Embed Size (px)
Citation preview
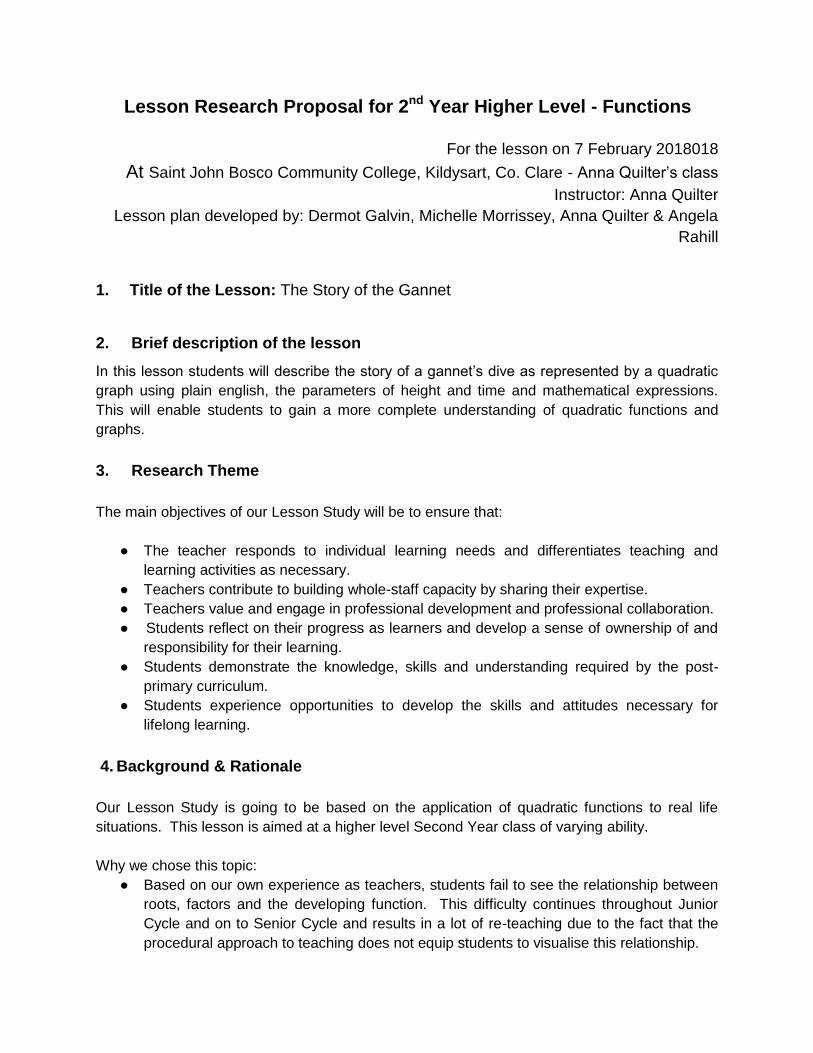
Lesson Research Proposal for 2nd Year Higher Level - Functions
For the lesson on 7 February 2018018
At Saint John Bosco Community College, Kildysart, Co. Clare - Anna Quilter’s class
Instructor: Anna Quilter
Lesson plan developed by: Dermot Galvin, Michelle Morrissey, Anna Quilter & Angela
Rahill
1. Title of the Lesson: The Story of the Gannet
2. Brief description of the lesson
In this lesson students will describe the story of a gannet’s dive as represented by a quadratic
graph using plain english, the parameters of height and time and mathematical expressions.
This will enable students to gain a more complete understanding of quadratic functions and
graphs.
3. Research Theme
The main objectives of our Lesson Study will be to ensure that:
● The teacher responds to individual learning needs and differentiates teaching and
learning activities as necessary.
● Teachers contribute to building whole-staff capacity by sharing their expertise.
● Teachers value and engage in professional development and professional collaboration.
● Students reflect on their progress as learners and develop a sense of ownership of and
responsibility for their learning.
● Students demonstrate the knowledge, skills and understanding required by the post-
primary curriculum.
● Students experience opportunities to develop the skills and attitudes necessary for
lifelong learning.
4. Background & Rationale
Our Lesson Study is going to be based on the application of quadratic functions to real life
situations. This lesson is aimed at a higher level Second Year class of varying ability.
Why we chose this topic:
● Based on our own experience as teachers, students fail to see the relationship between
roots, factors and the developing function. This difficulty continues throughout Junior
Cycle and on to Senior Cycle and results in a lot of re-teaching due to the fact that the
procedural approach to teaching does not equip students to visualise this relationship.

● Furthermore, students fail to see the connection between quadratic functions, graphs
and the real life applications and uses of these graphs, for example they are unaware
that the ‘y - axis’ can represent the profits of a company, the height of a ball thrown in
the air or the flight of a plane, etc. and that they can use quadratic graphs to determine
height/profit/maximum area etc. after a given period of time.
● Factorisation and quadratic functions are the foundation of several topics at both Junior
Cycle and on to Senior Cycle.
5. Relationship of the Unit to the Syllabus
Related prior learning
outcomes
Students already have some
experience of problem solving
and this lesson provides another
skill in problem solving.
This topic is not only a key part
of the Junior Cert syllabus in its
own right; it also forms the
foundation of the students’
understanding of several other
topics both at Junior Certificate
level and later at Leaving
Certificate level.
Learning Outcomes for this
Unit - Junior Cycle 4.2 Representing situations with tables, diagrams and graphs Relations derived from some kind of context – familiar, everyday situations, imaginary contexts or arrangements of tiles or blocks. Students look at various patterns and make predictions about what comes next.
− use tables, diagrams and graphs as
tools for representing and analysing
linear, quadratic and exponential patterns
and relations (exponential relations
limited to doubling and tripling)
− − present and interpret solutions,
explaining and justifying methods,
inferences and reasoning
4.4 Examining algebraic relationships Features of a relationship and how these features appear in the different representations. Constant rate of change: linear relationships. Non-constant rate of change: quadratic relationships. Proportional relationships.
− show that relations have features that
can be represented in a variety of ways −
distinguish those features that are
especially useful to identify and point out
how those features appear in different
representations: in tables, graphs,
physical models, and formulas expressed
in words, and algebraically
− use the representations to reason
Related later learning
outcomes - Senior Cycle
4.2 Solving equations
– select and use suitable strategies
(graphic, numeric, algebraic, mental) for
finding solutions to equations of the form:
• f(x) = g(x), with f(x) = ax+b, g(x) = cx+d
where a, b, c, d ∈ Q • f(x) = g(x) with f(x)
= g(x) = where a, b, c, e, f, p, q, r ∈ Z •
f(x) = k with f(x) = ax2 + bx + c (and not
necessarily factorisable) where a, b, c ∈
Q and interpret the results
– select and use suitable strategies (graphic, numeric, algebraic, mental) for finding solutions to • one linear equation and one equation of order 2 with two unknowns (restricted to the case where either the coefficient of x or the coefficient of y is ± 1 in the linear equation) and interpret the results – form quadratic equations given whole number roots
– select and use suitable strategies
(graphic, numeric, algebraic, mental) for
finding solutions to equations of the form:
f(x) = g(x) with f(x) = ; g(x) = k where a,
b, c, d, e, f, q, r ∈ Z
5.1 Functions – recognise that a function assigns a unique output to a given input – form composite functions
– graph functions of the form • ax+b
where a,b ∈ Q, x ∈ R • ax2 +bx + c where
a, b, c ∈ Z , x ∈ R • ax3 +bx
2 + cx+d

about the situation from which the
relationship is derived and communicate
their thinking to others
− recognise that a distinguishing feature
of quadratic relations is the way change
varies
4.5 Relations without formulae Using graphs to represent phenomena quantitatively.
− explore graphs of motion
− make sense of quantitative graphs and
draw conclusions from them
− make connections between the shape
of a graph and the story of a
phenomenon
− describe both quantity and change of
quantity on a graph
4.6 Expressions Using letters to represent quantities that are variable. Arithmetic operations on expressions; applications to real life contexts. Transformational activities: collecting like terms, simplifying expressions, substituting, expanding and factoring.
− evaluate expressions of the form • ax +
by • a (x + y) • x2 + bx + c • • axy where a,
b, c, d, x, y ∈ Z • ax2+ bx + c • x
3 + bx
2 +
cx + d where a, b, c, d, x, y ∈ Q
5.2 Graphing functions Interpreting and representing linear, quadratic and exponential functions in graphical form.
− interpret simple graphs
− plot points and lines
− draw graphs of the following functions
and interpret equations of the form f(x) =
g(x) as a comparison of functions • f(x) =
ax2 + bx + c, where a ∈ N; b, c ∈ Z; x ∈ R
• f (x) = ax2 + bx + c, where a, b, c ∈ Z, x
∈ R •
− use graphical methods to find
approximate solutions where f(x) = g(x)
and interpret the results
− find maximum and minimum values
of quadratic functions from a graph
where a,b,c,d ∈ Z, x ∈ R • abx where a ∈
N, b, x ∈ R
– interpret equations of the form f(x) = g(x) as a comparison of the above functions – use graphical methods to find approximate solutions to • f(x) = 0 • f(x) = k • f(x) = g(x) where f(x) and g(x) are of the above form, or where graphs of f(x) and g(x) are provided – investigate the concept of the limit of a function – recognise surjective, injective and bijective functions – find the inverse of a bijective function – given a graph of a function sketch the graph of its inverse – express quadratic functions in complete square form – use the complete square form of a quadratic function to • find the roots and turning points • sketch the function
– graph functions of the form • ax2 +bx +
c where a,b,c ∈ Q, x ∈ R • abx where a, b
∈ R • logarithmic • exponential •
trigonometric
– interpret equations of the form f(x) = g(x) as a comparison of the above functions – informally explore limits and continuity of functions 5.2 Calculus – find first and second derivatives of linear, quadratic and cubic functions by rule – associate derivatives with slopes and tangent lines – apply differentiation to • rates of change • maxima and minima • curve sketching

6. Goals of the Unit
● Students will recognise quadratic equations.
● Students will be proficient in factorisation of quadratic equations and will be able to form
quadratic equations from their roots.
● Students will use algebra, graphs and tables to solve quadratic equations.
● Students will be competent in the formation of a quadratic equation to represent a given
problem.
● Students will need to recognise the relationship between roots, factors and quadratic
functions.
● Students will be in a position to sketch the shifts in graphs and consequently to graph
quadratic functions and will understand how different changes in variables of a formula
would cause the graph to shift position.
● Students will understand that quadratic graphs represent real life situations and will be
able to visualise the relationship between the X-axis and the Y-axis.
● Students will be confident in the interpretation of these graphs and will understand how a
change in the X variable of the function corresponds to a change in the Y variable.
● Students will understand how the maximum and minimum points influence the shape of
the graph.
7. Unit Plan
Lesson Learning goal(s) and tasks
1
● Factorising of Quadratic Equations
2 Solving Quadratic Equations
● Students can see the relationship between the factors and
the roots
3 Functions
● Students are introduced to the concept of domain and range
and how these can be used to draw a linear/quadratic graph
to describe the relationship between the two variables in a
Function.
4 Graphing functions - to include sketching and shifting
● Students can see how changing the variables in the function
will results in a shift in position of the graph.
● Students can see how the maximum and minimum points

will influence the shape of the graph
● Students can predict the change in the shape and position
of the graph as the variables in the formula change
5 Matching functions to their related graphs
● Students will practice recognising graphs from a variety of
functions using matching exercises. This is designed to
increase the students awareness and confidence of the
shape of the graphs
.
.
6.
Applying real life problems to function graphs
● Students are given a quadratic function and are given the
opportunity to change the X variable and to observe the
change in the overall function as a result.
● Students now realise that the X variable is actually seconds
of time and the Y variable is the corresponding location of a
ball thrown in the air. .
7 Research Lesson
8. Goals of the Research Lesson:
a) Mathematical Goals
● Students will understand and use a 2 dimensional quadratic graph and use their
knowledge of factorisation and roots to solve a real world problem.
b) Goal of the Unit
● Students will become confident of their knowledge of quadratic functions, they will
become more positive about learning by developing a positive disposition towards
investigating, reasoning and problem solving by seeing patterns, trends and
relationships.
● Students will understand that the factors and roots of a quadratic expression have a real
meaning when solving a real world problem
● Students will appreciate that a problem solving using a quadratic function can be applied
to real world situations.
c) Key Skills and Statements of Learning

● Students will express ideas clearly and accurately. SL1 - Communicates effectively
using a variety of means in a range of contexts in L1
● They will become confident about performing and presenting in front of their classmates
as everybody’s contribution is value.
● Students will be respectful of difference in that other students may have approached
solving the problem in a different way.
● Students will improve their literacy by expressing ideas clearly and accurately. SL16 -
Describes, illustrates, interprets, predicts and explains patterns and relationships.
● Students will manage their own learning by reflecting on what they learn. SL17 -
Devises and evaluates strategies for investigating and solving problems using
mathematical knowledge, reasoning and skills.
● Students will engage purposefully in meaningful learning activities. SL15 - Recognises
the potential uses of mathematical knowledge, skills and understanding in all areas of
learning.
9. Flow of the Research Lesson:
The problem

The answer sheet
Steps, Learning Activities
Teacher’s Questions and Expected
Student Reactions
Teacher Support Assessment
Introduction and Posing the Task (5
min)
Use an online picture and student input to
explain what a gannet is.
Explain the layout of classroom materials.
Problem Solving 1 (5 min)
Task 1
Using the graph you have been given, Tell
the story of the gannet using five plain
English sentences
Anticipated responses include
● The gannet is diving. The gannet
drops from the sky into the water.
● The gannet is getting food; fish in
the water.
Supply the students with an A4
poster of the graph for the
quadratic
h(t) = t2 -8t +12 in the domain 1
<=t <=7 and a picture of a diving
gannet. (We ASSUME this
quadratic to fit the gannets
journey)
Supply students with 3 pieces of
coloured card. Each piece will be
a different colour to represent the
3 different questions and will be
used for student contributions to
the ceardaíocht.
Also, supply students with a
completed table of the relationship
between time and height for each
second
from time = 1 seconds
Assess as the teacher goes,
around the classroom,
choosing individuals for
ceardaíocht.

● The gannet goes down and then
up.
● The gannet goes downwards into
the water, then comes up out of
the water.
● The bird dives very fast.
● The gannet dives down deep in
the water.
● The gannet turns and rises up,
then leaves the water.
● The gannet gets wet.
to time = 7 seconds
Ask the students to describe what
is happening for up to 7 seconds,
i.e. to tell the story in plain english.
This will take 5 minutes.
Ceardaíocht 1 (5 – 10 min)
SpecificStudents are asked in a specific
order to tell their part of the story. Card is
used to record their input. (See
boardwork)
Individual students will then be
asked to come up to the board
and describe and explain their
findings
After the story has been told, - 1
student will synopsize the whole
story.
What direction does the gannet
take after diving into the water?
Do you think he is travelling fast?
and why?
When does the gannet start to
come up to the surface ?
What happens after it comes out
of the water?
Was the gannet hungry?
How long was it under water?
Discussion is elicited from the
students using open ended
questions such as:
● What do you think?
● Why is that?
● Did anyone else solve it
the same way?
Possible assessment
questions arising from
observations may include:
What does submerge/Dive
mean?
Why is the gannet going into
the water?

Problem Solving 2 (10 - 15min)
Task 2
Tell the same story with more detail using
the parameters height and time
Anticipated responses
● After 1 second he is five metres in
the air/above the water.
● After 2 seconds he hits the water,
so his height is 0.
● After three seconds he is 3 metres
underneath the water.
● After 4 seconds he is 4 metres
underneath the water. This is the
deepest he goes and now he
starts to come back up.
● After 5 seconds he is now 3
metres deep, i.e. 3 metres under
the water.
● After 6 seconds, he hits the water
again and comes up through
it/breaks the water.
● After 7 seconds he is five metres
above the water again and
heading up
● He is heading off to space. Never
to return. (infinity).
Task 3
Tell the story using as many
mathematical terms as possible
Anticipated responses
● Roots of 2 and 6 (2 seconds and
6 seconds)
● Minimum value (4, -4) - Turning
point
● Starting to dive at 5 metres
● Axis of Symmetry
● Negative y - Under axis/under
water
● Positive y - Above axis/above
water
Now, ask the students to tell the
story of the gannet within the
parameters of height and time.
Tell student they have 10 minutes
to do this task .
Finally, ask the students to
analyse the graph using as many
mathematical terms as possible in
five minutes.
As per problem solving 1.

Ceardaíocht 2 (15 - 20 min)
Specific students are asked in a specific
order to tell their part of the story. Card is
used to record their input. (See
boardwork)
Please use terms that you have learned
relating to quadratic expressions
Teacher will ask individual
students to take observation they
have made at each of the above
three steps and write it on the
card.
Individual student will then be
asked to come up to the board
after finished both task 2 and 3.
Students will be asked to describe
and explain their findings
Higher order questions may be
asked linking junior cert Science
in terms of Speed and Velocity
and how to calculate each term for
task 3
Minimum point and minimum
value.
Turning point
Distance
time
speed as a relationship between
distance and time.
SLOPE ?? steepness
Increasing
decreasing
Time
Total journey
AT the end Q
What parameters/variables of this
ASSUMED story would affect
As per Ceardaíocht 1.
Possible assessment
questions arising from
observations may include:
From what height did the
gannet start the dive?
Teacher asks how long did it
take the gannet before it
entered the water?
How long was the bird under
the water?
After how many seconds did
the gannet come back out of
the water?
What was the deepest dive of
the gannet?
After how many seconds was
the gannett at it deepest?
Describe the actions of the
gannet in the first 5 seconds?
Using SHOW ME BOARDS
Is the dive steep?
Is the upward journey steep?
Teacher should observe if
students are defending their
own ideas and whether they
are responding to each
other's ideas.
We expect students to use
the terms:
FACTORS
ROOTS
t axis represents….
h axis represents….

Summing up & Reflection
Now for those gannets in action!
http://video.nationalgeographic.com/video/wei
rdest‐cape‐gannets.
Students asked about the whether a gannet
follows a quadratic curve.
Topic is summarized and students are
asked to reflect on their learning by
completing a Reflection Questionnaire,
including reflection on:
● What they learned
● What is still unclear
● How they feel about the topic
● If they feel they can interpret:
○ when the gannet was
going down
○ When the gannet was
going up
○ The relationship between
the steepness of the
graph and the speed of
the gannet.
Extension/Homework
Students are given another graph relating
to profit made by a business over a
number of weeks. Can they tell the story
of that business using both mathematical
knowledge and reasoning but also
explaining in plain english.
Following discussion and
arrangement of the coloured card
on the board, the teacher or
students will use the final layout
on the Board to summarise the
story of the gannet.
Teacher will issue a Reflection
Questionnaire on which students
will record responses to the
questions above.
Reflections used for
assessment.
10. Board Plan Before


After

11. Evaluation
The consensus was that the lesson was successful, and the goals stated by the group at the
outset had been met. It was clear to the team that the students were engaged in the task from
the beginning. The students responded well to the prior knowledge and once the task was set
they engaged immediately in trying to find solutions. All students were successful in writing at
least one aspect of the story of the gannet for all three questions.
Once the Ceardaíocht began, and the students saw their classmates work, they were confident
in suggesting further solutions and in answering questions posed by the teacher. The class
learned from their colleagues presentations of their work to the class. 30 student observations
were presented to the class. This gave the students a comprehensive picture of story of the
gannet and of the quadratic graph.
The next stage of the Ceardaíocht went very well. A number of the students (at all levels)
recognised speed and velocity as aspects that could be developed. Overall, the students work
and their reflections demonstrated a strong knowledge and understanding of quadratic functions
and their graphical representations. This lesson meets its research targets.

12. Reflection
The team had hoped to observe students understanding of the relationship between the graph
and the diving gannet. The team also hoped to observe students learning from one anothers
input to develop whole class learning. It was also hoped that the diving speed of the gannet
would be recognised.
A very engaged class with significant mathematical discussion was observed. The students
understanding of the topic developed throughout the class and is strong. Students worked
excellently throughout the class. The majority of the work was individual work and students
were immersed in the problem in trying to find new words, relationships and mathematical
expressions to describe the gannet’s flight. Students written reflections indicated that the topic
was clear and that they found the class engaging and rewarding. Students enjoyed coming to
the board and discussing their points.
The lesson objectives were achieved. The synopsis of the board work volunteered by the
students after all three questions illustrated that they were engaged and had a deep
understanding of the quadratic graph. It was observed that the engagement and the
understanding developed by students in the first two questions helped students to answer and
engage with the 3rd question. It was also observed that a number of students used the
parameters of time and height to answer question 1.
Misconceptions observed were that x was being used instead of t for the horizontal axis. Other
students observed that the gannets trip took 7 seconds as opposed to 6 seconds. These
misconceptions were corrected by the students colleagues.
It was observed that students didn’t break down the journey of the gannet on a second by
second basis and that this could be further encouraged by rewording question 2 or question 1.
The boardwork, picture, video and coloured card added immensely to the lesson.
The research lesson took an hour to complete.
It was stated by team members that a derivative of this lesson could be used in senior cycle as
an introduction to calculus as the changing velocity of the gannet would be easily understood.