Embed Size (px)
Citation preview
Lessons Learned by Canadian Practitioners in Interpreting and Applying
Pavement ME Design Results
Mark Popik, M.Eng., P.Eng., Senior Pavement Engineer,
Thurber Engineering Ltd.
Hugh Donovan, P.Eng., Construction Services Engineer,
City of Edmonton
Paper prepared for presentation at the session entitled:
Experiences with Pavement ME Design
of the 2014 Annual Conference of the Transportation Association of Canada, Montreal, Quebec
ABSTRACT
The adaption of AASHTOWare’s Pavement ME software program in Canada has been an evolving
process. The complexity of the program at relatively large expense in annual licensing fees and staff
training are factors that have affected the ready acceptance of the software. Other factors that have
slowed the implementation process in Canada include: the time and resources required to learn how to use
the program; understanding the input requirements; limited Canadian experience in using the program;
and developing a level of confidence in the ability of the models to adequately predict pavement
distresses.
The need to calibrate the models for local conditions has been well documented; however, many
Canadian agencies simply don’t have the budget and resources available to undertake such an exhausting
venture. In Canada, the initial process to calibrate the program for Canadian conditions started through a
TAC pool fund study, but as resources became limited agencies were left on their own to continue the
process. With the development of their Default Parameters for AASHTOWare Pavement ME Design
Interim Report, the Ministry of Transportation of Ontario (MTO) has taken the lead in implementing
Pavement ME in Canada. Along with their web based GIS interface, iCorridor, this interim report has
provided guidance to the pavement design community in Ontario in using appropriate default values for
many of the input parameters.
There are a number of tools available to help designers use this software; however, as with any software
program, confidence in the program only comes in gaining experience in using it. In 2008, the TAC
sponsored project to calibrate the Pavement ME software for Canadian conditions initiated a user group to
provide a platform for Canadian agencies and practitioners to meet regularly and share experiences in
using the software program and to help the group better understand the capabilities of the program.
The primary purpose of this paper is to share the experiences of two Canadian practitioners in using the
AASHTOWare Pavement ME program, discuss some of the common user complexity observed with
design inputs, and demonstrate how the program can be an effective tool in the design and construction of
pavements in Canada.

Lessons Learned by Canadian Practitioners in Interpreting and Applying Pavement ME Design Results
- 2 -
INTRODUCTION
The adaption of AASHTOWare’s Pavement ME software program in Canada has been an evolving
process. The complexity of the program at relatively large expense in annual licensing fees and staff
training are factors that have affected the ready acceptance of the software. Other factors that have
slowed the implementation process in Canada include: the time and resources required to learn how to use
the program; understanding the input requirements; limited Canadian experience in using the program;
and developing a level of confidence in the ability of the models to adequately predict pavement
distresses.
To assist government agencies and practitioners in better understanding the software model and input
requirements the Federal Highway Association (FHWA) developed a number of training webinars that
have been recorded and uploaded on the AASHTOWare Pavement ME website at www.me-design.com
[1]. A total of ten webinars are available for viewing (each roughly two hours in length) that cover topics
of design input requirements and design analysis. Continuing on the success of these initial webinars, the
FHWA continued with an additional three-part series on local calibration requirements. Along with the
AASHTO Manual of Practice [2], these teaching tools provide a valuable resource for anyone attempting
to navigate through this mechanistic-empirical design methodology.
However, as often the case, real understanding of the Pavement ME design analysis, and design input
requirements, comes from using the software program in completing comparable designs. The primary
purpose of this paper is to share the experiences of two Canadian practitioners in using the
AASHTOWare Pavement ME program, discuss some of the common user complexities observed with
design inputs, and demonstrate how the program can be an effective tool in the design and construction of
pavements in Canada.
SOFTWARE CALIBRATION IN CANADA
The need to calibrate the models for local conditions has been well documented; however, many
Canadian agencies simply don’t have the budget and resources available to undertake such an exhausting
venture. In Canada, the initial process to calibrate the program for Canadian conditions started through a
TAC pool fund study, but as resources became limited agencies were left on their own to continue the
process [3].
With the development of their Default Parameters for AASHTOWare Pavement ME Design Interim
Report, the Ministry of Transportation of Ontario (MTO) [4] has taken the lead in implementing
Pavement ME in Canada. Along with their web based GIS interface, iCorridor, this interim report has
provided guidance to their pavement design community in Ontario in using appropriate default values for
many of the input parameters.
Although it is acknowledged that the models (and transfer functions) in Pavement ME software have not
been properly calibrated to Canadian conditions, it is felt that for the purposes of the analysis included in
this paper, undergoing a full calibration would have little impact on the resulting conclusions.
ACKNOWLEDGEMENT
There are a number of tools available to help designers use and understand this software; however, as
with any software program, confidence in the program only comes in gaining experience in using it. In
2008, the Transportation Association of Canada (TAC) sponsored project to calibrate the Pavement ME
software for Canadian conditions initiated a user group to provide a platform for Canadian agencies and
Lessons Learned by Canadian Practitioners in Interpreting and Applying Pavement ME Design Results
- 3 -
practitioners to meet regularly and share experiences in using the software program and to help the group
better understand the capabilities of the program.
Although this paper does not specifically discuss any of the results for design trials completed by the
TAC user group, some of the experiences and understanding shared in this paper have been discussion
items during user group meetings. The authors would like to acknowledge the valuable insight these open
discussions provided in preparing this paper, and the hard work of the user group members to continue
where the sponsored project left off, in calibrating the Pavement ME software for Canadian conditions.
PAVEMENT ME DESIGN INPUTS
The complexity of the Pavement ME models and transfer functions have made several agencies rethink
the approach they take in developing pavement designs, and re-evaluate the type (and format) of
information that is collected by the agency for pavement design purposes. As most Provincial agencies in
Canada had adopted the AASHTO ’93 approach to designing pavement structures (or a modified version
of this methodology) [5], the transition to the mechanistic-empirical approach used in the Pavement ME
software was found to be a rigorous one.
Although the previous AASHTO 1993 included design input requirements such as performance criteria,
material and soil properties, and traffic analysis, these parameters were represented by structural
coefficients, truck factors, and a present serviceability index. Although these design parameters are
correlated to tangible properties (such as resilient modulus (MR), International Roughness Index (IRI),
and axle load equivalency factors) [6], the transition to Pavement ME requires a closer evaluation of these
correlations, especially if pavement designs developed using AASHTO 1993 approach are being verified
using Pavement ME.
At first glance most pavement design practitioner familiar with the AASHTO 1993 design methodology
will notice the significant increase in the input requirements necessary to complete a design check in
Pavement ME. Although this feeling will eventually subside the more familiar the user becomes with
program, there are a number of significant differences that should be noted when verifying pavement
designs using the AASHTOWare Pavement ME software.
Subgrade Soils
A common item of consideration between the two AASHTO design approaches is the appropriate values
to use to represent the subgrade strength. In using the AASHTO 1993 methodology to develop pavement
designs, the value of the soil resilient modulus (MR) used for this design procedure should be consistent
with the subgrade strength of the subgrade soils during the typical moisture conditions for the project
area. Laboratory testing on soil samples for this input parameter should simulate the stresses and
moisture conditions during the primary moisture seasons [6], although an alternative approach was
developed to allow practitioners to quantify the relative damage a pavement is subjected to during the
various season throughout the year.
As MR testing of in-situ soils is relatively costly for typical pavement design projects, many Canadian
agencies use correlations developed to obtain the required subgrade strength. Regardless of the approach
used to determine the MR for the supporting subgrade soils, the effective roadbed soil MR used in the
AASHTO 1993 design procedure should be the average subgrade strength. This average MR value should
be based on the properties of the compact layer of the roadbed soil and include the effects of seasonal
variation [6].
Although the subgrade strength used in the Pavement ME analysis is identified as the soil resilient
modulus, the input parameter required for the methodology is not the same value as that used in the
Lessons Learned by Canadian Practitioners in Interpreting and Applying Pavement ME Design Results
- 4 -
AASHTO ’93 approach. The difference in the MR requirement for Pavement ME was well explained in
Module 4 of the FHWA series of webinars on ‘Material and Design Inputs - New Design’[1]. This series
of webinars presented by the software developers explained that the MR value required for a Level 3
analysis in Pavement ME is the soil strength under optimum conditions, or at optimum water content and
maximum dry density. The difference in MR value is most apparent when site specific soils information is
used for a Level 2 determination of the soils resilient modulus.
An example of this variability in subgrade strength is illustrated in completing a pavement design in the
City of Edmonton, where high plastic clays (CH) are found in many areas within the city limits. Prior to
the release of the AASHTOWare Pavement ME software, city staff used subgrade strength of 10 MPa for
these soils when completing design using the AASHTO 1993 design methodology. Using this approach,
city staff developed a high level of confidence that this low MR value was appropriate to represent the
highly plastic clay that supported many of their road network.
Using an input level 2 in Pavement ME to determine the MR for this soil, test results were used that
included particle size analysis, Atterberg limits, as well as optimum moisture content and maximum dry
density. For the input values presented in Table 1, the software models determined that the starting MR
for this soil is 33 MPa. This value is roughly three times the subgrade strength that was assumed using
AASHTO 1993 approach.
Table 1. Material Properties for High Plastic Clays in Edmonton.
Characteristic Highly Plastic Clay
Poisson’s Ratio 0.35
Coefficient of Lateral Earth Pressure 0.5
Percent Passing 25 mm 100 %
Percent Passing 19 mm 100 %
Percent Passing 12.5 mm 100 %
Percent Passing 9.5 mm 100 %
Percent Passing 4.75 mm 99 %
Percent Passing 2.0 mm 98 %
Percent Passing 425 µm 96 %
Percent Passing 75 µm 92 %
Percent Passing 1 µm 43 %
Liquid Limit 62 %
Plasticity Index 40 %
Maximum Dry Unit Weight 1,640 kg/m3
Optimum Moisture Content 20.0 %
Is Layer Compacted? Yes
Resilient Modulus - Level 2 Calculation
(at optimum moisture content) 33 MPa
Approximate AASHTO ’93 Resilient
Modulus Equivalent 10 MPa
As can be expected the difference in pavement structure supported by a subgrade soils with a MR of
10 MPa is substantial from a pavement that is supported by a subgrade soil with a MR of 33 MPa. For
illustration purposes, a number of designs were analyzed for a new flexible pavement using the Pavement
ME software. The designs were completed for a typical Minor Arterial roadway within the City of
Edmonton, with an Annual Average Daily Truck Traffic (AADTT) of 2,500. All designs were analyzed
Lessons Learned by Canadian Practitioners in Interpreting and Applying Pavement ME Design Results
- 5 -
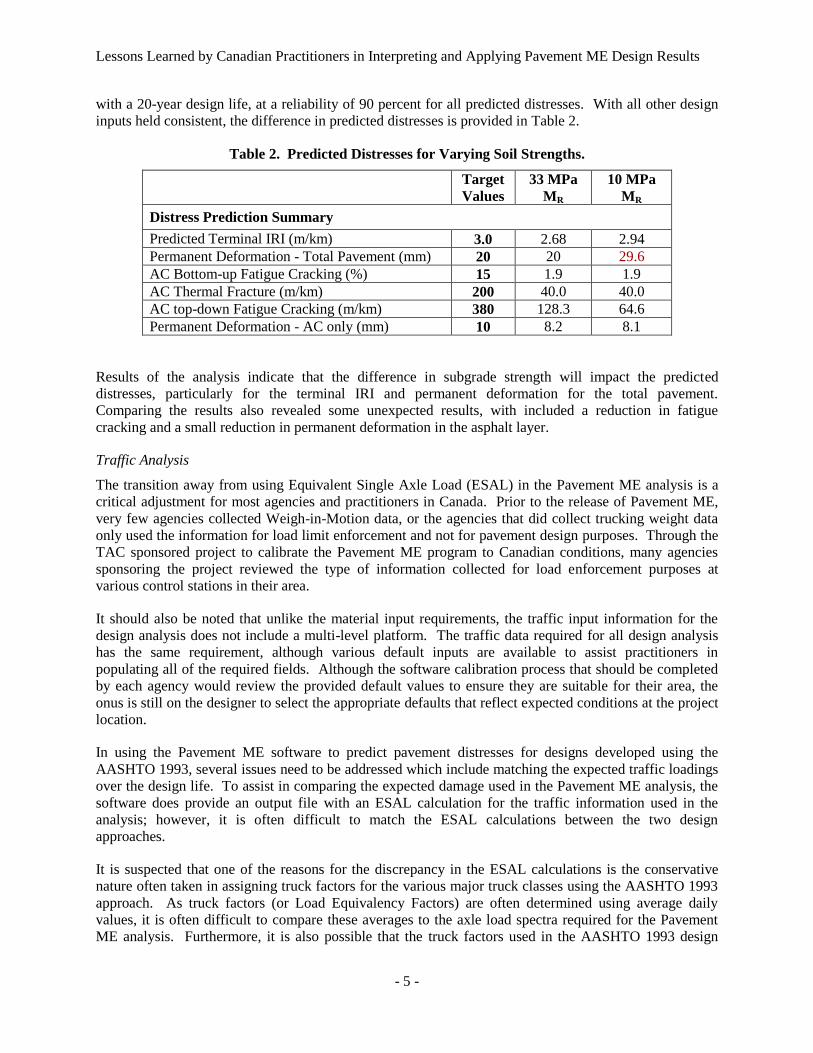
with a 20-year design life, at a reliability of 90 percent for all predicted distresses. With all other design
inputs held consistent, the difference in predicted distresses is provided in Table 2.
Table 2. Predicted Distresses for Varying Soil Strengths.
Target
Values
33 MPa
MR
10 MPa
MR
Distress Prediction Summary
Predicted Terminal IRI (m/km) 3.0 2.68 2.94
Permanent Deformation - Total Pavement (mm) 20 20 29.6
AC Bottom-up Fatigue Cracking (%) 15 1.9 1.9
AC Thermal Fracture (m/km) 200 40.0 40.0
AC top-down Fatigue Cracking (m/km) 380 128.3 64.6
Permanent Deformation - AC only (mm) 10 8.2 8.1
Results of the analysis indicate that the difference in subgrade strength will impact the predicted
distresses, particularly for the terminal IRI and permanent deformation for the total pavement.
Comparing the results also revealed some unexpected results, with included a reduction in fatigue
cracking and a small reduction in permanent deformation in the asphalt layer.
Traffic Analysis
The transition away from using Equivalent Single Axle Load (ESAL) in the Pavement ME analysis is a
critical adjustment for most agencies and practitioners in Canada. Prior to the release of Pavement ME,
very few agencies collected Weigh-in-Motion data, or the agencies that did collect trucking weight data
only used the information for load limit enforcement and not for pavement design purposes. Through the
TAC sponsored project to calibrate the Pavement ME program to Canadian conditions, many agencies
sponsoring the project reviewed the type of information collected for load enforcement purposes at
various control stations in their area.
It should also be noted that unlike the material input requirements, the traffic input information for the
design analysis does not include a multi-level platform. The traffic data required for all design analysis
has the same requirement, although various default inputs are available to assist practitioners in
populating all of the required fields. Although the software calibration process that should be completed
by each agency would review the provided default values to ensure they are suitable for their area, the
onus is still on the designer to select the appropriate defaults that reflect expected conditions at the project
location.
In using the Pavement ME software to predict pavement distresses for designs developed using the
AASHTO 1993, several issues need to be addressed which include matching the expected traffic loadings
over the design life. To assist in comparing the expected damage used in the Pavement ME analysis, the
software does provide an output file with an ESAL calculation for the traffic information used in the
analysis; however, it is often difficult to match the ESAL calculations between the two design
approaches.
It is suspected that one of the reasons for the discrepancy in the ESAL calculations is the conservative
nature often taken in assigning truck factors for the various major truck classes using the AASHTO 1993
approach. As truck factors (or Load Equivalency Factors) are often determined using average daily
values, it is often difficult to compare these averages to the axle load spectra required for the Pavement
ME analysis. Furthermore, it is also possible that the truck factors used in the AASHTO 1993 design
Lessons Learned by Canadian Practitioners in Interpreting and Applying Pavement ME Design Results
- 6 -
were developed several years ago, and may not have been updated to reflect present vehicle
configurations and traffic patterns. Regardless, practitioners should review the traffic information that is
being used for either methodology and determine the most appropriate approach to resolving this
discrepancy.
Performance Criteria Default Values
Identifying a target level for the distress prediction in the Pavement ME software sets the basis of the
acceptance, or rejection, of a trial design. The evaluation of a pavement design is based on pavement
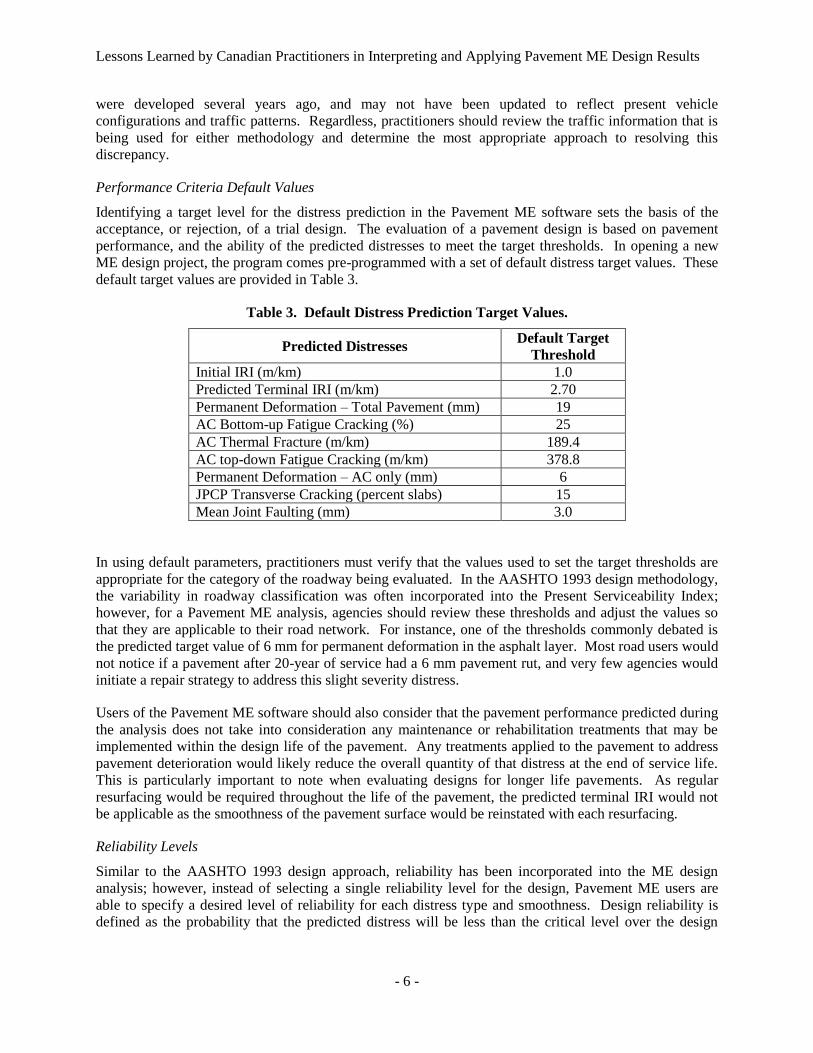
performance, and the ability of the predicted distresses to meet the target thresholds. In opening a new
ME design project, the program comes pre-programmed with a set of default distress target values. These
default target values are provided in Table 3.
Table 3. Default Distress Prediction Target Values.
Predicted Distresses Default Target
Threshold
Initial IRI (m/km) 1.0
Predicted Terminal IRI (m/km) 2.70
Permanent Deformation – Total Pavement (mm) 19
AC Bottom-up Fatigue Cracking (%) 25
AC Thermal Fracture (m/km) 189.4
AC top-down Fatigue Cracking (m/km) 378.8
Permanent Deformation – AC only (mm) 6
JPCP Transverse Cracking (percent slabs) 15
Mean Joint Faulting (mm) 3.0
In using default parameters, practitioners must verify that the values used to set the target thresholds are
appropriate for the category of the roadway being evaluated. In the AASHTO 1993 design methodology,
the variability in roadway classification was often incorporated into the Present Serviceability Index;
however, for a Pavement ME analysis, agencies should review these thresholds and adjust the values so
that they are applicable to their road network. For instance, one of the thresholds commonly debated is
the predicted target value of 6 mm for permanent deformation in the asphalt layer. Most road users would
not notice if a pavement after 20-year of service had a 6 mm pavement rut, and very few agencies would
initiate a repair strategy to address this slight severity distress.
Users of the Pavement ME software should also consider that the pavement performance predicted during
the analysis does not take into consideration any maintenance or rehabilitation treatments that may be
implemented within the design life of the pavement. Any treatments applied to the pavement to address
pavement deterioration would likely reduce the overall quantity of that distress at the end of service life.
This is particularly important to note when evaluating designs for longer life pavements. As regular
resurfacing would be required throughout the life of the pavement, the predicted terminal IRI would not
be applicable as the smoothness of the pavement surface would be reinstated with each resurfacing.
Reliability Levels
Similar to the AASHTO 1993 design approach, reliability has been incorporated into the ME design
analysis; however, instead of selecting a single reliability level for the design, Pavement ME users are
able to specify a desired level of reliability for each distress type and smoothness. Design reliability is
defined as the probability that the predicted distress will be less than the critical level over the design
Lessons Learned by Canadian Practitioners in Interpreting and Applying Pavement ME Design Results
- 7 -
period. The recommended levels of reliability are provided in Table 8-2 of the AASHTO MEPDG
Manual of Practice, and duplicated in the table below.[2]
Table 4. Levels of Reliability for Different Functional Classifications of Roadways.
Functional
Classification
Levels of Reliability
Urban Rural
Interstate / Freeway 95 95
Principal Arterials 90 85
Collectors 80 75
Local 75 70
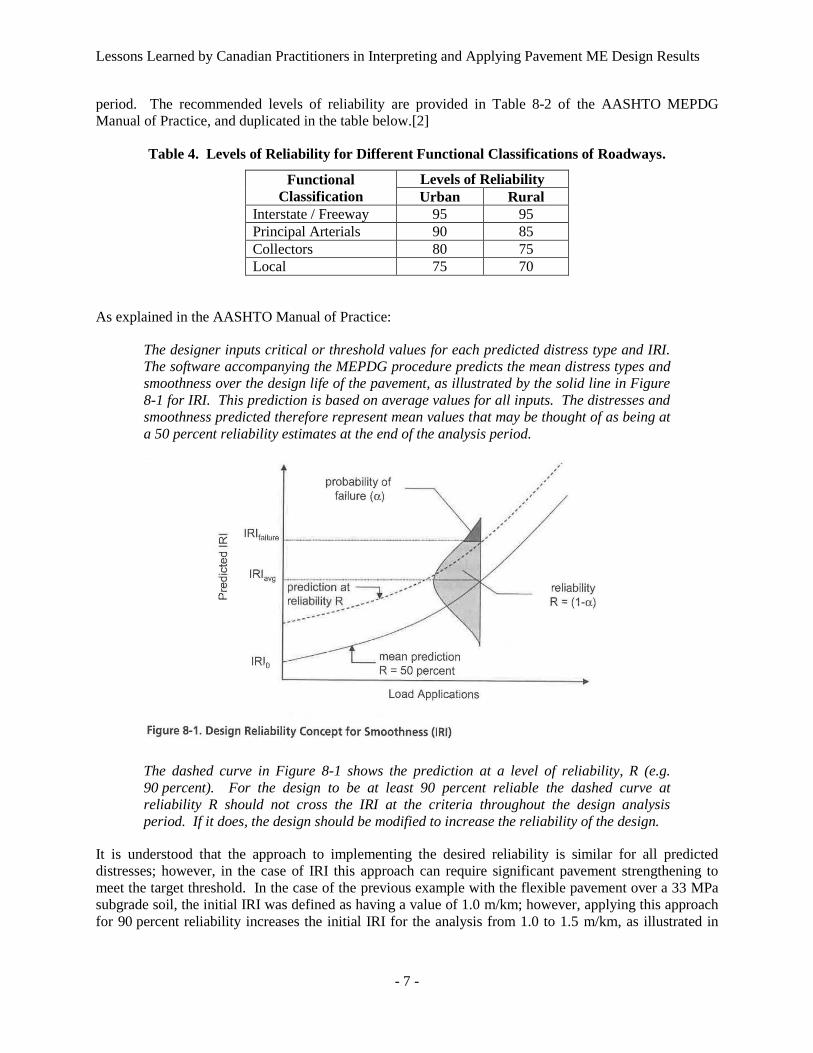
As explained in the AASHTO Manual of Practice:
The designer inputs critical or threshold values for each predicted distress type and IRI.
The software accompanying the MEPDG procedure predicts the mean distress types and
smoothness over the design life of the pavement, as illustrated by the solid line in Figure
8-1 for IRI. This prediction is based on average values for all inputs. The distresses and
smoothness predicted therefore represent mean values that may be thought of as being at
a 50 percent reliability estimates at the end of the analysis period.
The dashed curve in Figure 8-1 shows the prediction at a level of reliability, R (e.g.
90 percent). For the design to be at least 90 percent reliable the dashed curve at
reliability R should not cross the IRI at the criteria throughout the design analysis
period. If it does, the design should be modified to increase the reliability of the design.
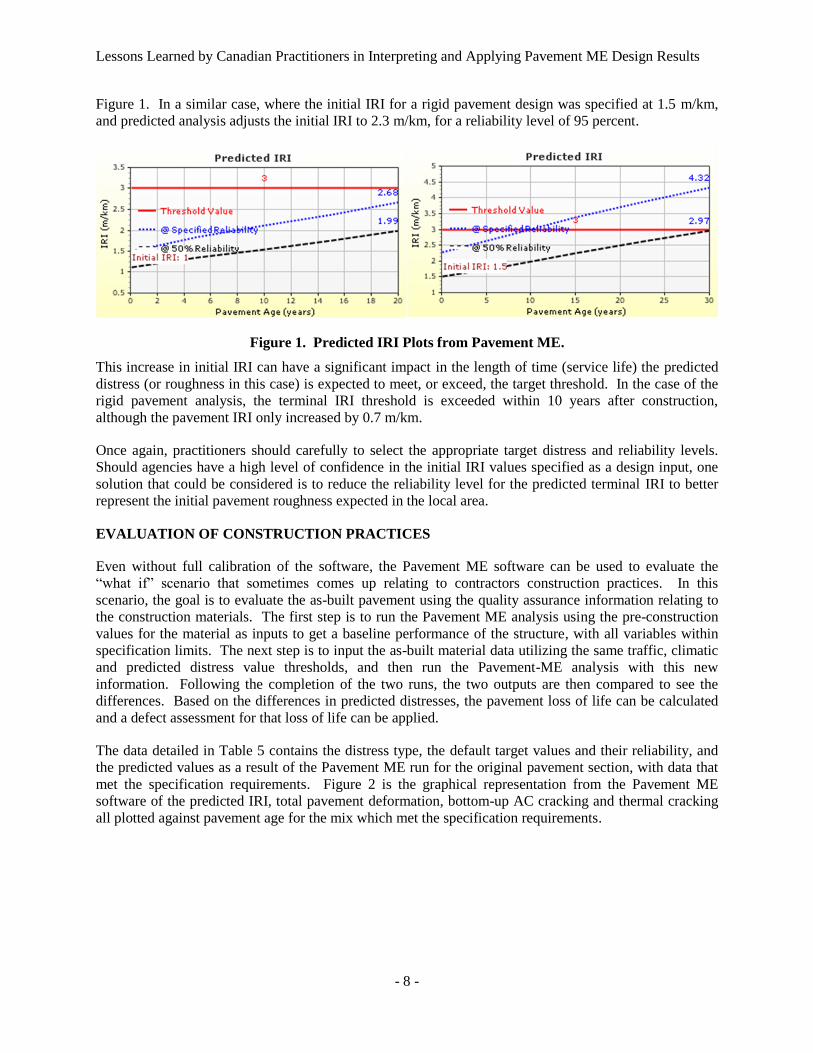
It is understood that the approach to implementing the desired reliability is similar for all predicted
distresses; however, in the case of IRI this approach can require significant pavement strengthening to
meet the target threshold. In the case of the previous example with the flexible pavement over a 33 MPa
subgrade soil, the initial IRI was defined as having a value of 1.0 m/km; however, applying this approach
for 90 percent reliability increases the initial IRI for the analysis from 1.0 to 1.5 m/km, as illustrated in
Lessons Learned by Canadian Practitioners in Interpreting and Applying Pavement ME Design Results
- 8 -
Figure 1. In a similar case, where the initial IRI for a rigid pavement design was specified at 1.5 m/km,
and predicted analysis adjusts the initial IRI to 2.3 m/km, for a reliability level of 95 percent.
Figure 1. Predicted IRI Plots from Pavement ME.
This increase in initial IRI can have a significant impact in the length of time (service life) the predicted
distress (or roughness in this case) is expected to meet, or exceed, the target threshold. In the case of the
rigid pavement analysis, the terminal IRI threshold is exceeded within 10 years after construction,
although the pavement IRI only increased by 0.7 m/km.
Once again, practitioners should carefully to select the appropriate target distress and reliability levels.
Should agencies have a high level of confidence in the initial IRI values specified as a design input, one
solution that could be considered is to reduce the reliability level for the predicted terminal IRI to better
represent the initial pavement roughness expected in the local area.
EVALUATION OF CONSTRUCTION PRACTICES
Even without full calibration of the software, the Pavement ME software can be used to evaluate the
“what if” scenario that sometimes comes up relating to contractors construction practices. In this
scenario, the goal is to evaluate the as-built pavement using the quality assurance information relating to
the construction materials. The first step is to run the Pavement ME analysis using the pre-construction
values for the material as inputs to get a baseline performance of the structure, with all variables within
specification limits. The next step is to input the as-built material data utilizing the same traffic, climatic
and predicted distress value thresholds, and then run the Pavement-ME analysis with this new
information. Following the completion of the two runs, the two outputs are then compared to see the
differences. Based on the differences in predicted distresses, the pavement loss of life can be calculated
and a defect assessment for that loss of life can be applied.
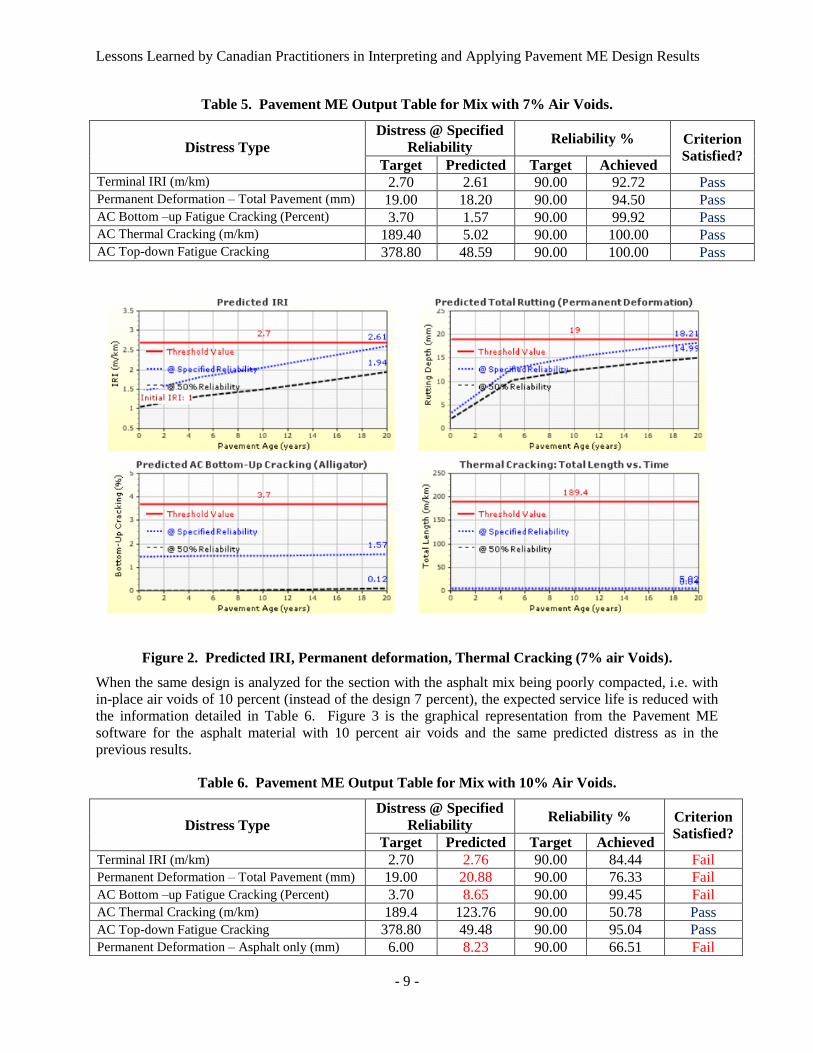
The data detailed in Table 5 contains the distress type, the default target values and their reliability, and
the predicted values as a result of the Pavement ME run for the original pavement section, with data that
met the specification requirements. Figure 2 is the graphical representation from the Pavement ME
software of the predicted IRI, total pavement deformation, bottom-up AC cracking and thermal cracking
all plotted against pavement age for the mix which met the specification requirements.
Lessons Learned by Canadian Practitioners in Interpreting and Applying Pavement ME Design Results
- 9 -
Table 5. Pavement ME Output Table for Mix with 7% Air Voids.
Distress Type
Distress @ Specified
Reliability Reliability % Criterion
Satisfied? Target Predicted Target Achieved
Terminal IRI (m/km) 2.70 2.61 90.00 92.72 Pass Permanent Deformation – Total Pavement (mm) 19.00 18.20 90.00 94.50 Pass AC Bottom –up Fatigue Cracking (Percent) 3.70 1.57 90.00 99.92 Pass AC Thermal Cracking (m/km) 189.40 5.02 90.00 100.00 Pass AC Top-down Fatigue Cracking 378.80 48.59 90.00 100.00 Pass
Figure 2. Predicted IRI, Permanent deformation, Thermal Cracking (7% air Voids).
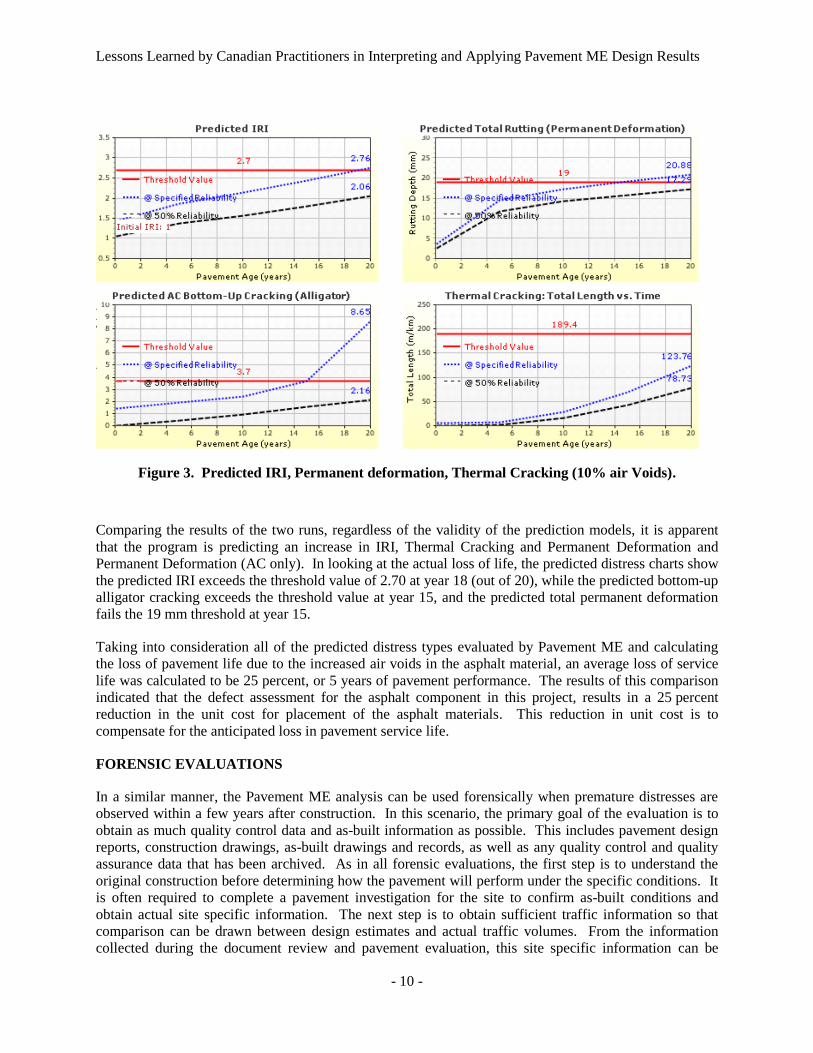
When the same design is analyzed for the section with the asphalt mix being poorly compacted, i.e. with
in-place air voids of 10 percent (instead of the design 7 percent), the expected service life is reduced with
the information detailed in Table 6. Figure 3 is the graphical representation from the Pavement ME
software for the asphalt material with 10 percent air voids and the same predicted distress as in the
previous results.
Table 6. Pavement ME Output Table for Mix with 10% Air Voids.
Distress Type
Distress @ Specified
Reliability Reliability % Criterion
Satisfied? Target Predicted Target Achieved
Terminal IRI (m/km) 2.70 2.76 90.00 84.44 Fail
Permanent Deformation – Total Pavement (mm) 19.00 20.88 90.00 76.33 Fail
AC Bottom –up Fatigue Cracking (Percent) 3.70 8.65 90.00 99.45 Fail
AC Thermal Cracking (m/km) 189.4 123.76 90.00 50.78 Pass
AC Top-down Fatigue Cracking 378.80 49.48 90.00 95.04 Pass
Permanent Deformation – Asphalt only (mm) 6.00 8.23 90.00 66.51 Fail
Lessons Learned by Canadian Practitioners in Interpreting and Applying Pavement ME Design Results
- 10 -
Figure 3. Predicted IRI, Permanent deformation, Thermal Cracking (10% air Voids).
Comparing the results of the two runs, regardless of the validity of the prediction models, it is apparent
that the program is predicting an increase in IRI, Thermal Cracking and Permanent Deformation and
Permanent Deformation (AC only). In looking at the actual loss of life, the predicted distress charts show
the predicted IRI exceeds the threshold value of 2.70 at year 18 (out of 20), while the predicted bottom-up
alligator cracking exceeds the threshold value at year 15, and the predicted total permanent deformation
fails the 19 mm threshold at year 15.
Taking into consideration all of the predicted distress types evaluated by Pavement ME and calculating
the loss of pavement life due to the increased air voids in the asphalt material, an average loss of service
life was calculated to be 25 percent, or 5 years of pavement performance. The results of this comparison
indicated that the defect assessment for the asphalt component in this project, results in a 25 percent
reduction in the unit cost for placement of the asphalt materials. This reduction in unit cost is to
compensate for the anticipated loss in pavement service life.
FORENSIC EVALUATIONS
In a similar manner, the Pavement ME analysis can be used forensically when premature distresses are
observed within a few years after construction. In this scenario, the primary goal of the evaluation is to
obtain as much quality control data and as-built information as possible. This includes pavement design
reports, construction drawings, as-built drawings and records, as well as any quality control and quality
assurance data that has been archived. As in all forensic evaluations, the first step is to understand the
original construction before determining how the pavement will perform under the specific conditions. It
is often required to complete a pavement investigation for the site to confirm as-built conditions and
obtain actual site specific information. The next step is to obtain sufficient traffic information so that
comparison can be drawn between design estimates and actual traffic volumes. From the information
collected during the document review and pavement evaluation, this site specific information can be
Lessons Learned by Canadian Practitioners in Interpreting and Applying Pavement ME Design Results
- 11 -
modelled in Pavement ME to see how the predicted distresses compare with the deterioration observed in
the early stages in the pavement life.
Only after understanding the reason and mode of failure can rehabilitation strategies be developed to
address the failure mode that caused the premature failure, and restore the pavements deterioration to its
expected rate. Pavement ME has been found to be a powerful tool, to not only model the distressed
pavement, but to develop an appropriate rehabilitation strategy.
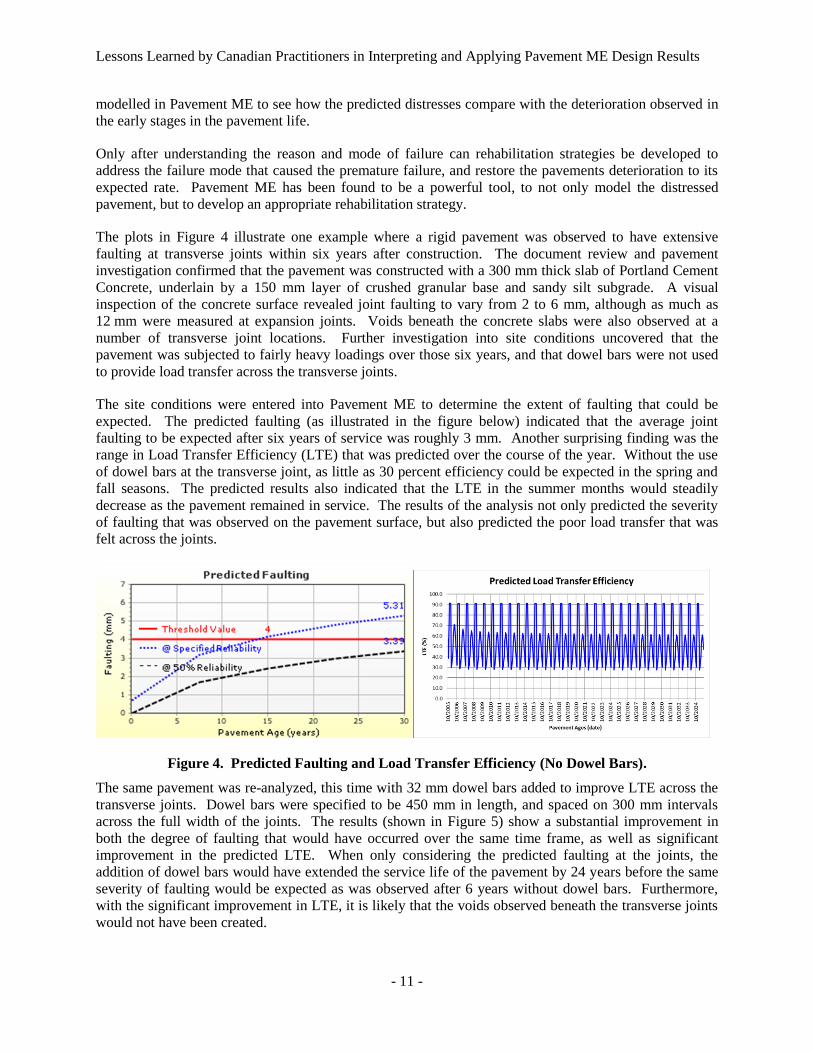
The plots in Figure 4 illustrate one example where a rigid pavement was observed to have extensive
faulting at transverse joints within six years after construction. The document review and pavement
investigation confirmed that the pavement was constructed with a 300 mm thick slab of Portland Cement
Concrete, underlain by a 150 mm layer of crushed granular base and sandy silt subgrade. A visual
inspection of the concrete surface revealed joint faulting to vary from 2 to 6 mm, although as much as
12 mm were measured at expansion joints. Voids beneath the concrete slabs were also observed at a
number of transverse joint locations. Further investigation into site conditions uncovered that the
pavement was subjected to fairly heavy loadings over those six years, and that dowel bars were not used
to provide load transfer across the transverse joints.
The site conditions were entered into Pavement ME to determine the extent of faulting that could be
expected. The predicted faulting (as illustrated in the figure below) indicated that the average joint
faulting to be expected after six years of service was roughly 3 mm. Another surprising finding was the
range in Load Transfer Efficiency (LTE) that was predicted over the course of the year. Without the use
of dowel bars at the transverse joint, as little as 30 percent efficiency could be expected in the spring and
fall seasons. The predicted results also indicated that the LTE in the summer months would steadily
decrease as the pavement remained in service. The results of the analysis not only predicted the severity
of faulting that was observed on the pavement surface, but also predicted the poor load transfer that was
felt across the joints.
Figure 4. Predicted Faulting and Load Transfer Efficiency (No Dowel Bars).
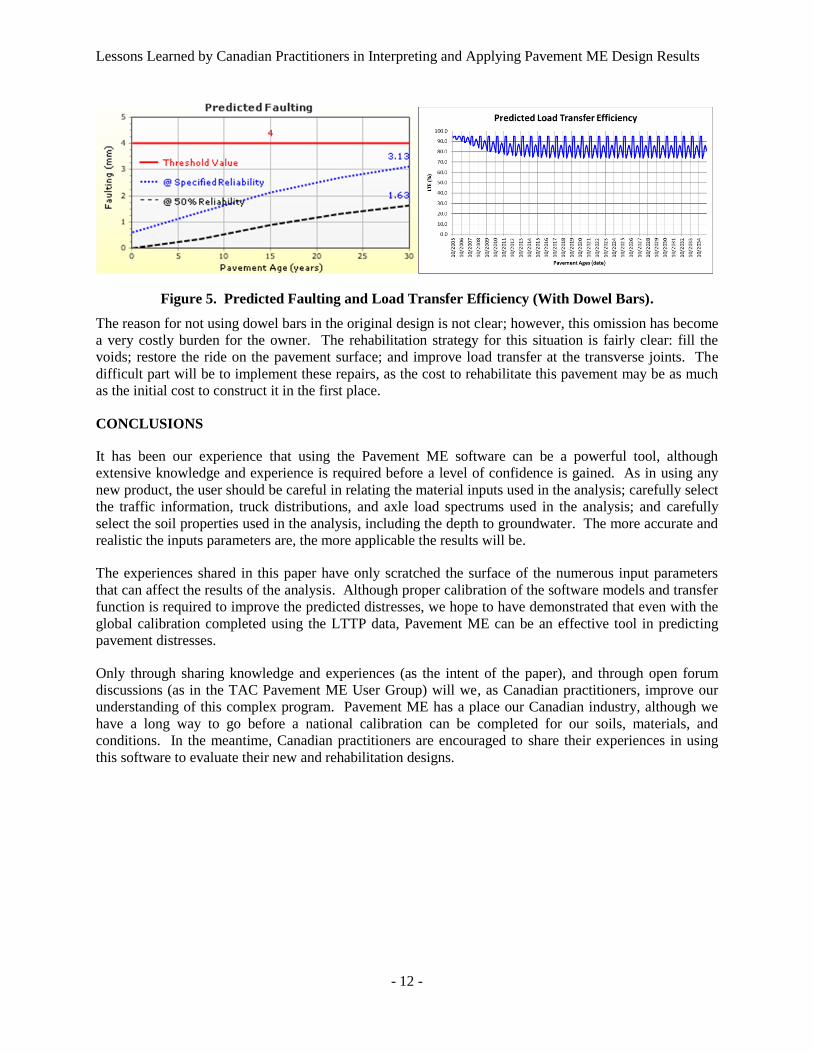
The same pavement was re-analyzed, this time with 32 mm dowel bars added to improve LTE across the
transverse joints. Dowel bars were specified to be 450 mm in length, and spaced on 300 mm intervals
across the full width of the joints. The results (shown in Figure 5) show a substantial improvement in
both the degree of faulting that would have occurred over the same time frame, as well as significant
improvement in the predicted LTE. When only considering the predicted faulting at the joints, the
addition of dowel bars would have extended the service life of the pavement by 24 years before the same
severity of faulting would be expected as was observed after 6 years without dowel bars. Furthermore,
with the significant improvement in LTE, it is likely that the voids observed beneath the transverse joints
would not have been created.
Lessons Learned by Canadian Practitioners in Interpreting and Applying Pavement ME Design Results
- 12 -
Figure 5. Predicted Faulting and Load Transfer Efficiency (With Dowel Bars).
The reason for not using dowel bars in the original design is not clear; however, this omission has become
a very costly burden for the owner. The rehabilitation strategy for this situation is fairly clear: fill the
voids; restore the ride on the pavement surface; and improve load transfer at the transverse joints. The
difficult part will be to implement these repairs, as the cost to rehabilitate this pavement may be as much
as the initial cost to construct it in the first place.
CONCLUSIONS
It has been our experience that using the Pavement ME software can be a powerful tool, although
extensive knowledge and experience is required before a level of confidence is gained. As in using any
new product, the user should be careful in relating the material inputs used in the analysis; carefully select
the traffic information, truck distributions, and axle load spectrums used in the analysis; and carefully
select the soil properties used in the analysis, including the depth to groundwater. The more accurate and
realistic the inputs parameters are, the more applicable the results will be.
The experiences shared in this paper have only scratched the surface of the numerous input parameters
that can affect the results of the analysis. Although proper calibration of the software models and transfer
function is required to improve the predicted distresses, we hope to have demonstrated that even with the
global calibration completed using the LTTP data, Pavement ME can be an effective tool in predicting
pavement distresses.
Only through sharing knowledge and experiences (as the intent of the paper), and through open forum
discussions (as in the TAC Pavement ME User Group) will we, as Canadian practitioners, improve our
understanding of this complex program. Pavement ME has a place our Canadian industry, although we
have a long way to go before a national calibration can be completed for our soils, materials, and
conditions. In the meantime, Canadian practitioners are encouraged to share their experiences in using
this software to evaluate their new and rehabilitation designs.

Lessons Learned by Canadian Practitioners in Interpreting and Applying Pavement ME Design Results
- 13 -
REFERENCES
1. AASHTOWare Pavement ME Design Webinar Training, www.me-design.com. Webinars hosted
by Federal Highway Administration (FHWA) from December 19, 2012 to March 14, 2013.
2. AASHTOWare, “Mechanistic-Empirical Pavement Design Guide – A Manual of Practice”,
Interim Edition, July 2008.
3. M. Popik, M. Juhasz, et al., “TAC Pavement ME User Group – Canadian Climate Trials”, 2013
TAC Annual Conference, Winnipeg, MB.
4. MTO Materials Engineering Research Office – Pavement and Foundations Section, “Ontario’s
Default Parameters for AASHTOWare Pavement ME Design – Interim Report”, November 2012
5. Transportation Association of Canada, “Pavement Asset Design and Management Guide”,
December 2013.
6. AASHTO, “Guide For Design of Pavement Structures”, 1993.
7. AASHTOWare, “Guide for the Local Calibration of the Mechanistic-Empirical Pavement Design
Guide”, November 2010.
8. AASHTOWare, “DARWin ME Software Help System – SI Units” Software Help Version 1.0.1,
April 2011.