Embed Size (px)
Citation preview
© LGC Limited 20131
Lessons to be learnt from twenty five years of analytical quality assurance, measurement uncertainty and metrological traceability
Analytical Research Forum 20138 – 10 July 2013, University of Hertfordshire & GlaxoSmithKline, UK
Mike SargentLGC Limited, Teddington, UK
© LGC Limited 20132
© LGC Limited 20133
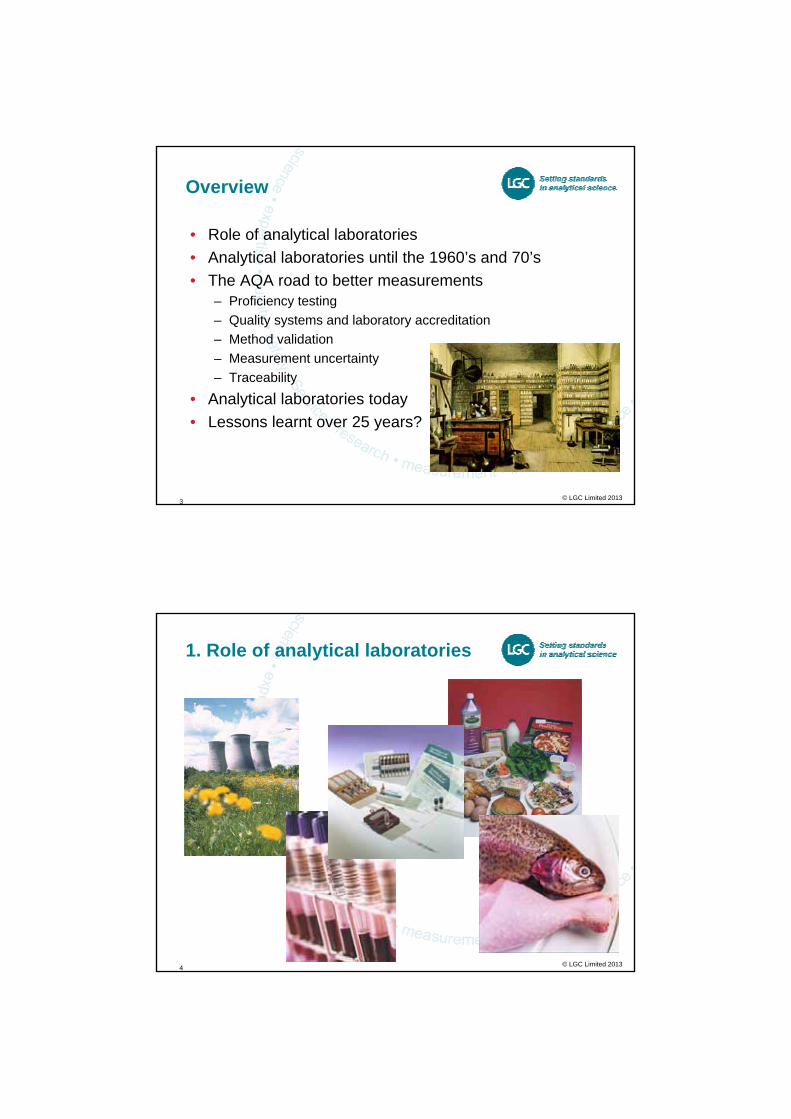
Overview
• Role of analytical laboratories• Analytical laboratories until the 1960’s and 70’s• The AQA road to better measurements
– Proficiency testing– Quality systems and laboratory accreditation– Method validation – Measurement uncertainty– Traceability
• Analytical laboratories today• Lessons learnt over 25 years?
© LGC Limited 20134
1. Role of analytical laboratories
© LGC Limited 20135
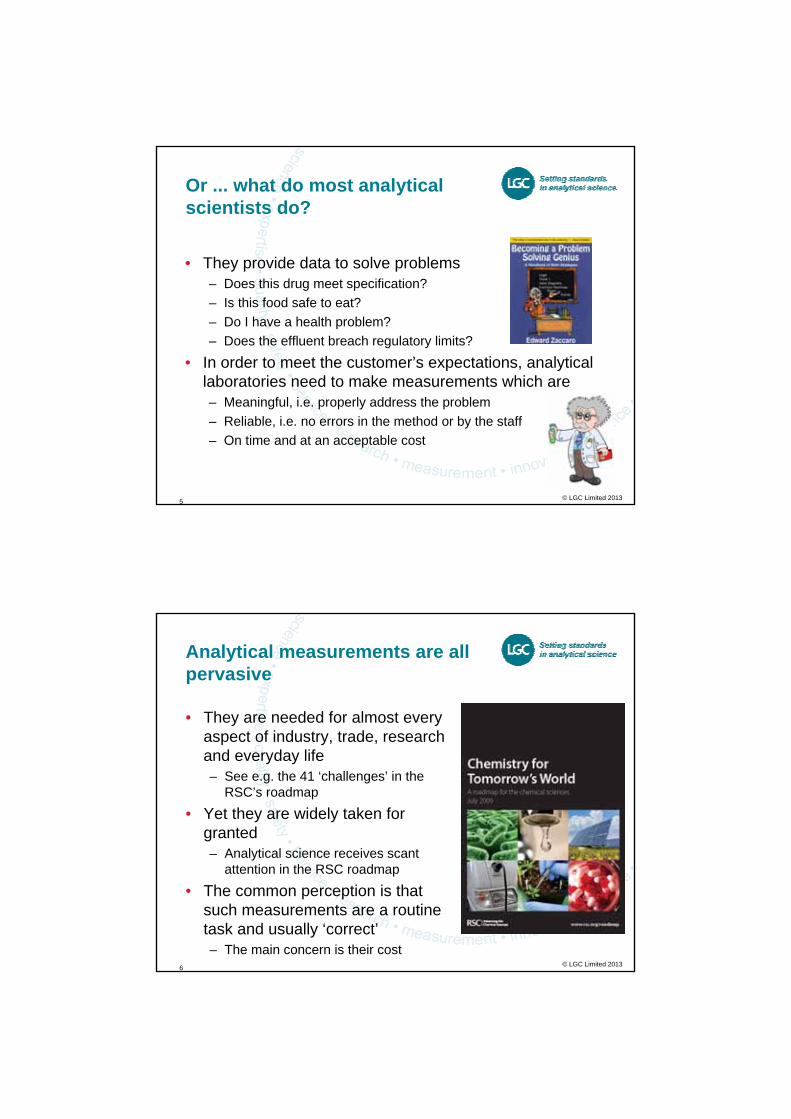
Or ... what do most analytical scientists do?
• They provide data to solve problems – Does this drug meet specification?– Is this food safe to eat?– Do I have a health problem?– Does the effluent breach regulatory limits?
• In order to meet the customer’s expectations, analytical laboratories need to make measurements which are – Meaningful, i.e. properly address the problem– Reliable, i.e. no errors in the method or by the staff– On time and at an acceptable cost
© LGC Limited 20136
Analytical measurements are all pervasive
• They are needed for almost every aspect of industry, trade, research and everyday life– See e.g. the 41 ‘challenges’ in the
RSC’s roadmap
• Yet they are widely taken for granted– Analytical science receives scant
attention in the RSC roadmap
• The common perception is that such measurements are a routine task and usually ‘correct’– The main concern is their cost
© LGC Limited 20137
2. Analytical laboratories until the 1960’s and 70’s
© LGC Limited 20138
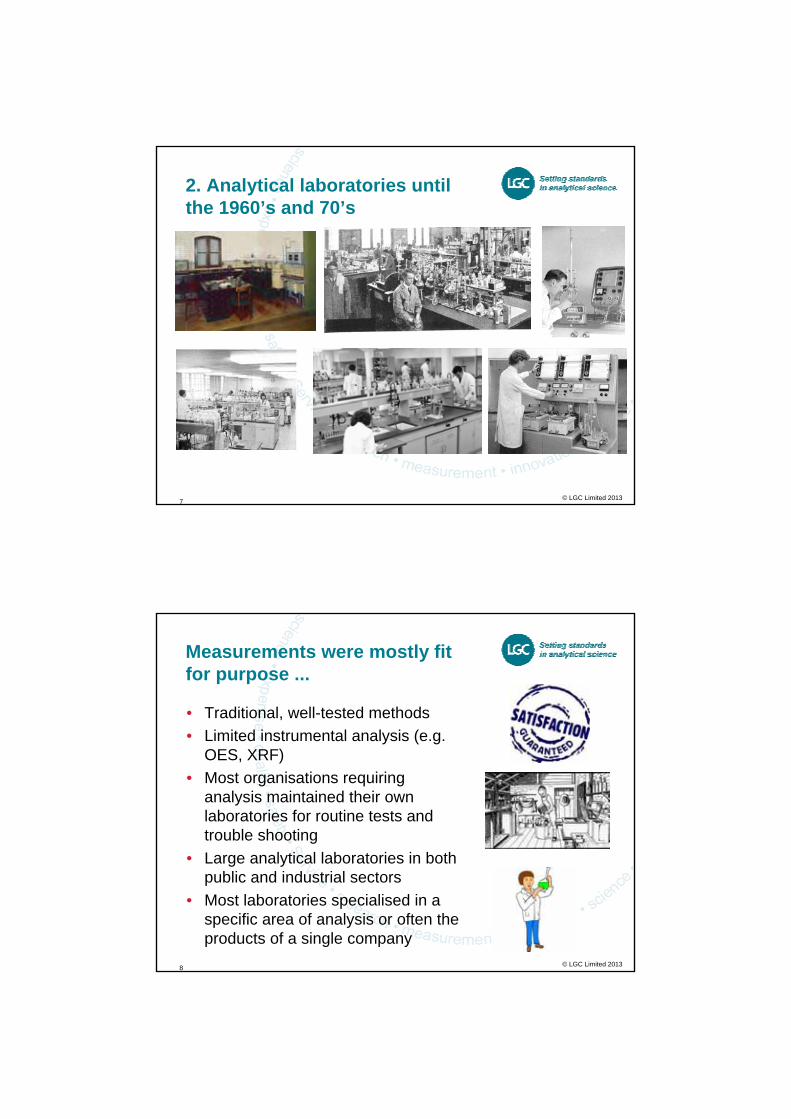
Measurements were mostly fit for purpose ...
• Traditional, well-tested methods• Limited instrumental analysis (e.g.
OES, XRF) • Most organisations requiring
analysis maintained their own laboratories for routine tests and trouble shooting
• Large analytical laboratories in both public and industrial sectors
• Most laboratories specialised in a specific area of analysis or often the products of a single company
© LGC Limited 20139
Why was data generally reliable without formal AQA?
• High level of specialist expertise and resourcing helped to avoid errors
• Laboratory managers adopted extensive precautions to ensure reliable data without a quality system
• Extensive informal networks of collaborating analysts
• Tried and tested methods widely published by practising analysts
• Wide opportunities for on-the-job training and education
© LGC Limited 201310
Not, however, a perfect world
• Pace of change increased from 1960’s as traditional methods were replaced with bench top instruments
• Industry, regulators, etc demanded ever more difficult analyses
• Market pressures and influence of ‘accountants’ reduced staff levels, training, method development, inter-company collaborations, etc
• Early attempts to compare data between laboratories indicated it was no longer safe to assume that every laboratory would report the same result on a sample
© LGC Limited 201311
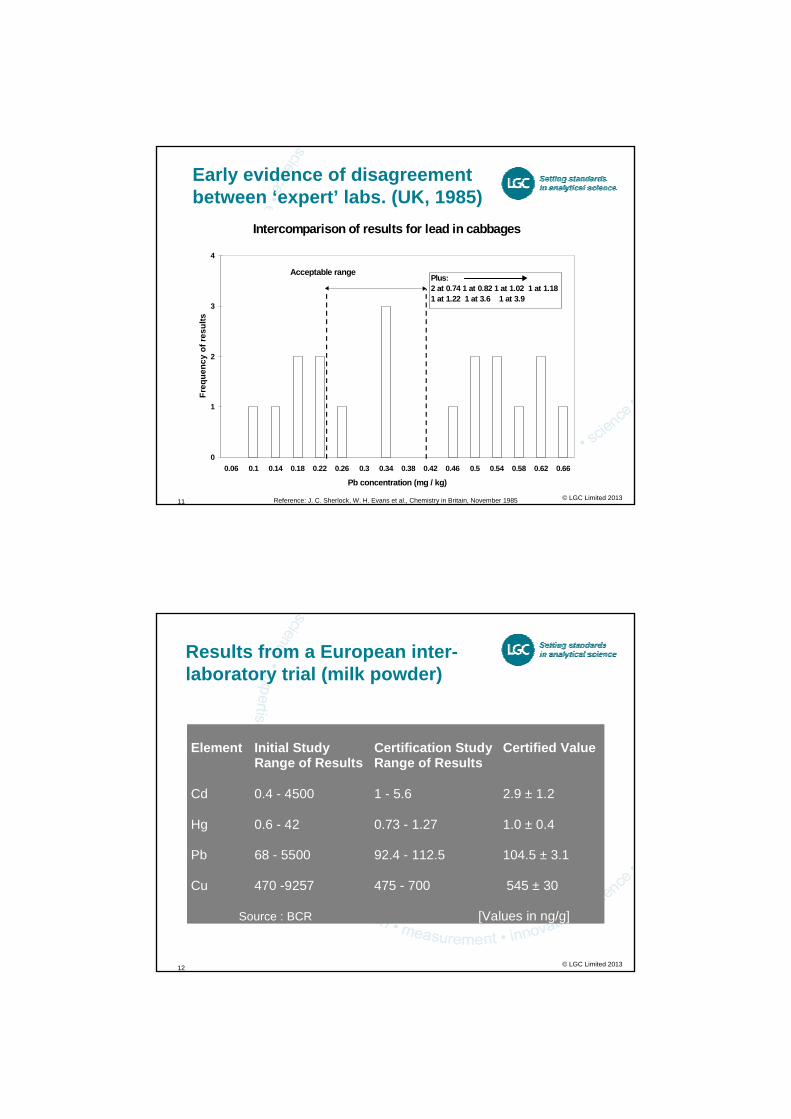
Intercomparison of results for lead in cabbages
0
1
2
3
4
0.06 0.1 0.14 0.18 0.22 0.26 0.3 0.34 0.38 0.42 0.46 0.5 0.54 0.58 0.62 0.66
Pb concentration (mg / kg)
Freq
uenc
y of
resu
lts
Acceptable rangePlus:2 at 0.74 1 at 0.82 1 at 1.02 1 at 1.181 at 1.22 1 at 3.6 1 at 3.9
Early evidence of disagreement between ‘expert’ labs. (UK, 1985)
Reference: J. C. Sherlock, W. H. Evans et al., Chemistry in Britain, November 1985
© LGC Limited 201312
Results from a European inter-laboratory trial (milk powder)
Element Initial Study Certification Study Certified ValueRange of Results Range of Results
Cd 0.4 - 4500 1 - 5.6 2.9 ± 1.2
Hg 0.6 - 42 0.73 - 1.27 1.0 ± 0.4
Pb 68 - 5500 92.4 - 112.5 104.5 ± 3.1
Cu 470 -9257 475 - 700 545 ± 30
Source : BCR [Values in ng/g]
© LGC Limited 201313
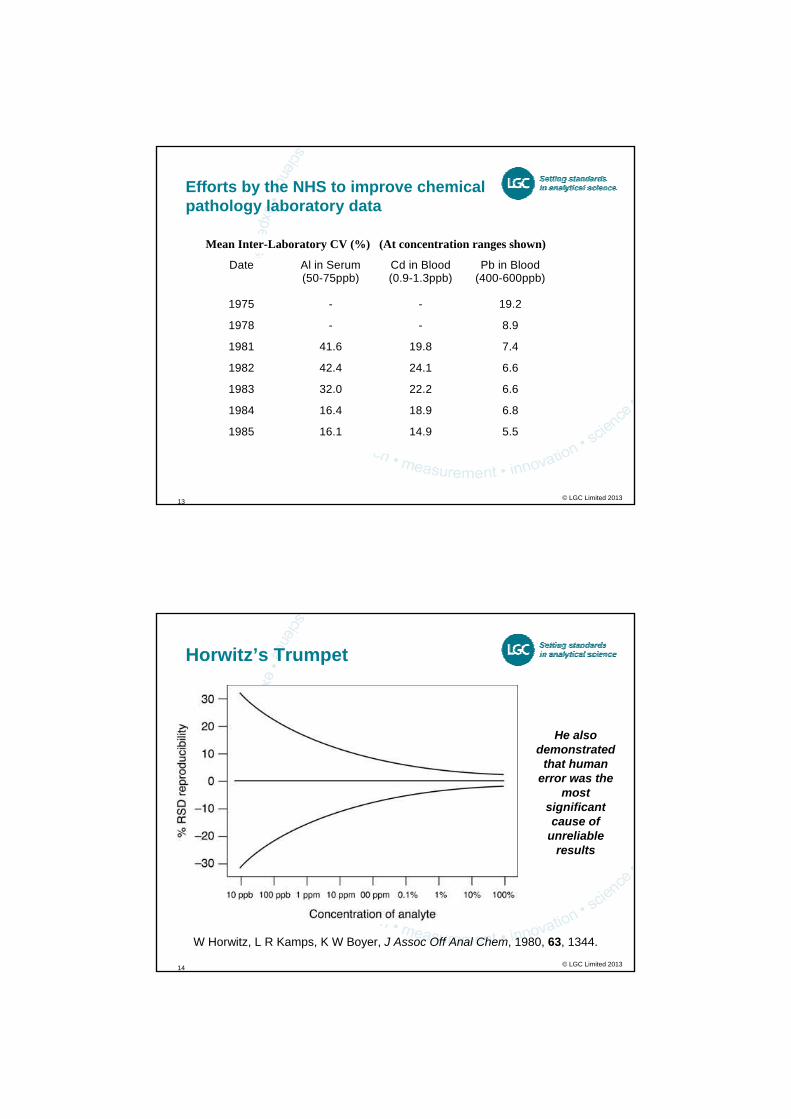
Date Al in Serum(50-75ppb)
Cd in Blood(0.9-1.3ppb)
Pb in Blood(400-600ppb)
1975 - - 19.2
1978 - - 8.9
1981 41.6 19.8 7.4
1982 42.4 24.1 6.6
1983 32.0 22.2 6.6
1984 16.4 18.9 6.8
1985 16.1 14.9 5.5
Mean Inter-Laboratory CV (%) (At concentration ranges shown)
Efforts by the NHS to improve chemical pathology laboratory data
© LGC Limited 201314
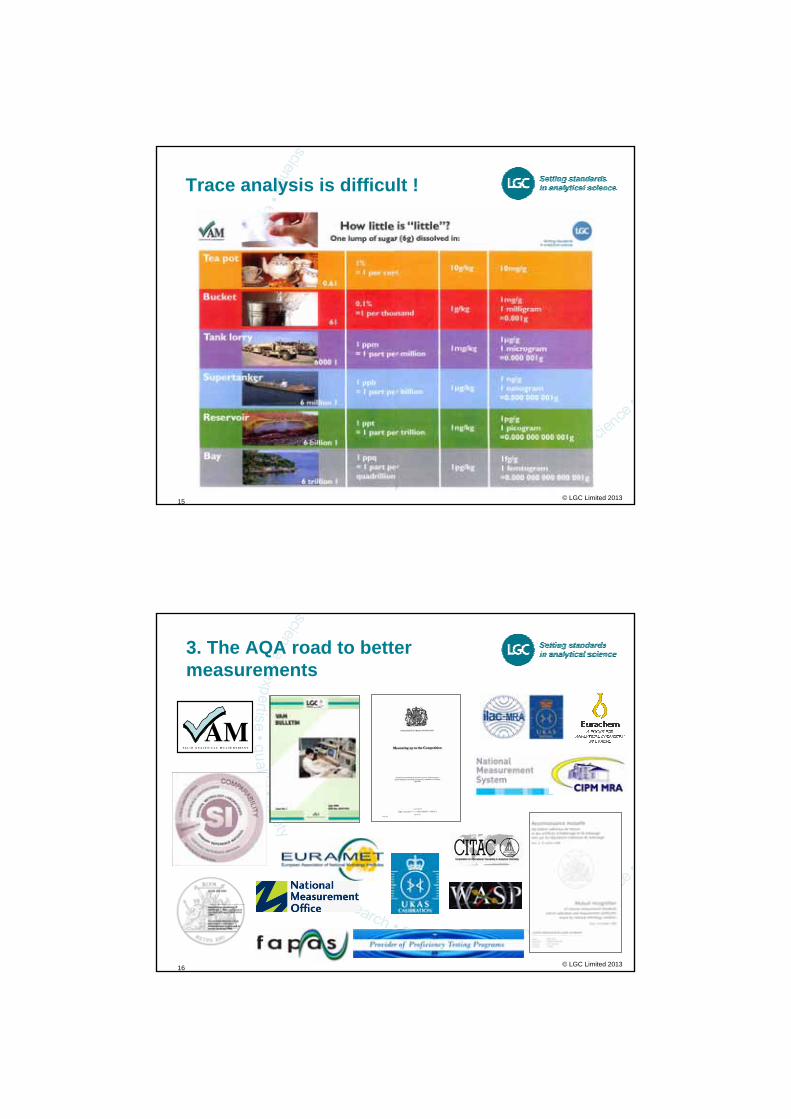
Horwitz’s Trumpet
W Horwitz, L R Kamps, K W Boyer, J Assoc Off Anal Chem, 1980, 63, 1344.
He also demonstrated
that human error was the
most significant cause of
unreliable results
© LGC Limited 201315
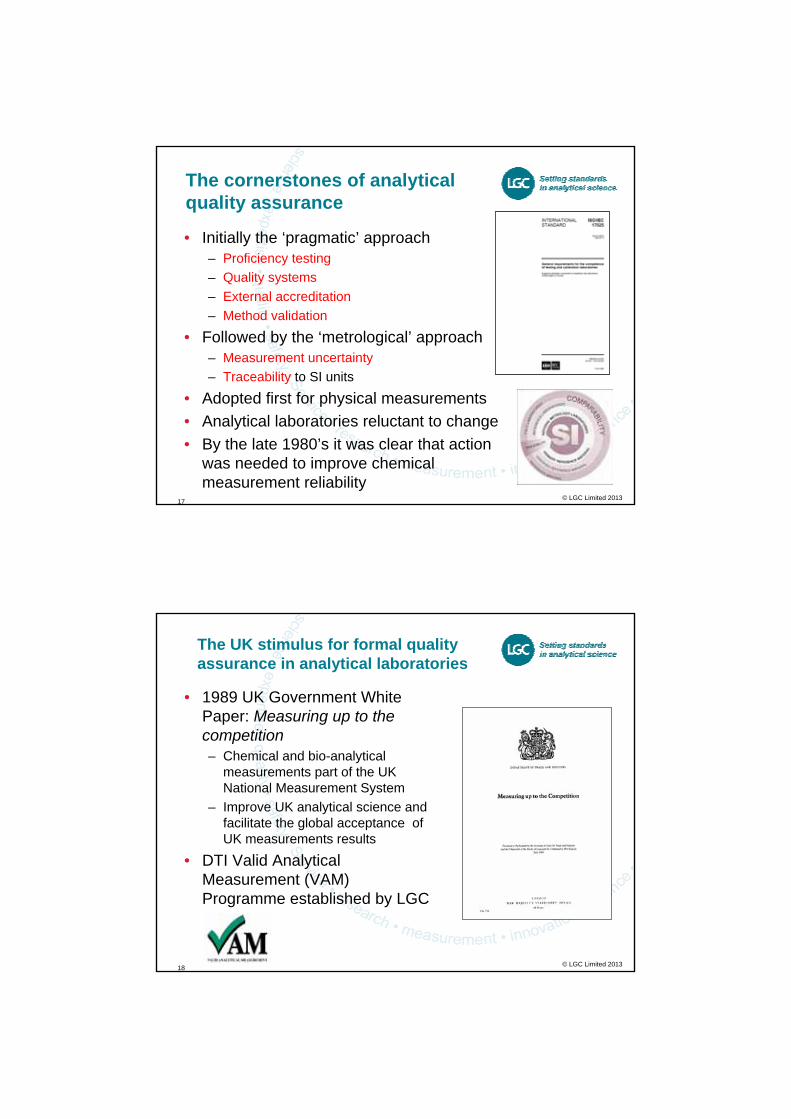
Trace analysis is difficult !
© LGC Limited 201316
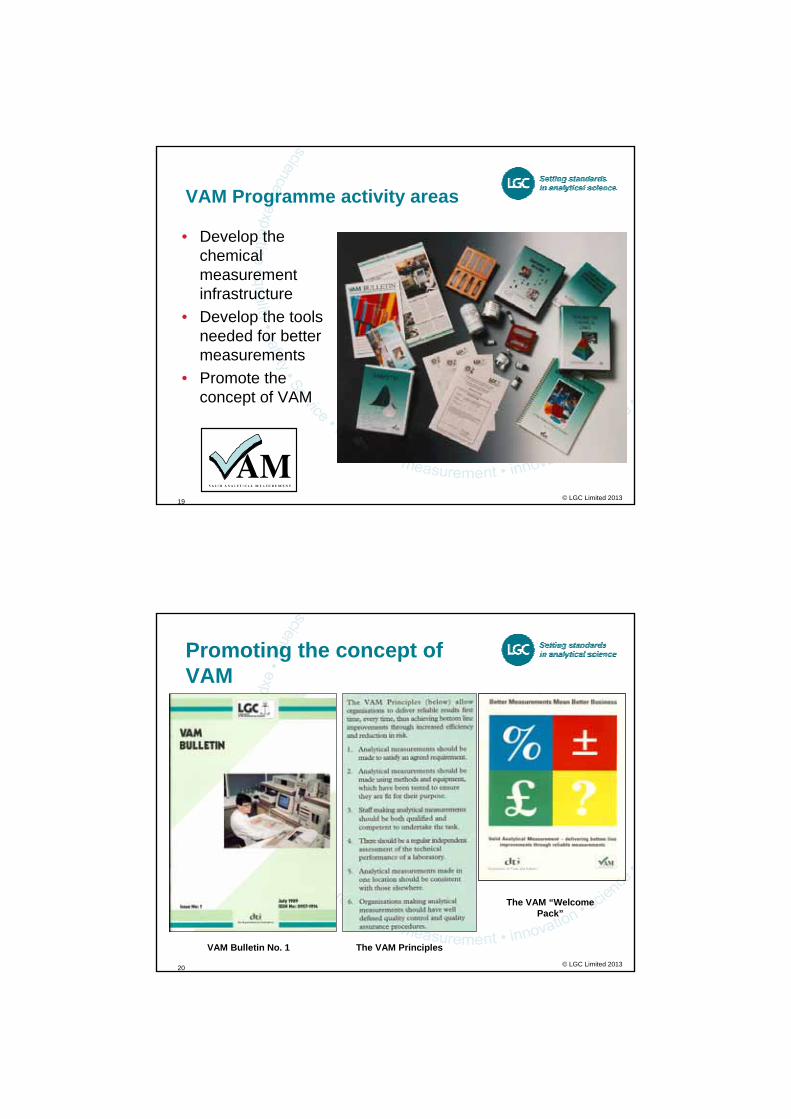
3. The AQA road to better measurements
© LGC Limited 201317
The cornerstones of analytical quality assurance
• Initially the ‘pragmatic’ approach– Proficiency testing – Quality systems– External accreditation– Method validation
• Followed by the ‘metrological’ approach– Measurement uncertainty– Traceability to SI units
• Adopted first for physical measurements• Analytical laboratories reluctant to change • By the late 1980’s it was clear that action
was needed to improve chemical measurement reliability
© LGC Limited 201318
The UK stimulus for formal quality assurance in analytical laboratories
• 1989 UK Government White Paper: Measuring up to the competition– Chemical and bio-analytical
measurements part of the UK National Measurement System
– Improve UK analytical science and facilitate the global acceptance of UK measurements results
• DTI Valid Analytical Measurement (VAM) Programme established by LGC
© LGC Limited 201319
VAM Programme activity areas
• Develop the chemical measurement infrastructure
• Develop the tools needed for better measurements
• Promote the concept of VAM
© LGC Limited 201320
Promoting the concept of VAM
VAM Bulletin No. 1
The VAM “Welcome Pack”
The VAM Principles
© LGC Limited 201321
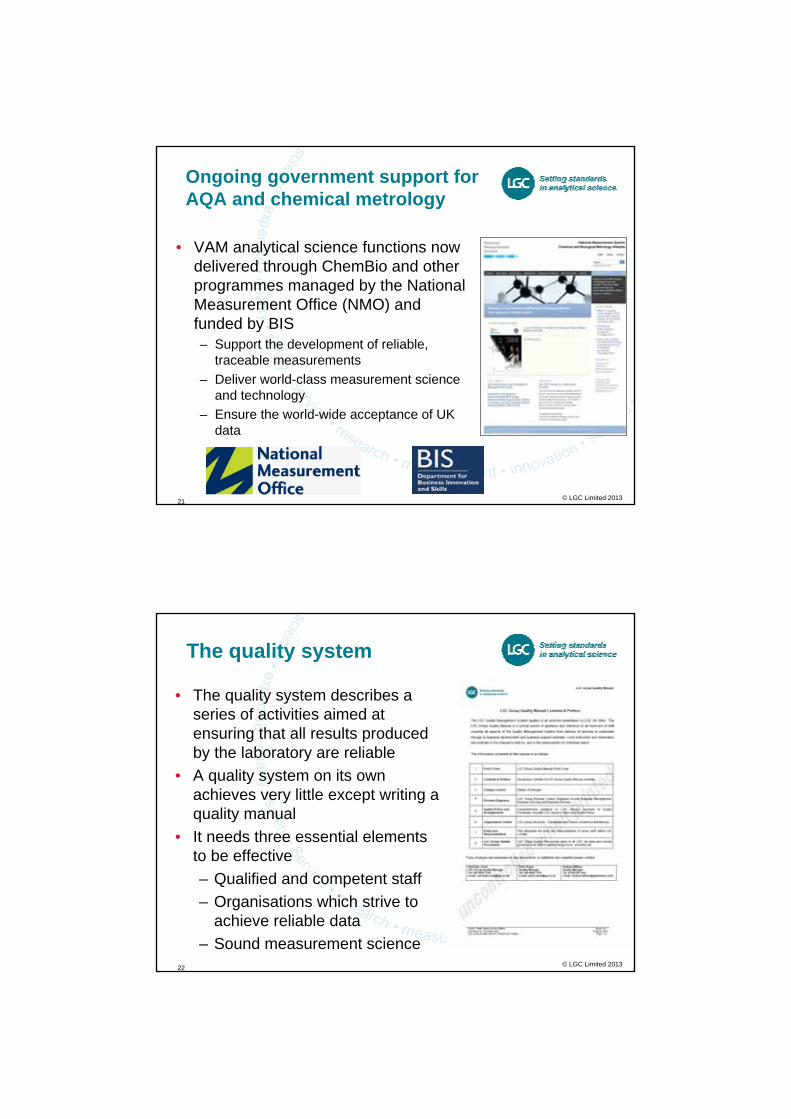
Ongoing government support for AQA and chemical metrology
• VAM analytical science functions now delivered through ChemBio and other programmes managed by the National Measurement Office (NMO) and funded by BIS– Support the development of reliable,
traceable measurements – Deliver world-class measurement science
and technology– Ensure the world-wide acceptance of UK
data
© LGC Limited 201322
The quality system
• The quality system describes a series of activities aimed at ensuring that all results produced by the laboratory are reliable
• A quality system on its own achieves very little except writing a quality manual
• It needs three essential elements to be effective– Qualified and competent staff– Organisations which strive to
achieve reliable data– Sound measurement science
© LGC Limited 201323
External assessment
• External assessment has two functions– Independent confirmation for managers that
their systems are operating as intended – Impartial information on the laboratory for
customers, regulatory bodies, etc.
• Laboratory accreditation (ISO 17025)– Outside experts review the laboratory’s
operations and quality system
• Proficiency testing (PT) or external quality assessment (EQA) schemes (ISO 17043)– External organisations provide ‘blind
samples’ to laboratories and monitor their results
© LGC Limited 201324
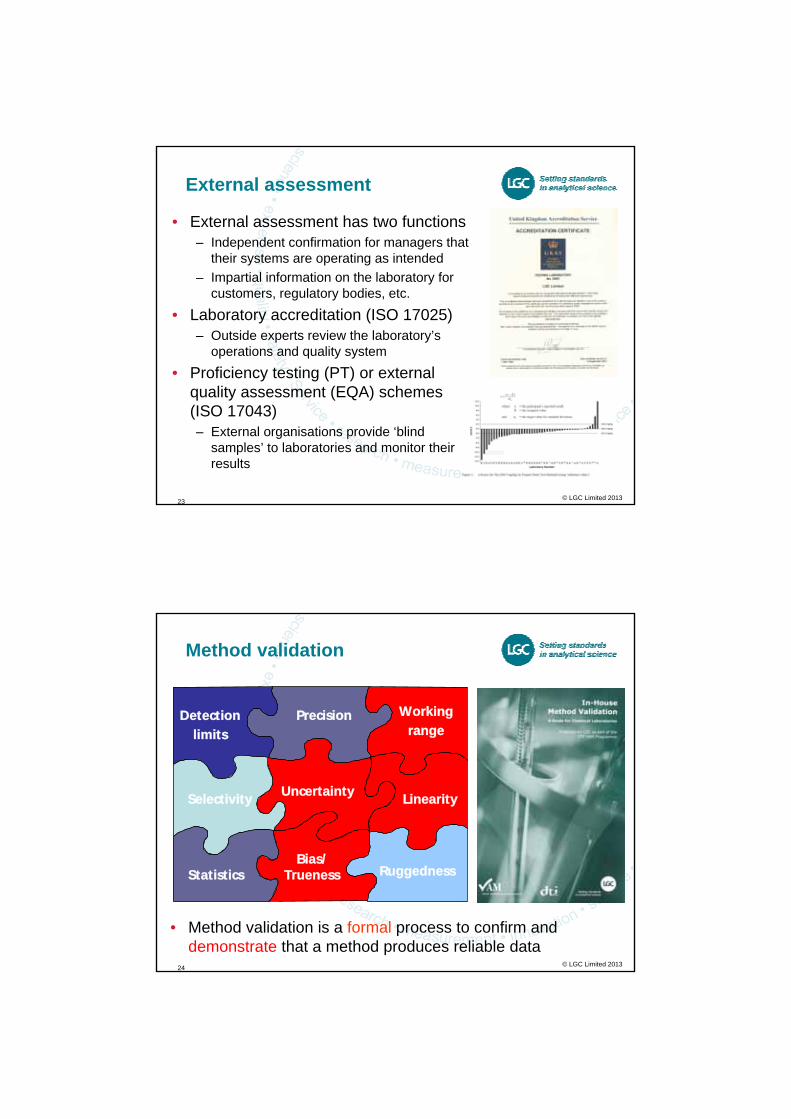
Uncertainty
Precision
Bias/Trueness
Detectionlimits
Linearity
Ruggedness
Selectivity
Workingrange
Statistics
Method validation
• Method validation is a formal process to confirm and demonstrate that a method produces reliable data
© LGC Limited 201325
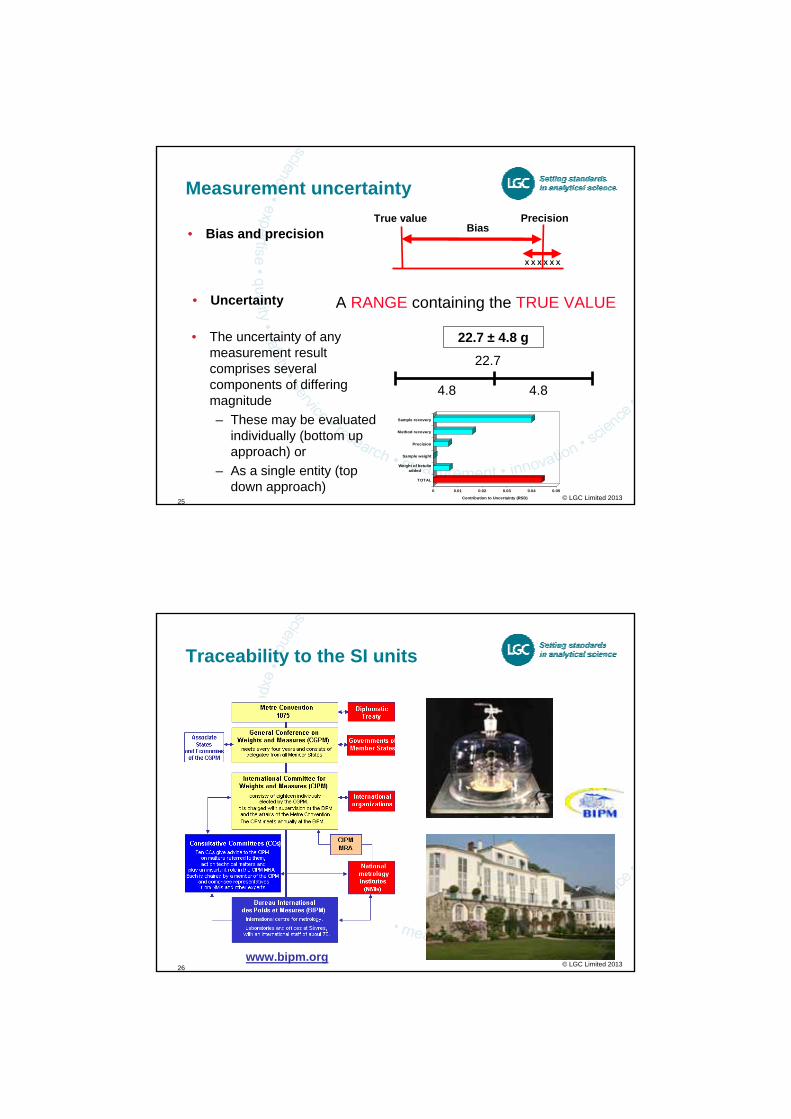
Measurement uncertainty
• Bias and precision
X X X X X X
PrecisionTrue valueBias
0 0.01 0.02 0.03 0.04 0.05
Contribution to Uncertainty (RSD)
TOTAL
Weight of betulinadded
Sample weight
Precision
Method recovery
Sample recovery
• Uncertainty A RANGE containing the TRUE VALUE
22.7
4.8 4.8
22.7 ± 4.8 g• The uncertainty of any measurement result comprises several components of differing magnitude– These may be evaluated
individually (bottom up approach) or
– As a single entity (top down approach)
© LGC Limited 201326
Traceability to the SI units
www.bipm.org
© LGC Limited 201327
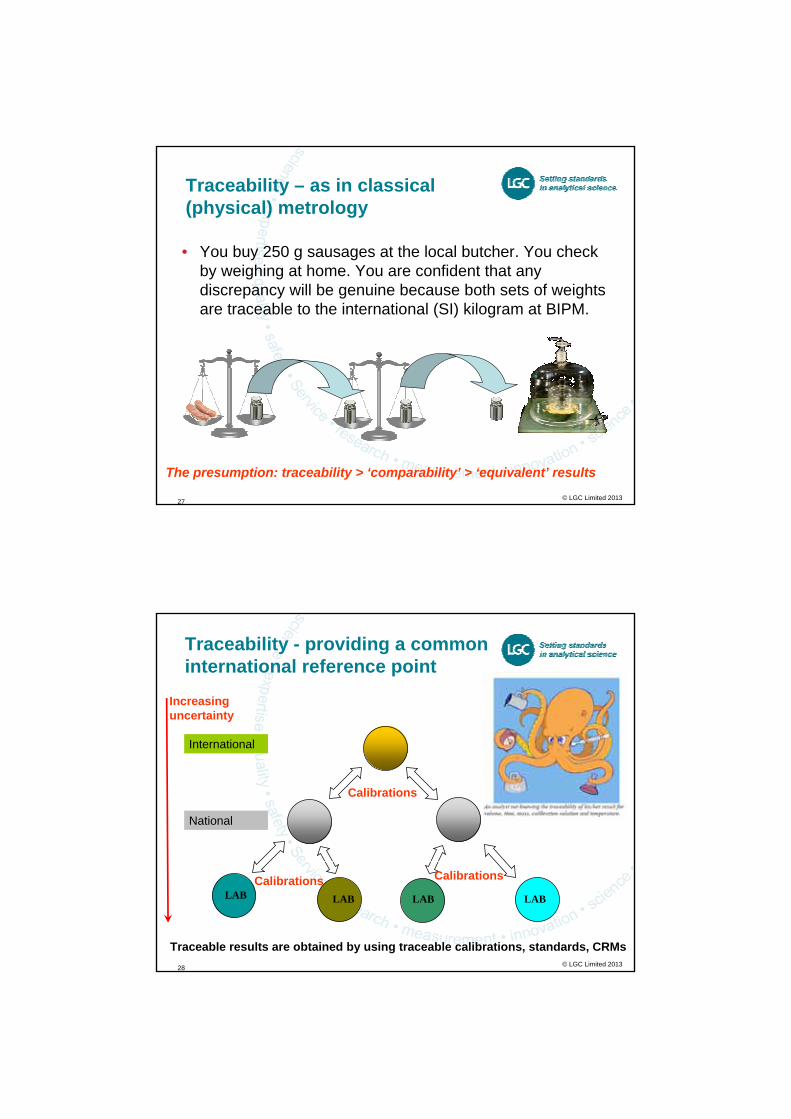
Traceability – as in classical (physical) metrology
• You buy 250 g sausages at the local butcher. You check by weighing at home. You are confident that any discrepancy will be genuine because both sets of weights are traceable to the international (SI) kilogram at BIPM.
The presumption: traceability > ‘comparability’ > ‘equivalent’ results
© LGC Limited 201328
Traceability - providing a common international reference point
International
National
LAB LAB LAB LAB
Increasing uncertainty
Calibrations
Calibrations Calibrations
Traceable results are obtained by using traceable calibrations, standards, CRMs
© LGC Limited 201329
Traceable reference materials and calibration standards
© LGC Limited 201330
4. Analytical laboratories today
© LGC Limited 201331
The commercial landscape
• Closure of many large analytical laboratories
• Commercial failure of small, specialist laboratories (e.g. Public Analysts)
• Demise of specialist in-house laboratories• Competition on price alone has spread
progressively through the analytical sector• Outsourcing has become fashionable and
synonymous with efficiency • Inter-company collaboration to develop
analytical methodology has dwindled in most sectors
© LGC Limited 201332
The skills landscape
• UK academic analytical science was never strong and has weakened further– Low priority in first degree chemistry courses– Limited teaching of practical laboratory skills – Demise of part time education and on the job
training
• The skills base in analytical laboratories is being lost– Practical expertise disappearing with older
generation– Laboratories unwilling or unable to provide on
the job training – Employers recruit from shrinking pool of
experienced candidates
© LGC Limited 201333
The analytical business today
• Outsourcing drives ‘analytical factories’competing on price above quality
• Link between the (customer’s) problem and the (analyst’s) result is broken
• Senior managers lack knowledge of analytical science - or a technical background
• Short term commercial goals are driven by accountants, shareholders and private equity
• Quality systems etc seen as a separate issue, not an essential aspect of reliable data
• Proficiency testing and accreditation become no more than ‘certificates we must have’
© LGC Limited 201334
A true story
• A manufacturer was worried about possible toxic metal contamination of his ‘herbal teas’
• He asked two accredited contract laboratories to independently “measure the toxic metal levels in these tea samples”
• Their data showed large discrepancies, so he sent some of the samples to a third ‘expert’ laboratory which produced another, completely different set of results
• He was not happy with this situation!• An independent investigation of the
samples and the methods used revealed why the errors occurred
© LGC Limited 201335
Herbal Tea: Pb
0
0.5
1
1.5
2
2.5
3
1 2 3 4 5 6 7 8 9 10
Sample Number
Con
cent
ratio
n (m
g/kg
)
Lab 1Lab 2Lab 3ALab 3B
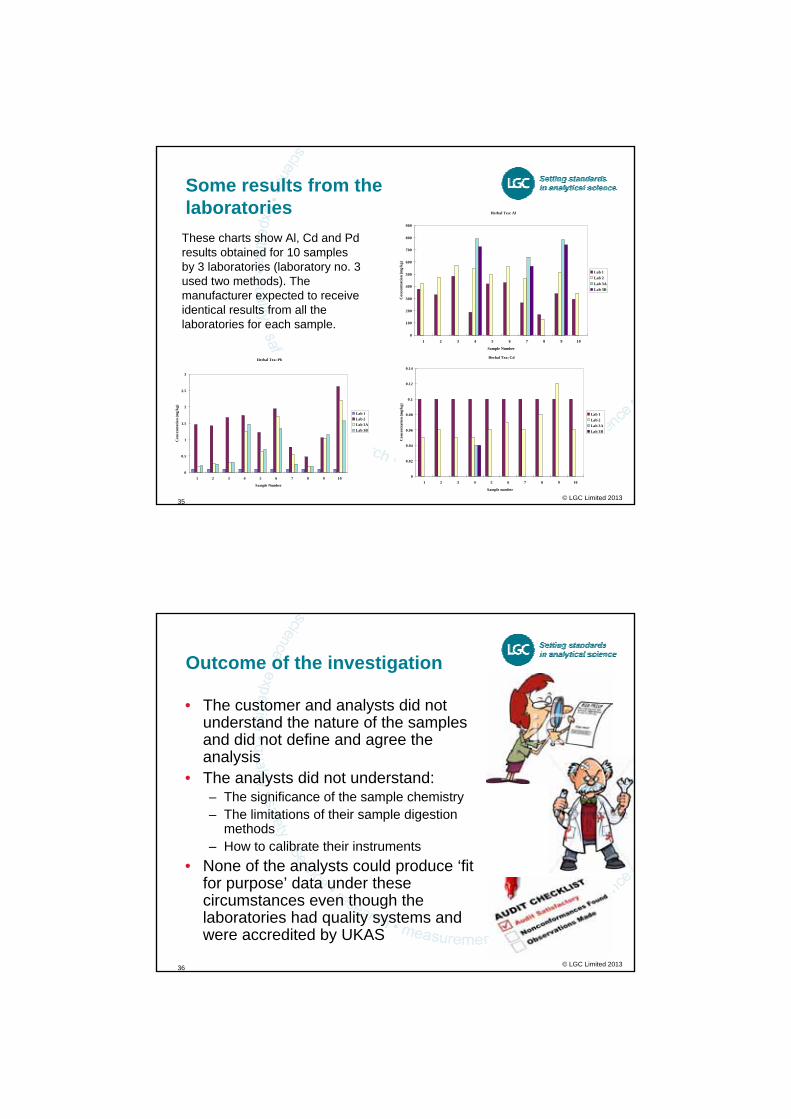
Some results from the laboratories
Herbal Tea: Cd
0
0.02
0.04
0.06
0.08
0.1
0.12
0.14
1 2 3 4 5 6 7 8 9 10
Sample number
Con
cent
ratio
n (m
g/kg
)
Lab 1Lab 2Lab 3ALab 3B
Herbal Tea: Al
0
100
200
300
400
500
600
700
800
900
1 2 3 4 5 6 7 8 9 10
Sample Number
Con
cent
ratio
n (m
g/kg
)
Lab 1Lab 2Lab 3ALab 3B
These charts show Al, Cd and Pd results obtained for 10 samples by 3 laboratories (laboratory no. 3 used two methods). The manufacturer expected to receive identical results from all the laboratories for each sample.
© LGC Limited 201336
Outcome of the investigation
• The customer and analysts did not understand the nature of the samples and did not define and agree the analysis
• The analysts did not understand:– The significance of the sample chemistry– The limitations of their sample digestion
methods– How to calibrate their instruments
• None of the analysts could produce ‘fit for purpose’ data under these circumstances even though the laboratories had quality systems and were accredited by UKAS
© LGC Limited 201337
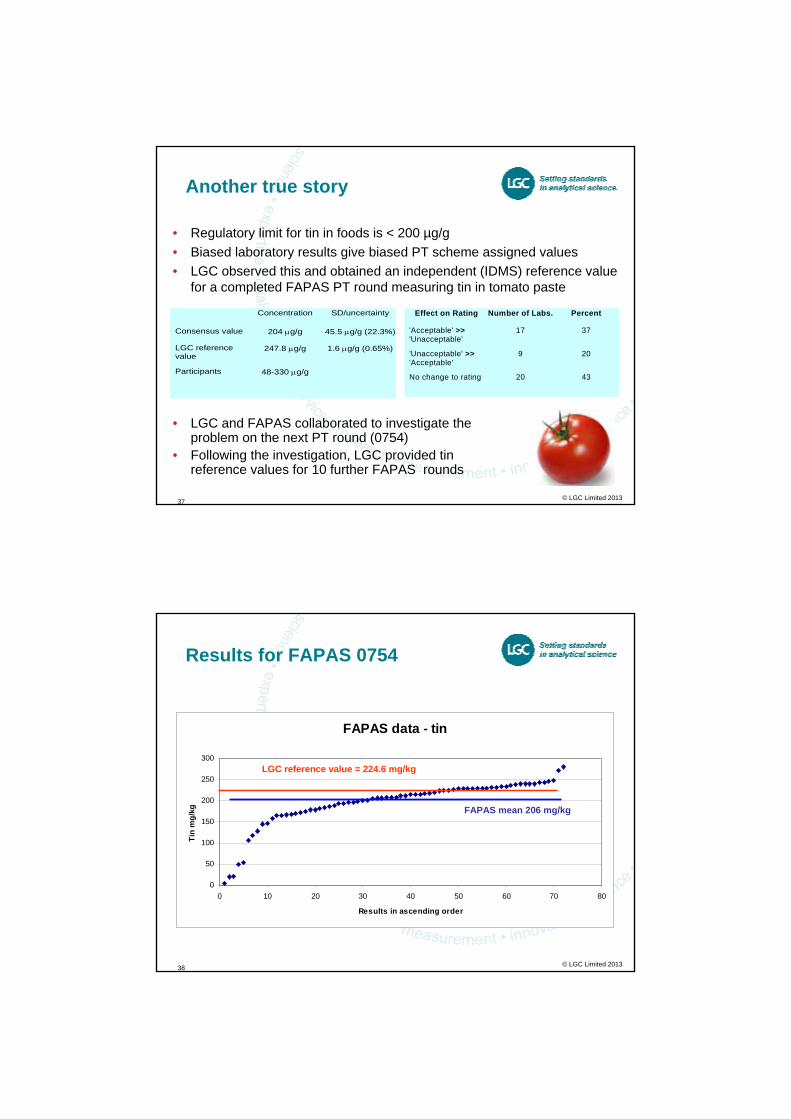
Another true story
• Regulatory limit for tin in foods is < 200 µg/g• Biased laboratory results give biased PT scheme assigned values• LGC observed this and obtained an independent (IDMS) reference value
for a completed FAPAS PT round measuring tin in tomato paste
Concentration SD/uncertainty
Consensus value 204 µg/g 45.5 µg/g (22.3%)
LGC reference value
247.8 µg/g 1.6 µg/g (0.65%)
Participants 48-330 µg/g
Effect on Rating Number of Labs. Percent
'Acceptable' >> 'Unacceptable'
17 37
'Unacceptable' >> 'Acceptable'
9 20
No change to rating 20 43
• LGC and FAPAS collaborated to investigate the problem on the next PT round (0754)
• Following the investigation, LGC provided tin reference values for 10 further FAPAS rounds
© LGC Limited 201338
Results for FAPAS 0754
FAPAS data - tin
0
50
100
150
200
250
300
0 10 20 30 40 50 60 70 80
Results in ascending order
Tin
mg/
kg
LGC reference value = 224.6 mg/kg
FAPAS mean 206 mg/kg
© LGC Limited 201339
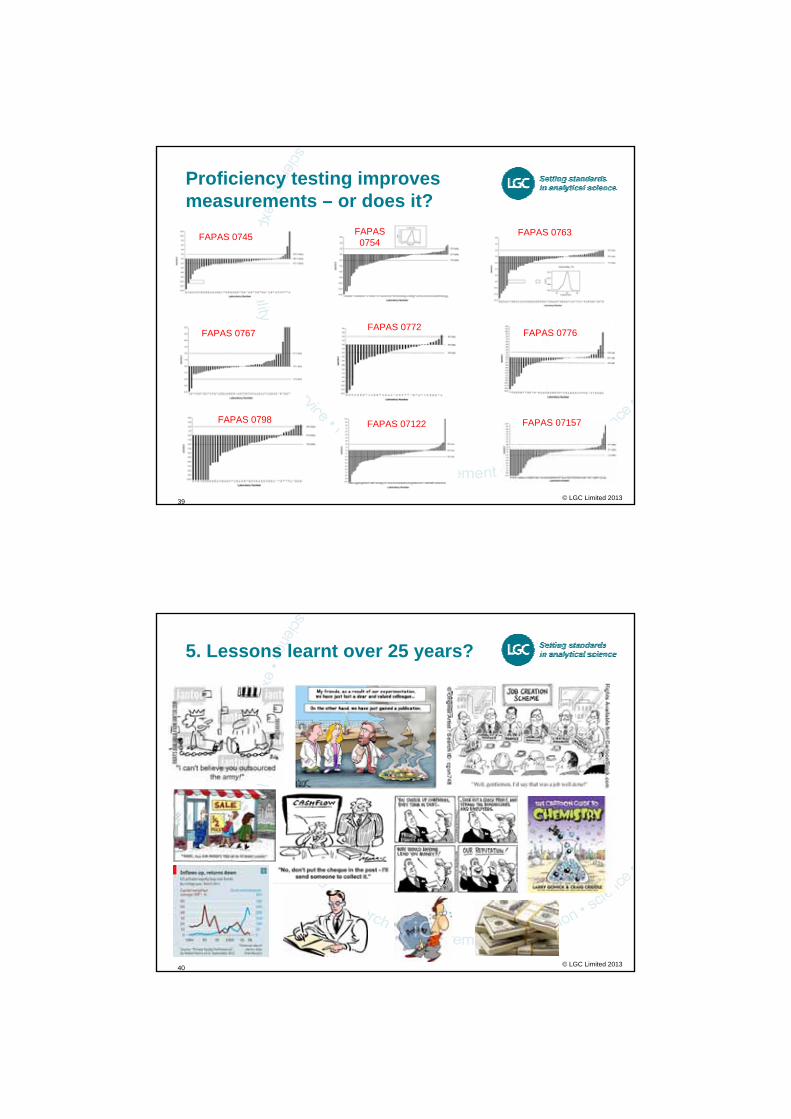
Proficiency testing improves measurements – or does it?
FAPAS 0754
FAPAS 0776FAPAS 0772FAPAS 0767
FAPAS 0745 FAPAS 0763
FAPAS 0798 FAPAS 07122 FAPAS 07157
© LGC Limited 201340
5. Lessons learnt over 25 years?
© LGC Limited 201341
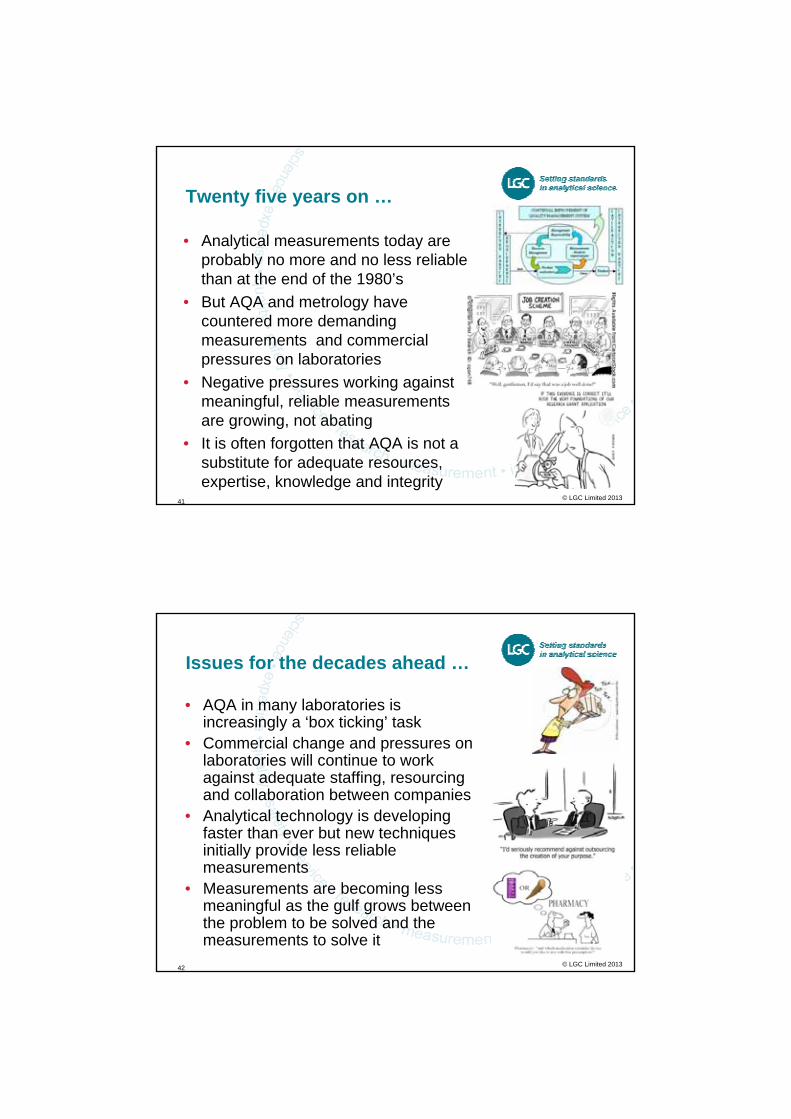
Twenty five years on …
• Analytical measurements today are probably no more and no less reliable than at the end of the 1980’s
• But AQA and metrology have countered more demanding measurements and commercial pressures on laboratories
• Negative pressures working against meaningful, reliable measurements are growing, not abating
• It is often forgotten that AQA is not a substitute for adequate resources, expertise, knowledge and integrity
© LGC Limited 201342
Issues for the decades ahead …
• AQA in many laboratories is increasingly a ‘box ticking’ task
• Commercial change and pressures on laboratories will continue to work against adequate staffing, resourcing and collaboration between companies
• Analytical technology is developing faster than ever but new techniques initially provide less reliable measurements
• Measurements are becoming less meaningful as the gulf grows between the problem to be solved and the measurements to solve it
© LGC Limited 201343
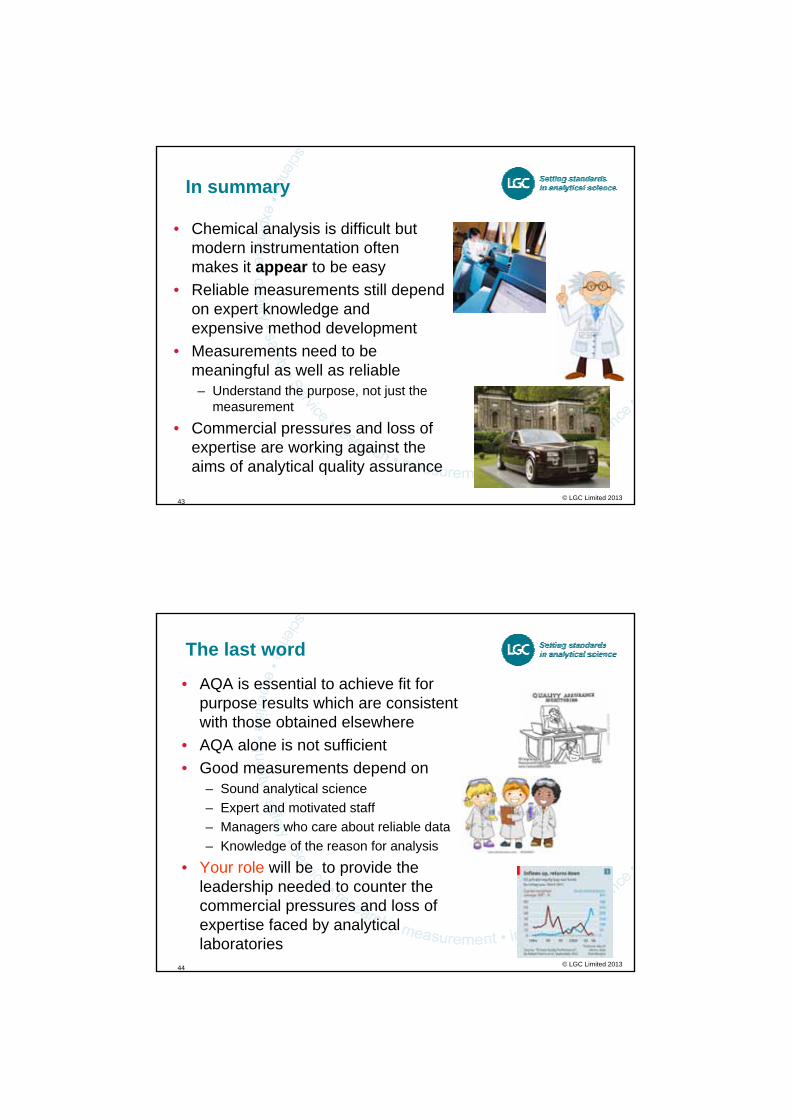
In summary
• Chemical analysis is difficult but modern instrumentation often makes it appear to be easy
• Reliable measurements still depend on expert knowledge and expensive method development
• Measurements need to be meaningful as well as reliable – Understand the purpose, not just the
measurement
• Commercial pressures and loss of expertise are working against the aims of analytical quality assurance
© LGC Limited 201344
The last word
• AQA is essential to achieve fit for purpose results which are consistent with those obtained elsewhere
• AQA alone is not sufficient• Good measurements depend on
– Sound analytical science– Expert and motivated staff– Managers who care about reliable data– Knowledge of the reason for analysis
• Your role will be to provide the leadership needed to counter the commercial pressures and loss of expertise faced by analytical laboratories
© LGC Limited 201345
Acknowledgements
Thomas Summers West CBE. BSc, PhD, DSc, FRSC, FRS. 1927 - 2010