Embed Size (px)
Citation preview

Letter to Our ShareholdersAugust 2021
Q2 2021

2 | Letter to Our Shareholders | Q2 2021
Dear Shareholders,We are excited to share our progress with you in our first quarterly
shareholder letter as a public company. Last month, we completed our
business combination with Rodgers Silicon Valley Acquisition Corp.
(RSVAC) and our listing on Nasdaq (ENVX). This transaction brought in
gross proceeds of approximately $405 million ($230 million from RSVAC’s
trust account and $175 million from a concurrent PIPE offering) and net
proceeds of $382 million. We plan to use these funds to scale-up two
advanced Lithium-ion battery cell production facilities to meet the demands
of our world-class customers. We welcome our new shareholders and look
forward to sharing our progress in the quarters and years ahead.
We are committed to creating the first facility in the world to be capable
of volume production of advanced Lithium-ion batteries with a 100%
active silicon anode using a 3D cell architecture. During the quarter, the
U.S Department of Energy released the “National Blueprint for Lithium
Batteries 2021-2030.” According to the report “[m]aintaining and expanding
lithium cell and battery manufacturing capability here in the U.S. — as well
as in allied and partner countries — is critical to U.S. national security and
is essential to developing resilient defense supply chains not under threat
from near-peer adversaries.” We believe Enovix is well positioned to meet
these needs with our U.S-based manufacturing footprint.
During the quarter, we were able to take receipt of the key equipment
for our first production line at our Fab-1 facility in Fremont, California,
despite the current global supply chain disruptions. This required a heroic
effort on the part of our team, including a crucial decision to charter an
Antonov An-124, one of the world’s largest cargo planes, to fly over 60
tons of manufacturing equipment from Asia to San Francisco International
Airport. We believe that this decision may have avoided delays of up to
three months in the buildout of our Fremont production facility. Going the
extra mile to stay on schedule has been extremely well-received by our
customers, who are counting on us to deliver batteries with record energy
densities.
On that note, we shipped final technology qualification samples from our
pilot production line to key customers during the quarter. These samples
represent the final configuration of the battery we have designed for these
customers and met the product requirements that permitted us to move to
the next stage of qualification. In the fourth quarter of 2021, we plan to ship
production qualification samples from the production line in Fremont. These
are important steps ahead of our expectation of beginning production in Q1
2022 and achieving first product revenue in Q2 2022.
We are excited about our recent contract award announcement to
demonstrate our batteries for the U.S. Army in conjunction with Inventus
Power. We believe that the total U.S. wearable military battery market is
approximately $350 million annually based on currently established military
programs.
Supporting our factory scale-up, we are currently experiencing robust
demand for our advanced batteries. The potential value of a full year of
production from our design wins and active designs reached $292 million
at the end of the second quarter, which exceeds the anticipated revenue
capacity of Fab-1. We are accelerating efforts throughout the company to
scale including:
1) Talent acquisition, hiring, and training
2) Factory capacity
3) Design capacity
4) Investments in intellectual property
5) Creating a global footprint to support our customers

3 | Letter to Our Shareholders | Q2 2021
ScorecardAs we evolve from a company focused predominantly on R&D to a
company capable of volume production and commercialization, we believe
shareholders should evaluate our progress across five key areas:
1. Technology & Products
We shipped technology qualification samples to customers in the quarter,
which is an important step on our way to delivering batteries in the EX-1
node from our automated production line at Fab-1 in Fremont.
Additionally, we have met key battery performance specifications for two of
our lead customers. These include metrics such as energy density, cycle life
at multiple temperatures, swelling, calendar life, and capacity.
2. Manufacturing and Scale-Up
In the quarter we were able to install and begin qualifying our first
production line at our headquarters in Fremont. This line includes a
combination of Enovix-designed proprietary equipment from tier one U.S.-
based factory automation vendors as well as standard battery industry
production equipment. This equipment incorporates our proprietary laser
patterning, stacking, and constraining processes that uniquely manage the
expansion of a 100% active silicon anode, replacing the traditional winding
processes found in conventional Li-ion cell manufacturing.
With the equipment for Line 1 installed, our factory is now undergoing
qualification. The first step in this process is a site acceptance test to confirm
the individual pieces of equipment are meeting performance requirements.
This follows factory acceptance testing already performed at the vendor’s
facility before taking delivery. The second step is a characterization
process, or tool and process bring-up. This is a rigorous phase gate process
developed and effectively used by several of our strategic partners and
members of our management team to successfully scale up multiple high-
volume production factories. To lead this effort, we have added Boris
Bastien as Vice President of Operations to our executive management team.
Bastien’s most recent position was General Manager of SunPower’s Fab4 in
the Philippines.
Category Milestone
1. Technology and Products EX-1: 900 Wh/L energy density 2022
EX-2: 1,030 Wh/L energy density 2023
EX-3: 1,255 Wh/L energy density 2025
2. Manufacturing and Scale-Up
Fab-1: First revenue Q2 2022
Fab-2: First revenue Q2 2023
3. Commercialization Progress funnel to revenue
4. Market Expansion Broaden end market applications
5. Financials $1 billion+ annualized revenue by Q425
with 50% GM and 30% EBIT
Enovix equipment being unloaded from the Antonov cargo plane at SFO

4 | Letter to Our Shareholders | Q2 20214 | Letter to Our Shareholders
3. Commercialization
We are seeing robust customer demand across multiple end markets. Our
revenue funnel reached $1.17 billion at the end of Q2 2021. The funnel metric
comprises the potential value of a full production year for all projects across
three stages: 1) engaged opportunities; 2) active designs; and 3) design wins.
Within the funnel, active designs and design wins reached $292 million. We
are gratified by this level of endorsement, considering that it is occurring
before Fab-1 is even in production.
In addition, we announced today that we have signed a Master Purchase
Agreement and a Cooperation Agreement with a California-based
technology leader focused initially on the wearable device space. Under
terms of the agreements, Enovix will receive a manufacturing capacity
reservation fee and pre-payments totaling $3.5 million over the next
12 months. The total agreements are valued at up to $20 million with
commercialization scheduled to begin in 2025.
Last, we have added to our marketing organization and today are launching
a new campaign – “Just in Time for the Future” that emphasizes the powerful
role our batteries can play in enabling innovations across multiple industries.
4. Market Expansion We recently announced a contract to demonstrate our batteries for the U.S. Army in conjunction with Inventus Power. The Defense market is a great fit for Enovix on several levels:
1) A secure domestic source of supply is valued.
2) Soldiers need smaller and lighter batteries given that today they carry
more than 60 pounds of gear, of which 15 pounds are batteries.
3) It is a market that prioritizes safety and product robustness and has
rigorous testing standards.
We also continued our efforts during the quarter to demonstrate the applicability of our technology for EVs. We commissioned a study by a team of industry leading battery module designers to evaluate the advantages of our cell design for an EV module. The study confirmed the potential advantages Enovix brings to that market in the form of:
1) Higher energy density.
2) Excellent thermal properties, enabling fast charge advantages
3) Reduced module form factor and simpler, smaller electrical and
thermal management sub-systems.
We look forward to addressing this market with our unique cell architecture
in the years ahead.
5. Financials
We remain on track to deliver our first product revenue in 2022 and scale
up in the years thereafter. Based on the strength of our revenue funnel,
we see a favorable demand picture supporting our goal to exit 2025 with
over $1 billion of annualized revenue. It is also worth noting that our recent
agreement with a wearable device customer confirmed our pricing model
and the value of our energy density advantages.
+
=
+
=
Engaged OpportunitiesEngaged customer has determined that our battery is applicable to their
product and is evaluating our technology.
$1.17B Revenue FunnelValue of Full Production Year for all Projects
Active Designs + Design WinsActive Design: Customer completed technology evaluation; identified
end-product; begun design work
Design Win: Customer has funded a custom battery design or qualification of standard battery for a formally approved product that will
use an Enovix 3D cell.
$292M
$881M

5 | Letter to Our Shareholders | Q2 2021
several leading brands in consumer electronics, software and social media
are investing significant resources in what they believe is the next mass
market computing platform, following the PC and the smartphone.
In computing, there is a push in the industry led by our
early investor Intel for laptop PCs to have “always-on”
capability with all-day battery life. We believe we are well
positioned to support this vision with our products and are
seeing strong interest from leading laptop OEMs. These
OEMs are well-represented in our revenue funnel.
In mobile communications, OEMs want to increase the
utilization of 5G radios and AI processing on the edge.
These features place tremendous strain on device power
budgets, driving strong interest in our batteries in this
category. We also target enterprise class devices such as
handheld devices used in retail, and land mobile radios
(LMR) which often need to remain charged for multiple first responder
shifts. These devices are also increasingly taking on the complex features
of a modern smartphone, with similar high-power needs. Our company
is well-positioned to satisfy these demands and we have multiple active
engagements across this category within our funnel.
We believe our focus on these initial categories will prepare us to address
the electric vehicle (EV) battery opportunity by 2025. Scaling production
is no small task and requires continuous improvement in throughput and
yield. We believe becoming a profitable high-volume manufacturer of mobile
electronics batteries de-risks our entry into the EV space. In parallel, we
are actively carrying out multiple projects to address the EV market. This
includes sampling batteries to Auto OEMs and work on our three-year grant
with the U.S. Department of Energy to develop batteries featuring our silicon
anode paired with EV-class cathode materials.
Company StrategyOur accomplishments in the second quarter moved us closer to delivering
batteries with record energy densities for industry-leading customers in
mobile electronics in 2022 We are targeting this market initially for several
reasons:
1) Product designers demand high energy densities, which allow them to
add features, functionality and create new form factors.
2) Batteries often make up a small fraction of the cost of the device,
which speeds adoption in premium products.
3) Consumer electronics design cycles and qualification cycles are
significantly shorter than in other applications such as automotive,
thus enabling us to quickly get to volume production and revenue.
Our near-term focus is on the following market applications: wearables
(smartwatches, AR/VR and headsets), computing and mobile
communications. We estimate the total addressable market for Lithium-
ion batteries in these markets to be $13 billion by 2025. We are actively
sampling to potential customers across all three of these markets and have
design wins in each. We believe this strategy will allow Enovix to deliver
energy densities years ahead of the competition and provide a meaningful
head start to reach scale and benefit from manufacturing learning curves.
In wearables, we are seeing a trend toward more feature-
packed smartwatches, particularly to enable health and
fitness monitoring. With each sensor that is added to track
a physiological trait, there is a corresponding need for
more energy. In addition, product designers want to make
devices more “invisible” to the end user, which means
smaller and lighter form factors. Our batteries enable
these features. As a result, we are engaged with multiple leading brands and
several exciting new entrants.
We also have multiple potential customers targeting our batteries for
Augmented Reality (AR) devices. This is a nascent category today, but

6 | Letter to Our Shareholders | Q2 2021
OutlookEnovix expects to make meaningful progress toward our goal of starting
production in Q1 2022 with product revenue in Q2 2022. With the proceeds
from the SPAC merger and associated PIPE offering, we are well-capitalized
and remain on track to fund our plan.
For full-year 2021 we expect to use between $110 million and $120 million
of free cash flow with roughly half coming from capital expenditures, as we
accelerate efforts to scale across multiple areas, including:
1) Talent acquisition and hiring. We have added 55 employees since
the beginning of the year to bring our total to 184 as of June 30, 2021.
In addition, we have supplemented our team with 62 contractors and
temporary employees to assist in the bring up of Fab-1.
2) Factory capacity. We are investing to support the capacity ramp
of Fab-1 including accelerating purchases and delivery of certain
equipment in response to extended lead times in the supply chain..
3) Design capacity. We are increasing our capacity for new designs and
custom cell development in response to increasing demand and an
expanding customer base.
4) Investments in intellectual property. We are significantly expanding
and accelerating our patent portfolio efforts to further protect our
unique 3D architecture globally.
5) Creating a global footprint to support our customers. We are
building out infrastructure to support a global customer base,
including sales and customer support.
SummaryOur work in this first half of 2021 has been productive, and we have
positioned our company to begin volume production of advanced Li-Ion
batteries for delivery to category-leading customers in 2022. We are proud
of our team’s execution toward the creation of our first-of-a-kind production
line.
Simply put, the world’s next-generation products are starved for higher
energy density batteries. Our team is focused on making a step change in
energy density a reality.
As a result of our business combination with RSVAC ,we are entering the
second half of this year with significant financial strength, one that we
will use to expand our revenue funnel, create two efficient high-volume
manufacturing Fabs, and continue to develop batteries with unparalleled
energy density.
Harrold Rust, CEO & Co-Founder Steffen Pietzke, CFO
Quarterly Conference Call and WebcastTuesday, August 10 / 2 p.m. PT / 5 p.m. ET
IR WEBSITE: ir.enovix.com
DIAL-IN: 1-833-865-1567, passcode: 9483164

7 | Letter to Our Shareholders | Q2 2021
Enovix CorporationConsolidated Balance Sheets
(In Thousands, Except Share and per Share Amounts)
Enovix equipment demonstration at our analyst day July 15, 2021
DRAFT 11.0
7
Enovix Corporation Consolidated Balance Sheets (In Thousands, Except Share and per Share Amounts)
June 30, December 31, 2021 2020
Assets Current assets:
Cash and cash equivalents $ 4,951 $ 29,143 Deferred contract costs 4,280 2,955 Prepaid expenses and other current assets 1,967 946
Total current assets 11,198 33,044 Property and equipment, net 50,701 31,290 Operating lease, right-of-use assets 6,897 — Deferred contract costs, non-current — 495 Deferred transaction costs 5,725 — Other assets, non-current 141 135
Total assets $ 74,662 $ 64,964 Liabilities, Convertible Preferred Stock and Stockholders’ Deficit Current liabilities:
Accounts payable $ 5,458 $ 2,083 Accrued expenses 4,721 1,999 Accrued compensation 1,914 1,268 Deferred revenue 5,495 5,410 Secured promissory note 14,932 — Other liabilities 710 108
Total current liabilities 33,230 10,868 Deferred rent, non-current — 1,567 Convertible preferred stock warrants — 15,995 Operating lease liabilities, non-current 9,447 — Deferred revenue, non-current 1,100 85 Other liabilities, non-current 265 233
Total liabilities 44,042 28,748 Commitments and Contingencies (Note 7) Convertible preferred stock, $0.001 par value
Authorized shares of 334,713,204; issued and outstanding shares of 334,531,360 and 324,370,424; and aggregate liquidation preference of $222,799 and $205,372 as of June 30, 2021 and December 31, 2020, respectively
222,933
202,056
Stockholders’ deficit: Common stock, $0.001 par value; authorized shares of 497,000,000; issued and outstanding shares of 104,597,618 and 93,986,381 as of June 30, 2021 and December 31, 2020, respectively
70
65
Additional paid-in-capital 45,363 41,373 Accumulated deficit (237,746 ) (207,278 )
Total stockholders’ deficit (192,313 ) (165,840 ) Total liabilities, convertible preferred stock and stockholders’ deficit $ 74,662 $ 64,964

8 | Letter to Our Shareholders | Q2 2021
Enovix CorporationCondensed Consolidated Statements of Operations (Unaudited)
(In Thousands, Except Share and per Share Amounts)
Enovix equipment demonstration at our analyst day July 15, 2021
DRAFT 11.0
8
Enovix Corporation Condensed Consolidated Statements of Operations (Unaudited) (In Thousands, Except Share and per Share Amounts)
Three Months Ended June 30, Six Months Ended June 30, 2021 2020 2021 2020
Operating expenses: Cost of revenue $ 112 $ 858 $ 1,743 $ 1,229 Research and development 9,523 3,230 15,112 5,635 Selling, general and administrative 4,548 1,280 8,709 2,280
Total operating expenses 14,183 5,368 25,564 9,144 Loss from operations (14,183 ) (5,368 ) (25,564 ) (9,144 ) Other income (expense):
Change in fair value of convertible preferred stock warrants — 209 (4,781 ) 275 Issuance of convertible preferred stock warrants — — — (1,476 ) Change in fair value of convertible promissory notes — — — (2,422 ) Interest expense (135 ) — (135 ) (107 ) Other income, net 15 9 12 42
Total other (expense) income, net (120 ) 218 (4,904 ) (3,688 ) Net loss $ (14,303 ) $ (5,150 ) $ (30,468 ) $ (12,832 ) Net loss per share, basic and diluted $ (0.21 ) $ (0.09 ) $ (0.45 ) $ (0.21 ) Weighted average number of common shares outstanding, basic and diluted 69,029,099 60,315,795 67,828,958 60,015,903
8 | Letter to Our Shareholders

9 | Letter to Our Shareholders | Q2 2021
Enovix CorporationCondensed Consolidated Statements of Cash Flows (Unaudited)
(In Thousands)
Enovix equipment demonstration at our analyst day July 15, 2021
DRAFT 11.0
9
Enovix Corporation Condensed Consolidated Statements of Cash Flows (Unaudited) (In Thousands)
Six Months Ended June 30, 2021 2020
Cash flows from operating activities: Net loss $ (30,468 ) $ (12,832 ) Adjustments to reconcile net loss to net cash used in operating activities
Depreciation 375 289 Stock-based compensation expense 3,675 116 Changes in fair value of convertible preferred stock warrants 4,781 (275 ) Issuance of convertible preferred stock warrants (non-cash) — 1,476 Change in fair value of convertible promissory notes — 2,422 Interest expense (non-cash) — 107 Changes in operating assets and liabilities:
Prepaid expenses and other assets 493 91 Deferred contract costs (693 ) (1,361 ) Accounts payable 3,904 (154 ) Accrued expenses and compensation 1,592 237 Deferred revenue 1,100 155 Other liabilities 99 397
Net cash used in operating activities (15,142 ) (9,332 ) Cash flows from investing activities: Purchase of property and equipment (20,573 ) (11,543 ) Net cash used in investing activities (20,573 ) (11,543 ) Cash flows from financing activities: Proceeds from issuance of convertible preferred stock, net — 39,213 Proceeds from exercise of convertible preferred stock warrants 102 — Proceeds from the exercise of stock options 163 — Repurchase of unvested restricted common stock (10 ) — Proceeds from secured promissory notes and converted promissory notes 14,910 1,628 Payments of Business Combination share issuance costs (3,592 ) — Net cash provided by financing activities 11,573 40,841 Change in cash, cash equivalents, and restricted cash (24,142 ) 19,966 Cash and cash equivalents and restricted cash, beginning of period 29,218 10,301 Cash and cash equivalents, and restricted cash, end of period $ 5,076 $ 30,267 Supplemental cash flow data (Non-cash): Accrued purchase of property and equipment $ 2,298 $ 5,053 Accrued purchase of transaction costs 2,133 — Conversion of promissory notes to convertible preferred stock — 8,073 Settlement of accrued interest expense through conversion of promissory notes to convertible preferred stock — 130 Issuance of convertible preferred stock warrants — 1,476
10 | Letter to Our Shareholders | Q2 2021
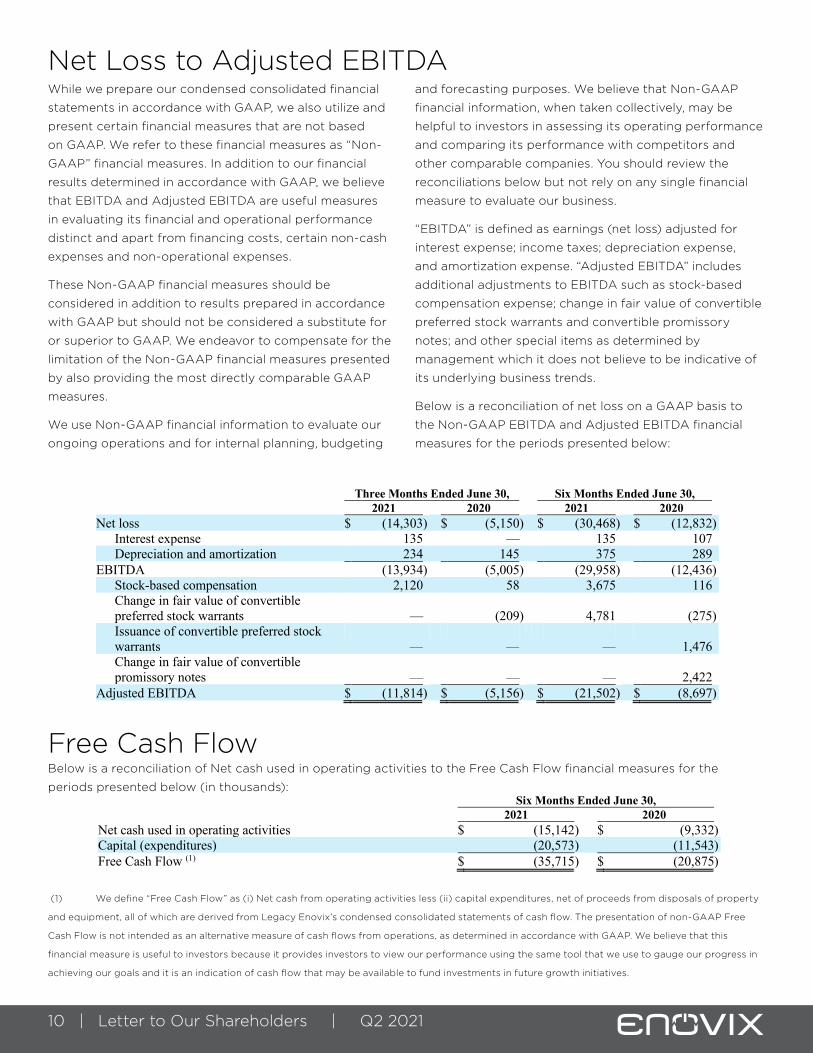
While we prepare our condensed consolidated financial
statements in accordance with GAAP, we also utilize and
present certain financial measures that are not based
on GAAP. We refer to these financial measures as “Non-
GAAP” financial measures. In addition to our financial
results determined in accordance with GAAP, we believe
that EBITDA and Adjusted EBITDA are useful measures
in evaluating its financial and operational performance
distinct and apart from financing costs, certain non-cash
expenses and non-operational expenses.
These Non-GAAP financial measures should be
considered in addition to results prepared in accordance
with GAAP but should not be considered a substitute for
or superior to GAAP. We endeavor to compensate for the
limitation of the Non-GAAP financial measures presented
by also providing the most directly comparable GAAP
measures.
We use Non-GAAP financial information to evaluate our
ongoing operations and for internal planning, budgeting
and forecasting purposes. We believe that Non-GAAP
financial information, when taken collectively, may be
helpful to investors in assessing its operating performance
and comparing its performance with competitors and
other comparable companies. You should review the
reconciliations below but not rely on any single financial
measure to evaluate our business.
“EBITDA” is defined as earnings (net loss) adjusted for
interest expense; income taxes; depreciation expense,
and amortization expense. “Adjusted EBITDA” includes
additional adjustments to EBITDA such as stock-based
compensation expense; change in fair value of convertible
preferred stock warrants and convertible promissory
notes; and other special items as determined by
management which it does not believe to be indicative of
its underlying business trends.
Below is a reconciliation of net loss on a GAAP basis to
the Non-GAAP EBITDA and Adjusted EBITDA financial
measures for the periods presented below:
Below is a reconciliation of Net cash used in operating activities to the Free Cash Flow financial measures for the
periods presented below (in thousands):
(1) We define “Free Cash Flow” as (i) Net cash from operating activities less (ii) capital expenditures, net of proceeds from disposals of property
and equipment, all of which are derived from Legacy Enovix’s condensed consolidated statements of cash flow. The presentation of non-GAAP Free
Cash Flow is not intended as an alternative measure of cash flows from operations, as determined in accordance with GAAP. We believe that this
financial measure is useful to investors because it provides investors to view our performance using the same tool that we use to gauge our progress in
achieving our goals and it is an indication of cash flow that may be available to fund investments in future growth initiatives.
Net Loss to Adjusted EBITDA
Free Cash Flow
Enovix equipment demonstration at our analyst day July 15, 2021
DRAFT 11.0
10
Net Loss to Adjusted EBITDA
While we prepare our condensed consolidated financial statements in accordance with GAAP, we also utilize and presents certain financial measures that are not based on GAAP. We refer to these financial measures as “Non-GAAP” financial measures. In addition to our financial results determined in accordance with GAAP, we believe that EBITDA and Adjusted EBITDA are useful measures in evaluating its financial and operational performance distinct and apart from financing costs, certain non-cash expenses and non-operational expenses.
These Non-GAAP financial measures should be considered in addition to results prepared in accordance with GAAP but should not be considered a substitute for or superior to GAAP. We endeavor to compensate for the limitation of the Non-GAAP financial measures presented by also providing the most directly comparable GAAP measures.
We use Non-GAAP financial information to evaluate our ongoing operations and for internal planning, budgeting and forecasting purposes. We believe that Non-GAAP financial information, when taken collectively, may be helpful to investors in assessing its operating performance and comparing its performance with competitors and other comparable companies. You should review the reconciliations below but not rely on any single financial measure to evaluate our business.
“EBITDA” is defined as earnings (net loss) adjusted for interest expense; income taxes; depreciation expense, and amortization expense. “Adjusted EBITDA” includes additional adjustments to EBITDA such as stock-based compensation expense; change in fair value of convertible preferred stock warrants and convertible promissory notes; and other special items as determined by management which it does not believe to be indicative of its underlying business trends.
Below is a reconciliation of net loss on a GAAP basis to the Non-GAAP EBITDA and Adjusted EBITDA financial measures for the periods presented below:
Three Months Ended June 30, Six Months Ended June 30, 2021 2020 2021 2020
Net loss $ (14,303 ) $ (5,150 ) $ (30,468 ) $ (12,832 ) Interest expense 135 — 135 107 Depreciation and amortization 234 145 375 289
EBITDA (13,934 ) (5,005 ) (29,958 ) (12,436 ) Stock-based compensation 2,120 58 3,675 116 Change in fair value of convertible preferred stock warrants — (209 ) 4,781 (275 ) Issuance of convertible preferred stock warrants — — — 1,476 Change in fair value of convertible promissory notes — — — 2,422
Adjusted EBITDA $ (11,814 ) $ (5,156 ) $ (21,502 ) $ (8,697 )
DRAFT 11.0
11
Free Cash Flow
Below is a reconciliation of Net cash used in operating activities to the Free Cash Flow financial measures for the periods presented below (in thousands):
Six Months Ended June 30, 2021 2020
Net cash used in operating activities $ (15,142 ) $ (9,332 ) Capital (expenditures) (20,573 ) (11,543 ) Free Cash Flow (1) $ (35,715 ) $ (20,875 )
(1) We define “Free Cash Flow” as (i) Net cash from operating activities less (ii) capital expenditures, net of proceeds from
disposals of property and equipment, all of which are derived from Legacy Enovix’s condensed consolidated statements of cash flow. The presentation of non-GAAP Free Cash Flow is not intended as an alternative measure of cash flows from operations, as determined in accordance with GAAP. We believe that this financial measure is useful to investors because it provides investors to view our performance using the same tool that we use to gauge our progress in achieving our goals and it is an indication of cash flow that may be available to fund investments in future growth initiatives.
Management’s Use of Non-GAAP Financial Measures
EBITDA, Adjusted EBITDA and Free Cash Flow are intended as supplemental financial measures of Enovix’s performance that are neither required by, nor presented in accordance with GAAP. Enovix believes that the use of EBITDA, Adjusted EBITDA and Free Cash Flow provides an additional tool for investors to use in evaluating ongoing operating results, trends, and in comparing its financial measures with those of comparable companies, which may present similar Non-GAAP financial measures to investors.
However, you should be aware that when evaluating EBITDA, Adjusted EBITDA, and Free Cash Flow, Enovix may incur future expenses similar to those excluded when calculating these measures. In addition, the presentation of these measures should not be construed as an inference that its future results will be unaffected by unusual or nonrecurring items. Enovix’s computation of EBITDA, Adjusted EBITDA, and Free Cash Flow may not be comparable to other similarly titled measures computed by other companies, because all companies may not calculate EBITDA, Adjusted EBITDA and Free Cash Flow in the same fashion.
Forward-Looking Statements
This letter to shareholders contains forward-looking statements within the meaning of Section 27A of the Securities Act of 1933, as amended, and Section 21E of the Securities Exchange Act of 1934, as amended, about us and our industry that involve substantial risks and uncertainties. Forward-looking statements generally relate to future events or Enovix’s future financial or operating performance. In some cases, you can identify forward-looking statements because they contain words such as “believe”, “will”, “may”, “estimate”, “continue”, “anticipate”, “intend”, “should”, “plan”, “expect”, “predict”, “could”, “potentially", “target”, “project”, “believe”, “continue” or the negative of these terms or similar

11 | Letter to Our Shareholders | Q2 2021
Management’s Use of Non-GAAP Financial Measures EBITDA, Adjusted EBITDA and Free Cash Flow are
intended as supplemental financial measures of Enovix’s
performance that are neither required by, nor presented
in accordance with GAAP. Enovix believes that the use of
EBITDA, Adjusted EBITDA and Free Cash Flow provides
an additional tool for investors to use in evaluating
ongoing operating results, trends, and in comparing its
financial measures with those of comparable companies,
which may present similar Non-GAAP financial measures
to investors.
However, you should be aware that when evaluating
EBITDA, Adjusted EBITDA, and Free Cash Flow, Enovix
may incur future expenses similar to those excluded
when calculating these measures. In addition, the
presentation of these measures should not be construed
as an inference that its future results will be unaffected
by unusual or nonrecurring items. Enovix’s computation
of EBITDA, Adjusted EBITDA, and Free Cash Flow may
not be comparable to other similarly titled measures
computed by other companies, because all companies
may not calculate EBITDA, Adjusted EBITDA and Free
Cash Flow in the same fashion.
Forward-Looking StatementsThis letter to shareholders contains forward-looking
statements within the meaning of Section 27A of the
Securities Act of 1933, as amended, and Section 21E of
the Securities Exchange Act of 1934, as amended, about
us and our industry that involve substantial risks and
uncertainties. Forward-looking statements generally relate
to future events or Enovix’s future financial or operating
performance. In some cases, you can identify forward-
looking statements because they contain words such as
“believe”, “will”, “may”, “estimate”, “continue”, “anticipate”,
“intend”, “should”, “plan”, “expect”, “predict”, “could”,
“potentially”, “target”, “project”, “believe”, “continue” or the
negative of these terms or similar expressions. Forward-
looking statements in this letter to shareholders include,
but are not limited to, statements regarding our financial
and business performance, our ability to meet milestones
and deliver on our objectives and expectations, our
ability to scale, our use of proceeds from the business
combination with RSVAC, statements regarding our
planned investments and the potential returns on those
investments, the future demand for our lithium-ion battery
solutions, our ability to achieve market acceptance for our
products, the implementation and success of our business
model and growth strategy, statements regarding our
expectations regarding market opportunity and the
expansion of our customer base, and our ability to meet
the expectations of new and current customers. Actual
results could differ materially from these forward-looking
statements as a result of certain risks and uncertainties,
including, without limitation, the risks set forth under
the caption “Risk Factors” in the Registration Statement
on Form S-1 (No. 333-258358) that Enovix filed with the
Securities and Exchange Commission (the “SEC”) on
August 2, 2021, and other documents Enovix has filed, or
that Enovix will file, with the SEC. Any forward-looking
statements made by Enovix in this letter to shareholders
speak only as of the date on which they are made and
subsequent events may cause these expectations to
change. Enovix disclaims any obligations to update or alter
these forward-looking statements in the future, whether
as a result of new information, future events or otherwise,
except as required by law.