Embed Size (px)
Citation preview
Leukaemia Cluster in Children near Kruemmel NPP and GKSS Nuclear Research Center in Germany
Inge Schmitz-FeuerhakeGerman Society for Radiation Protection
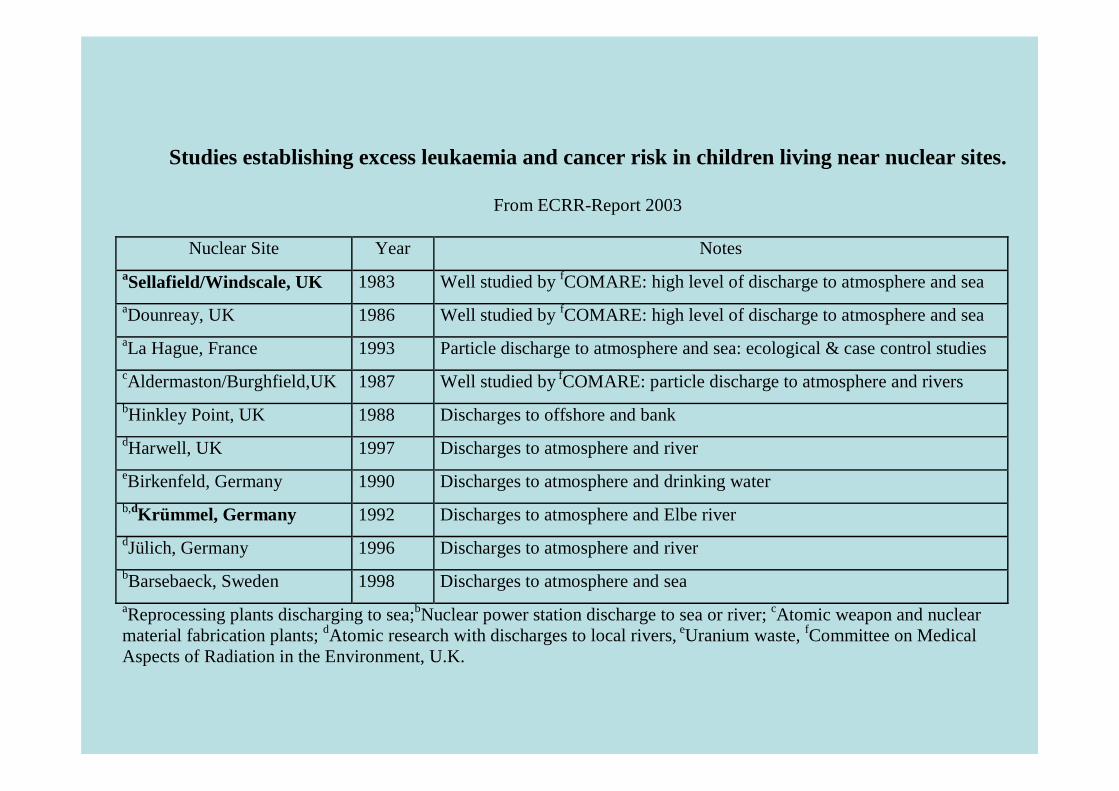
Studies establishing excess leukaemia and cancer risk in children living near nuclear sites.
From ECRR-Report 2003
Nuclear Site Year Notes aSellafield/Windscale, UK 1983 Well studied by fCOMARE: high level of discharge to atmosphere and sea aDounreay, UK 1986 Well studied by fCOMARE: high level of discharge to atmosphere and sea aLa Hague, France 1993 Particle discharge to atmosphere and sea: ecological & case control studies cAldermaston/Burghfield,UK 1987 Well studied by fCOMARE: particle discharge to atmosphere and rivers bHinkley Point, UK 1988 Discharges to offshore and bank dHarwell, UK 1997 Discharges to atmosphere and river eBirkenfeld, Germany 1990 Discharges to atmosphere and drinking water b,dKrümmel, Germany 1992 Discharges to atmosphere and Elbe river dJülich, Germany 1996 Discharges to atmosphere and river bBarsebaeck, Sweden 1998 Discharges to atmosphere and sea aReprocessing plants discharging to sea;bNuclear power station discharge to sea or river; cAtomic weapon and nuclear material fabrication plants; dAtomic research with discharges to local rivers, eUranium waste, fCommittee on Medical Aspects of Radiation in the Environment, U.K.
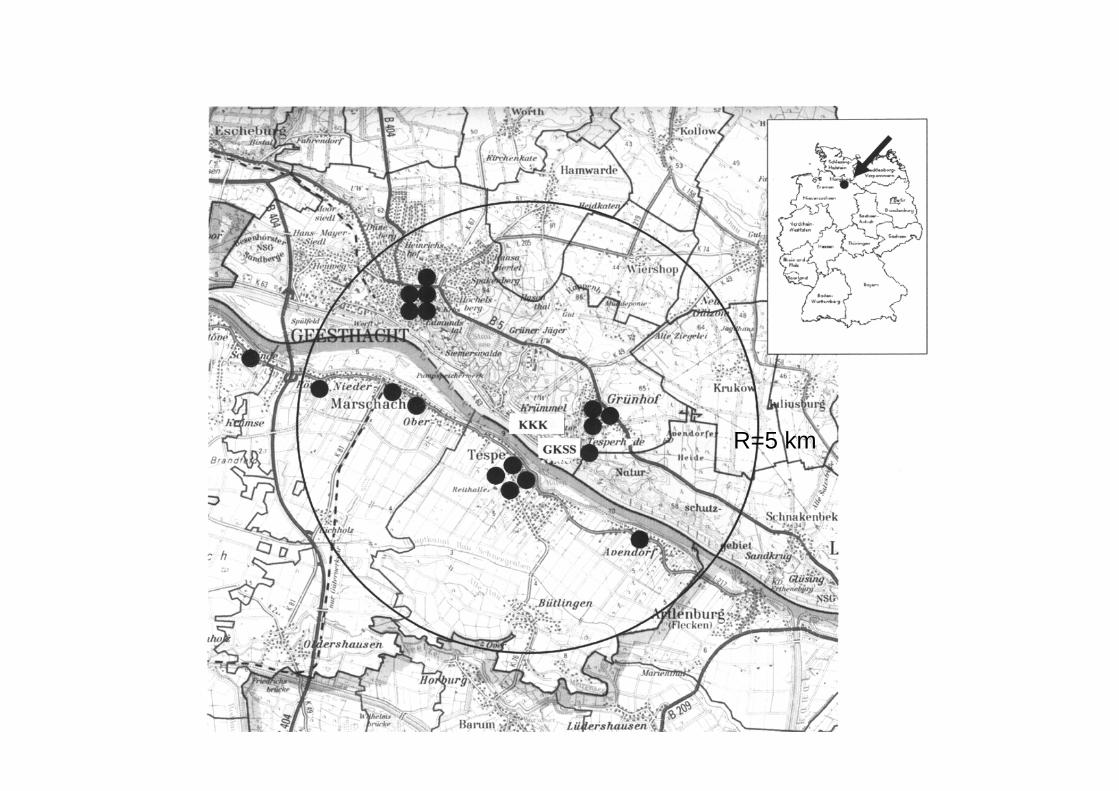
R=5 km

Epidemiologic phenomena about the cluster
• More boys than girls• Ages at diagnosis 10 years
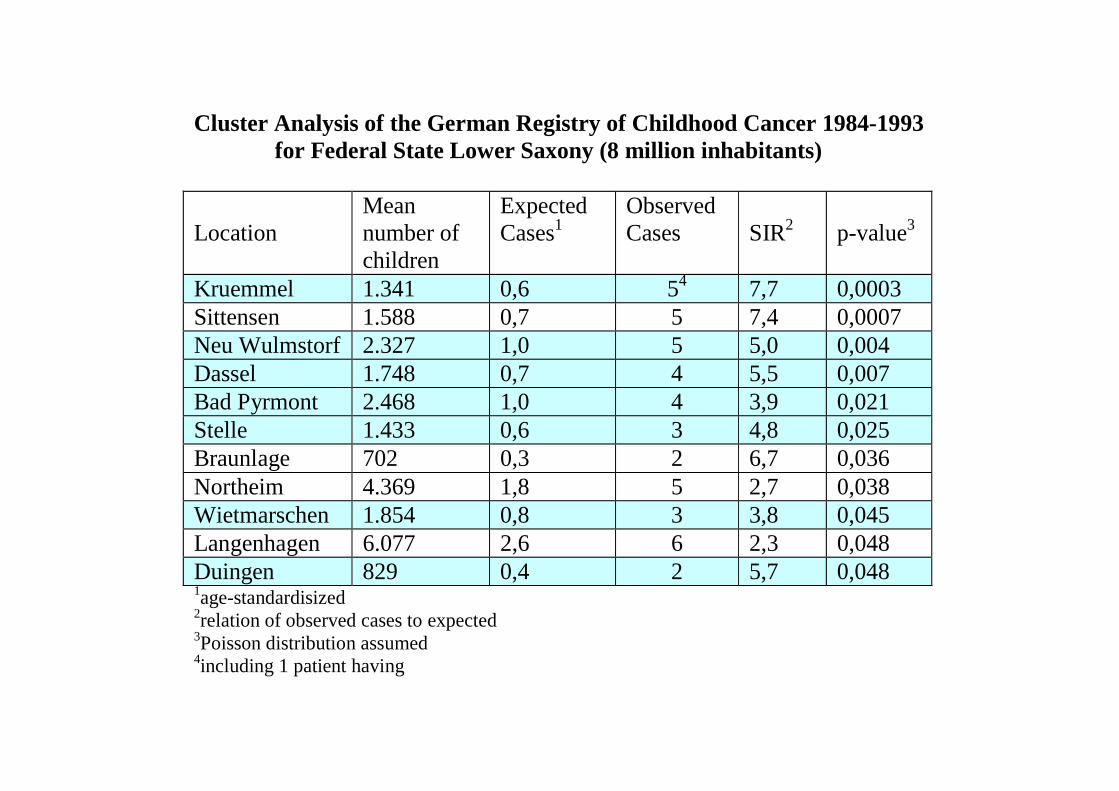
Cluster Analysis of the German Registry of Childhood Cancer 1984-1993 for Federal State Lower Saxony (8 million inhabitants)
Location
Mean number of children
Expected Cases1
Observed Cases
SIR2
p-value3
Kruemmel 1.341 0,6 54 7,7 0,0003 Sittensen 1.588 0,7 5 7,4 0,0007 Neu Wulmstorf 2.327 1,0 5 5,0 0,004 Dassel 1.748 0,7 4 5,5 0,007 Bad Pyrmont 2.468 1,0 4 3,9 0,021 Stelle 1.433 0,6 3 4,8 0,025 Braunlage 702 0,3 2 6,7 0,036 Northeim 4.369 1,8 5 2,7 0,038 Wietmarschen 1.854 0,8 3 3,8 0,045 Langenhagen 6.077 2,6 6 2,3 0,048 Duingen 829 0,4 2 5,7 0,048 1age-standardisized 2relation of observed cases to expected 3Poisson distribution assumed 4including 1 patient having

Investigations
• Chromosome studies• Environmental radioactivity• Analysis of an accident

Interchromosomal aberrations


0
1
2
3
4
5
6
1980
/8119
82/83
1984
/8519
86/87
1988
/8919
90/91
1992
/9319
94/95
1996
/9719
98/99
2000
/0120
02/03
2004
/0520
06/07
Anzahl Fälle

12.9.86
0
500
1000
1500
2000
2500
3000
3500
4000
1985 1986 1987 1988 1989 1990 1991
Bq/
qm
Marschacht E ichholzOldershausenHandorfRottorf
Gemessene Betaflächenaktivität durch GKSS an verschiedenen Stationen

Tschernobyl
0
20000
40000
60000
80000
100000
120000
1983
1984
1985
1986
1987
1988
15.9.86
oberhalbunterhalb
Spaltprodukt Cs 137 im Elbsediment bei GKSS in mB/kg, oberhalb GKSS-Einleitstelle und unterhalb GKSS-Einleitsstelle, Messung LUFA Kiel
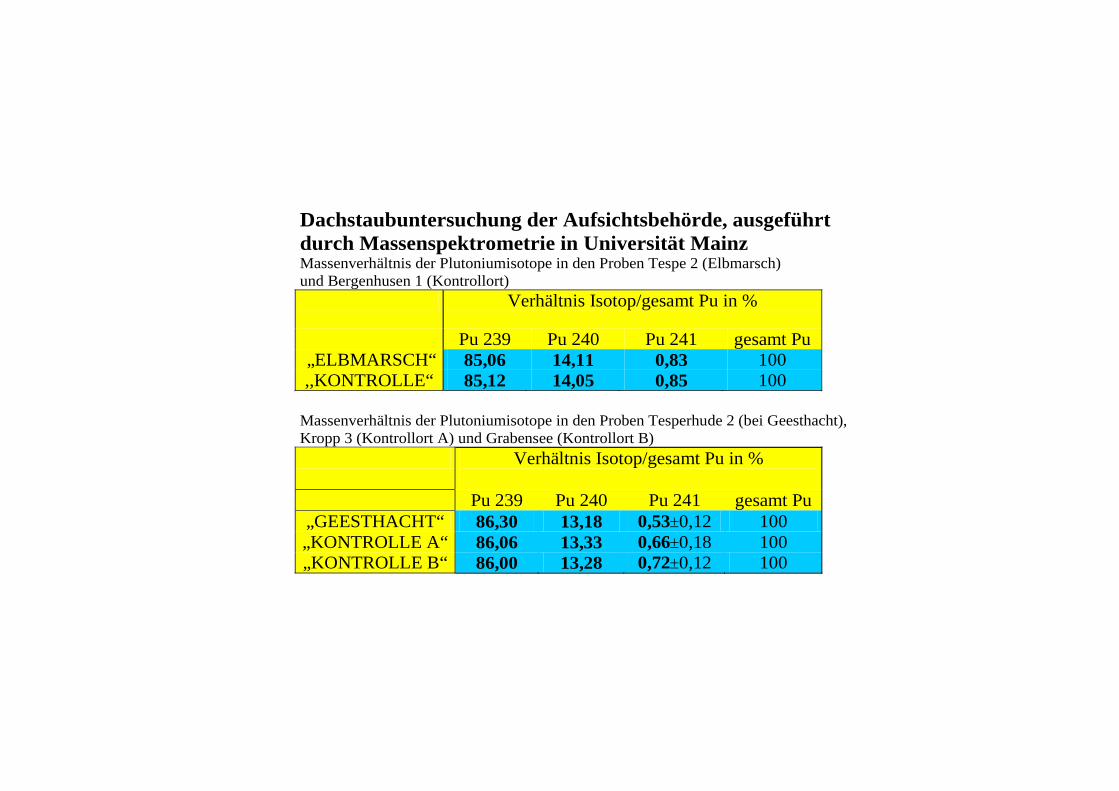
Dachstaubuntersuchung der Aufsichtsbehörde, ausgeführt durch Massenspektrometrie in Universität Mainz Massenverhältnis der Plutoniumisotope in den Proben Tespe 2 (Elbmarsch) und Bergenhusen 1 (Kontrollort)
Verhältnis Isotop/gesamt Pu in %
Pu 239 Pu 240 Pu 241 gesamt Pu „ELBMARSCH“ 85,06 14,11 0,83 100 ,,KONTROLLE“ 85,12 14,05 0,85 100
Massenverhältnis der Plutoniumisotope in den Proben Tesperhude 2 (bei Geesthacht), Kropp 3 (Kontrollort A) und Grabensee (Kontrollort B)
Verhältnis Isotop/gesamt Pu in %
Pu 239 Pu 240 Pu 241 gesamt Pu „GEESTHACHT“ 86,30 13,18 0,530,12 100 „KONTROLLE A“ 86,06 13,33 0,660,18 100 „KONTROLLE B“ 86,00 13,28 0,720,12 100


Which hypotheses are offered to explain the effect other thanradiation?
ChanceViruses, general clustering caused by microepidemiasGreavesKinlenGenetical susceptibilityUnknown factors which are to detect by studying the molecularmechanisms in leukaemia development (German Commission on radiological Protection)Unknown risk factors to be found by further research efforts

Leukaemia in childhood is caused by ionizing radiation via 4 induction chains:
• Somatic – exposure as a child• Prenatal – by exposure of the embryo or fetus in utero• Genetic/preconceptional – by gonadal exposure of mother or father

Dachstaubuntersuchung der Aufsichtsbehörde (Okt. 2000), ausgeführt durch Massenspektrometrie in Universität Mainz Massenverhältnis der Plutoniumisotope in den Proben Tespe 2 (Elbmarsch) und Bergenhusen 1 (Kontrollort)
Verhältnis Isotop/gesamt Pu in %
Pu 239 Pu 240 Pu 241 gesamt Pu „ELBMARSCH“ 85,06 14,11 0,83 100 ,,KONTROLLE“ 85,12 14,05 0,85 100
Massenverhältnis der Plutoniumisotope in den Proben Tesperhude 2 (bei Geesthacht), Kropp 3 (Kontrollort A) und Grabensee (Kontrollort B)
Verhältnis Isotop/gesamt Pu in %
Pu 239 Pu 240 Pu 241 gesamt Pu „GEESTHACHT“ 86,30 13,18 0,530,12 100 „KONTROLLE A“ 86,06 13,33 0,660,18 100 „KONTROLLE B“ 86,00 13,28 0,720,12 100