Embed Size (px)
Citation preview

-4
LEVEL II SCOUR ANALYSIS FORBRIDGE 36 (RICHVT01050036) onSTATE ROUTE 105, crossingSTANHOPE BROOK,RICHFORD, VERMONT
U.S. Geological SurveyOpen-File Report 96-584
Prepared in cooperation with
VERMONT AGENCY OF TRANSPORTATION
and
FEDERAL HIGHWAY ADMINISTRATION
-3
LEVEL II SCOUR ANALYSIS FORBRIDGE 36 (RICHVT01050036) onSTATE ROUTE 105, crossingSTANHOPE BROOK,
RICHFORD, VERMONT
By Erick M. Boehmler and Michael A. Ivanoff
U.S. Geological SurveyOpen-File Report 96-584
Prepared in cooperation with
VERMONT AGENCY OF TRANSPORTATION
and
FEDERAL HIGHWAY ADMINISTRATION
Pembroke, New Hampshire
1996
U.S. DEPARTMENT OF THE INTERIOR
BRUCE BABBITT, Secretary
U.S. GEOLOGICAL SURVEYGordon P. Eaton, Director
For additional information Copies of this report may bewrite to: purchased from:
District Chief U.S. Geological SurveyU.S. Geological Survey Branch of Information Services361 Commerce Way Open-File Reports UnitPembroke, NH 03275-3718 Box 25286
Denver, CO 80225-0286

-1
CONTENTSIntroduction and Summary of Results ............................................................................................................... 1
Level II summary ............................................................................................................................................... 7Description of Bridge ................................................................................................................................... 7Description of the Geomorphic Setting........................................................................................................ 8Description of the Channel........................................................................................................................... 8Hydrology..................................................................................................................................................... 9 Calculated Discharges .......................................................................................................................... 9Description of the Water-Surface Profile Model (WSPRO) Analysis ......................................................... 10 Cross-Sections Used in WSPRO Analysis............................................................................................ 10 Data and Assumptions Used in WSPRO Model ................................................................................... 11Bridge Hydraulics Summary........................................................................................................................ 12Scour Analysis Summary ............................................................................................................................. 13 Special Conditions or Assumptions Made in Scour Analysis............................................................... 13 Scour Results......................................................................................................................................... 14Riprap Sizing................................................................................................................................................ 14
References .......................................................................................................................................................... 18
Appendixes:
A. WSPRO input file.................................................................................................................................... 19
B. WSPRO output file .................................................................................................................................. 21
C. Bed-material particle-size distribution .................................................................................................... 26
D. Historical data form................................................................................................................................. 28
E. Level I data form...................................................................................................................................... 34
F. Scour computations.................................................................................................................................. 44
FIGURES
1. Map showing location of study area on USGS 1:24,000 scale map ............................................................. 3 2. Map showing location of study area on Vermont Agency of Transportation town
highway map ................................................................................................................................... 4 3. Structure RICHVT01050036 viewed from upstream (June 28, 1995) ......................................................... 5 4. Downstream channel viewed from structure RICHVT01050036 (June 28, 1995)....................................... 5 5. Upstream channel viewed from structure RICHVT01050036 (June 28, 1995). .......................................... 6 6. Structure RICHVT01050036 viewed from downstream (June 28, 1995). ................................................... 6 7. Water-surface profiles for the 100- and 500-year discharges at structure
RICHVT01050036 on State Route 105, crossing Stanhope Brook, Richford, Vermont........................................................................................................................... 15
8. Scour elevations for the 100- and 500-year discharges at structure RICHVT01050036 on State Route 105, crossing Stanhope Brook, Richford, Vermont........................................................................................................................... 16
TABLES
1. Remaining footing/pile depth at abutments for the 100-year discharge at structureRICHVT01050036 on State Route 105, crossing Stanhope Brook,Richford, Vermont .............................................................................................................................. 17
2. Remaining footing/pile depth at abutments for the 500-year discharge at structure RICHVT01050036 on State Route 105, crossing Stanhope Brook, Richford, Vermont ............................................................................................................................. 17
iii

0iv
CONVERSION FACTORS, ABBREVIATIONS, AND VERTICAL DATUM
Multiply By To obtain
Length
inch (in.) 25.4 millimeter (mm) foot (ft) 0.3048 meter (m) mile (mi) 1.609 kilometer (km)
Slope
foot per mile (ft/mi) 0.1894 meter per kilometer (m/km)Area
square mile (mi2) 2.590 square kilometer (km2) Volume
cubic foot (ft3) 0.02832 cubic meter (m3)Velocity and Flow
foot per second (ft/s) 0.3048 meter per second (m/s)cubic foot per second (ft3/s) 0.02832 cubic meter per second (m3/s)cubic foot per second per 0.01093 cubic meter per square mile second per square [(ft3/s)/mi2] kilometer [(m3/s)/km2]
OTHER ABBREVIATIONS
BF bank full LWW left wingwallcfs cubic feet per second MC main channelD50 median diameter of bed material RAB right abutmentDS downstream RABUT face of right abutmentelev. elevation RB right bankf/p flood plain ROB right overbankft2 square feet RWW right wingwallft/ft feet per foot TH town highwayJCT junction UB under bridgeLAB left abutment US upstreamLABUT face of left abutment USGS United States Geological SurveyLB left bank VTAOT Vermont Agency of TransportationLOB left overbank WSPRO water-surface profile model
In this report, the words “right” and “left” refer to directions that would be reported by an observer facing downstream.
Sea level: In this report, “sea level” refers to the National Geodetic Vertical Datum of 1929-- a geodetic datum derived from a general adjustment of the first-order level nets of the United States and Canada, formerly called Sea Level Datum of 1929.
In the appendices, the above abbreviations may be combined. For example, USLB would represent upstream left bank.
LEVEL II SCOUR ANALYSIS FOR BRIDGE 36 (RICHVT01050036) ON STATE ROUTE 105,
CROSSING STANHOPE BROOK, RICHFORD, VERMONT
By Erick M. Boehmler and Michael A. Ivanoff
INTRODUCTION AND SUMMARY OF RESULTS
This report provides the results of a detailed Level II analysis of scour potential at structure RICHVT01050036 on State Route 105 crossing Stanhope Brook, Richford, Vermont (figures 1–8). A Level II study is a basic engineering analysis of the site, including a quantitative analysis of stream stability and scour (U.S. Department of Transportation, 1993). Results of a Level I scour investigation also are included in Appendix E of this report. A Level I investigation provides a qualitative geomorphic characterization of the study site. Information on the bridge, gleaned from Vermont Agency of Transportation (VTAOT) files, was compiled prior to conducting Level I and Level II analyses and is found in Appendix D.
The site is in the Green Mountain section of the New England physiographic province in north-central Vermont. The 7.03-mi2 drainage area is in a predominantly rural and forested basin. In the vicinity of the study site, the surface cover is short grass except for the upstream left overbank area which is forested.
In the study area, Stanhope Brook has a steep, sinuous channel with a slope of approximately 0.03 ft/ft, an average channel top width of 47 ft and an average channel depth of 5 ft. The predominant channel bed material is cobble with a median grain size (D50) of 132 mm (0.432 ft). The geomorphic assessment at the time of the Level I and Level II site visit on June 28, 1995, indicated that the reach was laterally unstable.
The State Route 105 crossing of Stanhope Brook is a 42-ft-long, two-lane bridge consisting of one 38-foot concrete T-beam span (Vermont Agency of Transportation, written communication, March 8, 1995). The bridge is supported by vertical, concrete abutments with wingwalls. The channel is skewed approximately 15 degrees to the opening while the opening-skew-to-roadway is 20 degrees.
A scour hole 0.5 ft deeper than the mean thalweg depth was observed along the downstream end of the right abutment wall during the Level I assessment. The scour protection measures at this site were type-2 stone fill (less than 36 inches diameter) along the entire lengths of the upstream wingwalls, at the corner of the downstream left abutment and downstream left
1
wingwall and the downstream end of the downstream right wingwall. Additional details describing conditions at the site are included in the Level II Summary and Appendices D and E.
Scour depths and rock rip-rap sizes were computed using the general guidelines described in Hydraulic Engineering Circular 18 (Richardson and others, 1995). Total scour at a highway crossing is comprised of three components: 1) long-term streambed degradation; 2) contraction scour (due to accelerated flow caused by a reduction in flow area at a bridge) and; 3) local scour (caused by accelerated flow around piers and abutments). Total scour is the sum of the three components. Equations are available to compute depths for contraction and local scour and a summary of the results of these computations follows.
Contraction scour for all modelled flows ranged from 0.0 to 0.3 ft. The worst-case contraction scour occurred at the 500-year discharge. Abutment scour ranged from 6.6 to 9.4 ft. The worst-case abutment scour occurred at the 500-year discharge. Additional information on scour depths and depths to armoring are included in the section titled “Scour Results”. Scoured-streambed elevations, based on the calculated scour depths, are presented in tables 1 and 2. A cross-section of the scour computed at the bridge is presented in figure 8. Scour depths were calculated assuming an infinite depth of erosive material and a homogeneous particle-size distribution.
It is generally accepted that the Froehlich equation (abutment scour) gives “excessively conservative estimates of scour depths” (Richardson and others, 1995, p. 47). Usually, computed scour depths are evaluated in combination with other information including (but not limited to) historical performance during flood events, the geomorphic stability assessment, existing scour protection measures, and the results of the hydraulic analyses. Therefore, scour depths adopted by VTAOT may differ from the computed values documented herein.
2
3
Figure 1. Location of study area on USGS 1:24,000 scale map.
Plymouth, VT. Quadrangle, 1:24,000, 1966
Photoinspected 1983
NORTH

4
Figure 2. Location of study area on Vermont Agency of Transportation town highway map.

Figure 3. Structure RICHVT01050036 viewed from upstream (June 28, 1995).
Figure 4. Downstream channel viewed from structure RICHVT01050036 (June 28, 1995).
5

Figure 5. Upstream channel viewed from structure RICHVT01050036 (June 28, 1995).
Figure 6. Structure RICHVT01050036 viewed from downstream (June 28, 1995).
6

LEVEL II SUMMARY
Structure Number Stream
County
Bridge length
Alignment of bri
Abutment type
Stone fill on abut
Is bridge skewed
Debris accumul
Level I
Potential fo
RICHVT01050036
7
Road
Description of Bridge
ft Bridge width
ght)
Embankme
ment?
to flood flow according t rvey?
ation on bridge at time of Level I or Level
D Percent blocked
r debris
Stanhope Brook
District
Franklin VT 105nt type
Angle
II site visit:
Percent blocked
8
42
39.9 38 ft Max span length ftCurve
dge to road (on curve or straiVertical, concrete
Sloping
No
6/28/95
Date of inspectionType-2 on the entire length of the upstream wingwalls, at the corner of
Description of stone fillthe downstream end of the left abutment and the downstream left wingwall, and at the downstreamend of the downstream right wingwall.
Abutments and wingwalls are concrete. There is a one
Brief description of piers/abutments half foot deep scour hole along the downstream end of the right abutment.
Y
15o Level I suY
Is bridge located on a bend in channel? If so, describe (mild, moderate, severe) There is a mild channel bend through the bridge. A scour hole has developed in the location where
the bend impacts the downstream end of the right abutment.
ate of inspection 6/28/95
of channel horizontally 0
of channel vertically
0
6/28/95
0 0High. There was a landslide noted on the left bank upstream, which
Level IIis likely to contribute debris during flood events.
Field notes taken on 6/28/95.indicate there is a pile of boulders at the upstream end of
Describe any features near or at the bridge that may affect flow (include observation date).the right abutment, which may contribute to eddy development immediately
downstream of the pile where the remnant scour is evident.

Description of the Geomorphic Setting
General topography
Geomorphic conditio
Date of insp
DS left:
DS right:
US left:
US right:
Average top width
Predominant bed ma
Vegetative c
DS left:
DS right:
US left:
US right:
The channel is located in a moderate relief valley setting with flat to
slightly irregular flood plains and steep valley walls on both sides.
wnstream (DS), upstream (US)
ns at bridge site: do6/28/95
ectionSteep channel bank to a narrow flood plain and VT 105 road embankment.
Steep channel bank to flood plain and VT 105 road embankment.
Moderately sloping channel bank to valley wall.
Moderately sloping channel bank to flood plain.
Description of the Channel
teri
47
Average depthal Bank material
8
5
ftCobbles
ftCobbles
Perennial and sinuous
Stream type (straight, meandering, braided, swampy, channelized) with semi-alluvial channel boundaries.
6/28/95
over on channel banks near bridge: Date of inspection Trees with pasture on the flood plain.
Trees with a grass lawn and a house on the flood plain.
Brush and trees.
A few trees with a lawn and a house on the flood plain.
N
? If not, describe location and type of instability and On 6/28/95 there was a landslide feature noted on the upstream left
Do banks appear stabledate of observation. bank.
The assessment of
Describe any obstructions in channel and date of observation. 6/28/95 noted flow is influenced by a pile of boulders at the upstream end of the right abutment.

Hydrology
Drainage area i2
Percentage of dra
Is drainage a
Is there a USGS
Is there a lake/
Q
m7.03
inage area in physiographic provinces: (approximate)
Perc age area
Physiographic province/section New England / Green Mountaingage on the stream of interest
USGS gage description
USGS gage number
Gage drainage area mi2
Calculated Discharges
100 ft3/s
9
ent of drain100
Rural
rea considered rural or urban? Describe any significant-
urbanization:
No
?--
--
--No
pond that will significantly affect hydrology/hydraulics?-
If so, describe
1,950
2,620Q500 ft3/sThe 100- and 500-year discharges are based on
Method used to determine discharges discharge frequency curves computed by use of several empirical equations (Benson, 1962;
FHWA, 1983; Johnson and Laraway, unpublished draft, 1972; Johnson and Tasker, 1974; Potter,
1957; Talbot, 1887) and those published in the flood insurance study for the town of Richford at
the mouth of Stanhope Brook (FEMA, 1980). Due to the central tendency of the curve from the
flood insurance study values to the others, the 100- and 500-year discharges from the flood
insurance study were selected for this analysis.
Description of the Water-Surface Profile Model (WSPRO) Analysis
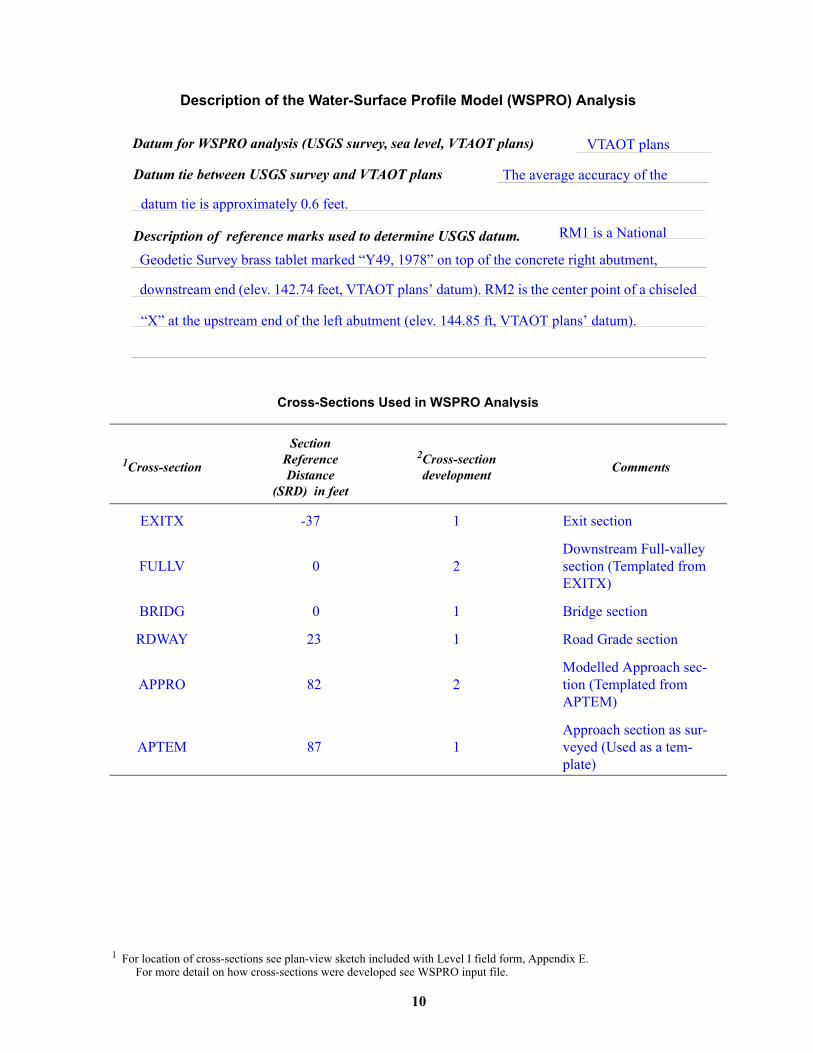
Datum for WSPRO analysis (USGS survey, sea level, VTAOT plans)
Datum tie between USGS survey and VTAOT plans
Cross-Sections Used in WSPRO Analysis
1 For location of cross-sections see plan-view sketch included with Level I field form, Appendix For more detail on how cross-sections were developed see WSPRO input file.
10
1Cross-section
Section Reference Distance
(SRD) in feet
2Cross-section development
EXITX -37 1 Ex
FULLV 0 2DoseEX
BRIDG 0 1 Br
RDWAY 23 1 Ro
APPRO 82 2MtioAP
APTEM 87 1Apvepla
VTAOT plans
The average accuracy of the
datum tie is approximately 0.6 feet.
RM1 is a National
Description of reference marks used to determine USGS datum.Geodetic Survey brass tablet marked “Y49, 1978” on top of the concrete right abutment,
downstream end (elev. 142.74 feet, VTAOT plans’ datum). RM2 is the center point of a chiseled
“X” at the upstream end of the left abutment (elev. 144.85 ft, VTAOT plans’ datum).
E.
Comments
it section
wnstream Full-valley ction (Templated from ITX)
idge section
ad Grade section
odelled Approach sec-n (Templated from TEM)
proach section as sur-yed (Used as a tem-te)

Data and Assumptions Used in WSPRO Model
11
Hydraulic analyses of the reach were done by use of the Federal Highway
Administration’s WSPRO step-backwater computer program (Shearman and others, 1986, and
Shearman, 1990). The analyses reported herein reflect conditions existing at the site at the time
of the study. Furthermore, in the development of the model it was necessary to assume no
accumulation of debris or ice at the site. Results of the hydraulic model are presented in the
Bridge Hydraulic Summary, Appendix B, and figure 7.
Channel roughness factors (Manning’s “n”) used in the hydraulic model were estimated
using field inspections at each cross section following the general guidelines described by
Arcement and Schneider (1989). Final adjustments to the values were made during the
modelling of the reach. Channel “n” values for the reach ranged from 0.050 to 0.055, and
overbank “n” values ranged from 0.035 to 0.070.
The slope-conveyance method, outlined in the user’s manual for WSPRO (Shearman,
1990), was used to compute a starting water surface. The slope used was 0.033 ft/ft, which was
estimated from the 100-year discharge water surface downstream of this site graphically
displayed in the Flood Insurance Study for the town of Richford (FEMA, 1980, exhibit 1, panel
13p). However, for the 100- and 500-year discharges, WSPRO assumes critical depth at the exit
section for the starting water surface. Analysis of the supercritical and subcritical profiles for the
exit section at each discharge indicates that the slope used is a supercritical slope. Since the
supercritical solution was close to critical depth, the starting water surface at critical depth was
assumed to be a satisfactory solution.
The surveyed approach section (APTEM) was moved along the approach channel slope
(0.0397 ft/ft) to establish the modelled approach section (APPRO), one bridge length upstream
of the upstream face as recommended by Shearman and others (1986). This method also
provides a consistent approach for determining scour variables.

Bridge Hydraulics Summary
Average bridge embankment eleva ftAverage low steel elevation
100-year discharge Water-surface elevati
Road overtopping? _
Area of flow in bridge openAverage velocity in bridge oMaximum WSPRO tube vel Water-surface elevation at AWater-surface elevation at AAmount of backwater cause
500-year discharge Water-surface elevatio
Road overtopping? __
Area of flow in bridge openAverage velocity in bridge oMaximum WSPRO tube vel Water-surface elevation at AWater-surface elevation at AAmount of backwater cause
Incipient overtopping dischWater-surface elevation in b
Area of flow in bridge openAverage velocity in bridge oMaximum WSPRO tube vel Water-surface elevation at AWater-surface elevation at AAmount of backwater cause
144.8
ft
tion139.9
ft3/s
1,95012
ening
ing pening ocity at bridge
pproach section wipproach section wd by bridge
ft3/s ening
ing pening ocity at bridge pproach section wipproach section
d by bridge
arge ridge opening
ing pening ocity at bridge pproach section wipproach sectio
d by bridge
ft135.7
r road __ s
on in bridge op
_______ DNo
2
th bridge
r road __2
th bridge
3
th bridge d
______ ft3/--
ischarge oveft187
10.4
ft/s ft/s13.5ge
e
/s
ge
ft137.5
ft137.4
ithout brid ft0.12,620
ft136.0
n in bridge op______ DNo
______ ft3/s-- ischarge ovef199
t ft13.2 /sft/s16.9
ft139.7
ft138.4
without bridg ft1.3f--
t /s ft--f--
t2f--
t/s ft--ft--
ft--
n without bri ft--
Scour Analysis Summary
Special Conditions or Assumptions Made in Scour Analysis
13
Scour depths were computed using the general guidelines described in Hydraulic
Engineering Circular 18 (Richardson and others, 1995). Scour depths were calculated
assuming an infinite depth of erosive material and a homogeneous particle-size distribution.
The results of the scour analysis are presented in tables 1 and 2 and a graph of the scour
depths is presented in figure 8.
Contraction scour was computed by use of the clear-water contraction scour equation
(Richardson and others, 1995, p. 32, equation 20). Laursen’s live-bed scour equation
(Richardson and others, 1995, p. 30, equation 17) was also computed for the 100-year
modelled discharge and can be found in appendix F. For contraction scour computations,
the average depth in the contracted section (AREA/TOPWIDTH) is subtracted from the
depth of flow computed by the scour equation (Y2) to determine the actual amount of scour.
Abutment scour was computed by use of the Froehlich equation (Richardson and
others, 1995, p. 48, equation 28). Variables for the Froehlich equation include the Froude
number of the flow approaching the embankments, the length of the embankment blocking
flow, and the depth of flow approaching the embankment less any roadway overtopping.
Scour Results
Incipient overtopping
Contraction scour: 100-yr discharge 500-yr discharge discharge
(Scour depths in feet)
Main channel
Live-bed scour
Clear-water scour
Depth to armoring
Left overbank
Right overbank
Local scour:
Abutment scour
Left abutment
Right abutment
Pier scour
Pier 1
Pier 2
Pier 3
Abutments:
Left abutment
Right abutment
Piers:
Pier 1
Pier 2
______0.0
14
______
______
______
Riprap Sizing
100-yr discharge
_
______
______--
______
______
______
500-yr discharg
et)
______
______
______--
______ 0.0
______ 0.3
______--
4.8
26.3 -- ______--
______--
______--
______--
______--
______--
______6.6
8.8o
e
--
______ 6.7
______ 9.4 ______--______
--
-- --______--
______-- ______--______--
______-- ______--______
Incipient vertopping
discharge
2.0
(D50 in fe2.3
--______ 2.0
2.3______--
______ --
______ --
______--
--
-- -- _____--
______--
______--
______
15
Figure 7. Water-surface profiles for the 100- and 500-yr discharges at structure RICHVT01050036 on State Route 105, crossing Stanhope Brook, Richford, Vermont.
ELE
VA
TIO
N A
BO
VE
AR
BIT
RA
RY
DA
TU
M,
IN F
EE
T
CHANNEL DISTANCE FROM DOWNSTREAM TO UPSTREAM, IN FEET
-40 90-40 -30 -20 -10 0 10 20 30 40 50 60 70 80120
150
120
122
124
126
128
130
132
134
136
138
140
142
144
146
148
APPROACH SECTION (APPRO)EXIT SECTION (EXITX) BRIDGE SECTION (BRIDG)
100-YR WATER SURFACE PROFILE500-YR WATER SURFACE PROFILE
BRIDGE DECK
MINIMUM BED ELEVATION

16
Figure 8. Scour elevations for the 100-yr and 500-yr discharges at structure RICHVT01050036 on State Route 105, crossing Stanhope Brook, Richford, Vermont.
0 5 10 15 20 25 30 35 40118
146
118
120
122
124
126
128
130
132
134
136
138
140
142
144
ELE
VA
TIO
N A
BO
VE
AR
BIT
RA
RY
DA
TU
M, I
N F
EE
T
STATIONING FROM LEFT TO RIGHT ALONG BRIDGE SECTION, IN FEET
AN
GLE
OF
RE
PO
SE
EX
AG
GE
RA
TED
100-YEAR WATER SURFACE
500-YEAR WATER SURFACE
LOW STEEL
TOP OF DECK
100-YR TOTAL SCOUR DEPTHS
500-YR TOTAL SCOUR DEPTHS

17
Table 1. Remaining footing/pile depth at abutments for the 100-year discharge at structure RICHVT01050036 on State Route 105, crossing Stanhope Brook, Richford, Vermont.[VTAOT, Vermont Agency of Transportation; --,no data]
Description Station1
1.Measured along the face of the most constricting side of the bridge.
VTAOT Bridge seat
elevation (feet)
Surveyed minimum low-chord elevation2
(feet)
2.Arbitrary datum for this study.
Bottom of footing
elevation2
(feet)
Channel elevation at abutment/
pier2
(feet)
Contraction scour depth
(feet)
Abutment scour depth (feet)
Pier scour depth (feet)
Depth of total scour
(feet)
Elevation of scour2
(feet)
Remaining footing/pile
depth(feet)
100-yr. discharge is 1,950 cubic-feet per second
Left abutment 0.0 140.8 139.8 128 133.7 0.0 6.6 -- 6.6 127.1 -1
Right abutment 38.9 140.6 140.0 128 128.4 0.0 6.7 -- 6.7 121.7 -6
Table 2. Remaining footing/pile depth at abutments for the 500-year discharge at structure RICHVT01050036 on State Route 105, crossing Stanhope Brook, Richford, Vermont.[VTAOT, Vermont Agency of Transportation; --, no data]
Description Station1
1.Measured along the face of the most constricting side of the bridge.
VTAOT Bridge seat
elevation (feet)
Surveyed minimum low-chord elevation2
(feet)
2.Arbitrary datum for this study.
Bottom of footing
elevation2
(feet)
Channel elevation at abutment/
pier2
(feet)
Contraction scour depth
(feet)
Abutment scour depth (feet)
Pier scour depth (feet)
Depth of total scour
(feet)
Elevation of scour2
(feet)
Remaining footing/pile
depth(feet)
500-yr. discharge is 2,620 cubic-feet per second
Left abutment 0.0 140.8 139.8 128 133.7 0.3 8.8 -- 9.1 124.6 -3
Right abutment 38.9 140.6 140.0 128 128.4 0.3 9.4 -- 9.7 118.7 -9

18
SELECTED REFERENCES
Arcement, G.J., Jr., and Schneider, V.R., 1989, Guide for selecting Manning’s roughness coefficients for natural channels and flood plains: U.S. Geological Survey Water-Supply Paper 2339, 38 p.
Barnes, H.H., Jr., 1967, Roughness characteristics of natural channels: U.S. Geological Survey Water-Supply Paper 1849, 213 p.
Benson, M. A., 1962, Factors Influencing the Occurrence of Floods in a Humid Region of Diverse Terrain: U.S. Geological Survey Water-Supply Paper 1580-B, 64 p.
Brown, S.A. and Clyde, E.S., 1989, Design of riprap revetment: Federal Highway Administration Hydraulic Engineering Circular No. 11, Publication FHWA-IP-89-016, 156 p.
Federal Highway Administration, 1983, Runoff estimates for small watersheds and development of sound design: Federal Highway Administration Report FHWA-RD-77-158
Federal Emergency Management Agency, 1980, Flood Insurance Study, Town of Richford, Franklin County, Vermont: Washington, D.C.,April 1980.
Froehlich, D.C., 1989, Local scour at bridge abutments in Ports, M.A., ed., Hydraulic Engineering--Proceedings of the 1989 National Conference on Hydraulic Engineering: New York, American Society of Civil Engineers, p. 13-18.
Hayes, D.C.,1993, Site selection and collection of bridge-scour data in Delaware, Maryland, and Virginia: U.S. Geological Survey Water-Resources Investigation Report 93-4017, 23 p.
Interagency Advisory Committee on Water Data, 1982, Guidelines for determining flood flow frequency: U.S. Geological Survey, Bulletin 17B of the Hydrology Subcommittee, 190 p.
Johnson, C.G. and Tasker, G.D.,1974, Progress report on flood magnitude and frequency of Vermont streams: U.S. Geological Survey Open-File Report 74-130, 37 p.
Lagasse, P.F., Schall, J.D., Johnson, F., Richardson, E.V., Chang, F., 1995, Stream Stability at Highway Structures: Federal Highway Administration Hydraulic Engineering Circular No. 20, Publication FHWA-IP-90-014, 144 p.
Laursen, E.M., 1960, Scour at bridge crossings: Journal of the Hydraulics Division, American Society of Civil Engineers, v. 86, no. HY2, p. 39-53.
Potter, W. D., 1957, Peak rates of runoff in the New England Hill and Lowland area, Bureau of Public Roads.
Richardson, E.V. and Davis, S.R., 1995, Evaluating scour at bridges: Federal Highway Administration Hydraulic Engineering Circular No. 18, Publication FHWA-IP-90-017, 204 p.
Richardson, E.V., Simons, D.B., and Julien, P.Y., 1990, Highways in the river environment: Federal Highway Administration Publication FHWA-HI-90-016.
Ritter, D.F., 1984, Process Geomorphology: W.C. Brown Co., Debuque, Iowa, 603 p.
Shearman, J.O., 1990, User’s manual for WSPRO--a computer model for water surface profile computations: Federal Highway Administration Publication FHWA-IP-89-027, 187 p.
Shearman, J.O., Kirby, W.H., Schneider, V.R., and Flippo, H.N., 1986, Bridge waterways analysis model; research report: Federal Highway Administration Publication FHWA-RD-86-108, 112 p.
Talbot, A.N., 1887, The determination of water-way for bridges and culverts.
U.S. Department of Transportation, 1993, Stream stability and scour at highway bridges, Participant Workbook: Federal Highway Administration Publication FHWA HI-91-011.
U.S. Geological Survey, 1986, Jay Peak, Vermont 7.5 Minute Series quadrangle map: U.S. Geological Survey Topographic Maps, Aerial photography, 1980; Contour interval, 6 meters; Scale 1:24,000.

19
APPENDIX A:
WSPRO INPUT FILE

20
T1 U.S. Geological Survey WSPRO Input File rich036.wsp T2 Hydraulic analysis for structure RICHVT01050036 Date: 11-SEP-96 T3 State Route 105 Crossing Stanhope Brook, Richford, VT EMB*J3 6 29 30 552 553 551 5 16 17 13 3 * 15 14 23 21 11 12 4 7 3*Q 1950.0 2620.0SK 0.0330 0.0330*XS EXITX -33GR -76.8, 140.95 -56.6, 136.99 -22.8, 136.56 -11.9, 138.24GR -8.2, 134.31 0.0, 128.54 10.1, 128.43 17.1, 128.86GR 23.0, 130.23 36.0, 136.72 47.9, 136.24 64.6, 137.33GR 81.9, 141.78*N 0.045 0.055 0.035SA -11.9 36.0*XS FULLV 0 * * * 0.0164** SRD LSEL XSSKEWBR BRIDG 0 139.91 20.0GR 0.0, 139.83 0.3, 133.69 6.6, 132.83 25.0, 129.24GR 32.9, 128.26 37.5, 128.38 37.6, 129.26 37.6, 130.50GR 38.9, 130.53 39.6, 140.00 0.0, 139.83** BRTYPE BRWDTH WWANGL WWWIDCD 1 54.2 * * 51 7.0N 0.050** SRD EMBWID IPAVEXR RDWAY 23 39.9 1GR -61.6, 144.31 -1.7, 144.80 -1.5, 145.75 0.0, 145.77GR 39.9, 145.69 40.2, 145.63 40.2, 144.77 239.5, 144.88GR 325.8, 145.99*XT APTEM 87GR -44.3, 145.36 -23.0, 144.17 -13.2, 142.84 -4.4, 137.03GR 8.0, 133.56 9.3, 132.26 17.1, 131.73 24.9, 132.08GR 31.3, 133.08 47.5, 138.56 110.3, 141.84 221.8, 143.37*AS APPRO 82 * * * 0.0398GTN 0.070 0.055 0.035SA -4.4 47.5BP 0.0*HP 1 BRIDG 135.71 1 135.71HP 2 BRIDG 135.71 * * 1950HP 1 APPRO 137.49 1 137.49HP 2 APPRO 137.49 * * 1950*HP 1 BRIDG 136.03 1 136.03HP 2 BRIDG 136.03 * * 2620HP 1 APPRO 139.65 1 139.65HP 2 APPRO 139.65 * * 2620*
WSPRO INPUT FILE

21
APPENDIX B:
WSPRO OUTPUT FILE
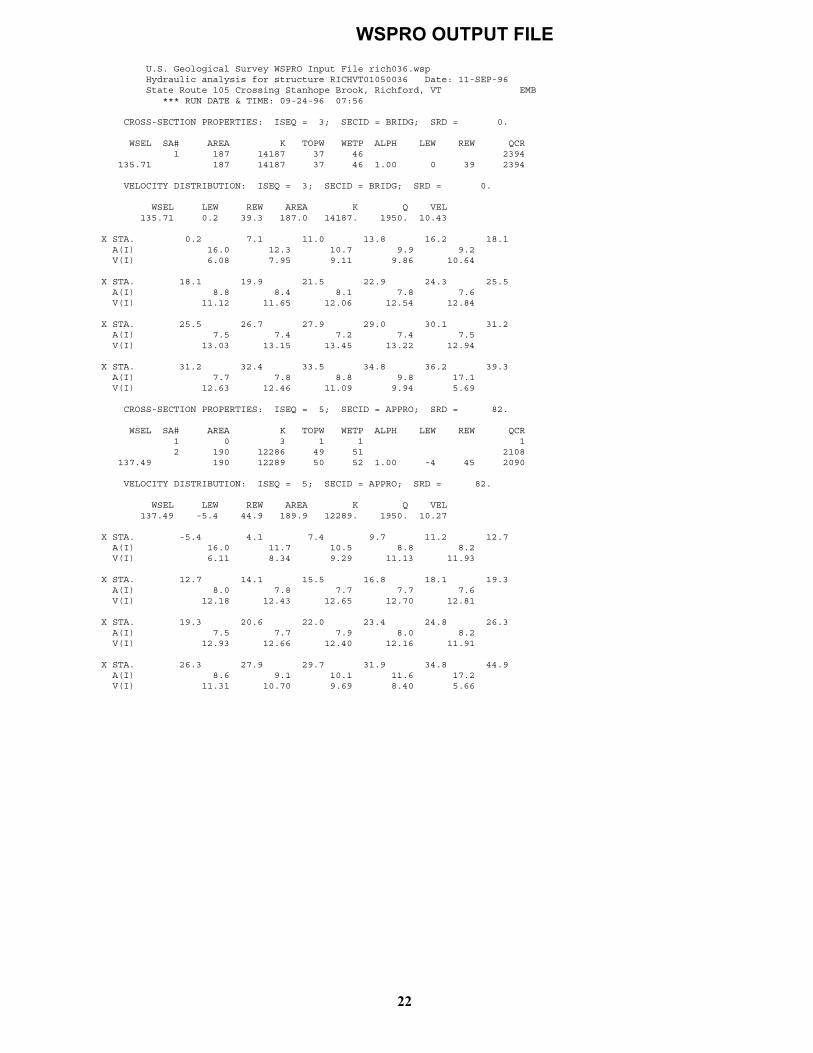
WSPRO OUTPUT FILE
U.S. Geological Survey WSPRO Input File rich036.wsp Hydraulic analysis for structure RICHVT01050036 Date: 11-SEP-96 State Route 105 Crossing Stanhope Brook, Richford, VT EMB *** RUN DATE & TIME: 09-24-96 07:56
CROSS-SECTION PROPERTIES: ISEQ = 3; SECID = BRIDG; SRD = 0.
WSEL SA# AREA K TOPW WETP ALPH LEW REW QCR 1 187 14187 37 46 2394 135.71 187 14187 37 46 1.00 0 39 2394
VELOCITY DISTRIBUTION: ISEQ = 3; SECID = BRIDG; SRD = 0.
WSEL LEW REW AREA K Q VEL 135.71 0.2 39.3 187.0 14187. 1950. 10.43
X STA. 0.2 7.1 11.0 13.8 16.2 18.1 A(I) 16.0 12.3 10.7 9.9 9.2 V(I) 6.08 7.95 9.11 9.86 10.64
X STA. 18.1 19.9 21.5 22.9 24.3 25.5 A(I) 8.8 8.4 8.1 7.8 7.6 V(I) 11.12 11.65 12.06 12.54 12.84
X STA. 25.5 26.7 27.9 29.0 30.1 31.2 A(I) 7.5 7.4 7.2 7.4 7.5 V(I) 13.03 13.15 13.45 13.22 12.94
X STA. 31.2 32.4 33.5 34.8 36.2 39.3 A(I) 7.7 7.8 8.8 9.8 17.1 V(I) 12.63 12.46 11.09 9.94 5.69
CROSS-SECTION PROPERTIES: ISEQ = 5; SECID = APPRO; SRD = 82.
WSEL SA# AREA K TOPW WETP ALPH LEW REW QCR 1 0 3 1 1 1 2 190 12286 49 51 2108 137.49 190 12289 50 52 1.00 -4 45 2090
VELOCITY DISTRIBUTION: ISEQ = 5; SECID = APPRO; SRD = 82.
WSEL LEW REW AREA K Q VEL 137.49 -5.4 44.9 189.9 12289. 1950. 10.27
X STA. -5.4 4.1 7.4 9.7 11.2 12.7 A(I) 16.0 11.7 10.5 8.8 8.2 V(I) 6.11 8.34 9.29 11.13 11.93
X STA. 12.7 14.1 15.5 16.8 18.1 19.3 A(I) 8.0 7.8 7.7 7.7 7.6 V(I) 12.18 12.43 12.65 12.70 12.81
X STA. 19.3 20.6 22.0 23.4 24.8 26.3 A(I) 7.5 7.7 7.9 8.0 8.2 V(I) 12.93 12.66 12.40 12.16 11.91
X STA. 26.3 27.9 29.7 31.9 34.8 44.9 A(I) 8.6 9.1 10.1 11.6 17.2 V(I) 11.31 10.70 9.69 8.40 5.66
22

WSPRO OUTPUT FILE (continued)
U.S. Geological Survey WSPRO Input File rich036.wsp Hydraulic analysis for structure RICHVT01050036 Date: 11-SEP-96 State Route 105 Crossing Stanhope Brook, Richford, VT EMB *** RUN DATE & TIME: 09-24-96 07:56
CROSS-SECTION PROPERTIES: ISEQ = 3; SECID = BRIDG; SRD = 0.
WSEL SA# AREA K TOPW WETP ALPH LEW REW QCR 1 199 15561 37 47 2622 136.03 199 15561 37 47 1.00 0 39 2622
VELOCITY DISTRIBUTION: ISEQ = 3; SECID = BRIDG; SRD = 0.
WSEL LEW REW AREA K Q VEL 136.03 0.2 39.3 198.7 15561. 2620. 13.18
X STA. 0.2 6.8 10.6 13.3 15.7 17.7 A(I) 17.2 12.7 10.9 10.6 9.8 V(I) 7.60 10.35 11.97 12.41 13.42
X STA. 17.7 19.5 21.1 22.6 23.9 25.2 A(I) 9.2 8.9 8.6 8.3 8.1 V(I) 14.29 14.68 15.20 15.82 16.20
X STA. 25.2 26.4 27.6 28.8 29.9 31.1 A(I) 8.0 7.9 7.7 7.9 8.0 V(I) 16.39 16.55 16.93 16.64 16.29
X STA. 31.1 32.2 33.4 34.7 36.1 39.3 A(I) 8.2 8.4 9.4 10.5 18.5 V(I) 15.91 15.69 13.93 12.49 7.10
CROSS-SECTION PROPERTIES: ISEQ = 5; SECID = APPRO; SRD = 82.
WSEL SA# AREA K TOPW WETP ALPH LEW REW QCR 1 6 143 4 5 41 2 301 25590 52 54 4103 3 16 505 25 25 72 139.65 322 26238 81 84 1.07 -8 72 3530
VELOCITY DISTRIBUTION: ISEQ = 5; SECID = APPRO; SRD = 82.
WSEL LEW REW AREA K Q VEL 139.65 -8.7 72.2 322.4 26238. 2620. 8.13
X STA. -8.7 1.0 4.7 7.5 9.8 11.5 A(I) 25.1 18.0 16.2 15.8 13.6 V(I) 5.21 7.27 8.11 8.31 9.60
X STA. 11.5 13.3 14.9 16.5 18.1 19.7 A(I) 13.3 13.1 12.8 12.8 12.7 V(I) 9.82 10.03 10.23 10.26 10.33
X STA. 19.7 21.3 22.9 24.6 26.4 28.3 A(I) 13.0 12.8 13.3 13.8 14.0 V(I) 10.11 10.20 9.83 9.52 9.38
X STA. 28.3 30.4 32.7 35.8 40.4 72.2 A(I) 14.8 15.6 17.8 20.2 33.7 V(I) 8.83 8.38 7.34 6.47 3.89
23

WSPRO OUTPUT FILE (continued)
+++ BEGINNING PROFILE CALCULATIONS -- 2 U.S. Geological Survey WSPRO Input File rich036.wsp Hydraulic analysis for structure RICHVT01050036 Date: 11-SEP-96 State Route 105 Crossing Stanhope Brook, Richford, VT EMB *** RUN DATE & TIME: 09-24-96 07:56
===015 WSI IN WRONG FLOW REGIME AT SECID “EXITX”: USED WSI = CRWS. WSI,CRWS = 134.16 134.32
XSID:CODE SRDL LEW AREA VHD HF EGL CRWS Q WSEL SRD FLEN REW K ALPH HO ERR FR# VEL
EXITX:XS ****** -7 167 2.12 ***** 136.43 134.32 1950 134.32 -32 ****** 31 11315 1.00 ***** ******* 1.00 11.66
FULLV:FV 33 -8 203 1.44 0.75 137.17 ******* 1950 135.73 0 33 33 14853 1.00 0.00 -0.01 0.77 9.63 <<<<<THE ABOVE RESULTS REFLECT “NORMAL” (UNCONSTRICTED) FLOW>>>>>
===125 FR# EXCEEDS FNTEST AT SECID “APPRO”: TRIALS CONTINUED. FNTEST,FR#,WSEL,CRWS = 0.80 0.98 137.37 137.28
===110 WSEL NOT FOUND AT SECID “APPRO”: REDUCED DELTAY. WSLIM1,WSLIM2,DELTAY = 135.23 145.16 0.50
===115 WSEL NOT FOUND AT SECID “APPRO”: USED WSMIN = CRWS. WSLIM1,WSLIM2,CRWS = 135.23 145.16 137.28
APPRO:AS 82 -4 184 1.75 1.79 139.12 137.28 1950 137.37 82 82 45 11705 1.00 0.16 0.00 0.97 10.61 <<<<<THE ABOVE RESULTS REFLECT “NORMAL” (UNCONSTRICTED) FLOW>>>>>
<<<<<RESULTS REFLECTING THE CONSTRICTED FLOW FOLLOW>>>>>
XSID:CODE SRDL LEW AREA VHD HF EGL CRWS Q WSEL SRD FLEN REW K ALPH HO ERR FR# VEL
BRIDG:BR 33 0 187 1.69 0.94 137.40 135.06 1950 135.71 0 33 39 14200 1.00 0.02 -0.01 0.81 10.42
TYPE PPCD FLOW C P/A LSEL BLEN XLAB XRAB 1. **** 1. 1.000 ****** 139.91 ****** ****** ******
XSID:CODE SRD FLEN HF VHD EGL ERR Q WSEL RDWAY:RG 23. <<<<<EMBANKMENT IS NOT OVERTOPPED>>>>>
XSID:CODE SRDL LEW AREA VHD HF EGL CRWS Q WSEL SRD FLEN REW K ALPH HO ERR FR# VEL
APPRO:AS 28 -4 190 1.64 0.74 139.14 137.28 1950 137.49 82 28 45 12292 1.00 1.01 0.02 0.93 10.27
M(G) M(K) KQ XLKQ XRKQ OTEL 0.215 0.034 11801. -6. 33. 136.42
<<<<<END OF BRIDGE COMPUTATIONS>>>>>
FIRST USER DEFINED TABLE.
XSID:CODE SRD LEW REW Q K AREA VEL WSEL EXITX:XS -33. -8. 31. 1950. 11315. 167. 11.66 134.32 FULLV:FV 0. -9. 33. 1950. 14853. 203. 9.63 135.73 BRIDG:BR 0. 0. 39. 1950. 14200. 187. 10.42 135.71 RDWAY:RG 23.************** 0.****************** 1.00******** APPRO:AS 82. -5. 45. 1950. 12292. 190. 10.27 137.49
XSID:CODE XLKQ XRKQ KQ APPRO:AS -6. 33. 11801.
SECOND USER DEFINED TABLE.
XSID:CODE CRWS FR# YMIN YMAX HF HO VHD EGL WSEL EXITX:XS 134.32 1.00 128.43 141.78************ 2.12 136.43 134.32 FULLV:FV ******** 0.77 128.97 142.32 0.75 0.00 1.44 137.17 135.73 BRIDG:BR 135.06 0.81 128.26 140.00 0.94 0.02 1.69 137.40 135.71 RDWAY:RG **************** 144.31 145.99********************************** APPRO:AS 137.28 0.93 131.53 145.16 0.74 1.01 1.64 139.14 137.49
24
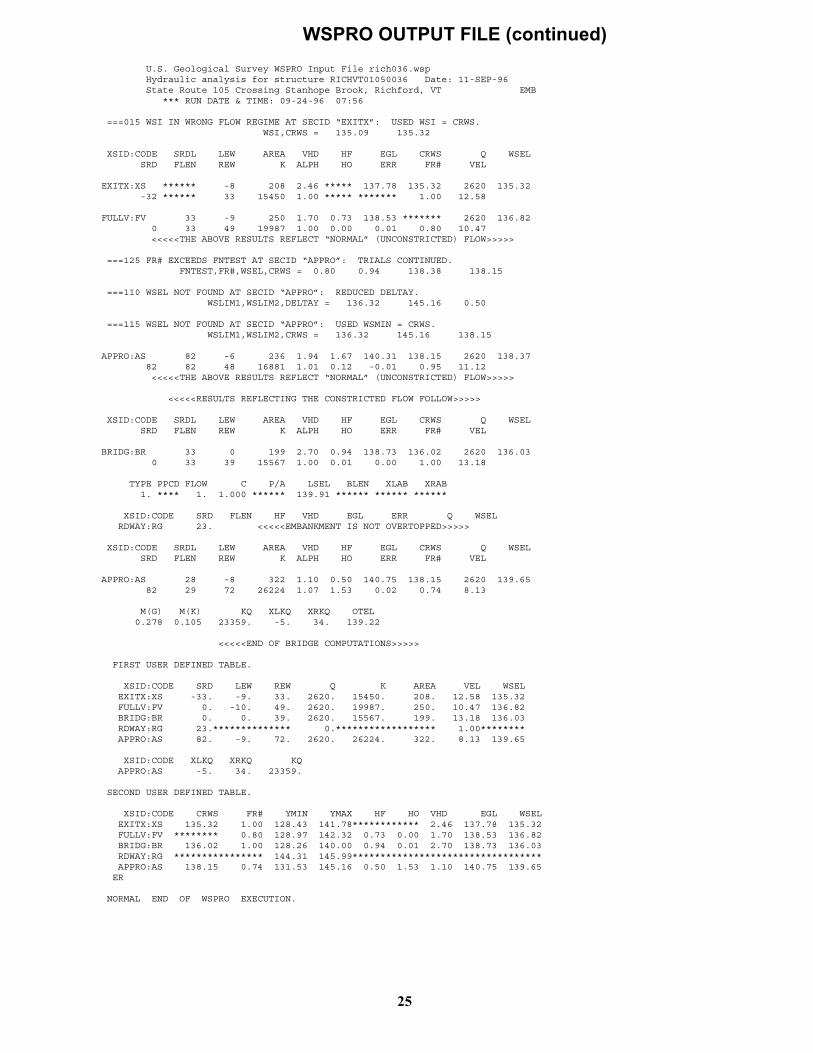
WSPRO OUTPUT FILE (continued)
U.S. Geological Survey WSPRO Input File rich036.wsp Hydraulic analysis for structure RICHVT01050036 Date: 11-SEP-96 State Route 105 Crossing Stanhope Brook, Richford, VT EMB *** RUN DATE & TIME: 09-24-96 07:56
===015 WSI IN WRONG FLOW REGIME AT SECID “EXITX”: USED WSI = CRWS. WSI,CRWS = 135.09 135.32
XSID:CODE SRDL LEW AREA VHD HF EGL CRWS Q WSEL SRD FLEN REW K ALPH HO ERR FR# VEL
EXITX:XS ****** -8 208 2.46 ***** 137.78 135.32 2620 135.32 -32 ****** 33 15450 1.00 ***** ******* 1.00 12.58
FULLV:FV 33 -9 250 1.70 0.73 138.53 ******* 2620 136.82 0 33 49 19987 1.00 0.00 0.01 0.80 10.47 <<<<<THE ABOVE RESULTS REFLECT “NORMAL” (UNCONSTRICTED) FLOW>>>>>
===125 FR# EXCEEDS FNTEST AT SECID “APPRO”: TRIALS CONTINUED. FNTEST,FR#,WSEL,CRWS = 0.80 0.94 138.38 138.15
===110 WSEL NOT FOUND AT SECID “APPRO”: REDUCED DELTAY. WSLIM1,WSLIM2,DELTAY = 136.32 145.16 0.50
===115 WSEL NOT FOUND AT SECID “APPRO”: USED WSMIN = CRWS. WSLIM1,WSLIM2,CRWS = 136.32 145.16 138.15
APPRO:AS 82 -6 236 1.94 1.67 140.31 138.15 2620 138.37 82 82 48 16881 1.01 0.12 -0.01 0.95 11.12 <<<<<THE ABOVE RESULTS REFLECT “NORMAL” (UNCONSTRICTED) FLOW>>>>>
<<<<<RESULTS REFLECTING THE CONSTRICTED FLOW FOLLOW>>>>>
XSID:CODE SRDL LEW AREA VHD HF EGL CRWS Q WSEL SRD FLEN REW K ALPH HO ERR FR# VEL
BRIDG:BR 33 0 199 2.70 0.94 138.73 136.02 2620 136.03 0 33 39 15567 1.00 0.01 0.00 1.00 13.18
TYPE PPCD FLOW C P/A LSEL BLEN XLAB XRAB 1. **** 1. 1.000 ****** 139.91 ****** ****** ******
XSID:CODE SRD FLEN HF VHD EGL ERR Q WSEL RDWAY:RG 23. <<<<<EMBANKMENT IS NOT OVERTOPPED>>>>>
XSID:CODE SRDL LEW AREA VHD HF EGL CRWS Q WSEL SRD FLEN REW K ALPH HO ERR FR# VEL
APPRO:AS 28 -8 322 1.10 0.50 140.75 138.15 2620 139.65 82 29 72 26224 1.07 1.53 0.02 0.74 8.13
M(G) M(K) KQ XLKQ XRKQ OTEL 0.278 0.105 23359. -5. 34. 139.22
<<<<<END OF BRIDGE COMPUTATIONS>>>>>
FIRST USER DEFINED TABLE.
XSID:CODE SRD LEW REW Q K AREA VEL WSEL EXITX:XS -33. -9. 33. 2620. 15450. 208. 12.58 135.32 FULLV:FV 0. -10. 49. 2620. 19987. 250. 10.47 136.82 BRIDG:BR 0. 0. 39. 2620. 15567. 199. 13.18 136.03 RDWAY:RG 23.************** 0.****************** 1.00******** APPRO:AS 82. -9. 72. 2620. 26224. 322. 8.13 139.65
XSID:CODE XLKQ XRKQ KQ APPRO:AS -5. 34. 23359.
SECOND USER DEFINED TABLE.
XSID:CODE CRWS FR# YMIN YMAX HF HO VHD EGL WSEL EXITX:XS 135.32 1.00 128.43 141.78************ 2.46 137.78 135.32 FULLV:FV ******** 0.80 128.97 142.32 0.73 0.00 1.70 138.53 136.82 BRIDG:BR 136.02 1.00 128.26 140.00 0.94 0.01 2.70 138.73 136.03 RDWAY:RG **************** 144.31 145.99********************************** APPRO:AS 138.15 0.74 131.53 145.16 0.50 1.53 1.10 140.75 139.65 ER
NORMAL END OF WSPRO EXECUTION.
25
26
APPENDIX C:
BED-MATERIAL PARTICAL-SIZE DISTRIBUTION

27
Appendix C. Bed material particle-size distribution for one pebble count transect in the channel approach of
structure RICHVT01050036, in Richford, Vermont.
CU
MU
LA
TIV
E P
ER
CE
NT
FIN
ER
SIZE (MM)
0
100
0
10
20
30
40
50
60
70
80
90
1 1,0002 5 10 20 50 100 200 500

28
APPENDIX D:
HISTORICAL DATA FORM

FHWA Structure Number (I - 8)
Topographic Map
United States Geological SurveyBridge Historical Data Collection and Processing Form
Gener
Data collected by (First Initial, Full last name
Date (MM/DD/YY) _
Highway District Number (I - 2; nn)
Town (FIPS place code; I - 4; nnnnn)
Waterway (I - 6)
Route Number
Latitude (I - 16; nnnn.n
Select
Maintenance responsibility (I - 21; nn) _
Year built (I - 27; YYYY)
Average daily traffic, ADT (I - 29; nnnnnn
Year of ADT (I - 30; YY) _
Opening skew to Roadway (I - 34; nn) _
Operational status (I - 41; X) _
Structure type (I - 43; nnn)
Approach span structure type (I - 44; nnn
Number of spans (I - 45; nnn)
Number of approach spans (I - 46; nnnn)
U.S
.DE
PA
RTM N OF H
I
G LC SUV
YET T E
NTERORI
E
OA RI
OL
GE Structure Number
______________RICHVT01050036al Location Descriptive
)
F
)
__. _L M
ed
________________EDALIE
___ /03
____ /08 ____95County (FIPS county code; I - 3; nnn) _
____08Vicinity (I - 9)
Road Name (I - 7):
Hydrologic Unit Code:
Longitude (i - 17; nnnnn.n)
eral Inventory Codes
Mile marker (I - 11; nnn.nnn)
_
Maximum span length (I - 48; nnnn
Structure length (I - 49; nnnnnn
Deck Width (I - 52; nn.n)
Channel & Protection (I - 61; n)
Waterway adequacy (I - 71; n)
Underwater Inspection Frequency (I - 92B;
Year Reconstructed (I - 106)
Clear span (nnn.n ft) _
Vertical clearance from streambed (nnn.n f
Waterway of full opening (nnn.n ft2)
29
______011
______59125
_______005360_____________________________STANHOPE BROOK
_____________________-_______VT105
________________________0.1 MI W JCT. VT.105A E_________________________Jay Peak
_________02010007) _______44597
_______72368________________20003400360611
_____01
______1930
) _______001030
____92
_____22
XYY)
_____A______104
______000
t)
_____001______0000
) _____0038
) ______000042
______399
____5
____5
______N
_______0000
_____40.0
_____010.5
______420.0
Comments:The structural inspection report of 7/26/93 indicates the structure is a concrete T-beam bridge. Both concrete abutment walls have minor vertical shrinkage cracks. The left abutment has some minor scaling along flow line. The concrete wingwalls are in good condition, but with minor shrinkage cracks. The waterway has a slightly skewed alignment through structure. The streambed consists of stone and boulders. There is some scour along right abutment, with no apparent undermining. The structure is in generally good condition. There has been no apparent settlement. Very minor bank erosion is reported. Stone fill is noted along both abutment wingwalls. (Continued, page 31)

ge Hydrologic DataIs there hydrologic 2
Terrain character:
Stream character & type
Streambed material:
Discharge Data (cfs): Q2.33
Q50 _
Record flood date (MM / DD
Estimated Discharge (cfs):
Ice conditions (Heavy, Moderate, Light
The stage increases to maximum h
The stream response is (Flashy, Not
Watershed storage area (in perc
The watershed storage area is:
Descrstage:
Water Surface Elevation Estimates
Peak discharge frequency
Water surface elevation (ft))
Velocity (ft / sec)
Long term stream bed changes:
Is the roadway over w t
Relief Elevation (ft):
Are there other structures
Upstream dist
Highway No. :
Clear span (ft): Clear Heig
Brid ____ iN
_____ Q10 __ ____ Q25 _
__ Q100 _ ____ Q500
urfac n (ft):
t Q ft/s): _
) Debris (Heavy, Moderate
ighwat , Not rapidly):
flashy):
(1-mainly at the headwaters; 2- uniformly distributed; 3-imm
for Existing Structure:
Q Q Q Q Q
he Q100? (Yes, No, Unknown): _ Fr
Discharge over roadway at Q100 (ft3/ sec):
Yes, No, Unkno
____ Town:
ht (ft): Full Waterway (ft2):
Structure No. : tructure T
type ctrl-n o
oi the site)
30
_______-
data available? f No, type ctrl-n h VTAOT Drainage area (mi ):_________________________________________________________________-
: -
_______________________________________________________________Stone and boulders
_____
________- ________- ________-_____
________- ________- ________-___ / -
___ /-___
___-
_______- / YY):________-
Water s____ (-
e elevatio_______-
_ Velocity a: __________-
____________- , Light):_______________-
er elevation (Rapidly_______________-
ibe any significant site conditions upstream or downstream that may influence the stream’s-
: ___%-
ediatly upstream
ent)
___ -
2.33 10 25 50 100
- - - - -
- - - - -
-
____U
_______- topped belo_________-
equency:________-
____U
nearby? (_______-
wn):___________________If No or Unknown,
-
______s-
ance (miles):________________-
______ S- _____________________Year Built:-
______-
______- _______ype:-

Downstream d _____ Town
Highway No. :
Clear span (ft): Clea
Drainage area (DA)
Watershed storage (ST
Main channel slope (S) __
Bridge site elevation _
Main channel length _
10% channel length elev
Watershed Precipitation Dat
Average site precipitation _
Maximum 2yr-24hr precipit
Average seasonal snowfall
Watershed Hydrographic Da
: ______-
r Height (ft):
Struc
USGS Wate
2
%
t / mi
ft Hea
mi
ation _ ft
a
in Ave
ation event (I24,2)
(Sn) _ t
ta
Lak
3
___________________-
Full Waterway (ft2):
Structure T
rshed Data
dwater elevation _ ft
85% channel length elevation _
rage headwater precipitation _
n
e and pond area mi2
1
______-
istance (miles)
________________-
:: ______-
_____________________Year Built:-
_____-
______ture No.
-
_______ype:-
Comments:
Possibly up to 3 feet of channel scour has occurred along right abutment according to the report.
________ m7.03
_________ 0 i_________0
) __________499
_________3438_________5.7
ft
_________584 _________1818________ f288.65
in
_________ _________________ i
________ f

Reference Point (MS
Is boring information
Foundation Material
Bridge Plan Data
Are plans availa te issued for construction (MM / YYYY):
Low superstructure
Foundation Type:
If 1: Footing Thickne
If 2: Pile Type:
If 3: Footing bottom
no, type ctrl-n pl
Project Number
____IfY
L, Arbitrary, Other): Datum (NAD27, NAD83, Oth
available?
Type: _ (1-regolith, 2-bedrock, 3-unknown)
Number of borings taken:
elevation: USLAB SLAB USRAB
Minimum channel bed elevation
(1-Spreadfooting; 2-Pile; 3- Gravity; 4-Unknown)
ss _ Footing bottom elevation
(1-Wood; 2 tal; 3-Concrete) Approximate pile driven len
elevation:
If no, type ctrl-n bi
32
___ / -
er):
SRA
:
gth:
______1930
ble? Da_______________________F 034-2(1)
________131.0B
_______ D143.03 ________140.82 _______ D141.57 _______140.57Benchmark location description:B.M. #28, F.R.P. 20C, about 100 feet on the roadway right bankward from the right abutment and 20 feet from the roadway centerline downstream on the right overbank. The benchmark is also across VT105 from a driveway to a home, elevation 142.13
_____________Arbitrary
___________Arbitrary____ 1
______2.0
: ______128.0_
____ ______- -Steel or me______-
_____N
_____-_____3
Briefly describe material at foundation bottom elevation or around piles:NO FOUNDATION MATERIAL INFORMATION
Comments:Notes on plans show bridge was widened later in 1960; plans for widening do not exist. Other reference points: 1) end of the downstream left wingwall where the slope of the wingwall changes from slight to nearly vertical, elevation 138.00; 2) end of the upstream right wingwall where slope of the wingwall changes from slightly to nearly vertical, elevation 139.50; 3) top of the upstream right wingwall at the corner where it meets the right abutment wall on the stream side, elevation 144.85. Undated page size plan in folder shows 3 timber pilings placed within left abutment, about 21 feet long, bottom elevation of both abutments are 488.5; maybe from 1960s.

ross-sectional DataIs cross-sectional data available?
Source (FEMA, VTAOT, Other)?
Comments:
Station
Feature
Low cord
elevation
Bed
elevation
Low cord to
bed length
Station
Feature
Low cordelevationBedelevationLow cord tobed length
Source (FEMA, VTAOT, Other)? _Comments:
Station
Feature
elevation
elevation
bed length
Low cord
Bed
Low cord to
Low cord
Bed
Low cord to
Station
Feature
elevation
elevation
bed length
If no, type ctrl-n xs
C _____N
_________-
NO CROSS SECTION INFORMATION
-
-
-
-
-
-
-
-
-
-
-
-
-
-
-
-
-
-
-
-
-
-
-
-
-
33
-
-
-
-
-
-
-
-
-
-
-
-
-
-
-
-
-
-
-
-
-
-
-
-
-
-
-
-
-
-
-
-
-
-
-
-
-
-
-
-
-
-
-
-
-
-
-
-
-
-
-
-
-
-
-
-
-
-
-
-
-
-
-
-
-
-
-
-
-
-
-
-
-
-
-
-
-
-
-
-
-
-
-
-
-
________-
NO CROSS SECTION INFORMATION
-
-
-
-
-
-
-
-
-
-
-
-
-
-
-
-
-
-
-
-
-
-
-
-
-
-
-
-
-
-
-
-
-
-
-
-
-
-
-
-
-
-
-
-
-
-
-
-
-
-
-
-
-
-
-
-
-
-
-
-
-
-
-
-
-
-
-
-
-
-
-
-
-
-
-
-
-
-
-
-
-
-
-
-
-
-
-
-
-
-
-
-
-
-
-
-
-
-
-
-
-
-
-
-
-
-
-
-
-
-

34
APPENDIX E:
LEVEL I DATA FORM

U.S
.DE
PA
RTM N OF H
I
G LC SUV
YET T E
NTERORI
E
OA RI
OL
GE
UB
US lef
U. S. Geological SurveyBridge Field Data Collection and Processing Form
Structure Number
A. Gene
1. Data collected by (First In ll last name)
2. Highw
Count
Waterway (I -
Route Numbe
B. Bri
4. Surface cover... LBUS RBUS(2b us,ds,lb,rb: 1- Urban; 2- S ; 3- Ro
5. Ambient water surfa US
6. Bridge structure typ - single span; 2- box culvert; o
7. Bridge length feet)
Road approach to bridge:
8. LB B ( 0 even, 1- lower, 2- highe
LBUS
RBUS
RBDS
LBDS
14.Severi
Erosion: 0 - none; 1- channel erosion; 2-
Erosion Severity: 0 - none; 1- slight; 2- moderate;
9. LB B 1- Paved, 2- Not paved)
US righ
10. Emban (run / rise :
Qa/Qc Check by ate
Computerized by ate
Reviewd by: ate
13.Erosion Protection
11 12
road wash; 3- both; 4- other
3- severe
Bank protection types: 0- none; 1- < 12 inches;2- < 36 inches; 3- < 48 inches;4- < 60 inches; 5- wall / artificial leve
Bank protection conditions: 1- good; 2- slumped;3- eroded; 4- failed
______________RICHVT01050036
ral Location Descriptive
/YY) 1
__. _M Idg
- mr 7-
r)
ty
e
________________VANOFF
Town
Road Name
Hydrologic Unit Code
Mile
e Deck Observations
LBDS RBDS 4- P - Shrub- and brushland; 6- Fores
DS 1- pool; 2- riffle)
ultiple span; 3- single arch; 4- multiple arch; 5- cy other)
Span length feet)
Channel approach to brid
15. Angle of approach:
17. Channe zone 1: Exist?
Where? LB, RB)
Range ee US, UB, DS) to
Channel impact zone 2: Exist?
Where? LB, RB)
Range? ee S, UB, DS) to
16. Bridge
Q
Q
Approach AngleBridge Skew A
Severity
Severity
Impact Severity: 0- none to very slight; 1- Slight;
35
Bridge wi
____ /6
Overat; 7- W
lindrica
ge (B
or N)
e
or N)
e
skew
ngle
2- Mod
dth
____ / 28
letland)
l culvert;
F):
Q
Ope
erate; 3-
fee
to
9____95
itial, Fu_____8
Date (MM/DDr ______________005360
ay District Numbery___________________________FRANKLIN (011)
______________________________marke
RICHFORD (59125)
_________________________________STANHOPE BROOK
__________________________VT 105 6)r ________VT 105
: ___________020100073. Descriptive comments:Located 0.1 mile west of the junction with VT 105 A East. June 1993 flash flood came up to high bank behind US right residence. Bridge project number F034-2(1), 1958.
_____6
_____4 _____5 _____4 l _____5 uburban______2
_____w crops;2
asture; 5
_____ (2
ce...e _____( 16
1
t)
________ (42 ________ (38 ______ (39.9____ R2
____0____ R1
____ (1ning skew
.Type
_____2
.Cond._____1
_____0 _____-_____2
_____1 _____0 _____-_____3
_____1 _____2 _____2_____0
_____0 _____0 _____-_____25
: _____15_____ (Y
l impact_____ (RB
Y
____1
? _____ f10
t ____ (UB _____fe0 t ____DS_____ (N
_____ (-
Y____-
_____ f-
t ____(U- _____fe- t ____-t ________
kment slope
2.7:1
t _______in feet / foot)
2.4:1
=
roadway
20.0
: _______ DRB
: __________3/6/96: _______ DRB
: __________ 3/6/96_______ D
: __________Severe
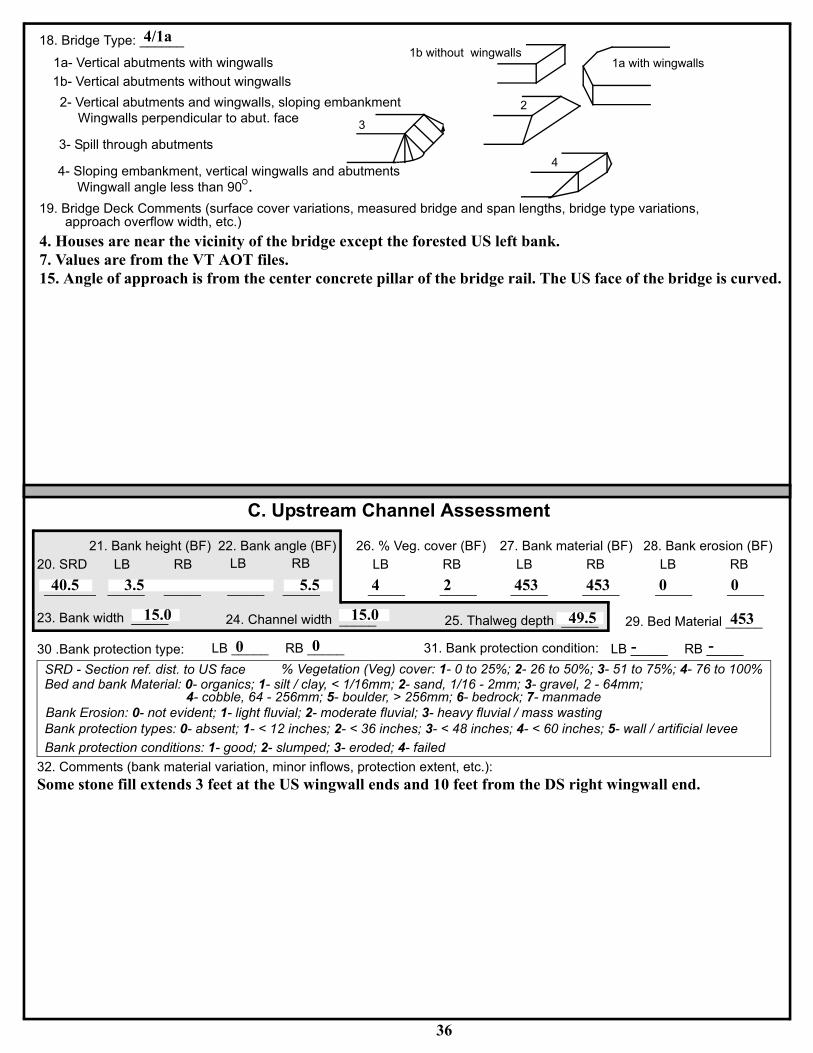
C. Upstream Channel Assessment
21. Bank height (BF) 22. Bank angle (BF) 26. % Veg. cover (BF) 27. Bank material (BF) 28. Bank erosion (BF)
18. Bridge Type
1a- Vertical abutments with wingwalls
1b- Vertical abutments without wingwalls
2- Vertical abutments and wingwalls, sloping embankmentWingwalls perpendicular to abut. face
3- Spill through abutments
4- Sloping embankment, vertical wingwalls and abutmentsWingwall angle less than 90
1b without wingwalls1a with wingwalls
2
3
4
19. Bridge Deck Comments (surface cover variations, measured bridge and span lengths, bridge type variations,
_______
20. SRD
40.5
Bed and
Bank Ero
23. Bank w
30 .Bank p
Bank pro
Bank pro
SRD - Se
LB RB
_____
LB
_____ _____ _ 3.5
bank Material: 0- organics; 1-
sion: 0- not evident; 1- light flu
idth 24. Cha
4- cobble, 64 -
rotection type: LB
tection types: 0- absent; 1- < 1
tection conditions: 1- good; 2-
ction ref. dist. to US face
RB
____ 5.5
nnel width 25. Thalweg dept 29. Bed Materia
_____ 15.0% Vegesilt / clay,
vial; 2- m256mm; 5
RB
2 inches;
slumped;
_____ 15.0
tation (Veg) cover: 1- 0 to 25%; 2- 26 < 1/16mm; 2- sand, 1/16 - 2mm; 3- g
oderate fluvial; 3- heavy fluvial / mas- boulder, > 256mm; 6- bedrock; 7- m
31. Bank protection c
2- < 36 inches; 3- < 48 inches; 4- < 6
3- eroded; 4- failed
36
h _____ 49.5
: ______4/1a
approach overflow width, etc.)
4. Houses are near the vicinity of the bridge except the forested US left bank.7. Values are from the VT AOT files.15. Angle of approach is from the center concrete pillar of the bridge rail. The US face of the bridge is curved.
LB
_____4
RB_____2
LB_____453
to 50ravel
s wasanm
ondit
0 inc
RB
_____453
%; 3- 51 to 7, 2 - 64mm;
tingade
ion: LB
hes; 5- wall
LB
_____0
5%; 4- 76 to
RB
/ artificial lev
RB
_____0
l _____453
_____0
_____0 _____- _____-100%
ee
32. Comments (bank material variation, minor inflows, protection extent, etc.):Some stone fill extends 3 feet at the US wingwall ends and 10 feet from the DS right wingwall end.

47. Scour dimensions: Length idth epth
46. Mid-scour distance
49. Are there major c ces? o ctrl-n mc) 50. Ho
51. Confluence 1: Distance 52. Enters o B or RB) 53. Typ 1- perennial; 2- ephemeral)
Confluence 2: Distance Enters on LB or RB) Type ( 1- perennial; 2- ephemeral)
Bridge Channel Assessment
56. Height (BF)LB RB
57 Angle (BF) 61. Material (BF) 62. Erosion (BF)LB RB LB RB LB RB
55. Channel restraint (BF)? LB 1- natural bank; 2- abutment; 3- artificial levee)
45. Is channel scour present? Y or if N type ctrl-n cs)
Position LB to RB
39. Is a cut-bank t? Y or if N type ctrl-n 40. Whe )
41. Mid-bank dist 42. Cut bank extent e S, UB) t e S, UB, DS)
43. Bank damage ( 1- eroded and/or creep; 2- slip failure; 3- block failure)
33.Point/Side b en Y or N c 35. Mi th:4. Mid-bar distance
36. Point ba ee S, UB) to e S, UB, DS) positioned LB to RB
37. Material:
__________ _____ 23.5
58. Bank width (BF
Bed and bank Mate
Bank Erosion: 0- no
_____ _____ 0.5
. Channel width (Amb . Thalweg depth (Amb 63. Bed Materia
) _____ 59 -rial: 0- organics; 1- silt / clay, < 1/
t evident; 1- light fluvial; 2- mode
5- boulder, > 256mm; 6- bed
) _____ 60 -
16mm; 2- sand, 1/16 - 2mm; 3- gra
rate fluvial; 3- heavy fluvial / mass
rock; 7- manmade
37
) _____ 90.0
_____ (N
ve
wa
: ______-
l, 2 - 64mm; 4- cobble, 64 -
sting
______-
ar pres: ______ f-t?t ____ (U-
. if N type
______ fe-
trl-n pb)3t ____ (U-
____ %- d-bar wid_____ %-
r extent_____-
38. Point or side bar comments (Circle Point or Side; Note additional bars, material variation, status, etc.):NO POINT BARS_____ (Y
_____ (LB presen: _____130cb)
: _____ fe200
t ____ (UUS re?o _____ fe90
LB or RBt ____ (UUS
ance: _____ 2
44. Cut bank comments (eg. additional cut banks, protection condition, etc.):On the left bank there is mass wasting with trees uprooted and 5 feet depth of slippage plane where trees are still remaining on the slope. Another cut bank is 300 feet from the bridge on the right bank._____ (N
: _____-______ W-
______ D- : _____- ____ %- _____ %- 48. Scour comments (eg. additional scour areas, local scouring process, etc.):NO CHANNEL SCOUR_____ (YN
_____- onfluen _____-r if N type
n _____ (L-
w many?e _____ (-
_____-
_____ (- _____ - 54. Confluence comments (eg. confluence name):NO MAJOR CONFLUENCES. There is a dry channel entering the left bank 250 feet from the bridge. This is a meander cut off type channel for higher flows.D. Under _____ RB _____ (2
_____2
_____7 _____7 _____-l ______-
256mm;
64. Comments (bank material variation, minor inflows, protection extent, etc.):453-

73. Toe
82. Bank / Bridge Protection:
USLWW USRWW RABUT LB RB DSLWW DSRWW
Type
Condition
Location
80. Wingwalls:
Exist? Material?
USLWW
USRWW
DSLWW
DSRWW
Wingwall materials: 1- Concrete; 2- Stone masonry or drywall; 3- steel or metal;
Angle?
Q
USRWW
DSRWW
Length?Wingwall
Wingwallangle
Pushed: LB or RB Toe Location (Loc.): 0- even, 1- set back, 2- protrudesScour cond.: 0- not evident; 1- evident (comment); 2- footing exposed; 3-undermined footing; 4- piling expos
Abutments 71. Attack 72. Slope 74. Scour
LABUT
RABUT
(BF) (Qmax) loc. (BF)77. Material 78. Length
Materials: 1- Concrete; 2- Stone masonry or drywall; 3- steel or metal; 4- wood
Extent
Scour
Bank / Bridge protection types: 0- absent; 1- < 12 inches; 2- < 36 inches; 3- < 48 inches; 4- < 60 inches;
Bank / Bridge protection conditions: 1- good; 2- slumped; 3- eroded; 4- failed5- wall / artificial levee
Protection extent: 1- entire base length; 2- US end; 3- DS end; 4- other
75. Scour Exposure
Scour
Condition
81.
38
5- settled; 6- failed
depth depth76.
lengthExposure
4- wood
65. Debris and Is there debris accumulation? or N)
69. Is there evidence of ice build-up? or N)
66. Where 1- Upstream; 2- At bridge; 3- Both)
Ice Blockage Potentia 1- Low; 2- Moderate; 3- High)
67. Debris Potentia 1- Low; 2 rate; 3- High) 68. Capture Efficienc 1- Low; 2- Moderate; 3- High)
90.0
36.5
USLWW
ed;
_____ _____ 36.5
_____ _____ 1.0
_____ _____ 47.0
_____ _____ 43.5
____ (Y
_____ (Y Icel ____ (1?
y ____ (3
___ (Y
- Mode1
l ____ (N70. Debris and Ice Comments:1Debris potential is high as further slippage of the left bank is likely. See comments for the US cut bank. Res-ident commented on the ice buildup as slight but it would prevent visually seeing the water surface.
0
90 2 0 0 01
15 90 2 279. Abutment comments (eg. undermined penetration, unusual scour processes, debris, etc.):
0.52175. The right abutment scour depth is about 0.5 feet with an average thalweg depth of 0.5 feet. Maximum water depth below the bridge is 1 foot.76. The top of the right abutment footing is exposed at the DS end to the DS right wingwall.
_____ _____:
_____ _____depth?Condition?
_____
depth?
_____ _____: Y
_____ _____1 _____0_____ _____: -
_____ _____- _____Y_____ _____: 1
_____ _____0 _____-DSLWW
-
Y
1
0
-
-
LABUT
Y
1
2
0
2
2
1
1
2
1
1
0
-
-
0
-
-
-

86. Locati
87. Type
88. Materi
89. Shape
90. Incline
91. Attack
92. Pushe
93. Length
94. # of pi
95. Cross-
96. Scour
97. Scour
Level 1 P
Piers:
84. Are there piers? or if N type ctrl-n pr)
Pier 1
w1
Pier 2
Pier no. width (w) feet elevation (e) feet
Pier 3
Pier 4
e@w1 e@w3
85.
98. Expos
w1
on (BF)
al
d?
(BF)
d
(feet)
les
members
Condition
depth
ier Descr.
ure depth
35.0
w2
e@w211.0
w365.0
12.5
60.0 10.5w3w2
35.0 18.0 - --
- - - - -LFP, LTB, LB, MCL, MCM, MCR, RB, RTB, RFP
1- Solid pier, 2- column, 3- bent
1- Wood; 2- concrete; 3- metal; 4- stone
1- Round; 2- Square; 3- Pointed
Y- yes; N- no
LB or RB
-
- - -83. Wingwall and protection comments (eg. undermined penetration, unusual scour processes, etc.):-----212213
_____ (Y80.
1
The
top
of
the
DS
right
wing
wall
0- none; 1- laterals; 2- diagonals; 3- both
foot- 0- not evident; 1- evident (comment);4- undermined footing; 5- settled; 6- failed 2- footing exposed; 3- piling exposed;
ing isexpo
sed
2
at
the
strea
m
bed
level
and
only
expo
sed
at its
cor-
3
ner
with
the
abut
ment
.
82.
The
right
abut
ment
pro-
4
tec-
tion
con-
sists
of a
pile
of
large
, <48
in.,
boul-
ders
39

E. Downstream Channel Assessment
Bank height (BF) Bank angle (BF) % Veg. cover (BF) Bank material (BF) Bank erosion (BF)LB RB
100.
_____
SRD
-
Bank wid
Bank prot
Bed and b
Bank ErosBank prote
Bank prote
SRD - Sec
101. Is a103. Dro
LB RB
_____ _____ _____ -
th (BF Channel
ection type (Qmax): LB
ank Material: 0- organics; 1- s
ion: 0- not evident; 1- light flu 4- cobble, 64 - 2
ction types: 0- absent; 1- < 12
ction conditions: 1- good; 2- s
tion ref. dist. to US face
ucture presen10et
_____ -
width (Amb Thalweg depth (Amb Bed Materia
) _____ -RB
% Vegetatiilt / clay, < 1
vial; 2- mod56mm; 5- b
inches; 2-
lumped; 3-
t? Y
4. Structure
) _____ -
Bank protection cond
40
on (Veg) cover: 1- 0 to 25%; 2- 26 t/16mm; 2- sand, 1/16 - 2mm; 3- gr
erate fluvial; 3- heavy fluvial / massoulder, > 256mm; 6- bedrock; 7- m
< 36 inches; 3- < 48 inches; 4- < 6
eroded; 4- failed
or N, if N rl-n ds) 102. Dis
materia 1- steel sheet pile;
) _____ -
ition: LB RB
o 50%; 3- 51 to 75%; 4- 76 to 100%avel, 2 - 64mm;
wastinganmade
0 inches; 5- wall / artificial levee
tance et
2- wo
: ______ fe -
od pile; 3- concrete; 4- other)
drop strp: ______ fe -
99. Pier comments (eg. undermined penetration, protection and protection extent, unusual scour processes, etc.):
at the US end.
N
LB
_____-
RB_____-
LB_____-
RB_____-
LB_____-
RB_____-
l _____-
_____-
_____- _____- _____-Comments (eg. bank material variation, minor inflows, protection extent, etc.):---------------
____ (-
type ctl: ____ (-
105. Drop structure comments (eg. downstream scour depth):------

Scour dimensions: Length id
Is channel scour p
Are there major c cesConfluence 1: Distance
Confluence 2: Distance
106. Point/Side bar present? Y or N. if N type ctrl-n pb) Mid-bar widthMid-bar distance:
Point ba ee S
Point or side bar comments (Circle Poi
Material:
Is a cut-banCut bank exte e S,
Bank damage ( 1- eroded and/
F.
107. Stage of reach evolut
_____ (-
th epth
Mid-scourY or if N typ s)
Positioned
? Y or ctrl-n mc) How
Enters o LB or RB) Typ
Enters o LB or RB) Typ
41
, UB, DS) to e S, UB, DS) posit
nt or Side; note additional bars, material variation, s
Y or if N t c re? LB or RB
UB, DS) t e S, UB, DS)
or creep; 2- slip failure; 3- block failure)
Geomorphic Channel Assessmen
ion _ 1- Constructed2- Stable3- Aggraded4- Degraded5- Laterally unstable6- Vertically and laterally u
______-
LB to RB
1- perennial; 2- eph
1- perennial; 2- eph
ioned LB to
tatus, etc.):
) Mid-bank distance
t
nstable
: ______-
RB
: ______ f- t ____ (U- ______ fe- t ____ (U- ____ %- _____ %- r extent_____-
----
_____ (N
_____ (O : _____PIE k preset: _____ feRSnt?
t ____ (U
ype ctrl-n
o _____ fe
b) Whe
t ____ (U
n: _____
Cut bank comments (eg. additional cut banks, protection condition, etc.):_____ (
: _______3______ W
resent?3
______ D453 : _____e ctrl-n c
453
distance
____ %1
____ %0Scour comments (eg. additional scour areas, local scouring process, etc.):45300-
_____ (-
_____Stonemeral)
onfluen _____e fill
if N type
_____ (exte
many?e _____ (nds
emeral)
_____10 nn _____ (feet
e _____ (beyConfluence comments (eg. confluence name):
ond the end of the right wingwall with large boulders along both banks.
____

108. Evolution comments (Channel evolution not considering bridge effects; See HEC-20, Figure 1 for geomorphic
descriptors):N
42

109. G. Plan View Sketch
43
point bar
cut-bank
scour hole ambient channelrip rap or
debris stone wall
other wallflow
cross-section
pb
cb
Q
stone fill
-
-
44
APPENDIX F:
SCOUR COMPUTATIONS

SCOUR COMPUTATIONS Structure Number: RICHVT01050036 Town: Richford Road Number: VT 105 County: Franklin Stream: Stanhope Brook Initials EMB Date: 9/11/96 Checked: Analysis of contraction scour, live-bed or clear water? Critical Velocity of Bed Material (converted to English units) Vc=11.21*y1^0.1667*D50^0.33 with Ss=2.65 (Richardson and others, 1995, p. 28, eq. 16) Approach Section Characteristic 100 yr 500 yr other Q Total discharge, cfs 1950 2620 0 Main Channel Area, ft2 190 301 0 Left overbank area, ft2 0 6 0 Right overbank area, ft2 0 16 0 Top width main channel, ft 49 52 0 Top width L overbank, ft 1 4 0 Top width R overbank, ft 0 25 0 D50 of channel, ft 0.432 0.432 0 D50 left overbank, ft 0 0 0 D50 right overbank, ft 0 0 0 y1, average depth, MC, ft 3.9 5.8 ERR y1, average depth, LOB, ft 0.0 1.5 ERR y1, average depth, ROB, ft ERR 0.6 ERR Total conveyance, approach 12289 26238 0 Conveyance, main channel 12286 25590 0 Conveyance, LOB 3 143 0 Conveyance, ROB 0 505 0 Percent discrepancy, conveyance 0.0000 0.0000 ERR Qm, discharge, MC, cfs 1949.5 2555.3 ERR Ql, discharge, LOB, cfs 0.5 14.3 ERR Qr, discharge, ROB, cfs 0.0 50.4 ERR Vm, mean velocity MC, ft/s 10.3 8.5 ERR Vl, mean velocity, LOB, ft/s ERR 2.4 ERR Vr, mean velocity, ROB, ft/s ERR 3.2 ERR Vc-m, crit. velocity, MC, ft/s 10.6 11.4 N/A Vc-l, crit. velocity, LOB, ft/s 0.0 0.0 N/A Vc-r, crit. velocity, ROB, ft/s N/A 0.0 N/A Results Live-bed(1) or Clear-Water(0) Contraction Scour? Main Channel 0 0 N/A Left Overbank N/A 1 N/A Right Overbank N/A 1 N/A
45

Live-Bed Contraction Scour Laursen’s Live Bed Contraction Scour y2/y1 = (Q2/Q1)^(6/7)*(W1/W2)^(k1) ys=y2-y_bridge (Richardson and others, 1995, p. 30, eq. 17 and 18) Approach Bridge Characteristic 100 yr 500 yr Other Q 100 yr 500 yr Other Q Q1, discharge, cfs 1950 2620 0 1950 2620 0 Total conveyance 12289 26238 0 14187 15561 0 Main channel conveyance 12286 25590 0 14187 15561 0 Main channel discharge 1950 2555 ERR 1950 2620 ERR Area - main channel, ft2 190 301 0 187 198.7 0 (W1) channel width, ft 49 52 0 36.7 36.7 0 (Wp) cumulative pier width, ft 0 0 0 0 0 0 W1, adjusted bottom width(ft) 49 52 0 36.7 36.7 0 D50, ft 0.432 0.432 0.432 w, fall velocity, ft/s (p. 32) 5.37 5.37 0 y, ave. depth flow, ft 3.88 5.79 N/A 5.10 5.41 ERR S1, slope EGL 0.024 0.022 0 P, wetted perimeter, MC, ft 51 54 0 R, hydraulic Radius, ft 3.725 5.574 ERR V*, shear velocity, ft/s 1.697 1.987 N/A V*/w 0.316 0.370 ERR Bed transport coeff., k1, (0.59 if V*/w<0.5; 0.64 if .5<V*/w<2; 0.69 if V*/w>2.0 p. 33) k1 0.59 0.59 0 y2,depth in contraction, ft 4.60 7.26 ERR ys, scour depth, ft (y2-y_bridge) -0.50 N/A N/A Clear Water Contraction Scour in MAIN CHANNEL y2 = (Q2^2/(131*Dm^(2/3)*W2^2))^(3/7) Converted to English Units ys=y2-y_bridge (Richardson and others, 1995, p. 32, eq. 20, 20a) Approach Section Q100 Q500 Qother Main channel Area, ft2 190 301 0 Main channel width, ft 49 52 0 y1, main channel depth, ft 3.88 5.79 ERR Bridge Section (Q) total discharge, cfs 1950 2620 0 (Q) discharge thru bridge, cfs 1950 2620
Main channel conveyance 14187 15561 Total conveyance 14187 15561 Q2, bridge MC discharge,cfs 1950 2620 ERR Main channel area, ft2 187 199 0 Main channel width (skewed), ft 36.7 36.7 0.0 Cum. width of piers in MC, ft 0.0 0.0 0.0 W, adjusted width, ft 36.7 36.7 0 y_bridge (avg. depth at br.), ft 5.10 5.41 ERR Dm, median (1.25*D50), ft 0.54 0.54 0 y2, depth in contraction,ft 4.45 5.73 ERR ys, scour depth (y2-ybridge), ft -0.65 0.31 N/A ARMORING D90 0.839895 0.839895 D95 1.459 1.459 Critical grain size,Dc, ft 0.5917 0.9199 ERR Decimal-percent coarser than Dc 0.269 0.095 Depth to armoring,ft 4.82 26.29 ERR
46

Abutment Scour Froehlich’s Abutment Scour Ys/Y1 = 2.27*K1*K2*(a’/Y1)^0.43*Fr1^0.61+1 (Richardson and others, 1995, p. 48, eq. 28)
Left Abutment Right Abutment Characteristic 100 yr Q 500 yr Q Other Q 100 yr Q 500 yr Q Other Q (Qt), total discharge, cfs 1950 2620 0 1950 2620 0 a’, abut.length blocking flow, ft 6.8 10.1 0 6.8 34.1 0 Ae, area of blocked flow ft2 11.5 27.1 0 11.6 43.8 0 Qe, discharge blocked abut.,cfs 69.8 145.2 0 65.6 196.5 0 (If using Qtotal_overbank to obtain Ve, leave Qe blank and enter Ve and Fr manually) Ve, (Qe/Ae), ft/s 6.07 5.36 ERR 5.66 4.49 ERR ya, depth of f/p flow, ft 1.69 2.68 ERR 1.71 1.28 ERR --Coeff., K1, for abut. type (1.0, verti.; 0.82, verti. w/ wingwall; 0.55, spillthru) K1 0.82 0.82 0 0.82 0.82 0 --Angle (theta) of embankment (<90 if abut. points DS; >90 if abut. points US) theta 70 70 0 110 110 0 K2 0.97 0.97 0.00 1.03 1.03 0.00 Fr, froude number f/p flow 0.822 0.576 ERR 0.763 0.698 ERR ys, scour depth, ft 6.61 8.79 N/A 6.71 9.35 N/A HIRE equation (a’/ya > 25) ys = 4*Fr^0.33*y1*K/0.55 (Richardson and others, 1995, p. 49, eq. 29) a’(abut length blocked, ft) 6.8 10.1 0 6.8 34.1 0 y1 (depth f/p flow, ft) 1.69 2.68 ERR 1.71 1.28 ERR a’/y1 4.02 3.76 ERR 3.99 26.55 ERR Skew correction (p. 49, fig. 16) 0.93 0.93 0.00 1.04 1.04 0.00 Froude no. f/p flow 0.82 0.58 N/A 0.76 0.70 N/A Ys w/ corr. factor K1/0.55: vertical ERR ERR ERR ERR 8.63 ERR vertical w/ ww’s ERR ERR ERR ERR 7.07 ERR spill-through ERR ERR ERR ERR 4.74 ERR Abutment riprap Sizing Isbash Relationship D50=y*K*Fr^2/(Ss-1) and D50=y*K*(Fr^2)^0.14/(Ss-1) (Richardson and others, 1995, p112, eq. 81,82) Characteristic Q100 Q500 Qother Fr, Froude Number 0.81 1 0.81 1 (Fr from the characteristic V and y in contracted section--mc, bridge section) y, depth of flow in bridge, ft 5.1 5.4 5.1 5.4 Median Stone Diameter for riprap at: left abutment right abutment, ft Fr<=0.8 (vertical abut.) ERR ERR 0.00 ERR ERR 0 Fr>0.8 (vertical abut.) 2.01 2.26 ERR 2.01 2.26 ERR
47