Embed Size (px)
Citation preview

1
Master Thesis, 30 ECTS
LEVELS & BARRIERS TO
SUPPLY CHAIN
INTEGRATION A SURVEY ON HALEEB FOOD’S DISTRIBUTORS IN PAKISTAN
Authors: Shamaion Sammuel 820908-T275 Huma Kashif 870701-T187 Examiner:Professor Helena Forslund Tutors: Åsa Gustavsson Semester: Spring, 2013 Course Code: 5FE02E

School of Business & Economics
SUMMARY
Business Administration, Business Process & Supply Chain Management, Degree
Project (Master), 30 higher education credits, 5FE02E, Spring 2013
Authors: Shamaion Sammuel and Huma Kashif
Tutor : Åsa Gustavsson
Tittle: Levels and Barriers to Supply chain integration
Background: This paper considers two levels of supply chain integration as
manufacture ( Haleeb foods) and distributors. In the last decade, the advancement in
technology and collaboration in the business becoming more commonly used. Firms
need to be working closely with their supply chain partner upstream and downstream.
However, supply chain integration is a process to join together as business
partners and optimize the collective performance of the supply chain.
Purpose: The purpose of this study is to identify the existing levels of supply chain
integration between Haleeb foods and its distributors in Pakistan. Theory defines that
developing countries have a lack of integration between supply chain partners due to
some barriers to supply chain integration. Furthermore, this study found the barriers to
supply chain integration between the Haleeb foods and its distributors as well as
identifying the most common barriers to SCI.
Methodology: This study is to identify different levels and barriers to SCI between
Haleeb foods and its distributors. Subsequently, research supported the supply chain
integration in the food industry of Pakistan. Furthermore, relevant literature is
reviewed to design the questionnaire and sent it to all the distributors of Haleeb foods
across the Pakistan through a company representative . 178 responses were received
out of 200 distributors in order to complete this survey based study. Pearson
correlation was performed out of empirical data to find out the significant relationship.
3

School of Business & Economics
Moreover, the authors used descriptive statistic to identify the levels and barriers to
supply chain integration.
Conclusion: The current level of supply chain integration in Haleeb foods and its
distributors is low due to less supply chain integration practice and unstable industrial
condition in Pakistan. However, the basic dimensions (II, CRS, ORL) of supply chain
integration are very important to identifying the levels of SCI. On the other hand,
there are some barriers to supply chain integration between Haleeb foods and its
distributors. These barriers are strongly influencing on SCI.
Originality/value: This is the first empirical work, measuring the existing levels and
barriers to supply chain integration in the dairy industry of Pakistan specifically,
Haleeb foods and its distributors. This research has given a clear idea about the supply
chain integration and collaborative efforts in the food industry of Pakistan.
Key words: Supply chain integration, information integration, information sharing,
levels of integration, barriers to supply chain integration .
4

School of Business & Economics
Acknowledgement The journey of this thesis wasn't relaxing , while conducting this research we have
faced a lot of difficulties like the geographical difference in a business environment,
structure of business and industrial situation in Pakistan. After a very hard struggle,
we have made it by the grace of God and strength which He has given us.
First, we appreciate and thankful to Professor Helena Forslund from the depth of our
hearts, for her expertise, supervision and patience during this research. She has been
of invaluable importance to the success of this research work.
We also thank to our tutor Åsa Gustavsson for her keenly and critical review of our
research, which has helped us to follow the right track. Furthermore, we are grateful
to the respondents of the questionnaire for providing us valuable information which
has helped us successfully complete this research. Additionally, we are thankful to
fellow students those who opposing of our thesis, in a constructive and systematic way
directed at refining the quality of this study.
Last but not least, our appreciation to our Parents, families for their moral support
during entire study in Sweden .
Växjö, 2013-09-11 Växjö, 2013-09-11
-------------------- ----------------------- Shamaion Sammuel Huma Kashif
5

School of Business & Economics
Table Of Content 1. INTRODUCTION .................................................................................................................................... 12
1.1 Background............................................................................................................................................. 12
1.1.1 Supply chain Integration ................................................................................................................. 12
1.2 Overview of Haleeb foods ..................................................................................................................... 16
1.3 Problem discussion ................................................................................................................................ 16
1.3.1 Levels of supply chain integration .................................................................................................. 16
1.3.2 Barrier to supply chain integration ................................................................................................ 18
1.4 Research Questions .............................................................................................................................. 20
1.5 Purpose .................................................................................................................................................. 21
1.6 Disposition of thesis .............................................................................................................................. 22
2. METHODOLOGY ................................................................................................................................... 23
2.1 Scientific perspective ............................................................................................................................. 23
2.1.1 Positivism ........................................................................................................................................ 24
2.1.2 Interpretivism ................................................................................................................................ 24
2.1.3 Scientific perspective of this Study ............................................................................................... 24
2.2 Scientific Approach ............................................................................................................................... 25
2.2.1 Deductive approach ........................................................................................................................ 25
2.2.2 Inductive approach ........................................................................................................................ 25
2.2.3 Scientific Approach to this Study ................................................................................................. 26
2.3 Research Methods ................................................................................................................................. 27
2.3.1 Qualitative Research method ........................................................................................................ 28
2.3.2 Quantitative research method ...................................................................................................... 28
2.3.3 Research method of this Study ..................................................................................................... 28
2.4 Research strategy ................................................................................................................................. 29
2.4.1 Survey ............................................................................................................................................. 29
2.4.1 Research strategy of this study ...................................................................................................... 29
2.5 Questionnaire ....................................................................................................................................... 30
2.5.3 Questionnaire design of this study ................................................................................................ 30
2.6 Population ............................................................................................................................................. 31
2.7 Data Collection ..................................................................................................................................... 31
6

School of Business & Economics
2.7.1 Primary Data Collection ................................................................................................................. 32
2.7.2 Secondary Data Collection ............................................................................................................. 32
2.7.3 Data collection method of this Study ............................................................................................ 32
2.8 Data Analysis ........................................................................................................................................ 33
2.8.1 Data analysis of this thesis ............................................................................................................. 33
2.9 Scientific creditability ........................................................................................................................... 33
2.9.1 Validity ............................................................................................................................................ 33
2.9.2 Validity of this thesis ..................................................................................................................... 34
2.9.3 Reliability ........................................................................................................................................ 34
2.9.4 Reliability of this thesis ................................................................................................................. 34
2.10 Summary of this chapter .................................................................................................................... 36
3. THEORETICAL FRAMEWORK ............................................................................................................. 37
3.1 Supply chain integration ....................................................................................................................... 38
3.1.1 Dimensions of supply chain integration ......................................................................................... 38
3.1.1.1 Information integration ............................................................................................................39
3.1.1.1.1 Information sharing ............................................................................................................ 40
3.1.1.1.2 Information technology integration .................................................................................... 40
3.1.1.1.3 Collaborative planning ........................................................................................................ 41
3.1.1.1.4 Joint demand forecasts ........................................................................................................ 41
3.1.1.1.5 Joint replenishment forecasts ............................................................................................. 42
3.1.1.2 Coordination resource sharing ................................................................................................ 42
3.1.1.2.1 Shared decision making ...................................................................................................... 43
3.1.1.2.2 Cooperation ........................................................................................................................ 43
3.1.1.2.3 Work realignment ............................................................................................................... 43
3.1.1.2.4 Reorganization of outsourcing common use of third party logistics ..................................... 43
3.1.1.2.5 Packaging customization standardization ........................................................................... 44
3.1.1.2.6 Agreement on delivery frequency ....................................................................................... 44
3.1.1.2.7 Common use of logistics equipment/ containers ................................................................. 44
3.1.1.2.8 Process integration ............................................................................................................. 44
3.1.1.3 Organizational relationship linkage ........................................................................................ 44
3.1.1.3.1 Design and maintaining of communication channels ...........................................................45
3.1.1.3.2 Laying down performance measures .................................................................................. 46
3.1.1.3.3 Incentive realignment ......................................................................................................... 46
7

School of Business & Economics
3.1.1.3.4 Integrated behavior ............................................................................................................ 46
3.1.1.3.5 Joint establishment of objectives of all parties in the chain ................................................. 46
3.1.1.3.6 Sharing of skill, ideas and institutional culture ................................................................... 46
3.1.1.3.7 Drawing up of contingency plan for quick problem solving ................................................ 47
3.1.1.3.8 Forging and maintaining long term relationship .................................................................. 47
3.1.1.3.9 Creating team works along SC and cross functional teams .................................................. 47
3.1.1.4 Supply chain integration framework ...................................................................................... 47
3.2 Barriers to supply chain integration .................................................................................................... 49
3.2.1 Lack of information technology .................................................................................................... 49
3.2.2 Lack of information sharing .......................................................................................................... 50
3.2.3 Lack of trust .................................................................................................................................... 51
3.2.4 Demand distortion – Bullwhip effect ............................................................................................ 51
3.2.4.1 Demand signal processing ....................................................................................................... 52
3.2.4.2 The rationing game ................................................................................................................. 53
3.2.4.3 Order batching ........................................................................................................................ 53
3.2.4.4 Price variation .......................................................................................................................... 53
3.2.5 Systems incompatibility ................................................................................................................. 53
3.2.6 Lack of knowledge/Poor human resource ....................................................................................54
3.3.7 Cost of integration .......................................................................................................................... 55
4. INDUSTRY DESCRIPTION .................................................................................................................... 57
4.1 Relationship of industries and supply chain integration ..................................................................... 57
4.1.1 Overview of Pakistani industry ....................................................................................................... 57
4.1.2 Dairy Food industry of Pakistan ................................................................................................... 58
4.2 Challenges to food industry of Pakistan ............................................................................................. 59
5. HYPOTHESES ........................................................................................................................................ 60
5.1 Creation of hypotheses ......................................................................................................................... 60
5.1.1 Relationship between dependent and independent variables ....................................................... 61
5.2 Levels of supply chain integration ...................................................................................................... 62
5.3 Barriers to supply chain integration .................................................................................................... 62
5.3.1.1 Sub Hypothesis.......................................................................................................................... 63
6. EMPIRICAL FINDING ............................................................................................................................ 72
6.1 Company Presentation .......................................................................................................................... 72
6.2 Reliability Analysis............................................................................................................................... 74
8

School of Business & Economics
6.3 Empirical findings for research question 1. ......................................................................................... 74
6.3.1 Descriptive statistics for information integration ......................................................................... 75
6.3.2 Descriptive statistics for coordination resource sharing ............................................................. 76
6.3.4 Descriptive statistics for organization relationship linkage ........................................................ 78
6.5 Empirical findings for research question 2. ........................................................................................ 79
6.5.1 Descriptive statistics for barriers to supply chain integration ..................................................... 79
7. ANALYSIS ............................................................................................................................................... 81
7.1 Research Question 1 .............................................................................................................................. 81
7.1.1 Level of information integration between Haleeb Foods and Distributors ............................ 82
7.1.2 The level of coordination resource sharing between Haleeb foods and Distributors ........... 84
7.1.3 Level of organizational relationship linkage between Haleeb foods and Distributors ........ 88
7.2 Research Question 2 ............................................................................................................................ 92
7.2.1 Sub hypothesis: .............................................................................................................................. 97
8. CONCLUSION ...................................................................................................................................... 103
8.1 Answer to research questions 1: .......................................................................................................... 103
8.2 Answer to research questions 2: ........................................................................................................ 104
8.3 Theoretical contributions ................................................................................................................... 105
8.4 Practical contributions ....................................................................................................................... 105
8.5 Recommendation for future studies .................................................................................................. 105
8.6Limitation ............................................................................................................................................ 106
9. REFERENCES. ....................................................................................................................................... 107
I- BOOKS REFERENCES: ................................................................................................................. 107
II- RESEARCH ARTICLES: .................................................................................................................. 112
III- WEBSITE REFERENCE: ............................................................................................................. 119
IV- PERSONS REFERENCE: ............................................................................................................. 119
Appendix I. ................................................................................................................................................ 120
Questionnaire ........................................................................................................................................... 120
Appendix II ................................................................................................................................................ 123
Appendix III .............................................................................................................................................. 124
Descriptive statistics ................................................................................................................................. 124
Appendix IV .............................................................................................................................................. 125
Appendix V ............................................................................................................................................... 126
Appendix VI .............................................................................................................................................. 127
9

School of Business & Economics
Appendix VII ............................................................................................................................................. 128
Appendix VIII ............................................................................................................................................ 131
Correlation tables of barriers to supply chain integration...................................................................... 131
Appendix IX ............................................................................................................................................. 134
Correlation tables of sub hypothesis ...................................................................................................... 134
List of Figures
Table Of Content ......................................................................................................................................... 6 Figure 1.2: disposition of thesis .................................................................................................................. 22 Figure: 3.1 Relationship with theory and Research question .................................................................... 37 Figure: 3.2 Research model of supply chain integration .......................................................................... 48 Figure: 5.1 Conceptual framework for research question 2 ...................................................................... 63 Figure: 5.2 Hypothesis between lack of information technology and dimensions of SCI ......................... 63 Figure: 5.3 Hypothesis between lack of information sharing and dimensions of SCI ............................ 64 Figure: 5.4 Hypothesis between lack of trust and dimensions of SCI ...................................................... 65 Figure: 5.5 Hypothesis between demand distortion- bullwhip effect and dimensions of SCI ................ 66 Figure: 5.6 Hypothesis between system incompatibility and dimensions of SCI ..................................... 68 Figure: 5.7 Hypothesis between lack of knowledge and dimensions of SCI ........................................... 69 Figure: 5.8 Hypothesis between cost of integration and dimensions of SCI........................................... 70
List of Tables Table: 1.1 Research justifications.............................................................................................................. 20 Table: 2.1 Types of scientific perspective ................................................................................................... 23 Table: 2.2 Difference between deductive and Inductive method .............................................................. 26 Table: 3.1 Variables of information integration in a supply chain ........................................................... 40 Table:3.2 Variables of coordination resource sharing in supply chain integration ................................. 42 Table: 3.3 Variables of organizational relationship linkage in supply chain integration ........................45 Table:3.7 Summary of the barriers to supply chain integration .............................................................. 56 Table 4.1 Economic indicators of Pakistan ............................................................................................... 58 Table: 6.1 Distributors of Haleeb Foods in Pakistan ................................................................................. 73 Table: 6.2 Testing cronbach's alpha .......................................................................................................... 74 Table: 6.3 Descriptive statistics for information integration ..................................................................... 75 Table: 6.4 Descriptive statistics for coordination resource sharing ......................................................... 76 Table: 6.5 Descriptive statistics for organizational relationship linkage ................................................. 78 Table: 6.6 Descriptive statistics for barriers to supply chain integration ................................................ 79
10

School of Business & Economics
Table: 7.1 Assessment of variables of information integration ................................................................. 83 Table:7.2 Level of information integration of Haleeb foods and its distributors ..................................... 84 Table: 7.3 Assessment of variables of coordination resource sharing ...................................................... 86 Table :7.4 Level of coordination resource sharing ................................................................................... 87 Table:7.5 Assessment of variable of organizational relationship linkage ................................................ 90 Table:7.6 Level of organizational relationship linkage .............................................................................. 91 Table:7.8 Correlation between supply chain integration ( II, CRS and ORL) and Barriers to supply chain integration ........................................................................................................................................ 95 Table: 8.1 Level of supply chain integration at Haleeb foods ................................................................. 104
List of Abbreviations
SC: Supply chain
SCI: Supply chain integration
SCM: Supply chain management
IT: Information technology
ERP: Enterprise resource planning
VMI: Vender managed inventory
EDI: Electronic data interchange
CRS: Coordination Resource sharing
ORL: Organization relationship linkage
II: Information integration
11
School of Business & Economics
1. INTRODUCTION The Introduction chapter provides an overview of what the motivation was behind
choosing this topic and what the purpose of this thesis was. This chapter contains
background, problem statement, research questions and the disposition of this thesis.
After reading this chapter the reader will be able to understand more about supply
chain integration and what are the levels and barriers between Haleeb foods and
distributors in Pakistan.
1.1 Background
1.1.1 Supply chain Integration
The concept of supply chain integration (SCI) has developed in the past decade;
almost every organization implements the supply chain integration to enhance the
performance of the business (Lau et al., 2010). According to the Lambert et al.,
(1998) supply chain performance depends on the integration. Supply chain integration
can be defined “as an association of customers and suppliers who work together to
optimize their collective performance in the creation, distribution, and support of an
end product”(National Research Council, 2000; p. 3). According to (Forslund and
Jonsson, 2007; pp. 547), “Integration is defined as two companies who jointly carry
out and agree upon activities in the supply chain”. Through supply chain integration,
organization tries to develop strong partnership and effective flow of information
links, alliance and cooperation (Power, 2005). The concept of supply chain integration
openly distinguished two kinds of flowers, goods and information in the whole chain
(Pagell, 2004 and Power, 2005). The supply chain integration’s purpose is defined by
Kaufman (1997; pp. 14) as “remove communication barriers and eliminate
redundancies” by practicing of coordination, monitoring and controlling process.
SCI involves the collaboration of tactical, operational and strategic level activities of
the organization (Alfalla-Luque et al., 2012). Furthermore, according to Bagchi and
Skjoett-Larsen (2002) there are three different dimensions have been seen in past
years which are recognized as supply chain resolutions in the organizations. First,
related to the integration of supply chain beyond the companies which intended cost
12

School of Business & Economics
reduction through the coordination and collaboration between the supplier and
customers. Second, emerging the supply structure characteristics within the individual
firm, outsourcing and logistics activities are a clear example of this dimension (Ibid) .
The last, third dimension belongs to the innovation and changes in the organizations
such as, reactive, more agile and intelligent (Ibid).
Now days, manufacturing firms must be involved to manage their business partners
upstream and downstream while managing their own business operations. This is the
need to become a single supply chain process (Ibid). Although the past years studies
funded by Froehlich and Westbrook , (2001); Rosenzweig et al., (2003); Bagchi et al.,
(2005); Li et al., (2009) cited in Alfalla-Luque et al .,(2012 ) that high level of
integration in the supply chain cause of greater the potential benefit of firms.
However, previous studies are suitable for different situation but never be the perfect
connection between the level of supply chain integration and performance
enhancement. Many descriptions and measures of supply chain integration have been
suggested, some study illustrated about the performance, some concentrating on the
relationship of SCI (Flynna et al., 2010). Moreover, Alfalla-Luque et al., (2012) have
a comprehensive study on the supply chain integration. The study discloses
information integration (II), coordinated resource sharing (CRS) and organizational
relationship linkage (ORL) are the main dimensions of SCI.
Information integration (II) stresses to the sharing knowledge and information within
the supply chain partners (Bagchi and Skjoett-Larsen, 2002). According to Cooper et
al., (1997) there is definitely a need for information integration of business operations
in the SC. A single business has impeccable information about itself, but there is a
basic requirement to have perfect information about other supply chain partners to
mitigate the uncertainties from the supply chain (Yu et al., 2001). The supply chain
integration is based on collaboration, coordination and information sharing, shared
technology, partnership and trust, between the manufacture and their customers’
(distributors) (Flynna et al., 2010). According to Lee, (2000) and after Alfalla-Luque
et al., (2012) highlight coordination resource sharing (CRS) discusses the
rearrangement and share the rouses of inter and intra-organization. Furthermore,
Bagchi and Skjoett-Larsen (2002) argues that CRS force to involve the supply chain
partners in decision making and joint them into same actions to balance the workload.
13
School of Business & Economics
Alfalla-Luque et al., (2012) describe that CRS is rearrangement of logistical activities
and optimize the operations through interconnection firms and departments in the
supply chain.
Bagchi and Skjoett-Larsen (2002) have described in their study about organizational
linkage which was (Lee, 2000) outline in the earlier study, they argue that ORL is
stressed to the communication channels between the supply chain partners. Likewise,
the description about ORL by Alfalla-Luque et al., (2012) that organizational
relationship linkage is a communication channel which expresses about the most
common performance indicators and aligned, share risks , costs and rewards and
become a bridge to link supply chain partners to seek mutual trust for customer
satisfaction.
Bagchi and Skjoett-Larsen (2005) describe that supply chain integration influence on
the performance of the companies. Furthermore, one of the focus points of the authors
was different levels (high, medium and low) of integration between the supply chain
partners. Both of the authors, Bagchi and Skjoett-Larsen, (2005) argue that there is
very tiny evidence about the level of integration of respondent firms. In the previous
research Bagchi and Skjöett-Larsen (2002) mentions that the factors like dominance
versus stable power in the supply chain, the maturing of the industry, degree of
completion and the nature of the product can influence the levels of supply chain
integration. Therefore, Bagchi and Skjöett-Larsen (2005) declare that high level
integration contains the close involvement of organization and joint decision making.
On the other hand, low-level integration includes nothing between organizations or
somehow less involvement.
Since the supply chain and partnership between supply chain parties’ three levels have
been discussed for the development, advancement and performance measurement
(Vrijhoef, 2011). For this research authors discusses the low, medium and high level
of supply chain integration. Though, the levels may fluctuate per factors of analysis
assessed (Ibid). Furthermore, the levels of supply chain integration affect the timely
availability of information, accurate information sharing, coordination of decision and
14

School of Business & Economics
ultimately effect the achievement goals of the organization and affect the overall
performance of the supply chain (LAN and Unhelkar, 2006).
Moreover, the definition of supply chain integration’s objective to create the
effectiveness in product flow, information flow, cash flow by providing value and cost
effectiveness to customers. Besides, this definition contains various important
dimensions which are given the importance to supply chain integration. Though
supply chain integration is achieving a mutual goal for supply chain partners, however
it creates trust, resolving the conflicts, sharing of information rewards and risk
between supply chain partners (Flynna et al., 2010). According to Bagchi and Skjoett-
Larsen (2005) the information integration and coordination resource sharing and
organizational relationship linkage are the main dimensions of the supply chain
integration.
1.1.2 Supply chain integration in food industry
In food industry, integration is a common practice between supply chain partners and
largely influenced by the customers (Bell and Cuthbertson, 2003). In this practice,
downstream supply chain partners agree to transfer demand and inventory status to up
stream’s supply chain partners (Lee, 2000). As a result of information sharing from
downstream to upstream lead to benefits and become the success factor for the whole
supply chain (Yu et al., 2001). The below figure shows the supply chain of the
15

School of Business & Economics
Haleeb Foods in Pakistan.
(Source: own ) Figure 1.1 Main focus of this thesis
1.2 Overview of Haleeb foods This study is about the Pakistani food industry, the authors took the maximum amount
of distributors of Haleeb foods (manufacturer) as an example of how supply chain
integration is practiced in a Pakistani business environment. Haleeb foods have more
than 200 distributors across the country; these distributors operate from 7 regional
offices divided by geography.
1.3 Problem discussion Under this section authors discuss about the levels of supply chain integration in the
dimensions of supply chain and what are the existing barriers to supply chain
integration that impede the process of supply chain integration.
1.3.1 Levels of supply chain integration Many organizations put a lot of investment in information systems and integration for
the accurate transfer information in the supply chain (Li and Williams, 1999; Weber
and Pliskin, 1996, cited in Rajaguru and Matanda, 2011). Recently, a literature review
study about the supply chain integration, describes that SCI has different meanings to
the different researchers and different organizations. Moreover, past years researches
Distributor
Product Flow
Information Flow
Two-way information
Area OF study
Manufacture
Wholesaler/retailer
Consumer
Supplier
16

School of Business & Economics
described about the impact of the high level of integration between the supplier and
customers’ performance, conversation, the studies did not find the clear relationship
between the levels of supply chain integration (Alfalla-Luque et al., 2012). The
question arises how can we differentiate the different levels of integration in the
supply chain? Because there is very little and unclear literature available on levels of
SCI, no one exactly highlight about high, medium and low levels of SCI.
Additionally, the authors of this research define the different levels of supply chain
integration. Authors checked these present levels of SCI in Haleeb foods with the
help of the proposed framework of supply chain integration. Different authors
explaining different dimensions of SCI according to their research need in the past.
For instance, according to Kotzab et al., (2005) there are six dimensions of supply
chain integration, which are as follows
o Customer integration
o Internal integration
o Supplier integration
o Technology and planning integration
o Measurement integration
o Relation integration
Furthermore, according to Lee (2000) and Bagchi and Skjöett-Larsen (2005) cited in
Alfalla-Luque et al., (2012) there are three dimensions of supply chain integration
which are as follows
o Information integration (II)
o Coordination and resource sharing (CRS)
o Organisational relationship linkage (ORL)
However, the authors follow these three dimensions which are described by Alfalla-
Luque et al., (2012) to find out the different levels in Haleeb foods in Pakistan.
In the developing countries the supply chain integration is usually not well organized
as compared to developed countries, due to the uneven nature of supply chain, a weak
communication infrastructure, lack of human and technical investment (Martinez and
17

School of Business & Economics
Poole, 2004). Food is one of the leading industries of Pakistan (Billah, 2013). Authors
selected dairy manufacturer “Haleeb foods” of Pakistan as above mentioned. There
are more intermediaries in distribution channels that clarify possibilities in supply
chain integration at minimal levels between them.
1.3.2 Barrier to supply chain integration
Mostly distributors and retailers fear from suppliers, who have knowledge of their
inventory, sales and management practices. Suppliers can take advantage of
that information to share with competitors, or use it in the way that
distributors/retailers can reduce profitability (Kinsey and Ashman, 2000). According
to Kinsey and Ashman, (2000) there are some possible barriers to integration that
affect the supply chain integration such as lack of trust between manufacturers and
distributors, incompatibility of information systems, lack of knowledge, price
variations, rationing game and demand signal processing leads to bullwhip effect.
Information integration is a source to enhance the effectiveness and efficiency across
the supply chain. Sometimes supplier and manufactures use information for self-
interest to increase opportunity of their business and weaken the performance of their
distributors and retailers (Bronte et al., 2009).
Katz and Shapiro (1994) illustrate major barriers to supply chain as lack of
expectations, lack of coordination and lack of compatibility between manufacturer and
distributor in their application systems of information integration. Very often, small
businesses have a lack of resources and the tendency to invest in business-to-
business systems. Likewise, incompatibility of hardware and software occur between
manufacturer and distributor.
Currently, dairy industry of Pakistan is facing a lot of difficulties such as lack of
information integration, lack of knowledge of IT and integrated system due to lack of
education, lack of financial and infrastructure facilities, which are the most ignored
aspects in the whole system of supply chain (Billah, 2013). Owen et al., (2009) has
also studied about Pakistan; they describe that in developing countries’ manufacturers
concentrate on producing products to get more profit. According to Sonia et al.,
(2012) the levels of collaboration depend on the need of companies, in other words
18

School of Business & Economics
companies do not share information without seeing any individual benefit. However,
minimum level integration indicates lack of order, demand for planning and
forecasting, and having difficulties in prediction of what the demand is. Though, these
levels of supply chain integration increase the inventory level (bullwhip ) for the
manufacturer (Hayat et al., 2012). Ningb et al., (2008) define that different objective,
priorities and interests of actors in supply chain that create diversity and conflicts in
supply chain, in Pakistan that practice is commonly used between manufacturers and
distributors. According to Ghani et al., (2009) Information integration is not an easy
process in Pakistan, due to lack of information integration they are not able to receive
or send feedback, update or other important information on them. As a result, the
inventory and transportation cost is increased as well as replenishment lead time
(Hayat et al., 2012).
Lack of integration in Pakistan from customers (distributors) to the supplier
(manufacturer) along the supply chain decreased the compatibility with other overseas
companies (www.scribed.com). This is therefore, Information technology plays a vital
role to increase coordination in Supply chain on the other hand decreasing
inconsistency and exploiting the benefit of effective information between supply chain
partners (Hayat et al., 2012). Sonia et al., (2012) discuss information sharing between
the supply chain partners in Pakistan where they do not let other partners know about
their information. Manufacturers and distributors think that information is their
property asset and if other partners get information about their operations they will
lose the competency. That leads to different priorities and personal benefits.
The main motivation factor for authors in doing this research is the unclear and less
literature on SCI particularly levels and barriers in developing countries like Pakistan
and existing research by Sonia et al., (2012) and Alfalla-Luque et al., (2012). Sonia et
al., (2012) find out the principal factors of supply chain integration in manufacturing
industries. However, manufacturing firms are still not much interested to provide
access to suppliers and customers. Before firms can recognize the cause of the
problems they face, there is a need to identify the state of supply chain integration first.
There is a lot of work to be done on supply chain integration in developing countries.
19

School of Business & Economics
The authors see this research being major contributing factors helping the food
industry of Pakistan.
Table: 1.1 Research justifications Inquiry Explanation Reference
Why the study on dairy
food manufacture and its
distributors
Dairy food industry one of the largest
industry of Pakistan.
(Billah, 2013)
Why the study on Haleeb
foods’ supply chain Leading dairy foods manufacture in
Pakistan with large market share.
(Billah, 2013);
(Awan et al., 2009)
Why the study of
integration between
Haleeb foods and its
distributors
Haleeb Foods faces a high level of
competition. Therefore to enhance the
competitiveness it is necessary to
consider integration within the supply
chain.
(Sonia et al., 2012)
What is the situation on
the Pakistani Foods
industry ‘s supply chain
integration
Unknown level of integration. No
report and literature available in the
dairy food industry.
(Sonia et al., 2012)
(Alfalla-Luque et al.,2012)
(Source: own)
The table above (1.1) is a clear justification of this research. The reader can easily
understand the motivation behind this research, which is why the authors are being
compelled to explore and research the levels and barrier to supply chain integration
between Haleeb foods and its distributors in Pakistan.
1.4 Research Questions Q1.Which level of supply chain integration exists between Haleeb foods and its
distributors in Pakistan?
Q2. Which barriers exist to supply chain integration between Haleeb foods and its
distributors in Pakistan ?
20

School of Business & Economics
1.5 Purpose The purpose of this research is to identify the existing levels of supply chain
integration by applying the supply chain dimensions (II, CRS, ORL) of SCI between
Haleeb foods in Pakistan and its distributors. Theory defines that developing countries
have a lack of integration between supply chain partners. Therefore authors aim to
identify the existing barriers to supply chain integration between the Haleeb foods and
its distributors. Consequently, these barriers are the cause of low level of supply
chain integration in Pakistan.
21
School of Business & Economics
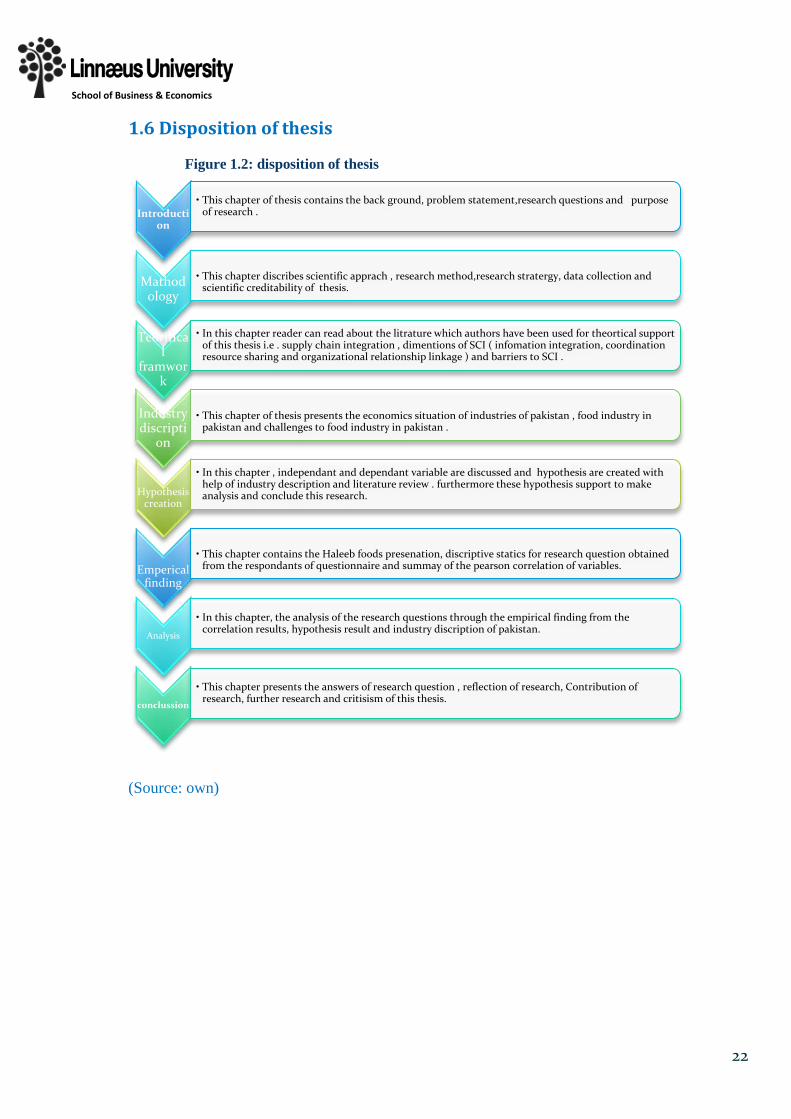
1.6 Disposition of thesis
Figure 1.2: disposition of thesis
(Source: own)
Introduction
• This chapter of thesis contains the back ground, problem statement,research questions and purpose of research .
Mathodology
• This chapter discribes scientific apprach , research method,research stratergy, data collection and
scientific creditability of thesis.
Teoritical
framwork
• In this chapter reader can read about the litrature which authors have been used for theortical support of this thesis i.e . supply chain integration , dimentions of SCI ( infomation integration, coordination resource sharing and organizational relationship linkage ) and barriers to SCI .
Industry discripti
on
• This chapter of thesis presents the economics situation of industries of pakistan , food industry in
pakistan and challenges to food industry in pakistan .
Hypothesis creation
• In this chapter , independant and dependant variable are discussed and hypothesis are created with help of industry description and literature review . furthermore these hypothesis support to make analysis and conclude this research.
Emperical
finding
• This chapter contains the Haleeb foods presenation, discriptive statics for research question obtained
from the respondants of questionnaire and summay of the pearson correlation of variables.
Analysis
• In this chapter, the analysis of the research questions through the empirical finding from the correlation results, hypothesis result and industry discription of pakistan.
conclussion
• This chapter presents the answers of research question , reflection of research, Contribution of research, further research and critisism of this thesis.
22

School of Business & Economics
2. METHODOLOGY This chapter describes the methodology of this thesis. Scientific perspective-positivism
adopted in this thesis. A survey as a research strategy is discussed in it. Furthermore,
this thesis contains the scientific approaches, research methods and data collection
methods. At the end, how the validity and reliability for the thesis is fulfilled.
2.1 Scientific perspective Scientific perspective concerns the matter of what is regarded as acceptable
knowledge in a particular discipline. Sometime it is also referred to as epistemological
consideration which means that how we know the things. Scientific perspective also
measures and seeks with having a good and complete knowledge of theory. In such a
way that how researcher relates theoretical part with empirical part. There are two
approaches to measure the scientific perspective i.e. Positivism and interpretivism
(Bryman and Bell, 2007).
Table: 2.1 Types of scientific perspective Positivist/post-
positivist
Interpretive/
constructivist
Purpose Predict, control ,
generalize
Describe, understand,
interpret
Type Experimental,
survey,
quasiexperimental
Phenomenology,
ethnography,
grounded theory,
naturalistic/qualitative
Reality Objective,
external , out
there
Multiple realities,
context-bound
(Source: Merriam, 2009; pp. 11)
23

School of Business & Economics
2.1.1 Positivism Positivism is an epistemological position and it is the study of social sciences and
beyond (Bryman and Bell, 2007). Positivism concerns the theory that an idea, thought
or concept is valuable only if it can be seen or measured in a real and actual way. In
this approach the researcher uses a general theory as an outline and a guideline that
has been followed throughout the research (McNabb, 2010). According to Valentine
and Aitken, (2006; pp. 20) “Positivism is a set philosophical approach that seeks to
apply scientific principles and methods, drawn from the natural and hard sciences to
social phenomena in order to explain them”. Positivism is the study of all discipline
i.e. Natural and social defines everything that can be familiar. In positivism,
hypothesis method is chosen which has been tested. Furthermore, in this approach
scientific knowledge would be based upon what is observed and experimented, rather
than belief or estimation of the researchers (McNabb, 2010).
2.1.2 Interpretivism According to Norman, (2007) interpretivism is the study of social science where
people have constructed their ongoing activities. Furthermore, Browne (2006)
describes interpretivism as how people understand and see their environment. The
method of interpretivism is used for those which involve collecting the qualitative
data, researcher more likely involve in depth, carry out the interview and find out how
they feel about doing work. Moreover it is necessary to understand the individual
motivation, meaning and act on those meanings. Bryman and bell, (2007) argue,
interpretivism only give stress on one single subject matter of the social science
however people basically different from the matter of natural sciences. Besides,
human behavior and attitudes must more oppositional relationship rather than cause
and consequence relationships. Hyde et al., (2004) illustrate, Interpretivism rejects the
positivism and improves the thinking that can only understand people’s interpretation
realities and social world.
2.1.3 Scientific perspective of this Study Since authors are using the existing theory as a base in the field of supply chain
integration. This is however; scientific perspective of this study falls into the
positivism approach, this is supported by Bryman and Bell, (2007, pp. 16) “the
purpose of theory is to generate hypotheses that can be tested and that will thereby
24

School of Business & Economics
allow explanations of laws to be assessed”. Furthermore, difference between theory
and research was done and theory has been tested in order to generate new knowledge.
The authors of this research were used statistical methods (Pearson correlation) for
analysis of social reality. The authors collected observations as a result , which were
not influenced by pre-existing theories.
2.2 Scientific Approach The basic phenomenon of the scientific approach is to find out that how the people
work for achieving their goals. For this purpose, we need to understand how the
concept of systematic narrates makes a good scientific answer (Steven and Kemp,
2004). In fact, the answer should be addressing the question that a certain method is
appropriate to improve the work (Dubois and Gadde, 2002). There are mainly two
different scientific approaches, deductive and inductive approaches that are being used
for conducting research.
2.2.1 Deductive approach Deductive method is a common observation point between research and theory. The
researcher concludes with the hypothesis, and offers possible solutions that can be one
or more to detective the theory that recommended in the study (Bryman and Bell,
2007). A deductive approach is better to a positivist paradigm. Furthermore, the
deductive approach research needs to be operationalized therefore the facts can be
measured (Collins, 2010) .
According to Sachdeva (2009) there are four stages of deductive reasoning:
1) Thinking up a theory about subjects of interest
2) Creating hypotheses to be tested
3) Gathering observations to test hypotheses
4) Confirmation or detection of the original theory
2.2.2 Inductive approach The inductive method is a process that begins with specific observations and then
filter data based on situation and moves towards the generalization and idea. A
25

School of Business & Economics
number of possible hypotheses help to formulate and ultimately end in a general
conclusion and theories. Inductive approach is more efficient and reliable techniques
for problem solving (Vandenbosch, 2003). The inductive method is a traditional and
untested, which is related to the exploratory study, where understanding and
experience is not provide the clear results of the theory (Hyde, 2000).
Table: 2.2 Difference between deductive and Inductive method Deductive Inductive
• Scientific principles • Gaining and understanding of meaning human attached to events
• Moving from theory to data • A close understanding of the research context
• The need to explain casual relationships between variables
• The collection of qualitative data
• The collection of quantitative data
• A more flexible structure to permit changes of research emphasis as the research progress
• The application of control to ensure validity of the data
• A realization that the researcher is part of the research process
• The operationalization of concepts to ensure clarity of definition
• Less concern with the need to generalize
• A highly structured approach
• Researcher independence of what is being researched
• The necessity to select a sample of sufficient size in order to generalize conclusions
Saunders et al., (2009; p. 127)
2.2.3 Scientific Approach to this Study The scientific approach of this research is deductive in nature. Moreover, this research
is based on theory and leading towards the result. Furthermore, descriptive statics
were used for identifying the existing level of supply chain integration Also, the
authors have created hypotheses to test the empirical finding of the barriers to chain
integration between Haleeb foods and its distributors in Pakistan. In deductive
approach, researcher use the existing theory and having a control on validity of data,
26

School of Business & Economics
clarity of definition and independency in research (Saunders et al., 2009). This
research is survey based. Moreover, the information and data gathered to test whether
the hypotheses actually support to the research questions (Anderson, 2004).
2.3 Research Methods Research method is a technique that is used to gather data from different sources
(Bryman and Bell, 2007). The reason to get information is used for problem solving
(Ghauri and Gronhaug, 2005). There are two most common methods of business
research, one is quantitative research method and second is a qualitative research
method. Below table is described about the characteristics of qualitative and
quantitative research methods.
Table: 2.3 Characteristics of qualitative and quantitative research
(Source: Merriam, 2009, pp. 18)
Point of comparison Qualitative research Quantitative research
Focus of research Quality (nature, essence) Quantity (how much, how many)
Philosophical roots Phenomology, symbolic
interactionism, constructivism
Positivism, logical empiricism,
realism
Associated phrases
Fieldwork, ethnographic,
naturalistic, grounded,
constructivist.
Experimental, empirical, statistical
Goal of investigation
Understanding, description ,
discovery, meaning , hypothesis
generation
Prediction, control , description ,
confirmation, hypothesis testing
Design characteristics Flexible, evolving, emergent Predetermined, structured
Sample Small , nonrandom, purposeful,
theoretical Large , random representative
Data collection Researcher as primary instrument,
interviews, observation, documents
Inanimate instruments ( scales,
tests, Surveys, questionnaires ,
computers)
Primary mode of analysis Inductive, constant comparative
method Deductive, statistical
Finding Comprehensive, holistic,
expansive, richly descriptive Precise, numerical
27

School of Business & Economics
2.3.1 Qualitative Research method “Qualitative method involves a researcher describing kind of characteristics of people
and even without comparing events in terms of measurements or amounts” (Thomas,
2003, p1 ). Qualitative research is a method of investigation working in many
different kind of academic disciplines, usually in the social sciences, but also in
research and further perspective. Qualitative researchers aim to gather a
comprehensive understanding of human behavior. The qualitative method investigates
why and how is the decision making occur (Denzin et al., 2005). The researchers are
being allowed to use the personal experience of the participants, how he perceived and
formed the meaning of objective instead of testing it by qualitative research method
(Corbin and Strauss, 2008). In qualitative research data are collected in a natural
setting, means the researcher has face to face interaction. Data is collected from the
field where participants experience the problem. Data can be collected in the form of
interviews, observations, and documents (Creswell, 2009). (Maynard et al., 2002)
states that qualitative research is enhanced to calculating quality, belief, attribute and
performance as compared to quantitative research.
2.3.2 Quantitative research method “Quantitative method focuses attention on measurements and amount more and less,
larger and smaller, often and seldom, similar and different of the
characteristics displayed by the people and events that the researcher studies”
(Thomas, 2003, p1). Quantitative research is a resource for testing the theories, by
investigating the relationship between different variables. Research is able to quantify
in numbers. Different statistical procedures are used to analyze data, which decide
whether the theory is true or false. This method builds protections against business
and improves the credibility of quantitative research (Creswell, 2009).
2.3.3 Research method of this Study The authors adopted quantitative method of research because the thesis focus on
collected data from respondents through a questionnaire. Furthermore, the research is
based on the numeric statistical data using closed ended questionnaires, collected data
analysis through statistical techniques (SPSS). Questionnaires were sent to the
28

School of Business & Economics
distributors via e-mails with help of Haleeb foods representative. This nature of
research is completely under the supremacy of the positivistic quantitative approach
(Shekedi, 2005).
2.4 Research strategy According to Blaikie, (2009; pp. 18) “Research strategy provide a logic or a set of
procedures, for answering research questions, particularly “What” and “Why”
questions”. Saunders et al., (2009) describe the different types of research strategies
such as experiment, survey, action research, archival research, grounded theory, case
study and ethnography that will guide the researcher to answer the research question.
However, this research is a survey based that’s why authors describe about the survey
only.
2.4.1 Survey According to Gray, (2006) the systematic way of collecting data is named as a survey.
Groves et al., (2011) define survey is creation of data collection progression. It does
not matter how you collect data whether by questionnaire, interviews, observation
method. Another author describes that survey identifies the principle about the
collection of data, processing and design the study (Groves et al., 2009). There are
three important aspects to designing a survey research such as measurements,
sampling and questionnaire design. This method gives the understanding about the
appropriate decision to make for required study. Also this methodology is a very
broad term but survey methodologies has to decide which method is appropriate and
write for the particular survey (Robert et al., 2009). Survey always conducts of the
real world’s unrestrained situation and very much affected by the situations. The
researcher makes the important decisions on the bases of many individuals’ features,
this important decision comprises how will identify the sample, what approach will be
used, how much researcher committed ?, Potential interviewers will involve an effort
of researcher (Groves et al., 2009). Survey data always gathered at the time of
interview and getting the answer after questionnaire (Grover et al., 2011).
2.4.1 Research strategy of this study This research intended to find out the existing level and barriers to supply chain
integration between Haleeb foods and its distributors. Survey normally uses for large
29

School of Business & Economics
population in quantitative research in a highly economical way (Groves et al., 2009).
Therefore, survey is suitable strategy for this research because of large numbers of
distributors (200) of Haleeb foods. A questionnaire was used as main techniques for
the survey and sent out to distributors in order to collect relevant information for
completion of this research. By using a survey strategy, researchers have more
control of the research process. Cropper et al., (2009, pp. 567) argues that “The
quantitative data of analytical survey are analyzed by statistical tools to produce
numerical results from which conclusions can be inferred”. As a result, the authors
have concluded the existing levels and barriers to supply chain integration between
Haleeb foods and its distributors in Pakistan.
2.5 Questionnaire Questionnaire technique is widely used in data collection method, defined as
“questionnaire is a standardized set of question to gain information from a subject”
(Gratton and Jones, 2010; p 126). Mostly two types of questionnaire are used in data
collection such as open-ended questionnaire and closed–ended questionnaire, in open-
ended respondents are allowed to answer by using their own choice and in the closed -
ended questionnaire, respondents use the alternative and multiple choice to answer the
questions (Bryman and Bell, 2007). A successful questionnaire is depending on how
to ask and design the questions; following are some guiding rules for questionnaire
design (Kumar, 2008).
• The questionnaire should be used in an informal way.
• Questions should be asked same to same as in the questionnaire.
• The questionnaire must be well planned and in perfect sequence which
supporting conversational atmosphere.
• The questionnaire should be consist on specified questions.
• Clarification in asking the questions that are misunderstood by the
respondent.
• The questionnaire should be correct and accurate according to coding of
questions.
2.5.3 Questionnaire design of this study
30

School of Business & Economics
According to the thesis time span, the authors have designed questionnaire in PM04.
With the guidance of tutor and examiner. While designing questionnaire authors used
five Likert scales (strongly disagree, disagree, neutral, agree and strongly disagree) for
rating the questions. These questions are also designed as direction statement, for
example the answers should be “agree” or “disagree” (Nardi, 2003). The authors
have made recommended mode of questionnaire by the theory that was convenient for
the respondents. Likewise , questions are precise, clear, time saving and easy to
understand. It contains four parts, first three parts related to SCI dimensions and last
one related to the barriers to supply chain integration.
2.6 Population Acceding to Cohen et al., (2007) population is a research interest should be connected
with the purpose of research. In the thesis, the authors worked with 200 distributors of
Haleeb foods. Therefore, the total population of this research is 200 distributors.
Haleeb foods is a Pakistan's leading food company with 28 years of providing its
customers with great tasting, healthy food products and beverages. A Haleeb foods
was market leader in the past year having 52 % market share of Pakistani dairy food
industry (www.haleebfoods.com). The majority of respondents is the owner, middle
and senior managers of the companies and also they have been served many years in
the dairy foods industry. All the participants of this survey are related to the supply
chain of Haleeb foods. This study population depends on resources including the time
and money besides that, to make sure the population is accessible for data collection
and help to complete the research (wood and Ross-Kerr, 2011).
2.7 Data Collection The first step of data collection is gathering the task understanding, gathered
information investigated given task with the support of the theory. The outcome of a
task is built up clear representation of observable fact (Weller and Romney, 1988).
There are two types of data which is collected inside any type of study named as
primary and secondary. In the research, data collection makes the relationship
between empirical and theory (Eriksson and Anne, 2008). Furthermore, data normally
31

School of Business & Economics
gather from different sources by using different data collection methods (Bryman and
Bell, 2007).
2.7.1 Primary Data Collection Data collected by own- self is called primary data and normally use in quantitative
method. The primary collection method includes such as observation, surveys,
interview, questionnaire, computer dialogue, email and personal interviews (Kotler
and Armstrong, 2001; Hair et al, 2003). The primary data provide first-hand
information to researcher to give basic information about the object. Furthermore,
the choice of data collection depends on the purpose of the study (Kumar, 2005).
2.7.2 Secondary Data Collection Secondary data collected by other researchers and used in a study to save time,
money, raise the quality of available data and give more time to compare and analyze
the collected data (Bryman and Bell, 2007) it can be easily accessible through
informal interview, observation or scanning available information (Hair et al., 2003).
Moreover, secondary data is helpful to the researcher and considering how to answer
the research question to meet their objectives of the study (Saunders et al., 2009).
According to (Kothari, 2006) for using secondary data researcher must be careful
about the reliability, suitability or adequacy of the data for the required study and it is
very uncertain to use already available data.
2.7.3 Data collection method of this Study In order to analyzing the collected empirical data, authors conducted an e-mail survey
and sent questionnaire to the Haleeb food’s distributors. For this study, the authors
used both primary and secondary sources for data collection. For primary data
information about research collected through a questionnaire. A questionnaire was
consisted of closed ended questions that helped the respondents to answer easily . For
secondary data collection authors used books, articles and journals, Linnaeus
university library databases such as Emerald and Google scholar for the theoretical
part of this study.
32

School of Business & Economics
2.8 Data Analysis Quantitative data analysis has three types, univariate, bivariate and multivariate.
Furthermore, in univariate only one variable analyzes, in bivariate there are two
independent and dependent variable’s relationship are analyzed and in multivariate,
three or more variables are analyzed (Greasley, 2008; Brym and Bell, 2007).
Moreover, statistical tests can either be descriptive or inferential, while descriptive
statistical tests disclose how the values of a variable are distributed, either the normal
data distribution or unusual distribution of data (Williman, 2011).
2.8.1 Data analysis of this thesis In this research, the authors described the supply chain integration as independent
variables and barriers to supply chain integration as dependent variables. Furthermore,
Pearson correlation analysis performed according to the bivariate application in this
research. This quantitative technique for data analysis is appropriate and gives richer
finding details and gives opportunity for greater explanation (Gratton and Jones,
2010). The descriptive statistics were used to answer research question 1 that which is
the existing level of supply chain integration between the Haleeb foods and its
distributors. Likewise, the hypothesis were also tested to answer the research question
2 that there is significant impact between the levels of information integration,
coordination resource sharing and organizational relationship linkage and barriers to
SCI by using SPSS . To check the reliability of the respondent’s answers, cronbach
alpha test and descriptive statistics were used that showed the high reliability of the
data.
2.9 Scientific creditability
2.9.1 Validity Cohen et al., (2007) define validity as “Validity is an important key to effective
research”. Validity required for both qualitative and quantitative research methods. By
resulting the question of the collected data it’s more about the validity (Sanders et al.,
2009). According McBurney and White (2009) to there are four types of validity must
be considered in the research designing such as internal validity, external validity,
construct validity, statistical validity
33
School of Business & Economics
Internal validly: logical relationship between independent and dependent variable discuss in internal validity
Statistical validity: it is very similar to internal validity but normally its use to measure the cause –effect relation between dependant and dependant variable.
External validity: this type of validity refers to the degree to which the result can be generalized to the wider population, cases or situation.
Construct validity: construct validity is one of the toughest validity to attain because it includes the indefinite number of theories it may be a reason of legitimate relationship.
2.9.2 Validity of this thesis The validity of our thesis passed out along with different ideas and individuals. The
vigilant selection of organization for the proper investigation, appropriate choice of
analysis techniques as well as our experts (tutor and examiner) in that area.
Furthermore, the survey questions based on the relevant theory that helped us to know
the current supply chain integration and levels of supply chain integration between
Haleeb foods and its distributors. The theoretical data was collected from reliable
sources such as the journals, textbooks, and publications. As a result this all help to
achieve the possible validity of the thesis.
2.9.3 Reliability Scale of regularity and stability of the application of the study schedule in excess of
time is called the reliability. Aptitude of people often performs and behaves in
different ways on different time and situation (Bryman and Bell, 2007). It means
achieving the constant result from measuring; if a study gives the same results when it
is used to measure the same object, under the same procedures. And some time if the
result is exact in a new study that may be done by anyone, as it was in the previous
study then it will be called the high reliable scale (Graziano and Raulin, 2007) .
2.9.4 Reliability of this thesis To ensure the reliability authors have given proper attention on collecting the
empirical data from the company’s resource persons. Furthermore, for the
development of questionnaire authors have put a lot of efforts to review the industrial
situation of Pakistan as well as relevant literature . To acquire good attention of
34

School of Business & Economics
respondents, the questionnaire had been designed in an easy and time saving way for
the respondents to fulfil the survey requirements. The collected responses and result
of analysis were checked accurately and compared them to check the reliability of the
thesis by the authors.
35

School of Business & Economics
2.10 Summary of this chapter Figure: 2.4 .Summary of this chapter
(Source: own)
Scientific Perspective
•The scientific perspective of this thesis is "Positivism"
Scientific Approach
•The sceientific approach is thesis is "Deductive" .
Research Method
•This thesis fall in to the "Quantitative" research method.
Research Strategy
•Research strategy has been adopt in this thesis is " Survey".
Data Collection
Method
•Primary source of data collection •Secondary source of data collection
Data analysis
•pearson corrletion , realability analysis
Scientific creditability
•Realiability •Validity
36

School of Business & Economics
3. THEORETICAL FRAMEWORK
The chapter describes the supply chain integration, levels of supply chain integration
between manufacturers and distributors, and what are the existing barriers to SCI in
Pakistan. Furthermore, the theory chapter support to the research questions and
purpose of this research. Selected theory has been used in the analysis chapter for
creating the result of this research.
This model is showing the relationship between research questions and theory .
Figure: 3.1 Relationship with theory and Research question
(Source: own )
• 3.1 Supply chain integration • information integration • Coordination and resource sharing • Organizational relationship linage
1.Which level of supply chain
integration exists between Haleeb
foods and its distributors in
Pakistan?
• 3.2 Barriers to Supply chain integration • Lack of IT in SC • Lack of Information sharing • Lack of trust • Demand distortion - bullwhip effect • Demand signal processing • Rationing game • Order batch • Price variation
• Incompetability of Information system • Lack of knwledge • Cost of integration
2- Which barriers exist to
supply chain integration
between Haleeb foods and its distributors?
Research Questions
Theory
37

School of Business & Economics
3.1 Supply chain integration According to Mangan et al., (2008 pp. 250) “Supply chain integration is the alignment
and interlinking of business processes, collaboration is a relationship between supply
chain partners developed over a period of time”. Supply chain integration helps to
achieve the competitive advantage for companies. Supply chain integration aims at
improving the quality and reducing the costs by using fast and accurate information
sharing across two or more companies. Furthermore, Supply chain integration
indicates a collaborative of both inter and intra-organizations management on
operational, tactical and strategic activities in order to work as a single entity that lead
improve management decision making (Tsinopoulos and Bell, 2009).
According to Lee (2000) cited in (Alfalla-Luque et al., 2012) discuss three dimensions
of SCI as information integration (II), coordination and resource sharing (CRS) and
organizational relationship linkage (ORL). However, Bagchi et al., (2005) cited in
(Alfalla-Luque et al., 2012) outlined five dimensions of supply chain integration as
Information sharing and communication across the SC, Collaboration is leading to
risk, cost and gain sharing, coordination and shared decision making with network
partners, sharing of skills, ideas and institutional culture and organization. Dimensions
of SCI identified by Lee (2000) and Bagchi et al., (2005) are rather similar. The key to
supply chain integration is to develop relationships with upstream suppliers and
downstream customers to measure the level of integration as well as classify the
performance measure (Alfalla-Luque et al., 2012). However information integration is
an enabler of supply chain integration (Tsinopoulos and Bell, 2009) because the
integration between upstream and downstream members is possible with information
sharing and communication (Alfalla-Luque et al., 2012).
3.1.1 Dimensions of supply chain integration Alfalla-Luque et al., (2012) Stated that supply chain integration has three dimensions
which are described below.
1. Information integration
2. Coordination and resource sharing
3. Organizational relationship linkage
38

School of Business & Economics
3.1.1.1 Information integration One of the significant subjects in managing a supply chain process is information
integration among its partners. To enable the integration, supply chain information
resource must be efficiently controlled and shared. Information integration provides
networks that transfer information from one supply chain partner to another (Chandra
and Grabis, 2007).
Information integration allows management to observe the operations of the
organization as a whole rather than uneven manner. Avoiding uncertainty in SC ,
information integration involves the sharing of appropriate information and
knowledge among members of the supply chain (Dam and Larsen, 2005).
Lee et al., (2000) argue that information integration contributes and sharing important
information by using the information technology within the supply chain partners.
Furthermore, information technology can integrate the supply chain partners through
system integration, application and data integration (Berente et al., 2009). Lee et al.,
(2000) also illustrate that information integration is a core objective of supply chain; it
helps to communicate the required information for decision making. Therefore,
according to Prajogo and Olhager (2012) information flows from downstream to
upstream support the material flow reciprocal from upstream to downstream. On the
other hand, information integration supports two basic concepts, technical which lead
to information technology and other social concept that leads to information sharing
and trust, for example some studies focus on adapting technology and some studies
emphasis on the information sharing between supply chain partners (Prajogo and
Olhager, 2012).
Also information integration is helping in such activities as reduced cycle time,
increased prominence of transactions, reduced transaction cost, better tracing and
tracking and give greater competitive advantage to all the partners in the supply chain.
As a result, the level of information integration shows how closely cooperation and
coordination are harmonized among the parties (Dam and Larsen, 2005).
39

School of Business & Economics
Table: 3.1 Variables of information integration in a supply chain What goes on How accomplished
1. Information sharing
2. Information technology integration
3. Collaborative planning
4. Joint demand forecasts
5. Joint replenishment forecasts
To share the information across the various functional departments of the organization and with supplier and customer organization to improve the decision-making
To make compatible the information system so as to allow accesses to information concerning the activity of the company from different department and companies that make up the supply chain To make available to the various companies with information that allow joint planning that takes into account the companies involved and seek to improve the planning process of comprehensive SC To have real –time information directly from the end customers to make a common demand forecast in order to avoid disruption To have sufficient information to perform the procurement activities that meet real needs
(Source: Alfalla-Luque et al., 2012; pp. 10)
Above table contains the different variables which are strongly supported the
dimension of supply chain integration, these variables are discussed below:
3.1.1.1.1 Information sharing According to different authors i.e. (Lee, 2000; Simatupang et al., 2004; Piplani and
Fu, 2005 ; Simatupang et al.,2002) point of views about the information sharing and
decision synchronization are the mode of supply chain integration, information
sharing is all about the exchange knowledge and information between the supply
chain partners. For example, a customer share information with retailer and retailers
pass this information to distributors and finally manufacture avoid big variations in
production and prevent the inventory level high in the supply chain. In that level of
sharing information among the supply chain partners get involved in joint decision
making that remove the uncertainty from the SC (Simatupang et al., 2004).
3.1.1.1.2 Information technology integration Since the last decade, integration has become the key aspect of the performance of the
supply chain. The interdependency of supply chain partners becomes a cause to raise
40

School of Business & Economics
the importance of integration processes in the supply chain processes like, sharing of
information, information technology and technical support (Cochon & Fisher,
2000:Tsay, 1999; Disney & Towill, 2003). Due to lack of integration and coordination
increase the cost of production, increase the inventory level, logistics cost as well as
increase replenishment lead time. There is a reason to use the advance information
technology in the supply chain that can increase integration by reducing uncertainty,
increasing the communication and coordination that influence the decision making
between supply chain partners (Sheomba, 1997). The inventory replenishment can be
done timely and accurately due to increasing communication capability that is
possible with the help of latest information system and technology (Handfield 1994;
Shapiro et al., 1993).
3.1.1.1.3 Collaborative planning Companies try to get competitive advantage through the collaboration with other
business partners, this called supply chain integration (Petersen et al., 2005).
Improvement in the information technology, companies try to involve the joint
planning for the supply chain performance (Alfalla-Luque et al., 2012). Furthermore,
the greatest benefit of the collaborative planning in the supply chain is the better
communication and information sharing among the supply chain partners and make
big change in the traditional business relationship. However, collaborative planning is
required the high quality of information sharing (Petersen et al., 2005).
3.1.1.1.4 Joint demand forecasts Supply chain members forecasts demand of a product individually and each member
accomplished of joining forecast apprises in the replenishment process. In that
scenario the demand forecast relates to the supplier or buyers. Because of the
decentralized structure of information supply chain members do not share the
inventory status (Aviv, 2001). According to Alfalla-Luque et al., (2012) avoid the
disruption of the demand in the supply chain need to real time and direct information
from end consumer to manufactures. Most companies heavily invest in the
information system and technology to manage the inventory challenges with high and
low demand (Lindsey and Pavur, 2008).
41

School of Business & Economics
3.1.1.1.5 Joint replenishment forecasts Information integration improves the quality of decision-making, reduce demand
uncertainty, and, ultimately, improve supply chain performance. Previous researches
describe advantages of collaboration i.e. Improved supply chain performance in
several core areas, including increased sales, improved forecasts, more accurate and
timely information, reduced costs, reduced inventory, and improved customer service
(Whipple and Russell, 2007). By attaining high service levels of the accurate product
in the perfect place with the help of better demand forecast and accuracy in
replenishment plan across the supply chain (Seifert, 2002).
3.1.1.2 Coordination resource sharing The coordination and resource sharing appreciate organizations for working together,
and it depends on the mutual trust and requirements between the supply chain
partners. This is however, difficult to remove the barriers and obstacles from the
department and organization in the integration process (Alfalla-Luque et al., 2012)
.When the less coordination diagnoses between the supply chain partners, and
production capacity planning is showing the imbalance, its mean the rearrangement is
required between the supply chain partners. Furthermore, the logistics features are
very essential like delivery agreements, common logistics equipment have high
impact on cost, outsourcing reform, quality and agility and packaging customization
(Ibid). According to Lambert et al., (1999); Bagchi and skjoett-Larsen (2002) all the
customer and supplier have different level of integration it depend on the originations
mutual interest.
Table:3.2 Variables of coordination resource sharing in supply chain integration What goes on How accomplished
1. Shared decision-making
2. Cooperation
3. Work realignment
4. Reorganization of outsourcing common use of
third party logistics
To involve to the SC members in decision making and to delegate to the member with the best negotiating position to lead the relevant decision making
To realize of joint actions to achieve the same end. To plan the workload in a balanced way among the links in SC To search for an optimal subcontracting for the entire SC, with special emphasis on logistics providers
42

School of Business & Economics
5. Packaging customisation/standardization
6. Agreements on delivery frequency
7. Common use of logistics equipment/ containers
8. Process integration
To design and joint development of packaging to facilitate handling and transport, reduce cost To search optimization in the procurement and distribution of materials throughout the SC To use containers, packaging and transportation common to facilitate handling operations, loading and unloading Use a process approach that allows the direct interconnection between departments and companies and avoids duplication
(Source: Alfalla-Luque et al., 2012; pp. 10)
3.1.1.2.1 Shared decision making Effective decision making can be possible and implemented if the information is
shared and level of trust among potential partners should be high. Limited and low
level of information sharing create problem while making decisions in the supply
chain. The strongest relationship among supply chain partners is due to cooperation
and that leads to effective decision making (Chandra, 2007).
3.1.1.2.2 Cooperation The highest level of supply chain integration is the due to planned cooperation
between activities and it also required for the stability of the supply chain.
Cooperation is also helpful in required decision making (Qin, 2010). High reliability
cooperation is characterized by the high level of trust and resource sharing ( Seuring
and Goldbach , 2002).
3.1.1.2.3 Work realignment Supply chain management required different actors to work together in a balanced
way to achieve common goal. It needs to be managed coordination and cooperation
among the partners of the supply chain to facilitate information sharing as well as to
work in a better way (Jespersen and Skjott-Larsen , 2005).
3.1.1.2.4 Reorganization of outsourcing common use of third party logistics Outsourcing becomes very common practice in many industries. Lower the product
cost is due to the reliance on the outside suppliers and on the other hand it provides a
high level of product and service quality. Furthermore, outsourcing is also helpful for
improving buyer supplier relationship ( Wisner, 2008).
43

School of Business & Economics
3.1.1.2.5 Packaging customization standardization According to Handfield and Nichols (1999) it is important that manufacturers manage
their own business operations also need to get involved with upstream and
downstream firms network. (Frohlich and Westbrook, 2001) argue that manufacture,
distributors should make a common integration strategy that can enhance the
performance of supply chain integration.
3.1.1.2.6 Agreement on delivery frequency The customer satisfaction always provides the delivery frequencies without any
interruption. Furthermore, this may enhance the transportation cost on the other hand
reduce the inventory cost but if we compare the overall benefits of supply chain than it
boost up the operation as well as whole supply chain. These practices of frequent
deliveries are rather common in retail chain (Spole, 2012).
3.1.1.2.7 Common use of logistics equipment/ containers Products move from the supplier to retail shelves with reliability and predictability to
fulfill the customer demand and to get a major market share common use of logistics
equipment is a common practice. Which is enhancing the business value for the
retailers or distributors as well as the entire industries. This common activity, is also
effective for the planning, implementing controlling process and efficient the services
for example storage of goods and related information from end users to supplier and
ensuring the customer's requirement. Furthermore, common use of logistics equipment
creates a comparative advantage and higher the level of logistics estimable whole
supply chain (Grawe, 2009).
3.1.1.2.8 Process integration “The term process integration means sharing information and coordinating resources
to jointly manage a process or processes” (Wisner, 2011; page 449). Consequently
Process integration is the essence of supply chain management. For process
integration in any company supply chain members have need of trust and cooperation
among them. Process integration maintaining and creating successful relationships
with customers (Wisner and Stanley, 2008). Lack of process knowledge among the
supply chain partners and within the firm can lead to the bad and downfall activities of
the supply chain ( Wang et al., 2007).
3.1.1.3 Organizational relationship linkage
44

School of Business & Economics
Organizational relationship linkage (ORL) encompasses stable relationship between
supply chain partners, which involves objective and common vision, sharing of ideas,
sharing of skills, cultural and institutional performance measures. In ORL clear
strategic vision is required to achieve common objectives and vision, to overcome
risk, promote rewards, reduce costs, develop skills and define joint performance
measure (Alfalla-Luque et al., 2012). In recent years, many organizations seek to
work with their suppliers and customers so various organization changes their attitude
toward their suppliers and customers. Consequently, supply chain integration help to
develop long-term relationship among supply chain partners (Ibid).
Table: 3.3 Variables of organizational relationship linkage in supply chain integration
(Source: Alfalla-Luqueet al., 2012; pp. 11)
3.1.1.3.1 Design and maintaining of communication channels Communication channels and networking among the members of supply chain help in
business policies and tasks. Furthermore, help to reduce the inventory level and
distortion in the communication of information (Ross, 2011). In supply chain,
information sharing is one of the factors that contribute to the better and stronger
relationship as well as also improve responsiveness and coordination within a buyer-
What goes on How accomplished
1. Design and maintaining of communication channels
2. Laying down performance measures
3. Incentive realignment
4. Integrated behavior
5. Joint establishment of objectives for all parties in the chain
6. Sharing of skills, Ideas and institutional culture
7. Drawing up of contingency plans for quick problem
solving
8. Forging and maintain long term relationship
9. Creating teamwork along SC and cross-functional teams
To communicate using an active communication channel with members of the SC To establish common performance indicators and aligned / consensus that reveal the evolution from the stated objectives To share risks , costs and rewards (operational and strategic collaboration) To promote attitudes and plans of action to promote an integrated business performance To guide organizations toward a joint search for the end customer satisfaction To disseminate of best practices among members of the SC To establish procedures under the normal orders of the companies against possible environment or business unexpected situations To establish stables links with partners to enable mutual trust To encourage team building to allow for coordination and active cooperation between member of different departments and companies in the SC
45

School of Business & Economics
supplier relationship. The critical examination of information systems must by the
supply chain managers within and outside of the firms to support the productive
relationship with suppliers. Firstly, the firm must know its insufficient leverage of
information sharing and collaborative efforts prior to adopt specific technology that
helps the inter firm communication systems. Furthermore if a firm wants to leverage
information systems must think about its objectives of doing investments and the
future impact (Hsu et al., 2008).
3.1.1.3.2 Laying down performance measures A successful integration between all the activities of supply chain leads to high level
of performance measurement. For having the focus on performance measurement
system the firm must have a proper understanding of the external and internal business
processes, a continuous improvement in meeting customer’s requirement that lead to
meet the business objectives (Chan et al.,2012).
3.1.1.3.3 Incentive realignment Incentive alignment in supply chain integration is that in which risk and gains of
integration are equally shared (Harrison et al., 2004). In ORL the incentive
realignment is one of the elements of performance measurement and incentives such
as rewards structures and cost (Dudek, 2009).
3.1.1.3.4 Integrated behavior For effective and efficient flow of product and services to the customers due to
effective supply chain integration. Furthermore, make effective plans to provide
maximum satisfaction to the customers at lower cost as well as to promote business
performance (Flynn et al., 2011).
3.1.1.3.5 Joint establishment of objectives of all parties in the chain The relationship of supply chain parties improves with the help of communication and
activities regarding problem solving between organization. In addition, partners
should use an objective performance measurement system to make sure that partners
have established objective. Furthermore, these activities lead to more improvement in
the supply chain (Handfield and Nichols, 2002).
3.1.1.3.6 Sharing of skill, ideas and institutional culture The relationship between supply chain partners is required for supply chain
integration. This is therefore, create a deeper cooperation between partners, ability to
46

School of Business & Economics
learn and sharing new skills, rewards and ideas and mutual trust. Furthermore,
Sharing of skills, ideas and rewards are important features and these are necessary to
achieve successful supply chain integration Gattorna, (1998) .
3.1.1.3.7 Drawing up of contingency plan for quick problem solving Many authors argue that improvement practices and management that lead to
enhanced integration of the supply chain (Bresnen and Marshall, 1999; Briscoe et al.,
2004). Besides, the better value can be delivered to the end consumer is due to the
improved integration of products and processes in the industry. This is therefore,
drawing a plan for work together as a united team in a supply chain moves towards the
effective supply chain (Briscoe, and Dainty, 2005).
3.1.1.3.8 Forging and maintaining long term relationship Forging and maintaining long term relationship requires mutual trust among members
of the supply chain, close communication, quality assurance and respond (Ross,
1996).
3.1.1.3.9 Creating team works along SC and cross functional teams Supply chain members working as a team in cross functional nature that help to
control supply chain activities Beecroft et al., (2003). Definitely collaboration and
coordination between supply chain partners is very important in literature.
Collaboration is a very important base of mutual trust, shared risks, shared rewards
and openness the result is the better performance. (Hogarth-Scott, 1999). Various
authors (Gattorna and Walters, 1996; Christopher, 1998; Gunasekaran et al., 2001;
Ozkul and Barut, 2009) cited in Vicedo et al., ( 2011) that on collaboration and give
stress on the long-term and closer relationship in a way to make responsive and
efficient supply chain. Many companies collaborate with supply chain since it offers
competitive pricing, market diversity and shorter product life cycle.
3.1.1.4 Supply chain integration framework
Below figure describe the comprehensive supply chain integration framework. This
framework will be helpful for the researcher to find the existing level of SCI and
measuring parameter for the performance of SCI. Furthermore, this figure is showing
current study that has an extensive range of dimensions and variables which are
exposed that pervious researches have defined but still unclear levels of supply chain
47

School of Business & Economics
integration. This framework gives the clear direction to achieve the research
objectives.
Figure: 3.2 Research model of supply chain integration
(Source: Alfalla-Luque et al., 2012; pp. 9)
Supply chain Integration
Organizational relationship linkage
Coordination&resource sharing
Information integration II
Information sharing
Information technology integration
Collaborative planning
Joint demand forecasts
Joint replenishment forecasts
Shared decision making
SCI Construct Dimensions Variables
Cooperation
Work realignment
Reorganization of outsourcing, third party logistics
Packaging customization/standardization
Agreement on delivery frequency
Common use of logistics equipment/
Process integration
Design & maintaining of Communication channels
Laying down performance measures
Forging & maintaining long term relationship
Incentive realignment
Drawing up of contingencies plan for problem solving
Integrated behavior
Joint establishment of objectives for all parties
Sharing of skill/Ideas and institutional culture
Creating team work along SC and cross functional teams
48

School of Business & Economics
3.2 Barriers to supply chain integration There are many difficulties in the process of supply chain integration, which limit the
ability of the whole chain (Richey et al., 2009). Independent businesses, distributors,
and vendors have obvious barriers. Furthermore, information and control systems are
major and often barriers in supply chain integration (Thomas et al,. 1984). Katunzi,
(2010) illustrate the main barriers to supply chain integration which are mentioned by
many other authors. For example, lack of information technology, lack of information
sharing, lack of trust, demand distortion, incompatibility of information system, and
lack of knowledge and cost of integration.
3.2.1 Lack of information technology Information technology implementation and design of IT for successful supply chain
management has not gotten sufficient concentration from both researchers and
companies (Gunasekaran and Ngai, 2004). Although the information technology
implication in supply chain management compels to collaboration and communication
to achieve long term benefits for all supply chain participants (Yu et al., 2001). It has
proven that lack of information technology leads to lack of collaborative planning and
disturbance in the production process (Günter et al., 2006).
On the other hand manual activities are less accurate and no timely availability of
data that lead to more chances of errors and time delays and ultimately increase
productivity cost. However, IT simultaneously increases the performance and cost
effective for manufactures and distributors. Availability of timely information from
distributors is very important for the manufactures. (Nath and Standing, 2010). Sheu
et al., (2006) describe that Information technology’s (IT) competencies create
healthier communication between supply chain partners to get connected and sharing
the necessary information and help to solve problems between them.
While companies use technological tools such as electronic data interchange (EDI)
and enterprise resource planning (ERP), there are still chances of a rise problem from
unsuited among the supply chain partners. The small to medium size companies are
the victim of this problem because they cannot put heavily invested in the information
system. As a result less use information technology that leads problem in sourcing,
49

School of Business & Economics
negotiating with suppliers, problem with payments and transactions, lack of careless
planning (Wang et al.,2007).
3.2.2 Lack of information sharing Although, information integration’s technological aspect is very important but no
doubt that the frequency of quantity and quality of shared information is also
comparatively important (Prajogo and Olhager, 2012). Information sharing and
information availability allow firms to reduce uncertainties and differences in the
supply chain. Furthermore, it can also be the part of building organization strategy
(Tai, 2011). Inter-organizational information systems maintain the ability to meet the
customer needs effectively and give a positive impact on the relationship of supply
chain partners (Hsu et al., 2008).
In food industry the relationship of supply chain partners shows the vertical
integration that facilitates the effective implementation of traceability, moreover it
also helps the distributor in making correct decision throughout the food supply chain
(Fumero and Dominguez, 2012). Fumero and Dominguez, (2012) give importance
that trade partner, members of the supply chain is normally hesitating to share
information. Every member of the supply chain has information about itself rather
than the other members. That will create uncertainties in the whole system and affect
the performance of the supply chain (Yu et al., 2001). Lack of information sharing
leads to higher inventory level and higher a stock-out for both manufacture and the
distributors thus, manufactures cannot clearly respond to the distributors order
patterns and bad forecast demand (Kulp et al., 2004).
Several negative results are poor customer services, excessive inventory investment,
and inefficient production programs, a weak collaboration among the members of the
supply chain, increase the entire cost of the chain, that affect the overall performance
of the chain (Yoon, 2008).
Poor information sharing system is a “chronic weakness” that leads to unbalance
communication networks among partners which affect the performance of the parties.
Lack of information system also leads to lack of trust between members of the supply
chain, as a result low integration level in the supply chain (Li et al., 2011).
50

School of Business & Economics
3.2.3 Lack of trust The main purpose of supply chain integration is to unite the business partners which
enhance the supply chain performance of companies. Previously, it has been proven
that unseen information and activities between supply chain partners is a clear sign of
lack of trust (Narayanan and Raman, 2004). Trust is the major uncertain block in
supply chain integration (Katunzi, 2010). The supply chain relationship often makes
trust and communication easier between members. Trust is the basic element in
calculating information exchange (Moorman et al., 1993) another scholar (Beth et al.,
2003) found out the reasons behind the lack of trust is different concern and priority of
business partners. Up till now, trust was found to be an essential factor that affects
supply chain integration (Kelle and Akbulut, 2005).
Lack of trust in supply chain integration between supply chain partners leads to
suboptimal use of the distributed resources (Gunasekaran and Sandhu, 2010).
The organization will more dedicate to supply chain collaboration and integration
when trust is at the same time coped within the supply chain partners (Yeung et al.,
2009). Trust is also playing a vital role to minimize transaction cost of organizations
(Li et al., 2009). Therefore, lack of trust has been often a reason why dyadic
relationships turn out to be less effective than planned (Sahay, 2003). Furthermore,
trust reflects the confidence of one party in a two-way relationship that the other party
will not exploit its weaknesses (Sako, 1991; Svensson, 2001). But unfortunately
human nature and companies’ practices do not change easily due to lack of
information integration and communication.
Trust becomes more important when two situational forces are present in a transaction
uncertainty, and asymmetric information. There are different levels of trust, if
business partners have a high level of trust shows that a high level of input between
them as a result supply chain integration gives better performance (Yeung et al.,
2009). Another author describes that lack of trust increased uncertainties and risk,
decrease the confidence between partners, ineffectiveness within the relationship
between partners and then company fear for investments (Ojala and Hallikas, 2006).
3.2.4 Demand distortion – Bullwhip effect Distortion in demand forecast for companies in the supply chain to share a mutual set
of demand data, to do demand forecasting (Hugos, 2011). Demand forecast accuracy
51

School of Business & Economics
is very important to reduce the negative effect and induce uncertainty into the supply
chain. The problem of demand distortion is due to the lack of mutual forecast, lack of
the combination of past observation of demand and lack of information from the
supplier regarding future demand (Lawrence et al, .2011).
Lee et al., (2004) suggest that achieving coordination in the supply chain is critical to
manage the flow of supply chain integration between members. Supply chain
integration has a direct impact on members of supply chain’s production scheduling,
inventory control and delivery plans. In supply chains, inventory levels and orders
lead to manufacturing decisions has an impact to fill orders and correct inventories
(Fiala, 2005). Though, the systematic distortion of demand information generates
when a distributor / retailer transmitting information from the manufacturer in the
form of orders instead of sales. When the actual sales do not match with the
distributor/retailer’s orders, then the problem of distortion in demand arises. As a
result, upstream members of the supply chain may mislead and they take wrong
decisions about inventory and production (Ibid).
The bullwhip effect arises when the variance of orders higher than the variation in
sales and the demand distortion increase and probable move to upstream. The
bullwhip effect has serious consequences, for example excess costs of raw material for
the manufacturer, extra cost associated with over capacity storage and transport (Lee
et al., 2004). According to Taylor and Brunt, (2001); Fiala, (2005) bullwhip effect-
demand distortion occurs due to Demand signal processing, the rationing game and
order batching and price variation.
3.2.4.1 Demand signal processing Demand signal process refers when past information about demand is used to update
the forecast. Demand distortion rises when the retailer concerns orders based on the
past demand forecast. Furthermore, the manufacturer is not aware of the true demand
in the marketplace however; the production plan is based on the inefficient distortion
signals (Taylor and Brunt, 2001). Variations in the orders vary from period to period
and then the review period change and then causing frequent updating of demand
forecasting. On the other hand if point of sale data is not available to the upstream
52

School of Business & Economics
members, then all supply chain partners cannot update their demand forecast normally
by using the same data (Katunzi, 2010).
3.2.4.2 The rationing game The rationing game arises when manufactures do not share the information of
inventory and production with the other member when supply shortage is expected.
Demand distortion can occur as a consequence of retailer's survival, which considers
the possibility of being placed on sharing the total sale of the product (Taylor and
Brunt, 2001). On the other hand production capacity ultimately equals to demand and
orders are completely filled, unexpected demand drops to less than the real level and
then buying firm show the shortage and unload the excess inventory for their own
sake (Katunzi, 2010).
3.2.4.3 Order batching Order batching occurs when order cost is non-zero, retailer trying to ordering in
uneconomical manner and to gain savings in pricing. Two factors are significantly
important in order batching. The processing cost of a purchase transaction and the
periodic review process. Due to periodic review process the demand distortion occurs
by providing access to the manufacturers to sell through data at the retail level. With
the help of this information manufacturers create a production planning that is
determined by sales as opposite to orders (Taylor and Brunt, 2001).
3.2.4.4 Price variation Price variation refers to the uneven purchase price strategy of the product. The
Bullwhip effect due the frequency as well as the depth of manufacturer’s price
promotion i.e. Wholesale discount. On the other hand, retailers want the benefits from
the discount and the result. Demand distortion occurs due to lack of coordination,
manufactures face problem like unnecessary inventory expenses and uneven
production planning (Taylor and Brunt, 2001).
3.2.5 Systems incompatibility Incompatibility of systems is a major problem in supply chain integration. Moreover,
it is very difficult and unable to communicate with each other when information is
needed to share with partners in the supply chain (Fawcett and Magnan 2001). As
supply chain partners have independent systems, which in many cases they cannot
53

School of Business & Economics
communicate with each other (Themistocleouns et al., 2004). Supply chain integration
systems in food sector could be more beneficial if both food manufacturers and
distributors will use the same compatible information integration mechanism with
each other (Kinsey and Ashman, 2000). Furthermore, they have to share, inventory
status, capacity plans, demand information, production schedules, demand forecasts,
promotion plans, and shipment schedules (Zhao et al., 2010).
In such relationship improvements, when the distributor needs to increase the
manufacturer's credible commitments as it expands its own alternatives in order to
keep the manufacturer from switching (Themistocleous et al., 2004).
When distributors give the available information about the sale data to the
manufacturers then it will help the manufacturers for production schedule plans that
can be achieved by more efficient internal operations (Katz and Shapiro, 1994).
Due to incompatibility of system also leads to lack of mutual trust like fear of misuse
of information create a major barrier for integration. At different levels of the supply
chain incompatible system of supply chain integration leads to the inefficient purchase
order, uneven coordination mechanism and greater lead time which results as the poor
performance of the supply chain (Gunasekaran and Sandhu, 2010).
An incompatibility system of SCI leads to poor measurement system and conflicting
organizational culture and structure, because many firms using their own system
comfortably for their own sake and task they do not want to share their information
with others due to fear of exposing their secrets and weakness to others (Fawcett et
al., 2008).
3.2.6 Lack of knowledge/Poor human resource Companies have been moving towards collaboration with their partners, process and
supply chain integration. There is definitely need for educated persons who have
knowledge of IT and management. Furthermore, the organization needs intelligence
and decision making systems and persons who perform their task by using high level
communication systems like the internet, e-commerce and EDI to exchange relevant
information at different level of manufacturing organization and supply chain
integration. IT and knowledge of IT is very important in operation strategies
(Gunasekaran et al., 2008).
54

School of Business & Economics
Lack of supply chain management knowledge and skills and training is the greatest
obstacle in the organization. Due to Lack of Education and training that leads to
curtail innovation, and innovations fuel cannot occur in supply chain
competitiveness (Katunzi, 2010).
3.3.7 Cost of integration The upstream members of supply chain frequently determined the stock level, but they
have access less information about market demand than downstream members of the
supply chain. In order to make a successful supply chain it is essential that the
downstream members of the supply chain have to share information of demand
effectively and efficiently with the upstream members of the supply chain (Chu and
Lee, 2006).
Moreover, effective information integration makes a supply chain to generate higher
returns. On the other hand, there exists a barrier of cost by using in information
integration. If downstream members provide information to the upstream members by
using communication technology and bears total costs of information integration
(Stefansson, 2002). In return, if there is no system to share profit generated through
information sharing, then there is no attraction for informed members to share their
information with uniformed members of the supply chain. Information integration has
main hinders of costs sometimes supply chain partners use the telephone and fax for
communication about their business due to the cost of installation and maintenance of
communication technology thus does not get the full potential benefits (Stefansson,
2002).
They come up with the conclusion that the decision of distributor does not disclose
the information to the manufacturer. It depends on the costs of disclosing information
and the nature of demand. Sometime depending upon the market demand, distributors
hold on demand information from the manufacturer. Distributors think that the costs
of information may be high. On the other hand, if the market demand is higher than
cost of information integration then distributor agreed to disclose their information to
manufacturer and vice versa. Information Technology (IT) can be used with a suitable
integrated system to reduce the distributor’s cost of revealing the information. It can
also play a vital role to encourage information integration. But on the other hand the
55
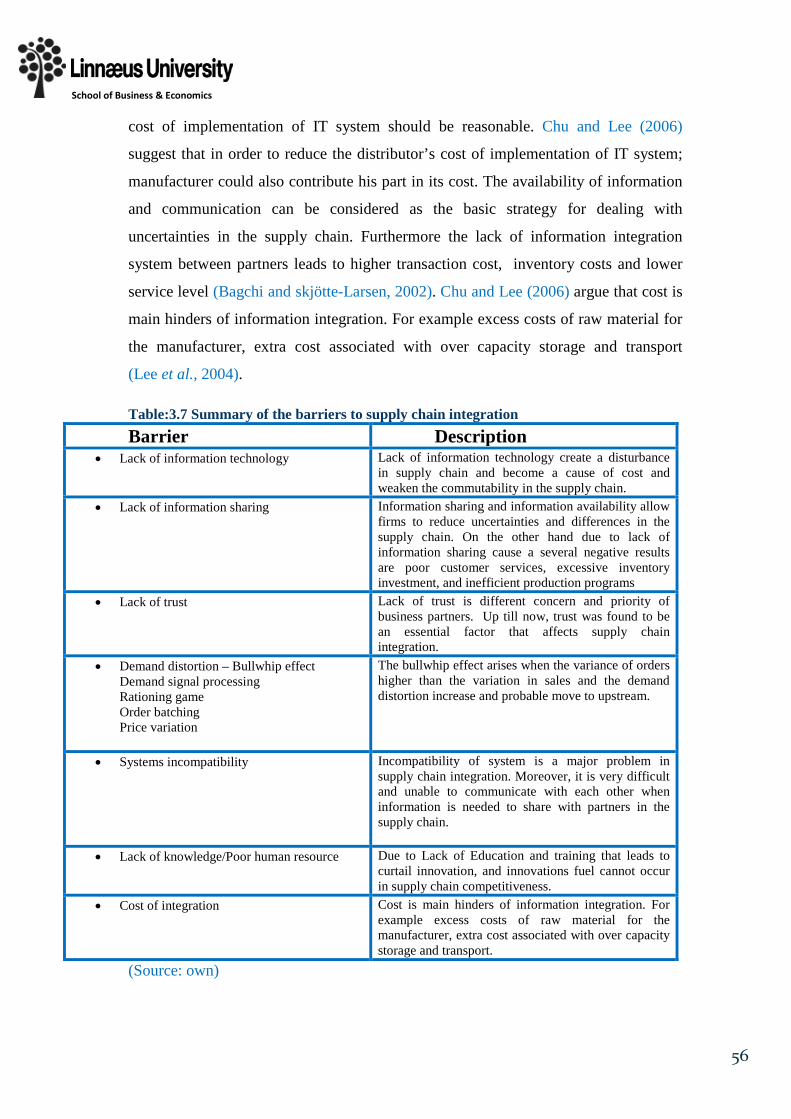
School of Business & Economics
cost of implementation of IT system should be reasonable. Chu and Lee (2006)
suggest that in order to reduce the distributor’s cost of implementation of IT system;
manufacturer could also contribute his part in its cost. The availability of information
and communication can be considered as the basic strategy for dealing with
uncertainties in the supply chain. Furthermore the lack of information integration
system between partners leads to higher transaction cost, inventory costs and lower
service level (Bagchi and skjötte-Larsen, 2002). Chu and Lee (2006) argue that cost is
main hinders of information integration. For example excess costs of raw material for
the manufacturer, extra cost associated with over capacity storage and transport
(Lee et al., 2004).
Table:3.7 Summary of the barriers to supply chain integration Barrier Description
• Lack of information technology Lack of information technology create a disturbance in supply chain and become a cause of cost and weaken the commutability in the supply chain.
• Lack of information sharing
Information sharing and information availability allow firms to reduce uncertainties and differences in the supply chain. On the other hand due to lack of information sharing cause a several negative results are poor customer services, excessive inventory investment, and inefficient production programs
• Lack of trust
Lack of trust is different concern and priority of business partners. Up till now, trust was found to be an essential factor that affects supply chain integration.
• Demand distortion – Bullwhip effect Demand signal processing Rationing game Order batching Price variation
The bullwhip effect arises when the variance of orders higher than the variation in sales and the demand distortion increase and probable move to upstream.
• Systems incompatibility Incompatibility of system is a major problem in supply chain integration. Moreover, it is very difficult and unable to communicate with each other when information is needed to share with partners in the supply chain.
• Lack of knowledge/Poor human resource
Due to Lack of Education and training that leads to curtail innovation, and innovations fuel cannot occur in supply chain competitiveness.
• Cost of integration
Cost is main hinders of information integration. For example excess costs of raw material for the manufacturer, extra cost associated with over capacity storage and transport.
(Source: own)
56

School of Business & Economics
4. INDUSTRY DESCRIPTION This chapter presents the industrial situation of Pakistan .Furthermore, how firms
integrate with each other. Because the main focus of this thesis is a dairy food
industry and this chapter gives an overview on industry description and convenient
for the reader to make them understand about Pakistani industry's condition.
4.1 Relationship of industries and supply chain integration A broader research has been done in the field of supply chain management (SCM),
and organizations are coming closer and work together due to advancement in the
business world. Consequently, supply chain integration and information and
communication play a vital role in this era (Shamimi et al., 2008). In the last two
decades, there has been a remarkable change in the business operations vertically and
horizontally. The most successful industries are those which focus carefully in
internal structure, external buyer and supplier in the supply chain. However, the
essential of supply chains is extensively accepted (Frohlicha and Westbrook, 2001).
Beside this, timely accuracy and traceability has become a part of the food industry in
order to meet the demand of the customers. Furthermore, supply chain integration is
important between the customers and producers. There is a geographical difference in
industry’s conditions i.e. European industries has the strong condition as compared to
developing countries. Although developed countries have better condition but still
they are striving to more efficiency responsiveness in manufacturing, distributing
except all the supply chain activities (Shah, 2005).
4.1.1 Overview of Pakistani industry Basically, Pakistan is an agricultural country. The leading industries of the Pakistan
are cement, textile, agriculture, steel, fertilizer, tobacco, edible oil, pharmaceuticals,
shrimp, sugar, food processing, construction materials chemicals and machinery. In
Previous year Pakistani industrial sectors have incredible growth, but currently the
shortage of electricity has affected all the industries. Conversely, it decreases the
foreign investment in the country badly that influence on GDP of Pakistan (
www.pakboi.gov.pk.com). In general Pakistan’s economy can be considered as semi-
industrialized. The total contribution of the industry 24.3% in the gross domestic
57

School of Business & Economics
production of Pakistan . According to the below table, the authors have given some
information about the general economic situation of Pakistan.
Table 4.1 Economic indicators of Pakistan Indicator Pakistan
Population ( million) 176,745,36
4
GDP ( billion US$) 211.09
Annual percentage of growth of GDP 3.0
Food industry value added (billion) 46.99
Milk & dairy industry value added
(billion)
26
(Source: World Bank, IDB; www.tribune.com; www.pakistangov.com.pk )
4.1.2 Dairy Food industry of Pakistan The dairy product industry is faster and profitably growing in Pakistan, that is the one
reason to choose dairy industry of Pakistan (Billah, 2013). Over two decades before
the Pakistani dairy food industry has satisfactory achievements in processed milk
products “Pakistan was second after India in the buffalo milk production and 12th in
cow milk production in the world in 2009” (Ahmad et al., 2011). Pakistan has a low
productivity level in agriculture and sub section like livestock/dairy products as
compared to developed countries as well as developing countries in the same resource.
Though, Agriculture has remained the backbone of the Pakistan’s economy as it
provides employment to 45% population and provides input for agro based industry
(Zamana et al., 2012). Economics and social development estimated that the food
industry is considered Pakistan’s largest industry and is believed to account for 27%
of its value-added production while 16% of the total employment by the
manufacturing sector (www.finance.gov.pk). In Pakistan, normally distribution
channel has more intermediaries as compare to a European (Ibid). But still, the
demand is increasing for livestock products due to increased consumer awareness of
natural products and new investment opportunities are also arising ( Billah, 2013).
58

School of Business & Economics
4.2 Challenges to dairy food industry of Pakistan For the sustainable growth of competitors, supply chain management is a competitive
advantage. Industries including small and Medium are facing difficulties due to low
integrated supply chain in Pakistan as well as other developing countries. There are
some reasons behind the low integration in the supply chain are limited resources and
inappropriate standards. Coordination and communication can play a vital role
between the top level of management in order to integrate supply chain members. The
main resolution of effective information sharing behind this scenario, Pakistani firms
need to develop their IT resources. Especially SME, s are facing obstacles due to lack
of resources ( Hayat et al., 2012).
On the other hand, end consumers are also faced with the key economic problem of
limited income and high expenses that affect the consumer market. In this
consequence, almost all the companies in all industries are facing a gradual increase in
their manufacturing costs. There is strongly interdependency in the different industries
also become a cause of less development of the industry are to aggregate the prices of
fuel, packaging material, raw material and overheads, hence reducing their profit
earnings (Billah, 2013). Moreover, the dairy industry of Pakistan is facing a number of
problems such as lack of dairy-related education and lack of financial and
infrastructure facilities. The cost investment and heavy logistics cost involved in dairy
milk collection (Iqbal and Asi, 2013).
59
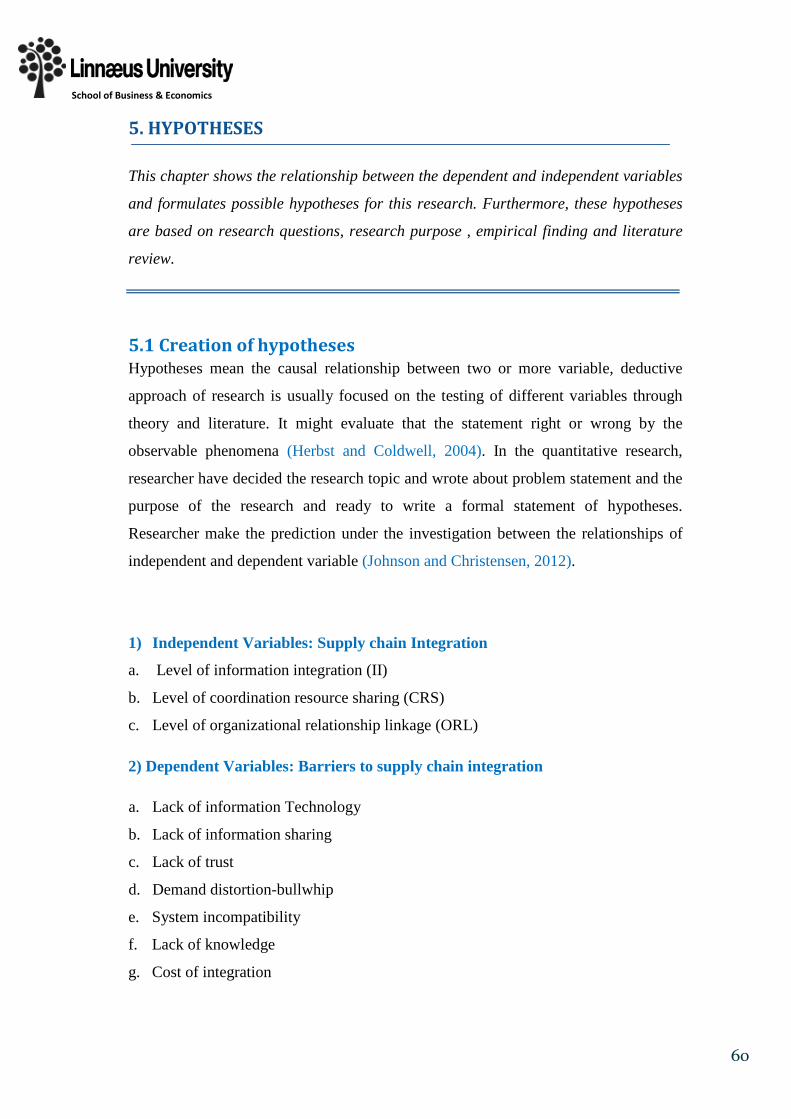
School of Business & Economics
5. HYPOTHESES This chapter shows the relationship between the dependent and independent variables
and formulates possible hypotheses for this research. Furthermore, these hypotheses
are based on research questions, research purpose , empirical finding and literature
review.
5.1 Creation of hypotheses Hypotheses mean the causal relationship between two or more variable, deductive
approach of research is usually focused on the testing of different variables through
theory and literature. It might evaluate that the statement right or wrong by the
observable phenomena (Herbst and Coldwell, 2004). In the quantitative research,
researcher have decided the research topic and wrote about problem statement and the
purpose of the research and ready to write a formal statement of hypotheses.
Researcher make the prediction under the investigation between the relationships of
independent and dependent variable (Johnson and Christensen, 2012).
1) Independent Variables: Supply chain Integration
a. Level of information integration (II)
b. Level of coordination resource sharing (CRS)
c. Level of organizational relationship linkage (ORL)
2) Dependent Variables: Barriers to supply chain integration
a. Lack of information Technology
b. Lack of information sharing
c. Lack of trust
d. Demand distortion-bullwhip
e. System incompatibility
f. Lack of knowledge
g. Cost of integration
60

School of Business & Economics
5.1.1 Relationship between dependent and independent variables Three independent variables are used in the study that are information integration,
coordination resource sharing and organizational resource linkage. Furthermore,
dependent variable (Barriers) is the cause and the independent variables are the effect
of that cause (Babbie, 2011).
The empirical study of this research aims to find out the existing level of supply and
the barriers to supply chain integration in Haleeb foods industry in Pakistan. Different
authors highlighted in the context of Pakistan that need to be developed IT system
(Hayat et al., 2012) lack of resources Ahmad et al., (2011); Billah, (2013) says lack
of education and lack of financial and infrastructure facilities and Iqbal and Asi,
(2013) high logistics cost. Precisely, Pakistan’s consider as developing countries and
industry situation also unstable.
Consequently, information integration(II), coordination resource sharing(CRS) and
organizational relationship linkage (ORL) has the effect on dependent variables like
levels of supply chain integration (low, medium, high level). Many studies have
mentioned the direct linkage of SCI with levels of integration and mostly write about
the high level of integration.
According to the authors Xu et al., (2013), a firm can attain benefits if the integration
between upstream and downstream partners leads to customer services and reduce
total costs. Another author Han, (2006) describes that the relationship among the
supply chain integration’s practice and levels of integration both have a positive
relationship to the overall performance of the supply chain.
According to Bagchi and skötte-Larsen (2005) cited in Alfalla-Luque et al., (2012)
that SCI is the coordination and collaboration between SC members in tactical,
strategic and operational decision making levels of activities.
Moreover the hypothesis shows that supply chain integration dimensions and the
levels of supply chain integration have a direct link with each other. The higher level
of supply chain integration to higher the organization performance in all supply chain
dimensions as supported by Alfalla-Luque et al., (2012). Higher levels of integration
within the supply chain partners lead to greater benefits in the firm.
61

School of Business & Economics
5.2 Levels of supply chain integration Research Question one (1) of this paper is descriptive in nature, and there is some
limitation because of suitable theory and nature of the study, geographical location
and industrial situation of Pakistan that resists the hypothesis and not fulfill the
exceptive result. Spite of this author has to answer the research question through the
detail descriptive analysis between the descriptive results and literature which support
for this research.
5.3 Barriers to supply chain integration From the reviewer of literature, there are some barriers to supply chain integration
which are detail discussed in theory chapter. These barriers are affecting the
performance of the supply chain integration. This study is conducted in a Pakistani
business environment perspective and specifically between Haleeb foods and its
distributors. Geographical location and culture of the companies is really matter.
There is creation of possible hypothesis which are going to be tested that barriers have
an impact on supply chain integration between Haleeb foods and its distributors.
H1:Different barriers to supply chain integration has significant impact on supply
chain integration at Haleeb foods.
This hypothesis, support to the research question 2 that barriers to supply chain
integration has significant impact on the supply chain integration. As Richey et al.,
(2009) highlight that barrier to supply chain integration are limited to performance of
supply chain, that ultimately effect to supply chain integration. In Pakistan, Hayat et
al., 2012; Billah , (2012); Iqbal and Asi, (2013) illustrate in their study that there are
some problems like of lack IT resource, information sharing, lack of infrastructure,
lack of knowledge all these led to the obvious barriers to SCI.
62

School of Business & Economics
Figure: 5.1 Conceptual framework for research question 2
H1
H4e H2
(Source: own)
(Source: own)
5.3.1.1 Sub Hypothesis For detail understanding about the barriers to supply chain integration authors has
created sub hypothesis. There are obvious barriers to SCI which authors have listed in
theory. Sub hypothesis are testing that show the existing barriers according to
Pakistani industry’s condition. Furthermore, these sub-hypothesis clearly show the
relationship between each barrier and supply chain dimension between Haleeb foods
and its distributors.
Figure: 5.2 Hypothesis between lack of information technology and dimensions of SCI H1a
H1b
H1c
(Source: own )
H1a: There is the significant impact of lack of information technology on the level of information integration
This hypothesis is created to test the relationship between lack of information
technology and level of information integration which is the dimension SCI.
Supplychain integration
Level of Information integration
Level of Coordination resource sharing
Level of Organizational relationshiplinkage
Barrier to Supply chain integration
2 1
Lack of information technology
Lack of information sharing
Lack of trust
Demand distorsion
System incompatibility
Lack of knowledge
Cost of information
Level of Information integration
Level of Coordination resource sharing
Level of Organizational relationshiplinkage
Lack of information technology
63

School of Business & Economics
According to Günter et al., (2006) lack of information technology leads to lack of
collaborative planning and disturbance in the production process. IT is one of the
variable of information integration, by testing this hypothesis authors will find out the
impact of information technology on information integration between Haleeb foods
and its distribution.
H1b: There is the significant impact of lack of information technology on level of coordination resource sharing
Theory proves that lack of information technology can because of low level of
integration between the supply chain partners, unsuitable system which drives
problem and inefficiencies in the supply chain (Wang et al.,2007). Therefore, authors
are going to test although this approach is applied in the Pakistani food industry and
what is the effect of lack of information technology on the distributors of Haleeb
foods.
H1c: There is the significant impact of lack of information technology on lack of organizational relationship linkage
This hypothesis (H1c) is created to test the impact of the lack of information
technology on the organizational relationship linkage. According to the literature that
lack of information technology has impacted on the organization relationship linkage
and it can because of the low integration between the organizations and business units.
Allfalla-Luque et al., (2012) describe that ORL is the common strategic vision and
objective of the supply chain partners, sharing risk and rewards, and achieving
common goals. But the purpose of this hypothesis testing to confirm that there is an
impact on organizational relationship linkage by lack of information technology
between Haleeb foods and its distributors.
Figure: 5.3 Hypothesis between lack of information sharing and dimensions of SCI H1d
H1e
H1f
(Source: own )
Lack information sharing
Level of Information integration
Level of Coordination resource sharing
Level of Organizational relationshiplinkage
64

School of Business & Economics
H1d: Lack of information sharing has significant impact on the level of information integration.
While going through the literature by the different authors, lack of information sharing
leads to weak communication links among partners (Li et al., 2011). According to the
(H1d) hypothesis author of this research going to test that how lack of information
sharing impact of the information integration in Pakistani business environment and
specifically Haleeb foods and its distributors.
H1e: Lack of information sharing has significant impact on coordination resource sharing.
According to this hypothesis author is going to test that lack of information sharing
has any impact on coordination resource sharing or not. According to Chandra, (2007)
lack of information sharing has major impact to create problems in making decision
in the supply chain. Furthermore, the authors of this research are going to test this
hypothesis with the perspective of Haleeb foods and its distributors.
H1f: Lack of information sharing has significant impact on organizational
relationship linkage
This hypothesis is created for testing the impact of lack of information sharing on
organizational relationship linkage with the perspective of Haleeb foods and its
distributors. Lack of information sharing do not promote stable and long term-
relationship that affect the institutional performance measures (Allfalla-Luque et al.,
2012).
Figure: 5.4 Hypothesis between lack of trust and dimensions of SCI H1g
H1h
H1i
(Source: own)
Figure 5.4 shows the lack of trust that is a possible barrier to supply chain integration,
because authers have described about the supply chain integration has three
dimensions these are clearly shown in figure. Authors has supported in their research
by the formulation possible hypothesis and answered the research question 2.
Level of Coordination resource sharing
Level of Organizational relationship linkage
Lack trust
Level of Information integration
65

School of Business & Economics
H1g: There is the significant impact of lack of trust on the level of information integration
Each arrow which directs to the dimension and as result three hypotheses formulated
H1g, shows the relationship between level of information integration and lack of trust.
Moorman et al., (1993) argue that Supply chain relationship often makes trust and
communication easier between members and trust is the basic element in calculating
information exchange.
H1h: There is significant impact of lack of trust on level of coordination resource sharing
H1h shows the second possible hypothesis which shows the relationship between
level of coordination resource sharing and lack of trust. According to (Beth et al.,
2003) trust issue is accruing when the supply chain partners has different priorities
and concern .This hypothesis is going to be tested for developing countries especially
in Pakistan.
H1i:There is the significant impact of lack of trust on level of organizational relationship linkage
This hypothesis will be tested the impact of lack of trust on the organization
relationship linkage. According to (Sahay, 2003) trust or the lack of trust is often a
reason why dyadic relationships turn out to be less effective than planned. In
developing countries, especially in SME’s different priority is very common practice
due to the lack of trust, it weakens the confidence of the parties .
Figure: 5.5 Hypothesis between demand distortion- bullwhip effect and dimensions of SCI H1j
H1k
H1l
(Source : own )
Figure 5.5 shows the sub-hypothesis between the demand distortion –bullwhip effect
and three dimensions of supply chain integration. Authors are going to test that
Level of Coordination resource sharing
Level of Organizational relationshiplinkage
Demand distortion –bullwhipeffect
Level of Information integration
66

School of Business & Economics
demand distortion has an impact on the supply chain integration dimension of the
Haleeb foods and its distributors..
H1j: There is the significant impact of demand distortion on the level of information integration
This hypothesis shows the arrow from demand distortion to the level of information
integration that mean there is some relationship between these variables. Lack of
information can be problematic for demand distortion, because supplier needs
accurate customer demand and pan the production accordingly information from the
customer (Lawrence et al.,2011). Authors are going to shed the light of theory and
the actual situation of Haleeb foods and its distributors.
H1k: There is the significant impact of demand distortion-bullwhip effect on level of coordination resource sharing
Above hypothesis shows the relationship between the demand distortion and level of
coordination resource sharing. Lee et al., (2004) argue that to achieve coordination
in the supply chain it is important to maintain the flow of inventory among the supply
chain partners. According to this hypothesis, the authors are going to check the
relationship between the CSR and demand distortion in Haleeb foods and its
distributors.
H1l: There is the significant impact of demand distortion-bullwhip effect on level of organizational relationship linkage
This hypothesis show that there is a relationship between the demand distortion and
organizational relationship linkage between Haleeb foods and its distributors.
Demand-distortion due the lack of mutual understanding of supply chain partners that
increase the inaccuracy in inventory (Lawrence et al., 2011). However, authors will
test the result of hypothesis between the Haleeb foods and its distributors.
67

School of Business & Economics
Figure: 5.6 Hypothesis between system incompatibility and dimensions of SCI
H1m
H1n
H1o
(Source: own)
Figure 5.6 shows the relationship between the system incompatibility and three
dimensions of supply chain integration. Actually the arrows from system
incompatibility to levels of II, CRS, ORL represent the effect that mean system
incompatibility affects these levels of supply chain integration. There are three
hypotheses are created.
H1m: There is the significant impact of system incompatibility on the level of
information integration
The creation of this hypothesis, is to check the significant impact of system
incompatibility on information integration at Haleeb foods and its distributors. In food
sector same compatible information system is valuable for both manufacturers and
distributors ( Kinsey and Ashman, 2000).
H1n:There is significant impact of system incompatibility on level of coordination
resource sharing
This hypothesis is to check the impact of system incompatibility on coordination
resource sharing between the Haleeb foods and its distributors. Incompatible system
of supply chain integration lead to uneven coordination between partners, inefficient
purchase orders and increased the lead time that affects the performance of supply
chain integration (Gunasekaran and Sandhu, 2010). Furthermore, authors are going to
test this hypothesis with the help of empirical finding and highlight the supported
theory.
H1o:There is the significant impact of system incompatibility on level of
organizational relationship linkage
Level of Information integration
Level of Coordination resource sharing
Level of Organizational relationshiplinkage
System incompatibility
68

School of Business & Economics
According to this hypothesis, the authors will check the relationship between the lack
of system incompatibility on organizational relationship linkage. Fawcett et al., (2008)
highlight that firms are not using a compatible system of SCI because fear of miss
use their information , as a result they don’t want to share their information others
supply chain members. This is therefore, authors want to check this issue with the help
of hypothesis between Haleeb foods and its distributors.
Figure: 5.7 Hypothesis between lack of knowledge and dimensions of SCI
H1p
H1q
H1r
(Source: own )
Figure 5.7 shows the relationship between the lack of knowledge and three
dimensions of supply chain integration. These relationships actually show the impact
through arrows that mean lack of knowledge in supply chain integration has affected
the level of information integration, level of coordination resource sharing and
organizational relationship linkage.
As a result there are following hypothesis are created that are going to be tested either
lack of knowledge in supply chain integration has an impact on supply chain
integration levels between the Haleeb foods and its distributors or not.
H1p: There is the significant impact of lack of knowledge on the level of information
integration
This hypothesis show that there is impact of lack of knowledge on the level of
information integration between Haleeb foods and its distributors. According to the
theory (Gunasekaran, 2008) organizations need for educated person who have
knowledge about the information technology within the supply chain, that is very
Level of Coordination resource sharing
Level of Organizational relationshiplinkage
Lack of knowledge
Level of Information integration
69

School of Business & Economics
important for making strategies for business operation. Besides this, authors will find
out how the result of the hypothesis is applied between Haleeb foods and its
distributors.
H1q: There is the significant impact of lack of knowledge on level of coordination
resource sharing
According to this hypothesis, it is going to be tested that lack of knowledge has
significant impact on the level of coordination resource sharing between Haleeb foods
and its distributors. According to (Wang et al ., 2007) bad and downfall activities in
process of supply chain due lack of knowledge among the supply chain partners .
H1r: There is the significant impact of lack of knowledge on level of organizational relationship linkage
According to this hypothesis, the authors are going to test the impact of lack of
knowledge have significant impact on level of organizational relationship linkage
between the Haleeb foods and its distributors. Lack of knowledge is the biggest
obstacle while exchanges skills and ideas that affect the competitiveness of the
organization as well as affect the organizational relationships ( Katunzi, 2010).
Figure: 5.8 Hypothesis between cost of integration and dimensions of SCI
H1s
H1t
H1u
(Source: own )
Figure 5.8 shows the relationship between cost of integration and levels of supply
chain integration, i.e. Information integration , coordination resource sharing and
organizational relationship linkage. Arrows explain that cost of integration has
relationships with dimensions of supply chain. Authors are going to test the effect of
Level of Coordination resource sharing
Level of Organizational relationshiplinkage
Cost of integration
Level of Information integration
70
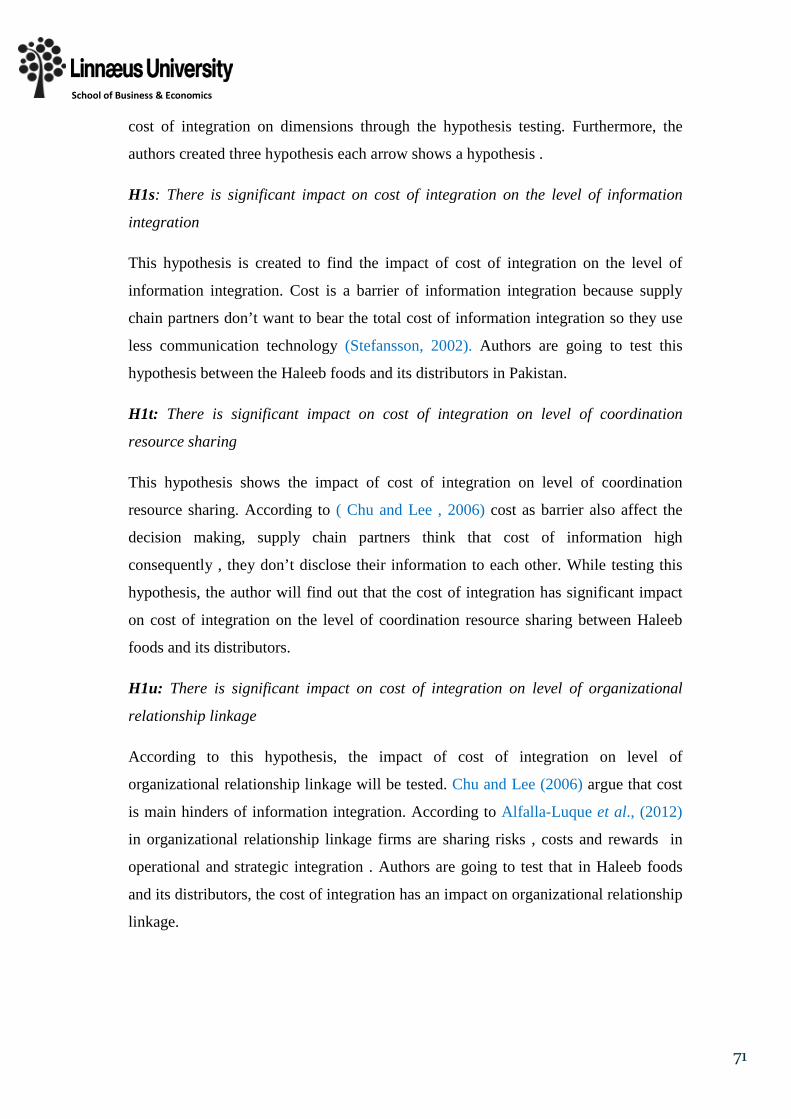
School of Business & Economics
cost of integration on dimensions through the hypothesis testing. Furthermore, the
authors created three hypothesis each arrow shows a hypothesis .
H1s: There is significant impact on cost of integration on the level of information
integration
This hypothesis is created to find the impact of cost of integration on the level of
information integration. Cost is a barrier of information integration because supply
chain partners don’t want to bear the total cost of information integration so they use
less communication technology (Stefansson, 2002). Authors are going to test this
hypothesis between the Haleeb foods and its distributors in Pakistan.
H1t: There is significant impact on cost of integration on level of coordination
resource sharing
This hypothesis shows the impact of cost of integration on level of coordination
resource sharing. According to ( Chu and Lee , 2006) cost as barrier also affect the
decision making, supply chain partners think that cost of information high
consequently , they don’t disclose their information to each other. While testing this
hypothesis, the author will find out that the cost of integration has significant impact
on cost of integration on the level of coordination resource sharing between Haleeb
foods and its distributors.
H1u: There is significant impact on cost of integration on level of organizational
relationship linkage
According to this hypothesis, the impact of cost of integration on level of
organizational relationship linkage will be tested. Chu and Lee (2006) argue that cost
is main hinders of information integration. According to Alfalla-Luque et al., (2012)
in organizational relationship linkage firms are sharing risks , costs and rewards in
operational and strategic integration . Authors are going to test that in Haleeb foods
and its distributors, the cost of integration has an impact on organizational relationship
linkage.
71

School of Business & Economics
6. EMPIRICAL FINDING The empirical chapter presents the information about the Haleeb foods and the supply
chain integration in Haleeb foods. Empirical data were received by sending the
questionnaire to the distributors. On the basis of collecting data, statics description
and generation of correlation have been made by using SPSS. Furthermore, these
statically description and correlation results helped to make the analysis result of this
research.
6.1 Company Presentation Haleeb foods was established in 1986 and first product was introduced as UHT
Haleeb milk. Meanwhile, Haleeb is striving to provide quality products to its
consumers with product and doing best to retain them. In the early 90’s Haleeb foods
built a great reputation and having the honor of market leader in Pakistan as well as
continuing to be at the lead of product and packaging innovation. Haleeb foods has a
strong portfolio in achieving a wide range of products. It has introduced national and
international brand with the largest distribution channels across the Pakistan like
Haleeb, Candia, Dairy Queen, Tea Max, Skimz, Just Fruit, Tropico, and Fun Milk &
Daizy. Furthermore, Haleeb foods also export to Afghanistan, Bangladesh, Central
Asian states and South Korea (www.haleebfoods.com). Haleeb foods was the first
company in Pakistan who used Tetra Pak’s novel packaging formats, Tetra Brick
Aseptic (TBA) and Tetra Fino Aseptic (TFA). Being a responsible company they were
the first one in the category to acquire ISO 9002, HACCP and ISO 14000
certifications in Pakistan. They are proud to be a part of millions of consumers
worldwide, who cherish our premium quality, safe and affordable products every day
and give us the reason to strive for the best of the best. Haleeb foods have more than
200 individual’s distributors with 7 regions all over the Pakistan. Haleeb foods also
deal in international business, food service departments and direct distribution channel
(Muhammad SabirLilla and Kashif Ahmad).
72

School of Business & Economics
Haleeb foods have seven regions across Pakistan. The authors have gathered data
from the distributors through the survey questionnaire, that is mentioned in the detail
data collection in the methodology chapter about this report. According to this table,
every region has a certain number of distributors.
Table: 6.1 Distributors of Haleeb Foods in Pakistan Regions Number of Distributors Number of Respondents Percentage
Peshawar 50 42 84
Islamabad 20 19 95
Gujranwala 50 44 88
Faisalabad 25 23 92
Lahore 20 20 100
Multan 15 13 86,67
Sukkur 10 8 80
Karachi 10 9 90
Total 200 178 89
(Source: Sabir-lillah)
According to table 6.1 readers get aware from the fact and figure about the distributors
region wise. Peshawar regions has 50 distributors and authors got responses 42 out of
50 total percentage of responses is 84. Islamabad region has 20 distributors and 19
distributors responded out of 20 it quite high rate of response in this region.
Gujranwala has 50 distributors and 44 distributors responded out of 50 and 88 % of
total respondents in this region. Faisalabad region has 25 distributors and authors got a
response 23 out of 25 its 92 %. Lahore has 20 distributors and authors get responses
100% because in this city Haleeb foods head office is situated. Multan region has 15
distributors and authors got a response from 13 distributors out 15 so 86.87% . Sukkur
region has 10 distributors but authors got a response from 8 out of 10 distributors its
80% little bit less as compared to others region. Karachi is one of the big city of
Pakistan whole foods has 10 distributors in Karachi and authors got a response 9 out
of 10 distributors 90 % response from distributors.
73

School of Business & Economics
6.2 Reliability Analysis The design of questionnaire covered the area of dimensions of SCI and barriers to
SCI. We received 178 responses out of 200. The coefficient Cronbach’s Alpha
measures reliability and internal consistency of the scale. Values close to 1 tells about
the strong reliability. According to Pallant (2010), the higher Cronbach Alpha values,
the better internal consistency reliability of the scale. The values above 0.7 are
acceptable value.
Table: 6.2 Testing cronbach's alpha
(Source: own )
The above table 6.2 shows that all the Cronbach Alpha values four concepts for
Distributors of Haleeb foods in Pakistan are above 0.7, according to the finding
information integration over acceptable value (0,8); three concept coordination
resource sharing, organizational relationship linkage and barriers to supply chain are
excellent value (0,9) of levels and barriers to supply chain integration for distributors
of Haleeb foods.
6.3 Empirical findings for research question 1. The descriptive statistics are used in the analysis and summarize the data from the
questionnaire in the survey for each variable. Construct describes the variables which
authors used as questions in the survey form. Authors have used 5 points Likert scale
in the survey form (1,2 ,3 ,4,5 ) 1 is equal to strongly disagree, 2 is agreed, 3 is neutral
Concepts
Number of
Items
No.
Cases
Reliabilities Coefficients
Cronbach's
Alpha
Cronbach's
Alpha
Information integration (II) 5 ,862 ,874 Coordination resource sharing (CRS) 8 ,930 ,935 Organizational relationship linkage
(ORL)
9 ,921 ,929
Barriers to supply chain integration 7 ,954 ,957
74

School of Business & Economics
and 4 is Agree and finally 5 is showing the strongly agree. In the descriptive statistics,
all the figures are in the percentage that is clearly showing how many present out of
178 distributors answers the questions according to Likert scale.
6.3.1 Descriptive statistics for information integration The descriptive statistics are used in analysis to summarize the data from survey
responses of each variable. N is representing the total number of cases that present
different values of means and standard deviations (S.D.) of questionable items. The
means refer to expected values derived from the survey rating by the agreement level
at 1 as lowest to 5 as highest while S.D. shows the variation of data from the means.
Moreover , the authors have used only mean and SD value in the description of the
table even reader can also see the percentage of each Likert scale. The survey
questions and the descriptive statistics for each item under 4 concepts from Haleeb
foods distributor’s respondents are shown below:
Table: 6.3 Descriptive statistics for information integration
Survey Question
N Liket Scale
Mean
SD 1 2 3 4 5
1-Your company share information with Haleeb Foods to improve decision making
178
0,56
1,07
43,82
46,63
7,87
3,6011
,67514
2- Your company and Haleeb Foods use the same or compatible information system
178
59,55
37,08
3,37
0,00
0,00
1,4382
,56158
3- Collaborative planning is introduced in your company to improve the planning process with Haleeb Foods
178
39,33
54,49
6,18
0,00
0,00
1,6798
,63222
4- Haleeb Foods have real time information to make a common demand forecast for your company
178
0,00
0,00
3,93
70,22
25,84
4,2191
,50116
5- Joint replenishment forecasts is used between you and Haleeb Foods to meet your market need
178
57,87
37,64
4,49
0,00
0,00
1,4663
,58367
(Source: own )
According to findings of descriptive statistics, distributors of Haleeb foods assume
that they provide the real time information to the Haleeb foods for making common
75
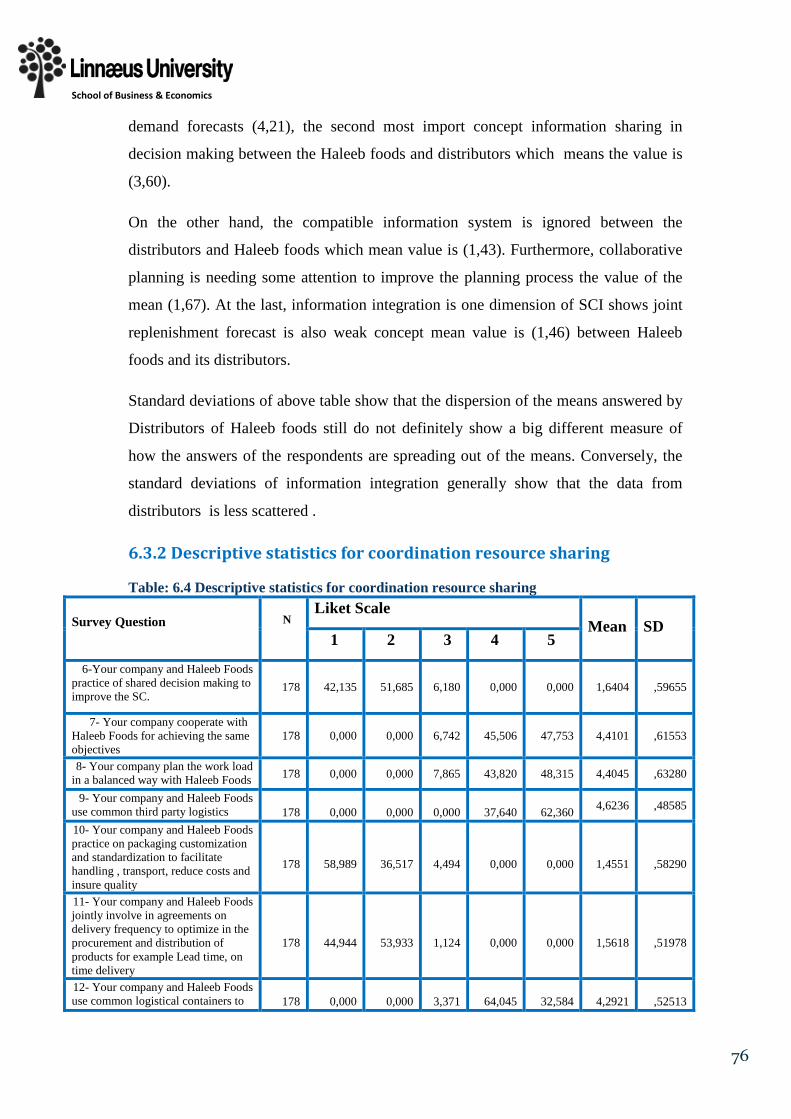
School of Business & Economics
demand forecasts (4,21), the second most import concept information sharing in
decision making between the Haleeb foods and distributors which means the value is
(3,60).
On the other hand, the compatible information system is ignored between the
distributors and Haleeb foods which mean value is (1,43). Furthermore, collaborative
planning is needing some attention to improve the planning process the value of the
mean (1,67). At the last, information integration is one dimension of SCI shows joint
replenishment forecast is also weak concept mean value is (1,46) between Haleeb
foods and its distributors.
Standard deviations of above table show that the dispersion of the means answered by
Distributors of Haleeb foods still do not definitely show a big different measure of
how the answers of the respondents are spreading out of the means. Conversely, the
standard deviations of information integration generally show that the data from
distributors is less scattered .
6.3.2 Descriptive statistics for coordination resource sharing
Table: 6.4 Descriptive statistics for coordination resource sharing
Survey Question
N Liket Scale
Mean
SD 1 2 3 4 5
6-Your company and Haleeb Foods practice of shared decision making to improve the SC.
178
42,135
51,685 6,180 0,000 0,000 1,6404 ,59655
7- Your company cooperate with Haleeb Foods for achieving the same objectives
178 0,000 0,000 6,742 45,506 47,753 4,4101 ,61553
8- Your company plan the work load in a balanced way with Haleeb Foods 178 0,000 0,000 7,865 43,820 48,315 4,4045 ,63280
9- Your company and Haleeb Foods use common third party logistics
178
0,000
0,000
0,000
37,640
62,360 4,6236 ,48585
10- Your company and Haleeb Foods practice on packaging customization and standardization to facilitate handling , transport, reduce costs and insure quality
178
58,989
36,517
4,494
0,000
0,000
1,4551
,58290
11- Your company and Haleeb Foods jointly involve in agreements on delivery frequency to optimize in the procurement and distribution of products for example Lead time, on time delivery
178
44,944
53,933
1,124
0,000
0,000
1,5618
,51978
12- Your company and Haleeb Foods use common logistical containers to
178
0,000
0,000
3,371
64,045
32,584
4,2921
,52513
76

School of Business & Economics
facilitate handling operations, loading and unloading 178 13- Your company and Haleeb Foods use a process approach that allows the direct interconnection between departments and company and avoid duplication
178
60,674
36,517
2,809
0,000
0,000
1,4213
,54926
( Source : own )
Descriptive statistics show in table 6.4 distributors of Haleeb foods giving more
importance to same objective and they are quite satisfied, mean value of showing
(4,41) from the responses ; on the other hand Haleeb foods and its distributors also try
to share the work load in balance way and make work realignment, the mean value of
the responses is (4,40). Furthermore, Haleeb foods and its distributors also use the
same logistics parties and distributors are quite satisfied that because it’s convenient
for them for coordination resource sharing, the value of mean is (4,61).
On the other hand, there are some weak concepts in the coordination resource sharing
between the Haleeb foods and its distributors. It is not common to shared decision
making to improve the SC (1,46). Furthermore, Haleeb foods and its distributors are
not practicing on packaging customization and standardization to facilitate handling ,
transport, reduce costs and ensure quality (1,45). Another concept that distributors are
not jointly involved in agreements on delivery frequency to optimize in the
procurement, lead time and on time delivery (1,56). At the last, distributors don’t use a
process approach that allows the direct interconnection between departments and
company and avoid duplication with the Haleeb foods (1,42).
For the standard deviations, the above table shows that the dispersion of the means
answered by distributors of Haleeb foods still do not definitely show a big different
measure of how the answers of the respondents are spreading out of the means.
Conversely, the standard deviations of coordination resource sharing generally show
that the data from distributors is not dispersal.
77

School of Business & Economics
6.3.4 Descriptive statistics for organization relationship linkage
Table: 6.5 Descriptive statistics for organizational relationship linkage
Survey Question
N Liket Scale
Mean
SD 1 2 3 4 5
14- Your company is using active communication channels with Haleeb Foods
178 46,067 0,000 52,809 1,124 0,000 1,5506 ,52100
15- Your company and Haleeb Foods establish common performance indicators and aligned
178 56,742 41,573 1,124 0,562 0,000 1,4551 ,55306
16- Your company and Haleeb Foods share risks, costs and rewards
178 48,876 50,000 1,124 0,000 0,000 1,5112 ,52334
17- Your company and Haleeb Foods promote an attitude and plans of action to support an integrated business performance
178 0,562 16,292 56,742 26,404 0,000 4,0843 ,66271
18- Your company and Haleeb Foods involve for the joint establishment of objectives for the end customer satisfaction
178 0,000 0,000 0,562 48,315 51,124 4,5056 ,51252
19- Your company and Haleeb Foods are sharing their skills ideas and institutional culture by conducting training sessions and seminars for best practices
178 37,079 60,674 2,247 0,000 0,000 1,6517 ,52295
20 – Your company and Haleeb Foods involved in drawing up of contingency plans for quick problem solving regarding business unexpected situations
178 31,461 61,236 7,303 0,000 0,000 1,7584 ,57545
21- Your company and Haleeb Foods establish stable links with each other for maintaining long term relationship
178 0,000 0,562 6,180 52,809 40,449 4,3371 ,61880
22- Your company and Haleeb Foods encourage team building to allow for coordination and active cooperation between different departments
178 39,888 56,180 3,933 0,000 0,000 1,6404 ,55738
(Source: own )
The descriptive statistics show in table 6.5 the answers from the distributors of Haleeb
foods regarding the concept of organizational relationship linkage. The distributors
and Haleeb foods are involved for the joint establishment of objectives (4,50), they
are seeking for stable links with each other for maintaining long term relationship
(4,33). On the other hand, it is also a common practice between Distributors and
Haleeb foods that promote an attitude and plans of action to support an integrated
business performance (4,08).
78

School of Business & Economics
In spite of this, distributors and Haleeb foods are not involved in drawing up of
contingency plans for quick problem solving regarding business unexpected situations
(1,75). Furthermore, they are not sharing their skills ideas and institutional culture by
conducting training sessions and seminars for best practices (1,65). There is also a
lack of encouraging team building to allow for coordination and active cooperation
between different departments (1,64). Also, distributors and Haleeb foods are not
using active communication channels (1,55) Your company and Haleeb Foods share
risks, costs and rewards (1,51) As well as that is not in practice to establish common
performance indicators and aligned between Haleeb foods and its distributors (1,45).
Apart of this, standard deviations are not showing that dispersion of the means
answered by distributors of Haleeb foods still do not definitely show a big different
measure of how the answers of the respondents are spreading out of the mines.
6.5 Empirical findings for research question 2. In this section, authors have talked about the barriers to supply chain integration.
Additionally, which are the existing barriers to supply chain integration between the Haleeb
foods and its distributors in Pakistan.
6.5.1 Descriptive statistics for barriers to supply chain integration
Table: 6.6 Descriptive statistics for barriers to supply chain integration
Survey Question Liket Scale
Mean
SD 1 2 3 4 5
23- Your company have not adequate information system to integrate with Haleeb Foods
52,809 43,258 3,933 0,000 0,000 1,5112 ,57479
24- Your company is not willing to share critical information with Haleeb Foods
0,000 1,124 7,303 45,506 46,067 4,3652 ,66919
25- Lack of trust restrict the integration between your company and Haleeb Foods
0,000 0,000 5,056 50,000 44,944 4,3989 ,58551
26- Increased stock level due to inadequate demand forecasts between your company and Haleeb Foods
0,000 0,000 0,000 13,483 86,517 4,8652 ,34251
79

School of Business & Economics
27- Incompatible system is used between your company and Haleeb Foods
31,461 63,483 5,056 0,000 0,000 1,7360 ,54509
28- Lack of education, knowledge about IT and management is restricted to supply chain integration
0,000 0,000 2,809 49,438 47,753 4,4438 ,55203
29- Cost effect the integration between your company and Haleeb Foods
0,000 0,000 0,000 20,787 79,213 4,7921 ,40692
(Source: own )
Descriptive statistics show that distributors and Haleeb foods often increased stock
level due to inadequate demand forecasts (4,86), Another barrier according to the
distributors cost effect the integration between them and Haleeb food (4,79)
.Incompatible system is also an issue between distributors and Haleeb foods (4,73).
Furthermore, lack of education, knowledge about IT and management is also a major
barrier between them (4,44). Lack of trust between distributors and Haleeb foods is
another foremost barrier (4,39) at the last, lack of information sharing to share found
between distributors and Haleeb foods (4,36).
On the other hand, according to distributors information technology is not a major
barrier to integration between Haleeb foods and them (1,51).
The standers deviation of this concept, also not showing the measurement separating
of the mean of the responses from the distributors of Haleeb foods.
80

School of Business & Economics
7. ANALYSIS This chapter presents the analysis of empirical finding from the correlation results,
industry description of food industry of Pakistan as well as the literature review.
Moreover, this chapter gives the facts and figures of this research after hypothesis
testing and descriptive statistics regarding research question.
7.1 Research Question 1 Which level of supply chain integration exists between Haleeb Foods and its distributors?
For answering research question 1, authors have used the descriptive result which they
have got from the respondents of the questionnaire (distributors of Haleeb foods). As
descriptive results are showing (3,60) that the information integration is important for
decision making and almost all the distributors agree upon the importance of
information sharing. As above mentioned in theory (Lee et al., 2000) describe that
information sharing has contribution in information integration. Yoon, (2008) defines
that lack of information sharing can be a cause of major problems in supply chain as
well as Li et al., (2011) describe a poor information sharing system is a “chronic
weakness” that leads to unbalance communication networks among partners which
result of ineffective performance of the chain. Furthermore, information integration a
dimension of supply chain integration. Hence, information sharing is a variable of
information integration that can be effected on the supply chain integration of Haleeb
foods and its distributors .
Second, descriptive statistics show that the compatible information system is
important, the authors found out there is no compatible system between the
distributors and Haleeb foods. According to (Nath and Standing, 2010) lack of IT is
not better for accurate and timely availability of data rather than there are more
chances of errors and time delays which increase productivity cost. Additionally,
compatible system is very important for Haleeb foods and its distributors, they can
increase the integration between them as a result increase the productivities and
performance of the supply chain.
81

School of Business & Economics
Third, after getting the result from descriptive statistics that collaborative planning is
not introduced between Haleeb foods and its distributors. Most respondents disagree
about this statement. Lack of information technology leads to lack of collaborative
planning and disturbance in the production process (Günter et al., 2006). Hence,
collaborative planning process is the most dominating factor between Haleeb foods
and distributors.
Fourth, according to the descriptive statistics that Haleeb foods has no real time
information to make a common demand forecast from distributors. Out of 178
distributors, approximately 93% said that there is no real time information sharing for
common demand. Alfalla-Luque et al.,(2013) describe that actual information
directly from the customers end to make a common demand forecast in order to avoid
trouble. Therefore, to get the real time demand from the distributors Haleeb foods
need to increase the information sharing and use of better information technology to
avoid disruption in demand forecast.
Fifth, result of descriptive statistics shows the joint replenishment forecasts are
common practice between the Haleeb foods and its distributors. Nath and Standing,
(2010) illustrate that information technology between partners of the supply chain that
lead to ruthless process management. Hence, Haleeb foods is getting data from
distributors manually or making an assumption of forecasting that is inaccurate and it
leads to high level of inventory at the warehouse and a sometime shortage of
inventory.
7.1.1 Level of information integration between Haleeb Foods and Distributors
Viewing up what manufacturing firms are doing today with their distributors to
improve their efforts to keep their product information update, since the choices made
about supply chain integration (Cagliano et al .,2006). The level of supply chain
integration has strong connections of effectiveness and proficiencies of supply chain
management. It is logical argue that level of supply chain integration has effected that
82

School of Business & Economics
how organizations accomplishing their goals and how successful they are to get
getting the planned result (Kim, 2009).
Based on a literature review of the SCI, the authors identify the existing level of
supply chain integration. The below table shows our contribution to this research in
order to answer the research question one .
Table: 7.1 Assessment of variables of information integration Variables of Information Integration
Low
Medium
High
Information sharing Not sharing information across the department
Relatively high sharing of information across the department
Sharing information with supplier and customer to improve decision making
Information technology integration
Manual communication system and Internet use for limited purpose
Use of database management system , limited use of EDI
Compatible information system. EDI , ERP.
Collaborative planning Not used Less use of planning process with various companies
Use of CRP , VMI to improve the planning process of comprehensive SC
Joint demand forecasts Not used
Assumption on demand information and manual data collection from customers
Real time information from customers to make demand forecast, VMI , CPFR
Joint replenishment forecasts Not used Insufficient information
in procurement activities
Sufficient information to perform procurement activities, supplier have access supplier have access to the production plant.
(Source: own )
Logically, collaborative efforts of all members of supply chain give right direction to
decision making, consequently the result will be best and help in improving the
performance of the entire supply chain (Bidgoli, 2010).
According to the conducted survey the descriptive statistics below table (7.2) shows
the actual result of the information integration (dimension of SCI) between the Haleeb
foods and 178 distributors.
83

School of Business & Economics
Table:7.2 Level of information integration of Haleeb foods and its distributors
(Source: own )
Table 7.1 interpreted the result of overall level of information integration between
Haleeb foods and its distributors, in this dimension of supply chain integration, the
authors found out average level of information integration is low. Information sharing
between the Haleeb foods and distributors is at a medium level because there is a
relatively high sharing of information but no usage of information in decision
making. Information technology integration a bit low in between the Haleeb foods and
its distributors because they do not use information system like ERP, VMI and they
limited use of internet etc. Collaborative planning is also low between Haleeb foods
and its distributors because they do not use any kind of common collaborative
planning system. For joint demand forecast there is no such system uses like CFRP
that can share the real time demand information from the customers end that become a
cause of low level of joint demand forecast. The joint replenishment forecasts fall into
the medium level between Haleeb foods and its distributors because they use the
information for replenishments but still there is a vacuum for the procurement
activities and access of production plant information to suppliers as well as to
distributors.
7.1.2 The level of coordination resource sharing between Haleeb foods and Distributors The second dimension of supply chain integration named as coordination resource
sharing is discussed. First, according to descriptive statistics result mean value (1,60)
clearly shows that Haleeb foods and its distributors don not give importance to shared
decision making. According to Alfalfa-Luque et al., (2012) in supply chain, member
with the best negotiation position lead to the decision making of the SC. Hence,
Variables of Information Integration
Low
Medium
High
Information sharing
Information technology integration
Collaborative planning
Joint demand forecasts
Joint replenishment forecasts
84
School of Business & Economics
statistics show that both Haleeb foods and distributors make business decisions their
self without any other supply chain partner's involvement.
Second, descriptive statistics show the result about the same business objective almost
all the respondents of the survey have strongly agreed and agree that Haleeb foods and
its distributors have the same objective. Qin, (2010) argues that same objective of the
supply chain partners develops the cooperation among them and it leads to high level
of SCI. According to mean of descriptive statistics (4,41) that shows that distributors
cooperate with Haleeb foods for achieving the same objectives. Hence, the Haleeb
foods and its distributor have somehow same objective and goal that lead to better
progress in between them.
Third, Descriptive statistics finding shows (4,40) mean value of work realignment.
Thus, the work realignment between the Haleeb foods and its distributors is a common
practice. Jespersen and Skjött-Larsen, (2005) illustrate that in the supply chain
integration all the partners need to work in a balanced way to get common goal.
Almost distributors agree upon it that Haleeb foods and distributors plan the work
realignment load or work in a balance way.
Fourth, according to survey results, mostly distributors agree upon it that Haleeb
foods and its distributors use the same third party logistics. Descriptive statistics show
mean values (4,62) that Haleeb foods and its distributors use the same third party
logistics services. According to Winner, (2008) common use of logistics party provide
a high level of customer service and help to improve the relationship between the
manufacturer and distributors, ultimately higher the supply chain performance.
Fifth, descriptive statistics shows distributors and Haleeb foods don’t practice on
packaging customization and standardization to facilitate handling , transport, reduce
costs and insure quality. According to the mean value (1,45) that indicate the
distributors and Haleeb foods are ignoring packaging customization and
standardization. Consequently, Handfield and Nichols (1999); Frohlich and
Westbrook, ( 2001) argue that manufacturers should get involve with other supply
chain partners with making common strategies. Hence, Haleeb foods and its
distributors are not working on packaging customizing and standardization that will
help to increase the handling and transportation cost.
85

School of Business & Economics
Sixth, descriptive statistics show mean values (1,56) of variable agreement on delivery
frequency which is very low. According to Spole, (2012) the practice of agreement on
delivery frequency reduce the inventory cost and optimize the logistics operations.
Hence, distributors and Haleeb foods are not jointly involved in agreements on
delivery frequency to optimize in the procurement and distribution of products for
example Lead time, on time delivery.
Seventh, the descriptive finding shows Haleeb foods and its distributors use the
common logistics containers to facilitate the handling operations loading and
unloading, mean value (4,29) of descriptive statistics is quite satisfied. According to
the (Grawe, 2009) common use of containers and logistics equipment generate
competitive benefits and increase the level of supply chain integration between the
partners. Thus, Haleeb foods and its distributors give the importance to this process
that make the clear difference in their SCI level.
Eighth, descriptive statistics show the Haleeb food and distributors facing the lack of
process integration, mean value (1,42) shows that this practice is ignored. According
to (Wisner, 2011) lack of sharing information , lack of sharing resources and no
jointly work together that lead to lack of process integration.
Table: 7.3 Assessment of variables of coordination resource sharing Variables of coordination resource sharing
Low
Medium
High
Shared decision making Bullwhip effect, increase the stock
Assortment planning, forecasting, inventory management
Lower inventory level, reduced transportation and handling costs
Cooperation
Limited access to a shared database within the individual company.
The partner must know each other thoroughly prior business transaction
Cooperative partners, top management are keenly involved in the Integration process to achieve the target goals
Work realignment Relatively low degree of integration
Less coordination with SC partners
Plan the work load in a balanced way
Reorganization of outsourcing .Common use of third party logistics
Not used Enhancement in
logistics
86

School of Business & Economics
Packaging customization/standardization Not used
Not preferable in short term relationship
Reduce handling and transportation cost and ensure quality
Agreement on delivery frequency Verbally , personally
Agreements on short term basis
Optimization upstream and downstream (throughout SC)
Common use of logistics equipment/ containers
Not used
Logistics reflect acute activities
Common use of logistical containers to enable handling process.
Process integration Not used
Collaboration between buyers and sellers in product planning and development
To use the process approach to avoid duplication.
(Source: own )
Table :7.4 Level of coordination resource sharing
(Source: own )
Table 7.2 is a description of the supply chain integration dimensions (level of
coordination resource sharing) between the Haleeb foods and its 178 distributors
across the Pakistan. According to this table there are three categories low medium and
high level of coordination resource sharing. Authors have got the results from the
Variables of coordination resource sharing Low
Medium
High
Shared decision making Cooperation Work realignment Reorganization of outsourcing /common use of third party logistics
Packaging customization/standardization Agreement on delivery frequency Common use of logistics equipment/ containers Process integration
87

School of Business & Economics
distributors through the survey and put the result into the statistical analysis.
According to Lee et al .,(2006) and Allfala-Luque et al., ( 2012) coordination
resource sharing has 8 variables. On the basis of descriptive statistics 3 variables out
of 8 i.e. Shared decision making, packaging customization/ standardization and
process integration fall into the low level of integration. Further, 3 variables out of 8
i.e. Cooperation, work realignment and agreement on delivery frequency are fall into
the medium level of integration. Furthermore, 2 out of 8 variables reorganization of
outsourcing/ common third party logistics and common use of logistics equipment/
containers fall into the high level of integration.
7.1.3 Level of organizational relationship linkage between Haleeb foods and Distributors According to the descriptive statistics of the third dimension of supply chain
integration, Haleeb foods and its 178 distributors have a particular level of
organizational relationship linkage which has shown through the descriptive findings.
This dimension of supply chain integration has 9 variables all of these variables are
very important and basic tool to find the level of organizational relationship linkage
between the two business units and departments.
First, Haleeb foods and distributors have no proper communication channels , mean
value of the descriptive statistics show (1,55). Rose, (2011) argues that proper
communication channel help to reduce the inventory level and create a better network
between supply chain partners. Therefore, Haleeb foods and its distributors don’t have
proper communication channels that lower the supply chain integration level between
them.
Second, Haleeb foods and its distributors are not establishing common performance
indicators and aligned. According to descriptive statistics (1,45) that they are not
using the common performance indicators. Chen et al., (2012) describe that supply
chain members should have appropriate understanding about the internal and external
business process and establish together performance indicators in order to get a high
level performance of SCI.
88

School of Business & Economics
Third, according to descriptive statistics (1,51) Haleeb foods and its distributors do
not share the risk, cost and reward system. Harrison et al., (2004) highlight in their
studies that firms should share risk and reward equally to gain the high level
integration between supply chain partners. Hence, therefore, Haleeb foods and its
distributors have somehow low level of organizational relationship linkage.
Fourth, likewise Flynn et al., (2011) firms need to do the effective plan together with
supply chain partners to get maximum satisfaction and a high level of supply chain
integration. Furthermore, according to descriptive statistics (4,08) that indicate that
both parties promote an attitude and plans of action to support an integrated business
performance.
Fifth, descriptive statistics shows (4,50) that Haleeb foods and its distributors are
focused on customer satisfaction. They involve for the joint establishment of objective
for the end customers satisfaction. Handfiled and Nichols, ( 2002) argues that the
joint establishment system should between the partner to measure the performance of
supply chain integration.
Sixth, descriptive statistics shows the mean value (1,65) that Haleeb foods and its
distributors don’t share their skills ideas and institutional and cultural. Supply chain
integration requires a good relationship between firms for sharing skill knowledge and
ideas (Gattorna, 1998). It is very clear indicator that Haleeb foods and its distributors
have lack of sharing skills and ideas between them.
Seventh, another problem found between the Haleeb foods and its distributors that
they are not involved in drawing contingency plans for quick problem solving
regarding unsuspecting business situation. Descriptive statistics show the value (1,75)
that is very low. Briscoe and Dainty, (2005) highlight that drawing a contingency plan
to work together as unite a team that leads to effective supply chain integration.
Eighth, according to the descriptive statistics (4,33) , Haleeb foods and distributors
establish stable links with each other for maintaining long term relationship.
According to (Rose , 1996) for maintaining long-term relationship require the mutual
trust between the partners. Hence, Haleeb foods and its distributors seek long term
relationship in order to get high level of supply chain integration.
89

School of Business & Economics
Ninth , result of descriptive statics shows (1,64), Haleeb foods and its distributor both
of are not giving importance to encourage the team building to allow for coordination
and active cooperation between different departments. Beecroft et al., (2003) argue
that working as team help to control supply chain activities that result is to better
performance of the whole supply chain.
Any one of these variables fall in low level of supply chain integration faces problems
regarding communication with partners, trust and also effect on the performance of
the whole supply chain. Furthermore, this dimension has its own importance like
“CRS involves realignment of decisions and responsibility in the supply chain”
(Skjott-Larsen et al., 2007 ; p 26 ).
Table:7.5 Assessment of variable of organizational relationship linkage Variables of Organizational relationship linkage
Low
Medium
High
Design and maintaining of communication channels
Less use of communication channels
Desired level of communication channels.
Enables closer cooperation with member of SC partners
Laying down performance measures
Performance measurement on requiring financial reporting to top management
Communicate company's performance with SC partners
Establish common performance indicators as well as alignment of demand with supply
Incentive realignment Miss communication between SC partners
Better decision making through sharing of information.
Collective responsibilities of risk and benefits sharing
Integrated behavior Not used Inefficiencies in SC Highest level of performance improvement
Joint establishment of objectives for all parties in the chain
Not used Plain to achieve customer satisfaction
Achieved customer satisfaction
Sharing of skill, ideas and institutional culture
Not used Within the organization
Circulate best practice among the supply chain partners to lead performance achievement
Drawing up of contingency plan for quick problem solving
Not used Somehow make plans to overcome unexpected situations
Plans to overcome an unexpected situation
Forging and Not used Lack of mutual trust in Trust enables long term
90

School of Business & Economics
maintaining long term relationship
short term relationship relationship
Creating a team works along SC and cross functional teams
No cross functional team
Cross functional team in any area of SC
Figuring out active cooperation between members of the supply chain
(Source: own )
According to above table all these dimensions are very important in supply chain
integration. All these dimensions have their own importance like Furthermore “ORL
include communication between members and performance measurement and sharing
common visions and objectives” ( Skjott-Larsen et al., 2007 ; p. 26). If there is a high
level of supply chain integration in ORL then, the members of supply chain
communicate with each other with a high degree of mutual trust and incorporated and
as well as sharing their skills and ideas to achieve common advantage and common
goals (Mouritsen et al.,2003).
Table:7.6 Level of organizational relationship linkage
Variables of Organizational relationship linkage Low
Medium
High
Design and maintaining of communication channels Laying down performance measures Incentive realignment Integrated behavior Joint establishment of objectives for all parties in the chain
Sharing of skill, ideas and institutional culture Drawing up of contingency plan for quick problem solving
Forging and maintaining long term relationship Creating a team works along SC and cross functional teams
(Source: own)
According to the table 7.6 organizational relationship linkage dimension of supply
chain integration shows that Haleeb foods and its distributors have an overall low
91

School of Business & Economics
level of organizational relationship linkage. It has 9 variables and 7 out of 9 falls in
the low level of integration and 2 falls into the medium level.
Low level of integration variables is designed and maintaining of communication
channels, incentive realignment, integrated behavior, sharing skills and ideas, drawing
up of contingency plans for quick problem solving, forging and maintaining long term
relationship and creating team work along SC.
Medium level of integration variables is lying down performance measuring and joint
establishment of behavior for all parties in the chain.
7.2 Research Question 2 Which barriers are existing to supply chain integration between Haleeb foods
and its distributors?
According to literature authors have used in theory chapter , supply chain integration
has lots of complications which are restrict the whole chain (Glenn Richey Jr et al.,
2009). Every kind of business, distributors and venders they all are face obvious
barriers.. Moreover, information sharing, technology and control systems are major
and frequently barriers in supply chain integration (Thomas et al,. 1984). This
research paper highlight the barriers which are existing in a Pakistani business
environment particularly between the manufacturers and distributors in the food
industry. Katunzi, (2010) highlights that lack of information technology, lack of
information sharing, lack of trust, demand distortion, incompatibility of information
system, and lack of knowledge and cost of integration are the main barriers to supply
chain integration.
Table:7.7 Barriers to supply chain integration according to the literature
Barriers Description Lack of information technology Gunasekaran and Ngai, 2004; Yu et al., 2001; Günter et al.,
2006; Nath and Standing, 2010; Sheu et al., 2006. Lack of information sharing
Wisner et al., 2008; Tai, 2011; Hsu et al., 2008; Fumero and Dominguez, 2012; Fumero and Dominguez, 2012; Yu et al., 2001; Kulp et al., 2004.
Lack of trust
Narayanan and Raman, 2004; Katunzi, 2010; Moorman et al., 1993; Beth et al., 2003; Kelle and Akbulut, 2005; Gunasekaran and Sandhu, 2010; Blecker et al., 2007; Yeung
92

School of Business & Economics
(Source : own )
Above table describes the different authors who have discussed about the different
barriers which authors of this paper have been used in theory chapter. All these
barriers are the basic ingredients for research question 2. It has proven that these are
the obvious barrier to supply chain integration.
H1:Different barriers to supply chain integration has significant impact on supply
chain integration at Haleeb foods.
The results prove that the relationship between the barriers to SCI and supply chain
integration between the distributors and Haleeb foods is very strong in Pakistan food
industry.
According to Weinberg and Abramowitz (2002), the Pearson correlation acceptable
value of variables are:
r= ±0, 50 indicate a strong relationship between variables
r= ± 0,30 indicate moderate relationship between
r=± 0,10 indicate weak relationship
There are 10 relationships found between supply chain integrations II, CRS and ORL
(three dimensions) and barriers to supply chain integration. All these relationships are
strong and moderately correlate with each other.
According to findings, there are 2 relationships found between the Information
integration (II) and variables “ Barrier to supply chain integration”. Both of the
relationship interpreted that the distributors have low use of collaborative planning
et al., 2009; Li et al., 2009;Sahay, 2003;Sako, 1991; Svensson, 2001;Yeung et al., 2009; Ojala and Hallikas, 2006.
Demand distortion – Bullwhip effect Hugos, 2011;Lawrence et al, .2011; Lee et al., 2004;Fiala, 2005;Lee et al., 2004; Taylor and Brunt, 2001.
Systems incompatibility Fawcett and Magnan 2001; Themistocleouns et al., 2004; Kinsey and Ashman, 2000; Zhao et al., 2010; Katz and Shapiro, 1994; Gunasekaran and Sandhu, 2010; Gunasekaran and Sandhu, 2010.
Lack of knowledge/Poor human resource
Katunzi, 2010; Gunasekaran et al., 2008.
Cost of integration
Chu and lee, 2006;Stefansson, 2002;Bagchi and skjötte-Larsen, 2002;Lee et al., 2004.
93

School of Business & Economics
and joint replenishment, as face the lack of information technology and lack of
information sharing between Haleeb foods and them.
1. Lack of information sharing (barrier) between the distributors and Haleeb
foods moderately impact on level of information integration (r = 0,211).
2. Lack of information technology (barrier) has a strong impact on level of
Information integration between the distributors and Haleeb foods ( r = 0,683).
All the Pearson correlations are significant. As presenting the level of information
integration is very low in the descriptive analysis due to lack of information sharing
between Haleeb foods and its distributors. Information integration has moderately
correlate with the lack of information sharing and strongly correlate with lack of
information technology. According to Lee, (2000) ; Alfalla-Luque et al., (2012);
Bagchi andSkjöett-Larsen, (2005) information integration always give importance to
information sharing and information technology internally and with other member of
the supply chain and has an effect on sales forecasts, demand forecast, collaborative
planning , joint decision making and replenishment forecasts. Hence, Haleeb foods
and its distributors has a lack of information sharing and information technology in
day to day activities and operations that can be a major cause of weakening the
information integration. See Appendix for further detail (IV, V, VI, VII and VIII).
94

School of Business & Economics
Table:7.8 Correlation between supply chain integration ( II, CRS and ORL) and Barriers to supply chain integration
Lack of information tecnology
Lack of information sharing
Lack of trust
Demand distortion –
Bullwhip effect
Systems incompatibil
ity
Lack of knowledge/Po
or human resource
Cost of integration
Pearson Sig. (2-tailed)
Pearson Sig. (2-tailed)
Pearson ,211**
Sig. (2-tailed) ,005Pearson
Sig. (2-tailed)Pearson ,683**
Sig. (2-tailed) ,000Pearson
Sig. (2-tailed)Pearson -,159* -,214**
Sig. (2-tailed) ,034 ,004Pearson -,147*
Sig. (2-tailed) ,050Pearson
Sig. (2-tailed)Pearson
Sig. (2-tailed)Pearson
Sig. (2-tailed)Pearson
Sig. (2-tailed)Pearson ,602**
Sig. (2-tailed) ,000Pearson
Sig. (2-tailed)
Pearson ,197**
Sig. (2-tailed) ,008Pearson
Sig. (2-tailed)Pearson ,204**
Sig. (2-tailed) ,006Pearson
Sig. (2-tailed)
Pearson ,220** ,172*
Sig. (2-tailed) ,003 ,022Pearson
Sig. (2-tailed)Pearson
Sig. (2-tailed)Pearson
Sig. (2-tailed)*. Correlation is signif icant at the 0.05 level (2-tailed).**. Correlation is signif icant at the 0.01 level (2-tailed).
organ
izatio
nal re
lation
ship l
inkag
e
Design and maintaining of
Laying down performance
Incentive realignment Integrated
behavior Joint
establishment of objectives
Sharing of skills, Ideas and Drawing up of
contingency Forging and
maintain long Creating
teamwork
Coord
inatio
n reso
urce l
inkag
e
Shared decision-
Corporation
Work realignment
Reorganization
f i Packaging customisation/s Agreements on delivery
Common use of logistics
Process integration
Barriers to Supply Chain Integration
inform
ation
integ
ration
Information sharing
Information technology
Collaborative planning
Joint demand forecasts
Joint replenishment
(Source: own )
There are 4 relationships found between coordination resource sharing and variables
“barriers to supply chain integration”. Three of them relationships are significant and
moderately negatively correlated with each other and one out of four is strongly
correlated.
1. Lack of trust (barrier) has moderately negative impact on the level of
coordination resource sharing between the distributors and Haleeb foods ( r = -
0,159).
95

School of Business & Economics
2. System incompatibility has moderately negative impact on the level of
coordination resource sharing between distributors and Haleeb foods (r = -
0,214).
3. System incompatibility has moderately negative impact on the level of
coordination resource sharing between distributors and Haleeb foods ( =0,
147).
4. Lack of information technology has strong impact on the level of coordination
resource sharing between Haleeb foods and its distributors (r = 0,602).
Alfalla-Luque et al., (2012) highlight that coordination and resource sharing always
compel to the organizations for working together. It is about the mutual trust and
requirements between the supply chain partners .I.e. Information technology.
According to correlation results, lack of trust and system incompatibility has
significant impact on cooperation, as well as system incompatibility shows
relationship with work realignment. Lack of information technology show the
significant relationship with process integration.
There were 4 relationships found between organizational relationship linkage ORL
(dimension of supply chain integration) and variables “ barriers to supply chain
integration. All the variable is significant and moderately correlate with each other,
low laying down performance, low integrated behavior and less sharing skills and idea
between distributors and Haleeb foods strongly increases the lack of IT , lack of
information sharing, lack of trust and also increases the cost of integration.
1. The cost of integration (barrier) has a moderate impact on level of
organizational relationship linkage between distributors and Haleeb foods (r =
0,197).
2. Lack of trust ( barrier) has a moderate impact on level of organizational
relationship linkage between Haleeb foods and its distributors (r = 0,204).
3. Lack of information technology (barrier) has a moderate impact on level of
organizational relationship linkage between Haleeb foods and its Distributors
(r =0220).
96

School of Business & Economics
4. Lack of information sharing (barrier ) has a moderate impact on level of
organizational relationship linkage between Haleeb foods and its distributors (r
=0, 172).
Moreover, the hypothesis H1 support of the relationship between the barriers to SCI
and supply chain integration, even some relationship are negative but still strongly
correlate each other. Hence, there are some barriers to supply chain integration
between the Haleeb foods and its distributors and these barriers lesser the performance
of supply chain and become the cause of the lower level of supply chain integration.
7.2.1 Sub hypothesis:
H1a: There is the significant impact of lack of information technology on the level
of information integration
The finding indicates that the lack of information technology has a significant impact
on the information integration. First of all, Haleeb foods and its distributors don’t use
the latest information technology to share their daily business operations activities like
common demand forecasting, planning and joint replenishment. All these activities
lower the level of information integration and joint decision making. There might be
a reason of geographical impact that authors have discussed in industry description
chapter, developing country are facing lack of information technology. Sheu et
al.,(2006) highlight in their study that information technology play a vital role to
promote information among the partners. Somehow survey descriptive statistics show
that they have a lack of information technology. The Pearson correlation result shows
that lack of information technology has strongly correlate (r=0, 323) with the
information integration, that clearly indicate the impact of lack of information
integration on information integration.
H1b: There is significant impact of lack of information technology on level of
coordination resource sharing
97

School of Business & Economics
The result of correlation between lack of information technology and coordination
resource sharing strongly correlate (r=0, 167). Coordination resource sharing
discusses to the readjustment of the resources and decisions of inter and intra
organizational logistics and outsourcing (Alfalla-Luque et al.,2012). Information
technology has a great impact on coordination resource sharing, lack of information
technology lead to level of coordinated resource sharing.
H1c: There is the significant impact of lack of information technology on lack of
organizational relationship linkage
The findings show that there is no relationship between the lack of information
technology and organizational relationship linkage. ORL refers to the transparent
relationship between the supply chain members and sharing the skill and knowledge
(Alfalla-Luque et al.,2012). There is no impact of lack of information technology to
build a relationship between the supply chain partners.
H1d: Lack of information sharing has significant impact on the level of
information integration.
According to the Pearson correlation result there is no relationship found between the
lack of information sharing and information integration. Therefore, this hypothesis
H1d not supported .
H1e: Lack of information sharing has significant impact on coordination resource
sharing.
The finding of this hypothesis weak relationship between the lack of information
integration and coordination resource sharing (r= -0,007). This relationship clearly
indicates that Haleeb foods and its distributors do not share the proper and complete
information within the departments and with other supply chain partners. Information
sharing and availability of information to reduce the uncertainty (Tai, 2011). As a
result, they face the difficulties in readjusting the research and decision making that
lead to low level of coordination resource sharing between them.
H1f: Lack of information sharing has significant impact on organizational relationship linkage
98

School of Business & Economics
There is no relationship found between the lack of information sharing and
organizational relationship linkage between Haleeb foods and its distributors. Hence,
the hypothesis H1f not supported.
H1g: There is the significant impact of lack of trust on the level of information integration
The finding shows, that there is no relationship between lack of trust and level of
information integration. It means that trust has no impact on the level of information
integration between Haleeb foods and its distributors. Therefore, this hypothesis H1g
not supported .
H1h: There is the significant impact of lack of trust on level of coordination resource sharing.
According to the Pearson correlation result, there is a moderate relationship (r= -
0,132) between lack of trust and level of coordination resource sharing. Trust is
important aspect for the coordination resource sharing among the supply chain
partners. Trust is seen as a major factor in the supply chain due to lack of information
sharing. Trust develops over the time period between partners on daily base
communication (Prajogo and Olhager, 2012). Somehow Haleeb foods and its
distributors has no trust with each other that lower the level of coordination resource
sharing.
H1i:There is the significant impact of lack of trust on level of organizational relationship linkage.
There is no relationship found between the lack of trust and level of organizational
relationship linkage between the Haleeb foods and its distributors in Pakistan .Hence,
this hypothesis H1i not supported.
H1j: There is the significant impact of demand distortion on the level of information integration.
There is no relationship found between the demand distortion-bullwhip effect and
level of information integration . Therefore, this hypothesis H1j not supported.
99

School of Business & Economics
H1k:There is significant impact of demand distortion-bullwhip effect on level of coordination resource sharing.
According to the result of correlation, there is no relation found between the demand
distortion-bull whip effect and level of coordination resource sharing. Therefore, this
hypothesis H1k not supported.
H1l: There is the significant impact of demand distortion-bullwhip effect on level of organizational relationship linkage
The finding shows (r= -, 039) the relationship between the demand distortion-bull
whip effect moderately impact on the level of organizational relationship linkage.
According to (Fiala, 2005) bullwhip effect occur when there is communication
variation between partners and they mislead about the demand and then they take the
wrong decision about demand forecasts. Hence, Haleeb foods and its distributors are
not sharing the exact inventory levels the results they face the bullwhip effect.
H1m: There is the significant impact of system incompatibility on the level of information integration .
According to results of correlation between the system incompatibility and level of
information integration there is a moderate relationship (or = -0,042). Information
integration refers to the inventory, demand order, planning, forecasts and joint
replenishment all the information sharing through the information integration within
the supply chain partners (Alfalla-Luque et al., 2012). Furthermore, communication is
very important for each member of the supply chain when its needed and it can be a
main problem due to incompatibility of information system. (Fawcett and Magnan
2001). There is the negative relationship found between the Haleeb foods and its
distributor’s system incompatibility. On the other hand, supply chain integration could
be more valuable and helpful for the supply chain partners when all the members have
a compatible system (Kinsey and Ashman, 2000). Hence, lack of system
incompatibility between Haleeb foods and distributors has negative impact on
information integration that could lower the level of information integration.
100

School of Business & Economics
H1n:There is significant impact of system incompatibility on level of coordination resource sharing.
The finding shows the strongly correction (r= -0,092) between the lack of system
incompatibility and level of coordination resource sharing. It is clearly defines that if
the lack of system incompatibility is exist then the level of coordination resource
sharing is decrease between the Haleeb foods and its distributors. It is important to
share the resources, and logistics activities the system should be incompatible between
the supply chain partners (Fawcett and Magnan, 2001).
H1o:There is the significant impact of system incompatibility on level of organizational relationship linkage.
The result of correlation shows weak relationship (=-0,028) between the system
incompatibility and organizational relationship linkage between the Haleeb foods and
distributors. Organizational relationship linkage is about the sharing risk, exchange
culture and create the same objective between the business partners. Without the
compatible system, it's quite difficult to get the expected result. In the food sector the
information sharing could be more beneficial when all the supply chain partners have
the same information system (Kinsey and Ashman, 2000). Hence, there is no
common information system between the Haleeb foods and its distributor which
cause as low level of organizational relationship linkage between them.
H1p: There is the significant impact of lack of knowledge on the level of information integration .
According to the finding, there is no correlation between the lack of knowledge and
level of information integration. Statistics description shows that, there is no
significant impact on information integration even Haleeb foods and distributors has
lack of knowledge and poor human resources at both ends. Therefore , this hypothesis
H1p not supported.
H1q: There is significant impact of lack of knowledge on level of coordination resource sharing.
The correlation result shows the strong relationship (r=-0,057) between the lack of
knowledge and coordination resource sharing. Lack of knowledge about management
is a big obstacle in decision making and problem in coordination and sharing skill
101

School of Business & Economics
(Katunzi, 2010). Negative relationship clearly defines that Haleeb foods and its
distributors has lack of knowledge and poor human resources both of them do not
share their resources and other logistics activities knowledge with each other.
Furthermore, lack of knowledge lower the level of coordination resource sharing
between both of them.
H1r: There is the significant impact of lack of knowledge on level of organizational relationship linkage.
The finding shows the strong correlation (r = -0,089) between the lack of knowledge
and organizational relationship linkage. According to negative results of a
relationship, lack of knowledge and poor human resource has an impact on sharing
skills and culture and joint performance measurement and facing the problem is
operations strategies. (Gunasekaran et al.,2008). Moreover, lack of knowledge and
poor human resource lower the level of organizational relationship linkage between
Haleeb foods and its distributors.
H1s: There is significant impact on cost of integration on the level of information integration.
The finding shows that there is no significant relationship between the cost of
integration and information integration. Hence, the hypothesis H1s not supported.
H1t: There is significant impact of cost of integration on level of coordination resource sharing.
The finding shows that there is no significant relationship between the cost of
integration and coordination resource sharing. Therefore, this hypothesis H1t not
supported.
H1u: There is significant impact on cost of integration on level of organizational relationship linkage
The finding shows that there is no significant relationship between the cost of
integration and organizational relationship linkage. Therefore, the hypothesis H1u not
supported.
102

School of Business & Economics
8. CONCLUSION This chapter contains the conclusion of research work. It also provides the summary
of answers to research questions and also highlights the theoretical and practical
contribution to this research as well as limitations and recommendation for future
research.
This study was aimed to identify the level of supply chain integration between the
Haleeb foods and its distributors in Pakistan. According to the previous literature on
supply chain integration there are some barriers to supply chain integration. Authors
have studied existing barriers to SCI on Haleeb foods and its distributors.
Furthermore, identifying the most common barriers with the help of hypothesis
results.
8.1 Answer to research questions 1:
Which level of supply chain integration exists between Haleeb foods and its
distributors in Pakistan?
The finding of analysis of descriptive statistics shows the level of supply chain
integration dimensions are low/ medium between Haleeb foods and its distributors in
Pakistan. This research based on these three dimensions of supply chain integration
which are clearly defined by the (Lee, 2000) cited (Alfalla-Luque et al.,2012). Each
dimension has particular parameter to see the level between partners or members of
the supply chain.
First dimension, defines the contribution of information sharing and information
technology between the Haleeb foods and its distributors but they could not share
proper information and do not use sufficient information technology that lead the
inappropriate demand order, joint planning and forecast between the Haleeb foods and
ultimately affect the shared decision making as a result, information integration level
become law.
103

School of Business & Economics
Table: 8.1 Level of supply chain integration at Haleeb foods Dimension Low Medium High
1-Information integration
2-Coordination resource sharing
3-Organizational relationship linkage
(Source: own )
Second dimension, defines that supply chain partner must be upon the shared resource
and common logistics activities, Haleeb foods and distributors are willing to share
resources and other logistics activities. But at the same time the business environment
and culture of business does effect, On the other hand no fear of losing the business
share. Therefore, they do not work together, do not have a mutual trust that lower the
coordination resource sharing level.
Third dimension, describes the objective and common vision, sharing of ideas, sharing
of skills, cultural and institutional performance measures of the supply chain
members. According to descriptive statistics, Haleeb foods and distributors do not
have a common objective, every one drags their own business share, no proper sharing
skills and ideas. This is therefore, that practices lower the level of organizational
relationship linkage.
Collectively, all the dimensions have low level between the Haleeb foods and
distributors that conclude that level of supply chain integration is low between the
Haleeb foods and its distributors in Pakistan.
8.2 Answer to research questions 2: What are the barriers to supply chain integration between Haleeb foods and its
distributors?
The finding of hypothesis results, there are some barriers to supply chain integration
between Haleeb foods and its distributors. The result shows the strong relationship
between the barriers to supply chain integration and levels of supply chain integration
dimensions. Even though few of them have negative relationship but still these barrier
effects of the integration of Haleeb foods and distributors.
104

School of Business & Economics
According the sub hypothesis finding, the most common barrier to Haleeb foods and
its distributors for example, integration or lack of information technology , lack of
information sharing, mutual trust, system incompatibility and lack of knowledge and
poor human resource.
Lack of information technology and lack of information sharing have effect on all
three dimensions level of (information integration, coordination resource sharing and
organizational relationship linkage).Mutual trust and system incompatibility have
effect on level of coordination resource sharing of Haleeb foods and its distributors.
Lack of knowledge and poor human resource has an effect on the organizational
relationship linkage of Haleeb foods and its distributors.
8.3 Theoretical contributions As mentioned earlier about that SCI has different meanings to different research and
different organizations. Moreover, there is no direct linkage in the past literature about
the levels of supply chain integration with the dimensions of SCI. However the main
contribution of this research is to find out the existing levels of SCI with the help of
the existing research by (Alfalla-Luque et al., 2012) about the SCI dimensions
(information integration, coordination resource sharing and organizational relationship
linkage). This research contributes to the information and knowledge about the current
levels in the SCI dimensions and barriers that affect the supply chain integration
distributors and Haleeb foods in Pakistan.
8.4 Practical contributions The data collected from distributors of Haleeb foods from Pakistan and used for the
analysis. The result from the analysis highlights the barriers to SCI and levels of SCI
between Haleeb Foods and its distributors in Pakistan. Hence, other companies
especially food industry’s supply chain partner can analyze that how to increase the
level of supply chain integration.
8.5 Recommendation for future studies We would like to recommend to future researchers to continue the research in this
perspective because the levels of SCI and barriers to SCI in any organization are a
105

School of Business & Economics
complex and multidimensional task. In our opinion it would be interesting to perform
the similar research from different dimensions and more possible barriers to SCI from
a manufacturer’s perspective. Since our focus of this research was done on the
distributors perspectives.
8.6Limitation The research begins with very interesting subject and also in interesting company
Haleeb foods and their distributors. We regret for not able to collect responses on time
with a long holidays in Pakistan due to Elections. Moreover, no information gathered
from 22 respondents out of 200, there might be a reason that they do not have internet
in their companies that’s why they did not respond to the questionnaire.
106

School of Business & Economics
9. REFERENCES.
I- BOOKS REFERENCES:
Anderson. V., (2004) “Research methods in human resource management” Chartered institute of personnel and development, Publication, London.
Babbie. E. R (2009), “The Basic of social research”, Cengage learning Publication, USA.
Babbie.E.R., (2011), “The basic of social research” Cengage learning publication, USA.
Bell. R and Cuthbertson. R., (2003), “Retail strategy, the view from the bridge”, Butterworth Heinemann, Amstredam, Boston.
Bidgoli. H (2010),“The handbook of technology management, supply chain management, marketing and advertising, and global management”, volume 2, John Wiley and Sons, Inc. Canada.
Bryman .A., (2012), “social research method” 4th edition, Oxford university press, New York.
Beecroft .G, Duffy. G and Moran. J (2003) The Executive Guide to Improvement and
publication by William A. Tony . USA.
Bergman. M., (2008), “Advances in Mixed Methods Research: Theories and Applications” SAGE Publication, London.
Blaikie .N., (2009), “Designing Social research, 2nd edition”, Publcation polity press, UK.
Blecker.T, George,Q and Salvador. F (2007) “RFID in operations and supply chain management: Research and applications” Hubert&co, Göttingen, publication, USA.
Browne. K, (2006) “Introducing sociology for as level” publication by polity press, UK.
Brayman. A and Bell. E., (2007), “Business research method, 2nd edition”, Oxford university press, London.
Chizzo. S. A., (1998), “Supply chain strategies: solutions for the customer-driven enterprise Software Magazine” , Supply Chain Management Directions Supplement, pp. 4–9.
107

School of Business & Economics
Chandra. C and Grabis. J (2007) “Supply chain configuration concepts, solutions, and applications” Springer publication, USA.
Collins. H, (2010)“Creative Research: The theory and practice of research for the creative industries, published by AVA , Switzerland.
Chan .H, Lettice .F and Durowoju .A(2012) “Decision-Making for Supply Chain Integration: Supply Chain Integration” , publication by springer, New York.
Creswell. W. J, (2009), “Research design: qualitative, quantitative, and mixed methods approaches”, Thousand Oaks, Calif : SAGE, Publication, London.
Christopher. M., (2005), “Logistics and supply chain management in creating value”, 3rd edition”, Great Britain publication. London.
Denzin. N. K and Lincoln. Y. S., (2005), “Handbook of Qualitative Research (3rd Ed)”, Sage publication, USA.
Dul.B J and Hak .T.,(2012), “case study methodology in business research” Elsevier Ltd publication, USA.
Eriksson. P and Anne. K., (2008), “Qualitative Methods in Business Research”, SAGE publication, London.
De Vaus. D (2002) “Surveys in the social research 5th edition” Routledge Taylor &Francis group, publication, Australia.
Dudek. G, (2009) “Collaborative Planning in Supply Chains: A Negotiation-Based
Approach,” published by Springer, New York.
Flynn. B, Morita. M, and Machuca .J ( 2011) “Managing Global Supply Chain Relationships: Operations: Strategies and Practices” publications by British Cataloguing, USA.
Gattorna. J (1998) “strategic supply chain alignment: Best practice in supply chain management” British library cataloguing, publication, USA.
Gratton .C, Jones. L , (2010)" Research Methods for sports studies" Routledge,
Canada.
Gattorna. J (1998) “Surviving Supply Chain Integration: Strategies for Small Manufacturers by Committee on Supply Chain Integration, Commission on Engineering and Technical Systems”, National Research Council National Academy of sciences, USA.
Gattorna. J. L (2003) “Handbook of supply chain management” Gower Publishing, England.
108

School of Business & Economics
Gattorna. J (1998) “strategic supply chain alignment: Best practice in supply chain management” British library cataloguing, publication, USA.
Gratton. C and Jones .I., (2010),”Research Methods for Sports Studies” Routledge publication, USA.
Greasley .P (2008) “Quantitative data analysis with SPSS”, Mc Grawhill international, USA.
Harrison. T, Lee. H, Neale. J, (2004) “The Practice of Supply Chain Management: Where Theory and Application Converge”, Springer Science and Business Media, USA.
Hyde. A, McDonnell. O and Lohan. M (2004) “Sociology for health professionals in Ireland” publication by first, Dublin.
Hugos. M. H (2011) “Essentials of supply chain management 3rd edition” Wiley, publication.
Han. J., (2006), “Supply chain integration: Quality management and firm performance in the pork processing industry in China” Wageningen Academic publication, Netherland.
Jespersen. B and Skjott-Larsen. T, ( 2005) “supply chain management: in theory and practice” , Copenhagen business school press , DK.
Johnson. B and Christensen L., (2012) “Educational research: quantitative, qualitative and mixed approaches” 4th edition, SAGE publication, London.
Kalton. G (1983) “Introduction to survey sampling, issue 35” Sage publication, USA.
Kumar. R., (2005) “Research methodology”, SAGE Publication , London .
Kothari C.R., (2006), “Research Methodology: Methods and Techniques, Second edition” , SAGE publication, London.
Kotzab. H, Seuring. S and Muller. M (2005), “Research methodologies in supply chain management”, Springer publication, USA.
Lan.Y and Unhelkar. B., (2006), “Global integrated supply chain systems” Idea group publishing, USA.
Lawrence. K. D , Klimberg. R. K and Miori. M.V., (2011),“The supply chain in manufacturing and distribution, and transportation: Modeling, optimizing, and application” CRC publication, USA.
Merriam S.B., (2009), “Qualitative Research: A Guide to Design and Implementation”, Publish by Jossey-bass, USA.
109

School of Business & Economics
Maynard. D.W, Houtkoop-steersta H, Zouwen. J and Schaeffer. N.C., (2002), “Standardization and tacit knowledge” Interaction and practice in the survey interview”, Wiley Publication, New York.
McBurney. D. H and White.T. L., (2009), “Research Method” 8th edition, published by Cengage learning, USA.
Mcnabb. D.E (2010), “Research Methods for Political Science: Quantitative and Qualitative Approaches” M.E Sharpe publication, USA .
National Research Council (2000), “Surviving supply chain integration strategies for small manufacturers”, publication, National Academies press, USA.
Neuman, W.L., (2003), “Social research methods: qualitative and quantitative approaches”, Allyn and Bacon, Boston.
Rrayman. A and Bell. E., (2007), “Business research method, 2nd edition”, Oxford university press, London.
Ross. D. F (2011) “Introduction to Supply Chain Management Technologies, Second Edition”, published by Taylor and Francis Group, US.
Ross. D (1996) “Distribution: Planning and Control”, publication by British library Cataloguing, USA.
Robert. B, Handfield, Ernest L. Nichols (2002) “Supply Chain Redesign: Transforming Supply Chains Into Integrated Value Systems” Financial Times Prentice Hall , USA.
Taylor. D and Brunt. D (2001)“Manufacturing operations and supply chain management: the lean approach” Cengage learning, publication , UK.
Thomas (2003) “Blending Qualitative and Quantitative Research Methods in Theses and Dissertations” Corwin Press, Inc. pg.
Saunders. M, Lewis .P, Thornhill. A., (2009)“Research methods for business student” fifth edition, Pearson education Limited, UK.
Seifert, D. (2002), “Collaborative Planning, Forecasting and Replenishment: How to
Create a Supply Chain Advantage”, Galileo Business, Kevelaer.
Seuring. S and Goldbach. M , (2002) “Cost Management in Supply Chains”
publication Physica Verlag Heidelberg, New York.
Shekedi. A., (2005) “Multiple case narratives: A qualitative approach to studying multiple populations” John Benjamins publishing company”, Netherlands.
110

School of Business & Economics
Skjott-Larsen .T, Schary. B. P, Mikkola. H.J and Kotzab. H (2007) , “Managing the Global supply chain” Copenhagen business school press, DK.
Spole .V (2012) “Supply chain management”, publication Dorling Kindersley, India.
Valentine. G and Aitken. S., (2006) “Approach to human geography” Sage publication Ltd, London.
Vrijhoef. R (2011) “Supply chain integration in the building industry: The emergence of integrated and repetitive strategies in a fragmented and project-driven industry” IOS press, publication, Netherland.
Wang. W. Y. C, Heng. M. S. H and Chau. P. Y. K (2007),“ Supply chain management: Issues in the new era of collaboration and competition”, Idea group Inc. Publication USA.
Wisner. J. D, Tan. K. C and Leong. K. G (2008) “Principles of supply chain management, 2nd edition” South western Cengage learning, publication, USA.
Wood .M and Ross-Kerr. J (2011) “ Basic steps in planning nursing research: From question to proposal” Jones and Bartlett learning publishers, Canada.
Xu.J, Yasinzai. M and Lev. B., (2013), “Proceedings of the sixth international conference on management science and engineering management” Springer-Verlag, London.
Yoon. S (2008), “the effect of information sharing in a two-step apparel supply chain” Proquest, publication, United States.
Wisner. J (2008) “Process Management: Creating Value in the Supply Chain:” Thomson Learning Academic, USA.
Wisner. J (2008) “Principles of Supply Chain Management: A Balanced Approach
South West”, Cengage learning, USA.
Wisner. J and Stanley. L (2008) “Process Management: Creating Value along the Supply Chain: Text and cases” , Thomson Learning Academic, USA.
Wang. W, Heng .M, Chau.P( 2007) “Supply Chain Management: Issues in the New Era of Collaboration and Competition” ,publication Library of congress Cataloging in publication data , USA.
Weinberg and Abramowitz. S (2002) “Data analysis for the behavioral sciences using
SPSS” Cambridge university press, UK.
111

School of Business & Economics
II- RESEARCH ARTICLES: Ahmed. F, Shah. H, Raza. I and Saboor. A., (2011) “ Forecasting milk production in Pakistan”, Pakistan jounal of agricultural research. Vol 24 no. 1-4.
Alfalfa-Luque .R, Madina-Lopez .C and Kumar dey. P., (2012), “supply chain integration framework using literature review”, Production planning and control, 1-18 first.
Asif. M, Fischer. O. M. A, and Bruijn. E. J, (2010), “An examination of strategies employed for the integration of management systems”, The TQM Journal, Vol. 22 No. 6, pp. 648-669.
Aviv. Y (2001) “The Effect of Collaborative Forecasting on Supply Chain Performance”, Management Science, Vol. 47, No. 10, October 2001 pp. 1326–1343.
Awan. U. M, Raouf A, Ahmad. N Sparks. L, (2009),"Total quality management in developing countries: A case of pharmaceutical wholesale distribution in Pakistan", International Journal of Pharmaceutical and Healthcare Marketing, Vol. 3 Iss: 4 pp. 363 – 380.
Bardi. E., Raghunathan. T and Bagchi. P. K, (1994), "Logistics Information Systems: The Strategic Role of Top Management," Journal of Business Logistics, Vol. 15, no. 1.
Bagchi. P. K and Larsen. T , (2002), “Integration of information technology and organizations in a supply chain” The international journal of logistics management vol. 14, pp. 90.
Berente. N, Vanderbosch. B and Aubert. B., (2009), “Information flows and business process integration”, Business Process Management, Vol. 15, No. 1, pp. 119-141.
Billah .U.I., (2013), “Cost minimization on techniques; a case of dairy product manufacturers in Pakistan” Information management and business review, vol.5, issue.1, pp 28-36.
Bresnen, M. and Marshall, N. (2000), “Partnering in construction: a critical review of issues, problems and dilemmas”, Construction Management and Economics, Vol. 18 ,No. 2, pp. 229-37.
Briscoe, G. and Dainty, A., 2005. Construction supply chain integration: an elusive goal? Supply Chain Management, Vol. 10, Issue.4, pp. 319–326. Brewer. P. C. And Speh. T. W., (2001), “Adapting the balance scorecard to supply chain management “, Supply Chain Management review, March/April, pp. 48-56.
Byrne. P. J and Heavey. C., (2006),“The impact of information sharing and forecasting incapacitated industrial supply chains: A case study”, Production Economics Vol.103, 420–437.
112

School of Business & Economics
Cagliano. R, Caniato. F and Spina. G (2006) “The linkage between supply chain integration and manufacturing improvement programs” International Journal of operations and production management , Vol.26, Iss.3 pp. 282-299.
Chizzo. S. A., (1998), “Supply chain strategies: solutions for the customer-driven enterprise Software Magazine” , Supply Chain Management Directions Supplement, pp. 4–9.
Chen F.T.S., (2003), “Performance measurement in a supply chain” International Journal of Advanced Manufacturing Technology, Vol. 21. No. 7. Pp. 534-48.
Chu. W.H.I. and Lee, Ch., (2006),“Strategic information sharing in a supply chain”, European Journal of Operational Research, Vol. 174, pp. 1567-1579.
Cohen. M. A and Lee, H.A., (1988), “Strategic analysis of integrated production-distribution systems: Models and methods”, Operational management, Res. 362216-228.
Cachon. G. P and Fisher. M., (2000), “Supply chain inventory management and the value of shared information”, Journal: Management Science, Vol. 46, issue. 8 pp. 1032–1048.
Cohen .L, Manion .L and Keith .M., (2007), “Research Method Education” Routledge Publication, USA.
Corsten. D. and Kumar, N., (2005), “Do Suppliers Benefit from Collaborative Relationships with Large Retailers? An Empirical Investigation of Efficient Consumer Response Adoption”, Journal of Marketing, Vol. 69, Issue. 3, pp. 80-94.
Cousins. P. D and Menguc. B., (2006),“The implications of socialization and integration in supply chain management” Journal of Operations management, Vol 24, Iss 5 pp. 604-620.
Fawcett. S. E, Magnan. G. M and McCarter. M.W (2008) “Benefits, barriers and bridges to effective supply chain management” Supply chain management: An international journal, Vol, 13 Iss, 1 pp.35-48.
Fiala. P., (2005), “Information sharing in supply chains”, the international general of management sciences, Volume 33, Issue 5, pp, 419–423.
Fliedner. G, (2003) “CPFR: an emerging supply chain tool” Industrial Management and data systems, Vol.103, Iss.1, pp. 14-21.
Flynna. B. B, Huo. B and Zhao .X., (2010), “The impact of supply chain integration on performance: A contingency and configuration approach” Journal of Operations Management, volume. 28, pp. 58–71.
113

School of Business & Economics
Frohlicha. M and Westbrook. R (2001) Arcs of integration: an international study of
supply chain strategies, Journal of Operations Management, Journal of Operations
Management, Vol. 19, pp. 185-200.
Forslund. H., (2009), “ERP systems´ capabilities for supply chain performance management” Industrial Management and data systems, Vol.110, Iss. 3, pp. 351-367.
Grover. V and Khawaja. A. S., (2007), "The Impact of Product, Market, and Relationship Characteristics on a lint-organizational System Integration in Manufacturer-Supplier Dyads”, Journal of Management Information Systems, Vol. 23.No. 4. Pp. 185-216.
Grawe .S (2009) Logistics innovation: a literature-based conceptual framework ,The International Journal of Logistics Management, Vol. 20 No. 3, pp. 360-377.
Groves. M. R, Fowler F.J, Couper M.P, Lepkowski J. M, Singer. E, Tourangeau. R., (2011), “Survey methodology”, Publication John Wiley and Sons. Inc, Canada.
Gropper. S, Smith. J. L and Groff. J. L (2009) “Advanced nutrition and human metabolism 5th edition” Cengage leraning, Publication, USA.
Gunasekaran. A, Ngai E.W.T., (2004), “information system in supply chain integration and management”, Journal: European operational research , Vol.159, Issue .2, pp. 269-295.
Gunasekaran. A, Lai. K and Cheng. T. (2008) “Responsive supply chain: A competitive strategy in a networked economy” Special issue in logistics: New perspectives and challenges, Vol.36, Iss.4, pp. 549-564
Hall. R., (2008), “Applied social research: planning, designing and conducting real-world research”, Macmillan Education, Australia.
Handfield. R. B and Nichols, E. L., (1999), “Introduction to Supply Chain Management”, Prentice Hall Inc, USA.
Hayat. K, Abbas. A, Siddique. MandCheema. K., (2012) “A study of the different factors that affecting the supply chain responsiveness”, Academic Research International, Vol. 3, issue. 3, pp. 345-356.
Herbst. F and Coldwell. D., (2004), “Business Research”, Publisher: Juta and company Ltd, South Africa.
Hsu, C., et al., (2008) “Information sharing, buyer–supplier relationships, and firm performance: a multi-region analysis”, International Journal of Physical Distribution and Logistics Management, 38 (4), 296–310.
114

School of Business & Economics
Katz. M.L. and Shapiro, C., (1994), “Systems Competition and Network Effects”, J. Econ Perspectives, Vol. 8, pp. 93-116.
Kaya. E and Azaltun M., (2012),"Role of information systems in supply chain management and its Application on five-star hotels in Istanbul", Journal of Hospitality and Tourism Technology, Vol. 3 Iss: 2 pp. 138 – 146.
Katunzi. T.M., (2011) “Obstacles to Process Integration along the Supply Chain: Manufacturing Firms Perspective International”, Journal of Business and Management Vol. 6, No. 5, pp.
Kinsey. J. and Ashman, S., (2000), “Information technology in the retail food industry”, Technology in Society, Vo. 22, No. 1, pp. 83-96.
Krajewski. L. And Wei. J. C., (2001), “The value of production schedule integration in supply chains”, Decision Sciences, Vol. 32 No. 4, pp. 601-34.
Lambert. D. M., Cooper .M.C. and Pagh. J.D., (1998), “Supply Chain Management Implementation Issues and Research Opportunities” The International Journal of Logistics Management, Vol. 11, Issue.1, pp. 1-17.
Lau. A, Tang. E and Yam. R., (2010), “Effects of Supplier and Customer Integration on Product Innovation and Performance: Empirical Evidence in Hong Kong Manufacturers”, Journal of product innovation management, Vol. 27, issue 5, pp. 761-777.
Lee. H.L., (2000),“Creating value through supply chain integration”, Supply Chain Management Review, Vol. 4, No. 4, pp. 30-37.
Lee. H.L., Padmanabhan .V and Whang. S., (2004), “Information Distortion in a Supply Chain: The Bullwhip Effect”, Management Science, Vol. 50, No. 12, pp. 1875-1886.
Lee. J and Kim. Y., (1999), “Effect of partnership quality on IS outsourcing: conceptual framework and empirical validation”, Journal of Management Information Systems, Vol. 15 , Issue, pp. 26–61
Li. J, Sikora. R, Shaw. M.J. and Tan. G.W., (2006),”A strategic analysis of inter organizational information sharing”, Decision Support Systems Vol. 42, pp. 251-266.
Lindsey. M and Pavur. R., (2008)“A comparison of methods for forecasting intermittent demand with increasing or decreasing probability of demand occurrences advances in business and management forecasting”, volume 5, 115–132.
Malone. T and Crowston. K., (1994), “The interdisciplinary study of coordination”, ACM Computing Surveys, Vol. 26, No. 1, pp. 87-119.
115

School of Business & Economics
Martinez. G.M and Poole. N., (2004) , “The development of private fresh produce safety standard: implications for developing Mediterranean exporting countries”, J. Food Policy , Vol. 29, pp 229-255.
Mouritsen. J , Skjott-Larsen. T and Kotzab. H 2003 “Exploring the contours of supply chain management” journal Integrated Manufacturing systems Vol.14, Iss . 8 pp 686-695 .
Ning Cao, Zhiming Zhang, Kin Man To andKeng Po Ng., (2008),"How are supply chains coordinated: An empirical observation in textile-apparel businesses", Journal of Fashion Marketing and Management, Vol. 12 Iss: 3 pp. 384 – 397.
Ngai. E. W. T and Gunasekaran. A, (2004). “Implementation of EDI in Hong Kong: an empirical analysis” Industrial management and data systems, Vol.104, Iss.1, pp. 88-100
Paik S. K,. Bagchi P.K., (2007),"Understanding the causes of the bullwhip effect in a supply chain", International Journal of Retail & Distribution Management, Vol. 35 Iss: 4 pp. 308 – 324.
Petersen k.j, Ragatz G.L and Monczka R.M (2005) “An Examination of Collaborative Planning Effectiveness and Supply Chain Performance”, Journal of Supply Chain Management, Volume 41, Issue 2, pages 14–25.
Power. D., (2005), “Supply Chain Management integration and implementation”, An International Journal, Vol.10, No.4, pp. 252-263.
Pålsson. H and Johansson. O., (2009) ,“Supply chain integration obtained through uniquely labelled goods: A survey of Swedish manufacturing industries” International Journal of Physical Distribution & Logistics Management, Vol, 39, No, 1, pp. 28-46.
Prajogo. D and Olhager .J., (2012), “Supply chain integration and performance: the effects of long-term relationship, information technology and sharing and logistics integration”, Int. J. Production Economics, Vol. 135, pp. 514–522.
Rajaguru. R and Matanda. M. j., (2011),"Role of inter-organizational compatibility and IOIS integration in large firms and SMEs retailing chains", Asia Pacific Journal of Marketing and Logistics, Vol. 23 Iss: 2 pp. 177 – 199.
Richey .G.R, Chen. H, Upreti. R, Fawcett. S. E and Adams. F. G., (2009) “The moderating role of barriers on the relationship between drivers to supply chain integration and firm performance”, International journal of physical Distribution and logistics management, Vol, 39, Iss, 10, pp. 826-840.
Sari. K, (2007) “Exploring the benefits of vendor managed inventory” International journal of physical distribution and logistics management, Vol.37, Iss.7, pp. 529-545.
116

School of Business & Economics
Shah. N. (2005) ,“Process industry supply chains: Advances and challenges”, Computers and Chemical Engineering, Vol. 29, pp. 1225–1235.
Shamimi. M, Riaz. S and Sheikh. R (2008)An Analysis Of Rise And Fall Of SCM – ICT Integration By The FMCG Sector In Pakistan Proceedings of the World Congress on Engineering, Vol, pp. 2 – 4.
Shue.C, Yen.H and Chae. B., (2006), “Determinants of supplier –retailer collaboration: evidence from an international study”, international journal of operations & production management, Vol.26 No.1, pp. 24-49.
Shatat. A. S and Udin. Z. M, (2012) “The relationship between ERP system and supply chain management performance in Malaysian manufacturing companies” Journal of enterprise information management, Vol.25, Iss.6, pp. 576-604.
Shahzad Zafar Iqbal , Muhammad Rafique Asi ,(2013)Assessment of aflatoxin M1 in milk and milk products from Punjab, Pakistan, food Control, vol.30 ,pp. 235-239.
Singh. J., (1996) , “Information has to be accurate , timely and visibiltybeforew it can replace inventory”, Journal : logistics information management, Vol.9, Issue 4, pp: 28-30.
Sikora. R. and Shaw, M., (1998),“A multi-agent framework for the coordination and integration of information systems”, Management Science, Vol. 44, No. 11, pp. 568-578.
Spens. K. M. & Kovacs, G., (2005). ”A Content Analysis of Research Approaches in Logistics Research”, International Journal of Physical Distribution & Logistics Management, Vol. 36, No. 5, pp. 374-390
Stein. T and Sweat, (1998), “Killer supply chains Information Week”, Volume. 708 Issue .9 pp. 36–46.
Suhong Li and Binshan J.L., (1998), “Accessing information sharing and information quality in supply chain management”, Supply chain economics World Trade, Vol.11, Issue.11, pp. 58–61.
Sonia. M, Bux .M and Saad. M., (2012) “The Importance of E-Integration in Supply Chain of Pakistani Firms and its Effect on Performance”, International Conference on Industrial Engineering and Operations Management, Istanbul, Turkey.
Stefansson. G., (2002) “Business to business data sharing: a source for integration of supply chain” International Journal of Production Economics, Volume 75, Issues , Pages 135–146
Sanchez. A. M and Perez. M. P, (2003) “The use of EDI for inter-organizational cooperation and coordination in the supply chain” Integrated Manufacturing systems, Vol.14, Iss.8, pp. 642-651.
117

School of Business & Economics
Themistocleous. M, Iran. Z and Love. P. E. D, (2004) “Evaluating the integration of supply chain information system: a case study” European journal of operational research, Vol 159, Iss 2 pp. 393-405.
Trkman P, Temberger M. I., Jaklic J and Groznik. A., (2007),“Process approach to supply chain integration”, supply chain management: international journal, Volume 12, Issue 2, pp. 116-128.
Vicedo. J Mula. J and Capo´, ( 2011)A social network-based organizational model Supply Chain Management: An International Journal, Volume 16 · Numbers 5, 379–388.
Weber. J. A., (2000), “partnering with distributors to stimulate sales: a case study”, Journal of business & industrial marketing , Vol.15, issue 2, pp. 154-162.
Wamba. F. S, (2012) “Achieving supply chain integration using RFID technology The case of emerging intelligent B-to-Be-commerce processes in a living laboratory” Business process management journal, Vol. 18 Iss. 1, pp. 58-81.
Whipple. J and Russell. D (2007) Building supply chain collaboration: a typology of
collaborative approaches, The International Journal of Logistics Management, Vol. 18
No. 2, pp. 174-196.
Yao, Y. and Dresner, M., (2008),“The inventory value of information sharing, continuous replenishment, and vendor-managed inventory”, Transportation Research Part E, Vol. 44, pp. 361-378.
Yao Y, DresnerM., (2008), “The inventory value of information sharing, continuous replenishment, and vendor-managed inventory”, Transportation Research E 44. 361–378.
Yao. Y.,Evers. P. T. and Dresner. M. E., (2007), “ Supply chain integration in vendor-managed inventory”, Journal of Decision Support Systems, Issue. 43, pp. 663– 674.
Yu.Z.X, H. Yan and Cheng T.C.E., (2001), “Benefits of information sharing with supply chain partnerships”, Industrial Management and Data Systems, Vol.101, Issue.3, pp. 114–121.
Zamana. K Khan. M, Ahmad. M and Rustam. R (2012), The relationship between agricultural technology and energy demand in Pakistan, Energy Policy, Vol. 44, pp. 268–279.
Zhao. X, Zhao. H and Hou. J , (2010) “B2B e-hubs and information integration in supply chain operations” Management Research Review Vol. 33 Iss. 10, pp. 961-979.
118

School of Business & Economics
III- WEBSITE REFERENCE: http://www.finance.gov.pk/survey/chapter_10/03_Manufacturing.pdf(2013-04-07; 18.48)
www.Scrided.com( date and time ) (3012-04-05;15.30)
www.haleebfoods.com (2013-04-01; 14.10)
www.tribune.com(2013-04-23; 13.00)
www.pakistangov.com.pk(2013-04-23; 13.30)
www.worldbank.com (2013-04-22; 14.15)
IV- PERSONS REFERENCE: Muhammad SabirLilla (Deputy Logistics Manager; email: [email protected]; Cell# 0092 302 8401422)
Muhammad Shahid Ali (Manager Supply chain and Logistics; [email protected];
Kashif Ali (Sales Coordinator; [email protected])
119

School of Business & Economics
Appendix I. Questionnaire
This questionnaire is designed to investigate the levels of supply chain integration and the barrier to the supply chain integration between Haleeb foods and its distributors. All responses are strictly confidential and no information which could disclose your firm’s or your own identity will be published, nor will it be shared with any other outside parties apart from your permission to do so
This questionnaire consists of two sections .The approximately time to complete is about 8- 10 minutes only.
Section 1: Supply chain integration (has 3 sub-sections a, b and c)
1 (a) Information integration
To what extent do you agree or disagree with the following statements regarding information integration between Haleeb Foods and your company?
Strongly disagree
Disagree Neutral Agree Strongly agree
1-Your company share information with Haleeb Foods to improve decision making 2- Your company and Haleeb Foods use the same or compatible information system 3- Collaborative planning is introduced in your company to improve the planning process with Haleeb Foods 4- Haleeb Foods have real time information to make a common demand forecast for your company 5- Joint replenishment forecasts is used between you and Haleeb Foods to meet your market need
1 (b) Coordination resource sharing
To what extent do you agree or disagree with the following statements that Haleeb Foods and you have coordination resource sharing?
Strongly disagree
Disagree Neutral Agree Strongly agree
6-Your company and Haleeb Foods practice of shared decision making to improve the Supply Chain 7- Your company cooperate with Haleeb Foods for achieving the same objectives 8- Your company plan the work load in a balanced way with Haleeb Foods 9- Your company and Haleeb Foods use common third party logistics 10- Your company and Haleeb Foods practice on packaging customization and standardization to facilitate handling , transport, reduce costs and insure quality
11- Your company and Haleeb Foods jointly involve in agreements on delivery frequency to optimize in the
120

School of Business & Economics
procurement and distribution of products for example Lead time, on time delivery 12- Your company and Haleeb Foods use common logistical containers to facilitate handling operations, loading and unloading
13- Your company and Haleeb Foods use a process approach that allows the direct interconnection between departments and company and avoid duplication
1 (c) Organizational relationship linkage
To what extent do you agree or disagree with the following statements that Haleeb Foods and your company has organizational relationship linkage?
Strongly disagree
Disagree Neutral Agree Strongly agree
14- Your company is using active communication channels with Haleeb Foods 15- Your company and Haleeb Foods establish common performance indicators and aligned 16- Your company and Haleeb Foods share risks, costs and rewards 17- Your company and Haleeb Foods promote an attitude and plans of action to support an integrated business performance
18- Your company and Haleeb Foods involve for the joint establishment of objectives for the end customer satisfaction
19- Your company and Haleeb Foods are sharing their skills ideas and institutional culture by conducting training sessions and seminars for best practices
20 – Your company and Haleeb Foods involved in drawing up of contingency plans for quick problem solving regarding business unexpected situations
21- Your company and Haleeb Foods establish stable links with each other for maintaining long term relationship
22- Your company and Haleeb Foods encourage team building to allow for coordination and active cooperation between different departments
Section 2. Barriers to supply chain integration
To what extent do you agree or disagree with the following statements that there are barriers to supply chain integration between Haleeb Foods and your company?
Strongly disagree
Disagree Neutral Agree Strongly agree
23- Your company has not adequate information system to integrate with Haleeb Foods 24- Your company is not willing to share critical information with Haleeb Foods
121

School of Business & Economics
25- Lack of trust restrict the integration between your company and Haleeb Foods 26- Increased stock level due to inadequate demand forecasts between your company and Haleeb Foods 27- Incompatible system is used between your company and Haleeb Foods 28- Lack of education, knowledge about IT and management is restricted to supply chain integration 29- Cost effect the integration between your company and Haleeb Foods
122

School of Business & Economics
Appendix II Statistical reliability
Reliability Statistics
Cronbach'sAlph
a
Cronbach's
Alpha Based on
Standardized
Items
N of Items
,862 ,874 5
Reliability Statistics
Cronbach'sAlpha Cronbach's
Alpha Based
on
Standardize
d Items
N of Items
,930 ,935 8
Reliability Statistics
Cronbach'sAlph
a
Cronbach's
Alpha Based on
Standardized
Items
N of Items
,921 ,929 9
Reliability Statistics
Cronbach'sAlph
a
Cronbach's
Alpha Based on
Standardized
Items
N of Items
,954 ,957 7
123

School of Business & Economics
Appendix III Descriptive statistics
Descriptive Statistics
N Mean Std. Deviation
X1 178 3,6011 ,67514
X2 178 1,4382 ,56158
X3 178 1,6798 ,63222
X4 178 4,2191 ,50116
X5 178 1,4663 ,58367
X6 178 1,6404 ,59655
X7 178 4,4101 ,61553
X8 178 4,4045 ,63280
X9 178 4,6236 ,48585
X10 178 1,4551 ,58290
X11 178 1,5618 ,51978
X12 178 4,2921 ,52513
X13 178 1,4213 ,54926
X14 178 1,5506 ,52100
X15 178 1,4551 ,55306
X16 178 1,5112 ,52334
X17 178 4,0843 ,66271
X18 178 4,5056 ,51252
X19 178 1,6517 ,52295
X20 178 1,7584 ,57545
X21 178 4,3371 ,61880
X22 178 1,6404 ,55738
X23 178 1,5112 ,57479
X24 178 4,3652 ,66919
X25 178 4,3989 ,58551
X26 178 4,8652 ,34251
X27 178 1,7360 ,54509
X28 178 4,4438 ,55203
X29 178 4,7921 ,40692
Valid N (listwise) 178
124

125
Appendix IV
Information tecnolgy
information sharing
Collaborative
planning
Joint demand
forecasts
Joint replenishment forecasts
Lack of information technology
Lack of information
sharing Lack of trust
Demand distortion –
Bullwhip effect
Systems incompat
ibility
Lack of knowledge
/Poor human
Cost of integrati
onPearson Correlation
1 ,046 ,003 ,059 ,174* ,063 -,076 -,053 ,108 -,104 -,023 ,046
Sig. (2-tailed) ,539 ,963 ,431 ,020 ,407 ,314 ,486 ,151 ,169 ,765 ,541N 178 178 178 178 178 178 178 178 178 178 178 178Pearson Correlation
,046 1 -,112 ,239** ,132 ,090 ,008 ,015 ,045 ,011 -,011 ,005
Sig. (2-tailed) ,539 ,138 ,001 ,080 ,234 ,918 ,840 ,555 ,884 ,881 ,944N 178 178 178 178 178 178 178 178 178 178 178 178Pearson Correlation
,003 -,112 1 -,009 -,037 -,044 ,211** ,103 ,034 ,016 ,070 ,047
Sig. (2-tailed) ,963 ,138 ,904 ,623 ,556 ,005 ,172 ,649 ,837 ,356 ,531N 178 178 178 178 178 178 178 178 178 178 178 178Pearson Correlation ,059 ,239** -,009 1 ,112 ,021 ,046 ,047 ,074 -,035 ,014 ,086
Sig. (2-tailed) ,431 ,001 ,904 ,136 ,783 ,538 ,533 ,324 ,641 ,852 ,253N 178 178 178 178 178 178 178 178 178 178 178 178Pearson Correlation
,174* ,132 -,037 ,112 1 ,683** -,048 -,051 -,108 ,016 -,032 ,030
Sig. (2-tailed) ,020 ,080 ,623 ,136 ,000 ,526 ,496 ,153 ,829 ,669 ,693N 178 178 178 178 178 178 178 178 178 178 178 178Pearson Correlation ,063 ,090 -,044 ,021 ,683** 1 ,055 ,012 -,050 -,018 -,114 -,002
Sig. (2-tailed) ,407 ,234 ,556 ,783 ,000 ,463 ,876 ,510 ,816 ,131 ,978N 178 178 178 178 178 178 178 178 178 178 178 178Pearson Correlation -,076 ,008 ,211** ,046 -,048 ,055 1 ,592** ,117 -,028 -,013 -,010
Sig. (2-tailed) ,314 ,918 ,005 ,538 ,526 ,463 ,000 ,119 ,706 ,864 ,893N 178 178 178 178 178 178 178 178 178 178 178 178Pearson Correlation -,053 ,015 ,103 ,047 -,051 ,012 ,592** 1 -,040 -,004 ,096 ,042
Sig. (2-tailed) ,486 ,840 ,172 ,533 ,496 ,876 ,000 ,594 ,953 ,203 ,581N 178 178 178 178 178 178 178 178 178 178 178 178Pearson Correlation ,108 ,045 ,034 ,074 -,108 -,050 ,117 -,040 1 -,101 ,049 ,122
Sig. (2-tailed) ,151 ,555 ,649 ,324 ,153 ,510 ,119 ,594 ,180 ,513 ,105N 178 178 178 178 178 178 178 178 178 178 178 178Pearson Correlation
-,104 ,011 ,016 -,035 ,016 -,018 -,028 -,004 -,101 1 -,040 -,096
Sig. (2-tailed) ,169 ,884 ,837 ,641 ,829 ,816 ,706 ,953 ,180 ,594 ,202N 178 178 178 178 178 178 178 178 178 178 178 178Pearson Correlation -,023 -,011 ,070 ,014 -,032 -,114 -,013 ,096 ,049 -,040 1 ,011
Sig. (2-tailed) ,765 ,881 ,356 ,852 ,669 ,131 ,864 ,203 ,513 ,594 ,888N 178 178 178 178 178 178 178 178 178 178 178 178Pearson Correlation
,046 ,005 ,047 ,086 ,030 -,002 -,010 ,042 ,122 -,096 ,011 1Sig. (2-tailed) ,541 ,944 ,531 ,253 ,693 ,978 ,893 ,581 ,105 ,202 ,888N 178 178 178 178 178 178 178 178 178 178 178 178
Joint demand forecasts
Correlations Between Information Integration and Barriers to Integration in Haleeb Foods and ite Distributors
Information tecnolgy
information sharing
Collaborative planning
Lack of knowledge/Poor human resourceCost of integration
*. Correlation is significant at the 0.05 level (2-tailed).**. Correlation is significant at the 0.01 level (2-tailed).
Joint replenishment forecasts
Lack of information technology
Lack of information sharing
Lack of trust
Demand distortion – Bullwhip effect
Systems incompatibility

School of Business & Economics
Appendix V
Shared decision-making
Corporation
Work realignment
Reorganizatio
n of outsourcing
Packaging
customisation/standar
Agreements on delivery frequency
Common use
of
Process integrati
on
Lack of informati
on technolo
Lack of informati
on sharing
Lack of trust
Demand distortion – Bullwhip
effect
Systems
incompatibili
Lack of knowledge/Poor human
Cost of integration
Pearson 1 -,073 -,047 ,037 ,002 ,036 -,042 -,104 -,120 -,066 -,089 ,010 ,141 -,096 -,077Sig. (2-tailed) ,332 ,537 ,622 ,979 ,637 ,582 ,167 ,111 ,385 ,240 ,892 ,061 ,202 ,308N 178 178 178 178 178 178 178 178 178 178 178 178 178 178 178Pearson -,073 1 ,776** ,028 -,003 ,070 -,006 ,004 -,021 -,146 -,159* -,004 -,214** ,043 ,026Sig. (2-tailed) ,332 ,000 ,711 ,964 ,350 ,940 ,957 ,780 ,052 ,034 ,955 ,004 ,566 ,726N 178 178 178 178 178 178 178 178 178 178 178 178 178 178 178Pearson -,047 ,776** 1 -,053 -,012 ,095 -,069 -,022 ,018 -,084 -,072 ,018 -,147* ,065 -,001Sig. (2-tailed) ,537 ,000 ,480 ,877 ,206 ,363 ,773 ,806 ,265 ,340 ,807 ,050 ,386 ,992N 178 178 178 178 178 178 178 178 178 178 178 178 178 178 178Pearson ,037 ,028 -,053 1 ,090 ,014 -,032 -,037 -,035 ,008 -,005 -,035 -,057 -,090 ,002Sig. (2-tailed) ,622 ,711 ,480 ,235 ,849 ,675 ,620 ,639 ,915 ,942 ,642 ,447 ,233 ,978N 178 178 178 178 178 178 178 178 178 178 178 178 178 178 178Pearson Correlation
,002 -,003 -,012 ,090 1 -,103 ,154* ,051 ,077 ,050 -,038 -,002 ,042 -,052 -,004
Sig. (2-tailed) ,979 ,964 ,877 ,235 ,173 ,040 ,502 ,304 ,511 ,612 ,976 ,574 ,492 ,959N 178 178 178 178 178 178 178 178 178 178 178 178 178 178 178Pearson Correlation
,036 ,070 ,095 ,014 -,103 1 -,025 -,042 -,059 ,105 -,016 ,111 ,028 ,071 ,074
Sig. (2-tailed) ,637 ,350 ,206 ,849 ,173 ,739 ,576 ,434 ,162 ,827 ,142 ,711 ,345 ,323N 178 178 178 178 178 178 178 178 178 178 178 178 178 178 178Pearson -,042 -,006 -,069 -,032 ,154* -,025 1 ,198** ,083 ,048 ,005 ,032 -,084 -,079 ,021Sig. (2-tailed) ,582 ,940 ,363 ,675 ,040 ,739 ,008 ,273 ,521 ,950 ,674 ,263 ,292 ,777N 178 178 178 178 178 178 178 178 178 178 178 178 178 178 178Pearson C l ti
-,104 ,004 -,022 -,037 ,051 -,042 ,198** 1 ,602** ,102 -,016 -,027 ,015 -,061 ,065
Sig. (2-tailed) ,167 ,957 ,773 ,620 ,502 ,576 ,008 ,000 ,177 ,831 ,724 ,841 ,417 ,385N 178 178 178 178 178 178 178 178 178 178 178 178 178 178 178Pearson C l ti
-,120 -,021 ,018 -,035 ,077 -,059 ,083 ,602** 1 ,055 ,012 -,050 -,018 -,114 -,002Sig. (2-tailed) ,111 ,780 ,806 ,639 ,304 ,434 ,273 ,000 ,463 ,876 ,510 ,816 ,131 ,978N 178 178 178 178 178 178 178 178 178 178 178 178 178 178 178Pearson -,066 -,146 -,084 ,008 ,050 ,105 ,048 ,102 ,055 1 ,592** ,117 -,028 -,013 -,010Sig. (2-tailed) ,385 ,052 ,265 ,915 ,511 ,162 ,521 ,177 ,463 ,000 ,119 ,706 ,864 ,893N 178 178 178 178 178 178 178 178 178 178 178 178 178 178 178Pearson C l ti
-,089 -,159* -,072 -,005 -,038 -,016 ,005 -,016 ,012 ,592** 1 -,040 -,004 ,096 ,042Sig. (2-tailed) ,240 ,034 ,340 ,942 ,612 ,827 ,950 ,831 ,876 ,000 ,594 ,953 ,203 ,581N 178 178 178 178 178 178 178 178 178 178 178 178 178 178 178Pearson ,010 -,004 ,018 -,035 -,002 ,111 ,032 -,027 -,050 ,117 -,040 1 -,101 ,049 ,122Sig (2-tailed) ,892 ,955 ,807 ,642 ,976 ,142 ,674 ,724 ,510 ,119 ,594 ,180 ,513 ,105N 178 178 178 178 178 178 178 178 178 178 178 178 178 178 178Pearson ,141 -,214** -,147* -,057 ,042 ,028 -,084 ,015 -,018 -,028 -,004 -,101 1 -,040 -,096Sig. (2-tailed) ,061 ,004 ,050 ,447 ,574 ,711 ,263 ,841 ,816 ,706 ,953 ,180 ,594 ,202N 178 178 178 178 178 178 178 178 178 178 178 178 178 178 178Pearson -,096 ,043 ,065 -,090 -,052 ,071 -,079 -,061 -,114 -,013 ,096 ,049 -,040 1 ,011Sig. (2-tailed) ,202 ,566 ,386 ,233 ,492 ,345 ,292 ,417 ,131 ,864 ,203 ,513 ,594 ,888N 178 178 178 178 178 178 178 178 178 178 178 178 178 178 178Pearson -,077 ,026 -,001 ,002 -,004 ,074 ,021 ,065 -,002 -,010 ,042 ,122 -,096 ,011 1Sig (2-tailed) ,308 ,726 ,992 ,978 ,959 ,323 ,777 ,385 ,978 ,893 ,581 ,105 ,202 ,888N 178 178 178 178 178 178 178 178 178 178 178 178 178 178 178
Lack of information sharing
Cor relations betw een Cordination Resource Shar ing and Bar r ier to Integration in Haleeb Foods and int dis tr ibutors
Shared decision-making
Corporation
Work realignment
Reorganization of outsourcing common use of third
t l i ti Packaging customisation/standardisation
Agreements on delivery frequency
Common use of logistics equipment/ containersProcess integration
Lack of information technology
*. Correlation is significant at the 0.05 level (2-tailed).
Lack of trust
Demand distortion – Bullwhip effect
Systems incompatibility
Lack of knowledge/Poor human resourceCost of integration
**. Correlation is significant at the 0.01 level (2-tailed).

School of Business & Economics
Appendix VI
Shared decision-making
Corporation
Work realignm
ent
Reorganization of outsourci
Packagin
g customis
Agreeme
nts on delivery
use of
logistics equipment
s integrat
ion
informatio
n technolog
informati
on sharing
Lack of trust
distortio
n – Bullw hip
ms incompatibility
know ledg
e/Poor human
Cost of integratio
n
Pearson C l i
1 -,073 -,047 ,037 ,002 ,036 -,042 -,104 -,120 -,066 -,089 ,010 ,141 -,096 -,077Sig (2-tailed) ,332 ,537 ,622 ,979 ,637 ,582 ,167 ,111 ,385 ,240 ,892 ,061 ,202 ,308N 178 178 178 178 178 178 178 178 178 178 178 178 178 178 178Pearson -,073 1 ,776** ,028 -,003 ,070 -,006 ,004 -,021 -,146 -,159* -,004 -,214** ,043 ,026Sig (2-tailed) ,332 ,000 ,711 ,964 ,350 ,940 ,957 ,780 ,052 ,034 ,955 ,004 ,566 ,726N 178 178 178 178 178 178 178 178 178 178 178 178 178 178 178Pearson -,047 ,776** 1 -,053 -,012 ,095 -,069 -,022 ,018 -,084 -,072 ,018 -,147* ,065 -,001Sig. (2-tailed) ,537 ,000 ,480 ,877 ,206 ,363 ,773 ,806 ,265 ,340 ,807 ,050 ,386 ,992N 178 178 178 178 178 178 178 178 178 178 178 178 178 178 178Pearson ,037 ,028 -,053 1 ,090 ,014 -,032 -,037 -,035 ,008 -,005 -,035 -,057 -,090 ,002Sig. (2-tailed) ,622 ,711 ,480 ,235 ,849 ,675 ,620 ,639 ,915 ,942 ,642 ,447 ,233 ,978N 178 178 178 178 178 178 178 178 178 178 178 178 178 178 178Pearson ,002 -,003 -,012 ,090 1 -,103 ,154* ,051 ,077 ,050 -,038 -,002 ,042 -,052 -,004Sig. (2-tailed) ,979 ,964 ,877 ,235 ,173 ,040 ,502 ,304 ,511 ,612 ,976 ,574 ,492 ,959N 178 178 178 178 178 178 178 178 178 178 178 178 178 178 178Pearson ,036 ,070 ,095 ,014 -,103 1 -,025 -,042 -,059 ,105 -,016 ,111 ,028 ,071 ,074Sig. (2-tailed) ,637 ,350 ,206 ,849 ,173 ,739 ,576 ,434 ,162 ,827 ,142 ,711 ,345 ,323N 178 178 178 178 178 178 178 178 178 178 178 178 178 178 178Pearson -,042 -,006 -,069 -,032 ,154* -,025 1 ,198** ,083 ,048 ,005 ,032 -,084 -,079 ,021Sig. (2-tailed) ,582 ,940 ,363 ,675 ,040 ,739 ,008 ,273 ,521 ,950 ,674 ,263 ,292 ,777N 178 178 178 178 178 178 178 178 178 178 178 178 178 178 178Pearson -,104 ,004 -,022 -,037 ,051 -,042 ,198** 1 ,602** ,102 -,016 -,027 ,015 -,061 ,065Sig. (2-tailed) ,167 ,957 ,773 ,620 ,502 ,576 ,008 ,000 ,177 ,831 ,724 ,841 ,417 ,385N 178 178 178 178 178 178 178 178 178 178 178 178 178 178 178Pearson -,120 -,021 ,018 -,035 ,077 -,059 ,083 ,602** 1 ,055 ,012 -,050 -,018 -,114 -,002Sig. (2-tailed) ,111 ,780 ,806 ,639 ,304 ,434 ,273 ,000 ,463 ,876 ,510 ,816 ,131 ,978N 178 178 178 178 178 178 178 178 178 178 178 178 178 178 178Pearson -,066 -,146 -,084 ,008 ,050 ,105 ,048 ,102 ,055 1 ,592** ,117 -,028 -,013 -,010Sig. (2-tailed) ,385 ,052 ,265 ,915 ,511 ,162 ,521 ,177 ,463 ,000 ,119 ,706 ,864 ,893N 178 178 178 178 178 178 178 178 178 178 178 178 178 178 178Pearson -,089 -,159* -,072 -,005 -,038 -,016 ,005 -,016 ,012 ,592** 1 -,040 -,004 ,096 ,042Sig. (2-tailed) ,240 ,034 ,340 ,942 ,612 ,827 ,950 ,831 ,876 ,000 ,594 ,953 ,203 ,581N 178 178 178 178 178 178 178 178 178 178 178 178 178 178 178Pearson ,010 -,004 ,018 -,035 -,002 ,111 ,032 -,027 -,050 ,117 -,040 1 -,101 ,049 ,122Sig. (2-tailed) ,892 ,955 ,807 ,642 ,976 ,142 ,674 ,724 ,510 ,119 ,594 ,180 ,513 ,105N 178 178 178 178 178 178 178 178 178 178 178 178 178 178 178Pearson ,141 -,214** -,147* -,057 ,042 ,028 -,084 ,015 -,018 -,028 -,004 -,101 1 -,040 -,096Sig (2-tailed) ,061 ,004 ,050 ,447 ,574 ,711 ,263 ,841 ,816 ,706 ,953 ,180 ,594 ,202N 178 178 178 178 178 178 178 178 178 178 178 178 178 178 178Pearson Correlation
-,096 ,043 ,065 -,090 -,052 ,071 -,079 -,061 -,114 -,013 ,096 ,049 -,040 1 ,011
Sig. (2-tailed) ,202 ,566 ,386 ,233 ,492 ,345 ,292 ,417 ,131 ,864 ,203 ,513 ,594 ,888N 178 178 178 178 178 178 178 178 178 178 178 178 178 178 178Pearson -,077 ,026 -,001 ,002 -,004 ,074 ,021 ,065 -,002 -,010 ,042 ,122 -,096 ,011 1Sig (2-tailed) ,308 ,726 ,992 ,978 ,959 ,323 ,777 ,385 ,978 ,893 ,581 ,105 ,202 ,888N 178 178 178 178 178 178 178 178 178 178 178 178 178 178 178
Lack of information sharing
Correlations between ganizational relationship linkage and Barriers to Supply chain integration
Shared decision-making
Corporation
Work realignment
Reorganization of outsourcing common use of third party Packaging customisation/standardisation Agreements on delivery frequency
Common use of logistics equipment/ Process integration
Lack of information technology
*. Correlation is significant at the 0.05 level (2-tailed).
Lack of trust
Demand distortion – Bullwhip effect
Systems incompatibility
Lack of knowledge/Poor human resource
Cost of integration
**. Correlation is significant at the 0.01 level (2-tailed).

School of Business & Economics
Appendix VII Summary of correlation of Supply chain integration and barriers to supply chain integration between Haleeb foods and Distributors
Information
sharing
Information
technology
integration
Collaborative plannin
g
Joint deman
d forecas
ts
Joint replenishment forecas
ts
Shared decisio
n-making
Corporation
Work realignment
Reorganizatio
n of outsour
cing common use of
third party
Packag
ing customisation/standardisatio
n
Agreements
on deliver
y freque
ncy
Common use of logistic
s equipm
ent/ contain
ers
Process
integration
Design
and maintaining of communicatio
n channe
ls
Laying down
performance measur
es
Incenti
ve realignment
Integra
ted behavi
or
Joint establishment
of objectives for
all parties in the chain
Sharing of
skills, Ideas and
institutional
culture
Drawing up of
contingency plans
for quick
problem
Forging and
maintain long term
relationship
Creating
teamwork
along SC and cross-
functional
teams
Lack of information
technology
Lack of information
sharingLack of
trust
Demand
distortion –
Bullwhip
effect
Systems
incompatibilit
y
Lack of knowledge/Po
or human
resource
Cost of integra
tion
Pearson
1 ,046 ,003 ,059 ,174* -,078 ,083 ,142 ,039 -,039 ,046 ,076 ,090 ,066 -,010 ,037 ,050 -,002 -,140 -,046 ,053 ,067 ,063 -,076 -,053 ,108 -,104 -,023 ,046
Sig. (2-t il d)
,539 ,963 ,431 ,020 ,304 ,270 ,059 ,604 ,609 ,538 ,316 ,232 ,384 ,890 ,626 ,505 ,983 ,063 ,544 ,481 ,373 ,407 ,314 ,486 ,151 ,169 ,765 ,541
N 178 178 178 178 178 178 178 178 178 178 178 178 178 178 178 178 178 178 178 178 178 178 178 178 178 178 178 178 178Pearson
,046 1 -,112 ,239** ,132 -,016 ,033 -,009 ,132 ,682** -,093 ,196** ,112 ,078 ,009 ,002 -,039 ,090 ,099 -,003 -,102 -,053 ,090 ,008 ,015 ,045 ,011 -,011 ,005
Sig. (2-tailed)
,539 ,138 ,001 ,080 ,831 ,663 ,908 ,080 ,000 ,215 ,009 ,135 ,299 ,903 ,975 ,605 ,235 ,187 ,971 ,174 ,480 ,234 ,918 ,840 ,555 ,884 ,881 ,944
N 178 178 178 178 178 178 178 178 178 178 178 178 178 178 178 178 178 178 178 178 178 178 178 178 178 178 178 178 178Pearson
,003 -,112 1 -,009 -,037 ,053 ,078 ,086 -,027 -,124 ,568** ,045 -,049 -,062 -,001 -,168* ,065 -,038 ,002 -,012 ,018 ,794** -,044 ,211** ,103 ,034 ,016 ,070 ,047
Sig. (2- ,963 ,138 ,904 ,623 ,486 ,300 ,256 ,723 ,100 ,000 ,550 ,520 ,411 ,989 ,025 ,390 ,614 ,974 ,874 ,816 ,000 ,556 ,005 ,172 ,649 ,837 ,356 ,531
N 178 178 178 178 178 178 178 178 178 178 178 178 178 178 178 178 178 178 178 178 178 178 178 178 178 178 178 178 178Pearson
,059 ,239** -,009 1 ,112 -,094 -,037 -,103 -,031 ,102 ,024 ,721** ,094 ,120 ,087 -,020 ,063 ,006 ,077 ,028 -,112 ,061 ,021 ,046 ,047 ,074 -,035 ,014 ,086
Sig. (2-t il d)
,431 ,001 ,904 ,136 ,212 ,628 ,172 ,685 ,177 ,754 ,000 ,213 ,112 ,250 ,789 ,402 ,935 ,305 ,712 ,137 ,418 ,783 ,538 ,533 ,324 ,641 ,852 ,253
N 178 178 178 178 178 178 178 178 178 178 178 178 178 178 178 178 178 178 178 178 178 178 178 178 178 178 178 178 178Pearson
,174* ,132 -,037 ,112 1 -,116 -,001 -,039 -,015 ,020 -,049 ,161* ,670** ,006 -,101 ,047 ,088 ,020 ,091 ,186* -,047 -,037 ,683** -,048 -,051 -,108 ,016 -,032 ,030
Sig. (2- ,020 ,080 ,623 ,136 ,123 ,993 ,602 ,841 ,787 ,516 ,031 ,000 ,940 ,180 ,529 ,244 ,796 ,228 ,013 ,537 ,620 ,000 ,526 ,496 ,153 ,829 ,669 ,693
N 178 178 178 178 178 178 178 178 178 178 178 178 178 178 178 178 178 178 178 178 178 178 178 178 178 178 178 178 178Pearson
-,078 -,016 ,053 -,094 -,116 1 -,073 -,047 ,037 ,002 ,036 -,042 -,104 -,068 ,053 -,077 -,080 ,025 ,121 -,189* ,116 ,051 -,120 -,066 -,089 ,010 ,141 -,096 -,077
Sig. (2-il d)
,304 ,831 ,486 ,212 ,123 ,332 ,537 ,622 ,979 ,637 ,582 ,167 ,364 ,478 ,304 ,288 ,739 ,106 ,012 ,123 ,501 ,111 ,385 ,240 ,892 ,061 ,202 ,308
N 178 178 178 178 178 178 178 178 178 178 178 178 178 178 178 178 178 178 178 178 178 178 178 178 178 178 178 178 178Pearson
,083 ,033 ,078 -,037 -,001 -,073 1 ,776** ,028 -,003 ,070 -,006 ,004 ,014 ,146 ,012 -,002 ,002 -,168* ,042 -,113 ,136 -,021 -,146 -,159* -,004 -,214** ,043 ,026
Sig. (2- ,270 ,663 ,300 ,628 ,993 ,332 ,000 ,711 ,964 ,350 ,940 ,957 ,850 ,052 ,874 ,978 ,983 ,025 ,578 ,134 ,071 ,780 ,052 ,034 ,955 ,004 ,566 ,726N 178 178 178 178 178 178 178 178 178 178 178 178 178 178 178 178 178 178 178 178 178 178 178 178 178 178 178 178 178Pearson
,142 -,009 ,086 -,103 -,039 -,047 ,776** 1 -,053 -,012 ,095 -,069 -,022 -,028 ,214** ,003 ,013 -,024 -,169* -,056 -,090 ,094 ,018 -,084 -,072 ,018 -,147* ,065 -,001
Sig. (2-t il d)
,059 ,908 ,256 ,172 ,602 ,537 ,000 ,480 ,877 ,206 ,363 ,773 ,710 ,004 ,966 ,868 ,746 ,024 ,458 ,230 ,211 ,806 ,265 ,340 ,807 ,050 ,386 ,992
N 178 178 178 178 178 178 178 178 178 178 178 178 178 178 178 178 178 178 178 178 178 178 178 178 178 178 178 178 178Pearso
,039 ,132 -,027 -,031 -,015 ,037 ,028 -,053 1 ,090 ,014 -,032 -,037 ,020 -,074 -,061 ,064 ,043 ,037 ,057 ,011 -,044 -,035 ,008 -,005 -,035 -,057 -,090 ,002
Sig. (2-tailed)
,604 ,080 ,723 ,685 ,841 ,622 ,711 ,480 ,235 ,849 ,675 ,620 ,793 ,327 ,418 ,396 ,573 ,624 ,451 ,884 ,563 ,639 ,915 ,942 ,642 ,447 ,233 ,978
N 178 178 178 178 178 178 178 178 178 178 178 178 178 178 178 178 178 178 178 178 178 178 178 178 178 178 178 178 178Pearson
-,039 ,682** -,124 ,102 ,020 ,002 -,003 -,012 ,090 1 -,103 ,154* ,051 ,138 ,002 ,029 -,056 ,058 ,208** ,026 ,011 -,067 ,077 ,050 -,038 -,002 ,042 -,052 -,004
Sig. (2- ,609 ,000 ,100 ,177 ,787 ,979 ,964 ,877 ,235 ,173 ,040 ,502 ,067 ,974 ,696 ,458 ,445 ,005 ,726 ,885 ,371 ,304 ,511 ,612 ,976 ,574 ,492 ,959
N 178 178 178 178 178 178 178 178 178 178 178 178 178 178 178 178 178 178 178 178 178 178 178 178 178 178 178 178 178Pearso
,046 -,093 ,568** ,024 -,049 ,036 ,070 ,095 ,014 -,103 1 -,025 -,042 ,041 ,010 -,127 -,089 -,033 -,087 ,003 -,083 ,545** -,059 ,105 -,016 ,111 ,028 ,071 ,074
Sig. (2- ,538 ,215 ,000 ,754 ,516 ,637 ,350 ,206 ,849 ,173 ,739 ,576 ,591 ,898 ,091 ,237 ,661 ,250 ,969 ,272 ,000 ,434 ,162 ,827 ,142 ,711 ,345 ,323
N 178 178 178 178 178 178 178 178 178 178 178 178 178 178 178 178 178 178 178 178 178 178 178 178 178 178 178 178 178
Shared decision-making
Cooporation
Work realignment
Reorganization of outsourcing common use of thi d t Packaging customisation/standardisation Agreements on delivery frequency
Information sharing
Information technology integration
Collaborative planning
Joint demand forecasts
Joint replenishment forecasts
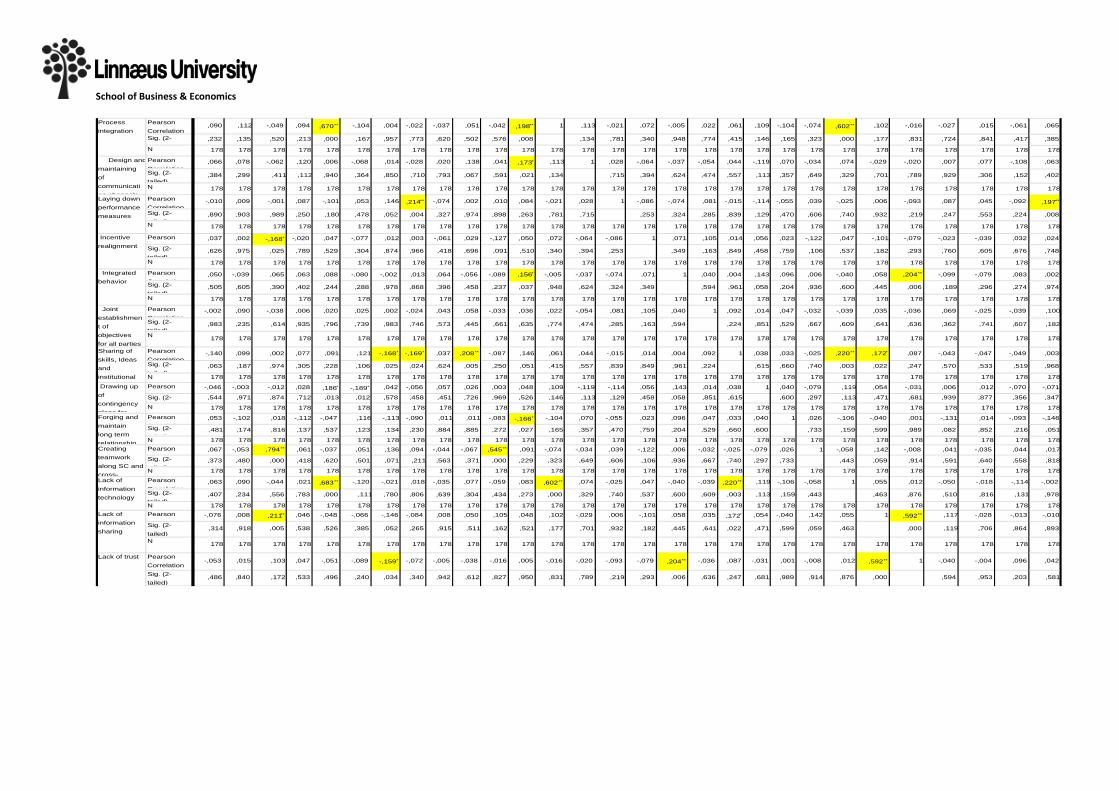
School of Business & Economics
Pearson Correlation
,090 ,112 -,049 ,094 ,670** -,104 ,004 -,022 -,037 ,051 -,042 ,198** 1 ,113 -,021 ,072 -,005 ,022 ,061 ,109 -,104 -,074 ,602** ,102 -,016 -,027 ,015 -,061 ,065
Sig. (2-il d)
,232 ,135 ,520 ,213 ,000 ,167 ,957 ,773 ,620 ,502 ,576 ,008 ,134 ,781 ,340 ,948 ,774 ,415 ,146 ,165 ,323 ,000 ,177 ,831 ,724 ,841 ,417 ,385
N 178 178 178 178 178 178 178 178 178 178 178 178 178 178 178 178 178 178 178 178 178 178 178 178 178 178 178 178 178
Pearson Correlation
,066 ,078 -,062 ,120 ,006 -,068 ,014 -,028 ,020 ,138 ,041 ,173* ,113 1 ,028 -,064 -,037 -,054 ,044 -,119 ,070 -,034 ,074 -,029 -,020 ,007 ,077 -,108 ,063
Sig. (2-tailed)
,384 ,299 ,411 ,112 ,940 ,364 ,850 ,710 ,793 ,067 ,591 ,021 ,134 ,715 ,394 ,624 ,474 ,557 ,113 ,357 ,649 ,329 ,701 ,789 ,929 ,306 ,152 ,402
N 178 178 178 178 178 178 178 178 178 178 178 178 178 178 178 178 178 178 178 178 178 178 178 178 178 178 178 178 178
Pearson Correlation
-,010 ,009 -,001 ,087 -,101 ,053 ,146 ,214** -,074 ,002 ,010 ,084 -,021 ,028 1 -,086 -,074 ,081 -,015 -,114 -,055 ,039 -,025 ,006 -,093 ,087 ,045 -,092 ,197**
Sig. (2-t il d)
,890 ,903 ,989 ,250 ,180 ,478 ,052 ,004 ,327 ,974 ,898 ,263 ,781 ,715 ,253 ,324 ,285 ,839 ,129 ,470 ,606 ,740 ,932 ,219 ,247 ,553 ,224 ,008
N 178 178 178 178 178 178 178 178 178 178 178 178 178 178 178 178 178 178 178 178 178 178 178 178 178 178 178 178 178
Pearson C l i
,037 ,002 -,168* -,020 ,047 -,077 ,012 ,003 -,061 ,029 -,127 ,050 ,072 -,064 -,086 1 ,071 ,105 ,014 ,056 ,023 -,122 ,047 -,101 -,079 -,023 -,039 ,032 ,024
Sig. (2-tailed)
,626 ,975 ,025 ,789 ,529 ,304 ,874 ,966 ,418 ,696 ,091 ,510 ,340 ,394 ,253 ,349 ,163 ,849 ,458 ,759 ,106 ,537 ,182 ,293 ,760 ,605 ,676 ,748
N 178 178 178 178 178 178 178 178 178 178 178 178 178 178 178 178 178 178 178 178 178 178 178 178 178 178 178 178 178
Pearson Correlation
,050 -,039 ,065 ,063 ,088 -,080 -,002 ,013 ,064 -,056 -,089 ,156* -,005 -,037 -,074 ,071 1 ,040 ,004 ,143 ,096 ,006 -,040 ,058 ,204** -,099 -,079 ,083 ,002
Sig. (2-tailed)
,505 ,605 ,390 ,402 ,244 ,288 ,978 ,868 ,396 ,458 ,237 ,037 ,948 ,624 ,324 ,349 ,594 ,961 ,058 ,204 ,936 ,600 ,445 ,006 ,189 ,296 ,274 ,974
N 178 178 178 178 178 178 178 178 178 178 178 178 178 178 178 178 178 178 178 178 178 178 178 178 178 178 178 178 178
Pearson Correlation
-,002 ,090 -,038 ,006 ,020 ,025 ,002 -,024 ,043 ,058 -,033 ,036 ,022 -,054 ,081 ,105 ,040 1 ,092 ,014 ,047 -,032 -,039 ,035 -,036 ,069 -,025 -,039 ,100
Sig. (2-tailed)
,983 ,235 ,614 ,935 ,796 ,739 ,983 ,746 ,573 ,445 ,661 ,635 ,774 ,474 ,285 ,163 ,594 ,224 ,851 ,529 ,667 ,609 ,641 ,636 ,362 ,741 ,607 ,182
N 178 178 178 178 178 178 178 178 178 178 178 178 178 178 178 178 178 178 178 178 178 178 178 178 178 178 178 178 178
Pearson Correlation
-,140 ,099 ,002 ,077 ,091 ,121 -,168* -,169* ,037 ,208** -,087 ,146 ,061 ,044 -,015 ,014 ,004 ,092 1 ,038 ,033 -,025 ,220** ,172* ,087 -,043 -,047 -,049 ,003
Sig. (2-tailed)
,063 ,187 ,974 ,305 ,228 ,106 ,025 ,024 ,624 ,005 ,250 ,051 ,415 ,557 ,839 ,849 ,961 ,224 ,615 ,660 ,740 ,003 ,022 ,247 ,570 ,533 ,519 ,968
N 178 178 178 178 178 178 178 178 178 178 178 178 178 178 178 178 178 178 178 178 178 178 178 178 178 178 178 178 178
Pearson C l ti
-,046 -,003 -,012 ,028 ,186* -,189* ,042 -,056 ,057 ,026 ,003 ,048 ,109 -,119 -,114 ,056 ,143 ,014 ,038 1 ,040 -,079 ,119 ,054 -,031 ,006 ,012 -,070 -,071
Sig. (2- ,544 ,971 ,874 ,712 ,013 ,012 ,578 ,458 ,451 ,726 ,969 ,526 ,146 ,113 ,129 ,458 ,058 ,851 ,615 ,600 ,297 ,113 ,471 ,681 ,939 ,877 ,356 ,347
N 178 178 178 178 178 178 178 178 178 178 178 178 178 178 178 178 178 178 178 178 178 178 178 178 178 178 178 178 178
Pearson C l ti
,053 -,102 ,018 -,112 -,047 ,116 -,113 -,090 ,011 ,011 -,083 -,166* -,104 ,070 -,055 ,023 ,096 ,047 ,033 ,040 1 ,026 -,106 -,040 ,001 -,131 ,014 -,093 -,146
Sig. (2-t il d)
,481 ,174 ,816 ,137 ,537 ,123 ,134 ,230 ,884 ,885 ,272 ,027 ,165 ,357 ,470 ,759 ,204 ,529 ,660 ,600 ,733 ,159 ,599 ,989 ,082 ,852 ,216 ,051
N 178 178 178 178 178 178 178 178 178 178 178 178 178 178 178 178 178 178 178 178 178 178 178 178 178 178 178 178 178Pearson ,067 -,053 ,794** ,061 -,037 ,051 ,136 ,094 -,044 -,067 ,545** ,091 -,074 -,034 ,039 -,122 ,006 -,032 -,025 -,079 ,026 1 -,058 ,142 -,008 ,041 -,035 ,044 ,017
Sig. (2-t il d)
,373 ,480 ,000 ,418 ,620 ,501 ,071 ,211 ,563 ,371 ,000 ,229 ,323 ,649 ,606 ,106 ,936 ,667 ,740 ,297 ,733 ,443 ,059 ,914 ,591 ,640 ,558 ,818
N 178 178 178 178 178 178 178 178 178 178 178 178 178 178 178 178 178 178 178 178 178 178 178 178 178 178 178 178 178
Pearson Correlation
,063 ,090 -,044 ,021 ,683** -,120 -,021 ,018 -,035 ,077 -,059 ,083 ,602** ,074 -,025 ,047 -,040 -,039 ,220** ,119 -,106 -,058 1 ,055 ,012 -,050 -,018 -,114 -,002
Sig. (2-tailed)
,407 ,234 ,556 ,783 ,000 ,111 ,780 ,806 ,639 ,304 ,434 ,273 ,000 ,329 ,740 ,537 ,600 ,609 ,003 ,113 ,159 ,443 ,463 ,876 ,510 ,816 ,131 ,978
N 178 178 178 178 178 178 178 178 178 178 178 178 178 178 178 178 178 178 178 178 178 178 178 178 178 178 178 178 178Pearson C l i
-,076 ,008 ,211** ,046 -,048 -,066 -,146 -,084 ,008 ,050 ,105 ,048 ,102 -,029 ,006 -,101 ,058 ,035 ,172* ,054 -,040 ,142 ,055 1 ,592** ,117 -,028 -,013 -,010
Sig. (2-tailed)
,314 ,918 ,005 ,538 ,526 ,385 ,052 ,265 ,915 ,511 ,162 ,521 ,177 ,701 ,932 ,182 ,445 ,641 ,022 ,471 ,599 ,059 ,463 ,000 ,119 ,706 ,864 ,893
N 178 178 178 178 178 178 178 178 178 178 178 178 178 178 178 178 178 178 178 178 178 178 178 178 178 178 178 178 178
Pearson Correlation
-,053 ,015 ,103 ,047 -,051 -,089 -,159* -,072 -,005 -,038 -,016 ,005 -,016 -,020 -,093 -,079 ,204** -,036 ,087 -,031 ,001 -,008 ,012 ,592** 1 -,040 -,004 ,096 ,042
Sig. (2-tailed)
,486 ,840 ,172 ,533 ,496 ,240 ,034 ,340 ,942 ,612 ,827 ,950 ,831 ,789 ,219 ,293 ,006 ,636 ,247 ,681 ,989 ,914 ,876 ,000 ,594 ,953 ,203 ,581
Lack of information sharing
Lack of trust
Joint establishment of objectives for all parties Sharing of skills, Ideas and institutional
Drawing up of contingency plans for Forging and maintain long term relationshipCreating teamwork along SC and cross-Lack of information technology
Process integration
Design and maintaining of communication channelsLaying down performance measures
Incentive realignment
Integrated behavior

School of Business & Economics
Pearson Correlation ,108 ,045 ,034 ,074 -,108 ,010 -,004 ,018 -,035 -,002 ,111 ,032 -,027 ,007 ,087 -,023 -,099 ,069 -,043 ,006 -,131 ,041 -,050 ,117 -,040 1 -,101 ,049 ,122
Sig. (2-tailed),151 ,555 ,649 ,324 ,153 ,892 ,955 ,807 ,642 ,976 ,142 ,674 ,724 ,929 ,247 ,760 ,189 ,362 ,570 ,939 ,082 ,591 ,510 ,119 ,594 ,180 ,513 ,105
N 178 178 178 178 178 178 178 178 178 178 178 178 178 178 178 178 178 178 178 178 178 178 178 178 178 178 178 178 178
Pearson Correlation -,104 ,011 ,016 -,035 ,016 ,141 -,214** -,147* -,057 ,042 ,028 -,084 ,015 ,077 ,045 -,039 -,079 -,025 -,047 ,012 ,014 -,035 -,018 -,028 -,004 -,101 1 -,040 -,096
Sig. (2-tailed),169 ,884 ,837 ,641 ,829 ,061 ,004 ,050 ,447 ,574 ,711 ,263 ,841 ,306 ,553 ,605 ,296 ,741 ,533 ,877 ,852 ,640 ,816 ,706 ,953 ,180 ,594 ,202
N 178 178 178 178 178 178 178 178 178 178 178 178 178 178 178 178 178 178 178 178 178 178 178 178 178 178 178 178 178
Pearson Correlation -,023 -,011 ,070 ,014 -,032 -,096 ,043 ,065 -,090 -,052 ,071 -,079 -,061 -,108 -,092 ,032 ,083 -,039 -,049 -,070 -,093 ,044 -,114 -,013 ,096 ,049 -,040 1 ,011
Sig. (2-tailed),765 ,881 ,356 ,852 ,669 ,202 ,566 ,386 ,233 ,492 ,345 ,292 ,417 ,152 ,224 ,676 ,274 ,607 ,519 ,356 ,216 ,558 ,131 ,864 ,203 ,513 ,594 ,888
N 178 178 178 178 178 178 178 178 178 178 178 178 178 178 178 178 178 178 178 178 178 178 178 178 178 178 178 178 178
Pearson Correlation ,046 ,005 ,047 ,086 ,030 -,077 ,026 -,001 ,002 -,004 ,074 ,021 ,065 ,063 ,197** ,024 ,002 ,100 ,003 -,071 -,146 ,017 -,002 -,010 ,042 ,122 -,096 ,011 1
Sig. (2-tailed),541 ,944 ,531 ,253 ,693 ,308 ,726 ,992 ,978 ,959 ,323 ,777 ,385 ,402 ,008 ,748 ,974 ,182 ,968 ,347 ,051 ,818 ,978 ,893 ,581 ,105 ,202 ,888
N178 178 178 178 178 178 178 178 178 178 178 178 178 178 178 178 178 178 178 178 178 178 178 178 178 178 178 178 178
Demand distortion – Bullwhip effect
Systems incompatibility
Lack of knowledge/Poor human resource
Cost of integration
*. Correlation is significant at the 0.05 level (2-tailed).
**. Correlation is significant at the 0.01 level (2-tailed).

Appendix VIII Correlation tables of barriers to supply chain integration
Correlations between Information integration and Barrier to supply chain integration (mean
value) Information
Integration
Barriers to
Supply Chain
Integration
Information Integration
Pearson Correlation 1 ,174*
Sig. (2-tailed) ,020
N 178 178
Barriers to Supply Chain Integration
Pearson Correlation ,174* 1
Sig. (2-tailed) ,020
N 178 178
*. Correlation is significant at the 0.05 level (2-tailed).
Correlations between coordination resource sharing and barriers to supply chain integration
(mean value) CoordinationRes
ourceSharing
Barriers to
Supply Chain
Integration
CoordinationResourceSharing
Pearson Correlation 1 ,008
Sig. (2-tailed) ,920
N 178 178
Barriers to Supply Chain Integration
Pearson Correlation ,008 1
Sig. (2-tailed) ,920
N 178 178
Correlations between organizational relationship linkage and barriers to supply chain
integration (mean value) Organizational
Relationship
Linkage
Barriers to
Supply Chain
Integration
Organizational Relationship Linkage
Pearson Correlation 1 ,031
Sig. (2-tailed) ,677
N 178 178
Barriers to Supply Chain Integration
Pearson Correlation ,031 1
Sig. (2-tailed) ,677
N 178 178
131

School of Business & Economics
Correlations
Supplychain
integration
Barriersto SCI
Supplychain integration
Pearson Correlation 1 -,049
Sig. (2-tailed) ,623
N 103 103
Barriersto SCI
Pearson Correlation -,049 1
Sig. (2-tailed) ,623
N 103 178
Information
Integration
Cooedinationres
ourcesharing
Organizational
relationship
linkage
Barriers to
supply chain
integration
Information
Integration
Pearson Correlation 1 ,400** ,172* ,174*
Sig. (2-tailed) ,000 ,022 ,020
N 178 178 178 178
Cooedinationres
ourcesharing
Pearson Correlation ,400** 1 ,122 -,029
Sig. (2-tailed) ,000 ,106 ,705
N 178 178 178 178
Organizational
relationship
linkage
Pearson Correlation ,172* ,122 1 ,031
Sig. (2-tailed) ,022 ,106 ,677
N 178 178 178 178
Barriers to
supply chain
integration
Pearson Correlation ,174* -,029 ,031 1
Sig. (2-tailed) ,020 ,705 ,677
N 178 178 178 178
**. Correlation is significant at the 0.01 level (2-tailed).
*. Correlation is significant at the 0.05 level (2-tailed).
132

School of Business & Economics
Correlations
Lack of
information
technology
Coordinatin
resource sharing
Lack of information
technology
Pearson Correlation 1 ,167*
Sig. (2-tailed) ,026
N 178 178
Coordinatin resource sharing
Pearson Correlation ,167* 1
Sig. (2-tailed) ,026
N 178 178
*. Correlation is significant at the 0.05 level (2-tailed).
133

School of Business & Economics
Appendix IX Correlation tables of sub hypothesis
Lack of information technology
Lack of
information
technology
Organizational
relationship
linkage
Lack of information
technology
Pearson Correlation 1 ,051
Sig. (2-tailed) ,498
N 178 178
Organizational relationship
linkage
Pearson Correlation ,051 1
Sig. (2-tailed) ,498
N 178 178
Correlations
Lack of infomation
technology
Information
Integration
Lack of infomation technology
Pearson Correlation 1 ,323**
Sig. (2-tailed) ,000
N 178 178
Information Integration
Pearson Correlation ,323** 1
Sig. (2-tailed) ,000
N 178 178
**. Correlation is significant at the 0.01 level (2-tailed).
134

School of Business & Economics
Lack of information sharing
Correlations
Lack of
information
sharing
Information
integration
Lack of information sharing
Pearson Correlation 1 ,056
Sig. (2-tailed) ,459
N 178 178
Information integration
Pearson Correlation ,056 1
Sig. (2-tailed) ,459
N 178 178
Correlations
Lack of
information
sharing
Organizational
relationship
linkage
Lack of information sharing
Pearson Correlation 1 ,097
Sig. (2-tailed) ,199
N 178 178
Organizational relationship
linkage
Pearson Correlation ,097 1
Sig. (2-tailed) ,199
N 178 178
Correlations
Lack of
information
sharing
Coordination
resource sharing
Lack of information sharing
Pearson Correlation 1 -,007
Sig. (2-tailed) ,921
N 178 178
Coordination resource
sharing
Pearson Correlation -,007 1
Sig. (2-tailed) ,921
N 178 178
135

School of Business & Economics
Lack of trust
Correlations
Information
integration
Lack of trust
Information integration
Pearson Correlation 1 ,022
Sig. (2-tailed) ,775
N 178 178
Lack of trust
Pearson Correlation ,022 1
Sig. (2-tailed) ,775
N 178 178
Correlations
Lack of trust Coordination
resource sharing
Lack of trust
Pearson Correlation 1 -,132
Sig. (2-tailed) ,080
N 178 178
Coordination resource
sharing
Pearson Correlation -,132 1
Sig. (2-tailed) ,080
N 178 178
Correlations
Lack of trust Organizational
relationship
linkage
Lack of trust
Pearson Correlation 1 ,022
Sig. (2-tailed) ,774
N 178 178
Organizational relationship
linkage
Pearson Correlation ,022 1
Sig. (2-tailed) ,774
N 178 178
136

School of Business & Economics
Demand distortion
Correlations
Organizational
relationship
linkage
Demand
Distortion -
Bullwhip effect
Organizational relationship
linkage
Pearson Correlation 1 -,039
Sig. (2-tailed) ,602
N 178 178
Demand Distortion -Bullwhip
effect
Pearson Correlation -,039 1
Sig. (2-tailed) ,602
N 178 178
Correlations
Demand
Distortion -
Bullwhip effect
Information
integration
Demand Distortion -Bullwhip
effect
Pearson Correlation 1 ,064
Sig. (2-tailed) ,395
N 178 178
Information integration
Pearson Correlation ,064 1
Sig. (2-tailed) ,395
N 178 178
Correlations
Demand
Distortion -
Bullwhip effect
Coordination
resource sharing
Demand Distortion -Bullwhip
effect
Pearson Correlation 1 ,031
Sig. (2-tailed) ,677
N 178 178
Coordination resource
sharing
Pearson Correlation ,031 1
Sig. (2-tailed) ,677
N 178 178
137

School of Business & Economics
System incompatibility
Correlations
System
incompatibility
Information
integration
System incompatibility
Pearson Correlation 1 -,042
Sig. (2-tailed) ,575
N 178 178
Information integration
Pearson Correlation -,042 1
Sig. (2-tailed) ,575
N 178 178
Correlations
System
incompatibility
coordination
resource sharing
System incompatibility
Pearson Correlation 1 -,092
Sig. (2-tailed) ,220
N 178 178
coordination resource sharing
Pearson Correlation -,092 1
Sig. (2-tailed) ,220
N 178 178
Correlations
System
incompatibility
Organizational
relationship
linkage
System incompatibility
Pearson Correlation 1 -,028
Sig. (2-tailed) ,706
N 178 178
Organizational relationship
linkage
Pearson Correlation -,028 1
Sig. (2-tailed) ,706
N 178 178
138

School of Business & Economics
Lack of knowledge/ poor human resource
Correlations
Lack of
knowledge/poor
human resource
Organizational
relationship
linkage
Lack of knowledge/poor
human resource
Pearson Correlation 1 -,089
Sig. (2-tailed) ,238
N 178 178
Organizational relationship
linkage
Pearson Correlation -,089 1
Sig. (2-tailed) ,238
N 178 178
Correlations
Lack of
knowledge/poor
human resource
Coordination
resource sharing
Lack of knowledge/poor
human resource
Pearson Correlation 1 -,057
Sig. (2-tailed) ,453
N 178 178
Coordination resource
sharing
Pearson Correlation -,057 1
Sig. (2-tailed) ,453
N 178 178
Correlations
Lack of
knowledge/poor
human resource
Information
integration
Lack of knowledge/poor
human resource
Pearson Correlation 1 ,007
Sig. (2-tailed) ,923
N 178 178
Information integration
Pearson Correlation ,007 1
Sig. (2-tailed) ,923
N 178 178
139

School of Business & Economics
Cost of integration
Correlations
Cost of
integration
Information
integration
Cost of integration
Pearson Correlation 1 ,085
Sig. (2-tailed) ,260
N 178 178
Information integration
Pearson Correlation ,085 1
Sig. (2-tailed) ,260
N 178 178
Correlations
Cost of
integration
Organizational
relationship
linkage
Cost of integration
Pearson Correlation 1 ,050
Sig. (2-tailed) ,504
N 178 178
Organizational relationship
linkage
Pearson Correlation ,050 1
Sig. (2-tailed) ,504
N 178 178
Correlations
Cost of
integration
Coordination
resource sharing
Cost of integration
Pearson Correlation 1 ,030
Sig. (2-tailed) ,686
N 178 178
Coordination resource
sharing
Pearson Correlation ,030 1
Sig. (2-tailed) ,686
N 178 178
140