Embed Size (px)
Citation preview

Dominic de Vries
Leveraging Patents Financially

GABLER RESEARCH
Dominic de Vries
Leveraging Patents Financially A Company Perspective
With a foreword by Prof. Dr. Cornelius Herstatt
RESEARCH
Bibliographic information published by the Deutsche Nationalbibliothek
The Deutsche Nationalbibliothek lists this publication in the Deutsche Nationalbibliografi e;
detailed bibliographic data are available in the Internet at http://dnb.d-nb.de.
Dissertation Hamburg University of Technology, 2011
1st Edition 2011
All rights reserved
© Gabler Verlag | Springer Fachmedien Wiesbaden GmbH 2011
Editorial Offi ce: Marta Grabowski | Jutta Hinrichsen
Gabler Verlag is a brand of Springer Fachmedien.
Springer Fachmedien is part of Springer Science+Business Media.
www.gabler.de
No part of this publication may be reproduced, stored in a retrieval system
or transmitted, in any form or by any means, electronic, mechanical, photo-
copying, recording, or otherwise, without the prior written permission of the
copyright holder.
Registered and/or industrial names, trade names, trade descriptions etc. cited in this publica-
tion are part of the law for trade-mark protection and may not be used free in any form or by
any means even if this is not specifi cally marked.
Cover design: KünkelLopka Medienentwicklung, Heidelberg
Printed on acid-free paper
Printed in the Netherlands
ISBN 978-3-8349-3176-4
Foreword
Together with other intangible assets, patents constitute essential value and competitive
factors for companies, particularly companies in technology-intensive sectors. Patents’ legal
and economic value is beyond question, while their quantitative valuation remains
challenging due to a lack of efficient and reliable methods. In practice, the valuation of
patents is therefore often limited to qualitative appraisals and “strategic” assessments.
This dissertation’s point of departure is the observation that the value of patents and patent
portfolios are often accounted for indirectly, but not based on qualitative valuations in
corporate financing. In this study, Dominic de Vries investigates whether and to what extent
patents may contribute to corporate financing and which factors may be relevant for it. Thus,
he observes the high importance of patents for innovative companies on the one hand and the
difficult utilization of these valuable assets for corporate financing on the other, placing his
focus on this discrepancy. Based on an empirical study, he addresses his set of research
questions within the German industry. As a result, Dominic de Vries provides descriptive and
partially explanatory findings and translates these into hypotheses. In the process, he chooses
an explorative, survey-based research approach, which he combines with a large-scale
empirical study.
In my view, the overall findings of his research are interesting and enriching for academics as
well as practitioners. The distinction of the findings concerning company size clusters allows
for a differentiated insight into corporate finance practice. Another interesting finding is that,
to date, mostly traditional financing instruments have been used to involve patents as
economic assets.
I consider Dominic de Vries’s dissertation a recommendable contribution in every respect.
Univ. Prof. Dr. Cornelius Herstatt
Hamburg, July 2011
Preface
Intellectual property (IP) is a key factor for the creation of value across industries and its
importance is widely recognized. However, measures of the value of IP assets are mostly
limited to qualitative appraisals, due to difficulties and deficiencies of quantitative valuation
methods. As a result, the value of IP, subsumed as intangible assets in reporting standards, is
not adequately represented in the range of corporate financing. Based on expert interviews
and a large-scale survey across technology-intensive industries in Germany, the objective of
this thesis is to find out how patents might contribute to the external access of companies to
financial sources. Within the class of IP assets, I focus on patents, since these are fungible
rights and form a large part of a company’s technological capital. As one of the first in-depth
empirical studies, this thesis explores the actual relevance of and identifies the main influence
factors for companies to leverage patents financially across industry and company size
clusters, and provides an analytical model with the influence factors to analyze the financial
utilization of patents. I therefore seek to contribute to a better theoretical understanding and to
facilitate the practical applicability of patents to external financing instruments.
I wrote this thesis as a research associate at the Institute for Technology and Innovation
Management at the Hamburg University of Technology. I am grateful to Prof. Dr. Cornelius
Herstatt for his supervision and academic support as well as the valuable and pleasant time at
his Institute. Besides allowing me a broad thesis development scope, he also supported me
throughout in many ways. I thank Prof. Dr. Matthias Meyer for his second advisory role,
interest and kind support. I also thank Prof. Thomas J.C. Matzen for the extremely interesting
and inspiring time as his assistant. This time as doctoral candidate was one of professional
and personal enrichment.
Furthermore, I appreciate the contribution of the experts and interview partners who provided
time, valuable insights, and substantial input for my empirical study. My kind thanks to all my
colleagues at the Institute for the company and their valuable advice and support for my work.
Finally, I thank my family for keeping me grounded and my friends Frank and Florian for the
great time and extraordinary fellowship over the years.
Dominic de Vries
Hamburg, July 2011
Outline
Foreword .................................................................................................................................. VPreface ................................................................................................................................... VIIOutline ..................................................................................................................................... IXList of Abbreviations .............................................................................................................. XIList of Figures ...................................................................................................................... XIIIList of Tables ......................................................................................................................... XV 1 Introduction ...................................................................................................................... 1
1.1 Purpose and objective ................................................................................................. 11.1.1 The increasing relevance of intellectual property .............................................. 11.1.2 Challenges in leveraging intellectual property financially ................................. 31.1.3 Research objectives ............................................................................................ 6
1.2 Introduction of central concepts and thesis focus ...................................................... 91.2.1 Introduction of key concepts and definitions ..................................................... 91.2.2 Thesis focus ...................................................................................................... 111.2.3 Thesis structure ................................................................................................ 14
2 The economics of patents ............................................................................................... 16
2.1 The concept of patents and patenting trends ............................................................ 162.1.1 The concept of patents ...................................................................................... 162.1.2 Patenting trends ................................................................................................ 19
2.2 Asset characteristics of patents ................................................................................ 202.2.1 Motives and barriers to patent .......................................................................... 212.2.2 Patents as value drivers .................................................................................... 262.2.3 Patents as value indicators ................................................................................ 292.2.4 Patents as 'assets per se' .................................................................................... 322.2.5 Patents compared to tangible assets ................................................................. 33
2.3 The value question ................................................................................................... 362.3.1 The value distribution of patents ...................................................................... 362.3.2 How to assess the value of patents ................................................................... 38
2.4 The liquidity question ............................................................................................... 412.4.1 The external acquisition and exploitation of patents ........................................ 422.4.2 The external acquisition of patents ................................................................... 432.4.3 The external exploitation of patents ................................................................. 472.4.4 Markets for technology .................................................................................... 522.4.5 Evolving patent-based business models ........................................................... 58
2.5 Synopsis of the economics of patents ...................................................................... 61 3 Patents as financial assets .............................................................................................. 63
3.1 The perception of patents in financial statements .................................................... 633.2 How to leverage patents financially ......................................................................... 67
3.2.1 The role of patents in equity transactions ......................................................... 693.2.2 The role of patents in debt financing ................................................................ 723.2.3 The role of patents in sale/lease-back transactions .......................................... 773.2.4 The role of patents in patent funds ................................................................... 80
3.3 Synopsis of patents as financial assets ..................................................................... 82
X
4 Design of the empirical study ........................................................................................ 844.1 Exploratory interviews ............................................................................................. 854.2 Large-scale survey .................................................................................................... 874.3 Statistical measures and methods ............................................................................. 89
5 Development of the survey ............................................................................................ 92
5.1 Asset characteristics of patents reconsidered ........................................................... 925.2 Endogeneous financial exploitability of patents ...................................................... 945.3 Actual extent and potential of leveraging patents financially .................................. 975.4 Influence factors for companies to leverage patents financially .............................. 98
5.4.1 Financial influence factors ............................................................................... 985.4.2 Asset-related influence factors ....................................................................... 1035.4.3 Managerial influence factors .......................................................................... 105
6 Descriptive results of the empirical study .................................................................. 107
6.1 Description of the survey sample ........................................................................... 1076.2 Asset characteristics of patents .............................................................................. 111
6.2.1 Patent use and patent management trends ...................................................... 1116.2.2 The value and valuation of patents ................................................................. 114
6.3 Endogenous financial exploitability of patents ...................................................... 1186.4 Actual extent and potential of the financial utilization of patents .......................... 1206.5 Influence factors for companies to leverage patents financially ............................ 123
6.5.1 Financial influence factors ............................................................................. 1246.5.2 Asset-related influence factors ....................................................................... 1266.5.3 Managerial influence factors .......................................................................... 128
6.6 Summary of major descriptive findings ................................................................. 129 7 Analytical examination of the survey results ............................................................. 133
7.1 Conceptual framework ........................................................................................... 1337.1.1 Dependent variable: Financial utilization of patents ...................................... 1347.1.2 Independent variables: Influence factors ........................................................ 1357.1.3 Control variables ............................................................................................ 1407.1.4 Overview of the analytical model .................................................................. 142
7.2 Analytical result of the empirical study and generation of hypotheses .................. 1437.3 Synopsis of the analytical survey results ................................................................ 154
8 Discussion and implications ......................................................................................... 157 9 Conclusion ..................................................................................................................... 171 Appendix 1: General information on the concept of patents ........................................... 173Appendix 2: Questionnaire .................................................................................................. 178Appendix 3: Information on descriptive results of the empirical study .......................... 183Appendix 4: Information on the analytical examination of survey result ...................... 194 List of references .................................................................................................................. 197
List of Abbreviations
BaFin Bundesanstalt für Finanzdienstleistungsaufsicht (Federal Financial Supervisory
Authority)
BCBS Basel Committee on Banking Supervision
BilMoG Bilanzmodernisierungsgesetz (Balance Modernization Act)
BGB Bürgerliches Gesetzbuch (German Code of Civil Law)
CDAX Composite Deutscher Aktien Index (Composite German Stock Index)
CEO chief executive officer
CF cash flow
CFO chief financial officer
DAX Deutscher Aktienindex (German Stock Index)
DCF discounted cash flow
DPMA Deutsches Patent- und Markenamt (German Office for Patents and Registered Brand Names)
EPC European Patent Convention
EPO European Patent Office
EU EUR
European Union Euro
FASB Financial Accounting Standards Board (US)
FDA Food and Drug Administration (US)
GDP gross domestic product
HGB Handelsgesetzbuch (German Commercial Code)
IAS International Accounting Standards
IASB International Accounting Standards Board
ICT information and communication technology
IFD IFRS
Initiative Finanzstandort Deutschland International Financial Reporting Standards
IP intellectual property
IPO initial public offering
IPR intellectual property rights
JPO JPY
Japan Patent Office Japanese Yen
JV joint venture
M&A merger & acquisition
MNC multinational corporation
N/K not known
XII
OECD OEM
Organization for Economic Co-operation and Development original equipment manufacturer
PatG Patentgesetz (Patent Act)
R&D research and development
RDFO research and development financial organization
RoI return on investment
SME small and medium-sized enterprises
SolvV Solvabilitätsverordnung (Solvability Decree)
S&P Standard & Poor's
SPV special purpose vehicle
SWORD stock warrants of balance-sheet research and development
UK United Kingdom
US USD
United States of America United States Dollar
USGAAP United States Generally Accepted Accounting Principles
USPTO United States Patent and Trademark Office
VC venture capital
WIPO World Intellectual Property Organization
List of Figures
Figure 1: Illustration of the thesis focus ................................................................................... 11
Figure 2: Thesis structure ......................................................................................................... 14
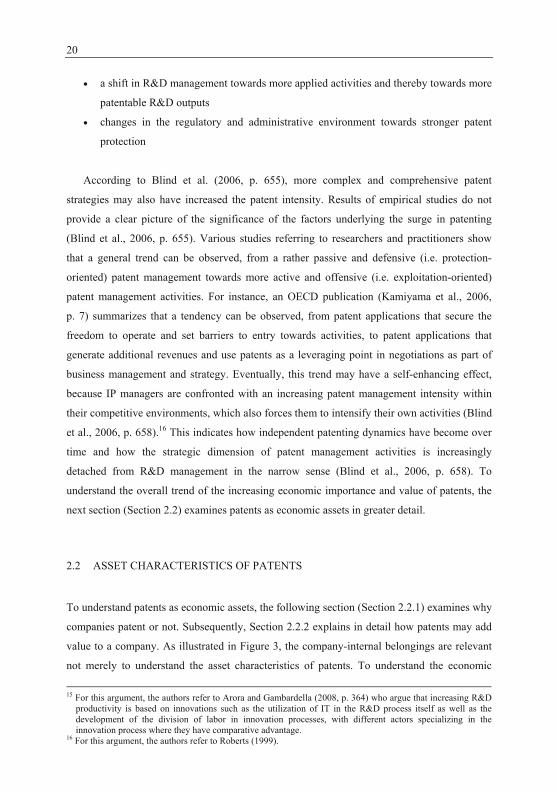
Figure 3: Framework to analyze asset characteristics of patents ............................................. 21
Figure 4: Framework to analyze patents as value drivers ........................................................ 28
Figure 5: WACC variables ....................................................................................................... 29
Figure 6: The value distribution of patents (PatVal survey) .................................................... 37
Figure 7: The role of patents in equity transactions ................................................................. 70
Figure 8: The role of patents in the acquisition of bank loans ................................................. 74
Figure 9: The role of patents in sale/lease-back transactions ................................................... 79
Figure 10: The role of patents in patent funds ......................................................................... 82
Figure 11: Design of the empirical study ................................................................................. 84
Figure 12: Patent disposition matrix ........................................................................................ 96
Figure 13: Overview of respondents' field of responsibility .................................................. 108
Figure 14: Distribution of company size clusters ................................................................... 109
Figure 15: Distribution of industry affiliation ........................................................................ 110
Figure 16: Distribution of patent portfolio size clusters ........................................................ 110
Figure 17: Patent management trends .................................................................................... 113
Figure 18: Distribution of patent portfolio value classes ....................................................... 114
Figure 19: Patent value distribution (comparison of PatVal and thesis results) .................... 117
Figure 20: Descriptive results of the patent disposition matrix ............................................. 119
Figure 21: Potential of a financial utilization of patents ........................................................ 123
Figure 22: Average measures of financial motives ................................................................ 125
Figure 23: Average measures of financial barriers ................................................................ 126
Figure 24: Average measures of asset-related barriers .......................................................... 127
Figure 25: Average measures of managerial barriers ............................................................. 129
Figure 26: Basic framework for the analytical examination of the survey ............................ 133
Figure 27: Operationalization of the dependent variable ....................................................... 135
Figure 28: Detailed framework for the analytical examination of the survey ....................... 142
Figure 29: Overview of the analytical survey results ............................................................. 155
List of Tables
Table 1: Existing literature on leveraging patents financially .................................................... 7
Table 2: Patent statistics at DPMA and EPO in 2006 .............................................................. 19
Table 3: Motives and barriers to patent .................................................................................... 22
Table 4: Overview of patent charges in the triad EU, US, and Japan (2003) .......................... 23
Table 5: Capital market reactions to patenting activities (pharmaceutical industry) ............... 30
Table 6: Patents compared to tangible assets ........................................................................... 34
Table 7: Motivations for and barriers to external patent acquisition ....................................... 44
Table 8: Motivations for and barriers to external patent exploitation ...................................... 48
Table 9: Characteristics of markets for technology compared to product markets .................. 56
Table 10: Overview of evolving patent-based business models in markets for technology .... 58
Table 11: Capitalization of development expenditures (automotive industry, 2007) .............. 66
Table 12: Distribution of different types of collateral in Germany .......................................... 76
Table 13: Overview of company interviews ............................................................................ 86
Table 14: Overview of expert interviews ................................................................................. 86
Table 15: Comparison of responding and non-responding companies .................................. 110
Table 16: Patent use ............................................................................................................... 112
Table 17: Average patent portfolio values and exploitablity ................................................. 115
Table 18: Average value of exploitable patents ..................................................................... 116
Table 19: Applied valuation methods .................................................................................... 117
Table 20: Actual extent of the financial utilization of patents ............................................... 120
Table 21: Factor loadings and factor interpretation ............................................................... 138
Table 22: Overview of model fit criteria and variable significance (likelihood ratio test) .... 145
Table 23: Parameter estimates (reference group: FUP3) ....................................................... 150
Table 24: Anecdotal evidence of funds based on innovative company measures ................. 174
Table 25: Anecdotal evidence of external patent exploitation ............................................... 175
Table 26: History of patent funds ........................................................................................... 176
Table 27: Anecdotal evidence of patent funds ....................................................................... 177
Table 28: Patent use - comparison of thesis results (n = 97) and PatVal results (n = 7.711) 184
Table 29: Company cluster discrepancies in patent management trends ............................... 185
Table 30: Feasibility of and prediction to leverage patents financially ................................. 186
Table 31: Average measures of financial influence factors (motives) ................................... 187
Table 32: Average measures of financial influence factors (barriers) ................................... 188
Table 33: Company cluster discrepancies in financial motivation factors ............................. 189
XVI
Table 34: Average measures of asset-related influence factors ............................................. 190
Table 35: Company cluster discrepancies in asset-related influence factors ......................... 191
Table 36: Average measures of managerial influence factors ............................................... 192
Table 37: Company cluster discrepancies in managerial influence factors ........................... 193
Table 38: Factor pattern matrix .............................................................................................. 195
1 INTRODUCTION "Corporate America is wasting a staggering USD 1 trillion in underutilized patent assets.
Given the pressures on companies these days to maximize shareholder returns, this
underutilization of technology assets represents either a stinging myopia regarding
intellectual property or the greatest opportunity to be handed to chief financial officers in a
generation" (Rivette and Kline, 2000, p. 143).
1.1 PURPOSE AND OBJECTIVE
This thesis explores the essential role of intellectual property (IP) assets for the creation of
economic value, the challenges and difficulties for market participants to leverage these assets
financially, and the chasm between them. Both the critical role of IP for the creation of
economic value and the challenges to leverage IP financially are reviewed in Sections 1.1.1
and 1.1.2, to derive the research objectives of the thesis in Section 1.1.3.
1.1.1 The increasing relevance of intellectual property
The importance and economic value of IP has increased considerably in developed countries
in the past (see, e.g., Granstrand, 1999, p. 8f; OECD, 2005a, p. 3). This increasing importance
is based on the shift from a labor-driven, industrial economy to a knowledge-based economy.
Economic scholars refer to the shift as a transformation towards "intellectual capitalism", i.e.
a capitalist, knowledge-intensive economy in which intellectual capital dominates capital
values, investments, and profit sources (Granstrand, 1999, p. 322). Accordingly, investments
in intellectual assets increased significantly since the 1980s and measure up to the levels of
investments in tangible assets in many OECD countries since the late 1990s (Nakamura,
2001, p. 2; OECD, 2006, p. 11). In line with the higher investments in IP, an increasing share
of the market value of companies is based on their intellectual assets (Kamiyama et al., 2006,
p. 6). By now, intangible capital constitutes the major percentage of corporate market values
of both old and new-economy companies (cf. Lev, 2003, p. 2). While, in 1982, intangibles
accounted, on average, for about 40% of corporate value (Kamiyama et al., 2006, p. 22), it is
estimated that in 2002, intangible assets accounted for 75% of the market value of US firms
(Kaplan and Norton, 2004, p. 4), indicating a major shift within two decades.
D. de. Vries, Leveraging Patents Financially, DOI 10.1007/978-3-8349-6903-3_1, © Gabler Verlag | Springer Fachmedien Wiesbaden GmbH 2011
2
This trend is enforced by the global division of labor. While man-hour-intensive
manufacturing activities associated with tangible assets are transferred to low-wage countries,
knowledge-intensive activities associated with intangible assets are concentrated in developed
countries. At the same time, however, the share of manufacturing output in GDP has remained
largely unchanged in developed countries. The confluence of a decreasing manufacturing
labor share and a stable or even growing manufacturing output in OECD countries is the
result of an increasing productivity (cf. Economist, 2005, p. 69), which can be ascribed to
investments in R&D, know-how, and other intangible assets (cf. Griliches, 2000, p. 15). Thus,
confronted with competition from low-wage countries with increasing manufacturing labor
shares, firms in OECD countries are investing in knowledge intensive activities to create
comparative advantage (OECD, 2005b, p. 5). The crucial role of IP for business performance
and economic growth in OECD countries is emphasized in various official economic reports
(see, e.g., OECD, 2006, p. 5). The Oxford Dictionary of Finance and Banking, for instance,
notes that "intangible assets are increasingly seen as the key to competitive advantage and the
market value of a firm" (Smullen and Hand, 2005, p. 213).
Some executives are staying abreast of this structural change and increasingly attach
importance to the active and strategic management of IP assets and the optimization of their
IP portfolios so as to increase value creation (Kamiyama et al., 2006, p. 6; PwC, 2007, p. 5).
Studies about IP management activities have traditionally shown fairly defensive patenting
activities to prevent copying, to block competitors, and to prevent lawsuits. Within the past
decades, several studies have also shown a development of patent management activities
towards a more active external acquisition and exploitation of IP assets (see, e.g., Kamiyama
et al., 2006, p. 7), to generate additional revenues and develop IP units from cost centers to
profit centers (Chesbrough, 2006, p. 25). By being managed as business assets, IP assets are
increasingly traded as economic goods and may also be utilized as financial assets, besides
being applied purely as legal assets inside the firm.
Based on this development, firms may leverage their IP assets financially to a greater
extent and utilize them to access additional external sources of financing (cf. Kamiyama et al.,
2006, p. 20). However, several studies indicate that the key economic role of IP assets in
OECD countries is not reflected in an equally important role in corporate financing (see, e.g.,
KfW, 2006, p. 145; Klawitter and Hombrecher, 2004, p. 1213). I address reasons for this
3
incongruity in the following section (Section 1.1.2), which outlines the difficulties in dealing
with intangible assets financially.
1.1.2 Challenges in leveraging intellectual property financially
Traditional accounting and reporting standards and their application in management decision
processes, financial instruments, and tax regulations are based on tangible assets as value
drivers and measures of economic performance. Measuring and quantifying IP assets in
economic terms is difficult due to their complex asset characteristics. Therefore, traditional
accounting and reporting systems cannot deal with the structural changeover to a knowledge-
based economy and fall short in an adequate coverage of intangibles and their economic
impact (Lev, 2003, p. 1). The systematic academic examination and discussion of intangible
assets and their economic impact only started in the 1980s; scholars only began to alert
managers, investors, and policy-makers since the early 1990s about the structural change and
the increasing impact of intangible asset on corporate value and growth (cf. Lev, 2003, p. 1).
Due to the failure in providing adequate reporting of intangibles, the value assigned to a
company by accountants and the value assigned to it by market participants often differ. This
is frequently seen in merger and acquisition (M&A) transactions with high discrepancies
between the reported balance sheet value and the purchasing price of equity, or in high
discrepancies between balance sheet values and market capitalization. For instance, as of the
end of 2000, Microsoft Corp. had only USD 1.9 billion in property and equipment, although
its market capitalization was about USD 328 billion (Blair and Wallman, 2001, p. 1).
The reporting gap emerges from the fact that most intangibles are not perceived as assets
in a company's financial statement, although intangibles may have already been adding value
to the firm for several years. According to HGB, intangibles can be capitalized only to a very
limited extent, which is based on HGB's principle of prudence and creditor protection,
according to the rule that assets and income will not be overstated and liabilities and charges
will not be understated. Until the recent commencement of BilMoG in 2010, intangibles were
capitalized only if they were bought in return for payment from a third party and self-
developed intangibles were not capitalized at all. As a result, a company's equity ratio might
have dropped although it might have created value. Eventually, financial key figures might
have shown a negative development when in fact the company was investing in intangibles.
With the commencement of BilMoG, the regulations of the HGB to some extent align with
4
the International Accounting Standards (IAS), which – in contrast to the HGB principle of
prudence and creditor protection – are designed to reflect a company's success potential to
investors. Therefore, the development costs of some self-developed intangibles can be put on
the asset side of the balance sheet, under certain restrictions.1 This may close the reporting
gap to a certain extent, but does not constitute a solution for providing adequate reporting
information. With current reporting standards, the failure in providing adequate information
about intangible assets causes a number of essential economic problems (cf. Chan et al., 2001,
p. 2454; Hall, 2003, p. 29; Lev, 2003, p. 2; Hofmann, 2005, p. 3ff); these include:
inappropriate rating and due diligence processes
systematic biases in managerial decisions
systematic biases in investor decisions
excessive cost of capital for intangible intensive investments
abnormally high volatility of stock prices and excessive insider trading gains
The significant impact of these failures has led to calls for additional information from the
investment community and financial institutions, who would "welcome improvements in
disclosures about the identity, source, and life of both purchased and internally generated
intangible assets" as articulated, for example, by the American Institute of Certified Public
Accountants (AICPA, 1994, p. 83). An increasing number and particularly intangible
intensive companies tend to provide supplementary information, such as voluntary
publications and investor relation, albeit on an unsystematic basis and with great
discrepancies between companies, sectors, and countries (Gelb, 2002, p. 457; OECD, 2006,
p. 19; PwC, 2007, p. 46). Considering the design of information, systematic and conceptual
approaches have different origins. Hiroyuki Itami was a pioneer in 1980 with his work on
invisible assets in the management in Japanese corporations. His findings were published in
English in 1987 (Itami, 1987) at the same time as Sveiby and Riesling's (1986) work on
knowledge management and human capital. Also at the same time, Johnson and Kaplan
(1987, p. 2) introduced their work on the inadequacy of the contemporary accounting system,
noting that it "treats many cash outlays as expenses in the period in which they are made even
though these outlays will benefit future periods." Based on the awareness that intangibles
have an important impact on company growth that is not represented by the contemporary
accounting system, Kaplan and Norton (1992) developed the Balanced Scorecard, with the 1 A detailed description of the handling of intangibles, according to HGB, before and after the commencement of the BilMoG as well as their handling according to IAS is provided in Section 3.1.
5
aim of providing performance measures that take these value drivers into account. Related
tools subsequently developed by economists and practitioners are the Intangible Asset
Monitor (Sveiby, 1997), the Skandia Navigator (Edvinsson and Malone, 1997), and the
Technology Broker (Brooking, 1996). In addition, many companies and organizations have
developed their own reporting tools and measures for their own use (Blair and Wallman,
2003, p. 458). However, Blair and Wallman (2003, p. 458) note that some of the measures
being used "to show the linkages among the intangible factors that contribute to the
performance […] have gained a certain prominence and have apparently proved to be useful
management tools in individual companies. None, however, is being used consistently by a
large enough group of firms to provide useful cross-sectional or time-series data, or even
reasonable benchmarks that one company could use to compare its performances with that of
another. So far, at least, the information generated by these efforts is still ad hoc and situation
specific." Similarly, concerning observations of internal reporting practices, Lev (2003, p. 2)
notes that these non-standardized measures are not adequate for resource allocation or
investment decisions. Even though official institutions, academics, and practitioners are
engaged in various efforts such as PRISM2 to address the problem, state-of-the-art intellectual
capital reporting has a number of barriers and shortcomings.3 In short, Lev (2003, p. 2)
concludes that "both managers and investors are at a very early stage of grappling with the
management, valuation, and reporting of intangibles."
The potential to leverage IP assets financially might be a matter of great interest to the
financial community, including private equity firms, investment banks, and commercial
banks. Investors would benefit from more realistic corporate valuations, and creditors would
benefit from more realistic risk assessments and could enhance their average yield per loan as
well as their overall market potential (Hofmann, 2005, p. 4). Moreover, Hofmann (2005,
p. 12) from Deutsche Bank Research notes that "an ever larger number of prospering
companies owe their success precisely to their intangible assets. Lenders unable to extend
credit to such businesses on the basis of these assets are closing the door on large part of the
credit market of the future." Some banks are thus beginning to take certain IP assets such as
patents into account in rating procedures, to deal with patents as major collateral, and to
develop other patent-based financing instruments such as IP securitization (Kamiyama et al.,
2006, p. 20). A number of trade journals have drawn the picture of a rapidly evolving field of
IP finance (e.g., Lucier and Milani, 2005). However, larger banks do not thoroughly analyze 2 PRISM is a project initiated by the European Union (see http://www.euintangibles.net, accessed: 2008/08/04). 3 See, e.g., Guimon (2005, p. 32f) for an overview of specific barriers and shortcomings.
6
IP (Hall, 2003, p. 36; Kamiyama et al., 2006, p. 20); a 2006 German study indicates that the
current volume of IP exploitation in the capital market is negligible (KfW, 2006, p. 146).
As a result, companies with high ratios of intangibles are confronted with serious
disadvantages in their ability to raise external capital. This difficulty applies both at the
company and project levels. A 2006 study shows that about a quarter of exploitable patents in
technology-based companies in Germany are lying idle (IW, 2006, p. 20). Particularly in
smaller companies, these patents are kept on hold, primarily due to the difficulty of attracting
external funds (IW, 2006, p. 23). Typically, young technology-based companies with limited
revenues, tangible assets, and track records are strongly dependent on the ability to leverage
their IP assets financially. Other established companies with valuable IP portfolios may also
benefit from the ability to leverage their IP assets financially. Based on the presumably
marginal contribution of IP assets to access external financial sources and on the high
potential of companies to benefit from leveraging their IP assets financially, I will now
describe the objectives of this thesis in the following section (Section 1.1.3).
1.1.3 Research objectives
Detailed information about the financial utilization of IP assets across technology-intensive
industry sectors and company size clusters does not exist for the German market environment.
The introduction to this thesis points out the significant role of IP assets and the high potential
to leverage them financially in a technology-driven economy, although it is assumed that the
actual utilization of IP assets for financial purposes is limited. Therefore, it is of great
economic concern for both capital seekers and capital providers to understand the economic
factors that determine the financial utilization of IP assets, and to recognize the actual extent
and potential possibilities of this (cf. Aho, 2006, p. 25; KfW, 2006, p. 145).
Due to the broad variety of IP assets, I will concentrate on specific assets. While the focus
of this thesis is described in greater detail in Section 1.2.2, it has to be mentioned here that
this thesis concentrates on patents. Patents are at the forefront of being leveraged financially,
because they are fungible and constitute a large part of a company's technological capital.
Owing to the increasing importance of the topic, there has been much research on patents and
patent management over the past two decades. For a long time, however, the role of patents as
financial assets was disregarded by both academics and by practitioners. Literature about

7
leveraging patents financially is rare, and very few studies examine the financial utilization of
patents in detail. Table 1 presents an overview of identified publications.
An overview of existing literature shows that information about the financial utilization of
patents is fragmented, and that comprehensive studies about the financial impact of patents
are mostly limited to venture capital financing. Besides this, there is rich research on the value
relevance of patent information in the capital market (see, e.g., Griliches et al., 1991; Deng et
al., 1999; Hirschey and Richardson, 2004; Hall et al., 2007). Because the impact of patent
information on the stock market performance of publicly tradable companies is only indirectly
associated with the financial utilization of patents, existing literature is not explicitly referred
to in Table 1. In short, it can be stated that most of the existing empirical findings on the
relationship between corporate financing and IP assets are based on stock market valuation
and venture capital financing. Hence, the financial utilization of patents is limited to a sub-
sample of firms and financing instruments.
Table 1: Existing literature on leveraging patents financially4
Author (year) Subject matter Type of data source (sample)
Company focus
Geographical scope
Czarnitzki and Kraft (2002)
the impact of innovation (in terms of patents, among others) on credit ratings and company value
databases (5,305 observations)
manufact-uring sector
Germany
Hall (2003) intangibles and credit risk analysis banks and rating agencies (14 interviews)
not supplied European Union
Baum and Silverman (2004)
selection criteria (among others, patents) in venture financing
(204 qualitative datasets)
bio-tech start-ups
Canada
Davies (2004) the financial utilization of IP assets companies and intermediaries (301 surveys)
SMEs Great Britain
Bittelmeyer (2007) patents as indicators in the capital market
databases (288 IPOs and 589 CDAX firms)
publicly tradable companies
Germany
Mann and Sager (2007)
the role of patents for venture capital financing
databases (1,089 datasets)
bio-tech and software start-ups
United States
Bittelmeyer et al. (2008)
the utilization of intangible assets as loan security
companies (4,300 surveys)
SMEs Germany
Haeussler et al. (2009)
the role of patents in venture capital financing
companies (280 surveys)
bio-tech companies
Germany, Great Britain
4 Source: own compilation.
8
The aim of this thesis is to provide a comprehensive and detailed analysis of the actual
extent of and influence factors on leveraging patents financially in the case of established
companies across industry sectors, company sizes, and company type clusters, from a
corporate perspective. The objectives of this thesis are:
I. to demonstrate the role of patents as financial assets and to describe prevalent
patent-based financing instruments from a corporate perspective based on literature
findings
II. to derive influence factors for leveraging patents financially from a corporate
perspective based on literature findings and expert interviews
III. to empirically examine the relevance of patent-based financing activities as well as
the significance of identified influence factors across company size clusters and
patent-intensive industry sectors based on an extensive survey
IV. to derive hypotheses about leveraging patents financially from a corporate
perspective based on empirical findings
This study is of a descriptive and explorative nature, due to the matter's emerging status.
This thesis conducts empirical research that prepares the ground for a set of hypotheses. The
results of the study should serve as a foundation for both practitioners and academics, to
enable a more comprehensive financial handling of patents, particularly in technology-driven
economies.
9
1.2 INTRODUCTION OF CENTRAL CONCEPTS AND THESIS FOCUS
Due to the complexity of key concepts in this thesis and the vastness of the research topic,
Section 1.2.1 defines frequently used terms, while Section 1.2.2 describes the focus of this
thesis. Finally, Section 1.2.3 provides an overview of the thesis structure.
1.2.1 Introduction of key concepts and definitions
Key concepts that are frequently used in the thesis are intangible asset, intellectual property,
intellectual property right, patent, and innovation. To avoid inaccuracies and
misinterpretation, I will now define these concepts and describe their use in this thesis.
Tangible and intangible assets comprise all value generating elements in a company
(Smith and Parr, 2000, p. 15). Tangible assets have a physical substance5, while intangibles
are nonmaterial assets that can neither be seen nor touched. There are various definitions of
intangibles. The International Accounting Standards Board (IASB) defines intangibles as
"identifiable non-monetary assets without physical substance held for use in the production or
supply of goods and services, for rental to others, or for administrative purposes."6 Intangibles
can be divided into relational capital (organizational capital, goodwill, and reputation), human
capital (competencies) and intellectual property rights (trademarks, copyrights, and patents)
(Granstrand, 2007, p. 16).
An intangible asset is referred to as intellectual property (IP) when it is legally secured
and enforceable against third parties (Smith and Parr, 2000, p. 27; Lev, 2001, p. 5). As any
other form of property, IP can be bought, sold, licensed, and traded. The term intellectual
property right (IPR) refers to the assignment of the property right through patents, copyrights,
and trademarks, which usually provide an exclusive right over the use of an intellectual asset
for a certain period of time.7 A property right is a social construct and must be distinguished
5 Tangible assets are generally categorized into physical capital (plant, equipment, machinery, etc.) and financial
capital (money, securities, etc.) (Granstrand, 2007, p. 16). 6 Source: http://www.iasplus.com/standard/ias38.htm, accessed: 2008/08/04. 7 Source: http://www.wto.org/english/tratop_e/trips_e/intel1_e.htm, accessed: 2010/05/08;
http://www.oecd.org/dataoecd/8/61/2376087.pdf, accessed: 2010/05/08.
10
from the underlying intellectual asset in the sense that the property right is transferable and
can be dealt with as an economic good in itself (Granstrand, 1999, p. 18).
The thesis focuses on patents.8 Patents are defined by the United States Patent and
Trademark Office (USPTO) as "the grant of a property right to the inventor […] to exclude
others from making, using, offering for sale, or selling the invention."9 It must be noted that a
patent is a negative right, i.e. a patent does not grant the right to make, use, offer, or sell an
invention, but it grants the right to exclude others from doing so.10 To be granted, a patent
application must fulfill three criteria: it must be new, involve an inventive step, and be
capable of industrial application (§§ 1 - 5 PatG). The patent application must describe the
invention in a detailed enough way to enable others to use it. The patent application is
published by the Patent Office. Patents are only valid in the country that granted them. The
general term of a patent is 20 years from the date on which the application was filed (the
priority date), provided that the maintenance fees for the patent are paid (§§ 16, 17, 20 PatG).
If, during this time, the patent is commercially exploited by others without authorization, the
patent holder may go to court and sue the infringer. The court may then stop the infringer
from using it through an injunction and the court may also claim against the infringer for
damages. Therefore, the value of a patent right is essentially based on its use as a means for
litigation (Granstrand, 2007, p. 161). The term patent is usually used in a broad sense,
including the right to commercialize the invention in the form of the legal document itself as
well as the invention and the know-how needed to apply and commercialize it. To draw a
clear distinction between concepts, I will refer to patents in this thesis as pure legal
documents, unless otherwise stated.
Other closely related terms frequently associated with patents and (new) technologies are
the terms invention and innovation. While invention basically refers to novel ideas of
technologies in a rudimentary form (e.g., sketches or prototypes), it does not imply a
successful application, whereas innovations imply that an invention has successfully been
transformed into marketable technologies or products (Granstrand, 1999, p. 58; Verburg et al.,
2006, p. 139). Innovations may be patented, or not.
8 With patents, I refer to both patent applications and granted patents. Distinctions will be used where necessary. 9 Source: http://www.uspto.gov/patents/resources/general_info_concerning_patents.jsp#heading-2, accessed:
10/06/04. 10 The distinction between an entitlement and a negative right can be explained by patents for drugs, which do
not automatically entitle the holder to sell it as a medicine unless national health authorities have also authorized this, independently from the question as to whether or not the drug is patented (Granstrand, 2007, p. 159).
11
1.2.2 Thesis focus
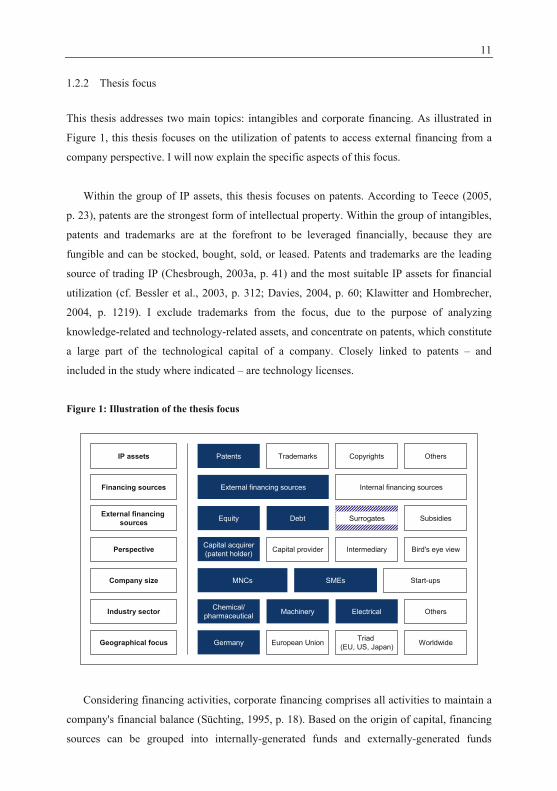
This thesis addresses two main topics: intangibles and corporate financing. As illustrated in
Figure 1, this thesis focuses on the utilization of patents to access external financing from a
company perspective. I will now explain the specific aspects of this focus.
Within the group of IP assets, this thesis focuses on patents. According to Teece (2005,
p. 23), patents are the strongest form of intellectual property. Within the group of intangibles,
patents and trademarks are at the forefront to be leveraged financially, because they are
fungible and can be stocked, bought, sold, or leased. Patents and trademarks are the leading
source of trading IP (Chesbrough, 2003a, p. 41) and the most suitable IP assets for financial
utilization (cf. Bessler et al., 2003, p. 312; Davies, 2004, p. 60; Klawitter and Hombrecher,
2004, p. 1219). I exclude trademarks from the focus, due to the purpose of analyzing
knowledge-related and technology-related assets, and concentrate on patents, which constitute
a large part of the technological capital of a company. Closely linked to patents – and
included in the study where indicated – are technology licenses.
Figure 1: Illustration of the thesis focus
Company size
Industry sector
Financing sources
IP assets
Geographical focus
Patents
Internal financing sources
Start-ups
Trademarks Copyrights Others
External financing sources
External financing sources
SMEsMNCs
Chemical/pharmaceutical Machinery Electrical Others
Germany European Union Triad (EU, US, Japan) Worldwide
Equity Debt SubsidiesSurrogates
Perspective Capital acquirer(patent holder) Capital provider Intermediary Bird's eye view
Considering financing activities, corporate financing comprises all activities to maintain a
company's financial balance (Süchting, 1995, p. 18). Based on the origin of capital, financing
sources can be grouped into internally-generated funds and externally-generated funds
12
(Süchting, 1995, p. 22; Wöhe, 2002, p. 27). Internal funds may be generated, for example,
through the creation of capital (retained earnings) or by the redeployment of capital (through
depreciation, rationalization, and other instruments) (Süchting, 1995, p. 22f ; Wöhe, 2002,
p. 13ff). Concerning leveraging IP assets financially, internal financial sources are the
commercialization of IP assets and the optimization of IP portfolios to cut the expenses for IP
activities. Both aspects have been the topic of numerous studies in recent years (see, e.g.,
Lichtenthaler, 2006, p. 40ff). This thesis does not seek to contribute to the large body of
research on external patent commercialization, but to specifically examine the utilization of
patents within external financing instruments. The external exploitation of patents to generate
additional revenues is only partially included in this thesis in order to analyze the distinction
and preferences of companies in the financial utilization of patents. First and foremost, the
objective of this thesis is to analyze the utilization of patents in external financing
instruments, i.e. the acquisition of capital from sources outside the company by means of
patents. In contrast to internally-generated funds, these instruments are characterized by an
inflow of capital at the start of financing activity, which involves the payback of the capital at
a later stage (Schneider, 1990, p. 1986). External financing instruments can basically be
categorized into equity financing and debt financing (Süchting, 1995, p. 22), both of which I
examine in detail. Furthermore, I examine the role of patents as financial assets in the
surrogate instrument sale/lease-back transaction. The classification of sale/lease-back is not
consistent in the financing literature. Because leasing has elements of loan agreements and
can be considered as a sub-form of debt financing (Wöhe, 2002, p. 15; Zantow, 2008, p. 315),
sale/lease-back transactions may equally be categorized as a sub-form of debt financing. I also
examine how patents can be leveraged in patent funds. Patent funds are a relatively new
model that cannot be classified within the scheme of financing instruments in Figure 1.
Nevertheless, for patent holders, the utilization of patents in patent funds is one way to
acquire external capital, which is aligned with the context of this thesis.
An important distinction from certain other studies is that this thesis does not concentrate
on how patents can be used to finance innovation projects, i.e. how development activities
based on certain proprietary rights can be financed with the help of these assets. Instead, this
thesis examines if and how existing and valuable patent portfolios of established companies
are leveraged financially. I also decided not to examine financing instruments relevant only
for specific companies. I do not examine the role of patents in accessing subsidies and
exclude financing instruments of large corporations that are not available to smaller
13
companies, due to a lack of financial volume, such as the issuing of securities in the capital
market (cf. Gräfer et al., 1998, p. 202; Zantow, 2008, p. 138). I also exclude financially
engineered products traded in capital markets, such as asset-backed instruments.
This thesis is designed to generate an understanding of how patents can be leveraged
financially across company size classes and industry clusters. Nevertheless, certain limitations
are also drawn concerning industries and company size. Considering industry sectors, I
concentrate on patent-intensive sectors. Arundel and Kabla (1998, p. 133f) analyzed the
patenting rate in different industry sectors. They found that the most patent-intensive
industries are the pharmaceutical industry, with a patenting rate of 74% of innovations, and
the chemical industry, with 57%. Companies in the machinery industry (and closely related
industries such as fabricated metal products) show patenting rates in the range of 38% to 52%;
companies in the electrical industry (and closely related sectors such as office and computing
equipment or precision instruments) show similar patenting rates between 43% and 56%. In
other industries, they found rather low patenting rates, for instance, in the basic metals
industry (14%) or the textile industry (a mere 8%). I focus on patent-intensive industries,
namely the chemical, pharmaceutical, machinery, and electrical industries, including closely
related sectors. Section 6.1 provides a systematic differentiation and a detailed description of
examined industry classes. Concerning company size clusters, this thesis includes all
company types, rather than concentrating on particularities of specific size clusters, such as
the role of patents for start-ups and venture capital financing. This thesis analyzes the
financial utilization of patents by all types of companies with valuable patent portfolios.
I also seek to avoid systematic distortions and noise from differing legal and economic
factors, which may influence financial and patent management behavior. To eliminate the
influence and noise of differing country-specific factors as far as possible, the study focuses
on firms within one country (cf. Ernst, 2001, p. 148). This thesis concentrates on the German
business environment, concerning the importance of IP with relatively high and lasting patent
application numbers compared to other countries. In 2009, with 25,107 or about 18% of all
patent applications worldwide, Germany ranked second behind the US (32,966), with Japan
third (19,933) (EPO, 2010, p.52f). The German business and legal environment is at the
center of investigation and is referred to throughout, unless otherwise stated. Nevertheless,
Germany's legal environment is integrated into the European Union (EU), and the German
business environment is strongly influenced by internationalized companies and foreign trade
14
regulations. Patent applications by German companies often extend German borders. Data and
information from other geographical regions will therefore be used, where indicated. This will
comprise primarily the so-called triad of the EU, the US, and Japan.
Finally, I must mention that IP and financing are both complex areas that involve a broad
range of academic disciplines, including engineering expertise, legal matters, macroeconomic
theories, tax matters as well as the broad field of policies and regulations. These are
considered along general lines within this thesis, but need to be examined in greater detail by
experts in the various fields.
1.2.3 Thesis structure
The purpose of this thesis, which is rooted in the importance and challenges in leveraging
patents financially, was outlined in the first two sections. The research objectives of this thesis
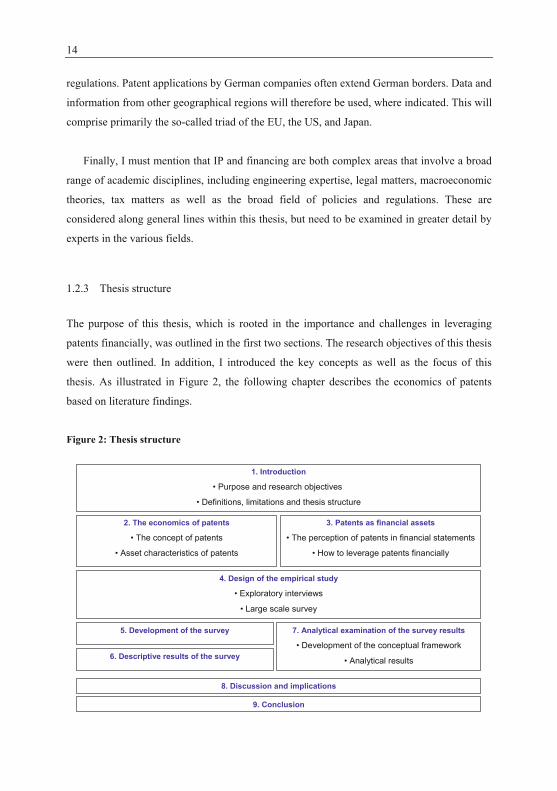
were then outlined. In addition, I introduced the key concepts as well as the focus of this
thesis. As illustrated in Figure 2, the following chapter describes the economics of patents
based on literature findings.
Figure 2: Thesis structure
2. The economics of patents
• The concept of patents
• Asset characteristics of patents
1. Introduction
• Purpose and research objectives
• Definitions, limitations and thesis structure
4. Design of the empirical study
• Exploratory interviews
• Large scale survey
8. Discussion and implications
3. Patents as financial assets
• The perception of patents in financial statements
• How to leverage patents financially
7. Analytical examination of the survey results
• Development of the conceptual framework
• Analytical results
5. Development of the survey
6. Descriptive results of the survey
9. Conclusion
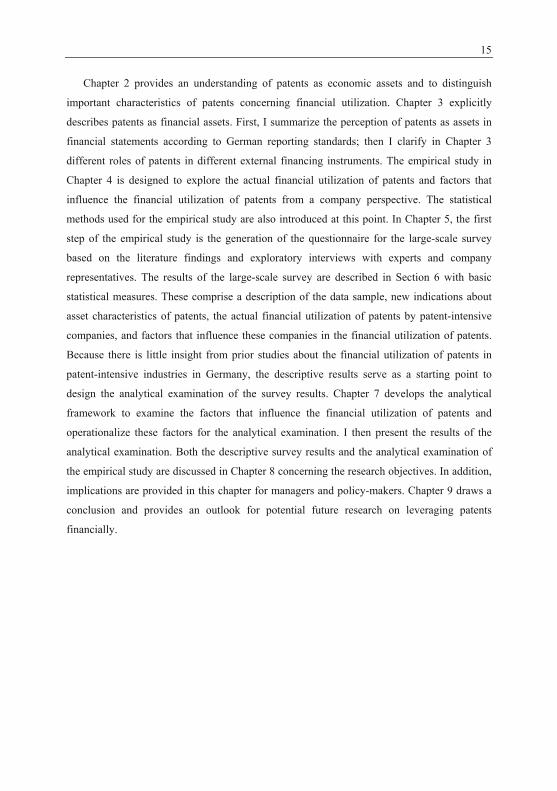
15
Chapter 2 provides an understanding of patents as economic assets and to distinguish
important characteristics of patents concerning financial utilization. Chapter 3 explicitly
describes patents as financial assets. First, I summarize the perception of patents as assets in
financial statements according to German reporting standards; then I clarify in Chapter 3
different roles of patents in different external financing instruments. The empirical study in
Chapter 4 is designed to explore the actual financial utilization of patents and factors that
influence the financial utilization of patents from a company perspective. The statistical
methods used for the empirical study are also introduced at this point. In Chapter 5, the first
step of the empirical study is the generation of the questionnaire for the large-scale survey
based on the literature findings and exploratory interviews with experts and company
representatives. The results of the large-scale survey are described in Section 6 with basic
statistical measures. These comprise a description of the data sample, new indications about
asset characteristics of patents, the actual financial utilization of patents by patent-intensive
companies, and factors that influence these companies in the financial utilization of patents.
Because there is little insight from prior studies about the financial utilization of patents in
patent-intensive industries in Germany, the descriptive results serve as a starting point to
design the analytical examination of the survey results. Chapter 7 develops the analytical
framework to examine the factors that influence the financial utilization of patents and
operationalize these factors for the analytical examination. I then present the results of the
analytical examination. Both the descriptive survey results and the analytical examination of
the empirical study are discussed in Chapter 8 concerning the research objectives. In addition,
implications are provided in this chapter for managers and policy-makers. Chapter 9 draws a
conclusion and provides an outlook for potential future research on leveraging patents
financially.
2 THE ECONOMICS OF PATENTS
"Many commentators believe that intellectual property, especially patents, will represent the
most significant wealth of the next century" (Ely, 1992, p. 6).
2.1 THE CONCEPT OF PATENTS AND PATENTING TRENDS
I will now discuss the concept of patents (Section 2.1.1) at the macro-economic level and will
provide a description of EPO statistics in the subsequent section (Section 2.1.2) to highlight
the development of patenting activities by market actors.
2.1.1 The concept of patents
The intellectual property rights system enables private ownership of intellectual capital
(Granstrand, 2007, p. 19). The concept of a patent system stimulates innovations by providing
a temporary monopoly for the inventor and, at the same time, by facilitating R&D on new
processes or products by publishing and disseminating detailed technical information about
the invention in the form of the patent itself that might otherwise remain secret (Griliches,
1990, p. 1663). The concept of patents, which stimulates innovations by granting a temporary
monopoly right, is based on specific characteristics of IP assets that otherwise barely allow for
profitable revenues on investments in IP assets. In general, IP assets are irreversibly produced
and transferred as well as reusable and reproducible at no or low cost. Therefore, the value
creation of IP assets is usually characterized by large initial investments with small variable
costs in application (Granstrand, 2007, p. 154). Teece (2005, p. 22) notes that "[…]
knowledge has aspects of what economists refer to as a public good – when consumption by
one individual does not reduce the amount left for another. This is especially true for
scientific knowledge. […] However, the distinction erodes quickly as one move towards
industrial knowledge and away from scientific knowledge. While multiple uses need not take
away from knowledge – indeed it may well be augmented – the economic value may well
decline with simultaneous use by multiple entities. […] Imitators can dramatically lower the
market value of knowledge by augmenting its supply in the market." Therefore, the objective
of patent systems is to sustain the economic value of technological knowledge and to enable
companies to refund investments in innovations, producing a high risk-reward ratio by
temporarily granting a monopoly right.
D. de. Vries, Leveraging Patents Financially, DOI 10.1007/978-3-8349-6903-3_2, © Gabler Verlag | Springer Fachmedien Wiesbaden GmbH 2011
17
If the patent protection model is considered for a single, isolated invention, the concept
seems convincing. Mansfield (1986, p. 173) notes, in this context, that "the patent system is at
the heart of our nation’s policies toward technological innovation." However, the patent
system is both complex and controversial (see Andersen and Konzelmann, 2008, p. 13).11
Several studies suggest that patent systems are an ineffective tool to encourage innovative
activities and may even impose disincentives (see, e.g., Bessen and Meurer, 2008, p. 26).
Hence, intellectual property rights may – in contrast to their conceptual motivation – even
hamper technological progress. This critique is primarily grounded on the following three
aspects:
technological factors
market participants' behavior
institutional inadequacy
Considering technological factors, monopoly rights may hamper innovative
developments, mostly in so-called "complex product industries", i.e. technological fields that
are complex and where technological developments are cumulative and interactive processes
with many cross-links (Hunt, 1999, p. 17f; Levin et al., 1987, p. 7). Especially high-
technological fields are characterized by interdisciplinary R&D processes and typically
interact with each other in complex and interdependent ways. At the same time, more generic
technologies12 emerge, i.e. more multiproduct technologies are developed (Granstrand, 1999,
p. 334). In addition, sources of new technologies and the number of cross-links within the
patent landscape increase with an increasing number of corporations investing in
internationalized R&D activities. As a result, new businesses become more reliant on an
increasing number of patents (Granstrand, 1999, p. 334). Companies are confronted with an
IP assembly problem by being required to develop not only their own IP assets, but also to
gather an increasing number of licenses from others so as to be able to commercialize new
products and services. As Shapiro (2001, p. 120) notes, "our patent system is in fact creating a
patent thicket, a dense web of overlapping intellectual property rights that a company must
hack its way through in order to actually commercialize new technologies." Considering
11 There are alternative concepts to patent systems in practice, which have been analyzed to some extent. For
instance, Wright (1983, p. 691ff) analyzes the choice between patents, prize, and direct contracting for research services, while Mansfield (1985, p. 97ff) conducted an empirical analysis of R&D tax credits and allowances in Canada to increase company-financed R&D activities.
12 Technologies are generic when a cascade of successive technologies emerges from them (Granstrand, 2007, p. 284).
18
market participants' behavior, the increasing importance and value of IP assets and the general
shift towards "intellectual capitalism" (see Section 1.1.1) leads to an increasing number of
market participants who intensify the use of the patent system as a competitive business tool.
Large corporations progressively develop patent portfolios to strengthen their bargaining and
retaliation power or to exercise patent strategies to delude competitors (Granstrand, 1999,
p. 335). Consequently, asymmetries in bargaining power between new and old firms, small
and large firms, and between industrial sectors are likely to increase (Granstrand, 1999,
p. 335), and patent management skills are likely to evolve into a competitive factor. At the
same time, opportunities to exploit patent values as well as to abuse the patent system arise.
With increasing opportunities to exploit patent values, new patent-based business models
evolve. On the one hand, these business models create value by means of a more effective and
more efficient application and exploitation of patents. On the other hand, new exploitation-
based business models might have destructive effects. Particularly, the litigation-based
business models of so-called patent trolls raise concerns.13 Another concern arises from
institutional inadequacies. According to Granstrand (1999, p. 334), "the changing character of
technology creates misfits between technology and the legal framework designed to foster it.
It is an inherent tendency that changes in legislation lag behind changes in technology."
Contemporary technology such as, for example, software and biotechnology are developing
swiftly and challenge patent systems concerning the protection of IP assets (Granstrand, 1999,
p. 334).
In short, with cumulative innovations and an increasing number of cross-links between IP
assets and actors in technological fields, the patent system may have the effect of slowing
down and hampering innovation and diffusion, and its workings may be too slow to be able to
protect the IP assets of fast-developing high-technology fields (Granstrand, 1999, p. 334;
Shapiro, 2001, p. 120), although patent systems are designed to stimulate investments in
innovation activities and constitute an essential instrument for companies to develop new
products and to bring them successfully to market.
13 Patent trolls are usually small and specialized firms with legal and technological expertise, and concentrate on
patent extortions.
19
2.1.2 Patenting trends Before 1980, relatively little value was attached to patents, strategically and in financial terms
(OECD, 2005b, p. 10). Since the 1980s, however, the patenting activity and the importance of
patents have increased rapidly and steadily (Cohen et al., 2000, p. 16; OECD, 2005b, p. 10).
While patent values are highly skewed, patent mean value estimates have grown significantly
(OECD, 2005b, p. 10). Estimates based on French patent data for the 1970s indicated average
patent values in the range of USD 15,000 (OECD, 2005b, p. 10), while recent estimates put
average patent values in the range of EUR 300,000 in Europe (cf. Giuri et al., 2007, p. 1121).
At the same time, receipts from licensing patents increased rapidly. For instance, in Germany,
receipts from international licensing and transfers of patents doubled between 1990 and 2003
from EUR 1.3 billion to EUR 2.7 billion (Kamiyama et al., 2006, p. 18). The number of
patent applications filed with the EPO (including Euro-PCT international phase) increased
from 79,261 in 1995 to 178,579 in 2004 (EPO, 2004, p. 82f).
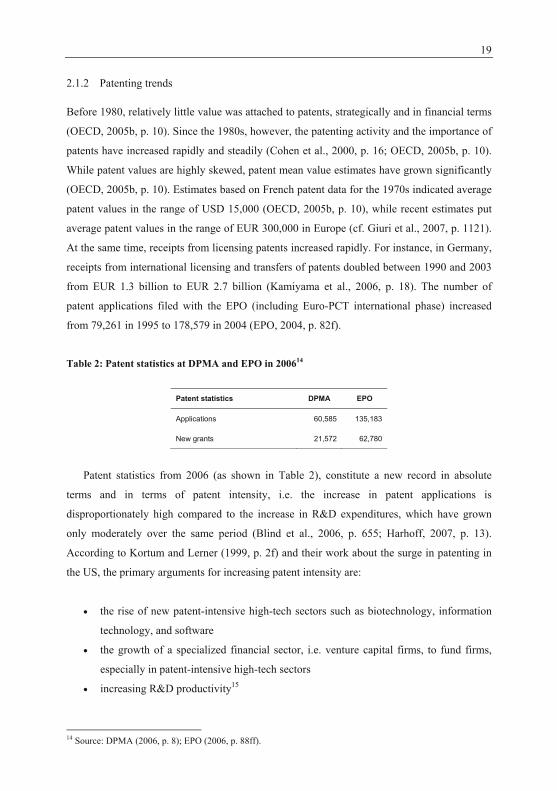
Table 2: Patent statistics at DPMA and EPO in 200614
Patent statistics DPMA EPO
Applications 60,585 135,183
New grants 21,572 62,780
Patent statistics from 2006 (as shown in Table 2), constitute a new record in absolute
terms and in terms of patent intensity, i.e. the increase in patent applications is
disproportionately high compared to the increase in R&D expenditures, which have grown
only moderately over the same period (Blind et al., 2006, p. 655; Harhoff, 2007, p. 13).
According to Kortum and Lerner (1999, p. 2f) and their work about the surge in patenting in
the US, the primary arguments for increasing patent intensity are:
the rise of new patent-intensive high-tech sectors such as biotechnology, information
technology, and software
the growth of a specialized financial sector, i.e. venture capital firms, to fund firms,
especially in patent-intensive high-tech sectors
increasing R&D productivity15
14 Source: DPMA (2006, p. 8); EPO (2006, p. 88ff).
20
a shift in R&D management towards more applied activities and thereby towards more
patentable R&D outputs
changes in the regulatory and administrative environment towards stronger patent
protection
According to Blind et al. (2006, p. 655), more complex and comprehensive patent
strategies may also have increased the patent intensity. Results of empirical studies do not
provide a clear picture of the significance of the factors underlying the surge in patenting
(Blind et al., 2006, p. 655). Various studies referring to researchers and practitioners show
that a general trend can be observed, from a rather passive and defensive (i.e. protection-
oriented) patent management towards more active and offensive (i.e. exploitation-oriented)
patent management activities. For instance, an OECD publication (Kamiyama et al., 2006,
p. 7) summarizes that a tendency can be observed, from patent applications that secure the
freedom to operate and set barriers to entry towards activities, to patent applications that
generate additional revenues and use patents as a leveraging point in negotiations as part of
business management and strategy. Eventually, this trend may have a self-enhancing effect,
because IP managers are confronted with an increasing patent management intensity within
their competitive environments, which also forces them to intensify their own activities (Blind
et al., 2006, p. 658).16 This indicates how independent patenting dynamics have become over
time and how the strategic dimension of patent management activities is increasingly
detached from R&D management in the narrow sense (Blind et al., 2006, p. 658). To
understand the overall trend of the increasing economic importance and value of patents, the
next section (Section 2.2) examines patents as economic assets in greater detail.
2.2 ASSET CHARACTERISTICS OF PATENTS
To understand patents as economic assets, the following section (Section 2.2.1) examines why
companies patent or not. Subsequently, Section 2.2.2 explains in detail how patents may add
value to a company. As illustrated in Figure 3, the company-internal belongings are relevant
not merely to understand the asset characteristics of patents. To understand the economic
15 For this argument, the authors refer to Arora and Gambardella (2008, p. 364) who argue that increasing R&D
productivity is based on innovations such as the utilization of IT in the R&D process itself as well as the development of the division of labor in innovation processes, with different actors specializing in the innovation process where they have comparative advantage.
16 For this argument, the authors refer to Roberts (1999).
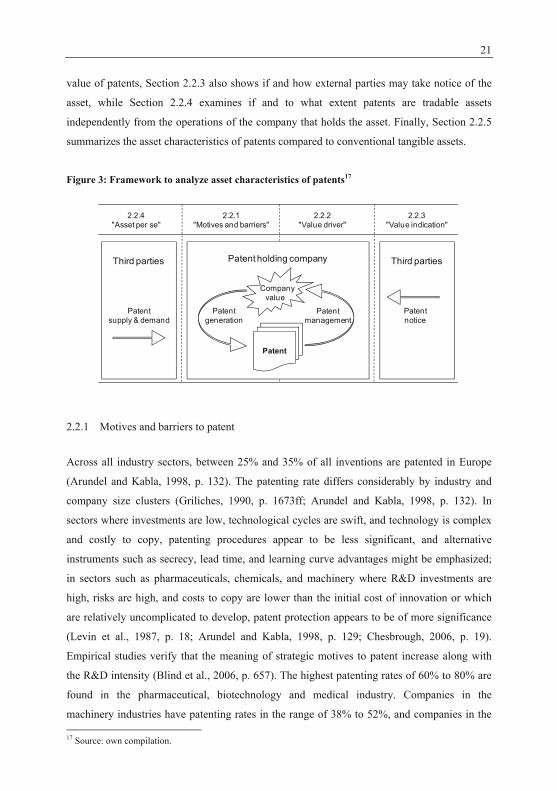
21
value of patents, Section 2.2.3 also shows if and how external parties may take notice of the
asset, while Section 2.2.4 examines if and to what extent patents are tradable assets
independently from the operations of the company that holds the asset. Finally, Section 2.2.5
summarizes the asset characteristics of patents compared to conventional tangible assets.
Figure 3: Framework to analyze asset characteristics of patents17
Third partiesThird parties
2.2.4"Asset per se"
2.2.3"Value indication"
2.2.1"Motives and barriers"
2.2.2"Value driver"
Patent holding company
Patent generation
Patent management
Patent notice
Patent supply & demand
Companyvalue
Patent
2.2.1 Motives and barriers to patent
Across all industry sectors, between 25% and 35% of all inventions are patented in Europe
(Arundel and Kabla, 1998, p. 132). The patenting rate differs considerably by industry and
company size clusters (Griliches, 1990, p. 1673ff; Arundel and Kabla, 1998, p. 132). In
sectors where investments are low, technological cycles are swift, and technology is complex
and costly to copy, patenting procedures appear to be less significant, and alternative
instruments such as secrecy, lead time, and learning curve advantages might be emphasized;
in sectors such as pharmaceuticals, chemicals, and machinery where R&D investments are
high, risks are high, and costs to copy are lower than the initial cost of innovation or which
are relatively uncomplicated to develop, patent protection appears to be of more significance
(Levin et al., 1987, p. 18; Arundel and Kabla, 1998, p. 129; Chesbrough, 2006, p. 19).
Empirical studies verify that the meaning of strategic motives to patent increase along with
the R&D intensity (Blind et al., 2006, p. 657). The highest patenting rates of 60% to 80% are
found in the pharmaceutical, biotechnology and medical industry. Companies in the
machinery industries have patenting rates in the range of 38% to 52%, and companies in the 17 Source: own compilation.
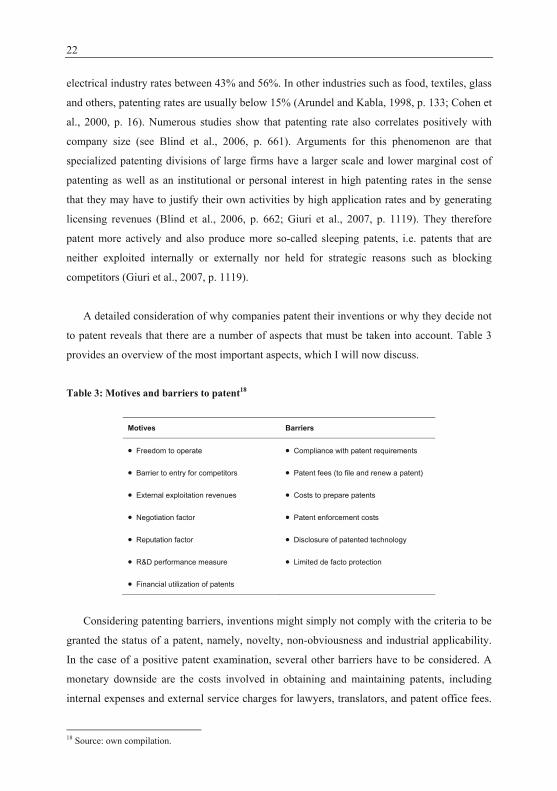
22
electrical industry rates between 43% and 56%. In other industries such as food, textiles, glass
and others, patenting rates are usually below 15% (Arundel and Kabla, 1998, p. 133; Cohen et
al., 2000, p. 16). Numerous studies show that patenting rate also correlates positively with
company size (see Blind et al., 2006, p. 661). Arguments for this phenomenon are that
specialized patenting divisions of large firms have a larger scale and lower marginal cost of
patenting as well as an institutional or personal interest in high patenting rates in the sense
that they may have to justify their own activities by high application rates and by generating
licensing revenues (Blind et al., 2006, p. 662; Giuri et al., 2007, p. 1119). They therefore
patent more actively and also produce more so-called sleeping patents, i.e. patents that are
neither exploited internally or externally nor held for strategic reasons such as blocking
competitors (Giuri et al., 2007, p. 1119).
A detailed consideration of why companies patent their inventions or why they decide not
to patent reveals that there are a number of aspects that must be taken into account. Table 3
provides an overview of the most important aspects, which I will now discuss.
Table 3: Motives and barriers to patent18
Motives Barriers
Freedom to operate Compliance with patent requirements
Barrier to entry for competitors Patent fees (to file and renew a patent)
External exploitation revenues Costs to prepare patents
Negotiation factor Patent enforcement costs
Reputation factor Disclosure of patented technology
R&D performance measure Limited de facto protection
Financial utilization of patents
Considering patenting barriers, inventions might simply not comply with the criteria to be
granted the status of a patent, namely, novelty, non-obviousness and industrial applicability.
In the case of a positive patent examination, several other barriers have to be considered. A
monetary downside are the costs involved in obtaining and maintaining patents, including
internal expenses and external service charges for lawyers, translators, and patent office fees.
18 Source: own compilation.
23
Table 4 provides an overview of average costs involved, which depend strongly on the
specific territorial scope and the time-frame.
Table 4: Overview of patent charges in the triad EU, US, and Japan (2003)19
Patent costs EPO 320
[EUR]
EPO 1321
[EUR]
USPTO
[USD]22
JPO
[JPY]23
Total filing process 20,570 39,675 9,856 5,541
Maintaining costs: 10 years (fees)
Maintaining costs: 20 years (fees)
2,975
22,658
16,597
89,508
2,269
4,701
2,193
11,800
Total costs: 10 years
Total costs: 20 years
23,545
43,228
56,272
129,183
12,125
14,556
7,734
17,341
In addition, the risk and cost of patent enforcement, which have increased considerably in
some countries, must be taken into account. In Europe, the matter is not as critical as in the
US, where the potential indemnification is high and the patent culture is much more litigation
oriented (Chesbrough, 2006, p. 28f).24 Besides monetary expenditures, another substantial
drawback of patenting activities – as demonstrated theoretically and empirically in various
studies – is the disclosure of detailed technical information by the patent office (see Arundel,
2001, p. 612).25 On the one hand, a patent constitutes a legal barrier to entry for competitors.
On the other hand, a patent also constitutes a technical handbook for competitors to copy
innovations or to invent around the patent because, as a rule, patents must be detailed enough
to allow a skilled person to reproduce the invention. Furthermore, the disclosure of technical
details may have signaling effects and analysis of patent databases may enable competitors to
draw conclusions from the innovation strategy and technological capabilities (Schewe, 1993,
p. 355). A further reason to refrain from patenting activities is a limited de facto effectiveness
of patents, as infringements might occur unperceived, infringers might be too powerful to be
stopped, patents might be bypassed technically or legally, or because technological cycles
might be too short (cf. Levin et al., 1987, p. 26). Schewe (1993, p. 355), for example, found in 19 Source: van Pottelsberghe de la Potterie and Francois (2006, p. 14). 20 The three most frequently designated EPC countries are Germany, UK, and France (van Pottelsberghe de la
Potterie and Francois, 2006, p. 14). 21 The 13 EPC countries designated for more than 60% of patent applications are: Germany, UK, France, Italy,
Spain, the Netherlands, Sweden, Switzerland, Belgium, Austria, Denmark, Finland and Ireland (van Pottelsberghe de la Potterie and Francois, 2006, p. 14).
22 Exchange rate: USD 1 = EUR 0.659 (date: 2008/08/08). 23 Exchange rate: JPY 1 = EUR 0.0059 (date: 2008/08/08). 24 Estimates of legal costs in patent litigation in the US range from USD 500,000 to USD 3 million per law suit
(Hall et al., 2004, p. 125) and regularly amount to more than USD 1 million (Chesbrough, 2006, p. 29). 25 In Europe, patent applications and examination results are published 18 months after patent submission.
24
a sample of 88 interviews in Germany's electrical and machinery industry that more than half
of these innovation projects could not be protected from imitation by competitors, although
they were patented. Teece (1986, p. 287) characterizes the ability of an innovator to capture
the profits generated by an innovation according to the "appropriability regime" in which a
firm operates. Appropriability regime refers to the nature of the technology given by its
tacitness and codifiability as well as legal mechanisms to protect innovation by means of
patents, trade secrecy, copyrights, and others (Teece, 1986, p. 287). Teece (1986, p. 287)
notes: "It has long been known that patents do not work in practice as they do in theory.
Rarely, if ever, do patents confer perfect appropriability." A study by Cohen et al. (2000,
p. 14) provides information about the reasons why US companies do not patent with an order
of precedence. They found that the "ease of inventing around", i.e. a limited effectiveness, is
the most cited reason, while detailed disclosure of R&D data and concerns to comply with
patenting requirements also rank high.
Considering motives to patent, the freedom to operate is essential for companies when
infringement accusations might cause severe payments, or when competitors might enforce
the shutdown of production processes or the phasing out of products. To protect one's own
freedom to operate is referred to as defensive blockade, while the intention to block others
from commercializing an innovation although the patent holder itself does not intend to use
the patented technology is referred to as offensive blockade (Blind et al., 2006, p. 657).26 The
power to block competitors is an important instrument to build barriers to entry (cf. Porter,
1979, p. 37) or to externally exploit patents and to generate additional revenues by selling or
licensing the patented technology. Pursuant to this thesis' topic, patents might also be utilized
for balancing and external fund-raising purposes. Patents can also be used as a R&D output
unit and performance measure. The measure can be used internally to judge the performance
of R&D departments, as an incentive for inventors, and to externally communicate and
emphasize the innovative strength (Blind et al., 2006, p. 669). According to Cohen et al.
(2000, p. 22 ff) the motives for patenting differ with industry sectors. They distinguish
between so-called "complex" product industries characterized by a large number of patents
per commercializable unit (e.g., the IT sector) and "discrete" product industries characterized
by a small number of patents per commercializable unit (e.g., the chemicals sector). While
discrete product industries tend to block competitors offensively with their patents, complex
product industries tend to build a negotiation mass with their patent portfolios. Thereby, 26 The authors refer to Rahn (1994), Kingston (2001) as well as Arundel and Patel (2003) for the definition of
these two concepts.
25
patents become bargaining chips and a kind of trading currency that provides companies in
complex product industries with access to important technological state-of-the-art
developments (Cohen et al., 2000, p. 25; Kingston, 2001, p. 408; Blind et al., 2006, p. 658). In
contrast to previous studies, Blind et al. (2006, p. 671) did not find a clear distinction between
complex and discrete industries and suggest that today all industries are characterized by
fairly complex technologies.
The order of precedence of reasons why companies use patents can be summarized in
terms of three layers of significance that can be observed in the results of most empirical
studies. The classical motives of protection from imitation as well as defensive and offensive
blockade are of primary significance (Cohen et al., 2000, p. 17 ff). Of secondary importance
are the motives to use patents as negotiation and reputation factors. The third layer is made up
all other motives.27
Reviewing this paragraph, it must be noted that between 25% and 35% of all inventions
are patented in Europe, while the patenting rate differs considerably by industry and company
size clusters. The highest patenting rates are observed in industries with a high R&D intensity
and easy-to-copy products, such as the pharmaceutical, machinery, and electrical industries.
Accordingly, various studies show that protection from imitation and freedom to operate are
the most important reasons for companies to patent. Of secondary importance are motives
such as external exploitation of patents, the use of patents as negotiation and reputation
factors, or other reasons (see above). The most important reasons why companies do not
patent are limited effectiveness as well as the detailed disclosure of innovations.
Unfortunately, most empirical studies do not include the concept and utilization of patents
as financial assets. For a long time, this aspect appeared to be disregarded in theory and
practice. To my knowledge, a study by Blind et al. (2006, p. 662) was the first German study
on patenting activities that included some financial aspects such as the motive to increase the
company value and the motive to improve access to the capital market. The results of the
study demonstrate that 51% of the responding companies ranked the increase of the company
value of high or very high importance, while 26% ranked access to the capital market as of
high or very high importance. These results lead me to a more comprehensive examination of
27 Blind et al. (2006) found a distinctively high ranking of the motive to improve technological image in the
German business environment, indicating that the reputation factor is equally important as blockade for companies in Germany.
26
the questions as to how patents can add value to a company, in the following section (Section
2.2.2) and as to how patents can improve access to the capital market (Section 2.2.3).
2.2.2 Patents as value drivers
With the structural change from an industrial to a knowledge-based economy, intangible
assets have become essential for productivity and economic growth (see, e.g., Lev, 2003, p. 2;
Teece, 2005, p. 27; Kamiyama et al., 2006, p. 6). Firms increasingly and actively use
intellectual property assets, especially patents, to create company value (Schmidt, 2002,
p. 296).
The potentially strong impact of patents can be shown by anecdotal evidence from the
pharmaceutical industry, where product turnovers frequently decrease by 80% after patent
termination (Psotta, 2008, p. 22). A strong interrelationship of patents and company
performance measures is demonstrated by rich empirical evidence in all patent-intensive
industries. Ernst (2001, p. 146f) provides an overview of empirical studies on the correlation
between patents and corporate performance at the company level. Referring to his overview,
Scherer (1965) finds a positive relationship between patents, sales growth, and profits via
sales growth with a sample of 365 corporations in the US Fortune 500 index; Comanor and
Scherer (1969, p. 392) find a positive relationship between patent applications and sales with
a sample of 57 pharmaceutical companies; Narin et al. (1987, p. 145) find a strongly positive
relationship between cites per patent and an increase in company profits and sales with a
sample of 17 US-based pharmaceutical firms; and Ernst (1995, p. 225) finds, with a sample of
50 German companies in the machinery industry, that patent quality and a systematic patent
strategy are positively related to economic performance. Bloom and van Reenen (2000, p. 26)
show, with a database of over 200 major British firms, that patents have an economically and
statistically significant impact on both firm-level productivity and market value. In short, it
can be stated that effective patent management and the quality of patent portfolios positively
influence company success (Ernst, 1995, p. 225; Ernst, 2001, p. 155; Ernst and Omland, 2003,
p. 110). Several studies have also analyzed the correlation of patent information and success
variables in publicly tradable corporations. Griliches (1981, p. 183) finds a positive
correlation between the number of patents and the market value of a corporation. Pakes (1984,
p. 256) finds a highly significant correlation between the stock market rate of return and
changes in patent applications, but questions the causality of the effect. Chan et al. (2001,
27
p. 2454) finds with a data sample of corporations listed at the US stock market between 1975
to 1995, that firms with a high ratio of R&D spending to market value of equity demonstrate a
higher rate of return.28 Accordingly, Bittelmeyer (2007, p. 369f) shows, on the basis of data
on the German stock exchange between 1996 to 2002, that established companies listed on
CDAX29 with many patent filings achieved a significantly higher return, compared to
companies without patent filings. Furthermore, she shows that the number of patent
applications positively influences the probability of IPOs' survival (Bittelmeyer, 2007,
p. 270).
I will now introduce a systematic approach to analyze the various value driving
mechanisms of patents. The framework of this thesis to analyze the impact of patents on value
drivers is based on methods to calculate company value. There are a number of valuation
methods that can be categorized into three different valuation approaches: the relative
valuation approach, the discounted cash flow valuation approach, and the option pricing
model (Damodaran, 2006, p. 13f). In relative valuation, the value is derived from the value of
comparable objects. For company valuation, multiples such as earnings, cash flows, book
value, or sales are usually taken as relative measures (Damodaran, 2006, p. 13). The
discounted cash flow (DCF) valuation approach is based on the assumption that the value of a
company is equal to the value of its future cash flows discounted by the time value of money
and the riskiness of those cash flows (Stowell, 2010, p. 81). The option pricing model is a
relatively new approach and, as it has been developed for the calculation of contingent claims
or assets with option-like characteristics, it therefore features a high degree of flexibility and
allows taking into account learning processes (Damodaran, 2006, p. 25ff). While the relative
valuation approach and the discounted cash flow valuation approach are frequently applied in
practice, the option pricing model is currently still a fairly academic exercise. To analyze the
impact of patents on the company value generation process, I concentrate on the relative
valuation approach and the discounted cash flow method (as shown in Figure 4).
Considering the relative valuation approach (CompanyValueMultiple), a financial key figure
of a company (Financial Ratiot) is multiplied by a factor (Multiples) based on comparative
industry data. The applied financial key figure of the company is either assets-based or
28 The result appears to be equivalent for the relationship of patents and excess rates of return because, according
to Griliches (1990, p. 1673), "there is quite a strong relationship between R&D and the number of patents received."
29 The CDAX (Composite DAX) comprises all stocks registered in the General Standard and Prime Standard at the Frankfurt Stock Exchange.
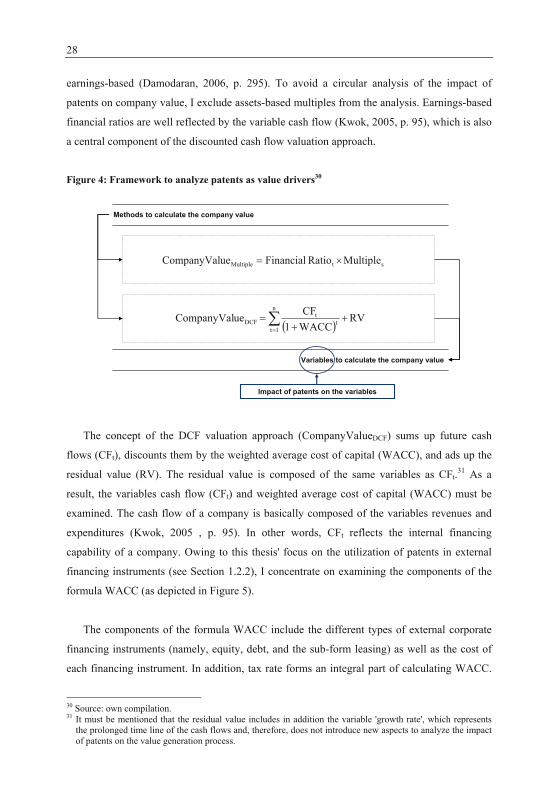
28
earnings-based (Damodaran, 2006, p. 295). To avoid a circular analysis of the impact of
patents on company value, I exclude assets-based multiples from the analysis. Earnings-based
financial ratios are well reflected by the variable cash flow (Kwok, 2005, p. 95), which is also
a central component of the discounted cash flow valuation approach.
Figure 4: Framework to analyze patents as value drivers30
Methods to calculate the company value
Variables to calculate the company value
Impact of patents on the variables
n
1tt
tDCF RV
WACC1CFueCompanyVal
stMultiple MultipleRatioFinancialueCompanyVal
The concept of the DCF valuation approach (CompanyValueDCF) sums up future cash
flows (CFt), discounts them by the weighted average cost of capital (WACC), and ads up the
residual value (RV). The residual value is composed of the same variables as CFt.31 As a
result, the variables cash flow (CFt) and weighted average cost of capital (WACC) must be
examined. The cash flow of a company is basically composed of the variables revenues and
expenditures (Kwok, 2005 , p. 95). In other words, CFt reflects the internal financing
capability of a company. Owing to this thesis' focus on the utilization of patents in external
financing instruments (see Section 1.2.2), I concentrate on examining the components of the
formula WACC (as depicted in Figure 5).
The components of the formula WACC include the different types of external corporate
financing instruments (namely, equity, debt, and the sub-form leasing) as well as the cost of
each financing instrument. In addition, tax rate forms an integral part of calculating WACC.
30 Source: own compilation. 31 It must be mentioned that the residual value includes in addition the variable 'growth rate', which represents
the prolonged time line of the cash flows and, therefore, does not introduce new aspects to analyze the impact of patents on the value generation process.
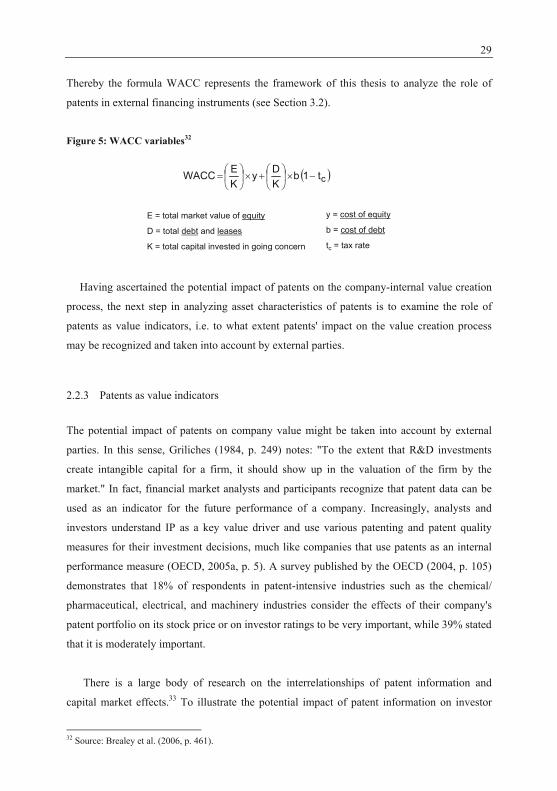
29
Thereby the formula WACC represents the framework of this thesis to analyze the role of
patents in external financing instruments (see Section 3.2).
Figure 5: WACC variables32
ct1bKDy
KEWACC
E = total market value of equity
D = total debt and leases
K = total capital invested in going concern
y = cost of equity
b = cost of debt
tc = tax rate
Having ascertained the potential impact of patents on the company-internal value creation
process, the next step in analyzing asset characteristics of patents is to examine the role of
patents as value indicators, i.e. to what extent patents' impact on the value creation process
may be recognized and taken into account by external parties.
2.2.3 Patents as value indicators
The potential impact of patents on company value might be taken into account by external
parties. In this sense, Griliches (1984, p. 249) notes: "To the extent that R&D investments
create intangible capital for a firm, it should show up in the valuation of the firm by the
market." In fact, financial market analysts and participants recognize that patent data can be
used as an indicator for the future performance of a company. Increasingly, analysts and
investors understand IP as a key value driver and use various patenting and patent quality
measures for their investment decisions, much like companies that use patents as an internal
performance measure (OECD, 2005a, p. 5). A survey published by the OECD (2004, p. 105)
demonstrates that 18% of respondents in patent-intensive industries such as the chemical/
pharmaceutical, electrical, and machinery industries consider the effects of their company's
patent portfolio on its stock price or on investor ratings to be very important, while 39% stated
that it is moderately important.
There is a large body of research on the interrelationships of patent information and
capital market effects.33 To illustrate the potential impact of patent information on investor
32 Source: Brealey et al. (2006, p. 461).
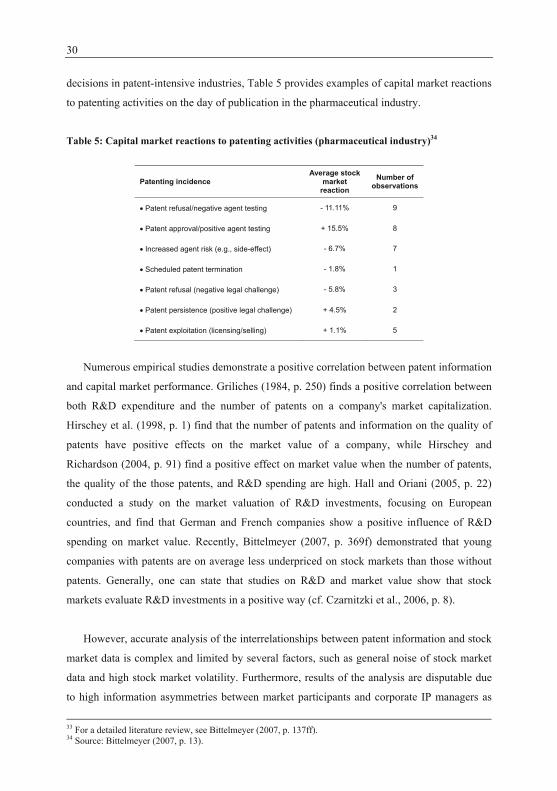
30
decisions in patent-intensive industries, Table 5 provides examples of capital market reactions
to patenting activities on the day of publication in the pharmaceutical industry.
Table 5: Capital market reactions to patenting activities (pharmaceutical industry)34
Patenting incidence Average stock
market reaction
Number of observations
Patent refusal/negative agent testing - 11.11% 9
Patent approval/positive agent testing + 15.5% 8
Increased agent risk (e.g., side-effect) - 6.7% 7
Scheduled patent termination - 1.8% 1
Patent refusal (negative legal challenge) - 5.8% 3
Patent persistence (positive legal challenge) + 4.5% 2
Patent exploitation (licensing/selling) + 1.1% 5
Numerous empirical studies demonstrate a positive correlation between patent information
and capital market performance. Griliches (1984, p. 250) finds a positive correlation between
both R&D expenditure and the number of patents on a company's market capitalization.
Hirschey et al. (1998, p. 1) find that the number of patents and information on the quality of
patents have positive effects on the market value of a company, while Hirschey and
Richardson (2004, p. 91) find a positive effect on market value when the number of patents,
the quality of the those patents, and R&D spending are high. Hall and Oriani (2005, p. 22)
conducted a study on the market valuation of R&D investments, focusing on European
countries, and find that German and French companies show a positive influence of R&D
spending on market value. Recently, Bittelmeyer (2007, p. 369f) demonstrated that young
companies with patents are on average less underpriced on stock markets than those without
patents. Generally, one can state that studies on R&D and market value show that stock
markets evaluate R&D investments in a positive way (cf. Czarnitzki et al., 2006, p. 8).
However, accurate analysis of the interrelationships between patent information and stock
market data is complex and limited by several factors, such as general noise of stock market
data and high stock market volatility. Furthermore, results of the analysis are disputable due
to high information asymmetries between market participants and corporate IP managers as
33 For a detailed literature review, see Bittelmeyer (2007, p. 137ff). 34 Source: Bittelmeyer (2007, p. 13).
31
well as the indirect, lagged effect of patent activities on corporate performance measures
(Ernst, 2001, p. 148). It is difficult to measure and assess the de facto influence of patents on
company value, because productivity increase does not manifest immediately (Bloom and
Reenen, 2000, p. 26). Ernst (2001, p. 143) demonstrates that patent applications lead to sales
increases with a time lag of two to three years after the priority year. Further, difficulties in
applying patents as value indicators are based on the fact that the economic values of single
patents vary substantially. Unfortunately, the distribution of important patents is highly
skewed by having a few valuable patents and "a great many blanks" (see, e.g., Giuri et al.,
2007, p. 1211). The question, therefore, is whether patent quality measures can and should be
taken into account in order to improve the utilization of patents as value indicators. Several
studies have analyzed whether the quality measure patent citations improves the value
indication. Narin et al. (1987, p. 145) find, with a sample of 17 US pharmaceutical companies,
that patent citations are strongly related to increases in company profits and sales. As noted
above, Hirschey et al. (1998, p. 1) and Richardson (2004, p. 91) also find that information on
patent quality is positively related to the market value of a company. In short, Hirschey and
Richardson (2004, p. 91) note that patent quality measures in the form of patent citations may
in fact help investors analyze the future profit potential of a corporation. Accordingly, Hall et
al. (2005, p. 31) find a strong correlation between patent citations and the market value of
companies, and that patent citations contain significant information in addition to R&D and
simple patent counts. They demonstrate that if a patent portfolio receives on average one
additional citation per patent, the market value of the company would increase by 3% (Hall et
al., 2005, p. 32). The perception that patents can be used as value indicators has also been
proved in a study by Czarnitzki and Kraft (2002, p. 6), who explored the effect of the patent
stock, R&D intensity, and the share of sales of newly developed products35 on the credit
rating of the largest rating agency in Germany, Creditreform, and found that all three
measures have a significant impact on credit rating.36
In fact, patent information is applied in practice by issuers of stock market funds to select
companies for their portfolios (see Table 24 for a list of several funds made up by means of
patent information). The kind of patent information they use to select companies and the
impact of the data in the selection process differ. For instance, the fund Allianz-dit Global
35 The authors define R&D intensity as R&D expenditure divided by total sales volume, and newly developed
products as products younger than three years (Czarnitzki and Kraft, 2002, p. 3). 36 It must be noted that the impact is not linear, but inversely U-shaped, implying that both too low and too high
innovation indices negatively influence the rating result. The decrease can be explained by the high risks involved in R&D investments (Czarnitzki and Kraft, 2002, p. 6).
32
InnovationTrends takes into account the number of patents as one selection criterion, besides
total R&D expenses, and general key figures such as the market share of a company, among
others (Narat, 2007, p. 39). Ocean Tomo, an IP merchant bank in the US, is building patent-
based indices and offers exchange traded funds (ETFs)37, which are strongly based on patent
indicators, on US stock exchanges (Narat, 2007, p. 40). The companies in the index are
ranked by patent-to-book value, which is based on sophisticated patent rating systems.
Unfortunately, the patent valuation method is proprietary and not published by Ocean Tomo
in any detail. According to company representatives, it includes more than 50 factors related
to patent claims, patent renewal data, business sector affiliation, and other patent value
indicators (Beales, 2006, p. 1).
In short, existing literature provides clear evidence that investors use patent information as
indicators to assess the value of companies. Thereby, information about the number of patents
in and quality measures of the patent portfolio in the form of citations appear to be useful
indicators of company value. The following section examines the extent to which patents can
be considered 'assets per se', i.e. independent from specific companies' business operations.
2.2.4 Patents as 'assets per se'
An asset can be defined as "any object, tangible or intangible, that is of value to its possessor"
(Smullen and Hand, 2005, p. 19). The range of factors that might be of value for patent
holders is reflected by the range of motives to patent (see Section 2.2.1). The long-established
understanding of patent function and patent value is basically freedom to operate and barriers
to entry for competitors with regard to own operations. Within the last decades, patent
management activities have become geared towards more active external acquisition and
exploitation of IP assets, besides being applied purely as legal assets inside the company
(see, e.g., Chesbrough, 2006, p. 25; Kamiyama et al., 2006, p. 7). This trend is motivated by
the quest to generate additional revenues with IP assets and is the result of more recent
innovation management approaches that concentrate not only on company-internal
capabilities to develop new technologies and products, but purposely utilize external R&D
sources (for a detailed discussion, see Section 2.4.1). As part of these trends, IP assets are
increasingly traded as economic goods and are increasingly perceived as economic assets with
commercial value. 37 An ETF is a fund based on the development of an index.
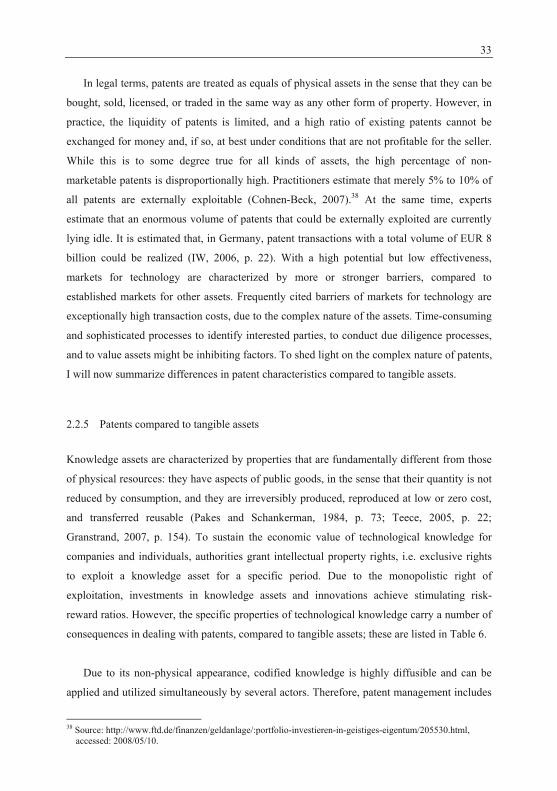
33
In legal terms, patents are treated as equals of physical assets in the sense that they can be
bought, sold, licensed, or traded in the same way as any other form of property. However, in
practice, the liquidity of patents is limited, and a high ratio of existing patents cannot be
exchanged for money and, if so, at best under conditions that are not profitable for the seller.
While this is to some degree true for all kinds of assets, the high percentage of non-
marketable patents is disproportionally high. Practitioners estimate that merely 5% to 10% of
all patents are externally exploitable (Cohnen-Beck, 2007).38 At the same time, experts
estimate that an enormous volume of patents that could be externally exploited are currently
lying idle. It is estimated that, in Germany, patent transactions with a total volume of EUR 8
billion could be realized (IW, 2006, p. 22). With a high potential but low effectiveness,
markets for technology are characterized by more or stronger barriers, compared to
established markets for other assets. Frequently cited barriers of markets for technology are
exceptionally high transaction costs, due to the complex nature of the assets. Time-consuming
and sophisticated processes to identify interested parties, to conduct due diligence processes,
and to value assets might be inhibiting factors. To shed light on the complex nature of patents,
I will now summarize differences in patent characteristics compared to tangible assets.
2.2.5 Patents compared to tangible assets
Knowledge assets are characterized by properties that are fundamentally different from those
of physical resources: they have aspects of public goods, in the sense that their quantity is not
reduced by consumption, and they are irreversibly produced, reproduced at low or zero cost,
and transferred reusable (Pakes and Schankerman, 1984, p. 73; Teece, 2005, p. 22;
Granstrand, 2007, p. 154). To sustain the economic value of technological knowledge for
companies and individuals, authorities grant intellectual property rights, i.e. exclusive rights
to exploit a knowledge asset for a specific period. Due to the monopolistic right of
exploitation, investments in knowledge assets and innovations achieve stimulating risk-
reward ratios. However, the specific properties of technological knowledge carry a number of
consequences in dealing with patents, compared to tangible assets; these are listed in Table 6.
Due to its non-physical appearance, codified knowledge is highly diffusible and can be
applied and utilized simultaneously by several actors. Therefore, patent management includes
38 Source: http://www.ftd.de/finanzen/geldanlage/:portfolio-investieren-in-geistiges-eigentum/205530.html,
accessed: 2008/05/10.
34
decisions about which patent is useful and needed, who may or may not be allowed to use the
patent, how to monitor usage, and how to handle irregularities and infringements. Thereby,
the disclosure of patent attributes is difficult and should be done by professionals such as
patent lawyers and engineers for decision making processes, prior to key decisions.
Table 6: Patents compared to tangible assets39
Characteristic Tangible asset Patents
Appearance physical non-physical
Utilization (per item) single deployment diffusible/simultaneous deployment
Disclosure of characteristics relatively easy relatively difficult
Exploitation unit single item single item or compound of items
Legal validity definite tentative and terminated
Boundaries clearly defined diffuse and often disputable
Value steady and persistent volatile and terminated
Specificity relatively low relatively high
Uncertainty/complexity relatively low relatively high
Tradability relatively high relatively low
The technical dimension involves not only the complex and sophisticated handling of the
asset, but also a higher degree of uncertainty, compared to tangible assets. Patents may be
rapidly rendered obsolete by the development of alternative or new technologies, causing a
sudden loss of asset value. Furthermore, the legal dimension contributes to the complex nature
of patents. While the ownership of tangible assets is relatively easy to define, and the
boundaries of the property can be clearly delineated, the ownership and boundaries of patents
are frequently diffuse and disputable. Furthermore, the legal validity of patents is terminated
and tentative. After a patent application is submitted, it usually takes several years before the
auditing process of the patent office results in a patent filing or refusal.40 Since the rules of
patent examination and the rigidity of their execution vary significantly across national patent
authorities and also to some extent over time, patent quality varies across countries and over
39 Source: cf. Teece (1998, p. 68); own compilation. 40 The average time taken by the EPO to grant a patent was 44.3 months in 2006. 56% of examined applications
were granted, 17% of the applications were abandoned by the applicant after the search phase and 27% were withdrawn by the applicant or rejected by the office during the examination phase (EPO, 2006, p. 22).

35
time (Griliches, 1990, p. 1663). In the case of a successful filing, patent protection is valid
retroactively from the date of application for a maximum period of 20 years.41 But there is a
permanent risk of legal challenge during the entire life-span.42 The legal uncertainty is based
on § 21 PatG, which holds that patents can be challenged by third parties and cancelled if it so
happens that the premises of granting the patent have not been met. Further, legal
uncertainties for third parties arise from the circumstance that entries in the patent register do
not guarantee information about actual ownership and do not disclose other contractual
commitments. These include, for instance, silent encumbrance such as mortgages or licensing
contracts43 and should be checked in a due diligence procedure (Klawitter, 2008, p. 1214ff).
Another difficulty is the fact that patents are frequently interwoven with other patents and IP
assets (Hall, 2003, p. 31). When a product or market-exploitable unit is covered by a group of
several intellectual property rights, it may be difficult to separate patents and to exploit them
as single assets. This is typically a problem in so-called complex product industries with a
large number of patents per market-exploitable unit, for example, in the IT industry, while it
is of lesser importance in discrete product industries with a low number of patents per market-
exploitable innovation, for example, in the pharmaceutical sector. To obtain a picture of these
interrelationships in the electrical industry, Philips, for example, holds a patent portfolio of
roughly 80,000 patents covering 16,000 inventions.44 Often, these patents are characterized by
high specificity and cannot be redeployed to an alternative use without a significant reduction
in the asset value, compared to the original application within the firm (Douma and
Schreuder, 2008, p. 151).
Based on technical and legal uncertainties and the complex managerial handling of
patents, the tradability of patents is relatively low compared to tangible assets. Since the risks
and uncertainties of patents primarily determine their value and valuability, Section 2.3
examines the 'value question' of patents in detail. Section 2.4 examines the aspects that
influence the tradability of and the indications for the actual liquidity of patents, referred to as
the 'liquidity question', in detail.
41 Prolongations can be applied exceptionally for pharmaceutical patents when testing and approval procedures
have been exceedingly long (Granstrand, 1999, p. 160). 42 The persistence of a legal challenge increases the value in the first instance, because the legal quality of the
patent is proven. However, an appeal is completely independent from previous legal actions and may result in a revocation.
43 The transfer of patents does not automatically include the transfer of a licensing contract. Licensing revenues are assigned to the original patent owner unless otherwise explicitly agreed (Klawitter and Hombrecher, 2004, p. 1215).
44 Source: https://www.ip.philips.com/download_attachment/5712/Int_prpoerty_within_ph.pps -, accessed: 2009/05/26.
36
2.3 THE VALUE QUESTION
Alan Greenspan (2003), the chairman of the Federal Reserve of the United States of America
from 1987 to 2006, noted that, "in recent decades […] the fraction of the total output of our
economy that is essentially conceptual rather than physical has been rising. This trend has, of
necessity, shifted the emphasis in asset valuation from physical property to intellectual
property and to the legal rights that inhere in the latter."45
The economic value of a patent derives from the various motives and barriers to patent, as
described in Section 2.2.1. According to Granstrand (1999, p. 73), "the major source of value
[of patents], as traditionally conceived, is through deterred or deferred imitation and
competition." The economic value of all patents filed in OECD countries is estimated at
EUR 100 billion per year (Wurzer and Müller, 2007).46 The aggregate value of patents is
around 1% of the GDP in the EU8 countries with Germany having the highest aggregate value
of patents of 2.1% of the GDP (Gambardella et al., 2006b, p. 6f).47 A prerequisite for market
participants to leverage this economic value financially is the ability to assess the value of the
assets efficiently and effectively. However, the valuation of single patents is difficult and a
lack of established valuation methods is a frequently cited barrier to leverage patents
financially. The following section (Section 2.3.1) provides a detailed understanding of the
value distribution of patents, while Section 2.3.2 provides an overview of the different
approaches to patent valuation and their application in practice.
2.3.1 The value distribution of patents
As a rule of thumb, 10% of the patents in a patent portfolio account for 80% to 90% of the
portfolio's value (Lev, 2001, p. 38). This value distribution implies that "patents are like
lotteries in which there are a few prizes and a great many blanks" (Pitkethly, 1997, p. 43).48 A
deep research base provides a number of studies on the value and value distribution of
patents. A very early and extensive survey was published by Rossman and Sanders (1957) in
the US; at that time, the mean value of applied patents was estimated at USD 577,000 per
45 Source: http://www.federalreserve.gov/BoardDocs/speeches/2003/20030404/default.htm, accessed: 2009/06/24. 46 Source: http://www.nzz.ch/nachrichten/startseite/patente_steigern_den_unternehmenswert_1.516697.html,
accessed: 2009/05/22. 47 To highlight the size of patents' aggregate value, 1% of GDP equals roughly the size of the software industry
in the EU8 countries (Gambardella et al., 2006b, p. 6). 48 The author refers to The Economist (1851).

37
patent. The same calculation with the total number of patents (including no gain, loss, and
not-yet-used patents) decreased the mean value to USD 112,000 per patent, indicating a
skewed distribution of patent values towards the side of low value and a long tale into the
high value side.49 This picture was later confirmed by Pakes and Schankerman (1984, p. 86)
as well as Lanjouw et al. (1998, p. 405) with a research approach that examines the value
distribution of patents based on a renewal model, i.e. the decision of patent owners to pay a
renewal fee, or not. The most recent and most extensive study on the economic use and value
of European patents, which was conducted on behalf of the European Commission, the PatVal
survey, was published by Giuri et al. (2007) together with 20 senior researchers throughout
Europe.50 The PatVal survey was conducted in 2003 and 2004 and comprises a sample of
9,017 patents granted by the EPO between 1993 and 1997. The researchers asked inventors of
patents to estimate the minimum price at which the owner of the patent would have sold the
patent on the day the patent was granted.51
Figure 6: The value distribution of patents (PatVal survey)52
0,0%
5,0%
10,0%
15,0%
20,0%
25,0%
<0.03 0.03-0.10.1-0.3 0.3-1 1-3 3-10 10-30 30-100 100-300 >300
Shar
e of
pat
ents
Patent value [Mio €]
PatVal sample (n=7.752)
The questionnaire ranked the present value of the patents in 1 of 10 value classes, ranging
from less than EUR 30,000 to more than EUR 300 million.53 The results of the study again
confirm the highly skewed value distribution, as illustrated in Figure 6.54Approximately 8%
of the patents in the PatVal sample are estimated to be worth more than EUR 10 million.
Approximately 24% of the patents are estimated to be worth between EUR 1 million and 10
million, and a share of approximately 68% falls in the left sector of the distribution, with
estimates lower than EUR 1 million. Due to the highly skewed value distribution, it is difficult 49 The cited study results derive from a publication by Griliches (1998, p. 309). 50 Countries included in the study are France, Germany, Italy, Spain, the Netherlands, and the UK. 51 Respondents were asked to assume that, at the time of the imaginary sale, the same information would have
been available as when the question was asked (Giuri et al., 2007, p. 1120). 52 Source: transcribed from Giuri et al. (2007, p. 1121). 53 The intervals were chosen by the authors of the study to construct a logarithm scale of the variable. 54 Since the graph has a logarithm scale of the value variable, the actual distribution appears a lot more skewed
than Figure 6 suggests.
38
to provide appropriate statistical measures of location and dispersion. Gambardella et al.
(2006b, p. 6) employed PatVal data to estimate a median value of EUR 300,000 per patent.
PatVal also reveals slight differences in the value distribution across industry sectors, with a
higher value distribution for the chemical/pharmaceutical industry compared to the machinery
and electrical industries. With fewer patents below the EUR 1 million line (58% vs. 70%) and
more patents above the EUR 10 million line (12% vs. 7%), the value of patents in the
chemical/pharmaceutical industry is frequently above the value of patents in the machinery
and electrical industries (Giuri et al., 2007, p. 1121).
Having verified that the value of single patents is potentially high, the question is whether
there are valuation methods that can be applied efficiently and effectively as a prerequisite to
leverage these assets financially. The following section (Section 2.3.2) provides an overview
of existing patent valuation approaches.
2.3.2 How to assess the value of patents
In principle, value is an asset's worth to a buyer and seller, while price is an expression of
perceived value (Davies, 2004, p. 31). However, perceived value is subjective and depends on
individual buyer and seller appraisals and preferences. Monetary valuation methods that aim
to determine a price for highly differentiated and diversified assets such as patents are
therefore inaccurate (Arora et al., 2001a, p. 431). Particularly patents and their purpose of use
are highly diverse and may differ substantially among both buyers and sellers. As a result, any
value measure of patents is likely to be imperfect. Theoretically, from a management
perspective, the value of a patent is equal to the difference between own revenues associated
with the exclusive right of exploitation and the loss of revenues induced by a competitor
holding the patent. Practically, the asset value of patents is complex and complicated to
determine. In the following, to review existing patent valuation methods, they are categorized
into two approaches: quantitative valuation approaches, which provide monetary results, and
qualitative (as well as econometric) approaches, which provide patent classifications.
Qualitative valuation approaches are used to rate and score patents, with the aim of
roughly classifying patents. One qualitative approach is to rank patents by comparing them.
The ranking procedure may be based on expert appraisal, or on objective measures such as
market size, scope of protection, and development stage (Davies, 2004, p. 33). Another
39
qualitative approach, which has been discussed thoroughly in academic studies in the field of
patent valuation, is the econometric, indicator-based valuation approach. This approach does
not use comparison with other patents, but a range of publicly available indicators, mostly
derived from the patent document. Thereby the value of a patent is indicated by the
relationship of a measure (i.e. the indicator) to effects on company performance or company
value. These can be single indicators or a combination of various indicators. A broad range of
indicators has already been analyzed (see, e.g. Reitzig, 2002b, p. 88ff), and a summary of
most discussed indicators and respective studies is provided by Giuri et al. (2007, p. 1120);
these include the number of forward and backward citations, period of registration, patent
family size, and the incidence of legal challenges and their persistence. The notion of using
citations is common in social science (Reitzig, 2002a, p. 7); concerning patents, Albert et al.
(1991, p. 258) found, in a study conducted with the help of expert appraisals at Eastman
Kodak, that highly cited patents are of greater de facto technical importance than infrequently
cited patents. Accordingly, Hall et al. (2005, p. 16) found a positive relationship between
patent citations as a measure of the importance of the patents and stock market valuation.
These literature findings demonstrate that indicator-based patent valuation can be applied to
classify patents qualitatively, but due to the complexity and diversity of this valuation
approach, with its many different indicators and appraisals of their validity, it is referred to
respective studies' findings.
Quantitative valuation methods seek to calculate the monetary value of patents. There are
basically four different quantitative valuation approaches: the cost approach, the market
approach, the income approach, and option pricing theory. First, the cost approach values
patents by accumulating the costs to reproduce or replace an asset, based on either internal
development or external acquisition. Despite being relatively simple and inexpensive to use,
the cost approach is not widely used for patent valuation, because it does not take into account
the future profit potential of the products and market-exploitable units covered by the patent
(Davies, 2004, p. 31; Kamiyama et al., 2006, p. 26). As a result, the cost method frequently
overrates valueless patents and underrates valuable patents and is, therefore, rarely suitable
for financial purposes, besides in historical cost-based accounting systems and taxation
methods (Pitkethly, 1999, p. 6). In certain cases, it might also be useful for the assessment of
licensing deals by comparing the licensing costs of the patent with the development costs of
replacing the patent. Second, the market approach values patents based on the comparison
with transactions of similar patents. This approach requires an active market for technology
40
with a sufficient number of comparable asset transactions as well as publicly available
information about the terms of transaction (Davies, 2004, p. 31). Unfortunately, there is a lack
of comparable transactions to reliably apply this method in practice, since active markets for
tangible assets do not exist to the same extent for IP assets (OECD, 2005a, p. 17). If the
transaction rate in markets for technology increases and if more IP transaction data were
publicly available, for example, due to an increase of transparent transaction models such as
IP auctions (see Sections 2.4.2 and 2.4.3), the market approach might also apply to a greater
extent. Third, the income approach is based on the discounted cash flow (DCF) valuation
(see Section 2.2.2) and relates the patent value to the present value of expected future cash
flow that can be ascribed to the patent. Generally, an important but uncertain factor of the
DCF method is determining an appropriate discount rate to measure the compensation of the
owner for his investment, which is based on opportunity costs and the risks involved in the
investment including inflation, liquidity, real interest rates, and measures of relative risk
(Smith and Parr, 2000, p. 242). In the case of patents, the discount rate is driven particularly
by the patent’s specific technological, legal, and managerial risk factors. The main
disadvantage of this approach is therefore that it requires much information, including a high
level of uncertainty due to the many assumptions that must be made. Fourth, the option
pricing theory was primarily developed to price financial options, which can be defined as "a
right but not an obligation, at or before some specified time, to purchase or sell an underlying
asset whose price is subject to some form of random variation" (Pitkethly, 1997, p. 10).
Financially speaking, "a patent is the right to a future series of cash flows from an underlying
asset that may or may not be commercialized profitable" (Arrow, 2002, p. 381). In this sense,
options and patents share key financial characteristics, which allow the option pricing model
to be applied to patents too. Even the value distribution of call options and patents is largely
similar: it clusters around zero, shows a vast majority of assets with little value, and a small
percentage of assets with a high payoff (Edwards, 2002, p. 3). The main disadvantage of
option valuation, which impedes broad application, is the high effort due to the complexity of
and the amount of information needed to conduct the method (Davies, 2004, p. 34).
The utility of qualitative and quantitative approaches varies according to the purpose of
valuation. In the financial context, both approaches might be suitable. In case of equity
transactions the value of a patent may be assessed in qualitative terms while, for debt
financing, creditors require quantitative monetary patent value measures. Consequently,
creditors may apply the cost, income, or market approach, while shareholders may rely on

41
qualitative valuation approaches to assess a patent portfolio's value. However, due to
complexity and limited reliability, the application of any approach is neither widespread nor
consistent in the financial context. In an article in the Harvard Business Review, Rivette and
Kline (2000, p. 11) draw the following picture concerning the frequency and intensity of
patent valuations in the financial context: "Most investment banks have teams of accountants,
tax advisers, management consultants, and regulatory affair experts to structure their deals to
a company's greatest advantage. But one would be hard-pressed to find a major investment
bank that employs even one individual with experience in evaluating patent portfolios […]
due diligence regarding patent assets is usually more myth than reality." From an economic
perspective, Gambardella et al. (2006b, p. 4) note that the monetary value of patents and the
estimated total value of patenting by a country "is an area where evaluation and measurement
are at a very crude stage compared to other areas where economic indicators are widely
available (e.g. exports and imports or R&D investments)." Accordingly, the OECD (2005a,
p. 3) concludes that further effort is needed to improve prevailing valuation practices, since
difficulties or inconsistencies in valuation impede the financial utilization of patents.
2.4 THE LIQUIDITY QUESTION
There is no operational, generally accepted measure of the liquidity of an asset (Schwartz and
Peng, 2006, p. 630). The liquidity of a market refers to price ranges, volumes, and the
market's responsiveness, i.e. the ability of market actors to trade a unit of an asset at
reasonable prices reasonably swift. The liquidity of an asset is integrally related to transaction
costs and can be defined in terms of the costs incurred to obtain a swift execution (Schwartz
and Peng, 2006, p. 630). Transaction costs represent the costs of facilitating exchanges and
include search and information costs, negotiation and decision costs, as well as monitoring
and enforcement costs (Lee and Vonortas, 2004, p. 174). These costs depend on three generic
drivers: asset specificity, uncertainty/complexity, and frequency (Douma and Schreuder,
2008, p. 150). All else being equal, the rule is that the more specific the assets, the higher the
transaction costs; the higher the uncertainty, the higher the costs; the higher the frequency, the
cheaper the transactions. While the first two asset characteristics – specificity and
uncertainty/complexity – are inherent in patents and may hardly alter, the third driving factor
– frequency – may evolve over time by a decreasing or increasing number of patent
transactions and the development of markets for technology. To examine frequency as a key
42
determinant of patent liquidity, the next sections examine the motivations of and barriers to
patent transactions and the development of markets for technology.
2.4.1 The external acquisition and exploitation of patents
The last decades have seen an increasing trend towards more active IP management
(Kamiyama et al., 2006, p. 6). Since the late 1980s, companies across industries actively
began to acquire knowledge from external sources and, since the late 1990s, an increase in the
external exploitation of technology assets can be observed (Lichtenthaler, 2006, p. 2f). This
trend is enforced by the shift towards a more open innovation strategy. While traditional
technology management models act on the assumption that innovations are based on
organizational routines that are difficult to transfer across boundaries (Arora et al., 2001a,
p. 420) and, therefore, concentrate on company-internal, closed innovation processes, the new
model – referred to as the open innovation paradigm – assumes that firms can and should use
internal as well as external sources for the innovation process and should be active buyers and
sellers of IP (Chesbrough, 2003a, p. 37ff). This paradigm shift is motivated by the observation
that companies may improve speed, cost, and quality of innovation processes by having
access to more ideas and different kinds of expertise (Rigby and Zook, 2002, p. 82). Important
drivers that facilitate the shift towards more open innovation models are the growing mobility
of experienced and skilled R&D personnel, the increasing linkage of corporate R&D and
academic networks, and a growing presence of venture capital specialized in creating new
firms that commercialize external R&D (Chesbrough, 2003a, p. 34ff).
Alongside the innovation strategy, a company's patent strategy can be defensive or
offensive. The objective of defensive patent strategies is to have the exclusive right of
utilization and exploitation of the patented technology and to ensure the freedom to operate,
i.e. to avoid legal challenges or conflicts and infringement claims with other companies
(Chesbrough, 2006, p. 27). While a defensive patent strategy is also referred to as a portfolio-
to-protect motive, offensive patent strategies are associated with a portfolio-as-corporate-asset
motive (Achleitner et al., 2007, p. 13). Offensive patent strategies seek to manage the patent
portfolio proactively and aggressively so as to leverage IP assets. Besides protection, this
strategy is driven by the aim of extracting and generating as much value as possible from their
intellectual properties by commercializing patented technologies, licensing out patents,
partnering with companies to access other markets or technologies, or selling unutilized
43
patents (Achleitner et al., 2007, p. 13f).55 As a result, offensive patent strategies are associated
with a higher patent transaction intensity than defensive patent strategies.
Both the trend towards a more offensive patent strategy with the aim of leveraging IP
assets and the paradigm shift towards a more open innovation strategy to improve innovative
performance have led to a higher patent transaction volume. Although there is a lack of
comprehensive empirical data, many available studies provide evidence for an increasing
trade of technologies in the past two decades. To provide a detailed understanding of the
factors that determine the patent transaction volume, the next two sections examine patent
acquisition and patent exploitation from the company perspective.
2.4.2 The external acquisition of patents
Today, many firms consider external technology acquisition an important complement to
internal R&D activities and do in fact acquire a significant portion of their technologies from
external sources (Lichtenthaler and Ernst, 2007, p. 1).56 As innovation management scholars
such as Chesbrough (2003b, p. 155) note: "Nowadays, a firm has to be able to take advantage
of useful ideas that are produced outside the company in order to be successful." However,
there are ambiguous research results on the (dis)advantages of external technology
acquisition. Table 7 provides an overview of the motives for and barriers to external
technology acquisition from the perspective of the acquiring company.
A number of barriers to external patent acquisitions are induced by the object of transfer.
Before a patent can be acquired, it must be examined in detail whether the objectives of the
acquisition are met in legal, technical, and managerial terms. A thorough due diligence
process for the acquisition of a patent is complex and costly and may disclose a number of
form and content limitations concerning the legal validity of a patent, its technological scope,
or its managerial constraints. If the object of acquisition is not limited to the patent itself, i.e.
the legal document, but also includes the transfer and adaptation of knowledge, the transfer is
more complicated. By acquiring technologies that have not been developed in-house,
information asymmetries may arise.
55 The authors refer to Sullivan (1998, p. 104f). 56 The authors refer to Edler and Reger (2002), Granstrand et al. (1992), and Veugelers and Cassiman (1999).
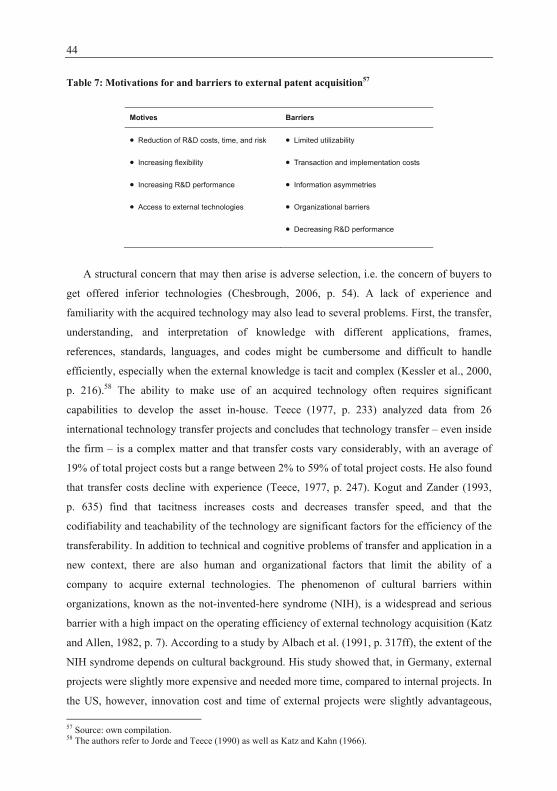
44
Table 7: Motivations for and barriers to external patent acquisition57
Motives Barriers
Reduction of R&D costs, time, and risk Limited utilizability
Increasing flexibility Transaction and implementation costs
Increasing R&D performance Information asymmetries
Access to external technologies Organizational barriers
Decreasing R&D performance
A structural concern that may then arise is adverse selection, i.e. the concern of buyers to
get offered inferior technologies (Chesbrough, 2006, p. 54). A lack of experience and
familiarity with the acquired technology may also lead to several problems. First, the transfer,
understanding, and interpretation of knowledge with different applications, frames,
references, standards, languages, and codes might be cumbersome and difficult to handle
efficiently, especially when the external knowledge is tacit and complex (Kessler et al., 2000,
p. 216).58 The ability to make use of an acquired technology often requires significant
capabilities to develop the asset in-house. Teece (1977, p. 233) analyzed data from 26
international technology transfer projects and concludes that technology transfer – even inside
the firm – is a complex matter and that transfer costs vary considerably, with an average of
19% of total project costs but a range between 2% to 59% of total project costs. He also found
that transfer costs decline with experience (Teece, 1977, p. 247). Kogut and Zander (1993,
p. 635) find that tacitness increases costs and decreases transfer speed, and that the
codifiability and teachability of the technology are significant factors for the efficiency of the
transferability. In addition to technical and cognitive problems of transfer and application in a
new context, there are also human and organizational factors that limit the ability of a
company to acquire external technologies. The phenomenon of cultural barriers within
organizations, known as the not-invented-here syndrome (NIH), is a widespread and serious
barrier with a high impact on the operating efficiency of external technology acquisition (Katz
and Allen, 1982, p. 7). According to a study by Albach et al. (1991, p. 317ff), the extent of the
NIH syndrome depends on cultural background. His study showed that, in Germany, external
projects were slightly more expensive and needed more time, compared to internal projects. In
the US, however, innovation cost and time of external projects were slightly advantageous, 57 Source: own compilation. 58 The authors refer to Jorde and Teece (1990) as well as Katz and Kahn (1966).
45
while in Japan, the results were significantly better, with a reduction of innovation costs of
50% and innovation time of 28%. In Japan, adaptation of external ideas is considered a fairly
pragmatic approach and a usual practice, which might explain their ability to integrate
external technologies more efficiently.59 Hence, an organizational structure that builds in
absorptive capacity60 and is able to overcome barriers such as NIH syndrome is a crucial
success factor for external technology acquisition (Cassima and Veugelers, 2000, p. 7).61
Quoted studies show that external technology sourcing is complicated and that one cannot
act on the assumption that purchasing external technologies saves money and time. While best
practice examples show the high potentiality of cost and time savings, a recent survey in
Germany conducted by BDO found that 32% of respondents think that the acquisition of
external patents can decrease their in-house R&D costs, while 65% were skeptical or
disagreed (BDO, 2007, p. 10). Nevertheless, according to Granstrand et al. (1992, p. 126),
"the pressure to keep R&D cost increases down and to keep R&D times low [....] leads to an
increased propensity to acquire new technologies externally, i.e. to an increased demand on
the external market for new technologies, everything else equal." These motives are enforced
by other benefits of R&D outsourcing strategies, such as a higher degree of flexibility as well
as less risk.
Besides time and costs, external technology acquisition may also have an impact on the
overall innovative performance and success of developed products and processes. External
knowledge sources facilitate new combinations of existing and complementary knowledge in
the development process (Fey and Birkinshaw, 2005, p. 600). Accordingly, the Sappho Study
(see Rothwell et al., 1974, p. 283) found that "successful firms generally had better
communication networks, internally and externally, had greater coupling with the outside
scientific and technological community." Granstrand et al. (1992, p. 126) find that external
technology acquisition is associated with an increasing product performance and increasing
technological diversification, and increasing R&D costs. In turn, Fey and Birkinshaw (2005,
p. 616) conclude, in their study, that "openness to new ideas emerged as the single most
important predicator for R&D performance." These results are reflected by a case study at
Procter & Gamble where R&D employees were advised to frequently contact a pool of
59 The authors refer to Diehl (1984, p. 74). 60 The term "absorptive capacity" is introduced by Cohen and Levinthal (1989, p. 569) and is defines as "the
firm's ability to identify, assimilate, and exploit knowledge from the environment." 61 The authors refer to Chatterji (1996).
46
external experts. Subsequently, 45% of the new products were generated with the help of
external impulses and the success rate of innovation projects has doubled (von der Eichen and
Sommerlatte, 2007, p. 18). At the same time, the capability to evaluate and exploit external
technologies requires sufficient internal scientific and technological resources (Cohen and
Levinthal, 1989, p. 593). External knowledge acquisition should not be considered a
substitute for, but as a complement to internal R&D resources (Cassiman and Veugelers,
2006, p. 68; Granstrand et al., 1992, p. 127). Firms engaged in either internal or external
technology sourcing introduced fewer new or substantially improved products, compared to
firms that combined both (Cassima and Veugelers, 2003, p. 2). An organizational structure
built on a too high intensity of external technology acquisition might lower overall company
innovativeness (Kessler et al., 2000, p. 217).62
With the increasing complexity and multidisciplinarity of many products and processes, it
is hardly possible even for companies with large R&D facilities to develop all innovations in-
house (Veugelers, 1997, p. 303). Particularly smaller companies cannot afford to operate
extensive R&D departments that address all the technological fields of their products and
processes. R&D-intensive products usually require various highly specialized capabilities
(Fey and Birkinshaw, 2005, p. 600) and often lead to an industry structure, such as the
automotive industry, with many specialized suppliers and a few large OEMs that establish
internal capabilities to evaluate and exploit new findings in the various suppliers' areas
(Cohen and Levinthal, 1989, p. 593). More open innovation models with extensive
technology transactions are also found in the IT, health care, and pharmaceutical industries
(Kamiyama et al., 2006, p. 8), with companies such as Microsoft, Cisco, Dell, Pfizer, and
Schwab, to name a few, that rely on technology acquisitions with their implemented
innovation strategies (Chesbrough, 2004, p. 576). The significant scale of in-licensing
strategies in certain industries is given by the fact that, in 2001, the 10 largest pharmaceutical
corporations worldwide generated 30% of their total turnover with in-licensed products
(Gassmann and Bader, 2006, p. 97). For instance, 2005, Merck & Co. Inc. attributed USD 9.5
billion or 44% of its revenues to alliance products and patents.63
62 The authors refer to Bettis et al. (1992). 63 Source: presentation by Reid J. Leonard, PhD, Senior Director, Worldwide Licensing & External Research,
Merck & Co., Inc. at TechConnect 2006 (http://www.techconnect.org/Summit2006/program/1713.pdf, accessed: 2008/12/07).
47
In short, there are a number of barriers to external patent acquisitions, starting with a
highly complex and costly process of patent evaluation, including problems such as
information asymmetries and adverse selection, via problems of transferring technology assets
with different standards, languages, and codes on the part of involved parties, to human
factors that hamper external technology acquisitions as the not-invented-here syndrome
(NIH). Quoted studies show that external technology sourcing is complicated and that one
cannot act on the assumption of saving cost and time by purchasing external technologies.
Empirical studies show that costs of transferring technologies to other parties may even
exceed the total costs of own technology developments and implementations. Therefore, a
certain degree of compatibility and absorptive capacity are crucial success factors to utilize
external patent acquisition as a means to gain competitive advantage. The high complexity of
many products, pressure on R&D costs and times as well as positive effects on overall
innovative performance lead to an increased propensity to acquire external technologies.
Anecdotal evidence shows that in certain industries, such as IT, health care, and
pharmaceuticals companies must rely on external technology sourcing to stay competitive.
2.4.3 The external exploitation of patents
Selling and licensing patents is an effective means for technology-based firms to generate
returns from their R&D. Many large firms do actively exploit their patent portfolios and have
created independent business units to extract value from their patent portfolios externally
(Arora et al., 2001b, p. 172; Kamiyama et al., 2006, p. 10). Licensing out technologies,
particularly for smaller companies with limited resources, provides the opportunity to
generate revenues without having to invest in all the complementary downstream assets and
marketing activities that would be needed to produce and distribute the products (OECD,
2005a, p. 11). Instead, firms can choose to generate returns from their R&D activities by
commercializing end products, licensing out the technology, or selling the technology (Arora
et al., 2001a, p. 421). Systematic approaches for the decision whether or not to exploit own
technology assets externally are provided, for instance, by Sullivan (1998, p. 25f) and Artley
et al. (2003, p. 42ff). A detailed list of pros and cons of external patent exploitation from the
perspective of the exploiting firm is provided in Table 8.
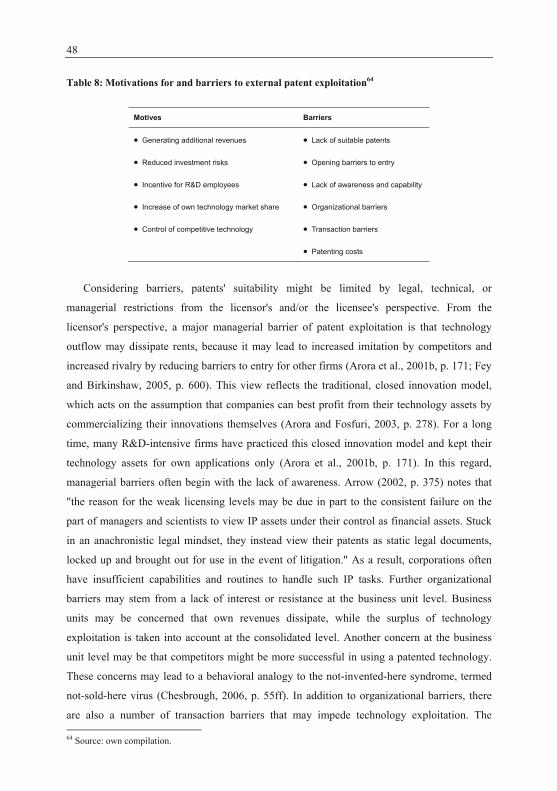
48
Table 8: Motivations for and barriers to external patent exploitation64
Motives Barriers
Generating additional revenues Lack of suitable patents
Reduced investment risks Opening barriers to entry
Incentive for R&D employees Lack of awareness and capability
Increase of own technology market share Organizational barriers
Control of competitive technology Transaction barriers
Patenting costs
Considering barriers, patents' suitability might be limited by legal, technical, or
managerial restrictions from the licensor's and/or the licensee's perspective. From the
licensor's perspective, a major managerial barrier of patent exploitation is that technology
outflow may dissipate rents, because it may lead to increased imitation by competitors and
increased rivalry by reducing barriers to entry for other firms (Arora et al., 2001b, p. 171; Fey
and Birkinshaw, 2005, p. 600). This view reflects the traditional, closed innovation model,
which acts on the assumption that companies can best profit from their technology assets by
commercializing their innovations themselves (Arora and Fosfuri, 2003, p. 278). For a long
time, many R&D-intensive firms have practiced this closed innovation model and kept their
technology assets for own applications only (Arora et al., 2001b, p. 171). In this regard,
managerial barriers often begin with the lack of awareness. Arrow (2002, p. 375) notes that
"the reason for the weak licensing levels may be due in part to the consistent failure on the
part of managers and scientists to view IP assets under their control as financial assets. Stuck
in an anachronistic legal mindset, they instead view their patents as static legal documents,
locked up and brought out for use in the event of litigation." As a result, corporations often
have insufficient capabilities and routines to handle such IP tasks. Further organizational
barriers may stem from a lack of interest or resistance at the business unit level. Business
units may be concerned that own revenues dissipate, while the surplus of technology
exploitation is taken into account at the consolidated level. Another concern at the business
unit level may be that competitors might be more successful in using a patented technology.
These concerns may lead to a behavioral analogy to the not-invented-here syndrome, termed
not-sold-here virus (Chesbrough, 2006, p. 55ff). In addition to organizational barriers, there
are also a number of transaction barriers that may impede technology exploitation. The 64 Source: own compilation.
49
transaction process starts with the identification of interested parties. The identification of
ideal licensing partners is often not obvious, since the lowest risk to dissipate own rents is to
find licensors that operate in other territories and markets, or with different technology
applications (Davis and Harrison, 2001, p. 72). Examples of patent exploitation in other
industrial fields are an automaker who found markets for his technology in the heavy
construction and health care industries, or a consumer products company that licensed a food
additive as a cleaning agent for toxic waste spills (Elton et al., 2002, p. 59). Most companies,
especially SMEs, do not have the resources to identify candidates or to detect infringements
and to sue them (cf. Brockhoff, 1999, p. 99). To illustrate the difficulty of identifying
interested parties, Elton et al. (2002, p. 60) point out that "engineers at chemical companies,
for example, aren’t likely to know that the materials and processes they use to separate
atmospheric gases could help semiconductor manufacturers reduce the time and money
needed to manufacture the high-value integrated circuits that use ceramic rather than plastic
bindings." They further illustrate the high potential by anecdotal evidence of a SME in the
chemical industry, which identified – with the help of external experts – that its IP enabled
others to cut their production costs by up to 20%. Most common, however, is the
identification of infringements by familiar competitors; according to practitioners in the field,
approximately 80% to 90% are stick licensing65 deals (Storn, 2003).66 Most companies have
insufficient experience and resources to manage licensing deals (Sullivan and Fox, 1996,
p. 83ff; Elton et al., 2002, p. 61). The exploitation of patents requires considerable expenses
and time for the licensor, who must conduct a due diligence on the licensee, must supply him
or her with information about the license and the underlying technology during the entire
process and period of the agreement, and must negotiate the licensing deal. If a licensing deal
is closed, further costs such as administration fees and/or costs to enforce the patent against
third parties, must also be taken into account.
Nonetheless, the external exploitation of technology assets may be a considerable source
of additional revenues for technology-based companies. Anecdotal evidence of successful
external patent exploitation is provided by a number of examples listed in Table 25
(see Appendix 1). Licensing rates generally depend on the specific invention and product
area. In the automobile industry, for example, royalty rates of about 2% of the product
revenues are standard deals (OECD, 2005b, p. 18). Besides the costs of holding the IP and
65 Stick licensing is the case when a potential licensee is already commercializing the invention and thereby
infringes on the patent. 66 Source: http://www.zeit.de/2002/25/200225_g-patentmarkt_xml, accessed: 2009/06/17.
50
transaction costs involved, licensing revenues have a strong effect on the EBIT, with
relatively little running expenses. At the same time, licensing involves lower risks, since
much of the risk of commercialization is transferred to the licensee, who must invest in the
development, production, and marketing of the licensed products. Particularly as an
alternative to foreign direct investments, licensing bears lower risk, because legal conditions,
living habits, the economic climate, and the political situation usually differ from the own
business environment and can be handled more efficiently by companies with local
experience and networks (Arora et al., 2001b, p. 175; OECD, 2005a, p. 11). A strategic
objective of technology licensing may also be to increase the own technology's market share
(Grindley and Teece, 1997, p. 20; Arora et al., 2001b, p. 171). In the most extensive form, the
objective is to set technology standards, for instance, when network externalities are
important (Rigby and Zook, 2002, p. 83f; Arora and Fosfuri, 2003, p. 278). Similarly,
licensing may be used to reduce the risk of prevailing new and superior technologies by
offering competitors attractive conditions to participate in exiting technologies instead of
investing in own new technology solutions (Arora et al., 2001b, p. 177). Another
organizational benefit is that the external exploitation of a patent may have a strong
motivating effect on R&D employees (Rigby and Zook, 2002, p. 83).
Owing to these benefits, several companies have implemented strong internal resources
and management policies to proactively exploit their IP assets. For instance, Procter &
Gamble has established a policy to offer all their innovations to outside organizations, even
competitors, by offering them licenses three years after introduction into the market, or five
years after patent approval (Sakkab, 2002, p. 41). P&G acts on the assumption that its core
competence is to create strong brands, rather than R&D, and that keeping patents on the shelf
undermines the opportunity to generate revenues (Chesbrough, 2006, p. 143). This conclusion
is not applicable to all companies in all industry sectors. External patent exploitation is
determined by company characteristics, industry characteristics, and patent characteristics.
Arora and Fosfuri (2003, p. 279) argue that firms license a technology when the revenue
effect from licensing is higher than the rent dissipation effect represented by the loss of
company profits due to increased competition in the product market after licensing. They also
show that the dissipation effect depends on a company's resources and that large, well-
established firms have higher losses and fewer gains from licensing due to the creation of
another competitor. As a result, all else being equal, larger firms out-license less, because they
have more to lose from licensing. Accordingly, studies show that smaller firms with less or
51
limited downstream assets are more likely to exploit their inventions through technology trade
(Arora et al., 2001a, p. 171; Gambardella et al., 2006a, p. 30). Important patent characteristics
for licensing are patent scope and maturity. Licensing is less likely to occur for technologies
that are still in their initial development stage, with much uncertainty involved in the
application and commercialization of the technology (Cassima and Veugelers, 2000, p. 7).67
Gambardella et al. (2007, p. 1164) find that the appropriability of licensing is positively
related to patent scope. They argue that "broad patents make licensing not only more feasible
and more efficient, but licensing becomes necessary if second-generation products are to be
developed by other firms that would otherwise infringe broad patents." Other patent
characteristics that have a positive impact on licensing probability are measures of economic
patent value, patent protection, and the scientific nature of the patent (Gambardella et al.,
2007, p. 1176).
Recapitulating, the conservative perspective is that an innovator can best profit from its
technology assets by commercializing innovations himself, since it might be costly and time
consuming to identify interested or infringing parties, since organizational barriers analogous
to the NIH syndrome often exist, and since many managers fear that technology outflow may
dissipate rents. Concerning the potential downsides, there is often a lack of awareness and, as
a result, corporations often have insufficient capabilities and routines. Therefore, many
companies fail to analyze potential upsides of external patent exploitation, such as additional
revenues and a transfer of risks to the party that manufactures the licensed products and brings
them to market. Particularly for smaller companies, licensing can be an effective means to
generate revenues without having to invest in all the complementary downstream assets
needed for large-scale production, marketing, and distribution. For larger companies, the
strategic objective of licensing might also be to increase own technologies' market share and
to control the competition. Furthermore, the question whether or not it is worthwhile to
exploit patents externally cannot be generalized, but depends on the individual asset and
company characteristics. There is rich anecdotal evidence of successful external patent
exploitations (see Table 24, Appendix 1). To analyze the extent to which these examples are
representative, the following section (Section 2.4.2) provides a detailed picture of markets for
technology.
67 The authors refer to Utterback and Abernathy (1975).
52
2.4.4 Markets for technology
The size and growth of markets for technology68 is difficult to measure. Available data on
patent exploitation is limited, scattered, highly fragmented, and lacking in uniformity (Arora
et al., 2001b, p. 29; Kamiyama et al., 2006, p. 16; Lichtenthaler, 2006, p. 3). No robust
statistics are available because there are no regulatory or accounting rules that require firms to
disclose patent licensing revenues as a separate item and most IP transactions are based on
private and complex contracts that are by nature sensitive and rarely made public (Davies,
2006, p. 576; Kamiyama et al., 2006, p. 16; Rohatschek, 2008, p. 142; Schultz, 2008, p. 2;
Bittelmeyer et al., 2008, p. 273). Regulatory requirements for reporting licensing contracts in
OECD countries are mostly related to cross-border transactions, and the data is published only
at an aggregate level (Kamiyama et al., 2006, p. 16).
Several studies indicate that technology trading has grown markedly in the last two
decades of the twentieth century. Arora et al. (2005, p. 325) collected information based on a
database69 of about 52,000 technology transactions70 worldwide and calculated an average
annual licensing and joint R&D volume of USD 25 billion between 1985 and 1997. To show
the increasing development, they point out that the annual average increased to USD 36
billion by confining the dataset to 1990 to 1997. Based on a World Bank database, the OECD
found that "international receipts for intellectual property (including patents, copyrights, and
trademarks) increased from USD 10 billion in 1985 to approximately USD 110 billion in
2004, with more than 90% of the receipts going to the three major OECD regions European
Union, Japan, and the United States" (Kamiyama et al., 2006, p. 17). In a survey published by
the OECD (2004, p. 109), more than half of the respondents answered that the number of
licenses granted by their companies is increasing. In Germany, receipts from international
licensing and the transfer of patents doubled during the 1990s from EUR 1.3 billion to
EUR 2.7 billion (Kamiyama et al., 2006, p. 18). On the one hand, these receipts include all
types of IP (such as patents, copyrights, trademarks, industrial processes, and franchises), and
the value of technology-based royalties is likely to be smaller. On the other hand, the figures
take into account only international licensing receipts, which are a fraction of total licensing
68 The term 'markets for technology' was coined by Arora et al. (2001a, p. 423), who refer to transactions for the
use, diffusion, and creation of technology and technology packages (patents and other forms of IP and know-how) and patent licensing.
69 The Securities Data Company (SDC) database covers about 52,000 joint ventures, alliances, licenses, R&D fundings, R&D collaborations, and other familiar deals worldwide.
70 The term technology transactions includes joint ventures, alliances, licenses, R&D funding, R&D collaborations, and other similar technology deals.
53
revenues. There is a lack of definite information about both the relative proportion of
technology-based and other sorts of IP licensing receipts and the relative proportion of
international to domestic receipts. Various sources estimate that total patent licensing
revenues in the US amounted to USD 100 billion in 2002 (Elton et al., 2002, p. 63; Kline,
2003, p. 89). Relating this estimation of total licensing revenues to statistics about receipts
from international licensing in the US of USD 52.6 billion in 2004 (World Bank, 2006)71,
roughly half the licensing revenues may be ascribed to international licensing contracts in the
US.
Frequently cited examples from well-known companies (see Table 25, Appendix 1) and
various publications in the last two decades provide an enthusiastic picture of the future
development of markets for technology (Lichtenthaler, 2006, p. 4). Sheehan et al. (2004,
p. 97) find, in an OECD survey, that more than 70% of the responding firms expect inward
licensing, while two-thirds of the firms expect outward licensing to increase.72 Accordingly, a
study conducted by PwC in 2007, confirms that 60% of executives hold that their companies
could extract much more value from their intellectual property by means of active IP
management (PwC, 2007, p. 4). Arora et al. (2001b, p. 113) argue that advances in science
and IT capabilities facilitate and push the division of innovative labor and, consequently, the
growth of markets for technology. However, this picture is not without controversy, as many
companies have a reserved, reluctant attitude to external technology exploitation
(Lichtenthaler, 2006, p. 4). Skeptical observers argue that the growing importance of licensing
is based on a few high-profile cases and that licensing with the purpose to turn R&D centers
from cost centers to profit centers by generating additional revenues is rarely practiced as a
proactive and consistent R&D policy. Moderate overall IP exploitation activity is also
indicated by PatVal results (Giuri et al., 2007, p. 1118f), as presented in Table 28
(see Appendix 3). The survey shows that the percentage of patents that are used to generate
licensing revenues are between 6% and 10% across industries and company size clusters.73
Another study conducted by the EPO in 2004 and cited by Kamiyama et al. (2006, p. 17)
relates licensing revenues to R&D spending and reveals a similar picture, as royalty receipts
amounted to 6.0%, 5.7%, and 3.1% of R&D spending in the US, Japan, and Europe,
respectively. Spending on inward-licensing was equivalent to 5.6% of the spending in R&D
71 Source: http://devdata.worldbank.org/wdi2006/contents/Section5.htm, accessed: 2009/04/22. 72 The increases in inward and outward licensing were seen more strongly in larger firms and in the ICT,
pharmaceutical, and chemical sectors, and to a lesser extent in smaller companies (with fewer than 1,000 employees) and in the machinery industry (Sheehan et al., 2004, p. 97).
73 Small firms (< 99 employees) are an exception, with approximately 20% externally exploited patents.
54
of US firms, 22.0% of firms in Japan, and merely 0.8% of firms in Europe. Besides a
relatively high share of in-licensed patents in Japan, the data of these studies reveals a
significantly smaller extent of licensing activities than what is indicated by anecdotal
evidence. Accordingly, a study by Lichtenthaler (2006, p. 274) indicates that "the number of
transactions and the revenues that firms generate through these activities […] still have a
rather limited importance for many companies, at least from a purely monetary perspective".
A closer look reveals that best practice examples of external technology exploitation (as
presented in Table 25) must be handled with care for two reasons: first, because many
transactions occur between affiliates of the same corporation, and second, because statements
about licensing revenues might be bundled with other sources of company income
(Chesbrough, 2006, p. 64ff). For example, interviews with IP experts conducted by
Chesbrough (2006, p. 64) disclosed that IBM consultants bundle IP licensing contracts with
their professional service fees and technical consulting. Considering intra-firm transactions,
the motive of the transaction might also be to shift profits to low tax countries, rather than
trading IP on the open market (Chesbrough, 2006, p. 26). For instance, in 2002, intra-firm
transactions in Japan accounted for about 60% of international royalty receipts and 14% of
royalty payments (Kamiyama et al., 2006, p. 19). Nonetheless, there are also indications that
the share of technology transactions in the open market is growing apart from mere intra-firm
arrangements. For instance, the share of IP royalties between unaffiliated companies doubled
in the US from approximately USD 5 billion in 1996 to USD 10 billion in 2001 (Wurzer,
2005, p. 21ff).74 As a matter of course, these transactions are concentrated in a few industry
sectors and basically take place in patent-intensive industries such as the
chemical/pharmaceutical, electrical, and machinery industries (Kamiyama et al., 2006, p. 14).
The significant growth of the market for technology during the 1990s also occurred
predominantly in these three top sectors (Arora et al., 2001b, p. 41). Furthermore, there are
sector-specific differences in the likelihood of in-licensing and out-licensing. In an OECD
survey cited by Kamiyama et al. (2006, p. 17), respondents from the ICT sector were the most
likely to report increases in outward licensing (approximately 80% of respondents), while
respondents from the pharmaceutical industry were most likely to report increases in inward-
licensing (approximately 80% of respondents). Considering cross-industry trade, Arora et al.
(2001b, p. 41) find that companies in the electrical and ICT sectors mostly acquire
technologies within their own technological fields, while they also sell their technologies to a
74 The author refers to "U.S. Bureau of Economic Analysis, Survey of Current Business, 2002."
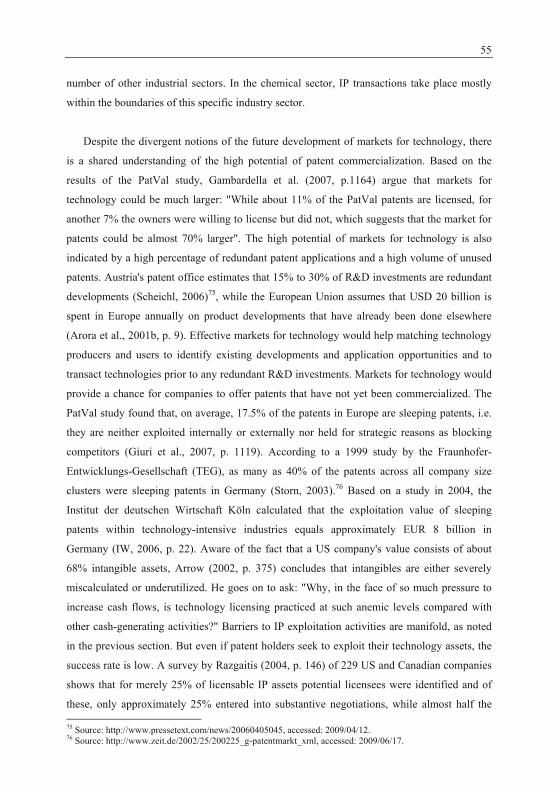
55
number of other industrial sectors. In the chemical sector, IP transactions take place mostly
within the boundaries of this specific industry sector.
Despite the divergent notions of the future development of markets for technology, there
is a shared understanding of the high potential of patent commercialization. Based on the
results of the PatVal study, Gambardella et al. (2007, p.1164) argue that markets for
technology could be much larger: "While about 11% of the PatVal patents are licensed, for
another 7% the owners were willing to license but did not, which suggests that the market for
patents could be almost 70% larger". The high potential of markets for technology is also
indicated by a high percentage of redundant patent applications and a high volume of unused
patents. Austria's patent office estimates that 15% to 30% of R&D investments are redundant
developments (Scheichl, 2006)75, while the European Union assumes that USD 20 billion is
spent in Europe annually on product developments that have already been done elsewhere
(Arora et al., 2001b, p. 9). Effective markets for technology would help matching technology
producers and users to identify existing developments and application opportunities and to
transact technologies prior to any redundant R&D investments. Markets for technology would
provide a chance for companies to offer patents that have not yet been commercialized. The
PatVal study found that, on average, 17.5% of the patents in Europe are sleeping patents, i.e.
they are neither exploited internally or externally nor held for strategic reasons as blocking
competitors (Giuri et al., 2007, p. 1119). According to a 1999 study by the Fraunhofer-
Entwicklungs-Gesellschaft (TEG), as many as 40% of the patents across all company size
clusters were sleeping patents in Germany (Storn, 2003).76 Based on a study in 2004, the
Institut der deutschen Wirtschaft Köln calculated that the exploitation value of sleeping
patents within technology-intensive industries equals approximately EUR 8 billion in
Germany (IW, 2006, p. 22). Aware of the fact that a US company's value consists of about
68% intangible assets, Arrow (2002, p. 375) concludes that intangibles are either severely
miscalculated or underutilized. He goes on to ask: "Why, in the face of so much pressure to
increase cash flows, is technology licensing practiced at such anemic levels compared with
other cash-generating activities?" Barriers to IP exploitation activities are manifold, as noted
in the previous section. But even if patent holders seek to exploit their technology assets, the
success rate is low. A survey by Razgaitis (2004, p. 146) of 229 US and Canadian companies
shows that for merely 25% of licensable IP assets potential licensees were identified and of
these, only approximately 25% entered into substantive negotiations, while almost half the 75 Source: http://www.pressetext.com/news/20060405045, accessed: 2009/04/12. 76 Source: http://www.zeit.de/2002/25/200225_g-patentmarkt_xml, accessed: 2009/06/17.
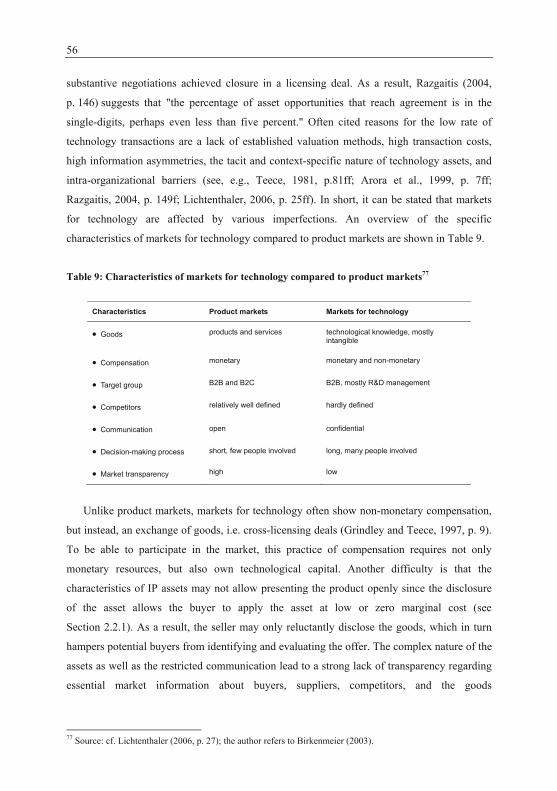
56
substantive negotiations achieved closure in a licensing deal. As a result, Razgaitis (2004,
p. 146) suggests that "the percentage of asset opportunities that reach agreement is in the
single-digits, perhaps even less than five percent." Often cited reasons for the low rate of
technology transactions are a lack of established valuation methods, high transaction costs,
high information asymmetries, the tacit and context-specific nature of technology assets, and
intra-organizational barriers (see, e.g., Teece, 1981, p.81ff; Arora et al., 1999, p. 7ff;
Razgaitis, 2004, p. 149f; Lichtenthaler, 2006, p. 25ff). In short, it can be stated that markets
for technology are affected by various imperfections. An overview of the specific
characteristics of markets for technology compared to product markets are shown in Table 9.
Table 9: Characteristics of markets for technology compared to product markets77
Characteristics Product markets Markets for technology
Goods products and services technological knowledge, mostly intangible
Compensation monetary monetary and non-monetary
Target group B2B and B2C B2B, mostly R&D management
Competitors relatively well defined hardly defined
Communication open confidential
Decision-making process short, few people involved long, many people involved
Market transparency high low
Unlike product markets, markets for technology often show non-monetary compensation,
but instead, an exchange of goods, i.e. cross-licensing deals (Grindley and Teece, 1997, p. 9).
To be able to participate in the market, this practice of compensation requires not only
monetary resources, but also own technological capital. Another difficulty is that the
characteristics of IP assets may not allow presenting the product openly since the disclosure
of the asset allows the buyer to apply the asset at low or zero marginal cost (see
Section 2.2.1). As a result, the seller may only reluctantly disclose the goods, which in turn
hampers potential buyers from identifying and evaluating the offer. The complex nature of the
assets as well as the restricted communication lead to a strong lack of transparency regarding
essential market information about buyers, suppliers, competitors, and the goods
77 Source: cf. Lichtenthaler (2006, p. 27); the author refers to Birkenmeier (2003).
57
(Lichtenthaler, 2006, p. 25). Consequently, decision processes and transaction processes in
markets for technology are long and involve many people.
To summarize, the size and evolution of markets for technology is difficult to measure and
there are no comprehensive databases to provide a clear picture. Several studies indicate that
technology trade has grown markedly in the last few decades; for example a World Bank
publication (2006) finds that international receipts from IP assets increased from USD 10
billion in 1985 to approximately USD 110 billion in 2004. Accordingly, various studies draw
an enthusiastic picture of the future development of markets for technology. However, this
picture is not uncontroversial and skeptical observers argue that the growing importance of
licensing is indicated by a few high-profile cases, rather than by comprehensive statistical
data. The PatVal survey (Giuri et al., 2007, p. 1118f) reveals a significantly smaller extent of
licensing activities than what is indicated in anecdotal evidence. A closer look at anecdotal
data reveals that licensing revenues are often bundled with other sources of company income
and that many transactions occur between affiliates of the same firm. A detailed analysis also
shows that technology trade only takes place in a few specific industries. Despite divergent
notions of the future development of markets for technology, there is a shared understanding
about the high potential of patent commercialization. The reasons for the low success rate of
transactions in markets for technology are ascribed to a lack of established valuation methods,
high transaction costs, high information asymmetries, the tacit and context-specific nature of
technology assets, and intra-organizational barriers. A comparison of conventional market
characteristics and those of markets for technology shows that technology transactions are
much more complicated and sophisticated than the trading of goods in product markets.
Therefore, the development and functioning of markets for technology requires supporting
institutions (Gambardella et al., 2007, p. 1180). These include the provision of a transaction
infrastructure (e.g., by establishing trading platforms) as well as the provision of intermediate
services that help to overcome market imperfections by reducing transaction costs,
information asymmetries, and intra-organizational barriers (e.g., by providing support to
evaluate patents, identify trading partners, and consult managers in developing and
establishing more open innovation and patent management strategies). If markets for
technology grow, the involvement of buyers, sellers, and intermediaries might co-evolve and
might induce a dynamic effect, as market development and market functioning are co-
dependent. A more intense transaction frequency may diminish market imperfections and may
lead to a higher liquidity of patents, a more intensive use of the market, and an increasing
58
number of market participants (Lichtenthaler, 2006, p. 25). The various kinds of evolving
market participants and evolving business models within markets for technology are described
in the following section (Section 2.4.3).
2.4.5 Evolving patent-based business models
The presence of various imperfections in markets for technology cause high transaction costs
for IP sellers and buyers. These obstacles provide opportunities for specialized intermediaries
to develop and offer services that reduce transaction costs and facilitate transactions in
markets for technology. Intermediaries are neither the originators nor the users of patents in
the original sense, but provide specialized services between and in addition to these two
parties. Patent agents and patent lawyers support clients to apply for patents or to conduct
infringement lawsuits since the late 1800s. With the increase in technology transactions and
the growth of markets for technology since the 1980s, intermediaries have become more
diverse and numerous (OECD, 2005a, p. 8; Tietze, 2010, p. 5f). Today, various intermediaries
have developed new IP based business models and seek to profit from IP assets themselves.
Table 10: Overview of evolving patent-based business models in markets for technology78
Business model Exemplary companies79 Description
Trade-based business models
IP auction house - IP Auctions GmbH
- OceanTomo
Companies that hold public live auctions for patents, with the intent of providing a marketplace for facilitating the exchange of the technology asset. They charge listing fees, attendance fees, buyer premiums, and/or seller commissions for their services. Online patent auctioning services also exist.
Licensing agent - IPValue
- ThinkFire
Companies that assist patent owners in finding licensees. While the amount, quality, and depth of services vary, they all earn retainer and/or success fees by assisting patent owners.
Patent broker - iPotential
- OceanTomo
Companies that assist patent owners to find buyers, rather than licensees. Unlike licensing agents, they operate both on the sell side and the buy side.
On-line IP exchange - Tynax
- Yet2.com
Companies that offer web platforms and interfaces for patent and other IP assets. The offline analogy is the service of the licensing agent or patent broker. Within the model, there are variances, such as whether listing fees are charged to patent owner/sellers in addition to, or versus, back-end fees for successful patent sale or licensing transactions.
IP-based M&A advisory - Blueprint Ventures
- Inflexion Point
Companies that advise technology companies in their M&A activities, with a focus on corporate transactions where IP is a driving or major component of the transaction. They earn fees based on the value of the whole deal.
78 Source: cf. Millien and Laurie (2007, p. 4ff). 79 Several companies may be listed at several business models due to their diversified activities.
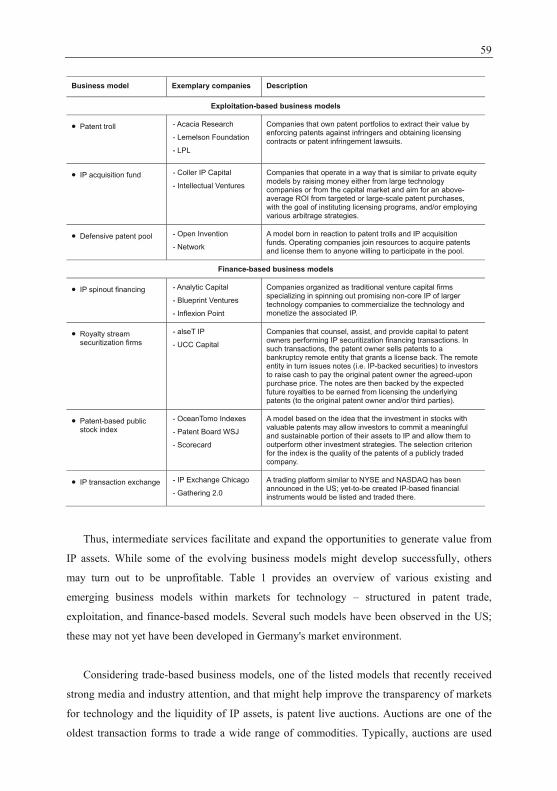
59
Business model Exemplary companies Description
Exploitation-based business models
Patent troll - Acacia Research
- Lemelson Foundation
- LPL
Companies that own patent portfolios to extract their value by enforcing patents against infringers and obtaining licensing contracts or patent infringement lawsuits.
IP acquisition fund - Coller IP Capital
- Intellectual Ventures
Companies that operate in a way that is similar to private equity models by raising money either from large technology companies or from the capital market and aim for an above-average ROI from targeted or large-scale patent purchases, with the goal of instituting licensing programs, and/or employing various arbitrage strategies.
Defensive patent pool - Open Invention
- Network
A model born in reaction to patent trolls and IP acquisition funds. Operating companies join resources to acquire patents and license them to anyone willing to participate in the pool.
Finance-based business models
IP spinout financing - Analytic Capital
- Blueprint Ventures
- Inflexion Point
Companies organized as traditional venture capital firms specializing in spinning out promising non-core IP of larger technology companies to commercialize the technology and monetize the associated IP.
Royalty stream securitization firms
- alseT IP
- UCC Capital
Companies that counsel, assist, and provide capital to patent owners performing IP securitization financing transactions. In such transactions, the patent owner sells patents to a bankruptcy remote entity that grants a license back. The remote entity in turn issues notes (i.e. IP-backed securities) to investors to raise cash to pay the original patent owner the agreed-upon purchase price. The notes are then backed by the expected future royalties to be earned from licensing the underlying patents (to the original patent owner and/or third parties).
Patent-based public stock index
- OceanTomo Indexes
- Patent Board WSJ
- Scorecard
A model based on the idea that the investment in stocks with valuable patents may allow investors to commit a meaningful and sustainable portion of their assets to IP and allow them to outperform other investment strategies. The selection criterion for the index is the quality of the patents of a publicly traded company.
IP transaction exchange - IP Exchange Chicago
- Gathering 2.0
A trading platform similar to NYSE and NASDAQ has been announced in the US; yet-to-be created IP-based financial instruments would be listed and traded there.
Thus, intermediate services facilitate and expand the opportunities to generate value from
IP assets. While some of the evolving business models might develop successfully, others
may turn out to be unprofitable. Table 1 provides an overview of various existing and
emerging business models within markets for technology – structured in patent trade,
exploitation, and finance-based models. Several such models have been observed in the US;
these may not yet have been developed in Germany's market environment.
Considering trade-based business models, one of the listed models that recently received
strong media and industry attention, and that might help improve the transparency of markets
for technology and the liquidity of IP assets, is patent live auctions. Auctions are one of the
oldest transaction forms to trade a wide range of commodities. Typically, auctions are used
60
for individually traded items or lots such as art, antiques, or agricultural goods such as cattle
and crops. In recent years, auctions have been applied to an increasing range of tangible and
intangible assets, including IP assets. In the spring of 2006, the US based firm OceanTomo
held its first live public IP auction in San Francisco, featuring 78 lots of patents. The resulting
auction turnover was approximately USD 3 million and 51% of the sellers who participated in
the auction successfully transacted their patents (Millien and Laurie, 2007, p. 10). Since then,
auctions have frequently been executed by OceanTomo in the US and the UK, with auction
turnovers in the region of USD 5 million to 25 million and average selling prices in the
dimension of USD 330,000 per lot.80 In 2007, IP Auctions GmbH held the first live IP auction
in Germany, with a transaction success rate of 30% and a turnover of USD 675,000 at the
auction and USD 1.5 million after the auction (Millien and Laurie, 2007, p. 10). It remains to
be seen whether live auctions will become established and thereby contribute to the liquidity
of patents. At any rate, the data of live auctions and the public nature of the process will allow
researchers to provide for a detailed analysis and a better understanding of IP asset transaction
processes.
Considering patent exploitation business models, many researchers and industry experts
have a skeptical view of the development of markets for technology as a result of abuses of
the IP system. For instance, a high-profile and alarming patent case for patent-intensive
industry sectors was BlackBerry maker Research in Motion Ltd.'s USD 612 million
settlements in 2006 with NTP Inc., a small US firm that held patents related to wireless email
delivery without being involved in the production of the patented technology (Sharma, 2008,
p. B1). Due to the fact that modern high-tech products involve up to hundreds of different
patents, almost every high-tech company is threatened by very expensive and resource-
binding patent trials. Expenses per lawsuit in the US amount, on average, to USD 500,000
(AIPLA, 2001)81, while the legal fees for litigating a patent case through trial are frequently
above USD 2 million per side. Although most patent lawsuits are settled, expenses in the
region of USD 1 million are often incurred (Chesbrough, 2006, p. 29).82 Besides financial
burdens, the case of Cyrix, a start-up that introduced Intel-compatible microprocessors, shows
that patent trials can also strategically hamper the business development of a company.
During a trial that lasted 1.5 years, Cyrix was hampered in its selling of microprocessors,
80 An overview of the IP auctions is provided by Millien and Laurie (2007, p. 10) as well as Bittelmeyer (2007,
p. 364). 81 Source: http://www.ftc.gov/opp/intellect/020319briankahin.pdf, accessed: 2009/02/14. 82 The author refers to Vermont (2002).
61
while Intel took advantage of the situation and developed processors to compete with Cyrix’s
innovation. In the end, Cyrix won the lawsuit, but lost the competition against Intel (Bessen
and Meurer, 2008, p. 3). Generally, it must be noted that the litigation issue is not as critical in
Europe as it is in the US, where the potential indemnification is high and the patent culture is
much more litigation-oriented (Chesbrough, 2006, p. 28). Nevertheless, in 2009, the German-
based company IPCom took action against Nokia for the infringement of patents in the region
of EUR 12 billion. IPCom bought the patents from Bosch with financial support from the US-
based investor Fortres (Hildebrand, 2009, p. 14). As one of the first high-potential cases in
Europe, the result for IPCom may open the way for more progressive and aggressive patent
exploitation strategies in the European market environment. It is beyond the focus of this
thesis to contribute to the highly complex discussion about the pros and cons of exploitation-
based business models, but irrespective of negative side effects and potential abuses of the IP
system, any transaction mode contributes positively to the liquidity of IP asset and thereby
helps to lower one of the most essential barriers for the financial utilization of patents.
Considering finance-based models, Table 1 shows that certain models are emerging. This
chapter does not delve into details of the capital market oriented models listed in Table 1.
How patents can be leveraged financially by companies is discussed in Section 3.2.
2.5 SYNOPSIS OF THE ECONOMICS OF PATENTS
This chapter takes a closer look at the economics of patents. Starting with a brief description
of the patent system and patenting trends at the macroeconomic level, subsequent sections
analyze asset characteristics of patents. Based on a summary of motives for and barriers to
patent, I explain how patents may generate value for a company and how patents are used as
value indicators by third parties. Literature findings show that, since the 1980s, the intensity
of patent applications and the importance of patents as a means for companies to exploit new
technologies have increased, as have the resources that companies apply for patent
management activities. Many researchers and business executives report that the usage of
patents has evolved in stages over time, from a primary focus on defensive, legal applications
such as the prevention of imitation and competitors to more offensive applications that seek to
generate additional revenues and to turn IP departments from cost centers into profit centers.
This development involves an increasing number of patent transactions and the emergence of
62
markets for technology. It has been shown that markets for technology comprise a variety of
different market participants and patent-based business models. Markets for technology
enable the division of innovative labor, as firms can sell or license their technology to others
instead of, or in addition to, investing in the downstream resources to produce, distribute, and
commercialize an innovation. The division of innovative labor means the development of
specialized technology suppliers with a comparative advantage in R&D activities on the one
hand, and corporations with a comparative advantage in producing, distributing, and
commercializing these innovations, on the other hand. Several patent-intensive high-tech
sectors such as software, semiconductors, or biotechnology are marked by a division of
innovative labor. Based on this development, specialized intermediaries emerge in markets for
technology and provide various trade-based, exploitation-based, and finance-based business
models (as described in the previous section). Empirical studies confirm that there is a high
potential for technology transactions and that the importance of technology transactions has
increased considerably. Accordingly, the number of transactions and the monetary turnover of
markets for technology have increased considerably within the last two decades. However, the
total volume of transactions and turnover is still limited, and markets for technology are not
yet well established. Due to the major differences of asset characteristics of patents compared
with tangible assets, patents show a relatively low inherent tradability. Particularly, the
difficult and uncertain valuability of patents seems to hamper patent transactions. Although
many different methodologies exist for assessing the value of patents, none has to date been
established. Therefore, managers and capital providers that seek to utilize patents as financial
assets are confronted with the mostly subjective and qualitative appraisal of patent values.
Existing studies show that such appraisals are used as value indicators for company
assessments by venture capital investors and stock market analysts. Nevertheless, the financial
utilization of patents analogous to tangible assets will remain constrained until more reliable
and efficient valuation methods for patents emerge. Although several studies show that the
value distribution of patents is highly skewed, the high potential to utilize patent values
financially is indicated by the PatVal results, which show that one-third of all patents are
estimated to be worth more than EUR 1 million and almost 10% of all patents are worth more
than EUR 10 million (Giuri et al., 2007, p. 1121). To better understand the concept of
leveraging patents financially, the following section elaborates on patents as financial assets.
3 PATENTS AS FINANCIAL ASSETS
According to Schumpeter (1924, p. 165f), the financial market is the quasi-headquarter of the
capitalist economy and an essential premise for innovation and economic growth. An
empirical study of the impact of finance on innovation and economic growth is provided, for
instance, by King and Levine (1993). This thesis' contribution is to examine the impact of
innovation – in the form of patents – on external financing.
Section 3.1 provides detailed information on the perception of patents as assets in
financial statements in Germany. The following section (Section 3.2) describes how patents
can be utilized financially and studies their role in external financing instruments. According
to the thesis focus, I concentrate on equity and debt financing as well as the financial
surrogate sale/lease-back transactions. I also examine how patent holders can leverage their IP
assets financially with patent funds.
3.1 THE PERCEPTION OF PATENTS IN FINANCIAL STATEMENTS
Despite the fact that patents are assets with an economic value practically, they are not yet
routinely recognized as such in financial statements. The difficulty of reliable patent valuation
is a major obstacle in accounting (cf. Alexander and Nobes, 2007, p. 167). Patents acquired
from external parties against payment can be perceived as assets in financial statements based
on their fair value. However, patents created by a company present a problem. The German
commercial code (HGB) until recently required as a general rule that internal expenditures for
patents must be immediately expensed in the profit and loss statement of the accounting
period. On the one hand, a decreasing income statement decreases the tax base of the
accounting period. On the other hand, this rule implies that internally developed patents are
not considered as assets to the firm and that the decreasing profit and loss statement decreases
equity.83 Therefore, the question of whether patents are recognized as assets in the financial
statement may have a strong impact on financial key figures, which provide a basis for
creditors and investors to assess the creditworthiness of a company or an investment
opportunity.
83 See § 266 HGB.
D. de. Vries, Leveraging Patents Financially, DOI 10.1007/978-3-8349-6903-3_3, © Gabler Verlag | Springer Fachmedien Wiesbaden GmbH 2011
64
This potential impact can be illustrated by the anecdotal case of a German auditor who
attested a patent portfolio value of EUR 2.2 million (equal to 12% of the company's balance
sheet) instead of a reasonable value of EUR 750,000. Due to the false appraisal of assets, the
result of the profit and loss statement amounted to EUR 475,000 in profits instead of a loss of
EUR 1 million. This false appraisal led to false financial key figures and a nonfactual rating
note. Eventually, the company delayed in filing insolvency and the auditor was accused as
liable, at the maximum legal penalty of EUR 1 million (see Landgericht München I, Az.
14HK O 8038/06).
The rules to recognize patents as assets in financial statements are inconsistent. In
Germany, both the commercial code (HGB) and IAS84 standards are applied, with differences
in the perception of patents as assets.85 Differences in the accounting standards stem from
cultural, legal, and capital market characteristics. Considering Germany's capital market, high
ratios of debt financing have traditionally been used. German accounting standards are
therefore characterized by the principle of prudence, in order to protect creditors (cf. Pellens
et al., 2008, p. 37ff). In contrast, Anglo-American economies are historically dominated by
public capital markets and the shareholders' interest in an unbiased estimate of future
prospects (cf. Alexander and Nobes, 2007, p. 73f).86 Accordingly, IAS 1 states within the
overall considerations that "financial statements shall present fairly the financial position,
financial performance and cash flows of an entity."87 These diverging concepts also imply
different perceptions of patents as assets. Until recently, in Germany one was generally not
allowed to capitalize intangible assets that are not acquired in return for payment, i.e. that
have a fair value.88 Intangibles acquired against payment must be capitalized in the balance
84 IAS are passed by the International Accounting Standards Board (IASB), an independent board that represents
more than 100 countries. It must be noted that the IAS board is strongly influenced by the Anglo-American tradition in setting accounting standards (Alexander and Nobes, 2007, p. 86). IASB standards are collectively called IFRS.
85 While the basic source of accounting rules in Germany is the HGB, international accounting standards have subsequently been introduced within the last decade in Germany. As a result, national rules are likely to die out for the consolidated reporting of large listed companies and IFRS will be the quasi-national accounting standard in Germany by 2012 to 2014 (Alexander and Nobes, 2007, p. 87; Fries, 2006, p. 3). At the same time, IFRS is expected to become optionally applicable for individual financial statements and for non capital market oriented companies (cf. Pellens et al., 2008, p. 52). Concurrently, major changes in HGB standards are passed by the Bilanzmodernisierungsgesetz (BilMoG) with the aim of aligning HGB and IAS standards (Pellens et al., 2008, p. 51). These changes include the recognition of patents as assets in financial statements, similar to IFRS standards.
86 It has to be noted that the observation was true in the 1950s and 1960s but that there are indications of similar debt ratios in Germany, the US, and many other countries in a similar range of 60% to 70% today. This comparison of corporate debt ratios is based on a constructed database of harmonized accounts in the respective countries (Brealey et al., 2006, p. 365).
87 Source: http://www.ifrs-portal.com/Dokumente/IFRS%20IAS%20EU%20English.pdf, accessed: 2009/03/02. 88 The rule was based on § 248 (2) HGB.
65
sheet based on the costs of acquisition. In contrast, International Accounting Standards (IAS)
generally recognize not only the fair value of acquired IP assets, but also self-developed
patents, licenses, and development expenditures. In July 2001, the Financial Accounting
Standards Board (FASB) promulgated FAS 142 (Goodwill and other Intangible Assets),
which formally gives IP an identity and a value for accounting purposes.89 Thereby, IP has
been transformed from being purely a legal asset into a financial asset (Kossovsky, 2003, p. 2;
Davies, 2004, p. 30). According to IAS 38.21, "an intangible asset shall be recognized if, and
only if, it is probable that the expected future economic benefits that are attributable to the
asset will flow to the entity, and the cost of the asset can be measured reliably."90 According
to IAS 38.22, "an entity shall assess the probability of expected future economic benefits
using reasonable and supportable assumptions that represent management’s best estimate of
the set of economic conditions that will exist over the useful life of the asset."91 It must be
noted that the intangible is capitalized at expenditures that have been made to purchase or
self-create the asset. As a result, externally acquired patents are capitalized at the market
value, which may reflect the true economic value as the buyer anticipates future economic
benefits. In contrast, internally developed patents are capitalized at the cost approach, which
reflects expenditures to create the asset but does not reflect the economic benefit the company
may have in the future (cf. Smith and Parr, 2000, p. 156). Considering R&D costs, which are
closely associated with patents, IAS differentiates between research costs and development
costs. According to IAS 38.54, "no intangible asset arising from research […] shall be
recognized; expenditure on research […] shall be recognized as an expense when it is
incurred."92 As summarized by Deliotte, IAS 38.57 states that an intangible asset arising from
development shall be recognized "if the technical and commercial feasibility of the asset for
sale or use has been established. This means that the enterprise must intend and be able to
complete the intangible asset, that it either uses it or sells it and must be able to demonstrate
how the asset will generate future economic benefits."93 In practice, these standards show a
lack of clarity and precision. It is often difficult to distinguish between research and
development activities and a number of other terms are interpretable. Furthermore, several
criteria are future oriented and uncertain. Therefore, the standard involves a choice to
capitalize development expenditures or not (cf. Rohatschek, 2008, p. 136ff). This can be
illustrated by the capitalization of the development activities of Germany's automotive
89 See www.fasb.org/st/summary/stsum142.shtml, accessed 2008/03/13. 90 Source: http://ec.europa.eu/internal_market/accounting/docs/consolidated/ias38_en.pdf, accessed 2009/03/12. 91 Source: http://ec.europa.eu/internal_market/accounting/docs/consolidated/ias38_en.pdf, accessed 2009/03/12. 92 Source: http://ec.europa.eu/internal_market/accounting/docs/consolidated/ias38_en.pdf, accessed 2009/03/12. 93 Source: http://www.iasplus.com/standard/ias38.htm, accessed 2009/03/12.

66
industry in 2007. As shown in Table 11, these expenses for R&D activities ranged from
EUR 0.7 billion at Porsche to EUR 4.9 billion at VW. The range of capitalized development
activities compared to total R&D expenditures ranged from 5% at Porsche to 42% at BMW.
At the same time, Daimler depreciated the associated intangible assets between 2 and 10 years
and Porsche generally within 6 years.94 The financial impact becomes clear upon relating the
amount of capitalized development expenditures to the total profit and loss for the accounting
period, which ranged from 17% at Porsche to 129% at VW.
Table 11: Capitalization of development expenditures (automotive industry, 2007)95
Porsche Daimler VW BMW
R&D expenditures [EUR, billion] 0.7 4.1 4.9 3.1
Capitalization ratio96 [%] 5 24 29 42
Depreciation [years] 6 2 - 10 5 - 10 7
Financial impact ratio97 [%] 17 80 129 93
In other industries, the range of capitalized development expenditures is much smaller. In
the biotech industry, for example, the feasibility of the development process is characterized
by high uncertainties. Therefore, the capitalization of development expenditures is practicable
only to a small extent for all companies in this industry (cf. Kessler, 2002, p. 340). Besides,
according to IAS 38.71, "expenditure on intangible items that was initially recognized as an
expense shall not be recognized as part of the cost of an intangible asset at a later date."98
Generally, it appears unlikely that internally developed intangible assets will be capitalized to
a great extent (cf. Coenenberg, 2001, p. 155).
94 IP assets have to be depreciated within the expected useful life. According to IFRS standards, the assessment
of the expected useful life must take into account various internal and external factors such as the product life cycle, technical progress, stability of the industry sector, expected competitors' strategies and so on (Rohatschek, 2008, p. 142).
95 Source: Küting (2008, p. 22); Daimler AG (2008); BMW AG (2008). 96 Capitalization ratio = development expenditures / total R&D expenditures. 97 Financial impact ratio = capitalized development expenditures / profit and loss for accounting period. 98 Source: http://ec.europa.eu/internal_market/accounting/docs/consolidated/ias38_en.pdf, accessed 2009/03/12.
67
3.2 HOW TO LEVERAGE PATENTS FINANCIALLY
The aim of this thesis is to examine how patents may contribute to raise external financial
funds. External financing can basically be differentiated in equity financing and debt
financing. From the company perspective, there is no generally accepted theory to optimize
the capital structure. There are several theories which differ in their emphasis on the factors
that affect the choice between debt and equity financing such as taxes, information
asymmetries, and agency costs (Myers, 2001, p. 81f).
Among the most recognized theories is Modigliani and Miller's proof that the capital
structure has no material effects on the value of the firm or the cost of available capital in a
perfect capital market, provided that the risk level of the investment is unchanged (cf. Myers,
2001, p. 81; Neus and Walter, 2008, p. 4f).99 Consequently, all firms would have equal access
to capital, and capital would flow to its most efficient use (Myers, 2001, p. 86). This would be
particularly advantageous for companies that hold valuable patent portfolios, as these would
be identified and investors would allocate their funds accordingly. However, several
characteristics of a perfect capital market are not observed in practice. Merton Miller (1988,
p. 100) notes that "[. . .] showing what doesn't matter can also show, by implication, what
does." Agency theory shows that the relationship between principals (capital provider) and
agents (capital acquirers) does not comply with the rules of a perfect capital market due to
information asymmetries and a conflict in interests. A conflict in interests is inherent in any
external financing source (Zantow, 2008, p. 138). The principal's problem is that he does not
have the same level of information as the agent who controls the company. He must consider
a lack of information and the possibility that the agent may make use of it for his own
benefits. As a result, agency costs occur. These comprise both the costs inherently associated
with opportunistic agent behavior and the costs of techniques used to mitigate this problem.
As shown in Section 2.2.5, patents are fairly complex assets compared to tangible assets.
Hence, the financial utilization of patents may be greatly affected by information
asymmetries. Myer and Majluf (1984, p. 3) analyzed the effect if agents know more about the
value of an asset and opportunities than outside investors. Based on the essay "The Market for
Lemons" by Akerlof (1970), they show that capital providers require a price reduction
(lemons' premium) if the assessment of the investment is uncertain due to information
99 Main characteristics of a perfect capital market are that the access to the market is not restricted, that there are
no transaction costs, and that the participants act rationally, implying no asymmetric and inefficient information and consequently unitary price levels and interest rates (cf. Neus and Walter, 2008, p. 3).
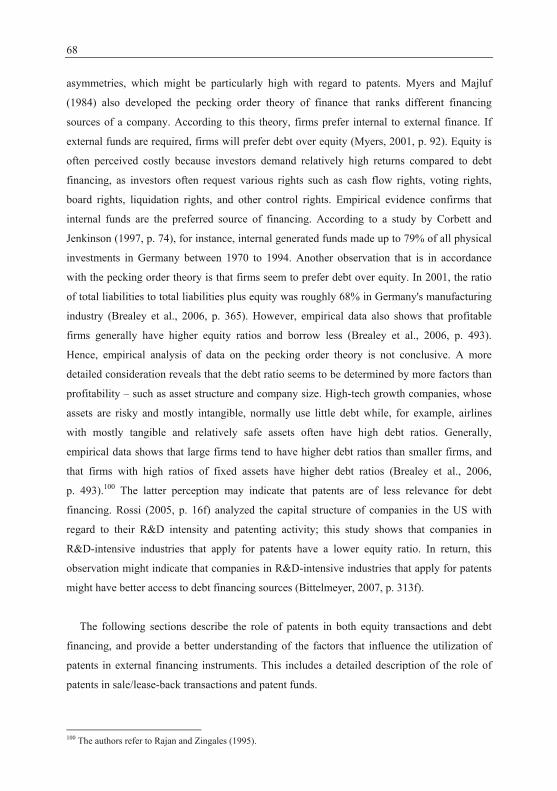
68
asymmetries, which might be particularly high with regard to patents. Myers and Majluf
(1984) also developed the pecking order theory of finance that ranks different financing
sources of a company. According to this theory, firms prefer internal to external finance. If
external funds are required, firms will prefer debt over equity (Myers, 2001, p. 92). Equity is
often perceived costly because investors demand relatively high returns compared to debt
financing, as investors often request various rights such as cash flow rights, voting rights,
board rights, liquidation rights, and other control rights. Empirical evidence confirms that
internal funds are the preferred source of financing. According to a study by Corbett and
Jenkinson (1997, p. 74), for instance, internal generated funds made up to 79% of all physical
investments in Germany between 1970 to 1994. Another observation that is in accordance
with the pecking order theory is that firms seem to prefer debt over equity. In 2001, the ratio
of total liabilities to total liabilities plus equity was roughly 68% in Germany's manufacturing
industry (Brealey et al., 2006, p. 365). However, empirical data also shows that profitable
firms generally have higher equity ratios and borrow less (Brealey et al., 2006, p. 493).
Hence, empirical analysis of data on the pecking order theory is not conclusive. A more
detailed consideration reveals that the debt ratio seems to be determined by more factors than
profitability – such as asset structure and company size. High-tech growth companies, whose
assets are risky and mostly intangible, normally use little debt while, for example, airlines
with mostly tangible and relatively safe assets often have high debt ratios. Generally,
empirical data shows that large firms tend to have higher debt ratios than smaller firms, and
that firms with high ratios of fixed assets have higher debt ratios (Brealey et al., 2006,
p. 493).100 The latter perception may indicate that patents are of less relevance for debt
financing. Rossi (2005, p. 16f) analyzed the capital structure of companies in the US with
regard to their R&D intensity and patenting activity; this study shows that companies in
R&D-intensive industries that apply for patents have a lower equity ratio. In return, this
observation might indicate that companies in R&D-intensive industries that apply for patents
might have better access to debt financing sources (Bittelmeyer, 2007, p. 313f).
The following sections describe the role of patents in both equity transactions and debt
financing, and provide a better understanding of the factors that influence the utilization of
patents in external financing instruments. This includes a detailed description of the role of
patents in sale/lease-back transactions and patent funds.
100 The authors refer to Rajan and Zingales (1995).
69
3.2.1 The role of patents in equity transactions
Equity can be defined as "the ownership interest of common and preferred stockholders in a
corporation" (Lee and Lee, 2006, p. 105). Essential differences in equity financing are based
on the legal form (see, e.g., Wöhe, 2002, p. 36ff; Zantow, 2008, p. 60ff). This thesis
concentrates on the transaction of equity shares of incorporated companies such as limited
liability companies and stock corporations.101
Equity capital can be contributed by existing shareholders or new ones. These may be
tactical or strategic investors. While the first group is primarily interested in participating in
an increasing company value, the latter group is primarily interested in participating in the
operations of a company in order to gain access to certain technologies, markets, resources, or
other operating factors. To assess the investment opportunity, tactical investors may use
patents as indicators to determine the value of company shares. They may use also patent
information for the due diligence of the technology infrastructure of a target company by
shedding light on aspects such as the employment of key inventors. A specific group of
tactical investors are venture capitalists (VC), who invest in entrepreneurial firms. Their
investment contracts are complex and include a combination of cash flow rights, board rights,
voting rights, liquidation rights and other control rights and frequently include debt-like
claims in case of negative business developments (Kaplan and Strömberg, 2002, p. 22).
Typically, high-tech start-ups possess few assets, but IP that investors may then claim as
security components in financing contracts. Hence, patents may also function as a recourse
option in venture capital contracts. Regarding strategic investors, patents may be the object of
the transaction when mergers and acquisitions (M&A) are done to acquire patent portfolios
and to gain access to certain technological fields (see, e.g., Birkinshaw, 2004, p. 296f).
Thereby, firms may enter new technology markets, restructure own technological resources,
or strengthen own technological core competencies. Empirical evidence on R&D-related
merger motivations is scarce (Frey and Hussinger, 2006, p. 2).102 Frey and Hussinger (2006,
p. 25) analyze the role of technology acquisition in European M&As in the 1990s and find
that that "the patent stock of an acquisition target is not per se attractive to potential acquirers
if the patented knowledge is not related to the acquirer’s technology portfolio. If, however, the
acquisition target has innovative assets in related technology fields, they are of high value to 101 This thesis does not contribute to research that analyzes the impact of patent information on public markets. I
do not exclude stock corporations, since the legal form of a stock company is a premise but not a requisite for public markets.
102 The authors refer to Veugelers (2006).
70
the acquiring firm." M&A transactions can be asset deals (i.e. the transfer of the entirety of
the assets and liabilities of a company), or they can occur by way of the transfer of the
corporate body through the acquisition of company shares. In both cases, the value of patents
that have not been capitalized before becomes evident. In share deals, the value of patents
appears indirectly as part of the goodwill; in asset deals, the value of patents is perceived in
the financial statement of the acquiring company based on the transaction price. In the latter
case, the transaction entails a release of hidden reserves. In equity transactions, patents may
also be utilized by investors as capital contribution in kind. It must be noted that capital in
kind is usually transferred in return for stock (Zantow, 2008, p. 59). Other forms are rare,
because § 5 (4) GmbHG imposes strict conditions on capital in kind in order to prevent
manipulation.
Figure 7: The role of patents in equity transactions103
Patent owner Investor
• Value indicator• Object of transaction
Equitycapital
Patent
Interest
In short, patents' potential roles in equity transactions are illustrated in Figure 7. Both
tactical and strategic investors provide capital to take an interest in the company. It is not
expected that they are interested in stripping patents if this is not in accordance with the
company's operative and strategic objectives. Therefore, the role of patents in equity
transactions does not imply the risk to disunite the patent from the original function against
company interests. Eventually, the disposition of patents as financial assets in equity
transactions appears to be of passive nature.
Existing literature on the role of patents in equity transactions has largely focused on the
impact of patents on the market capitalization of listed stock corporations and on VC
financing. However, the majority of companies are neither publicly traded nor VC-financed 103 Source: own compilation.
71
companies.104 Patent statistics show that merely 2.7% of all patents give rise to a new
company in Germany (Giuri et al., 2007, p. 1119). Therefore, the overview of existing
literature represents only a sub-sample of patents and companies. An overview of literature
findings concerning the analysis of stock market data is provided in Section 2.2.3. In
summary, the analysis of stock markets provides clear evidence that patent information is
used by analysts and investors as a value indicator for investment decisions. Considering VC
financing, patents often represent key assets for start-ups (Chesbrough, 2006, p. 68). As key
assets, patents are a crucial factor to access financial sources (Giuri et al., 2007, p. 1119).
Studies show that the breadth of patent protection can have a significant effect on the
valuation of an investment opportunity for venture capitalists (Lerner, 1994, p. 319).
Therefore, patents are not only crucial to show that a venture has the capability of securing
and defending a market position, and forming partnerships with other companies (Hall and
Ziedonis, 2001, p. 110; Chesbrough et al., 2006, p. 38), but also of providing an objective
measure to assess the quality of the venture as well as its technological performance. Several
studies have analyzed the role of patents in VC transactions. Empirical data shows that the
patent stock of high-tech companies such as biotechnology or software start-ups has a positive
impact on the valuation of a target company (Lerner, 1994, p. 319) and on the total amount of
venture capital obtained by the company (Mann and Sager, 2007, p. 193). Furthermore, Mann
and Sager (2007, p. 193) find a positive relation between patenting and the number of
financing rounds, exit status, receipt of late stage financing, and longevity. Haeussler et al.
(2009, p. 15ff) show that biotechnology companies with patent applications receive VC faster
and that patent oppositions increase the likelihood of receiving VC. They provide evidence
that patents help to reduce information asymmetries through a signaling105 effect (Haeussler et
al., 2009, p. 2). Considering the impact of patent quality, they show that companies with
frequently cited patents receive VC financing faster than firms with infrequently cited patent
applications (Haeussler et al., 2009, p. 16). Since citations usually occur after an investment
decision has been made, this finding indicates that investors are capable of assessing patent
quality, usually by hiring external experts to evaluate the patent portfolio (Haeussler et al.,
2009, p. 20).
104 Venture capital represents, on average, less than 2% of investments in innovation activities in Germany
(KfW, 2006, p. 118). Higher ratios of up to 5% were realized only temporarily around the year 2000. Several industry sectors show above-average venture capital ratios such as the biotechnology and medical engineering sector. Nevertheless, venture capitalists do not contribute more than 10% of financial sources in any industry sector (KfW, 2006, p. 118).
105 The authors define signalling as "a characteristic that is correlated with company performance, but is easier to observe than the underlying causal factors influencing performance" (Haeussler et al., 2009, p. 5).
72
3.2.2 The role of patents in debt financing
Debt financing includes a broad variety of financing instruments (see, e.g., Wöhe, 2002,
p. 178ff). This thesis concentrates on the role of patents in the acquisition of bank loans,
which can be defined as "a specified sum of money lent by a bank to a customer, usually for a
specified time and at a specified rate of interest" (Smullen and Hand, 2005, p. 33).
Lending decisions and lending terms depend on the credit risk, which is determined by the
probability of default and the expected loss that the creditor would incur in case of default.
The lower the credit risk is, the more likely it is that the loan is granted and/or the lower the
interest charged. Credit risk analysis is frequently presented in the form of credit ratings.
These can be bank internal ratings for individual referencing, or external ratings for large
corporations by institutions such as Moody's Investor Services or Standard & Poor's.106
Ratings are generally based on quantitative107 and qualitative108 factors. There is not a single
standard for the structure and operation of rating systems; instead there is much diversity.
Rating systems "lie on a continuum between pure statistical modeling of historic quantitative
data and pure judgmental models that rely on the subjective opinions of credit analysts vis-à-
vis borrowers’ qualitative characteristics" (Hall, 2003, p. 9). Empirical studies show that pure
reliance on statistical models is traditionally used for small corporate lending and that expert-
based models are applied in the mid-sized or large corporate borrower segments (Hall, 2003,
p. 17f). Generally, banks do not reveal their rating procedures to outsiders in any detail
(Treacy and Carey, 1998, p. 897). They may include quantitative and/or qualitative patent
information to assess the probability of loss due to any default in their rating systems.
Intangible assets are currently included in ratings on an unsystematic basis (Hofmann, 2005,
p. 3). Since patents are usually not perceived as assets in financial statement to a large extent,
it may – for example – be reasonable to adjust key financial figures according to a
reexamination of the patent portfolio value. If a quantitative valuation of patents is not
available or feasible, analysts may also consider patent information as a qualitative factor,
106 Traditionally, banks have used confidential references. Today, rating agencies gather information from a wide
range of sources, including court files, bankruptcy proceedings, and professional debt collectors and provide the information publicly (Smullen and Hand, 2005, p. 99).
107 Qualitative factors include a range of assessments such as the quality of the management, risk aspects, factors that influence the development of the industry sector, and various other aspects (cf. Zantow, 2008, p. 145).
108 Quantitative factors are basically key figures drawn from the analysis of a company's financial statement concerning liquidity, the assets and liabilities structure, and the income statement. In addition, an appraisal of future cash flows is essential for the rating, since the financial statement refers only to the past (cf. Zantow, 2008, p. 145).
73
which may range from predetermined assessment schemes to purely individual and intuitive
appraisals.
In addition to credit ratings, the creditworthiness of a company is also determined by
securities that may reduce the loss-giving default. These can be any rights that satisfy the
creditor's claims in case of a credit default. Securities are, for example, guarantees by third
parties or realities as pledges and liens on movable or immovable assets. The essential role of
securities for the loan decision is reflected by statistics about the experiences of SMEs, which
shows that 85% of credit refusals in Germany in 2005 were based on a lack of securities
(Reize, 2006, p. 10). Patents do fulfill basic requirements of securities since they are fungible
and legally enforceable. The German Federal Financial Supervisory Authority (BaFin)
permits banks to accept patents as the sole form of security for debt financing under certain
premises. These premises are, firstly, that the creditor applies an advanced measurement
approach (AMA) to calculate the capital charged for the operational risk and, secondly, that
the assessment of the security is based on historic exploitation figures109 and that the creditor
applies robust risk management (cf. Schedl, 2005, p. 21). If these premises are met, patents
can be used either as a mortgage according to §§ 1273ff BGB or as a transfer by way of
security (Klawitter and Hombrecher, 2004, p. 1213). The difference between the two types is
a question of ownership. As a mortgage, the patent still belongs to the debtor, and the creditor
may exploit it in the case of default. The debtor may even sell the patent to a third party,
which would not affect the right of the creditor to exploit the patent in the default scenario (cf.
Klawitter and Hombrecher, 2004, p. 1215).110 In contrast, the transfer by way of security
means a complete transfer of the patent from the debtor to the creditor during the loan
agreement term. The mortgage can be an informal agreement that is not to be registered at the
patent office (Klawitter and Hombrecher, 2004, p. 1214).111 A transfer by way of security is
not explicitly regulated by law, but arises from legal practice to overcome the complexities of
mortgages (cf. Klawitter and Hombrecher, 2004, p. 1216).112 It can also be an informal
109 According to § 161 SolvV securities must have "approved and publicly available market prices". 110 Creditors should be aware that the transfer of the patent does not automatically include the transfer of a
licensing contract. Therefore, existing licensing agreements with third parties are not included in the mortgage if not explicitly stated. If the loan agreement does not include existing licenses to the creditor's advantage, they might turn out to be an encumbrance to the creditor. If he aims to exploit the patent with an existing license that is not for the benefit of the bidder, the license may lower the value of the patent substantially (cf. Klawitter and Hombrecher, 2004, p. 1215).
111 The mortgage agreement should include clauses concerning the entitlement to grant licenses to third parties, the legal defense and enforcement of the patent against third parties, and the extension of the patent (Klawitter and Hombrecher, 2004, p. 1214).
112 The major difference between mortgages and transfers by way of security is that the latter are much more flexible and effectively exploitable in the default scenario (Klawitter and Hombrecher, 2004, p. 1217).

74
agreement between the debtor and the creditor.113 In contrast to mortgages, there are no
explicit restrictions and rules for the exploitation in the default case. Therefore, the contract
requires detailed clauses for the default scenario (Klawitter and Hombrecher, 2004, p. 1216).
The transfer by way of security is not registered at the patent office, even though the patent is
de facto transferred for the loan agreement term. Due to § 30 PatG, only long lasting patent
transfers are registered (Klawitter and Hombrecher, 2004, p. 1216).
In summary, patents may have an impact on a company's creditworthiness, either as a
security to reduce the loss-giving default and/or as an indicator to assess the probability of
loss-giving default – as illustrated in Figure 8. The latter does not involve an active
disposition of the patent to a third party. In contrast, the utilization of patents as a security
does imply that the creditor has the right to exploit the patent if the debtor fails to meet debt
services. The creditor may exploit the asset with the aim of compensating the loss-giving
default at the best rate. In doing so, he acts independent of the debtor's operative and strategic
objectives, as he has no interest in the debtor's economic development beyond the fulfillment
of the loan agreement. Therefore, debtors must carefully consider the probability of default
and the operative and strategic consequences of the creditor's patent exploitation.
Figure 8: The role of patents in the acquisition of bank loans114
Patent owner Creditor
• Risk indicator• Security
Debt service
Patent
Loan
Existing literature shows that patents have been rarely used for bank loans. There is little
evidence that banks consider intangible assets in either credit risk models or as collateral (cf.
Bezant, 1998, p. 237; Hall, 2003, p. 26; Klawitter and Hombrecher, 2004, p. 1213; 113 The transfer by way of security should include detailed information about the purpose, i.e. the security itself,
as well as clauses about the entitlement of the creditor and the debtor to use and exploit the patent during the loan agreement. Similar to the mortgage contract, the agreement should also include rules about the responsibility of legal defense and enforcement of the patent against third parties and the extension of the patent (cf. Klawitter and Hombrecher, 2004, p. 1216).
114 Source: own compilation.
75
Davies, 2006, p. 560). According to PRISM115, a study on behalf of the European Union,
"[…] there is surprisingly little evidence of any explicit consideration of intangibles in
corporate ratings products" (Mørck et al., 2003, p. 49). However, there is empirical evidence
of a positive correlation between a company's patent stock and its access to debt financing.
Czarnitzki and Kraft (2002, p. 6) explored the effect of innovation measures – among others
the patent stock116 – on the credit rating of the largest rating agency in Germany,
Creditreform, and found that patent stock has a significant impact on credit ratings. They
conclude that "most innovating firms have better ratings and, therefore, better access to credit
markets" (Czarnitzki and Kraft, 2002, p. 6). Besides the utilization of patents as value
indicators, Chesbrough (2006, p. 68) ascertained from expert interviews that financial
institutions are in fact assignees of a large number of patents. He argues that "in the event of a
company’s bankruptcy, a bank that results to be the assignee of a portfolio of patents enjoys a
better contractual position among the creditors" (Chesbrough, 2006, p. 69). However, the
value independently assigned to patents has generally been negligible relative to the total
liquidity raised. Where IP has been used as security, this has usually been in addition to other
assets (Davies, 2006, p. 560). Commercial banks do not routinely accept intangible assets as
major collateral in any of the triad regions of the US, Western Europe, and Japan.
Accordingly, a survey of approximately 50 European commercial banks shows that none of
them routinely accepts intangible assets as collateral for bank loans (Kamiyama et al., 2006,
p. 20). Another indication for little IP relevance in Germany's credit service sector is the fact
that patents and other IP assets are seldom mentioned in literature about Germany's law of
credit and security (Klawitter and Hombrecher, 2004, p. 1213).117 Table 12 shows the fairly
low relevance of intangible assets as collateral in Germany's credit market. The percentage of
patents is not explicitly listed in the table, but as a subunit of intangible asset with a total
percentage of merely 2.2%, the relevance thus appears to be marginal.
Among the very little anecdotal evidence available, the case of the Development Bank of
Japan is instructive. It is a government-related financial institution that in 1995 implemented a
loan system that allows for the use of patents and patent applications. Between 1995 and
115 See http://www.euintangibles.net, accessed: 2008/08/04. 116 The authors also examined the influence of the innovation measures R&D intensity (defined as R&D
expenditure divided by total sales volume) and the share of sales with newly developed products (defined as products not older than three years). They found that all innovation measures have a positive impact on the credit rating. It must be noted that the impact is not linear but inversely U-shaped, implying that both a too low and a too high innovation index negatively influence rating results. The decrease can be explained by the high risks involved in R&D investments (Czarnitzki and Kraft, 2002, p. 6).
117 The authors refer to Woeste (2002, p. 28f).
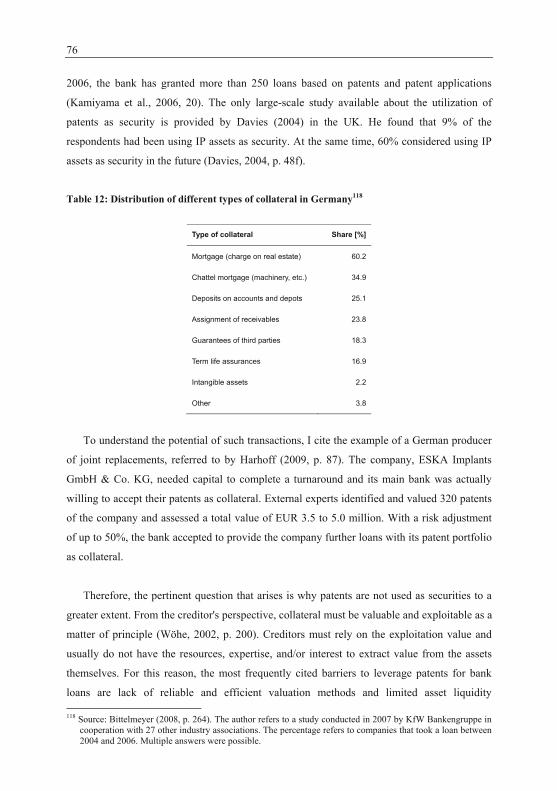
76
2006, the bank has granted more than 250 loans based on patents and patent applications
(Kamiyama et al., 2006, 20). The only large-scale study available about the utilization of
patents as security is provided by Davies (2004) in the UK. He found that 9% of the
respondents had been using IP assets as security. At the same time, 60% considered using IP
assets as security in the future (Davies, 2004, p. 48f).
Table 12: Distribution of different types of collateral in Germany118
Type of collateral Share [%]
Mortgage (charge on real estate) 60.2
Chattel mortgage (machinery, etc.) 34.9
Deposits on accounts and depots 25.1
Assignment of receivables 23.8
Guarantees of third parties 18.3
Term life assurances 16.9
Intangible assets 2.2
Other 3.8
To understand the potential of such transactions, I cite the example of a German producer
of joint replacements, referred to by Harhoff (2009, p. 87). The company, ESKA Implants
GmbH & Co. KG, needed capital to complete a turnaround and its main bank was actually
willing to accept their patents as collateral. External experts identified and valued 320 patents
of the company and assessed a total value of EUR 3.5 to 5.0 million. With a risk adjustment
of up to 50%, the bank accepted to provide the company further loans with its patent portfolio
as collateral.
Therefore, the pertinent question that arises is why patents are not used as securities to a
greater extent. From the creditor's perspective, collateral must be valuable and exploitable as a
matter of principle (Wöhe, 2002, p. 200). Creditors must rely on the exploitation value and
usually do not have the resources, expertise, and/or interest to extract value from the assets
themselves. For this reason, the most frequently cited barriers to leverage patents for bank
loans are lack of reliable and efficient valuation methods and limited asset liquidity 118 Source: Bittelmeyer (2008, p. 264). The author refers to a study conducted in 2007 by KfW Bankengruppe in
cooperation with 27 other industry associations. The percentage refers to companies that took a loan between 2004 and 2006. Multiple answers were possible.
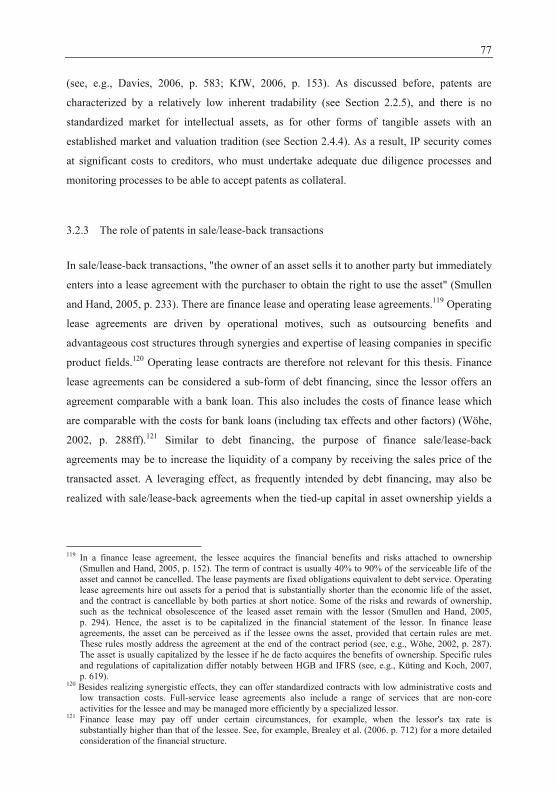
77
(see, e.g., Davies, 2006, p. 583; KfW, 2006, p. 153). As discussed before, patents are
characterized by a relatively low inherent tradability (see Section 2.2.5), and there is no
standardized market for intellectual assets, as for other forms of tangible assets with an
established market and valuation tradition (see Section 2.4.4). As a result, IP security comes
at significant costs to creditors, who must undertake adequate due diligence processes and
monitoring processes to be able to accept patents as collateral.
3.2.3 The role of patents in sale/lease-back transactions
In sale/lease-back transactions, "the owner of an asset sells it to another party but immediately
enters into a lease agreement with the purchaser to obtain the right to use the asset" (Smullen
and Hand, 2005, p. 233). There are finance lease and operating lease agreements.119 Operating
lease agreements are driven by operational motives, such as outsourcing benefits and
advantageous cost structures through synergies and expertise of leasing companies in specific
product fields.120 Operating lease contracts are therefore not relevant for this thesis. Finance
lease agreements can be considered a sub-form of debt financing, since the lessor offers an
agreement comparable with a bank loan. This also includes the costs of finance lease which
are comparable with the costs for bank loans (including tax effects and other factors) (Wöhe,
2002, p. 288ff).121 Similar to debt financing, the purpose of finance sale/lease-back
agreements may be to increase the liquidity of a company by receiving the sales price of the
transacted asset. A leveraging effect, as frequently intended by debt financing, may also be
realized with sale/lease-back agreements when the tied-up capital in asset ownership yields a
119 In a finance lease agreement, the lessee acquires the financial benefits and risks attached to ownership
(Smullen and Hand, 2005, p. 152). The term of contract is usually 40% to 90% of the serviceable life of the asset and cannot be cancelled. The lease payments are fixed obligations equivalent to debt service. Operating lease agreements hire out assets for a period that is substantially shorter than the economic life of the asset, and the contract is cancellable by both parties at short notice. Some of the risks and rewards of ownership, such as the technical obsolescence of the leased asset remain with the lessor (Smullen and Hand, 2005, p. 294). Hence, the asset is to be capitalized in the financial statement of the lessor. In finance lease agreements, the asset can be perceived as if the lessee owns the asset, provided that certain rules are met. These rules mostly address the agreement at the end of the contract period (see, e.g., Wöhe, 2002, p. 287). The asset is usually capitalized by the lessee if he de facto acquires the benefits of ownership. Specific rules and regulations of capitalization differ notably between HGB and IFRS (see, e.g., Küting and Koch, 2007, p. 619).
120 Besides realizing synergistic effects, they can offer standardized contracts with low administrative costs and low transaction costs. Full-service lease agreements also include a range of services that are non-core activities for the lessee and may be managed more efficiently by a specialized lessor.
121 Finance lease may pay off under certain circumstances, for example, when the lessor's tax rate is substantially higher than that of the lessee. See, for example, Brealey et al. (2006. p. 712) for a more detailed consideration of the financial structure.
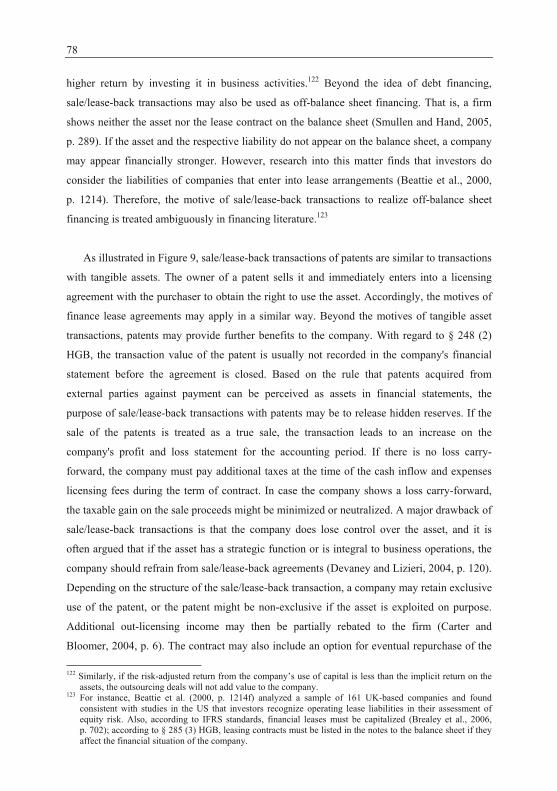
78
higher return by investing it in business activities.122 Beyond the idea of debt financing,
sale/lease-back transactions may also be used as off-balance sheet financing. That is, a firm
shows neither the asset nor the lease contract on the balance sheet (Smullen and Hand, 2005,
p. 289). If the asset and the respective liability do not appear on the balance sheet, a company
may appear financially stronger. However, research into this matter finds that investors do
consider the liabilities of companies that enter into lease arrangements (Beattie et al., 2000,
p. 1214). Therefore, the motive of sale/lease-back transactions to realize off-balance sheet
financing is treated ambiguously in financing literature.123
As illustrated in Figure 9, sale/lease-back transactions of patents are similar to transactions
with tangible assets. The owner of a patent sells it and immediately enters into a licensing
agreement with the purchaser to obtain the right to use the asset. Accordingly, the motives of
finance lease agreements may apply in a similar way. Beyond the motives of tangible asset
transactions, patents may provide further benefits to the company. With regard to § 248 (2)
HGB, the transaction value of the patent is usually not recorded in the company's financial
statement before the agreement is closed. Based on the rule that patents acquired from
external parties against payment can be perceived as assets in financial statements, the
purpose of sale/lease-back transactions with patents may be to release hidden reserves. If the
sale of the patents is treated as a true sale, the transaction leads to an increase on the
company's profit and loss statement for the accounting period. If there is no loss carry-
forward, the company must pay additional taxes at the time of the cash inflow and expenses
licensing fees during the term of contract. In case the company shows a loss carry-forward,
the taxable gain on the sale proceeds might be minimized or neutralized. A major drawback of
sale/lease-back transactions is that the company does lose control over the asset, and it is
often argued that if the asset has a strategic function or is integral to business operations, the
company should refrain from sale/lease-back agreements (Devaney and Lizieri, 2004, p. 120).
Depending on the structure of the sale/lease-back transaction, a company may retain exclusive
use of the patent, or the patent might be non-exclusive if the asset is exploited on purpose.
Additional out-licensing income may then be partially rebated to the firm (Carter and
Bloomer, 2004, p. 6). The contract may also include an option for eventual repurchase of the
122 Similarly, if the risk-adjusted return from the company’s use of capital is less than the implicit return on the
assets, the outsourcing deals will not add value to the company. 123 For instance, Beattie et al. (2000, p. 1214f) analyzed a sample of 161 UK-based companies and found
consistent with studies in the US that investors recognize operating lease liabilities in their assessment of equity risk. Also, according to IFRS standards, financial leases must be capitalized (Brealey et al., 2006, p. 702); according to § 285 (3) HGB, leasing contracts must be listed in the notes to the balance sheet if they affect the financial situation of the company.
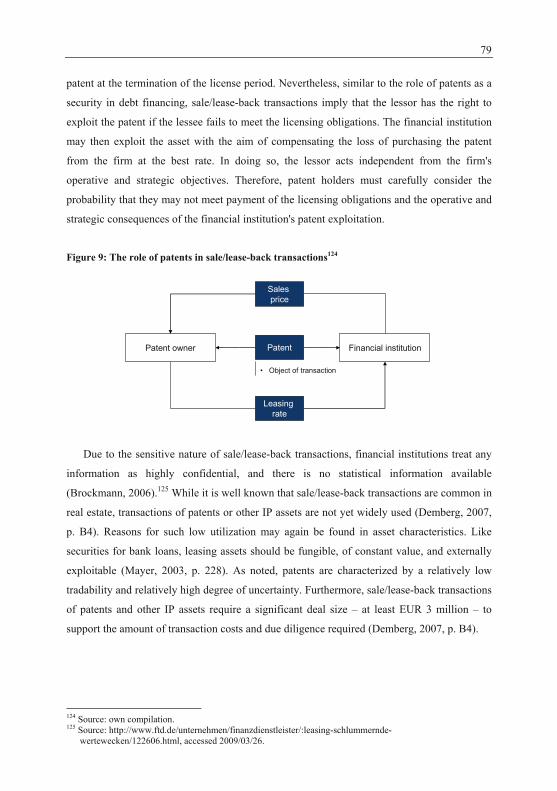
79
patent at the termination of the license period. Nevertheless, similar to the role of patents as a
security in debt financing, sale/lease-back transactions imply that the lessor has the right to
exploit the patent if the lessee fails to meet the licensing obligations. The financial institution
may then exploit the asset with the aim of compensating the loss of purchasing the patent
from the firm at the best rate. In doing so, the lessor acts independent from the firm's
operative and strategic objectives. Therefore, patent holders must carefully consider the
probability that they may not meet payment of the licensing obligations and the operative and
strategic consequences of the financial institution's patent exploitation.
Figure 9: The role of patents in sale/lease-back transactions124
Patent owner Financial institutionPatent
Leasing rate
Sales price
• Object of transaction
Due to the sensitive nature of sale/lease-back transactions, financial institutions treat any
information as highly confidential, and there is no statistical information available
(Brockmann, 2006).125 While it is well known that sale/lease-back transactions are common in
real estate, transactions of patents or other IP assets are not yet widely used (Demberg, 2007,
p. B4). Reasons for such low utilization may again be found in asset characteristics. Like
securities for bank loans, leasing assets should be fungible, of constant value, and externally
exploitable (Mayer, 2003, p. 228). As noted, patents are characterized by a relatively low
tradability and relatively high degree of uncertainty. Furthermore, sale/lease-back transactions
of patents and other IP assets require a significant deal size – at least EUR 3 million – to
support the amount of transaction costs and due diligence required (Demberg, 2007, p. B4).
124 Source: own compilation. 125 Source: http://www.ftd.de/unternehmen/finanzdienstleister/:leasing-schlummernde-
wertewecken/122606.html, accessed 2009/03/26.
80
3.2.4 The role of patents in patent funds
There is no clear definition of the term patent fund since the term is used for different fund
structures in different business models. There are funds that invest – as many other funds do –
directly in company shares. With regard to patent funds, the idea of this fund model is to
invest in company shares based on patent information. Examples of such funds are provided
in Section 2.2.3. Another model of patent funds does not invest in company shares, but
directly in patents. These funds are financial constructs that offer investors interests in so-
called special purpose vehicles (SPVs), which hold and acquire rights in patents in order to
generate revenues. This type of patent funds is examined in the following.
Patent funds are managed by specialized intermediaries who acquire patents from a
variety of sellers (such as individual inventors, research institutions, companies, or other
intermediaries) and generate returns from the acquisition by exploiting the patents (by
licensing out the patents, selling the patents, or by taking action for infringement upon the
patent). Some US patent funds have gained an ambivalent reputation for focusing on the
extortion of license payments by making use of legal threats (see, e.g., Orey, 2006).126 The
European situation is different, presumably because the litigation system does not grant the
kind of strategic opportunities available under the US system (Harhoff, 2009, p. 88).
According to a leading German intermediary in this field, premises for the acquisition of
patents are the legal strength, a remaining patent validity of at least 8 years, technological
feasibility, and sufficient market potential. Two kinds of patents are of primary interest to
fund managers. Firstly, patents that underlie disruptive technologies, i.e. technologies that
overturn the existing dominant technologies and, secondly, patents that do not involve such an
innovative leap but can be implemented in short periods of time with the help of some capital
employment and market access (Manthey, 2008, p. 5). Hence, the fund structure may be used
not only to acquire patents, but also to develop the patents for a more profitable
commercialization by, for example, investing in the development of prototypes or by
expanding the territorial scope of the patent.127 According to a leading German intermediary
126 Source: http://www.businessweek.com/magazine/content/06_27/b3991401.htm, accessed 2009/04/04. 127 For instance, the structure of "Patent Select I", distributed by Deutschen Bank (Clou Partners GmbH and
Deutsche Bank AG, 2006, p. 14ff), is designed for an average development stage of 24 to 30 months. The fund has a volume of EUR 24.5 million. The investment volume to develop the patents accounts for EUR 6.4 million and EUR 4.3 million is taken to administer the patents. EUR 1.3 million is used to purchase patents. Extra expenses for patent acquisition are planned to account for EUR 3.2 million. Another EUR 3.7 million is taken for additional expenditures to hold the patents and to exploit the patents if needed. The rest of the capital is used for once-off company expenditures and a liquidity reserve.
81
in this field, the development activities might well be assigned to the original patent holder,
because he usually has the best knowledge and qualifications to develop the patent. Thereby,
patent funds may constitute an alternative financing instrument to equity transactions for
high-tech companies. Instead of providing capital for company shares, patent funds provide
capital for patents to develop them and to commercialize them. This opportunity may be
particularly interesting for firms that specialize in developing technology without necessarily
planning to build downstream capabilities. Besides, patent funds may also constitute an
opportunity for established companies to outsource the exploitation of their patent portfolios
without necessarily being involved in development activities. Advantages for patent holders
compared to the own exploitation of patents include the following aspects: brokering
expertise (i.e. reduction of information asymmetries and transaction costs), IP expertise (i.e.
resources and experience in legal, technical, and managerial patent issues), and allocation of
patents (i.e. clustering effects and critical volume building). Usually, fund managers require
that the patent be transferred to the SPV. Licensing deals between the SPV and the original
patent holder should be managed by excellently rated companies in order to avert the risk of
patent loss if the company files for insolvency. The purchasing price of the patent may
compensate the expenses of the patent holder to file the patent, but it does not include a rate of
return.128 Instead, revenues from commercialization are divided between the intermediary, the
investors, and the original patent holder. The proportions of the dividend split differ and the
terms and conditions for the original patent holder are essentially determined by the status and
the value of the offered patent at the time when the contract is signed. In exchange, the
economic risk of investments in the patent development and initiating activities for exploiting
the patent is borne by the investors and the SPV.129
As illustrated in Figure 10, the role of patents in patent funds is to generate revenues as
the return on investment for investors and as a return for the original patent holder for
subscribing his asset. Furthermore, patent funds may constitute a financing instrument for the
original patent holder in case he receives capital from the fund to develop the patent for
successful commercialization of the patent.
128 For instance, the average purchasing price for the patents of "Patent Invest I", distributed by Credit Suisse
(Deutschland) AG, amounted to EUR 30,000 (Finance System GmbH & Co. KG, 2005, p. 18f). 129 These costs usually include expenses for the identification and valuation of patents, the costs to develop the
patent, the extension of the patent, legal actions, and the identification and negotiation with potential licensees and patent acquirers.
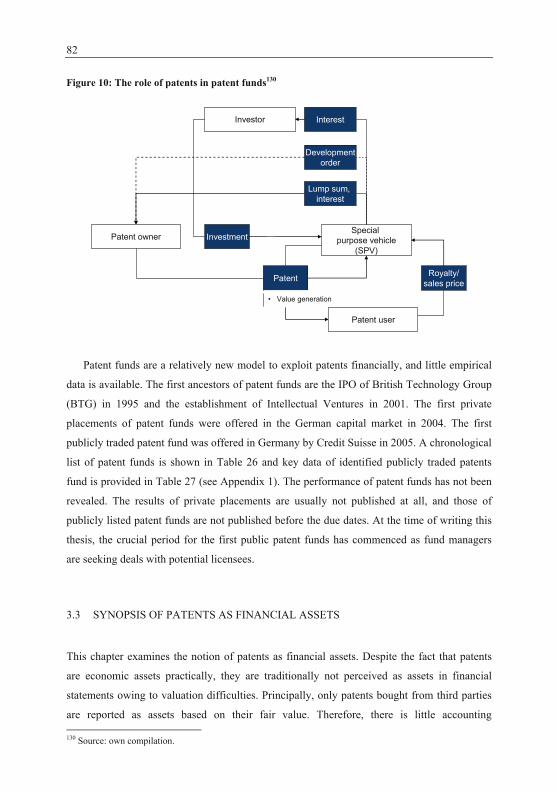
82
Figure 10: The role of patents in patent funds130
Patent ownerSpecial
purpose vehicle(SPV)
Investor
Patent
Investment
Royalty/sales price
Lump sum, interest
Interest
Developmentorder
• Value generation
Patent user
Patent funds are a relatively new model to exploit patents financially, and little empirical
data is available. The first ancestors of patent funds are the IPO of British Technology Group
(BTG) in 1995 and the establishment of Intellectual Ventures in 2001. The first private
placements of patent funds were offered in the German capital market in 2004. The first
publicly traded patent fund was offered in Germany by Credit Suisse in 2005. A chronological
list of patent funds is shown in Table 26 and key data of identified publicly traded patents
fund is provided in Table 27 (see Appendix 1). The performance of patent funds has not been
revealed. The results of private placements are usually not published at all, and those of
publicly listed patent funds are not published before the due dates. At the time of writing this
thesis, the crucial period for the first public patent funds has commenced as fund managers
are seeking deals with potential licensees.
3.3 SYNOPSIS OF PATENTS AS FINANCIAL ASSETS
This chapter examines the notion of patents as financial assets. Despite the fact that patents
are economic assets practically, they are traditionally not perceived as assets in financial
statements owing to valuation difficulties. Principally, only patents bought from third parties
are reported as assets based on their fair value. Therefore, there is little accounting 130 Source: own compilation.
83
measurement and reporting on the value and productivity of patent portfolios although it may
have a strong impact on assessments by external capital providers. Therefore, current
accounting practices and norms derived from measuring tangible and material assets are
inappropriate for technology-intensive companies and must be modified. Although the
introduction of IAS standards in Germany formally gives internally developed IP an identity
and a value for accounting purposes, a detailed examination of new accounting practices and
norms indicates that it appears unlikely that patents will be capitalized to a great extent in the
near future.
Beyond the formal perception of patents in financial statements, this section also analyzes
how patents may be leveraged financially. Having discussed the utilization of patents for
internal financing (i.e. the external exploitation of patents to generate additional revenues) in
Section 2.4.3, this chapter has focused on the question of how patents can be utilized for
external financing instruments (i.e. the acquisition of capital through patents from sources
outside the firm). In summary, patents function as value indicators and/or objects of transfer
in equity transactions, or as indicators for rating notes and/or security in the acquisition of
bank loans. In addition, this chapter addresses the utilization of patents as objects of
transaction in sale/lease-back agreements as well as the relatively new model of disposing
patents as value generating assets in patent funds. After introducing the financing models and
the role of patents within the models from the companies' perspective, I present empirical data
on the actual utilization of the models. For consolidated findings, I refer to the respective
sections. Generally, it turns out that there is very little empirical data about the utilization of
patents in equity transactions and the acquisition of bank loans. Existing studies on the role of
patents in equity transactions focus largely on VC financing or on the analysis of stock market
data and are therefore limited to a relatively small number of firms. Considering debt
financing, there is anecdotal evidence and rich expert opinions, but hardly any comprehensive
studies are available. There is also hardly any empirical data available on patent-based
sale/lease-back transactions and patent funds.
The aim of the empirical study is to collect and analyze data on the role of patents in
equity transactions of corporate entities beyond stock market data or venture capital analysis,
and to collect and analyze comprehensive data on the utilization of patents in debt financing,
sale/lease-back transactions, and patent funds.
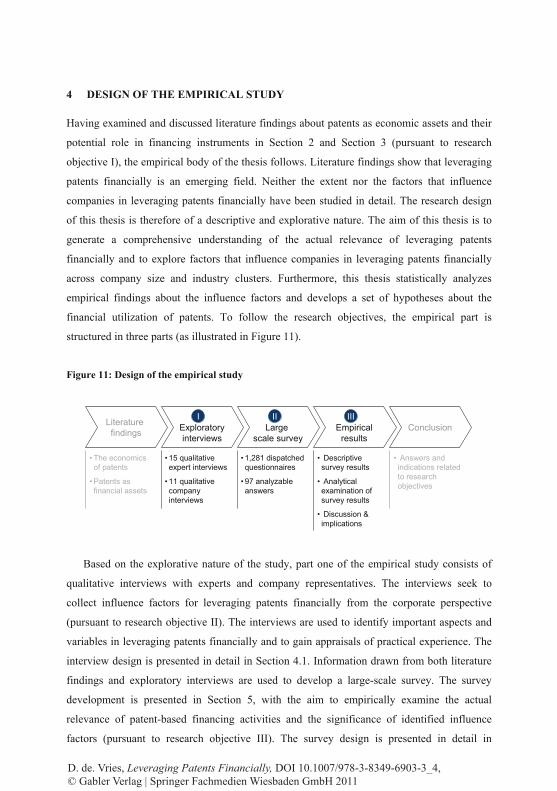
4 DESIGN OF THE EMPIRICAL STUDY Having examined and discussed literature findings about patents as economic assets and their
potential role in financing instruments in Section 2 and Section 3 (pursuant to research
objective I), the empirical body of the thesis follows. Literature findings show that leveraging
patents financially is an emerging field. Neither the extent nor the factors that influence
companies in leveraging patents financially have been studied in detail. The research design
of this thesis is therefore of a descriptive and explorative nature. The aim of this thesis is to
generate a comprehensive understanding of the actual relevance of leveraging patents
financially and to explore factors that influence companies in leveraging patents financially
across company size and industry clusters. Furthermore, this thesis statistically analyzes
empirical findings about the influence factors and develops a set of hypotheses about the
financial utilization of patents. To follow the research objectives, the empirical part is
structured in three parts (as illustrated in Figure 11).
Figure 11: Design of the empirical study
I Exploratoryinterviews
• 15 qualitative expert interviews
• 11 qualitative company interviews
IILarge
scale survey
• 1,281 dispatched questionnaires
• 97 analyzable answers
III Empirical
results
• Descriptive survey results
• Analytical examination of survey results
• Discussion & implications
Literature findings
• The economics of patents
• Patents as financial assets
Conclusion
• Answers and indications related to research objectives
I II III
Based on the explorative nature of the study, part one of the empirical study consists of
qualitative interviews with experts and company representatives. The interviews seek to
collect influence factors for leveraging patents financially from the corporate perspective
(pursuant to research objective II). The interviews are used to identify important aspects and
variables in leveraging patents financially and to gain appraisals of practical experience. The
interview design is presented in detail in Section 4.1. Information drawn from both literature
findings and exploratory interviews are used to develop a large-scale survey. The survey
development is presented in Section 5, with the aim to empirically examine the actual
relevance of patent-based financing activities and the significance of identified influence
factors (pursuant to research objective III). The survey design is presented in detail in
D. de. Vries, Leveraging Patents Financially, DOI 10.1007/978-3-8349-6903-3_4, © Gabler Verlag | Springer Fachmedien Wiesbaden GmbH 2011
85
Section 4.2. The survey's descriptive results are provided in Section 6. The descriptive results
begin with detailed information about the survey sample and are then structured in line with
the survey development in Section 5. Subsequently, the survey results are analyzed
statistically to develop a set of hypotheses about leveraging patents financially from the
corporate perspective (pursuant to research objective IV). Statistical methods used to analyze
the survey results and to develop a set of hypotheses are presented in Section 4.3.
4.1 EXPLORATORY INTERVIEWS
The exploratory interviews complement the information drawn from literature findings,
described in previous chapters, about the untapped field of leveraging patents financially. The
following aspects are addressed in the interviews:
the relevance and potential of leveraging patents financially from a corporate
perspective
existing activities and routines in companies to leverage patents financially
factors (i.e. motives and barriers) that influence companies in leveraging patents
financially
The exploratory interviews took place between September 2007 and December 2007 and
were conducted with company representatives as well as with experts in the fields of patent
management and corporate financing. Each expert or company interview lasted in average
1.5 hours. Due to the potentially sensitive nature of the material, all interview partners were
assured that no specific company data would be published and that all company names would
be kept secret, unless explicitly authorized. Interviews with company representatives
consisted of 11 qualitative on-site and telephone interviews with IP managers, R&D
managers, financial officers, and general managers. The objective in interview partner
selection was to represent all company sizes and industry clusters. Table 13 provides an
overview of the industry sectors and company types covered by the exploratory interview
sample.
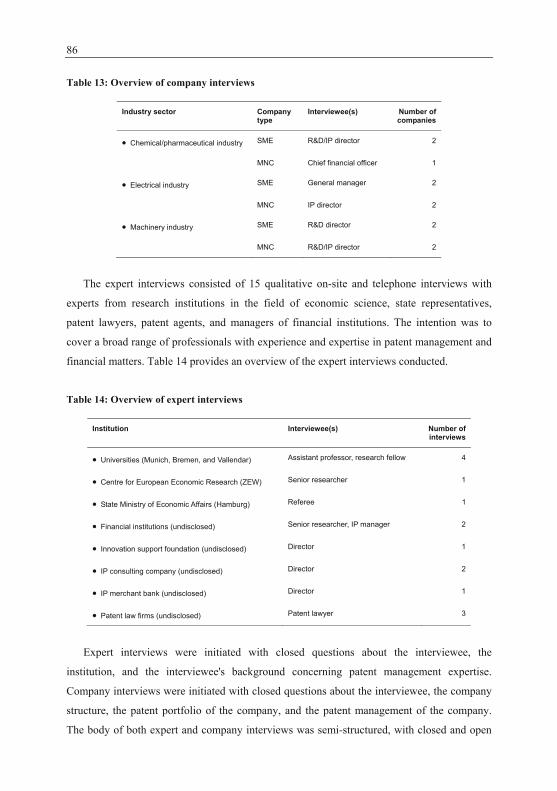
86
Table 13: Overview of company interviews
Industry sector Company type
Interviewee(s) Number of companies
Chemical/pharmaceutical industry SME R&D/IP director 2
MNC Chief financial officer 1
Electrical industry SME General manager 2
MNC IP director 2
Machinery industry SME R&D director 2
MNC R&D/IP director 2
The expert interviews consisted of 15 qualitative on-site and telephone interviews with
experts from research institutions in the field of economic science, state representatives,
patent lawyers, patent agents, and managers of financial institutions. The intention was to
cover a broad range of professionals with experience and expertise in patent management and
financial matters. Table 14 provides an overview of the expert interviews conducted.
Table 14: Overview of expert interviews
Institution Interviewee(s) Number of interviews
Universities (Munich, Bremen, and Vallendar) Assistant professor, research fellow 4
Centre for European Economic Research (ZEW) Senior researcher 1
State Ministry of Economic Affairs (Hamburg) Referee 1
Financial institutions (undisclosed) Senior researcher, IP manager 2
Innovation support foundation (undisclosed) Director 1
IP consulting company (undisclosed) Director 2
IP merchant bank (undisclosed) Director 1
Patent law firms (undisclosed) Patent lawyer 3
Expert interviews were initiated with closed questions about the interviewee, the
institution, and the interviewee's background concerning patent management expertise.
Company interviews were initiated with closed questions about the interviewee, the company
structure, the patent portfolio of the company, and the patent management of the company.
The body of both expert and company interviews was semi-structured, with closed and open
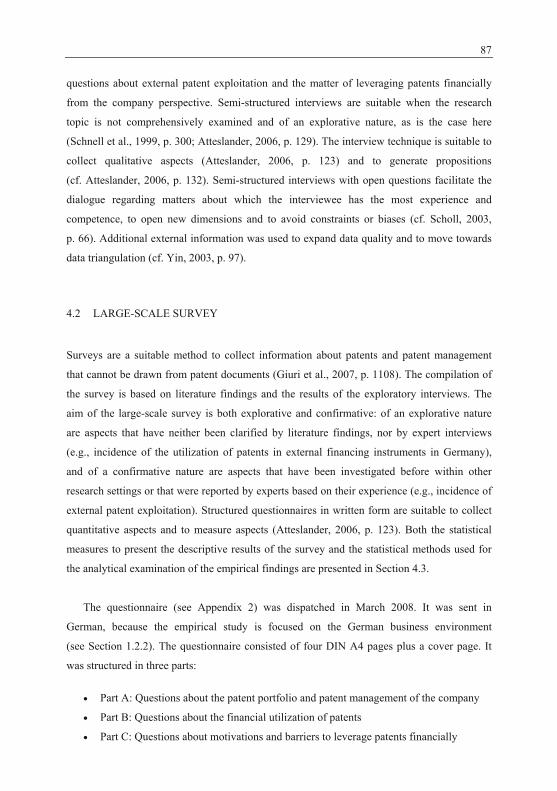
87
questions about external patent exploitation and the matter of leveraging patents financially
from the company perspective. Semi-structured interviews are suitable when the research
topic is not comprehensively examined and of an explorative nature, as is the case here
(Schnell et al., 1999, p. 300; Atteslander, 2006, p. 129). The interview technique is suitable to
collect qualitative aspects (Atteslander, 2006, p. 123) and to generate propositions
(cf. Atteslander, 2006, p. 132). Semi-structured interviews with open questions facilitate the
dialogue regarding matters about which the interviewee has the most experience and
competence, to open new dimensions and to avoid constraints or biases (cf. Scholl, 2003,
p. 66). Additional external information was used to expand data quality and to move towards
data triangulation (cf. Yin, 2003, p. 97).
4.2 LARGE-SCALE SURVEY
Surveys are a suitable method to collect information about patents and patent management
that cannot be drawn from patent documents (Giuri et al., 2007, p. 1108). The compilation of
the survey is based on literature findings and the results of the exploratory interviews. The
aim of the large-scale survey is both explorative and confirmative: of an explorative nature
are aspects that have neither been clarified by literature findings, nor by expert interviews
(e.g., incidence of the utilization of patents in external financing instruments in Germany),
and of a confirmative nature are aspects that have been investigated before within other
research settings or that were reported by experts based on their experience (e.g., incidence of
external patent exploitation). Structured questionnaires in written form are suitable to collect
quantitative aspects and to measure aspects (Atteslander, 2006, p. 123). Both the statistical
measures to present the descriptive results of the survey and the statistical methods used for
the analytical examination of the empirical findings are presented in Section 4.3.
The questionnaire (see Appendix 2) was dispatched in March 2008. It was sent in
German, because the empirical study is focused on the German business environment
(see Section 1.2.2). The questionnaire consisted of four DIN A4 pages plus a cover page. It
was structured in three parts:
Part A: Questions about the patent portfolio and patent management of the company
Part B: Questions about the financial utilization of patents
Part C: Questions about motivations and barriers to leverage patents financially
88
In addition, general questions about the company and the respondents were included. The
questionnaire consisted mostly of closed questions with yes/no answers, percentage
statements, the selection of predefined classifications, and Likert scales. Open questions were
limited to asking for further comments at the end of several sub-sections. Before the
questionnaire was dispatched, several reviews and pre-tests were conducted. The purpose of
the reviews and pre-tests was to check the questionnaire's applicability, completeness, and
processability, particularly concerning the questions' semantic clarity and understandability
(cf. Atteslander, 2006, p. 277ff).
Adjustments of the questionnaire were made according to the review and pre-test results,
which included:
4 reviews by researchers of the Institute for Technology and Innovation Management
at the Hamburg University of Technology
2 reviews by researchers at WHU – Otto Beisheim School of Management
1 review by an expert in the design of social empirical studies at the University
Medical Centre Hamburg-Eppendorf
10 pre-tests with IP directors, R&D directors, financial officers and general managers
of MNCs and SMEs in the chemical/pharmaceutical, electrical, and machinery
industries
The addressee selection process for the large-scale survey consisted of several steps. First,
German companies with patent portfolios were identified based on a DPMA database of all
registered patents. The database was filtered to exclude all patents registered before 1988 so
as to only take valid patents into account. Then, the single patents within the database were
accumulated to patent portfolios of registered companies. To ensure that no nominal
candidates with fairly obsolescent patent portfolios were addressed, the study selected only
companies that had applied for at least five patents within the previous five years. This
selection criterion does not provide any information about the passiveness or progressiveness
of the company's patent management. A bias towards companies with relatively active patent
exploitation efforts is therefore not expected in the sample. The next step was to identify
suitable contact persons in the selected companies in order to ensure the validity and quality
of the answers and to achieve a high response rate. Suitable contact persons were identified
89
with the help of the Hoppenstedt™ database131, which contains information about managerial
responsibility in German companies. For the purpose of the study, chief technology officers,
chief R&D officers, chief financial officers, or chief executive officers were selected.132 The
broad variety of the addressed executives was based on one result of the exploratory
interviews, which showed that there was as yet no distinct field of responsibility for this
research topic in most companies. By matching the filtered DPMA database with available
Hoppenstedt information, a list of 1,281 addressees were identified and contacted. The survey
was limited to a key informant approach instead of a multiple informant approach, due to the
limited number and uncertain assignment of potential respondents within a company
(cf. Lichtenthaler, 2006, p. 150). A critical factor for the response rate was the confidentiality
of many aspects of the survey. In fact, the confidentiality of company-specific information
was guaranteed. To motivate the response, a detailed summary of survey results was
promised. To facilitate the response, the survey was designed for a maximum processing time
of 20 to 25 minutes and was provided in both a hard copy version and an online version. The
survey results are presented in detail in Section 6.
4.3 STATISTICAL MEASURES AND METHODS
The design of the empirical study is both of descriptive and of explorative nature. Due to the
lack of information about the actual distribution of a financial utilization of patents and a lack
of information about the factors that influence the financial utilization of patents, it appeared
inappropriate to draft a comprehensive research design of causal analysis and complex
statistical methods (Atteslander, 2006, p. 264f; Backhaus et al., 2006, p. 11).
The descriptive results of the empirical study are presented with basic statistical measures
such as minimum, maximum, mean, median, and mode. All parameters containing the
variable 'patent value' are expected to be not normally distributed, but highly skewed
(see Section 2.3.1). For skewed data, the median is used as the most accurate representative of
the central tendency of the distribution, while the mean value is of limited expressiveness
(Antonius, 2004, p. 46). The presentation of the descriptive results also includes correlation
131 The HoppenstedtTM database is a commercial German database for company data. For detailed information,
see http://www.hoppenstedt.de/. 132 The assumption underlying the selection was that the addressee was either the best person to answer the
questionnaire or would forward the questionnaire to the person with most experience and responsibility in this regard.
90
coefficients and the analysis of variance (ANOVA). The correlation shows the degree of a
linear interrelation between two variables. It must be noted that correlation does not allow for
causal conclusions, since the variables might be determined by other parameters (Atteslander,
2006, p. 250). Again, it is expected that certain variables containing patent information are not
normally distributed. The profile of the distribution must be tested before correlation
coefficients can be calculated. In cases of normal distribution, a Pearson correlation is used; in
cases of not normally distributed parameters, a Spearman-Rho correlation is used (Vaus,
2002, p. 289). ANOVA is conducted to test whether the mean values of the variables are
equal between specific groups of respondents within the sample, such as company size and
industry clusters (Atteslander, 2006, p. 295). Before conducting ANOVA, the Kolmogorov-
Smirnov test is applied to test whether or not the variables are normally distributed (Hair et
al., 2006, p. 82). In cases of not normally distributed variables, the non-parametric Mann-
Whitney U test is applied to analyze variance for the two samples under consideration (Bühl
and Zöfel, 2000, p. 276), and the Kruskal-Wallis one-way analysis of variance for three and
more samples under consideration (Bühl and Zöfel, 2000, p. 286).
The statistical methods, which are applied in the analytical part of the empirical study, are
based on the conceptual framework introduced in Section 7.1. These include a factor analysis
and a logistic regression. The purpose of the factor analysis is to condense the information
contained in a number of original variables into a smaller set of new, composite dimensions
(called factors) with a minimum loss of information (Backhaus et al., 2006, p. 260). In this
case, the factor analysis is used to condense the various variables queried in the survey (i.e.
influence factors for companies in leveraging patents financially) into a viable number of
factors that can be applied as independent variables in the analytical model. Factor analysis
can be applied from an exploratory or a confirmatory perspective (Backhaus et al., 2006,
p. 330). In an exploratory perspective, factor analysis helps one detect a structure within a set
of variables. In a confirmatory perspective, the researcher tests hypotheses involving the
question as to which variables should be grouped together. Based on the research objective of
identifying variables and the structure of interrelationships among the variables that influence
the financial utilization of patents, the factor analysis was applied from an exploratory
perspective. The estimates of each variable's factors and contributions to the factors are
termed factor loadings, which are used to identify the underlying dimensions and to replace
the original variables with a new set of factors for further analysis (Backhaus et al., 2006,
p. 278). In this thesis, the new set of factors is used as an independent variables set of the
91
analytical model introduced in Section 7.1. A detailed description of the execution of the
factor analysis is presented in Section 7.1.2.
To exercise the analytical model, I apply a logistic regression. Regression methods are
applied for any data analysis concerned with describing the relationship between an outcome
variable (i.e. dependent variable) and one or more explanatory variables (i.e. independent
variables) (see, e.g., Backhaus et al., 2006, p. 9; Hosmer and Lemeshow, 1989, p. 1). What
distinguishes a logistic regression model from linear regression models is that the dependent
variable is not metric but discrete (i.e. binary or dichotomous), as it is the case in the
analytical model of this study (Backhaus et al., 2006, p. 426). In other respects, the logistic
regression follows the same principles and rules used in linear regression. A detailed
description of the execution of the regression, including information about the suitability of
the model, is presented in Section 7.2.

5 DEVELOPMENT OF THE SURVEY The development of the survey is structured according to the outline of the thesis. First,
Section 5.1 deals with the economics of patents and reconsiders asset characteristics of
patents that are important for financial utilization, including a detailed reexamination of the
'value question' and the 'liquidity question' (corresponding to Section 2). Subsequently,
Section 5.2 concentrates on patents as financial assets and develops a scheme to examine a
company's endogenous financial exploitability of patents concerning the specific role of
patents in different external financing instruments (corresponding to Section 3). In
Section 5.3, questions are posed about the actual extent and the future potential of a financial
utilization of patents. Finally, questions about the influence factors (i.e. motives and barriers)
for companies to leverage patents financially, drawn from literature findings and exploratory
interviews, are collected in Section 5.4.
5.1 ASSET CHARACTERISTICS OF PATENTS RECONSIDERED
Of essential interest for financial utilization are an asset's value and liquidity. It is beyond
question that some patents are of high monetary value and externally exploitable. However, a
profound research base provides evidence of a highly skewed value distribution of patents
(see Section 2.3.1). For instance, Scherer and Harhoff (2000, p. 560) find that, in a sample of
772 patents filed at DPMA, 54% of the patents' total value was concentrated in 5 patents
worth EUR 25 million133 or more. To estimate the overall potential of companies to utilize
patents financially, it is important to discern whether patents with high monetary value are
uniformly or unequally distributed across companies' patent portfolios. Unfortunately, no
studies provide information about patent portfolio values at the company level. Exploratory
company interviews and pre-tests have shown that it is usually difficult for respondents to
specify the value of their patent portfolio and that this information is considered confidential.
To facilitate responses, I do not ask for explicit portfolio values; I ask respondents to rank the
portfolio value in one of 8 value classes, ranging from less than EUR 0.5 million to more than
EUR 500 million (see Appendix 2).
133 The currency in Germany was the Deutsche Mark (DM) at the time of the cited study. For reference, I set a
DM-EUR exchange rate of 2:1.
D. de. Vries, Leveraging Patents Financially, DOI 10.1007/978-3-8349-6903-3_5, © Gabler Verlag | Springer Fachmedien Wiesbaden GmbH 2011
93
With survey-based information on the value of patents, this study is based on respondents'
statements, instead of drawing on impartial indirect patent measures as other studies do
(see Section 2.3.1). To consider what information the value statement of the respondents is
based on, I also pose a question about the patent valuation methods used in the company.
Patent valuation is a complex field and itself a research topic (see Section 2.3.2). This study
does not seek to contribute to this field of research. With the specific intention of considering
the accuracy of a respondent's value statement, I differentiate between quantitative-monetary
valuation methods, qualitative-strategic valuation methods, and a lack of patent valuation
methods (see Appendix 2).
Along with the estimated value of the patent portfolio, the potential exploitability of the
patent portfolio is crucial for financial utilization. The exploitability of patents is determined
by three factors: first, the willingness of the patent holder to offer patents and to allow others
to make use of the proprietary right; second, the demand by third parties to make use of the
patent at a reasonable price; third, the transaction cost levels involved. The first two aspects
are covered by asking respondents to report approximately how many patents of the portfolio
might be licensed out or sold in principle. The third aspect – transaction cost levels – is to be
determined by the frequency of patent transactions (see Section 2.4). According to literature
findings, markets for technology are imperfect and many firms experience considerable
difficulties in managing external technology exploitation (see, e.g., Lichtenthaler, 2006, p. 5).
Information about the actual size and the development of markets for technology are very
scarce. Based on the increasing importance of patents within the last two decades, there have
been various surveys about patents and patent management, but with limited European
coverage, and mostly biased in favor of large companies (Giuri et al., 2007, p. 1108). To
reconsider the amount of patent transactions across company size clusters in the German
market environment, two questions are included in the survey: first, a question about the
actual usage of patents (i.e. own use,134 licensing,135 licensing and own use,136
134 The category 'own use' means that the patent is internally exploited for commercial or industrial purposes in a
production process or incorporated in a product or applied to block competitors (cf. Giuri et al., 2007, p. 1118). The PatVal survey distinguishes further between the categories 'internal use' and 'blocking competitors' which are not explicitly included in this study.
135 The category 'licensing' means that the patent is not used internally by the applicant, but is licensed out to another party (Giuri et al., 2007, p. 1118).
136 The category 'licensing and own use' means that the patent is both licensed to another party and used internally by the applicant organization (Giuri et al., 2007, p. 1118).
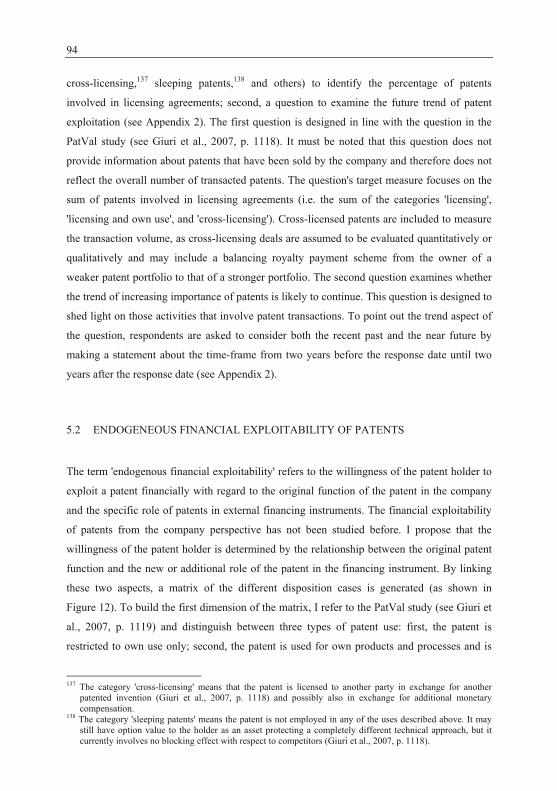
94
cross-licensing,137 sleeping patents,138 and others) to identify the percentage of patents
involved in licensing agreements; second, a question to examine the future trend of patent
exploitation (see Appendix 2). The first question is designed in line with the question in the
PatVal study (see Giuri et al., 2007, p. 1118). It must be noted that this question does not
provide information about patents that have been sold by the company and therefore does not
reflect the overall number of transacted patents. The question's target measure focuses on the
sum of patents involved in licensing agreements (i.e. the sum of the categories 'licensing',
'licensing and own use', and 'cross-licensing'). Cross-licensed patents are included to measure
the transaction volume, as cross-licensing deals are assumed to be evaluated quantitatively or
qualitatively and may include a balancing royalty payment scheme from the owner of a
weaker patent portfolio to that of a stronger portfolio. The second question examines whether
the trend of increasing importance of patents is likely to continue. This question is designed to
shed light on those activities that involve patent transactions. To point out the trend aspect of
the question, respondents are asked to consider both the recent past and the near future by
making a statement about the time-frame from two years before the response date until two
years after the response date (see Appendix 2).
5.2 ENDOGENEOUS FINANCIAL EXPLOITABILITY OF PATENTS
The term 'endogenous financial exploitability' refers to the willingness of the patent holder to
exploit a patent financially with regard to the original function of the patent in the company
and the specific role of patents in external financing instruments. The financial exploitability
of patents from the company perspective has not been studied before. I propose that the
willingness of the patent holder is determined by the relationship between the original patent
function and the new or additional role of the patent in the financing instrument. By linking
these two aspects, a matrix of the different disposition cases is generated (as shown in
Figure 12). To build the first dimension of the matrix, I refer to the PatVal study (see Giuri et
al., 2007, p. 1119) and distinguish between three types of patent use: first, the patent is
restricted to own use only; second, the patent is used for own products and processes and is
137 The category 'cross-licensing' means that the patent is licensed to another party in exchange for another
patented invention (Giuri et al., 2007, p. 1118) and possibly also in exchange for additional monetary compensation.
138 The category 'sleeping patents' means the patent is not employed in any of the uses described above. It may still have option value to the holder as an asset protecting a completely different technical approach, but it currently involves no blocking effect with respect to competitors (Giuri et al., 2007, p. 1118).
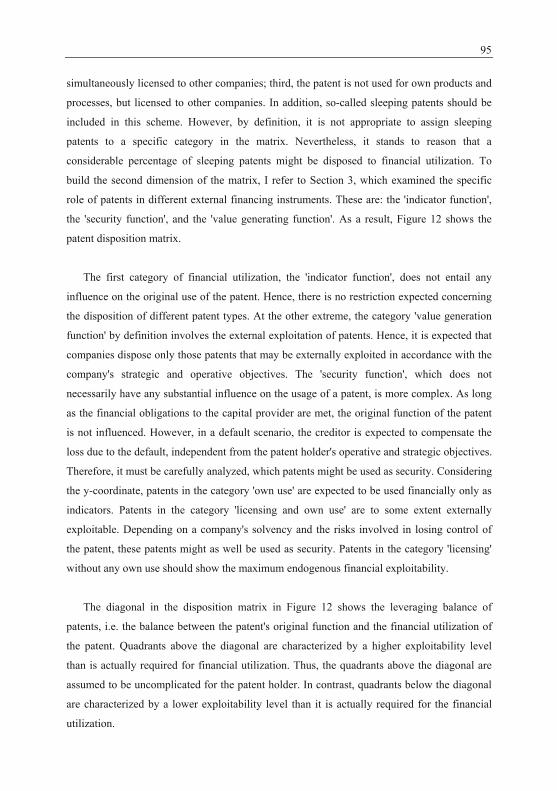
95
simultaneously licensed to other companies; third, the patent is not used for own products and
processes, but licensed to other companies. In addition, so-called sleeping patents should be
included in this scheme. However, by definition, it is not appropriate to assign sleeping
patents to a specific category in the matrix. Nevertheless, it stands to reason that a
considerable percentage of sleeping patents might be disposed to financial utilization. To
build the second dimension of the matrix, I refer to Section 3, which examined the specific
role of patents in different external financing instruments. These are: the 'indicator function',
the 'security function', and the 'value generating function'. As a result, Figure 12 shows the
patent disposition matrix.
The first category of financial utilization, the 'indicator function', does not entail any
influence on the original use of the patent. Hence, there is no restriction expected concerning
the disposition of different patent types. At the other extreme, the category 'value generation
function' by definition involves the external exploitation of patents. Hence, it is expected that
companies dispose only those patents that may be externally exploited in accordance with the
company's strategic and operative objectives. The 'security function', which does not
necessarily have any substantial influence on the usage of a patent, is more complex. As long
as the financial obligations to the capital provider are met, the original function of the patent
is not influenced. However, in a default scenario, the creditor is expected to compensate the
loss due to the default, independent from the patent holder's operative and strategic objectives.
Therefore, it must be carefully analyzed, which patents might be used as security. Considering
the y-coordinate, patents in the category 'own use' are expected to be used financially only as
indicators. Patents in the category 'licensing and own use' are to some extent externally
exploitable. Depending on a company's solvency and the risks involved in losing control of
the patent, these patents might as well be used as security. Patents in the category 'licensing'
without any own use should show the maximum endogenous financial exploitability.
The diagonal in the disposition matrix in Figure 12 shows the leveraging balance of
patents, i.e. the balance between the patent's original function and the financial utilization of
the patent. Quadrants above the diagonal are characterized by a higher exploitability level
than is actually required for financial utilization. Thus, the quadrants above the diagonal are
assumed to be uncomplicated for the patent holder. In contrast, quadrants below the diagonal
are characterized by a lower exploitability level than it is actually required for the financial
utilization.
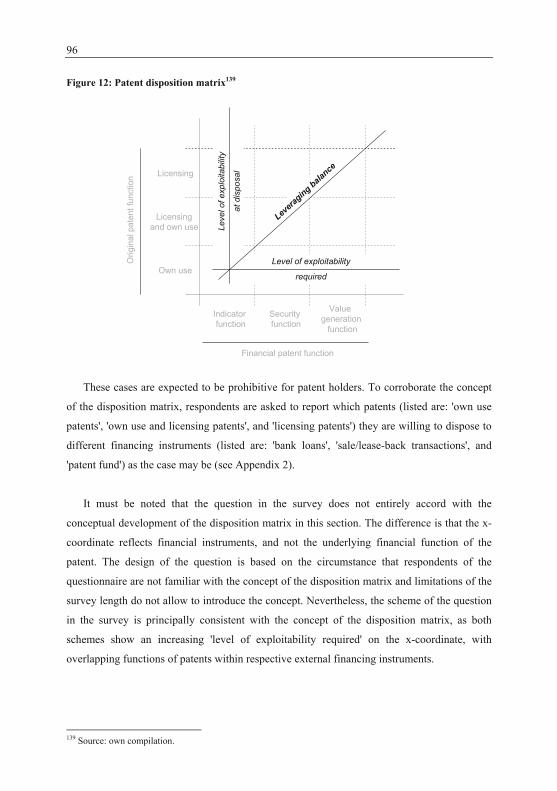
96
Figure 12: Patent disposition matrix139
Indicator function
Security function
Value generation
function
Own use
Licensing and own use
Licensing
Orig
inal
pat
ent f
unct
ion
Financial patent function
Leve
l of e
xplo
itabi
lity
at d
ispo
sal
Level of exploitability
required
Levera
ging balance
These cases are expected to be prohibitive for patent holders. To corroborate the concept
of the disposition matrix, respondents are asked to report which patents (listed are: 'own use
patents', 'own use and licensing patents', and 'licensing patents') they are willing to dispose to
different financing instruments (listed are: 'bank loans', 'sale/lease-back transactions', and
'patent fund') as the case may be (see Appendix 2).
It must be noted that the question in the survey does not entirely accord with the
conceptual development of the disposition matrix in this section. The difference is that the x-
coordinate reflects financial instruments, and not the underlying financial function of the
patent. The design of the question is based on the circumstance that respondents of the
questionnaire are not familiar with the concept of the disposition matrix and limitations of the
survey length do not allow to introduce the concept. Nevertheless, the scheme of the question
in the survey is principally consistent with the concept of the disposition matrix, as both
schemes show an increasing 'level of exploitability required' on the x-coordinate, with
overlapping functions of patents within respective external financing instruments.
139 Source: own compilation.

97
5.3 ACTUAL EXTENT AND POTENTIAL OF LEVERAGING PATENTS
FINANCIALLY
A central objective of the survey is to explore the actual extent and potential of the financial
utilization of patents. According to an OECD publication, firms increasingly exploit patents to
tap into external sources of finance (Kamiyama et al., 2006, p. 20).140 In a detailed study by
Davies (2004, p. 45ff) in the UK, 9% of SMEs reported using IP assets141 as security and 60%
considered using IP assets as security in the future. He also found that 73% of SMEs assume
that IP assets may have a positive influence on lending decisions in principle and that 54%
assume IP assets may have a positive influence on lending terms in principle. In Germany, a
survey by BDO (2007, p. 8) of 150 patenting142 companies revealed that 41% of the
respondents think that access to finance can be enhanced by active patent management, while
53% do not see any impact on corporate financing. In a German study about motives to
patent, Blind et al. (2006, p. 662) found that 26% of the respondents ranked the motivation
factor 'access to the capital market' as of high or very high importance. As a result, the cited
studies indicate that patents are used financially to some extent, but no comprehensive studies
provide detailed information about the actual extent of the financial exploitation, including
details such as the external financing instruments used. To explore the actual extent of the
financial utilization of patents and the specific role of patents in financing instruments,
I include a question in the questionnaire that asks respondents to report whether their
companies use patents in the negotiation of equity transactions, as elements in contracts of
equity transactions, to influence the rating of bank loans, as major/minor securities for bank
loans, in sale/lease-back transactions, or in patent funds. To assess the future potential of the
financial utilization of patents in external financing instruments, a further question is included
in the survey; it asks respondents to report whether they think that patents might be used as
such in the next five years (see Appendix 2).
140 The OECD publication concentrates on a short overview of patent exploitation in venture capital financing, IP
as collateral for bank loans, and IP-backed securitization. Other financing instruments are not considered. 141 The study also includes IP assets such as industrial design rights, copyrights, and trademarks. 142 The companies were holding portfolios with at least 20 patents.

98
5.4 INFLUENCE FACTORS FOR COMPANIES TO LEVERAGE PATENTS
FINANCIALLY
The following section explores influence factors for companies to utilize patents financially.
The collection of factors is based on literature findings and exploratory interviews with
experts and company representatives (see Section 4.1). I use both expert interviews and
company interviews to gather a comprehensive list of aspects. Besides this, company
interviews serve as first indications of the relevance of single aspects. This chapter is
structured as follows: Section 5.4.1 sheds light on financial influence factors, Section 5.4.2
considers factors stemming from the specific asset characteristics of patents, and Section 5.4.3
concentrates on the company-internal perspective.
5.4.1 Financial influence factors
Raising capital is concerned with the integrally related matters of capital structure, capital
volume, and capital costs (cf. Perridon and Steiner, 2004, p. 8). These aspects'
interrelationships are framed in the formula to calculate capital costs as the weighted average
cost of capital, i.e. the average rate of return demanded by investors in the company's debt and
equity securities.143 Equity and debt financing instruments and the role of patents to decrease
capital costs or to increase the amount of capital acquired is presented in Section 3.2. Existing
literature provides few empirical analyses of the motives of patent holders to deploy their
patents in equity or debt financing instruments. Own exploratory interviews indicate that
decreasing capital costs or increasing capital volume are not prevalent motives of patent
holders. Merely 3 of 11 company representatives deploy or intend to deploy patents in this
way. In contrast, 2 company representatives in the chemical/pharmaceutical industry report
that they would leverage patents financially only in a passive form (i.e. as value indicators or
rating factors), and that any loss of control might only be accepted in a financially distressed
situation. For them, patent portfolios are the company's last resort to access external funds.
IP intermediaries' experiences show that most IP holders are generally more interested in
commercializing patents, while financial exploitation in external financing instruments, i.e. to
decrease capital cost or increase capital volume, is only occasionally of interest (cf. Lipfert 143 The formula is introduced in Section 2.2.2.
99
and Keil, 2005, p. 444). Own interviews confirm this experience. While only 3 of 11
interview partners were interested in leveraging their patents in external financing
instruments, 9 of 11 company representatives reported that they are motivated to
commercialize patents to generate additional revenues. To distinguish – in the questionnaire –
between the motives to utilize patents within financing instruments and the motive to
commercialize patents, I include the factors 'acquisition of additional funds' and 'negotiation
of better financing conditions' to test for the former motive and the factor 'better exploitation
of lying idle assets' to test for the latter motive. The commercialization of patents might also
be pursued specifically with the aim of refinancing R&D expenditures; this was explicitly
mentioned by a company representative. Therefore, I also include the motive of a 'quick and
systematic refinancing of R&D expenditures' in the survey.
Beyond the benefit(s) of decreasing capital costs and/or increasing capital volume, the
utilization of patents in equity transactions and sale/lease-back agreements also involves
balancing and tax effects. Especially high-tech companies are affected by a reporting gap and
appear to be handicapped in accessing external funds, because their financial statements show
disproportionately high expenditures (i.e. a relatively weak profit and loss statement), but do
not show that these expenditures are actually invested in assets that constitute the basis for
future cash flow generation. The opportunity to capitalize patents in financial statements
would close the reporting gap of technology-intensive companies to some extent. However,
by releasing hidden reserves, there are tax effects that must also be taken into account.
Referring to Section 3.1, with its description of balancing and tax effects, it turns out that the
capitalization of patents is not necessarily advantageous, but depends on the specific financial
situation of the company. While 2 of 11 interview partners reported that balancing and tax
effects would be beneficial, another 2 of 11 interview partners reported that the effects would
currently be very negative. To test for this motive, I also include 'balancing or tax related
reasons' in the survey.
Further, expert interviews called attention to Basel II regulations. These might lead to an
increasing request by banks for IP assets. Basel II is the second of the Basel Accords issued
by the Basel Committee on Banking Supervision with the intention of creating a standard for
how much equity banks need to have in relation to the risks they face through their lending
and investment operations. Basel II was published in 2004 and has been gradually coming
into effect since the end of 2006. On the one hand, it includes several new risk and capital
management requirements that imply that, the greater the involved risk is, the more capital
100
must be held by the bank to finance the deal. On the other hand, Basel II includes new rating
approaches that might support the valuation of intangibles in credit analysis (Hofmann, 2005,
p. 13; Schedl, 2005, p. 21; Fries, 2006, p. 3). The so-called Advanced Internal Rating-Based
Approach permits the recognition of intellectual property as collateral in the Basel II
regulations (Hofmann, 2005, p. 13). Hence, Basel II assumes that IP becomes more
interesting and attractive for capital providers.144 However, existing literature clearly indicates
that the requirements for banks' valuation and realization are fairly high and might not be
feasible or opportune to be installed (cf. Hofmann, 2005, p. 13). In exploratory interviews of
this study, only one company representative stated that Basel II actually covers the inclusion
of patents in the lending terms of his company. To include this aspect, I include the motive
'changes in the course of the new equity policy for banks (Basel II)' in the survey.
The limited support for motivating factors in exploratory interviews raises the question as
to which factors impede the utilization of patents for external financing. Existing literature
clearly indicates that patents appear to be relatively complex, compared to other financial
assets (see Section 3.3). The complexity of patents might negatively affect the openness and
willingness of capital acquirers and capital providers in general terms, without specific
reason. Companies might feel embarrassed to exploit patents financially, based on the
awareness that capital providers are unwilling to accept IP assets. In fact, a lack of enthusiasm
on the part of capital providers was apparent, for instance, in the EPO public hearings on
Basel II and Patents in 2004 (Kamiyama et al., 2006, p. 20). Among other factors, involved
parties seem aware of the fact that the due diligence and monitoring process is much more
complex and expensive than for most other lending activities. Aspects capital providers
should consider include value, validity, proprietorship, third party rights, potential challenges,
and technical obsolescence (cf. Davies, 2004, p. 63). Commercial banks avoid risk and
generally do not yet have the necessary resources and competencies to value IP assets such as
patents (Hall, 2003, p. 46; European Commission, 2006, p. 5). To implement a complex and
specialized risk management system that allows for the recognition of IP assets as collateral is
a burden for capital providers (cf. Hall, 2003, p. 46). However, if a bank chooses the
standardized rating approach under the new capital rules, it has to make use of external ratings
and cannot realize a competitive advantage by providing the valuation of intangible capital
(Hofmann, 2005, p. 13). In addition, a field experiment with 40 loan officers in Sweden found
that they were reluctant to accept intangibles in the traditional sense and that reliable data 144 Source: Initiative Finanzstandort Deutschland (IFD), see http://www.finanzstandortdeutschland.de/BaseCMP
/pages/contentdelivery?CID=8187&JOB_NAME=DISPLAY_PAGE, accessed 2008/05/14.
101
about intangibles was an essentially important premise for the loan officers to take account of
intangibles in credit decisions (Catasus and Gröjer, 2003, p. 327). The dominant mindset of
many loan officers is to avoid risk and to make credit decisions basically based on financial
track records (Hall, 2003, p. 11). In short, reasons for such reluctance by financial institutions
include investment costs, a cultural gap, and fear of the unknown. As a result, a limited
willingness by capital providers is proposed as a negative factor in general terms. Own
exploratory interviews have shown that limited willingness of capital providers is perceived
as a strongly impeding factor by 5 of 11 interview partners. To explore this aspect, I include
the factor 'lack of interest and willingness of capital providers (banks, investors)' in the
survey.
From the company perspective, leveraging patents financially is costly and requires a
comprehensive decision support system to identify and monitor suitable patents, including an
analysis of the patent environment (Lev, 2003, p. 6). Specifically, holders of large patent
portfolios reported in exploratory interviews that the administration of their IP assets is
already costly and would be inappropriate for more advanced patent management activities,
such as IP financing. Companies might simply remain, with the conviction that they might
have access to more convenient sources of finance, and that they would need to step up
efforts. The study by Davies (2004, p. 51) in the UK shows that 34% of responding SMEs
denied having used IP assets to raise finance, because it had "not been necessary." In this
context, Bittelmeyer et al. (2008, p. 266) suppose that intangible assets are typically utilized
as securities if the company lacks other assets. To validate this argument, they examined the
likelihood that companies that utilized patents as securities were affected by credit refusals
compared to the likelihood of a representative sample of credit refusals. In fact, they found
that the likelihood is approximately 3 times as high for the companies that utilized patents as
security. Own interviews strongly confirm this argument, as 9 of 11 company representatives
explicitly stated that utilizing patents is too complex and complicated, compared with access
to alternative external funds. To test for this aspect, I include the impeding factor 'too
complex/ complicated compared with other funding' in the survey.
Another impeding factor is expected to be the difficulty of valuating patents and the
resulting high deduction for risk. Therefore, the monetary valuation of patents might not be
opportune for patent holders due to the costs involved as well as unfavorable results.
Considering debt financing, the valuation of securities is generally based on the potential
102
exploitation value of the assets. The exploitation value is usually derived from the fair value
of similar assets (Wöhe, 2002, p. 200). Since the exploitation of collateral may yield only a
fraction of the nominal value, creditors usually apply a loan-to-value ratio to set the lending
limit (Gebhardt et al., 1993, p. 421). To minimize credit risk, creditors also include a safety
reduction in the loan-to-value ratio. As a result, the lending limit for mortgages, for example,
is usually between 40% and 80% of their fair value (Wöhe, 2002, p. 200). For IP assets, the
loan-to-value ratio is assumed to be much smaller, as there is no systematic reporting of
previous prices paid – as is the case with mortgages. IP assets are characterized by relatively
high information asymmetries and uncertainties, which are expected to require a higher
lemons premium (see Section 3.2). Within own exploratory interviews, 2 of 11 companies
explicitly stated that an unfavorable deduction for risk impedes their intention to exploit
patents financially. To examine this aspect, I include the factor 'unfavorable assessment of
patent values (deduction for risk)' in the survey.
Another impeding factor might be concerns about the discredit of existing capital
providers. These concerns might be based on hard and soft factors. The hard factors are that
existing securities might essentially be eroded, or that the ordination of existing securities
might be disarranged by new obligations that involve the patent portfolio. This might
particularly be the case if patents are key assets and represent an essential part or function of
the company's asset base. Within the sample of own exploratory interviews, this factor is seen
to be strongly impeding by one chief financial officer. I decide not to explicitly interrogate
this factor in the survey, as it does not apply specifically to patents but to any valuable asset.
Soft factors are concerns that existing or new capital providers might lose confidence in the
company, as patents might be seen as the company's last resort by third parties and the
utilization of patents for external financing instruments might therefore suggest to third
parties that the company is in a critical financial situation. As a result, a negative signaling
effect might negatively affect access to external financial sources. While this factor was not
explicitly mentioned by any company representative in the exploratory interviews, it was
alluded to by an expert involved in consulting to and supporting young, innovative
companies. To explore this aspect, I include the factor 'loss of confidence of existing capital
providers (banks, investors)' in the survey.
103
5.4.2 Asset-related influence factors
Asset-related impeding factors with regard to utilizing patents in external financing
instruments are an integral item in the list of impeding factors collected and examined in this
study. This section addresses asset-related factors explicitly and in greater detail.
Even companies with large and valuable patent portfolios might conclude that their
patents are not suitable to be leveraged financially, due to a variety of reasons. First, the value
distribution of patents is highly skewed, with only a small number of patents being potentially
valuable (see Section 2.3.1). Further, the original use of patents and the associated inhibiting
loss of control, or existing agreements with third parties, might not allow for their financial
exploitation (see Section 5.2). Furthermore, the expiry date of the proprietary rights or swift
technology cycles and rapid technological obsolescence in an industry might not accord with
financing terms. These and many other reasons indicate that a large number of patents might
be regarded as unsuitable to be leveraged financially. In a study conducted in the UK by
Davies (2004, p. 51), 15% of the respondents pointed out a lack of suitable patents as a reason
for not leveraging their patent portfolio financially. Own exploratory interviews found that 8
of 11 companies pointed out a lack of suitable patents as a key factor for not leveraging their
portfolios financially. To examine this aspect, I include the impeding factor 'lack of suitable
patents (expiry date, value, or similar factors)' in the survey.
If patent holders asses their technological assets as suitable, their complex nature –
compared to tangible assets – might still prohibit their financial utilization (cf. Davies, 2006,
p. 574). The most frequently cited impeding factors are difficult valuation, high transaction
costs, and lack of liquidity (see Section 3.3). Empirical findings put these factors into
perspective. For instance, Davies (2004, p. 51) finds that only 3% of the responding SMEs
have not leveraged IP assets due to reasons associated with difficulties in valuation, and only
one of 159 of the relevant respondents explicitly stated that the costs of advice and services
were prohibitive. Within own exploratory interviews, 6 of 11 company representatives
reported that a lack of valuation methods is a strongly impeding factor, while 5 of 11
company representatives reported that the costs for external charges of service providers and
internal expenditures are strongly impeding.145 To examine this aspect, I include the aspects
145 Multiple answers were possible.
104
'lack of suitable valuation methods for patents' and 'high costs (external charges for service
providers and internal expenditures)' in the questionnaire.
Apart from the high costs involved, there might currently also be a lack of qualified
service providers (Kamiyama et al., 2006, p. 20). Lichtenthaler (2006, p. 270) finds that
intermediaries in markets for technologies are used to a very limited degree across industries,
which might indicate that there are not many qualified service providers. Within own
exploratory interviews, 4 of 11 company representatives reported a lack of suitable
intermediaries. To investigate this aspect, I include the factor 'lack of qualified service
providers/intermediaries' in the survey.
Notably, a lack of markets for technology (i.e. a limited patent liquidity) was not
mentioned by any interview partner as a relevant problem. On the contrary, the development
of markets for technology in terms of evolving patent-based business models raised concerns
of several interviewed IP managers. 3 of 11 company representatives explicitly stated that
they do not exploit their patents externally as a matter of principle, because they have serious
concerns that technology-intensive companies are increasingly confronted with the settlement
of patent claims.146 To study these aspects, I include the factor 'lack of markets for technology
to trade patents' and 'troll concern (no participation in external patent exploitation as a matter
of principle)' in the survey.
With regard to the legal treatment of patents, it is also of interest as to whether the
German legal framework is an impeding factor in general terms. According to Davies (2006,
p. 565) "the legal treatment [of IP in the UK] is complex, cumbersome and inconsistent and,
in large measures, the law is unusable from the point of view of sustaining a coherent security
legal regime in IP assets." He argues that IP rights "are concerned with the exploitation of
monopoly by the creators of these rights but the law beyond the licensing of these rights has
not been concerned with the development of these rights into other areas, notably ease of
investment and raising finance on security of this category of property" (Davies, 2004, p. 28).
However, in his study, only one respondent explicitly reported not having leveraged IP assets
financially due to legal restrictions (Davies, 2004, p. 51). Own exploratory interviews do not
support this concern in the German context. Own exploratory interviews show that no experts
146 One interview partner reported that he and his competitors invested much in R&D and little in patents until
recently, but that today, they must all invest much in patent activities, at the expense of R&D investments. In his words, "what is produced are values of patent claims, not products."
105
or company representatives explicitly mentioned that Germany's legal framework impedes
financial utilization of patents. To test for this aspect, I include the factor 'hampering legal
framework' in the survey.
5.4.3 Managerial influence factors
Since many smaller companies are affiliates of large corporations, the authority and
responsibility to utilize patent portfolios financially might be established at the corporate level
and not at the business unit level. During the preparation of own exploratory interviews, this
argument was brought forward by three companies to decline further participation in
interviews. To examine this aspect, I include the factor 'the company is part of a
group/holding that is in charge of patent management' in the survey. Thereby, it must be taken
into account that the questionnaire results are biased, as companies characterized by limited
responsibility might not participate in the study.
Besides authority and responsibility, managers might simply not be aware of the
opportunity to leverage patents financially due to the emerging status of the matter. According
to a discussion paper by the European Commission (2006, p. 4), very few SMEs have used
their IP assets to raise finance, mainly due to a lack of awareness. Davies (2004, p. 51) finds
that 13% of the SMEs in the UK in his sample stated that they are unaware or had never
considered the possibility to leverage IP financially. Borod and Cassidy (2005, p. 55ff) also
emphasize lack of awareness on the part of some US IP holders. By preparing own
exploratory interviews, I observed that there was seldom someone explicitly in charge of the
question to leverage patents financially, or not. While R&D and patent managers are usually
not directly involved in financing matters, financial officers are usually not directly involved
in patent management matters. During the interviews, 4 of 11 interview partners explicitly
stated that the opportunity to leverage patents financially had not yet been considered in their
company. To test for this aspect, I include the factor 'no consideration of the financial option
by the company yet' in the questionnaire.
Associated with a lack of awareness is a lack of resources and knowledge to leverage
patents financially. In the study by Davies (2004, p. 51), 5% of the respondents stated that
they had insufficient knowledge of IP transactions. Within own exploratory interviews, 5 of
11 company representatives stated that a lack of methods and resources currently substantially
106
impedes financial utilization of patents. To study this aspect, I include the factor 'lack of
methods and resources in the company' in the survey.
A lack of methods and resources does not have to be the result of little awareness, but
might well be the result of other administrative obstacles within a company. As noted, the
interdisciplinary character of a financial utilization of patents involves active collaboration
between IP managers and financial managers. Impeding factors might be internal
communication barriers as well as internal managerial resistance. Internal communication
barriers are often characterized as implicit. Managerial resistance is characterized by both
explicit and tacit factors. A specific managerial reason mentioned by one interview partner
was that the financial utilization of patents might lead to patent value transparency, which
might raise demands for compensation by employed inventors within the company. Other
explicit reasons against technology exploitation are discussed in detail in Section 2.4.1. Tacit
managerial resistance might also derive from phenomena analogous to the not-invented-here
syndrome. Within own exploratory interviews, unintentional communication barriers were
reported by 3 of 11 company representatives, and managerial resistance by 2 of 11 company
representatives. To examine these aspects, I include the factors 'internal communication
barriers between responsible departments' and 'internal managerial barriers (business policy
reasons)' in the questionnaire.
Besides internal barriers, managers might also refrain from leveraging patents financially
due to negative signaling effects towards stake-holders. Just as negative signals might be
avoided with regard to capital providers (see above), managers might be concerned about
causing negative signals towards other company stake holders. Within own exploratory
interviews, 2 of 11 company representatives reported that a loss of reputation in relation to
customers, suppliers, and competitors is a strongly impeding factor to leverage patents
financially. To study this aspect, I include the factor 'loss of reputation with regard to
customers, suppliers, and competitors in the survey. I provide a detailed description of the
survey results in the following section (Section 6).

6 DESCRIPTIVE RESULTS OF THE EMPIRICAL STUDY
The descriptive results of the empirical study are structured in line with the development of
the survey in Section 5. After a description of the survey sample in Section 6.1, the empirical
results on asset characteristics of patents are presented and compared to previous research
findings in Section 6.2. At this point, the uncharted and untapped field of leveraging patents
financially is explored, as Section 6.3 contains descriptive results about the financial
exploitability of patents from a company perspective. Section 6.4 provides the first
quantitative empirical results on the actual extent and potential of the financial utilization of
patents in Germany. The descriptive part proceeds with detailed information about empirical
measures of influence factors for companies to leverage patents financially in Section 6.5.
This chapter closes with a summary of major descriptive findings in Section 6.6.
6.1 DESCRIPTION OF THE SURVEY SAMPLE
The questionnaire was sent to 1,281 selected companies in Germany in the chemical/
pharmaceutical, machinery, and electrical industries.147 With 117 returned questionnaires in
total, the response rate was 9.13%. Of the 117 responses, 20 questionnaires turned out to be
unworkable, and 97 questionnaires were analyzable. Given the survey's sensitive and complex
nature, the response rate has met expectations.148 I will now provide a detailed description of
the data sample.
Approximately two-thirds of the respondents are senior IP or R&D managers (as shown in
Figure 13). Although the topic is closely related to the field of corporate financing, only 4.7%
of the respondents are financial managers. The small percentage of financial managers and the
predominance of R&D and IP managers among the respondents indicate that the matter of
leveraging patents financially is unusual in the field of corporate financing, located rather in
the sphere of IP and R&D managers.
147 The selection was based on the criterion that the company has applied at least five patents within the previous
five years and was limited by available contact data of suitable contact persons within the target companies. 148 Both the information about corporate financing activities as well as about patent management activities are
usually treated as highly confidential (see, e.g., Lichtenthaler, 2006, p. 152).
D. de. Vries, Leveraging Patents Financially, DOI 10.1007/978-3-8349-6903-3_6, © Gabler Verlag | Springer Fachmedien Wiesbaden GmbH 2011
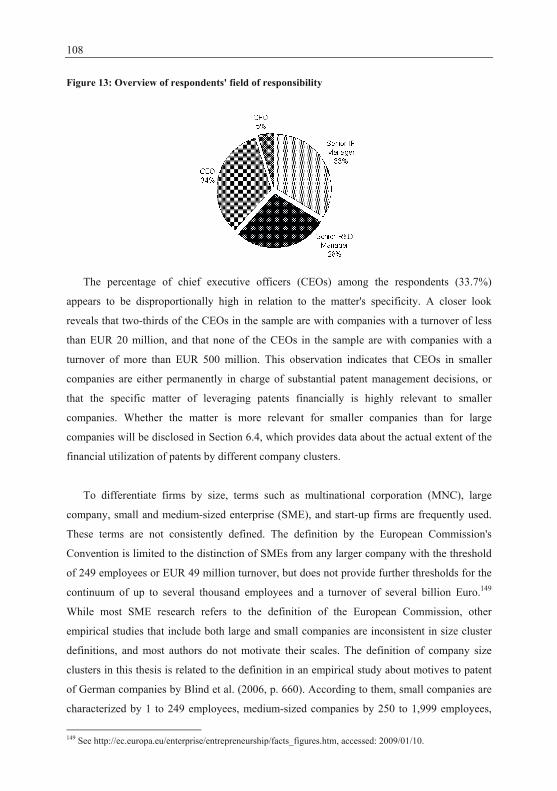
108
Figure 13: Overview of respondents' field of responsibility
The percentage of chief executive officers (CEOs) among the respondents (33.7%)
appears to be disproportionally high in relation to the matter's specificity. A closer look
reveals that two-thirds of the CEOs in the sample are with companies with a turnover of less
than EUR 20 million, and that none of the CEOs in the sample are with companies with a
turnover of more than EUR 500 million. This observation indicates that CEOs in smaller
companies are either permanently in charge of substantial patent management decisions, or
that the specific matter of leveraging patents financially is highly relevant to smaller
companies. Whether the matter is more relevant for smaller companies than for large
companies will be disclosed in Section 6.4, which provides data about the actual extent of the
financial utilization of patents by different company clusters.
To differentiate firms by size, terms such as multinational corporation (MNC), large
company, small and medium-sized enterprise (SME), and start-up firms are frequently used.
These terms are not consistently defined. The definition by the European Commission's
Convention is limited to the distinction of SMEs from any larger company with the threshold
of 249 employees or EUR 49 million turnover, but does not provide further thresholds for the
continuum of up to several thousand employees and a turnover of several billion Euro.149
While most SME research refers to the definition of the European Commission, other
empirical studies that include both large and small companies are inconsistent in size cluster
definitions, and most authors do not motivate their scales. The definition of company size
clusters in this thesis is related to the definition in an empirical study about motives to patent
of German companies by Blind et al. (2006, p. 660). According to them, small companies are
characterized by 1 to 249 employees, medium-sized companies by 250 to 1,999 employees,
149 See http://ec.europa.eu/enterprise/entrepreneurship/facts_figures.htm, accessed: 2009/01/10.
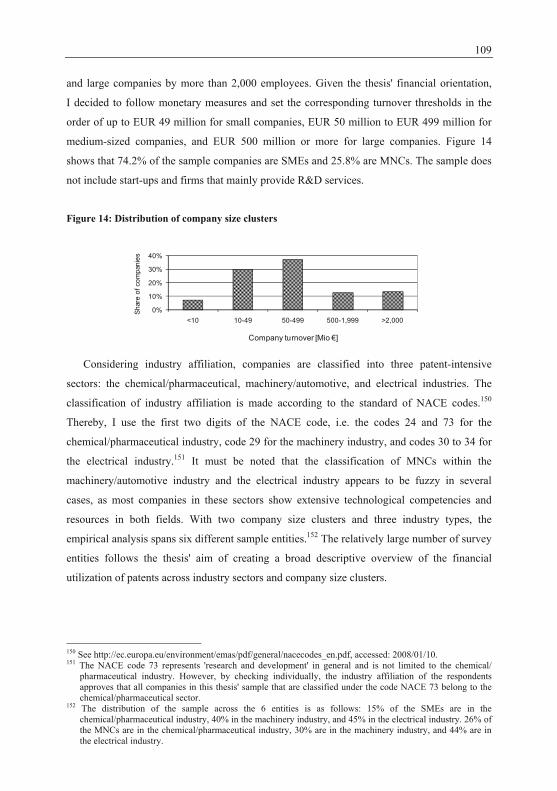
109
and large companies by more than 2,000 employees. Given the thesis' financial orientation,
I decided to follow monetary measures and set the corresponding turnover thresholds in the
order of up to EUR 49 million for small companies, EUR 50 million to EUR 499 million for
medium-sized companies, and EUR 500 million or more for large companies. Figure 14
shows that 74.2% of the sample companies are SMEs and 25.8% are MNCs. The sample does
not include start-ups and firms that mainly provide R&D services.
Figure 14: Distribution of company size clusters
0%
10%
20%
30%
40%
<10 10-49 50-499 500-1,999 >2,000
Shar
e of
com
pani
es
Company turnover [Mio €]
Considering industry affiliation, companies are classified into three patent-intensive
sectors: the chemical/pharmaceutical, machinery/automotive, and electrical industries. The
classification of industry affiliation is made according to the standard of NACE codes.150
Thereby, I use the first two digits of the NACE code, i.e. the codes 24 and 73 for the
chemical/pharmaceutical industry, code 29 for the machinery industry, and codes 30 to 34 for
the electrical industry.151 It must be noted that the classification of MNCs within the
machinery/automotive industry and the electrical industry appears to be fuzzy in several
cases, as most companies in these sectors show extensive technological competencies and
resources in both fields. With two company size clusters and three industry types, the
empirical analysis spans six different sample entities.152 The relatively large number of survey
entities follows the thesis' aim of creating a broad descriptive overview of the financial
utilization of patents across industry sectors and company size clusters.
150 See http://ec.europa.eu/environment/emas/pdf/general/nacecodes_en.pdf, accessed: 2008/01/10. 151 The NACE code 73 represents 'research and development' in general and is not limited to the chemical/
pharmaceutical industry. However, by checking individually, the industry affiliation of the respondents approves that all companies in this thesis' sample that are classified under the code NACE 73 belong to the chemical/pharmaceutical sector.
152 The distribution of the sample across the 6 entities is as follows: 15% of the SMEs are in the chemical/pharmaceutical industry, 40% in the machinery industry, and 45% in the electrical industry. 26% of the MNCs are in the chemical/pharmaceutical industry, 30% are in the machinery industry, and 44% are in the electrical industry.
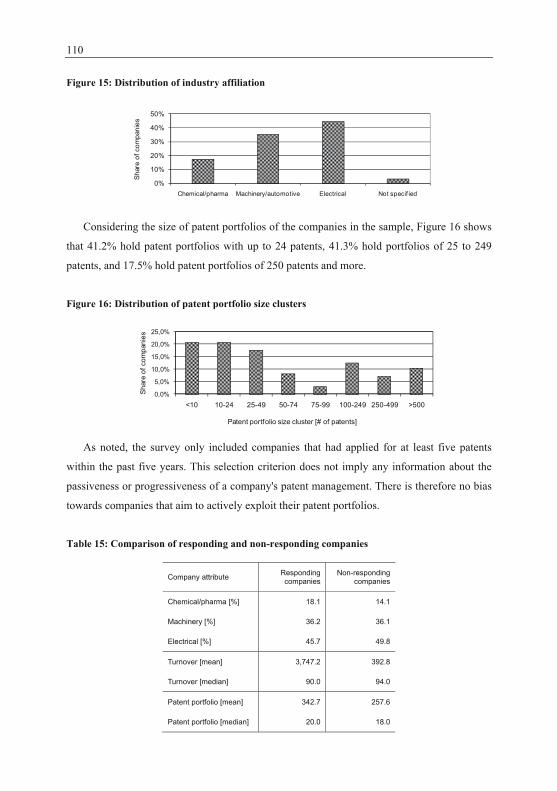
110
Figure 15: Distribution of industry affiliation
0%
10%
20%
30%
40%
50%
Chemical/pharma Machinery/automotive Electrical Not specif ied
Shar
e of
com
pani
es
Considering the size of patent portfolios of the companies in the sample, Figure 16 shows
that 41.2% hold patent portfolios with up to 24 patents, 41.3% hold portfolios of 25 to 249
patents, and 17.5% hold patent portfolios of 250 patents and more.
Figure 16: Distribution of patent portfolio size clusters
0,0%
5,0%
10,0%
15,0%
20,0%
25,0%
<10 10-24 25-49 50-74 75-99 100-249 250-499 >500
Shar
e of
com
pani
es
Patent portfolio size cluster [# of patents]
As noted, the survey only included companies that had applied for at least five patents
within the past five years. This selection criterion does not imply any information about the
passiveness or progressiveness of a company's patent management. There is therefore no bias
towards companies that aim to actively exploit their patent portfolios.
Table 15: Comparison of responding and non-responding companies
Company attribute Responding companies
Non-responding companies
Chemical/pharma [%] 18.1 14.1
Machinery [%] 36.2 36.1
Electrical [%] 45.7 49.8
Turnover [mean] 3,747.2 392.8
Turnover [median] 90.0 94.0
Patent portfolio [mean] 342.7 257.6
Patent portfolio [median] 20.0 18.0
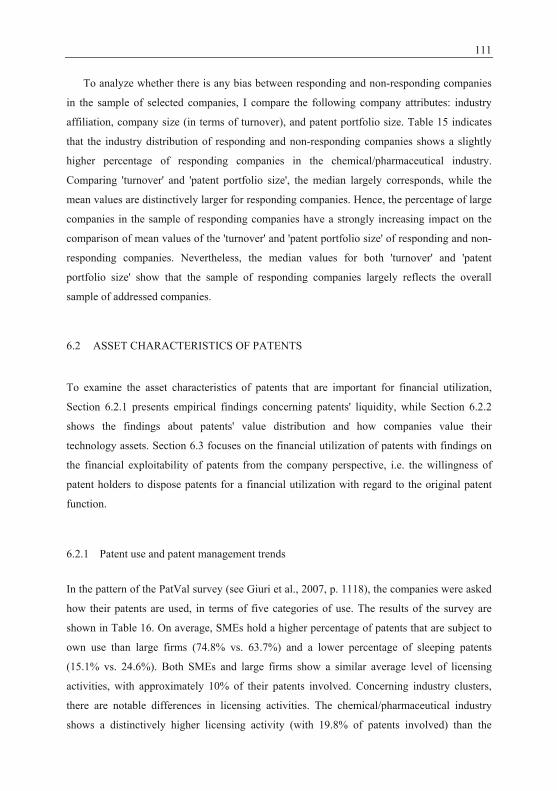
111
To analyze whether there is any bias between responding and non-responding companies
in the sample of selected companies, I compare the following company attributes: industry
affiliation, company size (in terms of turnover), and patent portfolio size. Table 15 indicates
that the industry distribution of responding and non-responding companies shows a slightly
higher percentage of responding companies in the chemical/pharmaceutical industry.
Comparing 'turnover' and 'patent portfolio size', the median largely corresponds, while the
mean values are distinctively larger for responding companies. Hence, the percentage of large
companies in the sample of responding companies have a strongly increasing impact on the
comparison of mean values of the 'turnover' and 'patent portfolio size' of responding and non-
responding companies. Nevertheless, the median values for both 'turnover' and 'patent
portfolio size' show that the sample of responding companies largely reflects the overall
sample of addressed companies.
6.2 ASSET CHARACTERISTICS OF PATENTS
To examine the asset characteristics of patents that are important for financial utilization,
Section 6.2.1 presents empirical findings concerning patents' liquidity, while Section 6.2.2
shows the findings about patents' value distribution and how companies value their
technology assets. Section 6.3 focuses on the financial utilization of patents with findings on
the financial exploitability of patents from the company perspective, i.e. the willingness of
patent holders to dispose patents for a financial utilization with regard to the original patent
function.
6.2.1 Patent use and patent management trends
In the pattern of the PatVal survey (see Giuri et al., 2007, p. 1118), the companies were asked
how their patents are used, in terms of five categories of use. The results of the survey are
shown in Table 16. On average, SMEs hold a higher percentage of patents that are subject to
own use than large firms (74.8% vs. 63.7%) and a lower percentage of sleeping patents
(15.1% vs. 24.6%). Both SMEs and large firms show a similar average level of licensing
activities, with approximately 10% of their patents involved. Concerning industry clusters,
there are notable differences in licensing activities. The chemical/pharmaceutical industry
shows a distinctively higher licensing activity (with 19.8% of patents involved) than the
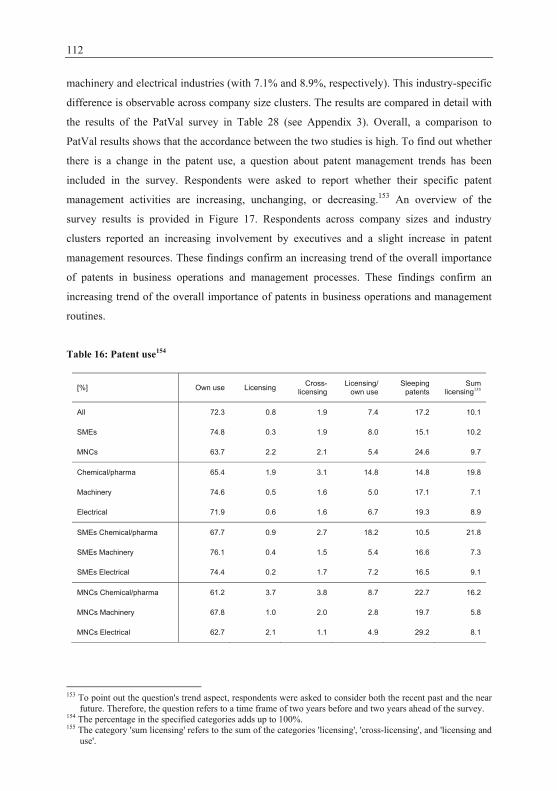
112
machinery and electrical industries (with 7.1% and 8.9%, respectively). This industry-specific
difference is observable across company size clusters. The results are compared in detail with
the results of the PatVal survey in Table 28 (see Appendix 3). Overall, a comparison to
PatVal results shows that the accordance between the two studies is high. To find out whether
there is a change in the patent use, a question about patent management trends has been
included in the survey. Respondents were asked to report whether their specific patent
management activities are increasing, unchanging, or decreasing.153 An overview of the
survey results is provided in Figure 17. Respondents across company sizes and industry
clusters reported an increasing involvement by executives and a slight increase in patent
management resources. These findings confirm an increasing trend of the overall importance
of patents in business operations and management processes. These findings confirm an
increasing trend of the overall importance of patents in business operations and management
routines.
Table 16: Patent use154
[%] Own use Licensing Cross-licensing
Licensing/ own use
Sleeping patents
Sum licensing155
All 72.3 0.8 1.9 7.4 17.2 10.1
SMEs 74.8 0.3 1.9 8.0 15.1 10.2
MNCs 63.7 2.2 2.1 5.4 24.6 9.7
Chemical/pharma 65.4 1.9 3.1 14.8 14.8 19.8
Machinery 74.6 0.5 1.6 5.0 17.1 7.1
Electrical 71.9 0.6 1.6 6.7 19.3 8.9
SMEs Chemical/pharma 67.7 0.9 2.7 18.2 10.5 21.8
SMEs Machinery 76.1 0.4 1.5 5.4 16.6 7.3
SMEs Electrical 74.4 0.2 1.7 7.2 16.5 9.1
MNCs Chemical/pharma 61.2 3.7 3.8 8.7 22.7 16.2
MNCs Machinery 67.8 1.0 2.0 2.8 19.7 5.8
MNCs Electrical 62.7 2.1 1.1 4.9 29.2 8.1
153 To point out the question's trend aspect, respondents were asked to consider both the recent past and the near
future. Therefore, the question refers to a time frame of two years before and two years ahead of the survey. 154 The percentage in the specified categories adds up to 100%. 155 The category 'sum licensing' refers to the sum of the categories 'licensing', 'cross-licensing', and 'licensing and
use'.
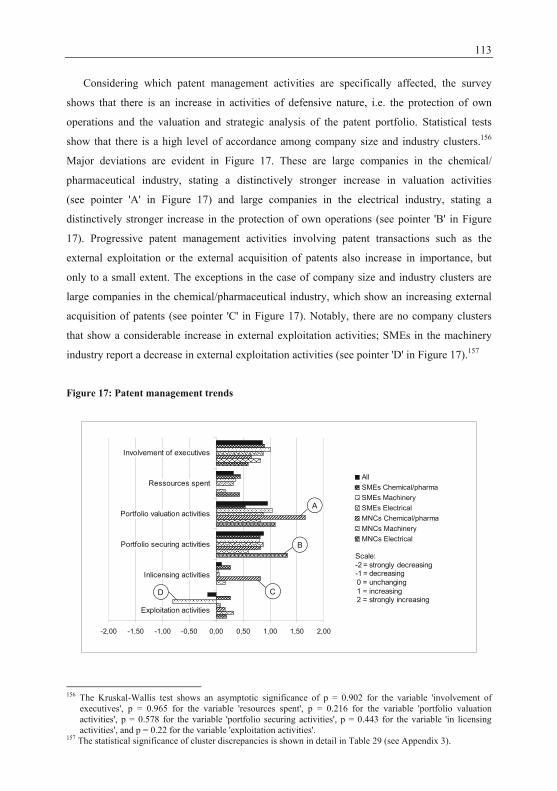
113
Considering which patent management activities are specifically affected, the survey
shows that there is an increase in activities of defensive nature, i.e. the protection of own
operations and the valuation and strategic analysis of the patent portfolio. Statistical tests
show that there is a high level of accordance among company size and industry clusters.156
Major deviations are evident in Figure 17. These are large companies in the chemical/
pharmaceutical industry, stating a distinctively stronger increase in valuation activities
(see pointer 'A' in Figure 17) and large companies in the electrical industry, stating a
distinctively stronger increase in the protection of own operations (see pointer 'B' in Figure
17). Progressive patent management activities involving patent transactions such as the
external exploitation or the external acquisition of patents also increase in importance, but
only to a small extent. The exceptions in the case of company size and industry clusters are
large companies in the chemical/pharmaceutical industry, which show an increasing external
acquisition of patents (see pointer 'C' in Figure 17). Notably, there are no company clusters
that show a considerable increase in external exploitation activities; SMEs in the machinery
industry report a decrease in external exploitation activities (see pointer 'D' in Figure 17).157
Figure 17: Patent management trends
Scale:-2 strongly decreasing-1 decreasing 0 unchanging 1 increasing 2 strongly increasing
-2,00 -1,50 -1,00 -0,50 0,00 0,50 1,00 1,50 2,00
Exploitation activities
Inlicensing activities
Portfolio securing activities
Portfolio valuation activities
Ressources spent
Involvement of executives
AllSMEs Chemical/pharmaSMEs MachinerySMEs ElectricalMNCs Chemical/pharmaMNCs MachineryMNCs Electrical
A
B
CD
Scale:-2 = strongly decreasing-1 = decreasing0 = unchanging1 = increasing2 = strongly increasing
156 The Kruskal-Wallis test shows an asymptotic significance of p = 0.902 for the variable 'involvement of
executives', p = 0.965 for the variable 'resources spent', p = 0.216 for the variable 'portfolio valuation activities', p = 0.578 for the variable 'portfolio securing activities', p = 0.443 for the variable 'in licensing activities', and p = 0.22 for the variable 'exploitation activities'.
157 The statistical significance of cluster discrepancies is shown in detail in Table 29 (see Appendix 3).
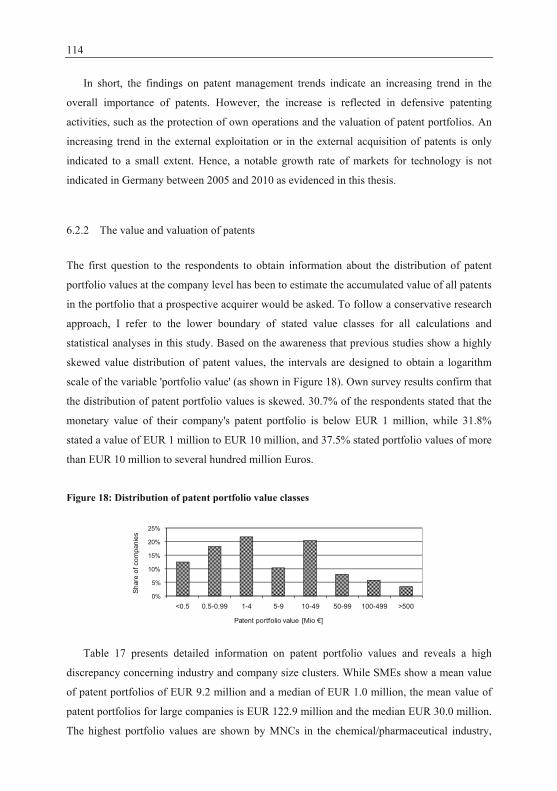
114
In short, the findings on patent management trends indicate an increasing trend in the
overall importance of patents. However, the increase is reflected in defensive patenting
activities, such as the protection of own operations and the valuation of patent portfolios. An
increasing trend in the external exploitation or in the external acquisition of patents is only
indicated to a small extent. Hence, a notable growth rate of markets for technology is not
indicated in Germany between 2005 and 2010 as evidenced in this thesis.
6.2.2 The value and valuation of patents
The first question to the respondents to obtain information about the distribution of patent
portfolio values at the company level has been to estimate the accumulated value of all patents
in the portfolio that a prospective acquirer would be asked. To follow a conservative research
approach, I refer to the lower boundary of stated value classes for all calculations and
statistical analyses in this study. Based on the awareness that previous studies show a highly
skewed value distribution of patent values, the intervals are designed to obtain a logarithm
scale of the variable 'portfolio value' (as shown in Figure 18). Own survey results confirm that
the distribution of patent portfolio values is skewed. 30.7% of the respondents stated that the
monetary value of their company's patent portfolio is below EUR 1 million, while 31.8%
stated a value of EUR 1 million to EUR 10 million, and 37.5% stated portfolio values of more
than EUR 10 million to several hundred million Euros.
Figure 18: Distribution of patent portfolio value classes
0%
5%
10%
15%
20%
25%
<0.5 0.5-0.99 1-4 5-9 10-49 50-99 100-499 >500
Shar
e of
com
pani
es
Patent portfolio value [Mio €]
Table 17 presents detailed information on patent portfolio values and reveals a high
discrepancy concerning industry and company size clusters. While SMEs show a mean value
of patent portfolios of EUR 9.2 million and a median of EUR 1.0 million, the mean value of
patent portfolios for large companies is EUR 122.9 million and the median EUR 30.0 million.
The highest portfolio values are shown by MNCs in the chemical/pharmaceutical industry,
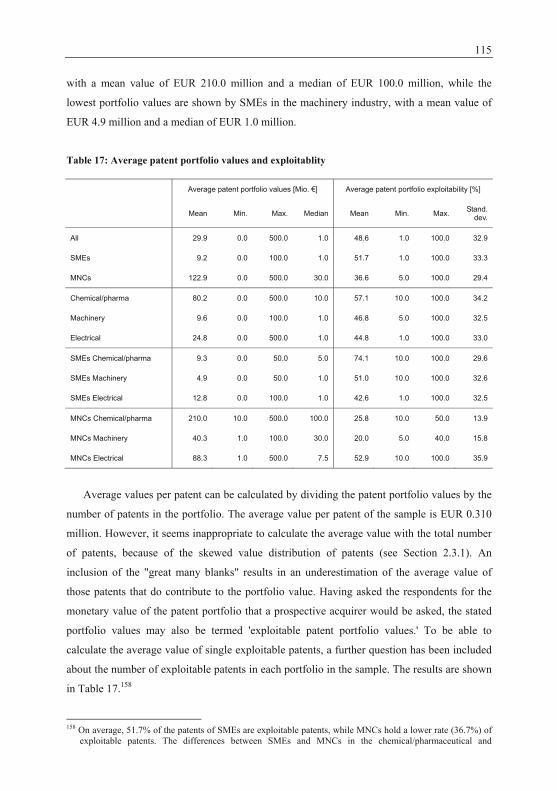
115
with a mean value of EUR 210.0 million and a median of EUR 100.0 million, while the
lowest portfolio values are shown by SMEs in the machinery industry, with a mean value of
EUR 4.9 million and a median of EUR 1.0 million.
Table 17: Average patent portfolio values and exploitablity Average patent portfolio values [Mio. €] Average patent portfolio exploitability [%]
Mean Min. Max. Median Mean Min. Max. Stand. dev.
All 29.9 0.0 500.0 1.0 48.6 1.0 100.0 32.9
SMEs 9.2 0.0 100.0 1.0 51.7 1.0 100.0 33.3
MNCs 122.9 0.0 500.0 30.0 36.6 5.0 100.0 29.4
Chemical/pharma 80.2 0.0 500.0 10.0 57.1 10.0 100.0 34.2
Machinery 9.6 0.0 100.0 1.0 46.8 5.0 100.0 32.5
Electrical 24.8 0.0 500.0 1.0 44.8 1.0 100.0 33.0
SMEs Chemical/pharma 9.3 0.0 50.0 5.0 74.1 10.0 100.0 29.6
SMEs Machinery 4.9 0.0 50.0 1.0 51.0 10.0 100.0 32.6
SMEs Electrical 12.8 0.0 100.0 1.0 42.6 1.0 100.0 32.5
MNCs Chemical/pharma 210.0 10.0 500.0 100.0 25.8 10.0 50.0 13.9
MNCs Machinery 40.3 1.0 100.0 30.0 20.0 5.0 40.0 15.8
MNCs Electrical 88.3 1.0 500.0 7.5 52.9 10.0 100.0 35.9
Average values per patent can be calculated by dividing the patent portfolio values by the
number of patents in the portfolio. The average value per patent of the sample is EUR 0.310
million. However, it seems inappropriate to calculate the average value with the total number
of patents, because of the skewed value distribution of patents (see Section 2.3.1). An
inclusion of the "great many blanks" results in an underestimation of the average value of
those patents that do contribute to the portfolio value. Having asked the respondents for the
monetary value of the patent portfolio that a prospective acquirer would be asked, the stated
portfolio values may also be termed 'exploitable patent portfolio values.' To be able to
calculate the average value of single exploitable patents, a further question has been included
about the number of exploitable patents in each portfolio in the sample. The results are shown
in Table 17.158
158 On average, 51.7% of the patents of SMEs are exploitable patents, while MNCs hold a lower rate (36.7%) of
exploitable patents. The differences between SMEs and MNCs in the chemical/pharmaceutical and
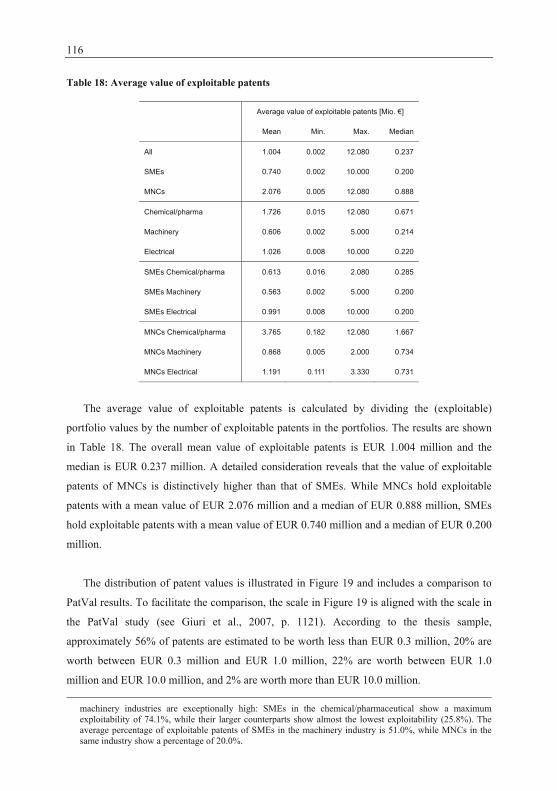
116
Table 18: Average value of exploitable patents
Average value of exploitable patents [Mio. €]
Mean Min. Max. Median
All 1.004 0.002 12.080 0.237
SMEs 0.740 0.002 10.000 0.200
MNCs 2.076 0.005 12.080 0.888
Chemical/pharma 1.726 0.015 12.080 0.671
Machinery 0.606 0.002 5.000 0.214
Electrical 1.026 0.008 10.000 0.220
SMEs Chemical/pharma 0.613 0.016 2.080 0.285
SMEs Machinery 0.563 0.002 5.000 0.200
SMEs Electrical 0.991 0.008 10.000 0.200
MNCs Chemical/pharma 3.765 0.182 12.080 1.667
MNCs Machinery 0.868 0.005 2.000 0.734
MNCs Electrical 1.191 0.111 3.330 0.731
The average value of exploitable patents is calculated by dividing the (exploitable)
portfolio values by the number of exploitable patents in the portfolios. The results are shown
in Table 18. The overall mean value of exploitable patents is EUR 1.004 million and the
median is EUR 0.237 million. A detailed consideration reveals that the value of exploitable
patents of MNCs is distinctively higher than that of SMEs. While MNCs hold exploitable
patents with a mean value of EUR 2.076 million and a median of EUR 0.888 million, SMEs
hold exploitable patents with a mean value of EUR 0.740 million and a median of EUR 0.200
million.
The distribution of patent values is illustrated in Figure 19 and includes a comparison to
PatVal results. To facilitate the comparison, the scale in Figure 19 is aligned with the scale in
the PatVal study (see Giuri et al., 2007, p. 1121). According to the thesis sample,
approximately 56% of patents are estimated to be worth less than EUR 0.3 million, 20% are
worth between EUR 0.3 million and EUR 1.0 million, 22% are worth between EUR 1.0
million and EUR 10.0 million, and 2% are worth more than EUR 10.0 million.
machinery industries are exceptionally high: SMEs in the chemical/pharmaceutical show a maximum exploitability of 74.1%, while their larger counterparts show almost the lowest exploitability (25.8%). The average percentage of exploitable patents of SMEs in the machinery industry is 51.0%, while MNCs in the same industry show a percentage of 20.0%.
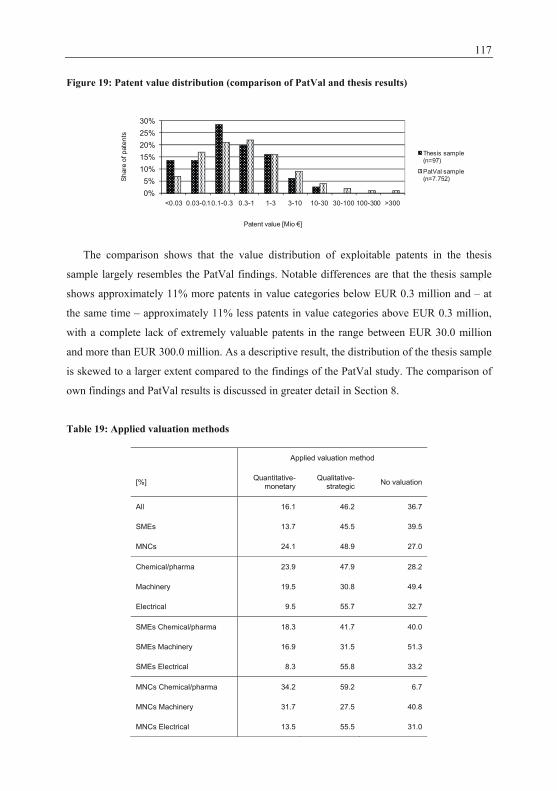
117
Figure 19: Patent value distribution (comparison of PatVal and thesis results)
0%5%
10%15%20%25%30%
<0.03 0.03-0.10.1-0.3 0.3-1 1-3 3-10 10-30 30-100 100-300 >300
Shar
e of
pat
ents
Patent value [Mio €]
Thesis sample (n=97)
PatVal sample (n=7.752)
The comparison shows that the value distribution of exploitable patents in the thesis
sample largely resembles the PatVal findings. Notable differences are that the thesis sample
shows approximately 11% more patents in value categories below EUR 0.3 million and – at
the same time – approximately 11% less patents in value categories above EUR 0.3 million,
with a complete lack of extremely valuable patents in the range between EUR 30.0 million
and more than EUR 300.0 million. As a descriptive result, the distribution of the thesis sample
is skewed to a larger extent compared to the findings of the PatVal study. The comparison of
own findings and PatVal results is discussed in greater detail in Section 8.
Table 19: Applied valuation methods
Applied valuation method
[%] Quantitative-monetary
Qualitative-strategic No valuation
All 16.1 46.2 36.7
SMEs 13.7 45.5 39.5
MNCs 24.1 48.9 27.0
Chemical/pharma 23.9 47.9 28.2
Machinery 19.5 30.8 49.4
Electrical 9.5 55.7 32.7
SMEs Chemical/pharma 18.3 41.7 40.0
SMEs Machinery 16.9 31.5 51.3
SMEs Electrical 8.3 55.8 33.2
MNCs Chemical/pharma 34.2 59.2 6.7
MNCs Machinery 31.7 27.5 40.8
MNCs Electrical 13.5 55.5 31.0
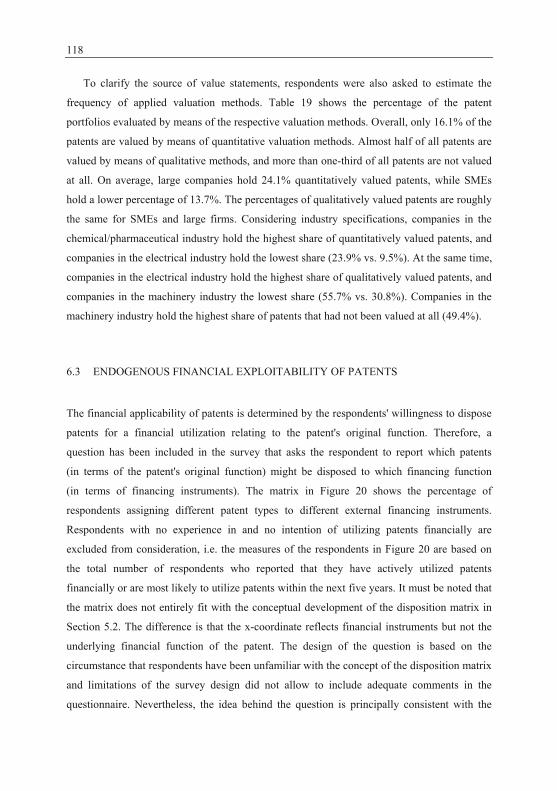
118
To clarify the source of value statements, respondents were also asked to estimate the
frequency of applied valuation methods. Table 19 shows the percentage of the patent
portfolios evaluated by means of the respective valuation methods. Overall, only 16.1% of the
patents are valued by means of quantitative valuation methods. Almost half of all patents are
valued by means of qualitative methods, and more than one-third of all patents are not valued
at all. On average, large companies hold 24.1% quantitatively valued patents, while SMEs
hold a lower percentage of 13.7%. The percentages of qualitatively valued patents are roughly
the same for SMEs and large firms. Considering industry specifications, companies in the
chemical/pharmaceutical industry hold the highest share of quantitatively valued patents, and
companies in the electrical industry hold the lowest share (23.9% vs. 9.5%). At the same time,
companies in the electrical industry hold the highest share of qualitatively valued patents, and
companies in the machinery industry the lowest share (55.7% vs. 30.8%). Companies in the
machinery industry hold the highest share of patents that had not been valued at all (49.4%).
6.3 ENDOGENOUS FINANCIAL EXPLOITABILITY OF PATENTS
The financial applicability of patents is determined by the respondents' willingness to dispose
patents for a financial utilization relating to the patent's original function. Therefore, a
question has been included in the survey that asks the respondent to report which patents
(in terms of the patent's original function) might be disposed to which financing function
(in terms of financing instruments). The matrix in Figure 20 shows the percentage of
respondents assigning different patent types to different external financing instruments.
Respondents with no experience in and no intention of utilizing patents financially are
excluded from consideration, i.e. the measures of the respondents in Figure 20 are based on
the total number of respondents who reported that they have actively utilized patents
financially or are most likely to utilize patents within the next five years. It must be noted that
the matrix does not entirely fit with the conceptual development of the disposition matrix in
Section 5.2. The difference is that the x-coordinate reflects financial instruments but not the
underlying financial function of the patent. The design of the question is based on the
circumstance that respondents have been unfamiliar with the concept of the disposition matrix
and limitations of the survey design did not allow to include adequate comments in the
questionnaire. Nevertheless, the idea behind the question is principally consistent with the
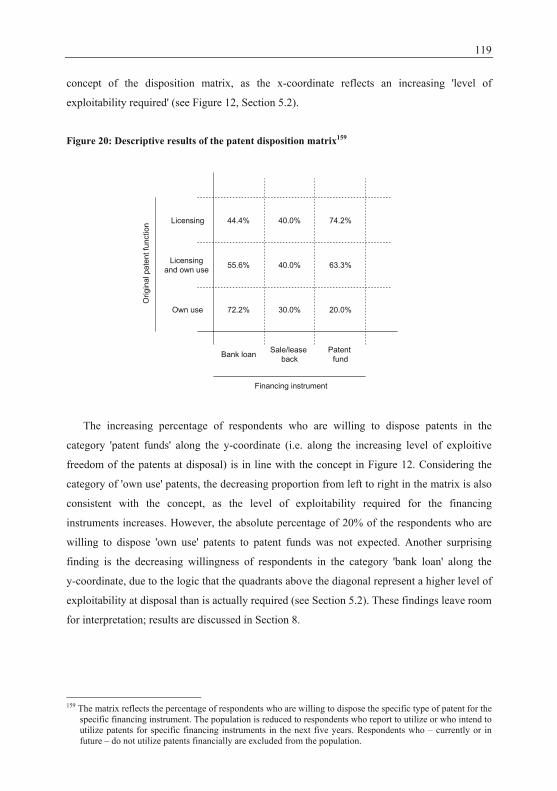
119
concept of the disposition matrix, as the x-coordinate reflects an increasing 'level of
exploitability required' (see Figure 12, Section 5.2).
Figure 20: Descriptive results of the patent disposition matrix159
Bank loan Sale/lease back
Patent fund
Own use
Licensing and own use
Licensing
72.2% 30.0% 20.0%
55.6% 40.0% 63.3%
44.4% 40.0% 74.2%
Orig
inal
pat
ent f
unct
ion
Financing instrument
The increasing percentage of respondents who are willing to dispose patents in the
category 'patent funds' along the y-coordinate (i.e. along the increasing level of exploitive
freedom of the patents at disposal) is in line with the concept in Figure 12. Considering the
category of 'own use' patents, the decreasing proportion from left to right in the matrix is also
consistent with the concept, as the level of exploitability required for the financing
instruments increases. However, the absolute percentage of 20% of the respondents who are
willing to dispose 'own use' patents to patent funds was not expected. Another surprising
finding is the decreasing willingness of respondents in the category 'bank loan' along the
y-coordinate, due to the logic that the quadrants above the diagonal represent a higher level of
exploitability at disposal than is actually required (see Section 5.2). These findings leave room
for interpretation; results are discussed in Section 8.
159 The matrix reflects the percentage of respondents who are willing to dispose the specific type of patent for the
specific financing instrument. The population is reduced to respondents who report to utilize or who intend to utilize patents for specific financing instruments in the next five years. Respondents who – currently or in future – do not utilize patents financially are excluded from the population.
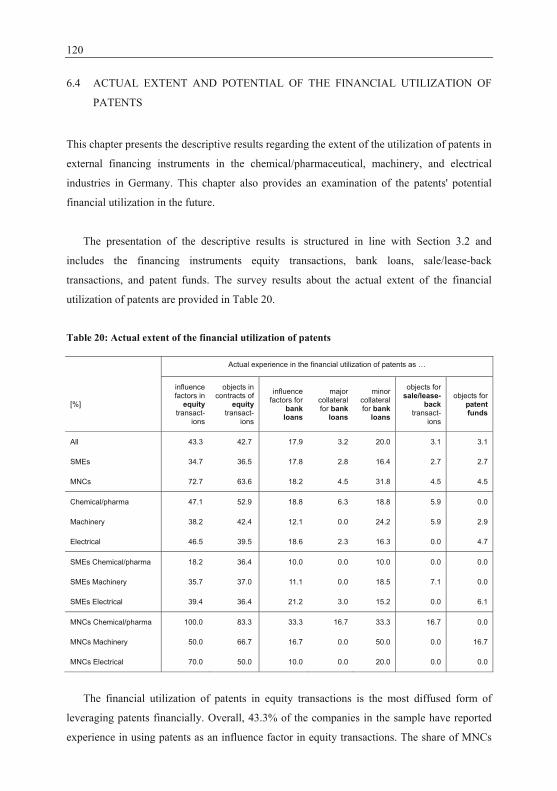
120
6.4 ACTUAL EXTENT AND POTENTIAL OF THE FINANCIAL UTILIZATION OF
PATENTS
This chapter presents the descriptive results regarding the extent of the utilization of patents in
external financing instruments in the chemical/pharmaceutical, machinery, and electrical
industries in Germany. This chapter also provides an examination of the patents' potential
financial utilization in the future.
The presentation of the descriptive results is structured in line with Section 3.2 and
includes the financing instruments equity transactions, bank loans, sale/lease-back
transactions, and patent funds. The survey results about the actual extent of the financial
utilization of patents are provided in Table 20.
Table 20: Actual extent of the financial utilization of patents Actual experience in the financial utilization of patents as …
[%]
influence factors in
equity transact-
ions
objects in contracts of
equity transact-
ions
influence factors for
bank loans
major collateral for bank
loans
minor collateral for bank
loans
objects for sale/lease-
back transact-
ions
objects for patent funds
All 43.3 42.7 17.9 3.2 20.0 3.1 3.1
SMEs 34.7 36.5 17.8 2.8 16.4 2.7 2.7
MNCs 72.7 63.6 18.2 4.5 31.8 4.5 4.5
Chemical/pharma 47.1 52.9 18.8 6.3 18.8 5.9 0.0
Machinery 38.2 42.4 12.1 0.0 24.2 5.9 2.9
Electrical 46.5 39.5 18.6 2.3 16.3 0.0 4.7
SMEs Chemical/pharma 18.2 36.4 10.0 0.0 10.0 0.0 0.0
SMEs Machinery 35.7 37.0 11.1 0.0 18.5 7.1 0.0
SMEs Electrical 39.4 36.4 21.2 3.0 15.2 0.0 6.1
MNCs Chemical/pharma 100.0 83.3 33.3 16.7 33.3 16.7 0.0
MNCs Machinery 50.0 66.7 16.7 0.0 50.0 0.0 16.7
MNCs Electrical 70.0 50.0 10.0 0.0 20.0 0.0 0.0
The financial utilization of patents in equity transactions is the most diffused form of
leveraging patents financially. Overall, 43.3% of the companies in the sample have reported
experience in using patents as an influence factor in equity transactions. The share of MNCs

121
reporting patent utilization for equity transactions is 72.7%, much higher than the share of
SMEs (34.7%). Considering the form of patent utilization in equity transactions, patents are
frequently both factors in the negotiation and objects of transactions. Notably, more SMEs in
the chemical/pharmaceutical industry reported that their patents had been objects of a
transaction than SMEs that reported that their patents had been influence factors in the
negotiation of the equity deal. The same applies to a smaller extent to companies in the
machinery industry. This observation indicates that patents may also be objects of equity
deals without having a perceived effect on the terms and conditions of the deal. Considering
company size and industry specifications, the most striking difference is observed in the
chemical/pharmaceutical industry. While 100.0% of MNCs in this industry cluster reported
patent use as an influence factor in equity transactions, merely 36.2% of the SMEs in the
chemical/pharmaceutical industry reported to utilize patents in equity transactions.
The overall percentage of companies with experience in utilizing patents to acquire bank
loans is 17.9%. Notably, the overall percentage of MNCs and SMEs is equivalent. There are
some differences between industry clusters. On the one hand, MNCs in the chemical/
pharmaceutical industry and SMEs in the electrical industry show above-average experience
(at 33.3% and 21.2%, respectively). On the other hand, SMEs in the chemical/pharmaceutical
industry and MNCs in the electrical industry show below-average experience, at 10.0% each.
Considering the form of utilization, the survey distinguished between the utilization of patents
as a major security or as a minor security, i.e. as the primary security for a bank loan, or as a
security in addition to other assets. Table 20 shows that only an overall share of 3.2% of the
companies in the sample reported leveraging patents as major collateral to date. These
observations are concentrated in the clusters of MNCs in the chemical/pharmaceutical
industry and of SMEs in the electrical industry. None of the companies in the machinery
industry had used patents as major collateral to date. In contrast, patents are frequently used as
minor collateral, at an overall percentage of 20.0%. Notably, the percentage of MNCs that had
used patents as minor collateral is distinctively higher than among SMEs. It must also be
noted that, especially in the machinery industry, the number of companies utilizing patents as
minor collateral is higher than the number of companies that influence the terms and
conditions of bank loans. As a result, several companies do use patents as collateral for bank
loans but report that patents have no influence on the volume or conditions of the bank loans.
This observation may indicate that companies do not provide patents as securities on their
own, but that banks require the inclusion of patents as securities in lending contracts.
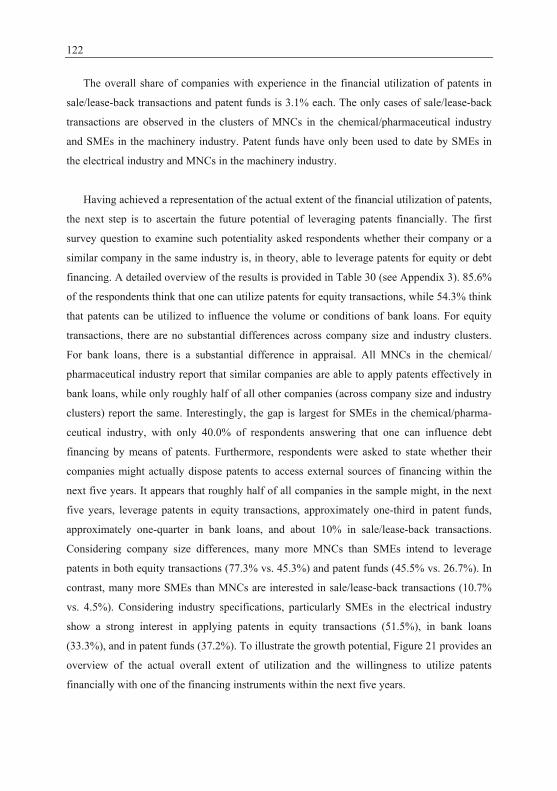
122
The overall share of companies with experience in the financial utilization of patents in
sale/lease-back transactions and patent funds is 3.1% each. The only cases of sale/lease-back
transactions are observed in the clusters of MNCs in the chemical/pharmaceutical industry
and SMEs in the machinery industry. Patent funds have only been used to date by SMEs in
the electrical industry and MNCs in the machinery industry.
Having achieved a representation of the actual extent of the financial utilization of patents,
the next step is to ascertain the future potential of leveraging patents financially. The first
survey question to examine such potentiality asked respondents whether their company or a
similar company in the same industry is, in theory, able to leverage patents for equity or debt
financing. A detailed overview of the results is provided in Table 30 (see Appendix 3). 85.6%
of the respondents think that one can utilize patents for equity transactions, while 54.3% think
that patents can be utilized to influence the volume or conditions of bank loans. For equity
transactions, there are no substantial differences across company size and industry clusters.
For bank loans, there is a substantial difference in appraisal. All MNCs in the chemical/
pharmaceutical industry report that similar companies are able to apply patents effectively in
bank loans, while only roughly half of all other companies (across company size and industry
clusters) report the same. Interestingly, the gap is largest for SMEs in the chemical/pharma-
ceutical industry, with only 40.0% of respondents answering that one can influence debt
financing by means of patents. Furthermore, respondents were asked to state whether their
companies might actually dispose patents to access external sources of financing within the
next five years. It appears that roughly half of all companies in the sample might, in the next
five years, leverage patents in equity transactions, approximately one-third in patent funds,
approximately one-quarter in bank loans, and about 10% in sale/lease-back transactions.
Considering company size differences, many more MNCs than SMEs intend to leverage
patents in both equity transactions (77.3% vs. 45.3%) and patent funds (45.5% vs. 26.7%). In
contrast, many more SMEs than MNCs are interested in sale/lease-back transactions (10.7%
vs. 4.5%). Considering industry specifications, particularly SMEs in the electrical industry
show a strong interest in applying patents in equity transactions (51.5%), in bank loans
(33.3%), and in patent funds (37.2%). To illustrate the growth potential, Figure 21 provides an
overview of the actual overall extent of utilization and the willingness to utilize patents
financially with one of the financing instruments within the next five years.
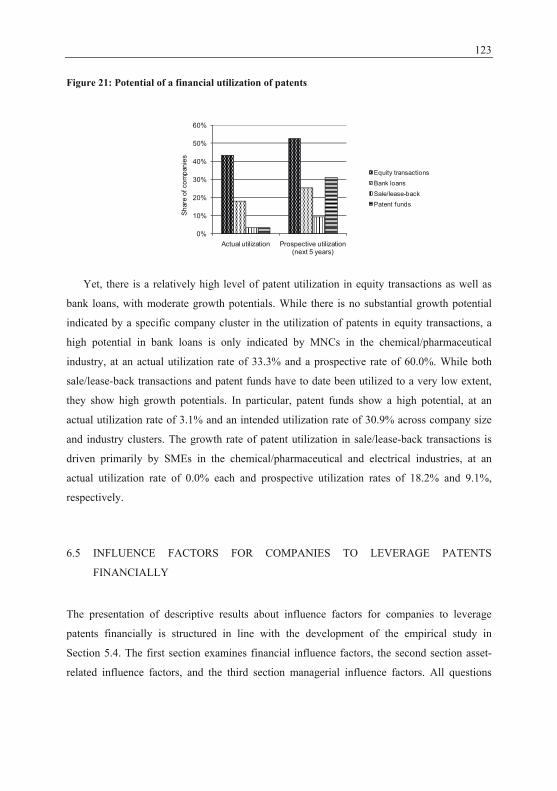
123
Figure 21: Potential of a financial utilization of patents
0%
10%
20%
30%
40%
50%
60%
Actual utilization Prospective utilization (next 5 years)
Shar
e of
com
pani
es
Equity transactionsBank loansSale/lease-backPatent funds
Yet, there is a relatively high level of patent utilization in equity transactions as well as
bank loans, with moderate growth potentials. While there is no substantial growth potential
indicated by a specific company cluster in the utilization of patents in equity transactions, a
high potential in bank loans is only indicated by MNCs in the chemical/pharmaceutical
industry, at an actual utilization rate of 33.3% and a prospective rate of 60.0%. While both
sale/lease-back transactions and patent funds have to date been utilized to a very low extent,
they show high growth potentials. In particular, patent funds show a high potential, at an
actual utilization rate of 3.1% and an intended utilization rate of 30.9% across company size
and industry clusters. The growth rate of patent utilization in sale/lease-back transactions is
driven primarily by SMEs in the chemical/pharmaceutical and electrical industries, at an
actual utilization rate of 0.0% each and prospective utilization rates of 18.2% and 9.1%,
respectively.
6.5 INFLUENCE FACTORS FOR COMPANIES TO LEVERAGE PATENTS
FINANCIALLY
The presentation of descriptive results about influence factors for companies to leverage
patents financially is structured in line with the development of the empirical study in
Section 5.4. The first section examines financial influence factors, the second section asset-
related influence factors, and the third section managerial influence factors. All questions
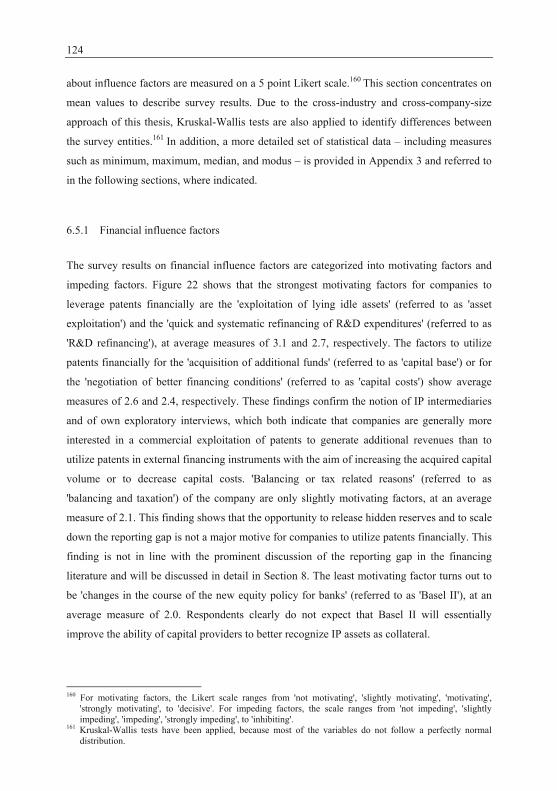
124
about influence factors are measured on a 5 point Likert scale.160 This section concentrates on
mean values to describe survey results. Due to the cross-industry and cross-company-size
approach of this thesis, Kruskal-Wallis tests are also applied to identify differences between
the survey entities.161 In addition, a more detailed set of statistical data – including measures
such as minimum, maximum, median, and modus – is provided in Appendix 3 and referred to
in the following sections, where indicated.
6.5.1 Financial influence factors
The survey results on financial influence factors are categorized into motivating factors and
impeding factors. Figure 22 shows that the strongest motivating factors for companies to
leverage patents financially are the 'exploitation of lying idle assets' (referred to as 'asset
exploitation') and the 'quick and systematic refinancing of R&D expenditures' (referred to as
'R&D refinancing'), at average measures of 3.1 and 2.7, respectively. The factors to utilize
patents financially for the 'acquisition of additional funds' (referred to as 'capital base') or for
the 'negotiation of better financing conditions' (referred to as 'capital costs') show average
measures of 2.6 and 2.4, respectively. These findings confirm the notion of IP intermediaries
and of own exploratory interviews, which both indicate that companies are generally more
interested in a commercial exploitation of patents to generate additional revenues than to
utilize patents in external financing instruments with the aim of increasing the acquired capital
volume or to decrease capital costs. 'Balancing or tax related reasons' (referred to as
'balancing and taxation') of the company are only slightly motivating factors, at an average
measure of 2.1. This finding shows that the opportunity to release hidden reserves and to scale
down the reporting gap is not a major motive for companies to utilize patents financially. This
finding is not in line with the prominent discussion of the reporting gap in the financing
literature and will be discussed in detail in Section 8. The least motivating factor turns out to
be 'changes in the course of the new equity policy for banks' (referred to as 'Basel II'), at an
average measure of 2.0. Respondents clearly do not expect that Basel II will essentially
improve the ability of capital providers to better recognize IP assets as collateral.
160 For motivating factors, the Likert scale ranges from 'not motivating', 'slightly motivating', 'motivating',
'strongly motivating', to 'decisive'. For impeding factors, the scale ranges from 'not impeding', 'slightly impeding', 'impeding', 'strongly impeding', to 'inhibiting'.
161 Kruskal-Wallis tests have been applied, because most of the variables do not follow a perfectly normal distribution.
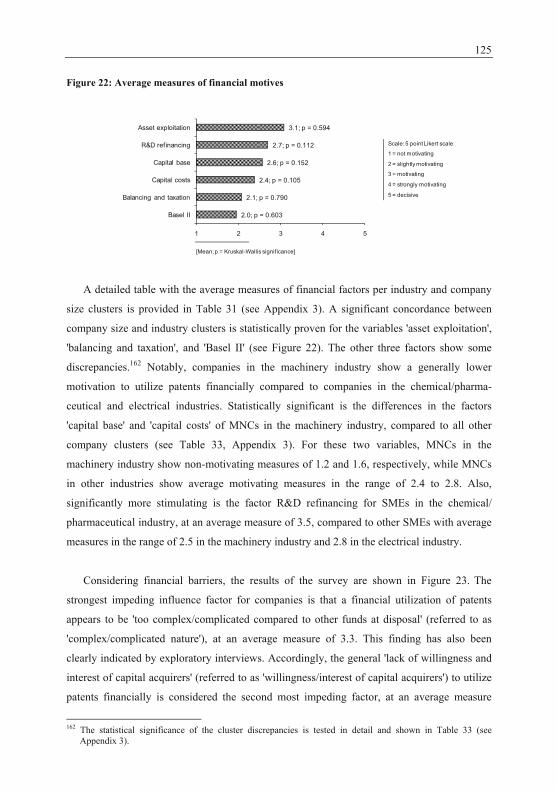
125
Figure 22: Average measures of financial motives
2.0; p = 0.603
2.1; p = 0.790
2.4; p = 0.105
2.6; p = 0.152
2.7; p = 0.112
3.1; p = 0.594
1 2 3 4 5
Basel II
Balancing and taxation
Capital costs
Capital base
R&D refinancing
Asset exploitation
[Mean; p = Kruskal-Wallis significance]
Scale: 5 point Likert scale
1 = not motivating
2 = slightly motivating
3 = motivating
4 = strongly motivating
5 = decisive
A detailed table with the average measures of financial factors per industry and company
size clusters is provided in Table 31 (see Appendix 3). A significant concordance between
company size and industry clusters is statistically proven for the variables 'asset exploitation',
'balancing and taxation', and 'Basel II' (see Figure 22). The other three factors show some
discrepancies.162 Notably, companies in the machinery industry show a generally lower
motivation to utilize patents financially compared to companies in the chemical/pharma-
ceutical and electrical industries. Statistically significant is the differences in the factors
'capital base' and 'capital costs' of MNCs in the machinery industry, compared to all other
company clusters (see Table 33, Appendix 3). For these two variables, MNCs in the
machinery industry show non-motivating measures of 1.2 and 1.6, respectively, while MNCs
in other industries show average motivating measures in the range of 2.4 to 2.8. Also,
significantly more stimulating is the factor R&D refinancing for SMEs in the chemical/
pharmaceutical industry, at an average measure of 3.5, compared to other SMEs with average
measures in the range of 2.5 in the machinery industry and 2.8 in the electrical industry.
Considering financial barriers, the results of the survey are shown in Figure 23. The
strongest impeding influence factor for companies is that a financial utilization of patents
appears to be 'too complex/complicated compared to other funds at disposal' (referred to as
'complex/complicated nature'), at an average measure of 3.3. This finding has also been
clearly indicated by exploratory interviews. Accordingly, the general 'lack of willingness and
interest of capital acquirers' (referred to as 'willingness/interest of capital acquirers') to utilize
patents financially is considered the second most impeding factor, at an average measure
162 The statistical significance of the cluster discrepancies is tested in detail and shown in Table 33 (see
Appendix 3).
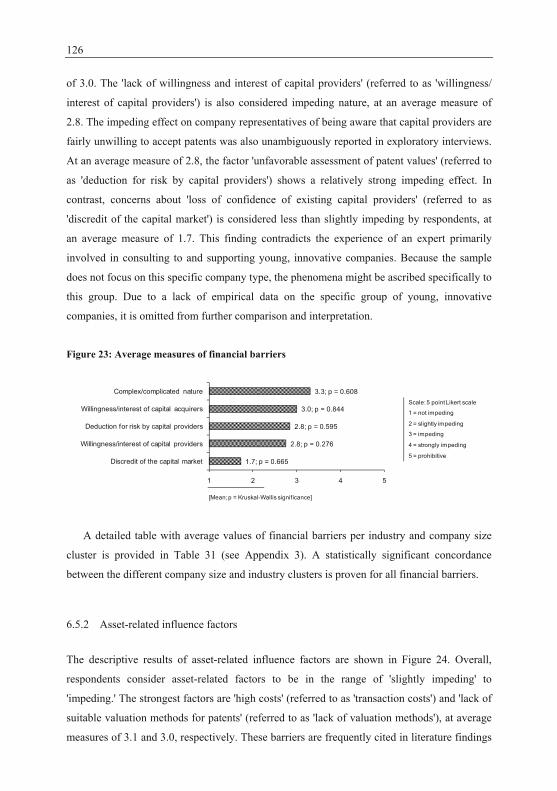
126
of 3.0. The 'lack of willingness and interest of capital providers' (referred to as 'willingness/
interest of capital providers') is also considered impeding nature, at an average measure of
2.8. The impeding effect on company representatives of being aware that capital providers are
fairly unwilling to accept patents was also unambiguously reported in exploratory interviews.
At an average measure of 2.8, the factor 'unfavorable assessment of patent values' (referred to
as 'deduction for risk by capital providers') shows a relatively strong impeding effect. In
contrast, concerns about 'loss of confidence of existing capital providers' (referred to as
'discredit of the capital market') is considered less than slightly impeding by respondents, at
an average measure of 1.7. This finding contradicts the experience of an expert primarily
involved in consulting to and supporting young, innovative companies. Because the sample
does not focus on this specific company type, the phenomena might be ascribed specifically to
this group. Due to a lack of empirical data on the specific group of young, innovative
companies, it is omitted from further comparison and interpretation.
Figure 23: Average measures of financial barriers
1.7; p = 0.665
2.8; p = 0.276
2.8; p = 0.595
3.0; p = 0.844
3.3; p = 0.608
1 2 3 4 5
Discredit of the capital market
Willingness/interest of capital providers
Deduction for risk by capital providers
Willingness/interest of capital acquirers
Complex/complicated nature
[Mean; p = Kruskal-Wallis significance]
Scale: 5 point Likert scale
1 = not impeding
2 = slightly impeding
3 = impeding
4 = strongly impeding
5 = prohibitive
A detailed table with average values of financial barriers per industry and company size
cluster is provided in Table 31 (see Appendix 3). A statistically significant concordance
between the different company size and industry clusters is proven for all financial barriers.
6.5.2 Asset-related influence factors
The descriptive results of asset-related influence factors are shown in Figure 24. Overall,
respondents consider asset-related factors to be in the range of 'slightly impeding' to
'impeding.' The strongest factors are 'high costs' (referred to as 'transaction costs') and 'lack of
suitable valuation methods for patents' (referred to as 'lack of valuation methods'), at average
measures of 3.1 and 3.0, respectively. These barriers are frequently cited in literature findings
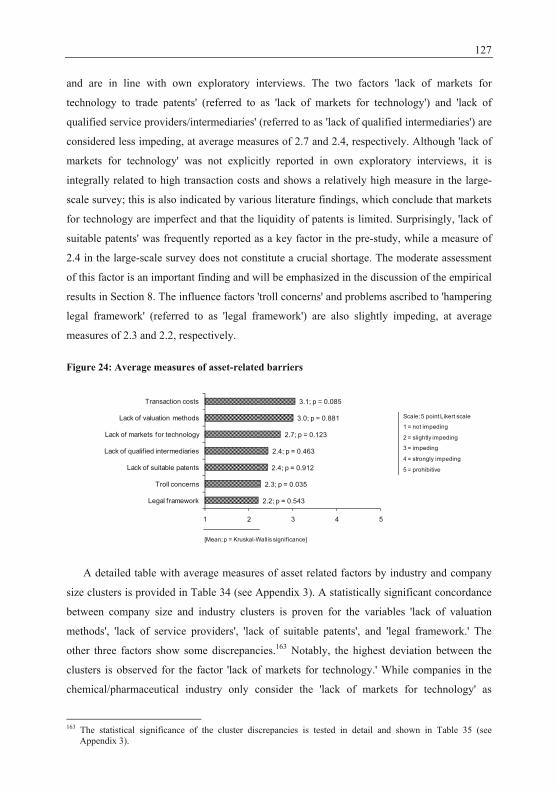
127
and are in line with own exploratory interviews. The two factors 'lack of markets for
technology to trade patents' (referred to as 'lack of markets for technology') and 'lack of
qualified service providers/intermediaries' (referred to as 'lack of qualified intermediaries') are
considered less impeding, at average measures of 2.7 and 2.4, respectively. Although 'lack of
markets for technology' was not explicitly reported in own exploratory interviews, it is
integrally related to high transaction costs and shows a relatively high measure in the large-
scale survey; this is also indicated by various literature findings, which conclude that markets
for technology are imperfect and that the liquidity of patents is limited. Surprisingly, 'lack of
suitable patents' was frequently reported as a key factor in the pre-study, while a measure of
2.4 in the large-scale survey does not constitute a crucial shortage. The moderate assessment
of this factor is an important finding and will be emphasized in the discussion of the empirical
results in Section 8. The influence factors 'troll concerns' and problems ascribed to 'hampering
legal framework' (referred to as 'legal framework') are also slightly impeding, at average
measures of 2.3 and 2.2, respectively.
Figure 24: Average measures of asset-related barriers
2.2; p = 0.543
2.3; p = 0.035
2.4; p = 0.912
2.4; p = 0.463
2.7; p = 0.123
3.0; p = 0.881
3.1; p = 0.085
1 2 3 4 5
Legal framework
Troll concerns
Lack of suitable patents
Lack of qualif ied intermediaries
Lack of markets for technology
Lack of valuation methods
Transaction costs
[Mean; p = Kruskal-Wallis significance]
Scale: 5 point Likert scale
1 = not impeding
2 = slightly impeding
3 = impeding
4 = strongly impeding
5 = prohibitive
A detailed table with average measures of asset related factors by industry and company
size clusters is provided in Table 34 (see Appendix 3). A statistically significant concordance
between company size and industry clusters is proven for the variables 'lack of valuation
methods', 'lack of service providers', 'lack of suitable patents', and 'legal framework.' The
other three factors show some discrepancies.163 Notably, the highest deviation between the
clusters is observed for the factor 'lack of markets for technology.' While companies in the
chemical/pharmaceutical industry only consider the 'lack of markets for technology' as
163 The statistical significance of the cluster discrepancies is tested in detail and shown in Table 35 (see
Appendix 3).
128
slightly impeding, at a measure of 2.1, companies in the machinery and electrical industries
consider the same factor as slightly more impeding, at average measures of 3.0 and 2.8,
respectively. Particularly MNCs in the machinery industry state, at an average measure of 3.6,
that lack of markets for technology is a strongly impeding factor. Also notable is the
difference in the perception of the troll aspect. While companies in the chemical/pharma-
ceutical industry report almost no troll concerns, at an average measure of 1.6, companies in
the machinery industry do have concerns, at an average measure of 2.8. Considering the factor
'transaction costs', there is a significant discrepancy between SMEs and MNCs in the
chemical/pharmaceutical industry (average measures of 2.7 and 3.7, respectively) and
between SMEs and MNCs in the machinery industry (average measures of 2.7 and 4.0,
respectively). Hence, smaller companies in these two industries consider 'transaction costs'
less impeding than large players. All other asset-related influence factors are well balanced
between the company clusters. The barrier 'lack of suitable patents' turns out not to be a
prohibiting or impeding factor within any company cluster.
6.5.3 Managerial influence factors
The descriptive results of managerial influence factors are shown in Figure 25. Overall, 'lack
of methods and resources in the company' (referred to as 'lack of resources') and 'no
consideration of the financial option in the company yet' (referred to as 'lack of awareness')
are considered the two most impeding factors (at average measures of 2.9 and 2.7,
respectively). 'Internal barriers for business policy reasons' (referred to as 'internal managerial
resistance') and 'internal communication barriers between involved departments' (referred to
as 'internal communication barriers') are considered only slightly impeding, at average
measures of 2.0 each. The same is reported for the factor 'loss of reputation with regard to
customers, suppliers, and competitors' (referred to as 'discredit of stake holder'), at an average
value of 1.9. The least managerial problem is reported to be an 'unwanted effect of patent
value transparency' (referred to as 'transparency of patent values'), at an average measure of
1.5. These findings are entirely in line with the pre-study of the survey and with literature
findings. Finally, the factor 'the company is part of a group/holding that is responsible for the
patent portfolio' (referred to as 'patent portfolio responsibility') – and, therefore, inability to
utilize patents – is not very impeding, at an average measure of 1.4. It must be taken into
account that the latter result is biased, as companies characterized by limited responsibility
might not have participated in the study.
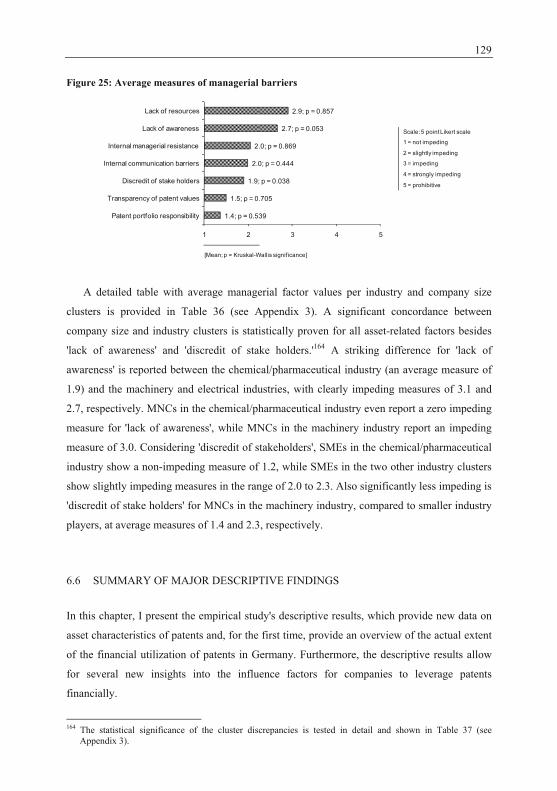
129
Figure 25: Average measures of managerial barriers
1.4; p = 0.539
1.5; p = 0.705
1.9; p = 0.038
2.0; p = 0.444
2.0; p = 0.869
2.7; p = 0.053
2.9; p = 0.857
1 2 3 4 5
Patent portfolio responsibility
Transparency of patent values
Discredit of stake holders
Internal communication barriers
Internal managerial resistance
Lack of awareness
Lack of resources
[Mean; p = Kruskal-Wallis significance]
Scale: 5 point Likert scale
1 = not impeding
2 = slightly impeding
3 = impeding
4 = strongly impeding
5 = prohibitive
A detailed table with average managerial factor values per industry and company size
clusters is provided in Table 36 (see Appendix 3). A significant concordance between
company size and industry clusters is statistically proven for all asset-related factors besides
'lack of awareness' and 'discredit of stake holders.'164 A striking difference for 'lack of
awareness' is reported between the chemical/pharmaceutical industry (an average measure of
1.9) and the machinery and electrical industries, with clearly impeding measures of 3.1 and
2.7, respectively. MNCs in the chemical/pharmaceutical industry even report a zero impeding
measure for 'lack of awareness', while MNCs in the machinery industry report an impeding
measure of 3.0. Considering 'discredit of stakeholders', SMEs in the chemical/pharmaceutical
industry show a non-impeding measure of 1.2, while SMEs in the two other industry clusters
show slightly impeding measures in the range of 2.0 to 2.3. Also significantly less impeding is
'discredit of stake holders' for MNCs in the machinery industry, compared to smaller industry
players, at average measures of 1.4 and 2.3, respectively.
6.6 SUMMARY OF MAJOR DESCRIPTIVE FINDINGS
In this chapter, I present the empirical study's descriptive results, which provide new data on
asset characteristics of patents and, for the first time, provide an overview of the actual extent
of the financial utilization of patents in Germany. Furthermore, the descriptive results allow
for several new insights into the influence factors for companies to leverage patents
financially.
164 The statistical significance of the cluster discrepancies is tested in detail and shown in Table 37 (see
Appendix 3).
130
Considering asset characteristics of patents, the results of the survey provide new
indications on the liquidity of patents. Respondents across company size clusters report that
approximately 10% of their patents are involved in licensing activities.165 Notable differences
are observed concerning industry sectors. The chemical/pharmaceutical industry shows a
percentage of licensed patents of 19.8%, which is almost 3 times as high as the percentage of
licensed patents in the machinery and electrical industries (7.1% and 8.9%, respectively). The
survey also shows that primarily defensive patent management activities, such as the
protection of own operations and the valuation of the patent portfolio, tend to increase.
Activities that indicate an increasing transaction rate of patents, such as the external
exploitation or acquisition of patents, are reported to be increasing slightly. Own empirical
findings do not indicate an increasing liquidity of patents or a notable growth of markets for
technology in Germany between 2005 and 2010. Considering the value question, own survey
results show that patent portfolios are assessed as potentially valuable by patent holding
companies, but the results also show that the value distribution of patent portfolios is skewed.
A high discrepancy is observed concerning industry and company size clusters. The highest
portfolio values of several hundred million Euros are shown by MNCs in the chemical/
pharmaceutical industry, while SMEs in the machinery industry stated portfolio values of
EUR 4.9 million, on average. Considering the external exploitability of these portfolios,
SMEs report a higher percentage of externally exploitable patents than MNCs (51.7% vs.
36.6%). At the same time, however, the value of exploitable patents of MNCs is, in terms of
both median and mean value, approximately 4 times higher than that of SMEs. The overall
mean value of exploitable patents is EUR 1.004 million, and the median is EUR 0.237
million. The assessment of patent portfolio values is based on 16.1% quantitatively evaluated
patents and almost 46.2% qualitatively evaluated patents. More than one-third of all patents
are not valued at all. Again, industry specifications become evident as companies in the
chemical/pharmaceutical industry hold the highest share of quantitatively valued patents,
while companies in the electrical industry hold the highest share of qualitatively valued
patents, and companies in the machinery industry hold the highest share of patents that have
not been valued at all.
Furthermore, this study provides, for the first time, detailed information about the
utilization of patents in external financing instruments by companies in Germany. The results
of the study show that the utilization of patents is most frequently practiced in equity 165 The term 'licensing activities' includes all patents assigned to the usage categories 'licensing', 'cross-licensing',
and 'licensing and use.'
131
transactions. Overall, 43.3% of all companies report experience in the utilization of patents in
equity transactions. The percentage of MNCs reporting to utilize patents for equity
transactions is more than twice as high as the percentage of SMEs. The overall percentage of
companies that have utilized patents to influence the acquisition of bank loans amounts to
17.9%. Notably, the overall percentage of MNCs and SMEs is almost equivalent here. For the
most part, patents are used as minor collateral by an overall percentage of 20.0%, and only
3.2% of the companies in the sample had utilized patents as major collateral to date. Clearly,
the number of companies utilizing patents as minor collateral is higher than the percentage of
companies that report having influenced the terms and conditions of bank loans by means of
patent utilization. Particularly companies in the machinery industry use patents as collateral
for bank loans, but report that the patents had little influence on the volume or conditions of
the loan. The overall percentage of companies with experience in the financial utilization of
patents in sale/lease-back transactions and patent funds is marginal and amounts to 3.1% each.
Considering the future potential of these financing instruments, the utilization of patents in
equity transactions does not show substantial growth potential. Considering the utilization of
patents to acquire bank loans, a high growth potential is only indicated by MNCs in the
chemical/pharmaceutical industry. Both, sale/lease-back transactions and patent funds show
generally high growth potentials. Particularly patent funds show a high growth potential, at an
de facto utilization rate of 3.1% and an intended utilization rate of 30.9% across company size
and industry clusters.
The strongest motivating factor for companies to utilize patents financially is the
exploitation of lying idle assets across all companies in the sample. To utilize patents in
external financing instruments to increase the company's capital base or to improve capital
costs is less motivating. The objectives to improve the balance sheet or taxes are only slightly
motivating. Changes due to Basel II are also only considered a slightly stimulating factor.
Considering industry specifications, companies in the machinery industry generally report a
lower motivation to utilize patents financially; particularly MNCs in this industry sector show
a distinctively lower motivation to increase the 'capital base' or improve 'capital costs'
compared to other companies. The strongest impeding factor for companies to utilize patents
financially is the complex and complicated nature compared to other funding sources. This
argument is reported across company size and industry clusters. A general lack of willingness
and interest by both companies and capital providers is also reported as a major impeding
factor. In contrast, concerns about the discredit of existing or new capital providers are
132
considered not impeding. Considering factors specifically associated with asset characteristics
of patents, respondents reported 'lack of valuation methods' and 'high transaction costs' as the
most impeding factors. 'Lack of markets for technology' is only slightly impeding for
companies in the chemical/pharmaceutical industry, while this is considered impeding by all
other companies. Particularly MNCs in the machinery industry reported that 'lack of markets
for technology' is a strongly impeding factor. 'Lack of suitable patents' and Germany's 'legal
framework' do not constitute crucial problems for companies to leverage patents financially.
A general reluctance to exploit patents externally based on 'troll concerns' is reported by
companies in the machinery industry, while companies in the chemical/pharmaceutical
industry reported almost no 'troll concerns'. Specific company-internal barriers, as 'lack of
resources' and 'lack of awareness' are considered impeding factors. A striking difference in the
measure of awareness is reported by companies in the machinery and electrical industries,
which reported that 'lack of awareness' is an impeding factor, while companies in the
chemical/pharmaceutical industry do not report 'lack of awareness'. MNCs in the
chemical/pharmaceutical industry even report a zero impeding measure for the factor 'lack of
awareness', while MNCs in the machinery industry report an impeding measure of 3.0.
Internal barriers for business policy reasons, as 'internal communication barriers' and concerns
about the 'discredit of stakeholders' are only slightly impeding. The least important
managerial factor is considered 'transparency of patent values' inside the firm.
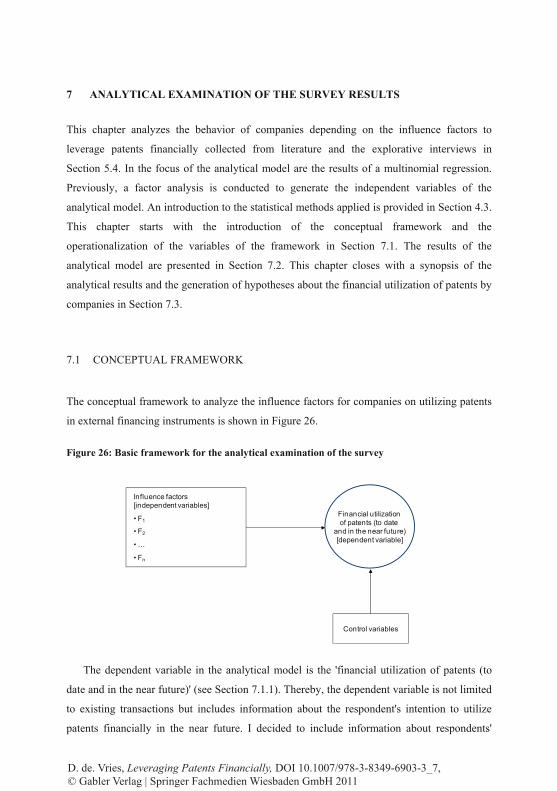
7 ANALYTICAL EXAMINATION OF THE SURVEY RESULTS
This chapter analyzes the behavior of companies depending on the influence factors to
leverage patents financially collected from literature and the explorative interviews in
Section 5.4. In the focus of the analytical model are the results of a multinomial regression.
Previously, a factor analysis is conducted to generate the independent variables of the
analytical model. An introduction to the statistical methods applied is provided in Section 4.3.
This chapter starts with the introduction of the conceptual framework and the
operationalization of the variables of the framework in Section 7.1. The results of the
analytical model are presented in Section 7.2. This chapter closes with a synopsis of the
analytical results and the generation of hypotheses about the financial utilization of patents by
companies in Section 7.3.
7.1 CONCEPTUAL FRAMEWORK
The conceptual framework to analyze the influence factors for companies on utilizing patents
in external financing instruments is shown in Figure 26.
Figure 26: Basic framework for the analytical examination of the survey
Control variables
Influence factors [independent variables]
• F1
• F2
• …
• Fn
Financial utilization of patents (to date
and in the near future)[dependent variable]
The dependent variable in the analytical model is the 'financial utilization of patents (to
date and in the near future)' (see Section 7.1.1). Thereby, the dependent variable is not limited
to existing transactions but includes information about the respondent's intention to utilize
patents financially in the near future. I decided to include information about respondents'
D. de. Vries, Leveraging Patents Financially, DOI 10.1007/978-3-8349-6903-3_7, © Gabler Verlag | Springer Fachmedien Wiesbaden GmbH 2011
134
intention, due to the emerging status of the topic. The independent variables represent all
influence factors collected in Section 5.4. According to the preliminary objective of the
analytical model to examine influence factors, the set of independent variables is limited to
these variables and does not include other aspects. Because the managerial decision to
leverage patents financially or not might well also be determined by other factors, such as
firm size, industry sector, or patenting characteristics of the company, the model includes
these variables as control variables (see Section 7.1.3). Due to the lack of previous studies that
measure influence factors for companies to leverage patents financially, almost all items are
newly created for this study. The following sections introduce the different variable types of
the analytical model in detail.
7.1.1 Dependent variable: Financial utilization of patents
The dependent variable of the analytical model is the 'financial utilization of patents (to date
and in the near future).' The measure of the dependent variable is new, because no previous
studies were found during the literature survey, which introduced an equivalent variable. The
variable is not limited to the actual utilization of patents in external financing instruments, but
includes the prediction of respondents to leverage patents financially in the near future. Such
prediction is considered, because the descriptive results of the study confirm that companies
have relatively little experience in the financial utilization of patents to date but expect a
potentially higher utilization rate in the near future. The descriptive results show that 17.9%
of the respondents have been utilizing patents for bank loans (whereas only 3.2% reported
using patents as major collateral) and only 3.1% have experience in sale/lease-back
transactions and patent funds, respectively. At the same time, the financial utilization of
patents was predicted to be 25.3% for bank loans, 9.3% for sale/lease-back transactions, and
30.9% for patent funds. By combining the actual utilization status with the predicted
utilization, the dependent variable becomes a discrete variable that can take any of four values
(as shown in Figure 27). The first parameter value FUP1 represents the most intense financial
utilization of patents, i.e. when a firm shows both actual experience and the expectation to
utilize patents financially in future. The second parameter value FUP2 represents the
utilization pattern of companies that report no actual experience in the financial utilization of
patents, but predicted to utilize patents financially in the near future. The third parameter
value FUP3 represents the utilization pattern of companies in the sample that report no
experience and predict no financial utilization of patents in the near future; the last utilization
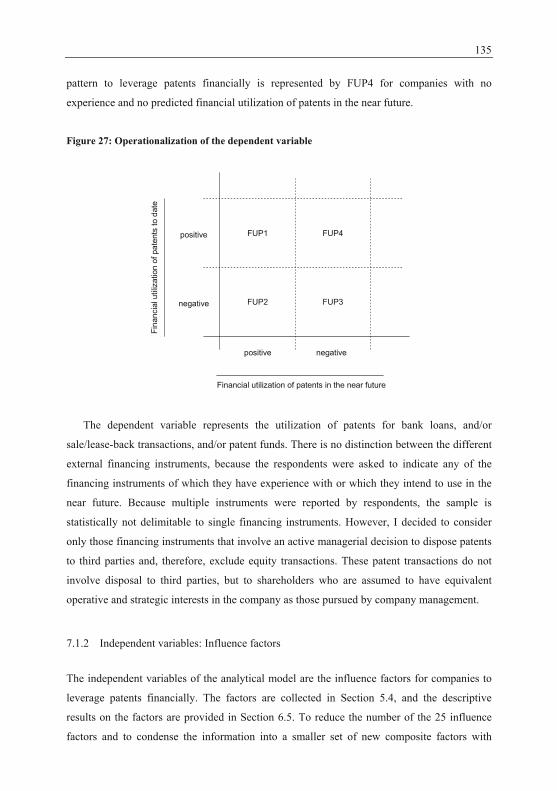
135
pattern to leverage patents financially is represented by FUP4 for companies with no
experience and no predicted financial utilization of patents in the near future.
Figure 27: Operationalization of the dependent variable
positive negative
negative
positive
Fina
ncia
l util
izat
ion
of p
aten
ts to
dat
e
Financial utilization of patents in the near future
FUP1
FUP2 FUP3
FUP4
The dependent variable represents the utilization of patents for bank loans, and/or
sale/lease-back transactions, and/or patent funds. There is no distinction between the different
external financing instruments, because the respondents were asked to indicate any of the
financing instruments of which they have experience with or which they intend to use in the
near future. Because multiple instruments were reported by respondents, the sample is
statistically not delimitable to single financing instruments. However, I decided to consider
only those financing instruments that involve an active managerial decision to dispose patents
to third parties and, therefore, exclude equity transactions. These patent transactions do not
involve disposal to third parties, but to shareholders who are assumed to have equivalent
operative and strategic interests in the company as those pursued by company management.
7.1.2 Independent variables: Influence factors
The independent variables of the analytical model are the influence factors for companies to
leverage patents financially. The factors are collected in Section 5.4, and the descriptive
results on the factors are provided in Section 6.5. To reduce the number of the 25 influence
factors and to condense the information into a smaller set of new composite factors with

136
minimum loss of information, a factor analysis was conducted. The first step of a factor
analysis is to select the variables (i.e. the influence factors) and to test whether the data
sample is appropriate. The second step is to determine the number of extracted factors (i.e.
composite factors) and to rotate the composite factors to improve the model. Finally, the
extracted factors can be interpreted and labeled (cf. Backhaus et al., 2006, p. 269). I present
these steps of the factor analysis in the following.
The number of variables that can be analyzed in a factor analysis is limited by the rule that
the data set must contain a minimum of 3 to 5 observations for each variable (cf. Backhaus et
al., 2006, p. 331; Hair et al., 2006, p. 112). The number of collected influence factors is 25
and the sample includes 97 observations, with negligible missing values in each variable.166
All influence factors can therefore be included in the factor analysis. The first run of the factor
analysis shows several cross-loadings, i.e. influence factors with more than one significant
loading, and therefore confuses the interpretation of composite factors (Hair et al., 2006,
p. 130). With the aim of minimizing the number of significant loadings on each row of the
factor matrix, the following influence factors with cross-loadings are deleted from the set of
examined influence factors:167
Financial influence factors:
o too complex/complicated nature
o willingness/interest of capital acquirers
o Basel II
Asset-related influence factors:
o transaction costs
o troll concerns
o legal framework
Managerial influence factors:
o internal communication barriers
o patent portfolio responsibility
166 Several options are available for dealing with missing values in a factor analysis. Missing values can be
excluded with the entire observation, excluded as single values, or replaced by average values (Backhaus et al., 2006, p. 325). I chose to exclude missing values as single values. The effect might be that the average values of the single variables are not balanced. According to Hair et al. (2006, p. 55), missing data under 10% for individual cases or observations can generally be ignored if the missing data occurs in a random fashion, which is the case here.
167 See Section 6.5 for a complete presentation of the examined influence factors.
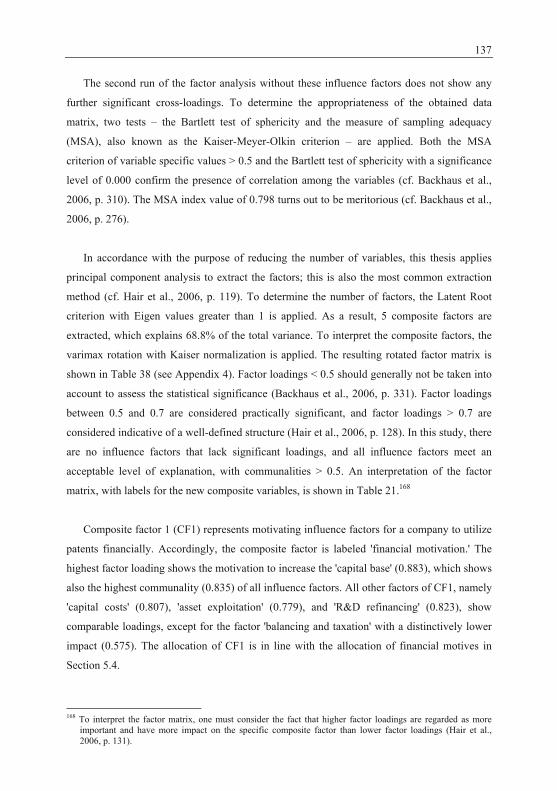
137
The second run of the factor analysis without these influence factors does not show any
further significant cross-loadings. To determine the appropriateness of the obtained data
matrix, two tests – the Bartlett test of sphericity and the measure of sampling adequacy
(MSA), also known as the Kaiser-Meyer-Olkin criterion – are applied. Both the MSA
criterion of variable specific values > 0.5 and the Bartlett test of sphericity with a significance
level of 0.000 confirm the presence of correlation among the variables (cf. Backhaus et al.,
2006, p. 310). The MSA index value of 0.798 turns out to be meritorious (cf. Backhaus et al.,
2006, p. 276).
In accordance with the purpose of reducing the number of variables, this thesis applies
principal component analysis to extract the factors; this is also the most common extraction
method (cf. Hair et al., 2006, p. 119). To determine the number of factors, the Latent Root
criterion with Eigen values greater than 1 is applied. As a result, 5 composite factors are
extracted, which explains 68.8% of the total variance. To interpret the composite factors, the
varimax rotation with Kaiser normalization is applied. The resulting rotated factor matrix is
shown in Table 38 (see Appendix 4). Factor loadings < 0.5 should generally not be taken into
account to assess the statistical significance (Backhaus et al., 2006, p. 331). Factor loadings
between 0.5 and 0.7 are considered practically significant, and factor loadings > 0.7 are
considered indicative of a well-defined structure (Hair et al., 2006, p. 128). In this study, there
are no influence factors that lack significant loadings, and all influence factors meet an
acceptable level of explanation, with communalities > 0.5. An interpretation of the factor
matrix, with labels for the new composite variables, is shown in Table 21.168
Composite factor 1 (CF1) represents motivating influence factors for a company to utilize
patents financially. Accordingly, the composite factor is labeled 'financial motivation.' The
highest factor loading shows the motivation to increase the 'capital base' (0.883), which shows
also the highest communality (0.835) of all influence factors. All other factors of CF1, namely
'capital costs' (0.807), 'asset exploitation' (0.779), and 'R&D refinancing' (0.823), show
comparable loadings, except for the factor 'balancing and taxation' with a distinctively lower
impact (0.575). The allocation of CF1 is in line with the allocation of financial motives in
Section 5.4.
168 To interpret the factor matrix, one must consider the fact that higher factor loadings are regarded as more
important and have more impact on the specific composite factor than lower factor loadings (Hair et al., 2006, p. 131).
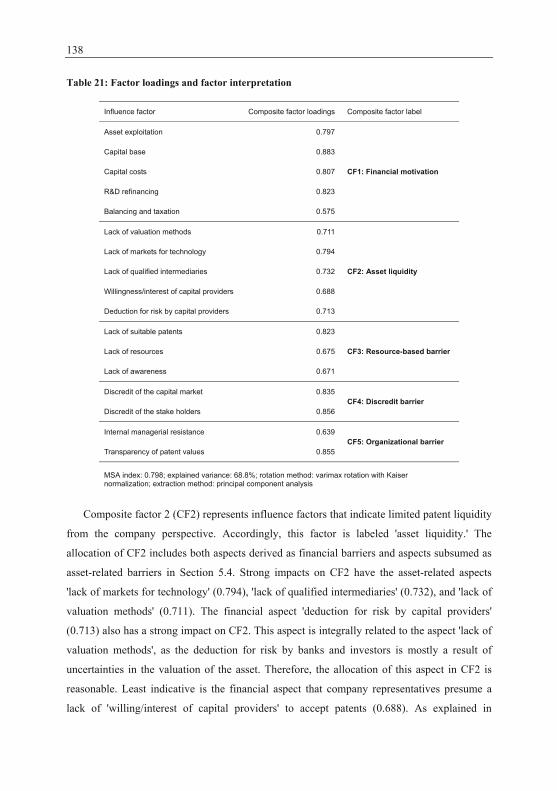
138
Table 21: Factor loadings and factor interpretation
Influence factor Composite factor loadings Composite factor label
Asset exploitation 0.797
CF1: Financial motivation
Capital base 0.883
Capital costs 0.807
R&D refinancing 0.823
Balancing and taxation 0.575
Lack of valuation methods 0.711
CF2: Asset liquidity
Lack of markets for technology 0.794
Lack of qualified intermediaries 0.732
Willingness/interest of capital providers 0.688
Deduction for risk by capital providers 0.713
Lack of suitable patents 0.823
CF3: Resource-based barrier Lack of resources 0.675
Lack of awareness 0.671
Discredit of the capital market 0.835 CF4: Discredit barrier
Discredit of the stake holders 0.856
Internal managerial resistance 0.639 CF5: Organizational barrier
Transparency of patent values 0.855
MSA index: 0.798; explained variance: 68.8%; rotation method: varimax rotation with Kaiser normalization; extraction method: principal component analysis
Composite factor 2 (CF2) represents influence factors that indicate limited patent liquidity
from the company perspective. Accordingly, this factor is labeled 'asset liquidity.' The
allocation of CF2 includes both aspects derived as financial barriers and aspects subsumed as
asset-related barriers in Section 5.4. Strong impacts on CF2 have the asset-related aspects
'lack of markets for technology' (0.794), 'lack of qualified intermediaries' (0.732), and 'lack of
valuation methods' (0.711). The financial aspect 'deduction for risk by capital providers'
(0.713) also has a strong impact on CF2. This aspect is integrally related to the aspect 'lack of
valuation methods', as the deduction for risk by banks and investors is mostly a result of
uncertainties in the valuation of the asset. Therefore, the allocation of this aspect in CF2 is
reasonable. Least indicative is the financial aspect that company representatives presume a
lack of 'willing/interest of capital providers' to accept patents (0.688). As explained in

139
Section 3.2, the limited willingness of capital providers is to a large extent determined by
limited liquidity. Hence, the allocation of this aspect in CF2 is also reasonable.
Composite factor 3 (CF3) represents factors that indicate whether or not a company's
resources are suitable for utilizing patents financially. Accordingly, the factor is labeled
'resource-based barrier.' The allocation of CF3 includes both aspects derived as managerial
barriers and aspects collected as asset-related barriers in Section 5.4. The strongest impact on
CF3 has the asset-related factor 'lack of suitable patents' (0.823). The other two factors 'lack
of resources' (0.675) and 'lack of awareness' (0.671) show lower factor loadings. Logically, a
company lacking suitable patents has insufficient resources and might have little awareness of
how to leverage these assets financially. Nevertheless, companies that hold highly suitable
patent portfolios might also lack awareness and resources to leverage these assets financially.
Thereby, a lack of resources might cause a lack of awareness, while a lack of awareness might
cause a lack of resources to do so. As these aspects are integrally related, their allocation in
one composite factor labeled 'resource-based barrier' is appropriate, given their content.
Composite factor 4 (CF4) represents factors that indicate concerns about a negative
signaling effect of leveraging patents financially. Accordingly, the factor is labeled 'discredit
barrier.' The allocation of CF4 includes an aspect derived as a managerial barrier and an
aspect derived as an asset-related barrier in Section 5.4. Both aspects 'discredit of the capital
market' (0.835) and 'discredit of stake holders' (0.856) have similar impacts on CF4. Both
factors are also characterized by relatively high communalities (0.795 and 0.807) and match
well to be allocated into one composite factor labeled 'discredit barrier.'
Composite factor 5 (CF5) represents organizational factors that might impede the financial
utilization of patents. Accordingly, the factor is labeled 'organizational barrier.' Most impact
has the factor 'transparency of patent values' (0.855), while the factor 'internal managerial
resistance' (0.639) has less impact. The allocation of CF5 is in line with the allocation of
managerial barriers in Section 5.4.
In short, the allocation of composite factors is partially in line with the previous allocation
of aspects in Section 5.4 and partially a new combination of aspects. New combinations
match well concerning content and are labeled accordingly. To use the composite factors for

140
further analysis, the specific variable values of the sample entities are generated by applying
the regression method (see Backhaus et al., 2006, p. 331).
7.1.3 Control variables
Control variables are included in the model to consider contextual differences, i.e. aspects that
are not direct influence factors for company activities, but which represent given aspects of
the company's background that might implicitly have an impact on the financial utilization of
patents. In addition to the variables 'industry sector' (i.e. the classification into chemical/
pharmaceutical, machinery, or electrical industries) and 'company size' (i.e. the classification
into SMEs and MNCs, according to Section 6.1), which have been examined throughout this
thesis, the control variables also include aspects of patent management context factors, such
as the 'patenting rate' of the company (defined as the ratio of patents developed in the past five
years to the total number of active patents in the patent portfolio of the company), the 'patent
exploitation activity' of the company (defined as the share of patents involved in licensing
activities to the total number of patents in the patent portfolio of the company) and the 'patent
portfolio value ratio' (defined as the ratio of the patent portfolio value to the company value).
There is little available literature that incorporates the effects of these contextual aspects on
the financial utilization of patents.
Considering the control variable 'company size', there are a number of studies on the
relationship between investments, finance, and company size (Harhoff, 1997, p. 7). On the
one hand, it is often cited that SMEs have stronger financing needs than large companies,
which leads to the assumption that SMEs might be more prone to out-of-the-ordinary
solutions such as utilizing IP assets for external financing instruments. Accordingly, an
OECD publication presumes that approaches to leverage patents financially "are used by large
and small firms, but may have particular importance for smaller firms, which often lack other
tangible assets with which to secure (or attract) outside financing" (Kamiyama et al., 2006,
p. 20). On the other hand, SMEs are generally characterized by limited resources and
capabilities for complicated transactions such as IP financing. In addition, certain financing
instruments such as sale/lease-back transactions require a considerable deal size – at least
EUR 3 million (Demberg, 2007, p. B4) – to support the involved transaction costs and due
diligence required. These transaction volumes might simply be out of many SMEs' reach.
Eventually, Bittelmeyer et al. (2008, p. 266) found that, all else being equal, large companies
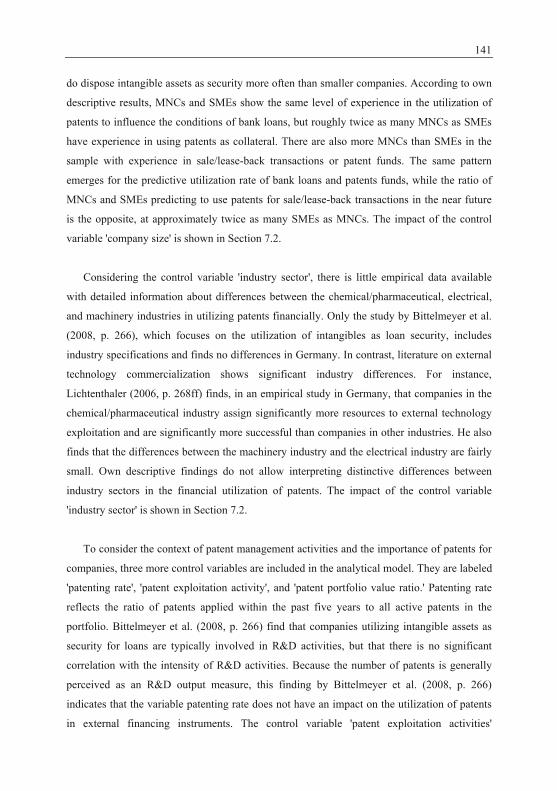
141
do dispose intangible assets as security more often than smaller companies. According to own
descriptive results, MNCs and SMEs show the same level of experience in the utilization of
patents to influence the conditions of bank loans, but roughly twice as many MNCs as SMEs
have experience in using patents as collateral. There are also more MNCs than SMEs in the
sample with experience in sale/lease-back transactions or patent funds. The same pattern
emerges for the predictive utilization rate of bank loans and patents funds, while the ratio of
MNCs and SMEs predicting to use patents for sale/lease-back transactions in the near future
is the opposite, at approximately twice as many SMEs as MNCs. The impact of the control
variable 'company size' is shown in Section 7.2.
Considering the control variable 'industry sector', there is little empirical data available
with detailed information about differences between the chemical/pharmaceutical, electrical,
and machinery industries in utilizing patents financially. Only the study by Bittelmeyer et al.
(2008, p. 266), which focuses on the utilization of intangibles as loan security, includes
industry specifications and finds no differences in Germany. In contrast, literature on external
technology commercialization shows significant industry differences. For instance,
Lichtenthaler (2006, p. 268ff) finds, in an empirical study in Germany, that companies in the
chemical/pharmaceutical industry assign significantly more resources to external technology
exploitation and are significantly more successful than companies in other industries. He also
finds that the differences between the machinery industry and the electrical industry are fairly
small. Own descriptive findings do not allow interpreting distinctive differences between
industry sectors in the financial utilization of patents. The impact of the control variable
'industry sector' is shown in Section 7.2.
To consider the context of patent management activities and the importance of patents for
companies, three more control variables are included in the analytical model. They are labeled
'patenting rate', 'patent exploitation activity', and 'patent portfolio value ratio.' Patenting rate
reflects the ratio of patents applied within the past five years to all active patents in the
portfolio. Bittelmeyer et al. (2008, p. 266) find that companies utilizing intangible assets as
security for loans are typically involved in R&D activities, but that there is no significant
correlation with the intensity of R&D activities. Because the number of patents is generally
perceived as an R&D output measure, this finding by Bittelmeyer et al. (2008, p. 266)
indicates that the variable patenting rate does not have an impact on the utilization of patents
in external financing instruments. The control variable 'patent exploitation activities'
142
represents the ratio of all patents involved in licensing agreements to all patents in the
portfolio of the company. It stands to reason that there might be a correlation between the
utilization of patents in external financing instruments and the intensity of patent exploitation
activities of a company, as empirical data is missing so far. The control variable 'patent
portfolio value ratio' reflects the ratio of the patent portfolio value to the company value. As
with the latter control variable, it stands to reason that the value percentage of the patent
portfolio correlates with the financial utilization of patents as empirical data is still missing.
The impact of the control variables 'patenting rate', 'patent exploitation activity', and 'patent
portfolio value ratio' are shown in Section 7.2.
7.1.4 Overview of the analytical model
The detailed framework for the analytical examination of the survey results – with the
dependent variable, all independent variables, and control variables – is presented in
Figure 28. The dependent variable represents the utilization of patents in external financing
instruments by companies to date and in the near future. The parameter of external financing
instruments concentrates on bank loans, sale/lease-back transactions, and patent funds. The
set of independent variables includes five composite factors that were generated with the help
of a factor analysis in Section 7.1.2. The factor analysis is based on 25 influence factors
collected from literature and exploratory interviews, as presented in Section 5.4.
Figure 28: Detailed framework for the analytical examination of the survey
Control variables
• CV1: Company size
• CV2: Industry sector
• CV3: Patenting rate
• CV4: Patent exploitation activity
• CV5: Patent portfolio value ratio
Influence factors (composite factors)
• CF1: Financial motivation
• CF2: Asset liquidity
• CF3: Resource-based barrier
• CF4: Discredit barrier
• CF5: Organizational barrier
Financial utilization of patents (to date
and in the near future)
143
The control variables include the two variables 'CV1: Company size' and 'CV2: Industry
sector', which have both been examined throughout the study. Accordingly, variable 'CV2:
Industry sector' differentiates between the chemical/pharmaceutical, electrical industry, and
machinery industries, while variable 'CV1: Company size' differentiates between SMEs and
MNCs. Furthermore, the set of control variables includes context factors of patenting
activities that might have an impact on the dependent variable. These are the variable 'CV3:
Patenting rate' of the company (defined as the ratio of patents developed in the past five years
to the total number of active patents in the patent portfolio of the company), the variable
'CV4: Patent exploitation activity' of the company (defined as the share of patents involved in
licensing activities to the total number of patents in the patent portfolio of the company) and
the variable 'CV5: Patent portfolio value ratio' (defined as the ratio of the patent portfolio
value to the company value).
7.2 ANALYTICAL RESULT OF THE EMPIRICAL STUDY AND GENERATION OF
HYPOTHESES
In the following sections, the results of the analytical model are presented in order to analyze
them and to generate hypotheses about the impact of the independent variables and control
variables on the utilization of patents in external financing instruments. In the analytical
examination, 6 multinomial regression models are calculated. All models take the variable
'financial utilization of patents (to date and in the near future)', as operationalized in
Section 7.1.1, as the dependent variable. Model P0 is calculated with control variables only.
In Models P1 to P5, the independent variables CF1 to CF5 are successively included so as to
compare the models and to find indications about the contribution of the single independent
variables to the model fit. An overview of the overall significance of the single variables and
of the model fit criteria is presented in Table 22. Overall, an appropriate model fit and a good
separating capability is indicated by levels of significance between 0.001 and 0.004. The
highest ratio of explained variance (pseudo R2; Negelkerke) is 65.8% in Model P5. An
acceptable goodness of fit of the models is also indicated by the statistically significant
difference between -2 log likelihood values of the null model and the proposed model.169
169 The minimum value for -2 log likelihood value is 0, which corresponds to a perfect fit. Thus, the lower the -2
log likelihood value, the better the model fit (Hair et al., 2006, p. 361). To facilitate the between-model comparison, the chi-square value is calculated; this equals the difference between the -2 log likelihood values.
144
It must be mentioned that these statistical tests are particularly sensitive to sample sizes. With
small samples, as in this study, it is harder to show statistical significance than with large
samples (Hair et al., 2006, p. 362). In terms of predictive efficiency, the models achieve a
predictive rate of up to 71.6% in Model P5.
Model P0, which concentrates on the control variables, shows a significant effect of the
variables 'patent exploitation activity', 'patent portfolio value ratio', and 'company size.' This
effect remains significant for all three variables in all subsequent models. The variable
'patenting rate' also shows a high level of significance in Model P0, but the effect does not
remain as stable in subsequent models as the effect of the aforementioned three variables. The
variable 'industry sector' is not significant in Model P0.
It must be noted that the high value of Negelkerke's pseudo R2 of 0.412 means that the
control variables explain a very high percentage (41.2%) of the variance of the dependent
variable. The highly significant impact of the variable 'patent exploitation activity' and the
significant impact of the variables 'patent portfolio value ratio', 'patenting rate', and 'company
size' are a first indication within the analytical study that the behavior of companies in
leveraging patents financially is to a large extent explained by these variables, i.e. the general
affinity towards progressive patent management activities, a relatively high patent portfolio
value with regard to the company's value structure, a high patenting rate, and company size.
Later, the analytical examination reveals whether large companies utilize patents financially
more frequently than small companies, or whether the relationship in the model is the other
way around.
In addition to the control variables, Model P1 considers the first independent variable,
'CF1: Financial motivation.' The impact of the variable is highly significant and remains
highly significant in all subsequent models. By adding CF1, Negelkerke's pseudo R2
increases from 0.412 to 0.542, by 31.6%. The chi-square measure also increases from 37.669
to 44.790 (by 18.9%), which indicates an enhancement of model fit. The descriptive results
have shown that some companies do utilize patents financially, although they do not assume
that this is beneficial. This finding has raised the question as to whether companies utilize
patents at their own initiative, or because they are requested to do so by capital providers. The
significant impact of CF1 in Model P1 may indicate that the financial utilization of patents is
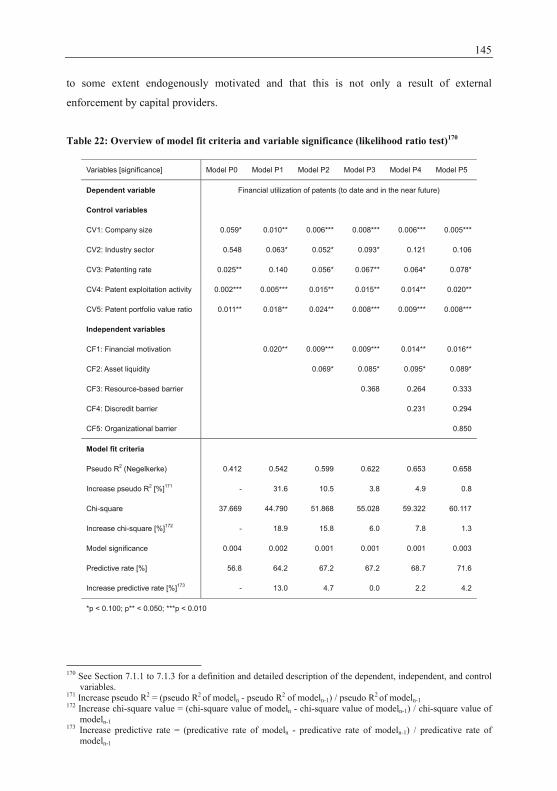
145
to some extent endogenously motivated and that this is not only a result of external
enforcement by capital providers.
Table 22: Overview of model fit criteria and variable significance (likelihood ratio test)170
Variables [significance] Model P0 Model P1 Model P2 Model P3 Model P4 Model P5
Dependent variable Financial utilization of patents (to date and in the near future)
Control variables
CV1: Company size 0.059* 0.010** 0.006*** 0.008*** 0.006*** 0.005***
CV2: Industry sector 0.548 0.063* 0.052* 0.093* 0.121 0.106
CV3: Patenting rate 0.025** 0.140 0.056* 0.067** 0.064* 0.078*
CV4: Patent exploitation activity 0.002*** 0.005*** 0.015** 0.015** 0.014** 0.020**
CV5: Patent portfolio value ratio 0.011** 0.018** 0.024** 0.008*** 0.009*** 0.008***
Independent variables
CF1: Financial motivation 0.020** 0.009*** 0.009*** 0.014** 0.016**
CF2: Asset liquidity 0.069* 0.085* 0.095* 0.089*
CF3: Resource-based barrier 0.368 0.264 0.333
CF4: Discredit barrier 0.231 0.294
CF5: Organizational barrier 0.850
Model fit criteria
Pseudo R2 (Negelkerke) 0.412 0.542 0.599 0.622 0.653 0.658
Increase pseudo R2 [%]171 - 31.6 10.5 3.8 4.9 0.8
Chi-square 37.669 44.790 51.868 55.028 59.322 60.117
Increase chi-square [%]172 - 18.9 15.8 6.0 7.8 1.3
Model significance 0.004 0.002 0.001 0.001 0.001 0.003
Predictive rate [%] 56.8 64.2 67.2 67.2 68.7 71.6
Increase predictive rate [%]173 - 13.0 4.7 0.0 2.2 4.2
*p < 0.100; p** < 0.050; ***p < 0.010
170 See Section 7.1.1 to 7.1.3 for a definition and detailed description of the dependent, independent, and control
variables. 171 Increase pseudo R2 = (pseudo R2 of modeln - pseudo R2 of modeln-1) / pseudo R2 of modeln-1 172 Increase chi-square value = (chi-square value of modeln - chi-square value of modeln-1) / chi-square value of
modeln-1 173 Increase predictive rate = (predicative rate of modeln - predicative rate of modeln-1) / predicative rate of
modeln-1
146
It must be noted that the control variable 'industry sector' also reaches a significant level in
Model P1 and may also contribute to the enhancement of model fit. The direction of
relationship and the strength of impact of the variable CF1 are analyzed in detail later in this
section. Based on the high level of significance of the impact of CF1 and the high increase of
model fit, I post the first hypothesis:
HCF1.0: The financial motivation has a significant impact on the utilization of patents in
external financing instruments.
In Model P2, I have additionally taken into account the independent variable 'CF2: Asset
liquidity.' The variable CF2 has a significant impact on the financial utilization of patents.
Negelkerke's pseudo R2 increases from 0.542 to 0.599 (by 10.5%), the chi-square measure
increases from 44.790 to 51.868 by (15.8%), and the level of significance increases from the
0.002 to 0.001. Based on the descriptive survey results and on a variety of literature findings,
it is expected that the perceived liquidity of the asset has a significant impeding impact on the
financial utilization of patents. In addition to the two independent variables CF1 and CF2, all
control variables are also of significant impact in Model P2. The direction of relationship and
the strength of the influence of the variables are analyzed in the following. Based on the
significant impact of the variable CF2 and the high increase in model fit, I post the second
hypothesis:
HCF2.0: The perceived asset liquidity of patents has a significant impact on the utilization
of patents in external financing instruments.
Model P3 includes the independent variable 'CF3: Resource-based barrier.' The variable
CF3 does not have a significant impact on the financial utilization of patents. This effect is
also observed for all subsequent models. A comparison of model fit of Model P3 and that of
the previous model shows that Negelkerke's pseudo R2 only increases from 0.599 to 0.622
(by 3.8%), and that the chi-square measure increases only slightly from 51.868 to 55.028 (by
6.0%), while the level of significance is stable at 0.001. This finding is not expected, as the
descriptive results of the survey have shown considerable measures for several components of
CF3, which is composed of the factors 'lack of resources', 'lack of awareness', and 'lack of
suitable patents.' While the latter component is in line with the findings of the regression
analysis with only slightly impeding descriptive measures across industry sectors and
147
company size clusters, the other two components have shown a distinct impeding level in the
survey. Particularly, the factor 'lack of resources' has been found to be of impeding influence,
with a high degree of accordance across all survey entities.174 However, the regression
analysis shows that this component does not have a significant influence on a company's de
facto financial utilization of patents. This contradiction in the findings might be explained if
respondents reported the current status of resources as an impeding factor, while acting on the
assumption that the allocation of resources is upwardly adjusted in the event of action. The
no-effect level of the component 'lack of awareness', which also shows an impeding mean
value in the descriptive part, might be explained by a low degree of accordance between
survey entities. A detailed consideration shows that the mean value of the component is 2.7
(on a 5 point Likert scale), but that the median is 2.0 and the modus is 1.0 (see Table 36,
Appendix 3). Particularly, companies in the chemical/pharmaceutical sector have not reported
an impeding influence for this factor. Eventually, the regression analysis shows that the
composite factor CF3 does not have a significant impact on the financial utilization of patents.
Based on the insignificance of variable CF3 in the analytical model and the limited impact on
model fit, I post the following hypothesis:
HCF3.0: Resource-based barriers as a lack of suitable patents, a lack of available
methods and resources within the company, or a lack of awareness do not have a
significant impact on the utilization of patents in external financing instruments.
In Model P4, I have included the independent variable 'CF4: Discredit barrier.' The
variable CF4 does not have a significant impact on the financial utilization of patents. This
effect remains in the following models. Compared to Model P3, Negelkerke's pseudo R2 only
increases very little, from 0.622 to 0.653 (by 4.9%) and chi-square only increases from 55.028
to 59.322 (by 7.8%). The level of significance is stable at 0.001. The insignificance of CF4 is
not unexpected, as the descriptive results of the empirical study show little influence of the
single components of the variable. The variable represents the components 'discredit of the
capital market' and 'discredit of stake holders' with less than slightly impeding mean values of
1.7 and 1.9, respectively. The insignificant impact of the composite factor CF4 is confirmed
by the regression analysis. Based on the insignificance of the variable CF4 in the analytical
model and the limited impact on model fit, I post the following hypothesis:
174 The Kruskal-Wallis significance for the factor 'lack of resources' equals 0.857.
148
HCF4.0: Discredit barriers, as the potential discredit of stake-holders or the capital
market, do not have a significant impact on the utilization of patents in external
financing instruments.
In Model P5, all independent variables have been introduced by adding the last variable
'CF5: Organizational barrier.' The impact of CF5 is not significant. Negelkerke's pseudo R2
barely increases from 0.653 to 0.658 (by 0.8%), the chi-square measure barely increases from
59.322 to 60.117 (by 1.3%), and the level of significance decreases from 0.001 to 0.003. The
insignificant impact is anticipated by descriptive empirical findings of the two components
'internal managerial resistance' and 'transparency of patent values' of the composite variable
CF5. At most, both components show a slightly impeding influence, with mean values of 2.0
and 1.5, respectively. The regression analysis confirms that the composite variable CF5 does
not have a significant impact on the financial utilization of patents. Based on the
insignificance of variable CF5 in the analytical model and the limited impact on model fit,
I post the following hypothesis:
HCF5.0: Organizational barriers as internal managerial resistance or transparency of
patent values do not have a significant impact on the utilization of patents in
external financing instruments.
In summary, the independent variables CF3, CF4, and CF5 do not have a significant
impact on a firm's 'financial utilization of patents (to date and in the near future)' and the
between model comparison in Table 22 shows that these variables contribute little to
increased model fit. The best model fit for further analysis appears to be Model P2, with a set
of independent and control variables that all have a significant impact on the dependent
variable. With a Negelkerke's pseudo R2 of 0.599, this model explains 59.9% of the variance
of the financial utilization of patents. On the one hand, the overall predictive rate of Model P2
of 67.2% is slightly below the predictive rate of the other models with up to 71.6%. On the
other hand, Model P2 shows the highest level of significance of 0.001, which decreases in the
following models to 0.003.
To analyze the direction of relationship and the strength of variable impact, Table 23
provides the parameter estimates and odds ratios for Model P2. The regression coefficient 'B'
reflects the direction of the relationship between variables. A negative 'B' means that an
149
increase in the independent variable is associated with a decrease of the predicted probability
of belonging to the comparison group and an increase in the probability of belonging to the
reference group (i.e. in this case, FUP3). A positive 'B', on the contrary, means that an
increase in the independent variable is associated with an increase in the predicted probability
to belong to the comparison group, i.e. negative regression coefficients lead to a lower
probability and positive coefficients to a higher probability that an observation belongs to the
comparison group. Regression coefficients close to 0 mean that the variable does not
contribute to the separation of the reference group and the considered group. For 'B' values
different from 0, the strength of impact is best reflected by the odds ratio (cf. Backhaus et al.,
2006, p. 475f). An odds ratio greater than 1 of an independent variable means that an increase
of one unit on the scale value leads to an increase in the odds of belonging to this specific
group by the given factor.175 An odds ratio value less than 1 of an independent variable means
that an increase of one unit on the scale value leads to a decrease in the odds of belonging to
this specific group by the given factor.176
To test for the significance of the parameters, a likelihood ratio test should be applied in a
multinomial regression model (Hosmer and Lemeshow, 1989, p. 222). This has already been
provided in this section and proves the significance of all variables across the multinomial
Model P2. However, it must be noted that, although all variables of Model P2 are significant
according to the likelihood ratios test, some of the parameters in Table 23 are not significant
in all multinomial logit estimates according to Wald statistics. Insignificance according to
Wald statistics might be explained by small sample sizes. Variables that are not significant in
Model P2 according to both the likelihood ratios test and Wald statistics will not be
interpreted in the following. Nevertheless, it must be noted that the appropriateness of the
model is supported by the fact that Wald statistics are less reliable when the sample size is
small to moderate, and that the likelihood ratio test should be preferred in case the two tests
yield different results (cf. Agresti, 2007, p. 13; Kleinbaum et al., 1998, p. 652).
In Table 23, the parameter estimates of the multinomial regression model are presented,
with group FUP3 as the reference group. This group represents all companies that do not
currently utilize patents in external financing instruments and may neglect to do so in the near
175 For example, if the scale value is increased by one unit and the odds ratio value is 1.5, then the odds of
belonging to the considered group changes from the balanced ratio of 1 : 1to an increased ratio of 1.5 : 1. 176 For example, if the scale value is increased by one unit and the odds ratio value is 0.5, then the odds of
belonging to the considered group changes from the balanced ratio of 1 : 1to a decreased ratio of 0.5 : 1.
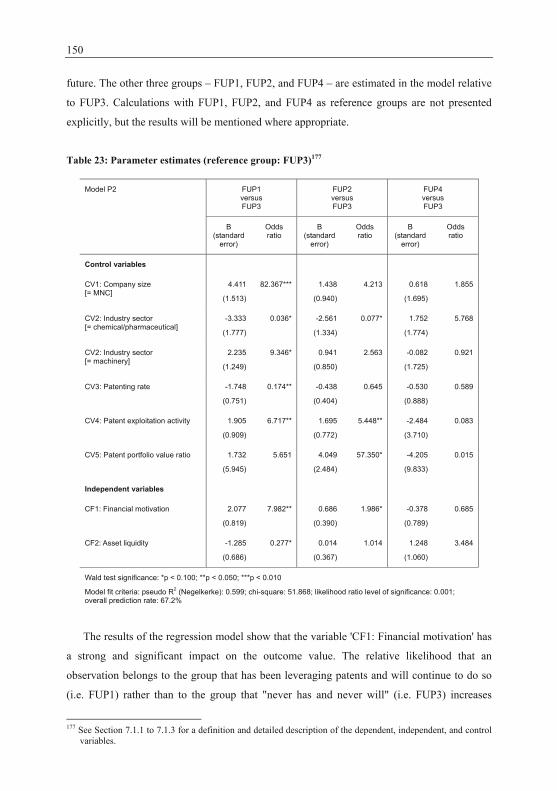
150
future. The other three groups – FUP1, FUP2, and FUP4 – are estimated in the model relative
to FUP3. Calculations with FUP1, FUP2, and FUP4 as reference groups are not presented
explicitly, but the results will be mentioned where appropriate.
Table 23: Parameter estimates (reference group: FUP3)177
Model P2 FUP1 versus FUP3
FUP2 versus FUP3
FUP4 versus FUP3
B
(standard error)
Odds ratio
B (standard
error)
Odds ratio
B (standard
error)
Odds ratio
Control variables
CV1: Company size [= MNC]
4.411
(1.513)
82.367***
1.438
(0.940)
4.213
0.618
(1.695)
1.855
CV2: Industry sector [= chemical/pharmaceutical]
-3.333
(1.777)
0.036*
-2.561
(1.334)
0.077*
1.752
(1.774)
5.768
CV2: Industry sector [= machinery]
2.235
(1.249)
9.346*
0.941
(0.850)
2.563
-0.082
(1.725)
0.921
CV3: Patenting rate -1.748
(0.751)
0.174**
-0.438
(0.404)
0.645
-0.530
(0.888)
0.589
CV4: Patent exploitation activity 1.905
(0.909)
6.717**
1.695
(0.772)
5.448**
-2.484
(3.710)
0.083
CV5: Patent portfolio value ratio 1.732
(5.945)
5.651
4.049
(2.484)
57.350*
-4.205
(9.833)
0.015
Independent variables
CF1: Financial motivation 2.077
(0.819)
7.982**
0.686
(0.390)
1.986*
-0.378
(0.789)
0.685
CF2: Asset liquidity -1.285
(0.686)
0.277*
0.014
(0.367)
1.014
1.248
(1.060)
3.484
Wald test significance: *p < 0.100; **p < 0.050; ***p < 0.010
Model fit criteria: pseudo R2 (Negelkerke): 0.599; chi-square: 51.868; likelihood ratio level of significance: 0.001; overall prediction rate: 67.2%
The results of the regression model show that the variable 'CF1: Financial motivation' has
a strong and significant impact on the outcome value. The relative likelihood that an
observation belongs to the group that has been leveraging patents and will continue to do so
(i.e. FUP1) rather than to the group that "never has and never will" (i.e. FUP3) increases
177 See Section 7.1.1 to 7.1.3 for a definition and detailed description of the dependent, independent, and control
variables.
151
significantly by a factor of 7.9 with an increase in CF1. Comparing the two groups with no
experience in the financial utilization of patents (i.e. comparing FUP2 to FUP3), an increase
in CF1 has a positive significant impact by a factor of merely 1.9 on the probability that an
observation belongs to the group that will leverage patents financially in the near future (i.e.
FUP2). Hence, the financial motivation has relatively little impact on the probability that
companies that do not utilize patents financially intend to do so in future or not. Comparing
those companies that have experience in the financial utilization of patents (i.e. comparing
FUP1 to FUP4), an increase in CF1 has a strongly significant impact (by a factor of 11.6) to
continue to utilize patents financially.178 This finding indicates that experienced companies
that continue to utilize patents in external financing instruments are strongly motivated to do
so. At the same time, this finding also indicates that there is a strong motivational gap
between experienced companies that report the intention to leverage patents financially in the
near future and those companies that report no intention to utilize patents financially in the
near future.
HCF1.1: The higher the financial motivation is, the higher the probability is that a
company does utilize patents in external financing instruments currently and in
the near future than that it does not do so currently and in the near future.
HCF1.2: The higher the financial motivation is, the higher the probability is that a
company that does not currently utilize patents in external financing instruments
intends to do so in the near future than that it does not intend to do so in the near
future.
HCF1.3: The higher the financial motivation is, the higher the probability is that a
company that does currently utilize patents in external financing instruments
intends to continue to do so in the near future than that it does not intend to
continue in the near future.
An examination of variable 'CF2: Asset liquidity' shows that liquidity is an impeding
factor for companies to leverage patents financially. An increase in CF2 significantly
increases the likelihood by a factor of 3.6 that a company belongs to the group that does not
use and does not intend to use patents financially in the near future (i.e. FUP3) than to the 178 A comparison of 'Prob1' and 'Prob4' is not explicitly presented in Table 23. The parameter estimates are
generated by a rearrangement of the groups, with 'Prop4' taken as the reference group.
152
group that currently uses patents financially and intends to do so in the near future (i.e.
FUP1). Comparing the companies that currently use patents financially (i.e. comparing FUP1
to FUP4), an increase in CF2 has a significant and strongly negative impact (by a factor of
12.6) that a company will not continue to leverage patents financially. This finding indicates
that the limited liquidity of the asset is a major reason for experienced companies to stop
leveraging patents financially.
HCF2.1: The higher the perceived lack of patent liquidity is, the higher the probability is
that a company does not utilize patents in external financing instruments
currently and in the near future than that it does do so currently and in the near
future.
HCF2.2: The higher the perceived lack of patent liquidity is, the higher the probability is
that a company that does utilize patents in external financing instruments does
not intend to continue to do so than that it does intend to do so in the near future.
Considering context factors of the financial utilization of patents, the two control variables
'CV1: Company size' and 'CV2: Industry sector' also show a significant impact on the odds
that a company utilizes patents financially or not. The likelihood that a company belongs to
the group that currently utilizes patents financially and intends to do so in the near future (i.e.
FUP1), instead of belonging to the diametrically opposite group FUP3, is significantly and
strongly higher (by a factor of 82.4) for MNCs than for SMEs. This means that MNCs turn
out to be much more inclined to utilize patents financially than SMEs. Considering industry
specifications, the odds ratio that a chemical/pharmaceutical company belongs to the group of
companies that do not currently utilize patents financially and in the near future (i.e. FUP3)
rather than to the group of companies that do so currently and in the near future (i.e. FUP1), is
significant and strong, at a factor of 28.0. The odds ratio that a machinery company belongs to
the group that does currently utilize patents financially and in the near future (i.e. FUP1) than
to the group that does not do so currently and in the near future (i.e. FUP3) is significant, at a
factor of 9.4. The odds ratio that a company in the electrical industry belongs to the group of
companies that do not currently utilize patents financially or in the near future (i.e. FUP3)
than to those that do currently utilize patents financially and in the near future (i.e. FUP1) is
significant and strong, at a factor of 10.0. Surprisingly, these findings show that companies in
the chemical/pharmaceutical and electrical industries do not currently utilize patents
153
financially and in the near future, but that companies in the machinery industry are more
likely to utilize patents financially and intend to do so in the near future.
HCV1.0: The probability that a company utilizes patents in external financing instruments
is higher for MNCs than for SMEs.
HCV2.0: The industry type of a company has a significant impact on the utilization of
patents in external financing instruments currently and in the near future.
HCV2.1: The probability that a company utilizes patents in external financing instruments
is lower for companies in the chemical/pharmaceutical industry than for other
companies.
HCV2.2: The probability that a company utilizes patents in external financing instruments
is lower for companies in the electrical industry than for other companies.
HCV2.3: The probability that a company utilizes patents in external financing instruments
is higher for companies in the machinery industry than for other companies.
The analysis of further control variables shows that the variable 'CV3: Patenting rate' has a
negative impact on the probability that a company utilizes patents financially. Surprisingly,
the likelihood that a company belongs to the group that does not currently utilize patents
financially and in the near future (i.e. FUP3) increases with the patenting rate by a factor of
5.7, instead of belonging to the group that does utilize patents financially and does intend to
do so in the near future (i.e. FUP1). Considering the context factor 'CV4: Patent exploitation
activity', the odds that a company with no experience (i.e. FUP2 and FUP3) belongs to the
group that intends to utilize patents financially in the near future (i.e. FUP2) increases
significantly (by a factor of 5.5) with an increasing level of existing patent exploitation
activity. A similar significant odds ratio of 6.7 applies for companies that do have experience
and intend to continue to utilize patents financially in the near future (i.e. FUP1), compared to
those that do not currently utilize patents financially and do not plan to do so in the near
future (i.e. FUP3). Finally, the examination of the control variable 'CV5: Patent portfolio
value ratio' shows that the probability that a company with no experience in utilizing patents
financially (i.e. FUP2 and FUP3) belongs to those that do intend to start utilizing patents
154
financially in the near future (i.e. FUP2) significantly and strongly increases with this variable
(by a factor of 57.4). This finding means that the likelihood that a company intends to utilize
patents financially in the near future increases tremendously with the value ratio of the patent
portfolio.
HCV3.0: The higher the patenting rate of a company is, the lower the probability is that it
utilizes patents in external financing instruments currently and in the near
future.
HCV4.0: The higher the patent exploitation activity of a company is, the higher the
probability is that it utilizes patents in external financing instruments currently
and in the near future.
HCV5.0: The higher the patent portfolio value ratio is of a company, the higher the
probability is that it utilizes patents in external financing instruments in the near
future.
7.3 SYNOPSIS OF THE ANALYTICAL SURVEY RESULTS
In this chapter, the results of the analytical model are presented and hypotheses about the
financial utilization of patents in external financing instruments are generated. Based on a
multinomial regression, it turns out that the two independent variables 'CF1: Financial
motivation' and 'CF2: Asset liquidity' and all control variables show a highly significant
impact on the dependent variable, while the variables 'CF3: Resource-based barrier', 'CF4:
Discredit barrier', and 'CF5: Organizational barrier' do not show a significant impact within
the model and do not considerably increase the model fit. The analytical model with the two
independent variables CF1 and CF2 and all control variables has a high model fit level and
explains 59.9% of the variance of the financial utilization of patents. However, it must be
noted that, although all variables of this model are significant according to the likelihood
ratios test, some of the parameters are not significant according to Wald statistics. Variables
that are not significant according to both the likelihood ratios test and Wald statistics are not
interpreted, as indicated in the overview of variable interpretation (Figure 29).
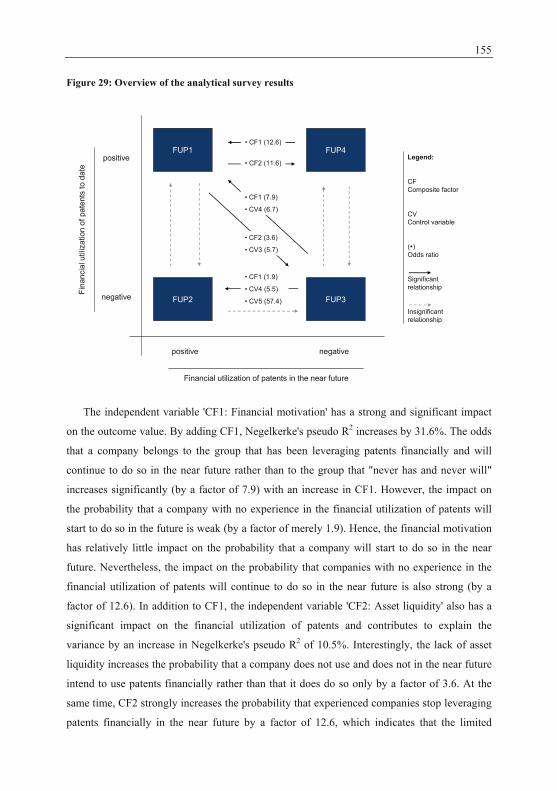
155
Figure 29: Overview of the analytical survey results
positive negative
negative
positive
Fina
ncia
l util
izat
ion
of p
aten
ts to
dat
e
Financial utilization of patents in the near future
FUP1
FUP2 FUP3
FUP4
• CF1 (7.9)
• CV4 (6.7)
• CF2 (3.6)
• CV3 (5.7)
• CF1 (12.6)
• CF1 (1.9)
• CV4 (5.5)
• CV5 (57.4)
• CF2 (11.6)Legend:
CF Composite factor
CV Control variable
( ) Odds ratio
Significant relationship
Insignificant relationship
The independent variable 'CF1: Financial motivation' has a strong and significant impact
on the outcome value. By adding CF1, Negelkerke's pseudo R2 increases by 31.6%. The odds
that a company belongs to the group that has been leveraging patents financially and will
continue to do so in the near future rather than to the group that "never has and never will"
increases significantly (by a factor of 7.9) with an increase in CF1. However, the impact on
the probability that a company with no experience in the financial utilization of patents will
start to do so in the future is weak (by a factor of merely 1.9). Hence, the financial motivation
has relatively little impact on the probability that a company will start to do so in the near
future. Nevertheless, the impact on the probability that companies with no experience in the
financial utilization of patents will continue to do so in the near future is also strong (by a
factor of 12.6). In addition to CF1, the independent variable 'CF2: Asset liquidity' also has a
significant impact on the financial utilization of patents and contributes to explain the
variance by an increase in Negelkerke's pseudo R2 of 10.5%. Interestingly, the lack of asset
liquidity increases the probability that a company does not use and does not in the near future
intend to use patents financially rather than that it does do so only by a factor of 3.6. At the
same time, CF2 strongly increases the probability that experienced companies stop leveraging
patents financially in the near future by a factor of 12.6, which indicates that the limited
156
liquidity of the asset is a major reason for experienced companies to stop leveraging patents
financially.
Considering context factors of the financial utilization of patents, the two control variables
'company size' and 'industry sector' also show a significant impact on the likelihood that a
company utilizes patents financially or not. MNCs are much more inclined to utilize patents
financially than SMEs. Surprisingly, the analytical models also indicate that companies in the
chemical/pharmaceutical and electrical industries do not utilize patents financially, but that
companies in the machinery industry are more likely to utilize patents financially. Another
surprising result is that the control variable 'CV3: Patenting rate' has a negative impact on the
likelihood that a company utilizes patents financially by a factor of 5.7. The control variable
'CV4: Patent exploitation activity' does have a positive impact on the probability that
companies with no experience intend to utilize patents financially in the near future by the
factor of 5.5. A similar significant impact of CV4 (by a factor of 6.7) applies to companies
with experience in leveraging patents financially and intend to proceed in the near future,
compared to those that do not currently utilize patents financially and do not plan to do so in
the near future. Finally, the examination of the control variable 'CV5: Patent portfolio value
ratio' shows that the probability that a company with no experience in utilizing patents
financially belongs to those that do intend to start utilizing patents financially increases with
this variable significantly and strongly (by a factor of 57.4). This finding means that the
likelihood that a company intends to utilize patents financially in the near future increases
tremendously with the value ratio of the patent portfolio. Verified with regard to the high
level of explained variance (41.2%) by control variables only, it turns out that company size,
the general affinity towards progressive patent management activities, and a relatively high
value ratio of the patent portfolio explain the likelihood as to whether or not a company
utilizes patents in external financing instruments to a large extent.
8 DISCUSSION AND IMPLICATIONS In the previous chapters, the descriptive and analytical results of this study were presented and
summarized. In the following, I will therefore not provide a detailed repetition of the
empirical results, but I discuss the findings and provide implications that can be drawn from
these findings for researchers, practitioners, and policy-makers. I will also identify limitations
of the study and further research opportunities.
The active management of patent portfolios, with the aim of turning IP departments from
cost centers into profit centers by transforming patents from passive legal rights into
economic assets, has increased among patent holders and has been studied by researchers
since the 1980s. This trend is related to the strongly increasing strategic and operative
relevance of technological assets and the fact that intangibles, such as IP assets, make up the
majority of corporate market values today. In this regard, this thesis provides – to my
knowledge – the first detailed collection and analysis of empirical data about the utilization of
patents in external financing instruments in Germany. It also provides, for the first time, a
collection and examination of impeding and motivating factors to leverage patents financially
from the company perspective. The results of this study therefore constitute very relevant
basic information in the field of leveraging patents financially. The findings are important due
to the high relevance and the high value share of patent portfolios, on the one hand, and the
difficult and as yet uncharted financial impact of these assets, on the other hand. The findings
are based on a large-scale survey, which was developed based on literature findings and
exploratory interviews. The descriptive and analytical examination of the large-scale survey
has generated a variety of interesting findings, which I will now discuss.
Starting with a re-examination of patent characteristics that are important for financial
utilization, the empirical study delves into the 'liquidity question' and the 'value question' of
patents. Generally, own findings on patent characteristics largely correspond with previous
research findings, such as of the PatVal study. Regarding the liquidity of the patents, on
average 10.1% of the respondents' patent portfolios were involved in licensing activities such
as in-licensing, out-licensing, and cross-licensing agreements.179 Respondents indicated only a
slightly increasing trend in patent exploitation or patent acquisition activities. A noticeable
179 Company size and industry specifications, which are particularly apparent with regard to licensing activities,
will be discussed later in this section.
D. de. Vries, Leveraging Patents Financially, DOI 10.1007/978-3-8349-6903-3_8, © Gabler Verlag | Springer Fachmedien Wiesbaden GmbH 2011
158
increasing transaction rate and growth of markets for technology and, thereby, increasing
patent liquidity, can therefore not be expected in Germany between 2005 and 2010.
Considering the value question, more than two-thirds of all companies across company size
and industry clusters reported that they held patent portfolios worth more than EUR 1 million.
Based on the assumption that such portfolios may potentially be appropriate for financial
utilization, most companies in patent-intensive industries may do so. Notably, the high
potential appears to be spread across company size clusters, as the thesis sample consists of
SMEs, with a dominant share of 74.0%. The average value of single patents has also been
calculated in this study by dividing the portfolio value by the number of patents in the
portfolio. In the process, I have not referred to the total number of patents in the portfolio but,
only to the share that contributes to the portfolio value. These have been identified by asking
respondents for the percentage of patents which they consider externally exploitable. It turns
out that the overall mean value of exploitable patents is EUR 1.004 million, while the median
is EUR 0.237 million. Own research findings on the value distribution of single patents
largely resemble the PatVal findings on patent value distribution.180 A detailed comparison
shows that the value distribution of this study is lower and that there are no patents worth
more than EUR 30 million. The shift towards a lower value distribution in the thesis sample
can be explained by the circumstance that I did not ask respondents for a precise figure as the
PatVal researchers did, but asked for an assignment in 1 of 8 value classes and then referred
to the lower limit to calculate the mean value. The lack of highly valuable patents worth more
than EUR 30 million can be explained by the fact that I refer to average values, while the
PatVal researchers asked respondents to state the value of single patents.
While an appropriate liquidity and value are compulsory requirements to utilize patents
financially, the actual financial exploitability also depends on the company's strategic and
operative patent usage restrictions. Therefore, I asked respondents about their patents'
endogenous financial exploitability (for a description of the concept, see Section 5.2). It must
be noted that the statistical examination of this question includes only the answers of those
respondents who reported experience in the financial utilization of patents. Therefore, this
question is not appropriate for an examination of the actual extent and potential of the
180 It must be noted that the authors of the PatVal study did not select patents by asking for externally exploitable
patents only. The PatVal researchers "increased the number of valuable patents in their sample by over-sampling patents that were either opposed under the EU opposition procedure before they were granted or that were not opposed, but had received at least one citation by the time they sent out the questionnaires. [...] Both oppositions and citations are correlated with the value of the patents"(Giuri et al., 2007, p. 1109). Furthermore, PatVal researchers addressed the survey to inventors, who tend to overestimate the value of their patents (Giuri et al., 2007, p. 1110).
159
utilization of patents in external financing instruments, which was examined separately and
will be discussed next. It turns out that the statements of the respondents are largely in line
with the logic of the concept developed in Section 5.2, i.e. the higher the degree of exploitive
freedom of the patent, the higher the percentage of respondents who are willing to dispose the
patents to an increasing level of external exploitation. Considering the correlation in greater
detail, the percentage of respondents who are willing to dispose patents that are for own use at
the outset (i.e. the most restricted patents) to patent funds (i.e. the financing instrument with
the most extensive asset exploitation and loss of control for the original patent holder) is
surprisingly high, at 20.0%. Another surprising factor is the negative correlation between the
degree of exploitive freedom of the patent and the percentage of respondents who are willing
to dispose patents in order to get bank loans. This finding might indicate that respondents not
only referred to the maximum exploitability of patents, but also pursued the most effective
exploitation of the patent portfolio, as they might think that patents with a high degree of
exploitive freedom should not be "captured" in the most restrictive financing instruments, but
might hold higher benefits in financing instruments that make use of external exploitability.
This finding might indicate a relatively refined assessment of the endogenous financial
exploitability of patents by respondents.
Examining the actual extent of the financial utilization of patents, it turns out that a high
percentage of companies has experience in the utilization of patents in external financing
instruments such as equity transactions, debt financing, sale/lease-back transactions, or patent
funds. More than two-thirds of all MNCs and more than one-third of all SMEs reported
experience of managing patents in equity transactions. Whether patents had consciously been
leveraged in transactions and how relevant this particular asset group was in the transaction is
an open question. For instance, 36.4% of all SMEs reported that patents had been objects of
equity transactions, but only half of these reported that they had influenced the equity deal.
Eventually, it can be stated that experience with patents in equity transaction was widespread
across companies in patent-intensive industries, but that the role and relevance of the
particular asset in the deal must be examined in every case. Considering bank loans, 20.0% of
all companies reported experience of utilizing patents as collateral. A limited relevance of
patents in bank loan acquisition was indicated, as they were mostly used as minor collateral.
Only 3.2% of the companies had to date utilized patents as major collateral. Furthermore, the
overall number of companies utilizing patents as minor collateral is higher than the overall
percentage of companies that reported that patents influenced the lending decision or the
160
lending conditions. This finding indicates that companies might utilize patents not only upon
their own initiative, but also because capital providers might ask them to do so. The negative
gap between action and influence is much stronger in the machinery industry than in the
chemical/pharmaceutical industry. In the electrical industry, this gap is positive, with more
companies using patents to influence bank loans rather than using them as collateral. This
indicates that patents can also be effectively used as rating indicators. The percentage of
companies with experience in the utilization of patents in sale/lease-back transactions and
patent funds is a mere 3.1% each. Considering growth potential, all financing instruments
show some potential, with sale/lease-back transactions and patent funds showing the highest
potential. In particular, patent funds show a high growth potential, with 10 times more
companies intending to use this instrument compared to de facto past use. In short, the
findings show that the utilization of patents in external financing instruments is not an
exceptional or chance occurrence, but something companies have done in the past and intend
to do in future. Furthermore, significant growth potential has been identified. Nevertheless,
the actual relevance and influence of patents in external financing instruments appears to be
limited.
The high strategic and operative relevance and the high value share of patent portfolios in
many companies' value structure are not reflected in financial terms. The identification and
examination of influence factors from the company perspective helps to explain the
perceptive gap between the importance of these assets to the firm and their limited utilization
in acquiring external funds. By differentiating between financial, asset-related, and
managerial influence factors, the analysis covers an extensive set of reasons as to why
companies may utilize patents financially or not. The influence factors were examined by
means of both a descriptive consideration of the empirical results and an analytical model. In
the analytical model, the dependent variable is based on observing whether companies had
been utilizing patents in external financing instruments and/or intend to do so in the near
future. To generate an appropriate set of independent variables for the analytical model, a
factor analysis was applied to condense the various influence factors into a smaller set of new
composite dimensions. I will now discuss the results of the analytical model and the
descriptive results of the single items represented by the composite factors.
The first composite factor 'financial motivation' represents all influence factors that may
motivate companies to utilize patents in external financing instruments. The analytical model
161
shows that the impact of the financial motivation on the probability of a company utilizing
patents in external financing instruments is strong, highly significant, and explains 31.6% of
the variance. However, considering companies that had not yet utilized patents financially, the
motivation has relatively little impact on the probability of a company belonging to the group
that intends to start utilizing patents financially in future. The potential growth rate of patent-
based financing instruments is therefore to a significant extent triggered by the patent holder's
financial motivation, but only with limited strength of impact. By comparing those companies
with experience in utilizing patents financially, the impact of financial motivation turns out to
have a strong significant impact on the intention to continue patent utilization. This finding
indicates that experienced companies that continue to utilize patents financially are strongly
motivated to do so and that those who do not continue to do so lack financial motivation. A
lack of motivation by experienced companies might either be explained by the circumstance
that these companies might never have been motivated to leverage patents financially, but
might have acted upon capital providers' request, or by the circumstance that these companies
experienced strong frustration in utilizing patents financially. The latter factor is analyzed and
discussed later in this section by examining impeding influence factors. A detailed
consideration of the single items represented by the composite factor 'financial motivation'
shows that the strongest factor is the opportunity to commercialize patents in order to generate
additional revenues. The empirical analysis therefore confirms the experience of
intermediaries and the impression gained in own exploratory interviews that companies are
generally more interested in commercially exploiting patents to generate additional revenues
than to utilize patents in external financing instruments with the aim of increasing the
acquired capital volume or decreasing the capital costs. This is also reflected by the finding
that firms report the highest interest and potential in utilizing patents within patent funds.
Nevertheless, the descriptive results show that the improvement of the capital base and capital
costs are motivating, while other factors such as changes in the course of Basel II are not
motivating factors at all as respondents clearly do not expect that Basel II will notably
improve capital providers' ability to recognize IP assets as collateral in a more beneficial way.
Surprisingly, reasons relating to balancing or tax turn out to be only slightly motivating
factors. Concerning the prominence of the reporting gap and its problems, as discussed in the
financial literature, the weak stimulating effect of the opportunity to release hidden reserves
and to narrow the reporting gap is surprisingly low. Hence, either the need to narrow the
reporting gap is not perceived as strong enough to take the opportunity of utilizing patents, or
the instruments to narrow the gap with the utilization of patents are not adequate. External
162
financing instruments that may be used for balancing effects and that are examined in this
study are equity transactions and sale/lease-back transactions.181 Equity transactions would
imply using patents as capital contribution in kind in exchange for company shares. Unless
such transactions are not pursued for strategic reasons, it appears unlikely that they are
pursued solely to yield balancing effects. Furthermore, it is difficult to use patents as capital in
kind, since the restrictions on the valuation of capital in kind are relatively high. If the
primary motivation behind the transaction would be to yield balancing effects, approval by
financial authorities would be questionable. Sale/lease-back transactions might either be
conducted within a consolidated group of companies or with financial institutions. According
to several post-study interviews, sale/lease-back transactions between business units of larger
corporations are actually practiced. These transactions are sophisticated corporate financing
activities by larger corporations and were not identified as such at the outset of this study.
Within the scope of this thesis, a more relevant question is why sale/lease-back transactions
have to date not been more frequently conducted also by smaller companies and financial
institutions. As learned from literature findings, key barriers to such transactions are the
requirement of high transaction volumes to yield a profitable cost-benefit ratio. Furthermore,
one of the chief financial officers in this study reported that he would be much more
conservative in using patents for sale/lease-back transactions than using his real estate assets,
which he had frequently used for sale/lease-back transactions. He noted that loss of control
over patents is a major barrier and that the financial utilization of patents that belong to the
core business is limited to a rating or value indication function. It must be mentioned that the
response to the question as to why patent portfolios are not subject to sale/lease-back
transactions, while real estate frequently is, led to moments of surprise in many interviews,
indicating that patents had to date not been seriously considered for utilization in sale/lease-
back transactions. Having asked experts whether patents might in future be considered more
often for sale/lease-back transactions, they reported that financial authorities are likely to
close the window of opportunity before considerable tax benefits might be realized at the
national economic level. Therefore, they concluded that sale/lease-back transactions with
patents will primarily be done for liquidity reasons rather than for balancing effects.
181 Regarding the other examined financing instruments, patent funds may be considered as a sub-form of equity
transactions in the context of balancing effects, since patents are contributed in exchange for participation in the fund, and the utilization of patents to acquire bank loans has no effect on the opportunity to perceive patents as assets within financial statements.
163
The second composite factor 'asset liquidity' has also a significant impact on the financial
utilization of patents and explains 10.5% of the variance within the analytical model.
Surprisingly, this variable has a relatively weak impact on the probability that a company
belongs either to the group of companies that "never has and never will" utilize patents
financially or to the group with experience and the intention to continue the financial
utilization of patents. Nonetheless, comparing companies with experience in leveraging
patents financially, the variable has a significant and strong impact on the probability that a
company belongs to the group that will stop to leverage patents financially in future. This
finding underlines the presumption that some companies' lack of motivation to continue
utilizing patents financially, as noted, might be caused in part by frustrating experiences. A
detailed consideration of the single items represented by the variable confirms that the most
frequently cited factors 'lack of valuation methods' and 'high transaction costs' are in fact most
hampering, even though respondents did not consider them 'prohibitive' or 'strongly
impeding'. Closely related to 'lack of valuation methods' and almost equally impeding for
company representatives is the concern that capital providers may assess the patent value with
a high deduction for risk. Respondents also reported that they are generally impeded by the
awareness that capital providers are relatively unwilling to accept patents, which may also be
ascribed to the asset's limited liquidity. This finding raises a chicken-and-egg problem, i.e. the
question whether patent holders are hampered in utilizing patents financially, because capital
providers are unwilling to consider patents, or whether capital providers rarely consider
patents, because companies seldom ask them to do so? Considering the relatively high
utilization of patent as minor collateral, it appears that patents are often taken into account but
only have limited relevance for capital providers.
The other composite factors 'resource-based barrier', 'discredit barrier', and 'organizational
barrier' do not show a significant impact on the outcome variable 'financial utilization of
patents' and do not contribute considerably to explain the variance in the analytical model.
This is particularly surprising for the variable 'resources-based barrier', because the
descriptive results show relatively high measures for several components, with a high degree
of accordance across all survey entities. This contradiction might be explained if respondents
pointed out the present status of resources as an impeding factor while acting on the
assumption that the resources allocation will and can be adjusted easily. Considering the
single factors represented by the composite factor 'resource-based barrier', a 'lack of suitable
patents' was frequently identified as a key barrier within the pre-study. On the contrary, the
164
survey revealed that a shortage of assets appears to be a slightly impeding factor (i.e. far from
inhibiting within any company cluster). Together with the high value distribution of patent
portfolios, this finding indicates that the asset base is not the limiting factor in many
companies. Descriptive findings have also shown that the factor that a company might be part
of a holding that is responsible for the patent portfolio and, therefore, not able to utilize
patents, is hardly impeding. However, it must be taken into account that this result might well
be biased, since companies with a limited patent responsibility are unlikely to have
participated in the study. Contradictory to the results of the analytical model is the impeding
influence of the variable 'lack of awareness' within the descriptive findings. The limited
impact in the analytical model might be explained by striking company cluster differences.182
A limited awareness in many companies is also indicated by a subjective impression gained in
own exploratory interviews that many managers have a fairly reluctant and skeptical attitude
towards the financial utilization of patents, particularly compared with other asset-based
financing activities, such as real estate sale/lease-back transactions. The insignificant impact
of the last two composite factors – 'discredit barrier' and 'organizational barrier' – is in line
with the descriptive results of the empirical study, which show little influence of the single
variables.183
There are also other important impeding influence factors that were not represented by the
composite factor in the analytical model, because they were excluded through factor analysis,
such as the 'complex and complicated nature' of financial patent utilization compared to other
financing activities, 'troll concerns', and 'hampering legal framework.' The descriptive results
show that the legal framework is not considered impeding across company size and industry
clusters. 'Troll concerns' were mainly reported as a concern by smaller companies in the
machinery industry but not by other survey entities. However, the 'complex and complicated
nature' of patent-based financing activities appeared to be the strongest impeding factor for
companies across all company clusters. Unfortunately, the factor analysis results did not
permit the inclusion of this variable in the analytical model, which might have made a
valuable contribution to the interpretation of the analytical results.
182 While 'lack of awareness' is barely expressed by respondents in the chemical/pharmaceutical industry, it is
considered of impeding influence in the machinery and electrical industries. 183 The variables represented by these two composite factors are 'discredit of the capital market', 'discredit of
stake holders', 'internal managerial resistance', and 'transparency of patent values.'
165
In addition to motivating and impeding influence factors, the analytical model also
considered context-related factors, i.e. control variables such as 'industry type', 'company
size', and certain patent portfolio characteristics. With a pseudo R2 of 41.2%, the set of control
variables explains a high percentage of the outcome variable within the analytical model, i.e.
the likelihood of a company utilizing patents in external financing instruments or not. To start
with the variable 'company size', earlier research found that company size explains a large
part of the variation in the extent to which patents are used or licensed (see, e.g., Giuri et al.,
2007, p. 1119). Own research findings confirm that this is also true for the financial utilization
of patents. MNCs turn out to be much more inclined to utilize patents financially than SMEs.
The analytical model shows that the likelihood is significantly and strongly higher for MNCs
than for SMEs to belong to the group of companies that utilizes patents financially at present
and in the near future, than to belong to the diametrically opposite group of companies, which
"never has and never will." Specifically, the percentage of MNCs reporting the utilization of
patents in equity transactions or debt financing is more than twice as high as the percentage of
SMEs. Considering industry specifications, companies in the machinery and electrical
industries generally appear less active and less progressive in patent management activities
than companies in the chemical/pharmaceutical industry. This is also reflected by companies
in the machinery industry reporting that a lack of markets for technology is a strongly
impeding factor for them to utilize patents financially, while this is only a slightly impeding
factor for companies in the chemical/pharmaceutical industry. Accordingly, with 19.8% of
patents involved in licensing agreements, chemical/pharmaceutical firms hold almost a three
times higher percentage of licensed patents than companies in the machinery and electrical
industries. Earlier research, for example a study by Lichtenthaler (2006, p. 268ff), provides
support for the leading role of chemical/pharmaceutical firms in external technology
commercialization by showing that they have the most professional approach and attribute
significantly more importance and resources to external technology exploitation than firms in
other industry sectors. He also finds that the differences between the machinery and electrical
industries are fairly small. Accordingly, companies in the chemical/pharmaceutical industry
generally demonstrate a higher motivation to utilize patents financially than companies in the
electrical industry and a distinctively higher motivation than companies in the machinery
industry. This differentiation is not only true for the motive to generate additional revenues
but also with regard to the motives to increase the capital base and/or to decrease capital costs.
The benefits of a financial utilization of patents are allocated respectively. While only half the
companies in the machinery industry reported that terms and conditions were influenced by
166
utilizing patents for debt financing, all companies in the chemical/pharmaceutical industry
reported that they managed to improve lending terms by utilizing patents. It must be
mentioned that there are more companies in the electrical industry that had influenced a loan
agreement by means of patents than those that had used patents as collateral, indicating that
some companies had effectively utilized patents as rating indicators. Surprisingly, the
analytical findings indicate, however, that companies in the machinery industry are more
likely to utilize patents financially at present and in the near future than companies in the
chemical/pharmaceutical and electrical industries. This finding is contrary to the descriptive
results, and demonstrates that the impact of motivational factors on the likelihood of a
company to leverage patents financially or not is limited, although it is significantly
verifiable. Even so, the fact that chemical/pharmaceutical companies turn out to be less active
in leveraging patents financially is surprising, since this industry sector is relatively
sophisticated and progressive concerning other patent management activities. Interviews with
company representatives emphasize that the strategic relevance of patents is particularly high
in the chemical/pharmaceutical industry and that a financial utilization involving loss of
control over the asset is unacceptable for company representatives in this industry. Otherwise,
financial utilization in terms of an external exploitation through licensing activities, which has
not been part of the outcome variable in the analytical model, has seen fairly extensive usage
in this industry.
In addition to company size and industry specifications, the analytical model also includes
context variables that reflect patent portfolio characteristics, i.e. 'patenting rate',184 'patent
exploitation activity',185 and 'patent portfolio value ratio.'186 Surprisingly, the variable
'patenting rate' shows a negative impact on the likelihood that a company belongs to the group
of companies that currently utilize patents financially and in the near future. This finding
indicates that the higher a company's R&D output (measured in patent applications) is, the
lower is the likelihood that the company will leverage patents financially. There are no
explanations at hand for this relationship; further studies are necessary to interpret this
finding. As expected, the next context variable 'patent exploitation activity' shows a positive
relationship with the financial utilization of patents. An increasing level of existing patent
exploitation activities significantly and strongly increases the likelihood that a company
184 'Patenting rate' is defined as the ratio of patents developed in the past five years to the total number of active
patents in the company's patent portfolio. 185 'Patent exploitation activity' is defined as the percentage of patents involved in licensing activities to the total
number of patents in the company's patent portfolio. 186 'Patent portfolio value ratio' is defined as the ratio of the patent portfolio value to the company value.
167
belongs to the group that leverages patents financially at present and in the near future, rather
than not. Likewise, an increase in this context variable increases the probability that
companies with no experience belong to the group that intends to utilize patents financially in
the near future. Finally, the impact of the context variable 'patent portfolio value ratio' turns
out to be very high. The impact of this variable is the strongest of all tested variables in the
analytical model. The odds that a company intends to start leveraging patents financially in
the near future, rather than not, increases greatly with the ratio of patent portfolio value to
company value.
Furthermore, I provide several managerial and policy implications. This study shows that
many firms have assigned high monetary values to their patent portfolios, but that their
motivation to utilize these values financially is limited. Companies should be aware that the
financial utilization of patents is a viable and frequently used means to acquire external
capital. Although the relevance and impact of patents within external financing instruments is
often limited, this study shows that there is a high potential for increased utilization, which
might reinforce its meaning and importance for both capital providers and capital seekers.
Particularly for technology-intensive companies with a high value share of patent portfolios in
long-term assets, the utilization of these assets may not only be an option, but rather a
necessity to access sound financing. In other words, capital seekers and capital providers must
put more effort in the financial utilization of patents and other intangible assets due to the
decreasing importance and value share of tangible assets that were traditionally utilized for
financial purposes. Concerning motivating factors, this study shows that there is considerable
interest in generating additional revenues through external patent exploitation, while
utilization to improve capital costs or increase the capital base is less important. Since the
average share of patent portfolios that may be licensed out is fairly small, a closer
consideration of the application of patents in external financing instruments is strongly
recommended. Certainly, the strategy to make use of the patent portfolio in external financing
instruments should be aligned with the overall corporate financial strategy and the corporate
innovation strategy. Managers should be aware that an initial set up phase is inevitable and
that it might not be possible to utilize patents for financial purpose at short notice due to the
complex nature of the asset and the lack of awareness and experience of involved persons
inside and outside the firm. In their spheres of influence, managers should create awareness of
the potential of utilizing patents financially throughout their organization, since the response
to this study's survey indicates that especially financial managers, who might profit most from
168
this, are usually not involved in this regard, and do not seriously consider the opportunity
presented by exploiting patent portfolios' value to acquire external capital. Although
organizational factors are not considered to be considerably impeding factors, own
exploratory interviews and prior research indicates that employees in many firms have fairly
reserved attitudes to an external utilization of patents generally and especially to a financial
utilization of patents (see, e.g., Lichtenthaler, 2006, p. 291). Therefore, the initiation to
leverage patents financially might need support from top management. To seize the
opportunity of leveraging patents financially, top management should involve R&D
managers, IP managers, and financial managers and should motivate them to proactively
identify leveraging potentials. Against the background of more extensive patent management
activities as a growing trend, the identification and administration of patents that might be
applied for external financing instruments should be a relatively small step. The operational
handling of patents should present little effort, since fluctuation within patent portfolios is
usually relatively low and the investment cycles are usually relatively long. A company's
operational handling of patents would mostly be limited to monitoring changes within existent
patents and the analysis of new patents in the portfolio. At any rate, financial requirements of
acquiring fresh capital and improving capital costs are – or should be – both standard and
permanent organizational tasks. Policy-makers may contribute to improving companies'
ability to utilize patents financially by supporting the development of markets for technology
that facilitate the valuability and tradability of patents for capital providers. Governmental
institutions could contribute to a more efficient and reliable valuability of patents by
providing support for research institutions and experts in the field to develop standardized
valuation procedures. These might reduce transaction costs and might also allow for a more
adequate accountability of a company's assets and liabilities structure, which is dominated by
intangible assets nowadays. In addition, public institutions might contribute to the tradability
of patents by providing support in developing an infrastructure for markets for technology.
Examples are CORDIS or the Steinbeis Foundation. While CORDIS is an internet-based
platform created by the European Union to trade technologies and to match technology
partners, the Steinbeis Foundation is initiated by the German government and private
investors to form a network of firms and research institutions to match the demand and supply
of technology assets (Arora et al., 2001b, p. 258f). To stimulate the participation of patent
holders in markets for technology and to increase the liquidity of these markets, financial
authorities might also introduce tax incentives such as reduced tax rates on profits from
external patent exploitation.
169
Finally, I will now point out the study's limitations and propose suggestions for further
research. To start with the empirical approach of this study, a potential respondent bias cannot
be excluded, as a majority of 61.6% of respondents turned out to be R&D or IP managers,
while only 4.7% were financial executives. While the matter integrates both topics, financial
management and technology management usually occur with little cross-sectoral interactions
within companies. For example, balancing and taxation is primarily done by and is important
to financial officers, but might be only of secondary presence to technology managers. More
generally, a potential bias may also be present, since mainly companies with stronger interest
in and inclination to utilize patents financially might have participated in the survey so as to
benchmark their activities. Concerning potential biases, further studies with larger research
samples and studies with other research topics and different types of respondents should be
conducted, particularly with a higher involvement of financial expertise. Another
methodological matter is that the analytical model does not refer to single financing
instruments, but combines several financing instruments to build the dependent variable.
Future studies could focus on single financing instruments. Concerning influence factors,
further studies could also adopt a project-level perspective by analyzing, for example, single
transactions in order to deepen the understanding of the influence factors and to develop a set
of success factors for financial utilization of patents. Further limitations concern the chosen
foci of this study, as summarized in the introduction (see Section 1.2.2). First, the focus on the
company perspective might be extended. Further research should analyze the perspective of
capital providers and intermediaries in detail. Eventually, a research perspective including all
parties – i.e. capital acquirers, intermediaries, and capital providers – could provide a holistic
picture of the influence factors. Due to this study's geographic focus, it would also be
interesting to compare the findings with studies in the European Union, US, and Japan.
Especially a comparison with research results on companies in the US would be interesting,
since a proactive utilization and exploitation of patents seems to be present there (see, e.g.,
Chesbrough, 2006, p. 28). In addition, the utilization of patents to acquire capital may not
only be analyzed in the private sector, but also for different organizations such as research
institutions. Apart from foci that have narrowed the results of this study, there are also aspects
that have allowed a broader picture. This study's aim was to provide a picture across company
size and industry clusters, and not to focus on specific company types such as technology-
intensive start-ups. This research approach implies that the specific situation of start-ups is not
explicitly reflected in this study, and may therefore be analyzed with a similar set of research
questions. While few large changes are expected in the short term, the results of this study

170
should be reconsidered in the medium term and long term, since several studies show that IP
management has changed dynamically within the past two decades and may continue to do so
into the future.
9 CONCLUSION
The present study contains the first collection of empirical data on the utilization of patents in
external financing instruments and factors that influence company activities in applying their
patent portfolios to increase their capital base or to improve their financing conditions. This
early effort to understand the utilization of patents in external financing instruments is based
on exploratory interviews and a large-scale survey that is presented descriptively and used for
analytical examination. Firstly, this thesis has demonstrated the role of patents as financial
assets and described prevalent patent-based financing instruments (i.e. equity transactions,
debt financing, sale/lease-back transactions, and patent funds) from the company perspective.
Secondly, I have derived influence factors for leveraging patents financially from the
company perspective based on literature findings and expert interviews. Thirdly, the study has
empirically examined the current extent and future potential of patents' utilization in such
external financing instruments, drawing on the data of 97 companies. The data was gathered
through a questionnaire-based survey across company size clusters and patent-intensive
industry clusters. The results are important for practitioners as they provide a benchmark and
for researchers as they provide, for the first time, a thorough picture of the actual financial
utilization of patents by German companies. Beyond measuring the extent and volume of the
financial utilization of patents, I have also examined motives for and barriers to companies
doing so. These were presented as descriptive results, have been examined in an analytical
model, and have served to generate hypotheses. From a methodological perspective, the
influence factors have not been tested as individual items but have been concentrated within
five composite factors by means of a factor analysis. In addition to influence factors for
managers, context factors such as company size, industry specifications, and patent portfolio
characteristics were analyzed within the analytical model. The study's results show that
companies in patent-intensive industries hold considerable values in the form of patent
portfolios and that patents can be utilized to access external sources of financing. The results
also provide a detailed overview of factors that influence companies in utilizing patents
financially. While all these factors turn out to be neither strongly impeding nor strongly
motivating, it will become increasingly important for technology-intensive companies to
make use of these values, as they account for a considerable fraction of their long term assets.
Against this background, this study may also help policy-makers create a better framework, to
allow for a stronger financial utilization of technological assets. I hope that the results will
D. de. Vries, Leveraging Patents Financially, DOI 10.1007/978-3-8349-6903-3_9, © Gabler Verlag | Springer Fachmedien Wiesbaden GmbH 2011

172
serve as a thorough groundwork and help researchers, practitioners, and policy-makers to gain
a better picture and understanding of the financial utilization of patents by German
companies.
Appendix 1:
General information on the concept of patents
D. de. Vries, Leveraging Patents Financially, DOI 10.1007/978-3-8349-6903-3, © Gabler Verlag | Springer Fachmedien Wiesbaden GmbH 2011
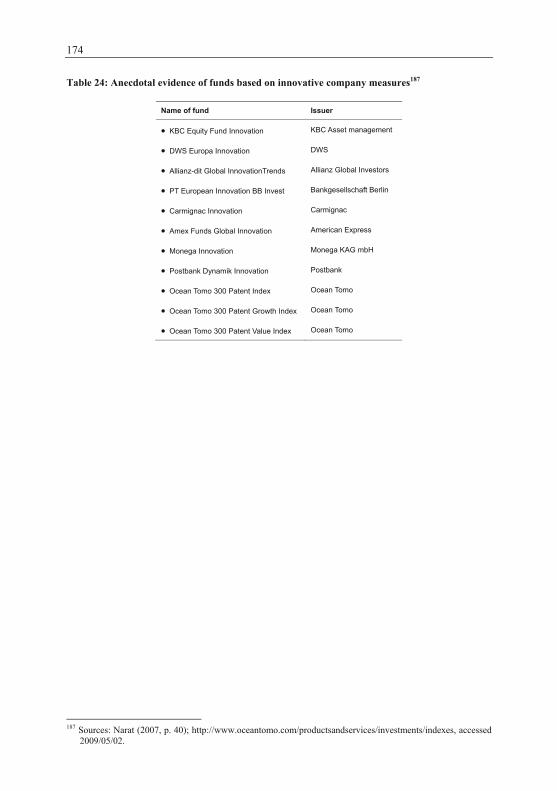
174
Table 24: Anecdotal evidence of funds based on innovative company measures187
Name of fund Issuer
KBC Equity Fund Innovation KBC Asset management
DWS Europa Innovation DWS
Allianz-dit Global InnovationTrends Allianz Global Investors
PT European Innovation BB Invest Bankgesellschaft Berlin
Carmignac Innovation Carmignac
Amex Funds Global Innovation American Express
Monega Innovation Monega KAG mbH
Postbank Dynamik Innovation Postbank
Ocean Tomo 300 Patent Index Ocean Tomo
Ocean Tomo 300 Patent Growth Index Ocean Tomo
Ocean Tomo 300 Patent Value Index Ocean Tomo
187 Sources: Narat (2007, p. 40); http://www.oceantomo.com/productsandservices/investments/indexes, accessed
2009/05/02.
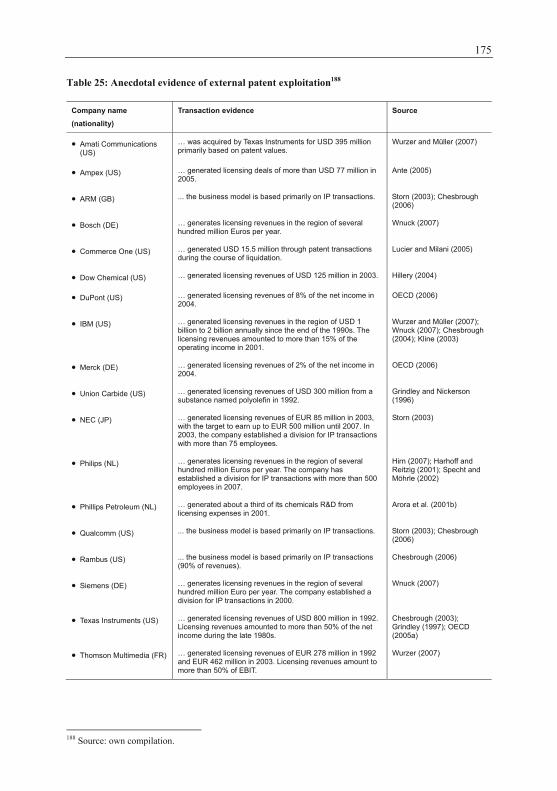
175
Table 25: Anecdotal evidence of external patent exploitation188
Company name
(nationality)
Transaction evidence Source
Amati Communications (US)
… was acquired by Texas Instruments for USD 395 million primarily based on patent values.
Wurzer and Müller (2007)
Ampex (US) … generated licensing deals of more than USD 77 million in 2005.
Ante (2005)
ARM (GB) ... the business model is based primarily on IP transactions. Storn (2003); Chesbrough (2006)
Bosch (DE) … generates licensing revenues in the region of several hundred million Euros per year.
Wnuck (2007)
Commerce One (US) … generated USD 15.5 million through patent transactions during the course of liquidation.
Lucier and Milani (2005)
Dow Chemical (US) … generated licensing revenues of USD 125 million in 2003. Hillery (2004)
DuPont (US) … generated licensing revenues of 8% of the net income in 2004.
OECD (2006)
IBM (US) … generated licensing revenues in the region of USD 1 billion to 2 billion annually since the end of the 1990s. The licensing revenues amounted to more than 15% of the operating income in 2001.
Wurzer and Müller (2007); Wnuck (2007); Chesbrough (2004); Kline (2003)
Merck (DE) … generated licensing revenues of 2% of the net income in 2004.
OECD (2006)
Union Carbide (US) … generated licensing revenues of USD 300 million from a substance named polyolefin in 1992.
Grindley and Nickerson (1996)
NEC (JP) … generated licensing revenues of EUR 85 million in 2003, with the target to earn up to EUR 500 million until 2007. In 2003, the company established a division for IP transactions with more than 75 employees.
Storn (2003)
Philips (NL) … generates licensing revenues in the region of several hundred million Euros per year. The company has established a division for IP transactions with more than 500 employees in 2007.
Hirn (2007); Harhoff and Reitzig (2001); Specht and Möhrle (2002)
Phillips Petroleum (NL) … generated about a third of its chemicals R&D from licensing expenses in 2001.
Arora et al. (2001b)
Qualcomm (US) ... the business model is based primarily on IP transactions. Storn (2003); Chesbrough (2006)
Rambus (US) ... the business model is based primarily on IP transactions (90% of revenues).
Chesbrough (2006)
Siemens (DE) … generates licensing revenues in the region of several hundred million Euro per year. The company established a division for IP transactions in 2000.
Wnuck (2007)
Texas Instruments (US) … generated licensing revenues of USD 800 million in 1992. Licensing revenues amounted to more than 50% of the net income during the late 1980s.
Chesbrough (2003); Grindley (1997); OECD (2005a)
Thomson Multimedia (FR) … generated licensing revenues of EUR 278 million in 1992 and EUR 462 million in 2003. Licensing revenues amount to more than 50% of EBIT.
Wurzer (2007)
188 Source: own compilation.
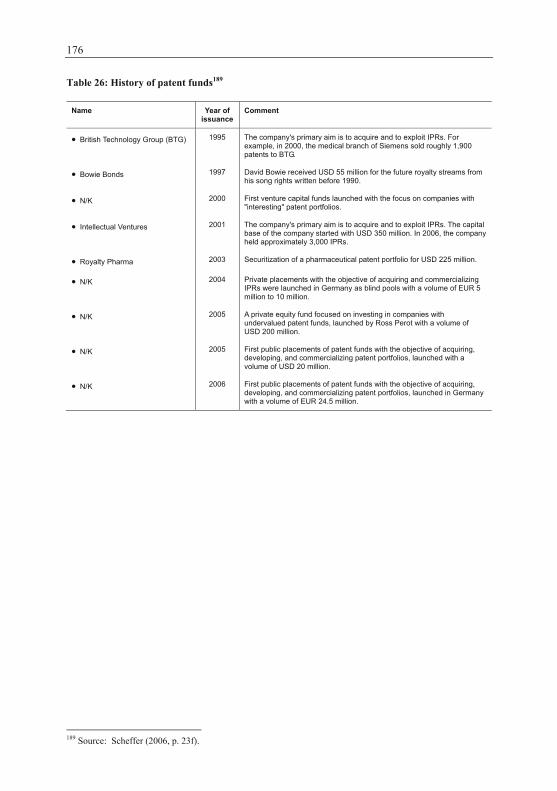
176
Table 26: History of patent funds189
Name Year of issuance
Comment
British Technology Group (BTG) 1995 The company's primary aim is to acquire and to exploit IPRs. For example, in 2000, the medical branch of Siemens sold roughly 1,900 patents to BTG.
Bowie Bonds 1997 David Bowie received USD 55 million for the future royalty streams from his song rights written before 1990.
N/K 2000 First venture capital funds launched with the focus on companies with "interesting" patent portfolios.
Intellectual Ventures 2001 The company's primary aim is to acquire and to exploit IPRs. The capital base of the company started with USD 350 million. In 2006, the company held approximately 3,000 IPRs.
Royalty Pharma 2003 Securitization of a pharmaceutical patent portfolio for USD 225 million.
N/K 2004 Private placements with the objective of acquiring and commercializing IPRs were launched in Germany as blind pools with a volume of EUR 5 million to 10 million.
N/K 2005 A private equity fund focused on investing in companies with undervalued patent funds, launched by Ross Perot with a volume of USD 200 million.
N/K 2005 First public placements of patent funds with the objective of acquiring, developing, and commercializing patent portfolios, launched with a volume of USD 20 million.
N/K 2006 First public placements of patent funds with the objective of acquiring, developing, and commercializing patent portfolios, launched in Germany with a volume of EUR 24.5 million.
189 Source: Scheffer (2006, p. 23f).
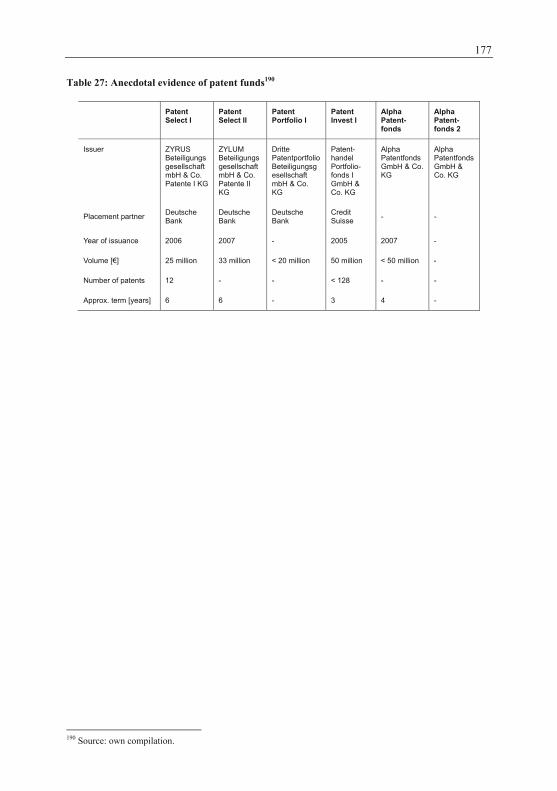
177
Table 27: Anecdotal evidence of patent funds190
Patent Select I
Patent Select II
Patent Portfolio I
Patent Invest I
Alpha Patent-fonds
Alpha Patent-fonds 2
Issuer ZYRUS Beteiligungsgesellschaft mbH & Co. Patente I KG
ZYLUM Beteiligungsgesellschaft mbH & Co. Patente II KG
Dritte Patentportfolio Beteiligungsgesellschaft mbH & Co. KG
Patent-handel Portfolio-fonds I GmbH & Co. KG
Alpha Patentfonds GmbH & Co. KG
Alpha Patentfonds GmbH & Co. KG
Placement partner Deutsche Bank
Deutsche Bank
Deutsche Bank
Credit Suisse - -
Year of issuance 2006 2007 - 2005 2007 -
Volume [€] 25 million 33 million < 20 million 50 million < 50 million -
Number of patents 12 - - < 128 - -
Approx. term [years] 6 6 - 3 4 -
190 Source: own compilation.
Appendix 2:
Questionnaire
D. de. Vries, Leveraging Patents Financially, DOI 10.1007/978-3-8349-6903-3, © Gabler Verlag | Springer Fachmedien Wiesbaden GmbH 2011
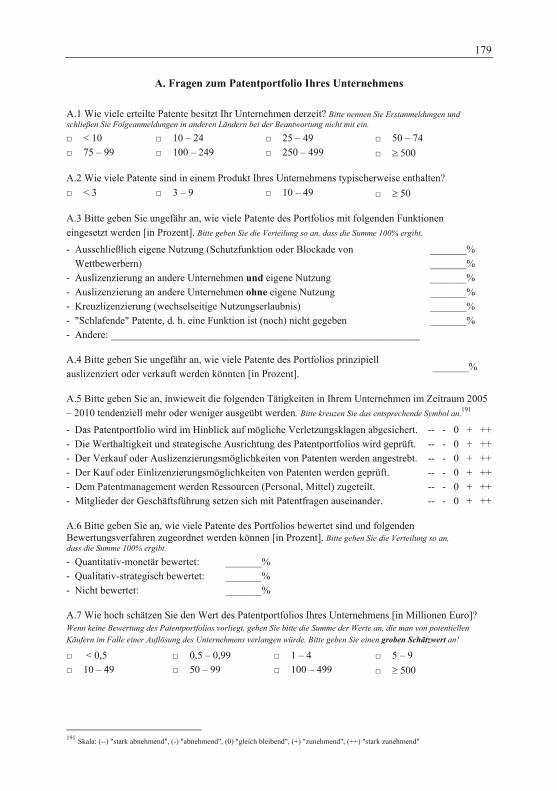
179
A. Fragen zum Patentportfolio Ihres Unternehmens A.1 Wie viele erteilte Patente besitzt Ihr Unternehmen derzeit? Bitte nennen Sie Erstanmeldungen und schließen Sie Folgeanmeldungen in anderen Ländern bei der Beantwortung nicht mit ein.
< 10 75 – 99
10 – 24 100 – 249
25 – 49 250 – 499
50 – 74 500
A.2 Wie viele Patente sind in einem Produkt Ihres Unternehmens typischerweise enthalten? < 3 3 – 9 10 – 49 50
A.3 Bitte geben Sie ungefähr an, wie viele Patente des Portfolios mit folgenden Funktionen eingesetzt werden [in Prozent]. Bitte geben Sie die Verteilung so an, dass die Summe 100% ergibt. - Ausschließlich eigene Nutzung (Schutzfunktion oder Blockade von
Wettbewerbern) - Auslizenzierung an andere Unternehmen und eigene Nutzung - Auslizenzierung an andere Unternehmen ohne eigene Nutzung - Kreuzlizenzierung (wechselseitige Nutzungserlaubnis) - "Schlafende" Patente, d. h. eine Funktion ist (noch) nicht gegeben - Andere: ____________________________________________________________
_______% _______% _______% _______% _______% _______%
A.4 Bitte geben Sie ungefähr an, wie viele Patente des Portfolios prinzipiell auslizenziert oder verkauft werden könnten [in Prozent].
_______%
A.5 Bitte geben Sie an, inwieweit die folgenden Tätigkeiten in Ihrem Unternehmen im Zeitraum 2005 – 2010 tendenziell mehr oder weniger ausgeübt werden. Bitte kreuzen Sie das entsprechende Symbol an.191
- Das Patentportfolio wird im Hinblick auf mögliche Verletzungsklagen abgesichert. - Die Werthaltigkeit und strategische Ausrichtung des Patentportfolios wird geprüft. - Der Verkauf oder Auslizenzierungsmöglichkeiten von Patenten werden angestrebt. - Der Kauf oder Einlizenzierungsmöglichkeiten von Patenten werden geprüft. - Dem Patentmanagement werden Ressourcen (Personal, Mittel) zugeteilt. - Mitglieder der Geschäftsführung setzen sich mit Patentfragen auseinander.
-- - 0 + ++ -- - 0 + ++ -- - 0 + ++ -- - 0 + ++ -- - 0 + ++ -- - 0 + ++
A.6 Bitte geben Sie an, wie viele Patente des Portfolios bewertet sind und folgenden Bewertungsverfahren zugeordnet werden können [in Prozent]. Bitte geben Sie die Verteilung so an, dass die Summe 100% ergibt.
- Quantitativ-monetär bewertet: - Qualitativ-strategisch bewertet: - Nicht bewertet:
_______% _______% _______%
A.7 Wie hoch schätzen Sie den Wert des Patentportfolios Ihres Unternehmens [in Millionen Euro]? Wenn keine Bewertung des Patentportfolios vorliegt, geben Sie bitte die Summe der Werte an, die man von potentiellen Käufern im Falle einer Auflösung des Unternehmens verlangen würde. Bitte geben Sie einen groben Schätzwert an!
< 0,5 10 – 49
0,5 – 0,99 50 – 99
1 – 4 100 – 499
5 – 9 500
191 Skala: (--) "stark abnehmend", (-) "abnehmend", (0) "gleich bleibend", (+) "zunehmend", (++) "stark zunehmend"
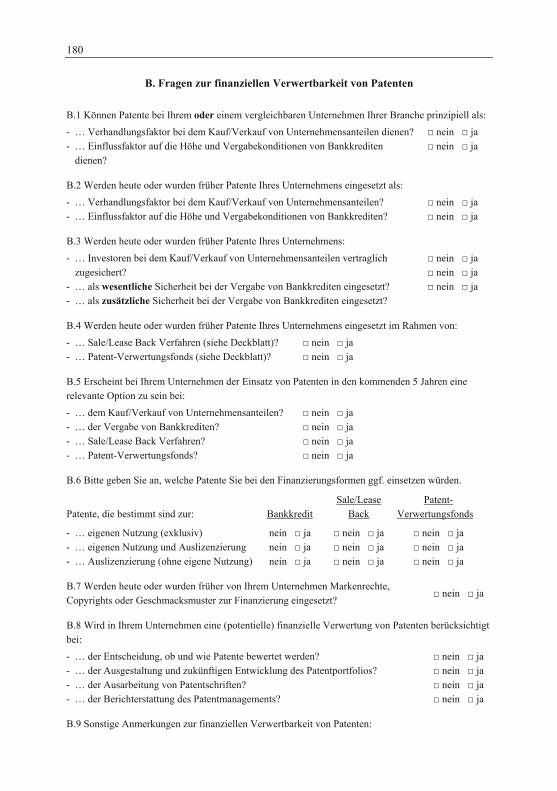
180
B. Fragen zur finanziellen Verwertbarkeit von Patenten B.1 Können Patente bei Ihrem oder einem vergleichbaren Unternehmen Ihrer Branche prinzipiell als: - … Verhandlungsfaktor bei dem Kauf/Verkauf von Unternehmensanteilen dienen? - … Einflussfaktor auf die Höhe und Vergabekonditionen von Bankkrediten
dienen?
nein ja nein ja
B.2 Werden heute oder wurden früher Patente Ihres Unternehmens eingesetzt als: - … Verhandlungsfaktor bei dem Kauf/Verkauf von Unternehmensanteilen? - … Einflussfaktor auf die Höhe und Vergabekonditionen von Bankkrediten?
nein ja nein ja
B.3 Werden heute oder wurden früher Patente Ihres Unternehmens:
- … Investoren bei dem Kauf/Verkauf von Unternehmensanteilen vertraglich zugesichert?
- … als wesentliche Sicherheit bei der Vergabe von Bankkrediten eingesetzt? - … als zusätzliche Sicherheit bei der Vergabe von Bankkrediten eingesetzt?
nein ja nein ja nein ja
B.4 Werden heute oder wurden früher Patente Ihres Unternehmens eingesetzt im Rahmen von:
- … Sale/Lease Back Verfahren (siehe Deckblatt)? - … Patent-Verwertungsfonds (siehe Deckblatt)?
nein ja nein ja
B.5 Erscheint bei Ihrem Unternehmen der Einsatz von Patenten in den kommenden 5 Jahren eine relevante Option zu sein bei: - … dem Kauf/Verkauf von Unternehmensanteilen? - … der Vergabe von Bankkrediten? - … Sale/Lease Back Verfahren? - … Patent-Verwertungsfonds?
nein ja nein ja nein ja nein ja
B.6 Bitte geben Sie an, welche Patente Sie bei den Finanzierungsformen ggf. einsetzen würden.
Patente, die bestimmt sind zur: - … eigenen Nutzung (exklusiv) - … eigenen Nutzung und Auslizenzierung - … Auslizenzierung (ohne eigene Nutzung)
Bankkredit
nein ja nein ja nein ja
Sale/Lease Back
nein ja nein ja nein ja
Patent- Verwertungsfonds
nein ja nein ja nein ja
B.7 Werden heute oder wurden früher von Ihrem Unternehmen Markenrechte, Copyrights oder Geschmacksmuster zur Finanzierung eingesetzt?
nein ja
B.8 Wird in Ihrem Unternehmen eine (potentielle) finanzielle Verwertung von Patenten berücksichtigt bei: - … der Entscheidung, ob und wie Patente bewertet werden? - … der Ausgestaltung und zukünftigen Entwicklung des Patentportfolios? - … der Ausarbeitung von Patentschriften? - … der Berichterstattung des Patentmanagements?
nein ja nein ja nein ja nein ja
B.9 Sonstige Anmerkungen zur finanziellen Verwertbarkeit von Patenten:
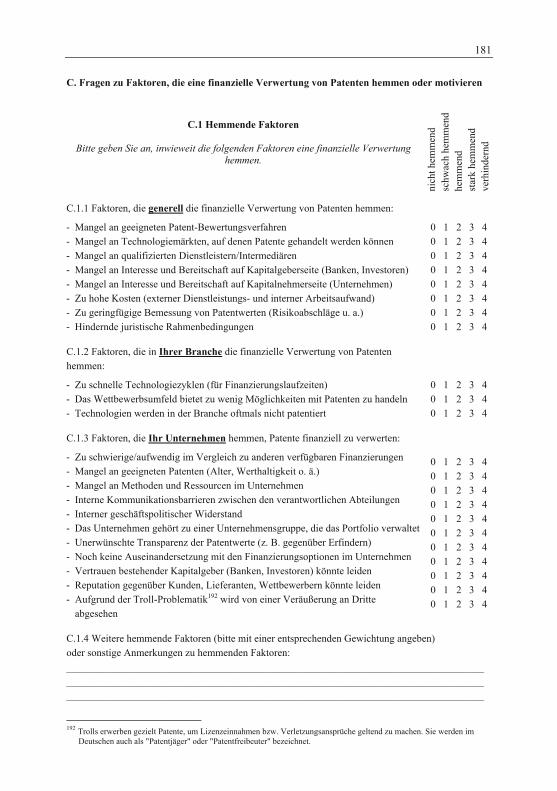
181
C. Fragen zu Faktoren, die eine finanzielle Verwertung von Patenten hemmen oder motivieren
C.1 Hemmende Faktoren
Bitte geben Sie an, inwieweit die folgenden Faktoren eine finanzielle Verwertung
hemmen.
nich
t hem
men
d sc
hwac
h he
mm
end
hem
men
d st
ark
hem
men
d ve
rhin
dern
d
C.1.1 Faktoren, die generell die finanzielle Verwertung von Patenten hemmen: - Mangel an geeigneten Patent-Bewertungsverfahren - Mangel an Technologiemärkten, auf denen Patente gehandelt werden können - Mangel an qualifizierten Dienstleistern/Intermediären - Mangel an Interesse und Bereitschaft auf Kapitalgeberseite (Banken, Investoren) - Mangel an Interesse und Bereitschaft auf Kapitalnehmerseite (Unternehmen) - Zu hohe Kosten (externer Dienstleistungs- und interner Arbeitsaufwand) - Zu geringfügige Bemessung von Patentwerten (Risikoabschläge u. a.) - Hindernde juristische Rahmenbedingungen
0 1 2 3 4 0 1 2 3 4 0 1 2 3 4 0 1 2 3 4 0 1 2 3 4 0 1 2 3 4 0 1 2 3 4 0 1 2 3 4
C.1.2 Faktoren, die in Ihrer Branche die finanzielle Verwertung von Patenten hemmen: - Zu schnelle Technologiezyklen (für Finanzierungslaufzeiten) - Das Wettbewerbsumfeld bietet zu wenig Möglichkeiten mit Patenten zu handeln - Technologien werden in der Branche oftmals nicht patentiert
0 1 2 3 4 0 1 2 3 4 0 1 2 3 4
C.1.3 Faktoren, die Ihr Unternehmen hemmen, Patente finanziell zu verwerten: - Zu schwierige/aufwendig im Vergleich zu anderen verfügbaren Finanzierungen - Mangel an geeigneten Patenten (Alter, Werthaltigkeit o. ä.) - Mangel an Methoden und Ressourcen im Unternehmen - Interne Kommunikationsbarrieren zwischen den verantwortlichen Abteilungen - Interner geschäftspolitischer Widerstand - Das Unternehmen gehört zu einer Unternehmensgruppe, die das Portfolio verwaltet - Unerwünschte Transparenz der Patentwerte (z. B. gegenüber Erfindern) - Noch keine Auseinandersetzung mit den Finanzierungsoptionen im Unternehmen - Vertrauen bestehender Kapitalgeber (Banken, Investoren) könnte leiden - Reputation gegenüber Kunden, Lieferanten, Wettbewerbern könnte leiden - Aufgrund der Troll-Problematik192 wird von einer Veräußerung an Dritte
abgesehen
0 1 2 3 4 0 1 2 3 4 0 1 2 3 4 0 1 2 3 4 0 1 2 3 4 0 1 2 3 4 0 1 2 3 4 0 1 2 3 4 0 1 2 3 4 0 1 2 3 4 0 1 2 3 4
C.1.4 Weitere hemmende Faktoren (bitte mit einer entsprechenden Gewichtung angeben) oder sonstige Anmerkungen zu hemmenden Faktoren: _________________________________________________________________________________ _________________________________________________________________________________ _________________________________________________________________________________
192 Trolls erwerben gezielt Patente, um Lizenzeinnahmen bzw. Verletzungsansprüche geltend zu machen. Sie werden im
Deutschen auch als "Patentjäger" oder "Patentfreibeuter" bezeichnet.
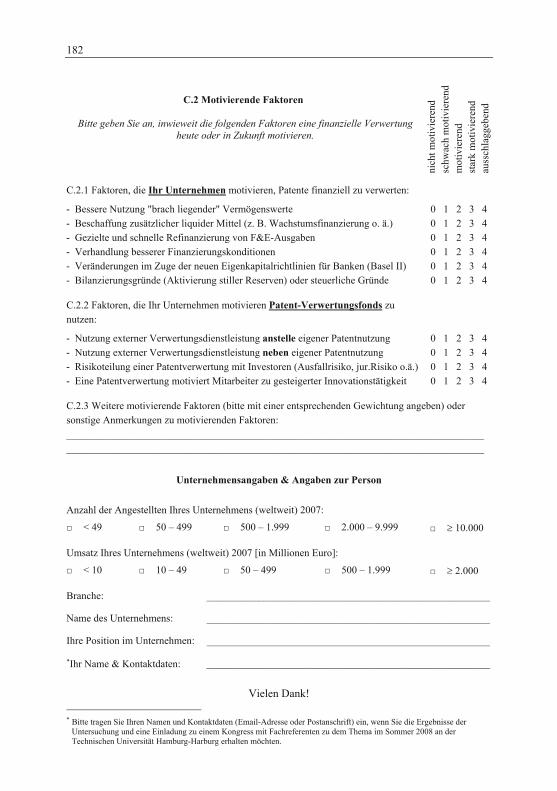
182
C.2 Motivierende Faktoren
Bitte geben Sie an, inwieweit die folgenden Faktoren eine finanzielle Verwertung
heute oder in Zukunft motivieren.
nich
t mot
ivie
rend
sc
hwac
h m
otiv
iere
nd
mot
ivie
rend
st
ark
mot
ivie
rend
au
ssch
lagg
eben
d
C.2.1 Faktoren, die Ihr Unternehmen motivieren, Patente finanziell zu verwerten:
- Bessere Nutzung "brach liegender" Vermögenswerte - Beschaffung zusätzlicher liquider Mittel (z. B. Wachstumsfinanzierung o. ä.) - Gezielte und schnelle Refinanzierung von F&E-Ausgaben - Verhandlung besserer Finanzierungskonditionen - Veränderungen im Zuge der neuen Eigenkapitalrichtlinien für Banken (Basel II) - Bilanzierungsgründe (Aktivierung stiller Reserven) oder steuerliche Gründe
0 1 2 3 4 0 1 2 3 4 0 1 2 3 4 0 1 2 3 4 0 1 2 3 4 0 1 2 3 4
C.2.2 Faktoren, die Ihr Unternehmen motivieren Patent-Verwertungsfonds zu nutzen: - Nutzung externer Verwertungsdienstleistung anstelle eigener Patentnutzung - Nutzung externer Verwertungsdienstleistung neben eigener Patentnutzung - Risikoteilung einer Patentverwertung mit Investoren (Ausfallrisiko, jur.Risiko o.ä.) - Eine Patentverwertung motiviert Mitarbeiter zu gesteigerter Innovationstätigkeit
0 1 2 3 4 0 1 2 3 4 0 1 2 3 4 0 1 2 3 4
C.2.3 Weitere motivierende Faktoren (bitte mit einer entsprechenden Gewichtung angeben) oder sonstige Anmerkungen zu motivierenden Faktoren: _________________________________________________________________________________ _________________________________________________________________________________
Unternehmensangaben & Angaben zur Person
Anzahl der Angestellten Ihres Unternehmens (weltweit) 2007:
< 49 50 – 499 500 – 1.999 2.000 – 9.999 10.000
Umsatz Ihres Unternehmens (weltweit) 2007 [in Millionen Euro]:
< 10 10 – 49 50 – 499 500 – 1.999 2.000
Branche: _______________________________________________________
Name des Unternehmens: _______________________________________________________
Ihre Position im Unternehmen: _______________________________________________________
Ihr Name & Kontaktdaten: _______________________________________________________
Vielen Dank!
Bitte tragen Sie Ihren Namen und Kontaktdaten (Email-Adresse oder Postanschrift) ein, wenn Sie die Ergebnisse der Untersuchung und eine Einladung zu einem Kongress mit Fachreferenten zu dem Thema im Sommer 2008 an der Technischen Universität Hamburg-Harburg erhalten möchten.
Appendix 3:
Information on descriptive results of the empirical study
D. de. Vries, Leveraging Patents Financially, DOI 10.1007/978-3-8349-6903-3, © Gabler Verlag | Springer Fachmedien Wiesbaden GmbH 2011
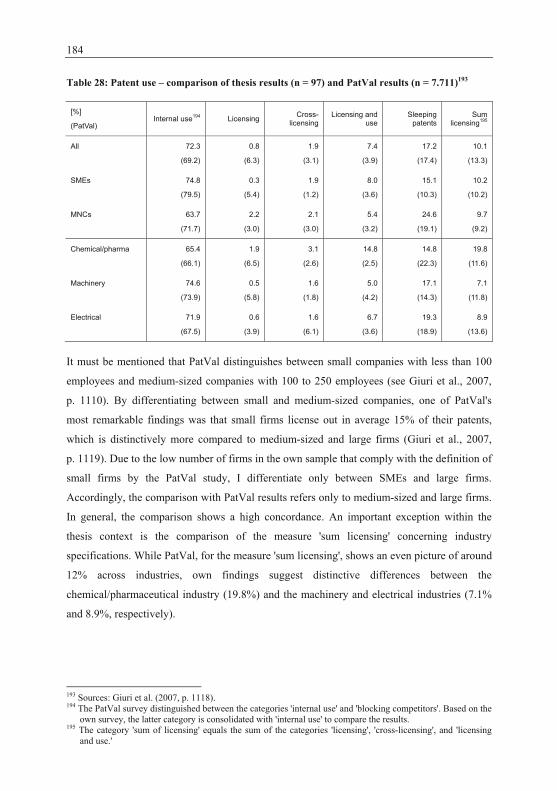
184
Table 28: Patent use – comparison of thesis results (n = 97) and PatVal results (n = 7.711)193
[%]
(PatVal) Internal use194 Licensing Cross-
licensing Licensing and
use Sleeping
patents Sum
licensing195
All
72.3
(69.2)
0.8
(6.3)
1.9
(3.1)
7.4
(3.9)
17.2
(17.4)
10.1
(13.3)
SMEs
74.8
(79.5)
0.3
(5.4)
1.9
(1.2)
8.0
(3.6)
15.1
(10.3)
10.2
(10.2)
MNCs
63.7
(71.7)
2.2
(3.0)
2.1
(3.0)
5.4
(3.2)
24.6
(19.1)
9.7
(9.2)
Chemical/pharma
65.4
(66.1)
1.9
(6.5)
3.1
(2.6)
14.8
(2.5)
14.8
(22.3)
19.8
(11.6)
Machinery
74.6
(73.9)
0.5
(5.8)
1.6
(1.8)
5.0
(4.2)
17.1
(14.3)
7.1
(11.8)
Electrical
71.9
(67.5)
0.6
(3.9)
1.6
(6.1)
6.7
(3.6)
19.3
(18.9)
8.9
(13.6)
It must be mentioned that PatVal distinguishes between small companies with less than 100
employees and medium-sized companies with 100 to 250 employees (see Giuri et al., 2007,
p. 1110). By differentiating between small and medium-sized companies, one of PatVal's
most remarkable findings was that small firms license out in average 15% of their patents,
which is distinctively more compared to medium-sized and large firms (Giuri et al., 2007,
p. 1119). Due to the low number of firms in the own sample that comply with the definition of
small firms by the PatVal study, I differentiate only between SMEs and large firms.
Accordingly, the comparison with PatVal results refers only to medium-sized and large firms.
In general, the comparison shows a high concordance. An important exception within the
thesis context is the comparison of the measure 'sum licensing' concerning industry
specifications. While PatVal, for the measure 'sum licensing', shows an even picture of around
12% across industries, own findings suggest distinctive differences between the
chemical/pharmaceutical industry (19.8%) and the machinery and electrical industries (7.1%
and 8.9%, respectively).
193 Sources: Giuri et al. (2007, p. 1118). 194 The PatVal survey distinguished between the categories 'internal use' and 'blocking competitors'. Based on the
own survey, the latter category is consolidated with 'internal use' to compare the results. 195 The category 'sum of licensing' equals the sum of the categories 'licensing', 'cross-licensing', and 'licensing
and use.'
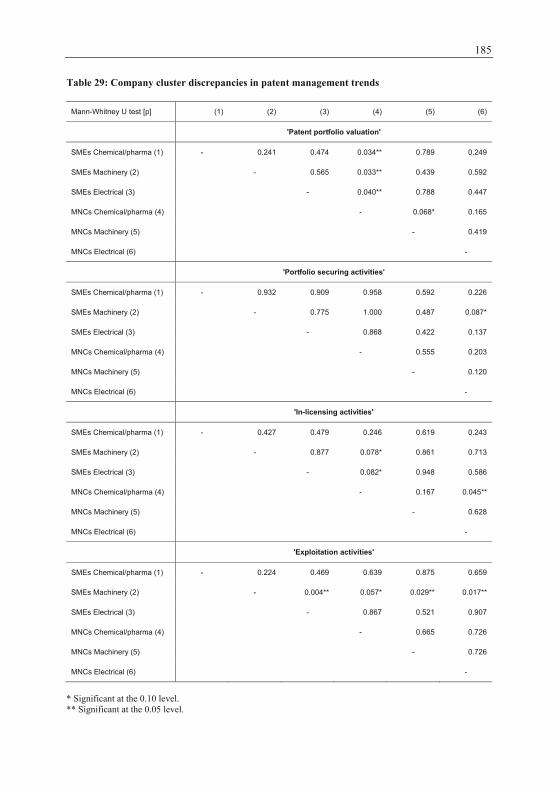
185
Table 29: Company cluster discrepancies in patent management trends
Mann-Whitney U test [p] (1) (2) (3) (4) (5) (6)
'Patent portfolio valuation'
SMEs Chemical/pharma (1) - 0.241 0.474 0.034** 0.789 0.249
SMEs Machinery (2) - 0.565 0.033** 0.439 0.592
SMEs Electrical (3) - 0.040** 0.788 0.447
MNCs Chemical/pharma (4) - 0.068* 0.165
MNCs Machinery (5) - 0.419
MNCs Electrical (6) -
'Portfolio securing activities'
SMEs Chemical/pharma (1) - 0.932 0.909 0.958 0.592 0.226
SMEs Machinery (2) - 0.775 1.000 0.487 0.087*
SMEs Electrical (3) - 0.868 0.422 0.137
MNCs Chemical/pharma (4) - 0.555 0.203
MNCs Machinery (5) - 0.120
MNCs Electrical (6) -
'In-licensing activities'
SMEs Chemical/pharma (1) - 0.427 0.479 0.246 0.619 0.243
SMEs Machinery (2) - 0.877 0.078* 0.861 0.713
SMEs Electrical (3) - 0.082* 0.948 0.586
MNCs Chemical/pharma (4) - 0.167 0.045**
MNCs Machinery (5) - 0.628
MNCs Electrical (6) -
'Exploitation activities'
SMEs Chemical/pharma (1) - 0.224 0.469 0.639 0.875 0.659
SMEs Machinery (2) - 0.004** 0.057* 0.029** 0.017**
SMEs Electrical (3) - 0.867 0.521 0.907
MNCs Chemical/pharma (4) - 0.665 0.726
MNCs Machinery (5) - 0.726
MNCs Electrical (6) -
* Significant at the 0.10 level. ** Significant at the 0.05 level.
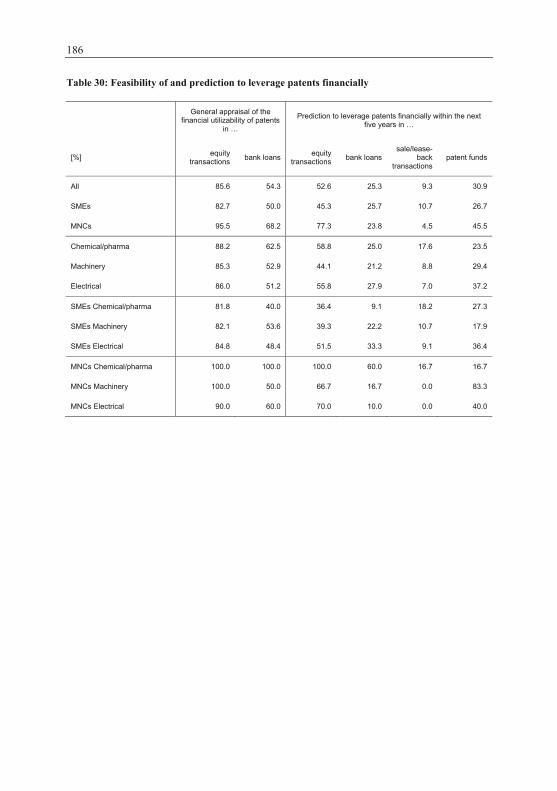
186
Table 30: Feasibility of and prediction to leverage patents financially
General appraisal of the
financial utilizability of patents in …
Prediction to leverage patents financially within the next five years in …
[%] equity transactions bank loans equity
transactions bank loans sale/lease-
back transactions
patent funds
All 85.6 54.3 52.6 25.3 9.3 30.9
SMEs 82.7 50.0 45.3 25.7 10.7 26.7
MNCs 95.5 68.2 77.3 23.8 4.5 45.5
Chemical/pharma 88.2 62.5 58.8 25.0 17.6 23.5
Machinery 85.3 52.9 44.1 21.2 8.8 29.4
Electrical 86.0 51.2 55.8 27.9 7.0 37.2
SMEs Chemical/pharma 81.8 40.0 36.4 9.1 18.2 27.3
SMEs Machinery 82.1 53.6 39.3 22.2 10.7 17.9
SMEs Electrical 84.8 48.4 51.5 33.3 9.1 36.4
MNCs Chemical/pharma 100.0 100.0 100.0 60.0 16.7 16.7
MNCs Machinery 100.0 50.0 66.7 16.7 0.0 83.3
MNCs Electrical 90.0 60.0 70.0 10.0 0.0 40.0
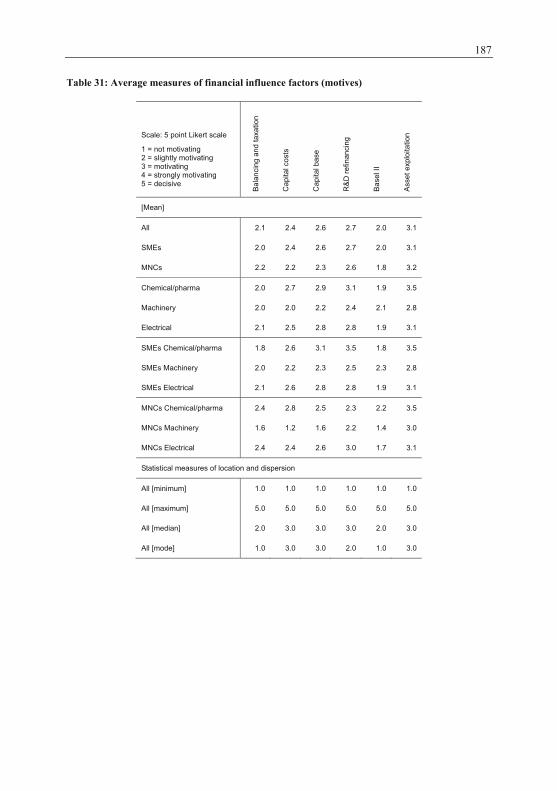
187
Table 31: Average measures of financial influence factors (motives)
Scale: 5 point Likert scale
1 = not motivating 2 = slightly motivating 3 = motivating 4 = strongly motivating 5 = decisive
Bal
anci
ng a
nd ta
xatio
n
Cap
ital c
osts
Cap
ital b
ase
R&
D re
finan
cing
Bas
el II
Ass
et e
xplo
itatio
n
[Mean]
All 2.1 2.4 2.6 2.7 2.0 3.1
SMEs 2.0 2.4 2.6 2.7 2.0 3.1
MNCs 2.2 2.2 2.3 2.6 1.8 3.2
Chemical/pharma 2.0 2.7 2.9 3.1 1.9 3.5
Machinery 2.0 2.0 2.2 2.4 2.1 2.8
Electrical 2.1 2.5 2.8 2.8 1.9 3.1
SMEs Chemical/pharma 1.8 2.6 3.1 3.5 1.8 3.5
SMEs Machinery 2.0 2.2 2.3 2.5 2.3 2.8
SMEs Electrical 2.1 2.6 2.8 2.8 1.9 3.1
MNCs Chemical/pharma 2.4 2.8 2.5 2.3 2.2 3.5
MNCs Machinery 1.6 1.2 1.6 2.2 1.4 3.0
MNCs Electrical 2.4 2.4 2.6 3.0 1.7 3.1
Statistical measures of location and dispersion
All [minimum] 1.0 1.0 1.0 1.0 1.0 1.0
All [maximum] 5.0 5.0 5.0 5.0 5.0 5.0
All [median] 2.0 3.0 3.0 3.0 2.0 3.0
All [mode] 1.0 3.0 3.0 2.0 1.0 3.0
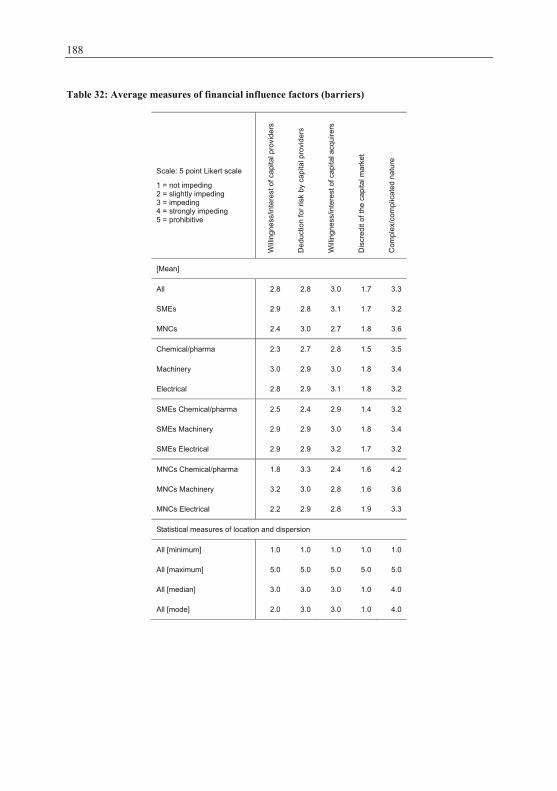
188
Table 32: Average measures of financial influence factors (barriers)
Scale: 5 point Likert scale
1 = not impeding 2 = slightly impeding 3 = impeding 4 = strongly impeding 5 = prohibitive
Will
ingn
ess/
inte
rest
of c
apita
l pro
vide
rs
Ded
uctio
n fo
r ris
k by
cap
ital p
rovi
ders
Will
ingn
ess/
inte
rest
of c
apita
l acq
uire
rs
Dis
cred
it of
the
capi
tal m
arke
t
Com
plex
/com
plic
ated
nat
ure
[Mean]
All 2.8 2.8 3.0 1.7 3.3
SMEs 2.9 2.8 3.1 1.7 3.2
MNCs 2.4 3.0 2.7 1.8 3.6
Chemical/pharma 2.3 2.7 2.8 1.5 3.5
Machinery 3.0 2.9 3.0 1.8 3.4
Electrical 2.8 2.9 3.1 1.8 3.2
SMEs Chemical/pharma 2.5 2.4 2.9 1.4 3.2
SMEs Machinery 2.9 2.9 3.0 1.8 3.4
SMEs Electrical 2.9 2.9 3.2 1.7 3.2
MNCs Chemical/pharma 1.8 3.3 2.4 1.6 4.2
MNCs Machinery 3.2 3.0 2.8 1.6 3.6
MNCs Electrical 2.2 2.9 2.8 1.9 3.3
Statistical measures of location and dispersion
All [minimum] 1.0 1.0 1.0 1.0 1.0
All [maximum] 5.0 5.0 5.0 5.0 5.0
All [median] 3.0 3.0 3.0 1.0 4.0
All [mode] 2.0 3.0 3.0 1.0 4.0
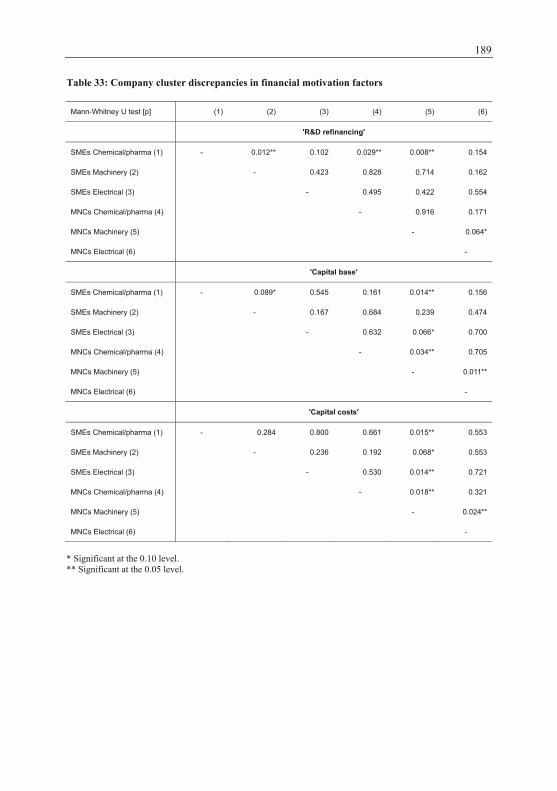
189
Table 33: Company cluster discrepancies in financial motivation factors
Mann-Whitney U test [p] (1) (2) (3) (4) (5) (6)
'R&D refinancing'
SMEs Chemical/pharma (1) - 0.012** 0.102 0.029** 0.008** 0.154
SMEs Machinery (2) - 0.423 0.828 0.714 0.162
SMEs Electrical (3) - 0.495 0.422 0.554
MNCs Chemical/pharma (4) - 0.916 0.171
MNCs Machinery (5) - 0.064*
MNCs Electrical (6) -
'Capital base'
SMEs Chemical/pharma (1) - 0.089* 0.545 0.161 0.014** 0.156
SMEs Machinery (2) - 0.167 0.684 0.239 0.474
SMEs Electrical (3) - 0.632 0.066* 0.700
MNCs Chemical/pharma (4) - 0.034** 0.705
MNCs Machinery (5) - 0.011**
MNCs Electrical (6) -
'Capital costs'
SMEs Chemical/pharma (1) - 0.284 0.800 0.661 0.015** 0.553
SMEs Machinery (2) - 0.236 0.192 0.068* 0.553
SMEs Electrical (3) - 0.530 0.014** 0.721
MNCs Chemical/pharma (4) - 0.018** 0.321
MNCs Machinery (5) - 0.024**
MNCs Electrical (6) -
* Significant at the 0.10 level. ** Significant at the 0.05 level.
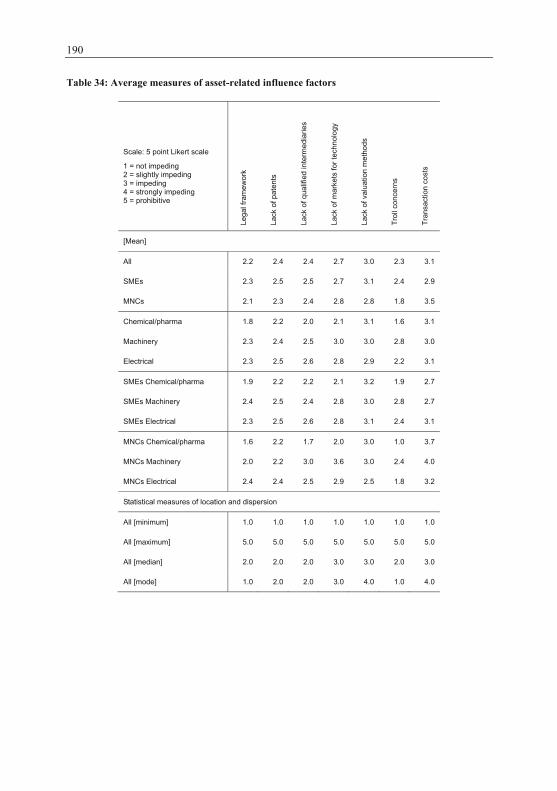
190
Table 34: Average measures of asset-related influence factors
Scale: 5 point Likert scale
1 = not impeding 2 = slightly impeding 3 = impeding 4 = strongly impeding 5 = prohibitive
Lega
l fra
mew
ork
Lack
of p
aten
ts
Lack
of q
ualif
ied
inte
rmed
iarie
s
Lack
of m
arke
ts fo
r tec
hnol
ogy
Lack
of v
alua
tion
met
hods
Trol
l con
cern
s
Tran
sact
ion
cost
s
[Mean]
All 2.2 2.4 2.4 2.7 3.0 2.3 3.1
SMEs 2.3 2.5 2.5 2.7 3.1 2.4 2.9
MNCs 2.1 2.3 2.4 2.8 2.8 1.8 3.5
Chemical/pharma 1.8 2.2 2.0 2.1 3.1 1.6 3.1
Machinery 2.3 2.4 2.5 3.0 3.0 2.8 3.0
Electrical 2.3 2.5 2.6 2.8 2.9 2.2 3.1
SMEs Chemical/pharma 1.9 2.2 2.2 2.1 3.2 1.9 2.7
SMEs Machinery 2.4 2.5 2.4 2.8 3.0 2.8 2.7
SMEs Electrical 2.3 2.5 2.6 2.8 3.1 2.4 3.1
MNCs Chemical/pharma 1.6 2.2 1.7 2.0 3.0 1.0 3.7
MNCs Machinery 2.0 2.2 3.0 3.6 3.0 2.4 4.0
MNCs Electrical 2.4 2.4 2.5 2.9 2.5 1.8 3.2
Statistical measures of location and dispersion
All [minimum] 1.0 1.0 1.0 1.0 1.0 1.0 1.0
All [maximum] 5.0 5.0 5.0 5.0 5.0 5.0 5.0
All [median] 2.0 2.0 2.0 3.0 3.0 2.0 3.0
All [mode] 1.0 2.0 2.0 3.0 4.0 1.0 4.0
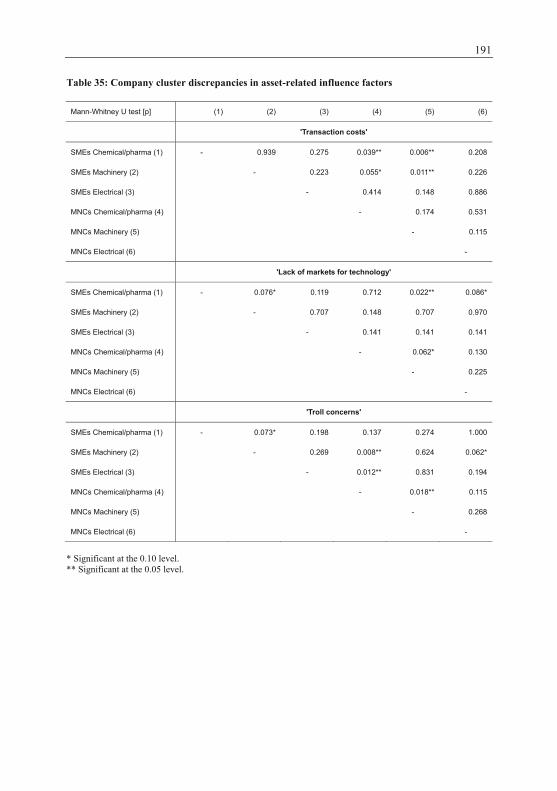
191
Table 35: Company cluster discrepancies in asset-related influence factors
Mann-Whitney U test [p] (1) (2) (3) (4) (5) (6)
'Transaction costs'
SMEs Chemical/pharma (1) - 0.939 0.275 0.039** 0.006** 0.208
SMEs Machinery (2) - 0.223 0.055* 0.011** 0.226
SMEs Electrical (3) - 0.414 0.148 0.886
MNCs Chemical/pharma (4) - 0.174 0.531
MNCs Machinery (5) - 0.115
MNCs Electrical (6) -
'Lack of markets for technology'
SMEs Chemical/pharma (1) - 0.076* 0.119 0.712 0.022** 0.086*
SMEs Machinery (2) - 0.707 0.148 0.707 0.970
SMEs Electrical (3) - 0.141 0.141 0.141
MNCs Chemical/pharma (4) - 0.062* 0.130
MNCs Machinery (5) - 0.225
MNCs Electrical (6) -
'Troll concerns'
SMEs Chemical/pharma (1) - 0.073* 0.198 0.137 0.274 1.000
SMEs Machinery (2) - 0.269 0.008** 0.624 0.062*
SMEs Electrical (3) - 0.012** 0.831 0.194
MNCs Chemical/pharma (4) - 0.018** 0.115
MNCs Machinery (5) - 0.268
MNCs Electrical (6) -
* Significant at the 0.10 level. ** Significant at the 0.05 level.
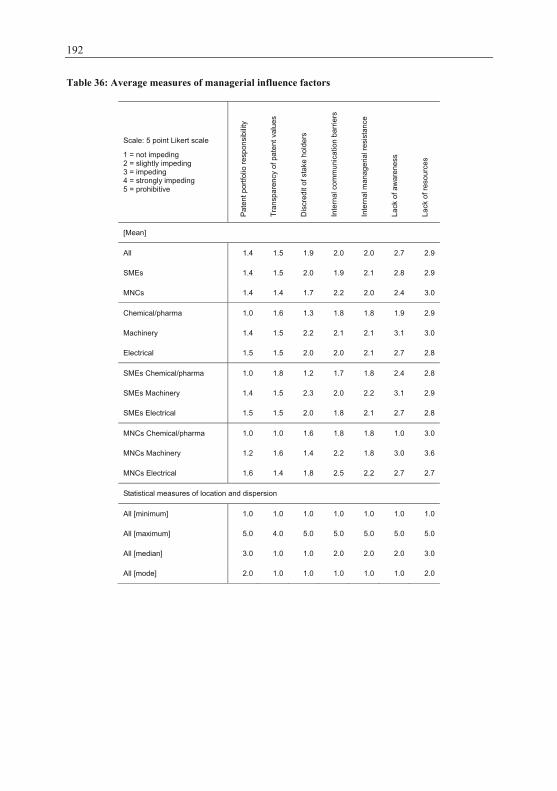
192
Table 36: Average measures of managerial influence factors
Scale: 5 point Likert scale
1 = not impeding 2 = slightly impeding 3 = impeding 4 = strongly impeding 5 = prohibitive
Pat
ent p
ortfo
lio re
spon
sibi
lity
Tran
spar
ency
of p
aten
t val
ues
Dis
cred
it of
sta
ke h
olde
rs
Inte
rnal
com
mun
icat
ion
barr
iers
Inte
rnal
man
ager
ial r
esis
tanc
e
Lack
of a
war
enes
s
Lack
of r
esou
rces
[Mean]
All 1.4 1.5 1.9 2.0 2.0 2.7 2.9
SMEs 1.4 1.5 2.0 1.9 2.1 2.8 2.9
MNCs 1.4 1.4 1.7 2.2 2.0 2.4 3.0
Chemical/pharma 1.0 1.6 1.3 1.8 1.8 1.9 2.9
Machinery 1.4 1.5 2.2 2.1 2.1 3.1 3.0
Electrical 1.5 1.5 2.0 2.0 2.1 2.7 2.8
SMEs Chemical/pharma 1.0 1.8 1.2 1.7 1.8 2.4 2.8
SMEs Machinery 1.4 1.5 2.3 2.0 2.2 3.1 2.9
SMEs Electrical 1.5 1.5 2.0 1.8 2.1 2.7 2.8
MNCs Chemical/pharma 1.0 1.0 1.6 1.8 1.8 1.0 3.0
MNCs Machinery 1.2 1.6 1.4 2.2 1.8 3.0 3.6
MNCs Electrical 1.6 1.4 1.8 2.5 2.2 2.7 2.7
Statistical measures of location and dispersion
All [minimum] 1.0 1.0 1.0 1.0 1.0 1.0 1.0
All [maximum] 5.0 4.0 5.0 5.0 5.0 5.0 5.0
All [median] 3.0 1.0 1.0 2.0 2.0 2.0 3.0
All [mode] 2.0 1.0 1.0 1.0 1.0 1.0 2.0
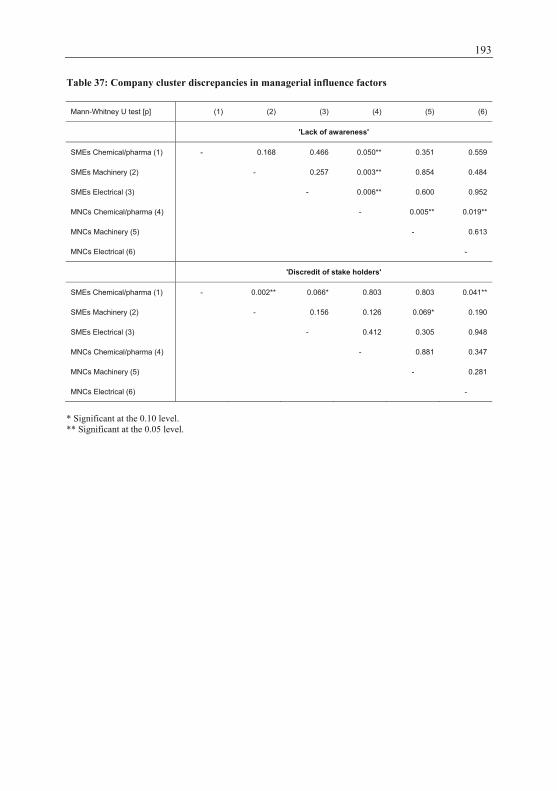
193
Table 37: Company cluster discrepancies in managerial influence factors
Mann-Whitney U test [p] (1) (2) (3) (4) (5) (6)
'Lack of awareness'
SMEs Chemical/pharma (1) - 0.168 0.466 0.050** 0.351 0.559
SMEs Machinery (2) - 0.257 0.003** 0.854 0.484
SMEs Electrical (3) - 0.006** 0.600 0.952
MNCs Chemical/pharma (4) - 0.005** 0.019**
MNCs Machinery (5) - 0.613
MNCs Electrical (6) -
'Discredit of stake holders'
SMEs Chemical/pharma (1) - 0.002** 0.066* 0.803 0.803 0.041**
SMEs Machinery (2) - 0.156 0.126 0.069* 0.190
SMEs Electrical (3) - 0.412 0.305 0.948
MNCs Chemical/pharma (4) - 0.881 0.347
MNCs Machinery (5) - 0.281
MNCs Electrical (6) -
* Significant at the 0.10 level. ** Significant at the 0.05 level.
Appendix 4:
Information on the analytical examination of survey result
D. de. Vries, Leveraging Patents Financially, DOI 10.1007/978-3-8349-6903-3, © Gabler Verlag | Springer Fachmedien Wiesbaden GmbH 2011
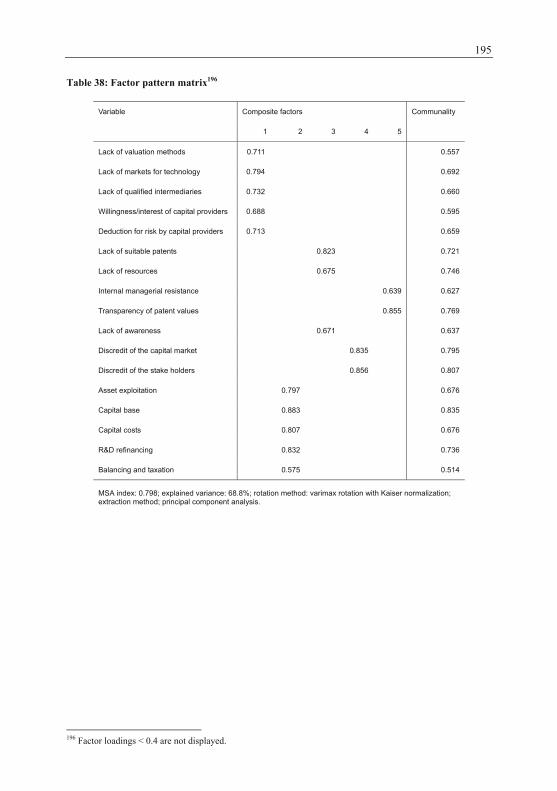
195
Table 38: Factor pattern matrix196
Variable Composite factors Communality
1 2 3 4 5
Lack of valuation methods 0.711 0.557
Lack of markets for technology 0.794 0.692
Lack of qualified intermediaries 0.732 0.660
Willingness/interest of capital providers 0.688 0.595
Deduction for risk by capital providers 0.713 0.659
Lack of suitable patents 0.823 0.721
Lack of resources 0.675 0.746
Internal managerial resistance 0.639 0.627
Transparency of patent values 0.855 0.769
Lack of awareness 0.671 0.637
Discredit of the capital market 0.835 0.795
Discredit of the stake holders 0.856 0.807
Asset exploitation 0.797 0.676
Capital base 0.883 0.835
Capital costs 0.807 0.676
R&D refinancing 0.832 0.736
Balancing and taxation 0.575 0.514
MSA index: 0.798; explained variance: 68.8%; rotation method: varimax rotation with Kaiser normalization; extraction method; principal component analysis.
196 Factor loadings < 0.4 are not displayed.
List of references
Achleitner, A.-K., Schraml, S. and Nathasius, E. (2007): Valuation of platform technology based intangible companies. Working Paper No. 2007-02, Center for Entrepreneurial and Financial Studies: Technische Universität München Agresti, A. (2007): An introduction to categorical data analysis. Hoboken, NJ: Wiley Aho, E. (2006): Creating an innovative Europe: European Commission AICPA (1994): Improving business reporting - a customer focus: Special committee on financial reporting; Jenkins Committee Report AIPLA (2001): Economic report 2001. Arlington, VA: American Intellectual Property Law Association Akerlof, G. A. (1970): The market for lemons: qualitative uncertainty and the market mechanism. Quarterly Journal of Economics, 84, p. 488-500 Albach, H., Pay, D. d. and Rojas, R. (1991): Quellen, Zeiten und Kosten von Innovationen: deutsche Unternehmen im Vergleich zu ihren japanischen und amerikanischen Konkurrenten. Zeitschrift für Betriebswirtschaft, 61, p. 309-324 Albert, M. B., Avery, D., Narin, F. and McAllister, P. (1991): Direct validation of citation counts as indicators of industrially important patents. Research policy, 20, p. 251-259 Alexander, D. and Nobes, C. (2007): Financial accounting: an international introduction. Harlow: Financial Times/Prentice Hall Andersen, B. and Konzelmann, S. (2008): In search of a useful theory of the productive potential of intellectual property rights. Research policy, 37, p. 12-28 Ante, S. E. (2005): How Ampex squeezes out cash. BusinessWeek, April 18, 2005 Antonius, R. (2004): Interpreting quantitative data with SPSS. London: Sage Arora, A. and Fosfuri, A. (2003): Licensing the market for technology. Journal of Economic Behavior & Organization, 52, p. 277-295 Arora, A., Fosfuri, A. and Gambardella, A. (1999): Markets for technology (why do we see them, why don't we see more of them, and why we should care). Getafe: Dep. de Economía de la Empresa, Univ. Carlos III de Madrid Arora, A., Fosfuri, A. and Gambardella, A. (2001a): Markets for technology and their implications for corporate strategy. Oxford: Oxford University Press Arora, A., Fosfuri, A. and Gambardella, A. (2001b): Markets for technology: the economics of innovation and corporate strategy. Cambridge, MA: The MIT Press Arora, A., Fosfuri, A. and Gambardella, A. (2005): Markets for technology, intellectual property rights, and development: Cambridge Univ. Press
D. de. Vries, Leveraging Patents Financially, DOI 10.1007/978-3-8349-6903-3, © Gabler Verlag | Springer Fachmedien Wiesbaden GmbH 2011

198
Arora, A. and Gambardella, A. (2008): The changing technology of technological change: general and abstract knowledge and the division of innovative labour. In: Antonelli, C., ed. The economics of innovation: London: Routledge, p. 351 - 366 Arrow, A. K. (2002): Intangible asset deployment in technology-rich companies: how does innovation affect return on assets? International Journal of Technology Management, 24, p. 375-390 Artley, R. J., Dobrauz, G., Plasonig, G. E. and Strasser, R., R. (2003): Making money out of technology: best practice in technology exploitation from academic sources: Solothurn Arundel, A. (2001): The relative effectiveness of patents and secrecy for appropriation. Research policy, 30, p. 611-624 Arundel, A. and Kabla, I. (1998): What percentage of innovations are patented? Empirical estimates for European firms. Research policy, 27, p. 127-141 Arundel, A. and Patel, P. (2003): Strategic patenting. Background Report for the Trend Chart Policy Benchmarking Workshop. New Trends in IPR Policy. Atteslander, P. (2006): Methoden der empirischen Sozialforschung. Berlin: Schmidt Backhaus, K., Erichson, B., Plinke, W. and Weiber, R. (2006): Multivariate Analysemethoden. Berlin: Springer Baum, J. A. C. and Silverman, B. S. (2004): Picking winners or building them? Alliances, patents, and human capital as selection criteria in venture financing of biotechnology start-ups. Journal of Business Venturing, 19, p. 411-436 BDO (2007): Bewertung von Patenten (durchgeführt von TNS Emnid). Hamburg: BDO Deutsche Warentreuhand AG Beales, R. (2006): Profiting from a very good idea, patently. Financial Times | FT.com, November 24, 2006 Beattie, V., Goodacre, A. and Thomson, S. (2000): Recognition versus disclosure: an investigation of the impact on equity risk using UK operating lease disclosures. Journal of Business Finance & Accounting, 27, p. 1185-1224 Bessen, J. E. and Meurer, M. J. (2008): The private costs of patent litigation. Working Paper No. 07-08, Law and Economics: Boston University School of Law Bessler, W., Bittelmeyer, C. and Lipfert, S. (2003): Zur Bedeutung von wissensbasierten immateriellen Vermögensgegenständen für die Bewertung und Finanzierung von kleinen und mittleren Unternehmen. In: Meyer, J.-A., ed. Unternehmensbewertung und Basel II in kleinen und mittleren Unternehmen. Lohmar Eul, p. 309-334 Bettis, R., Bradley, S. and Hamel, G. (1992): Outsourcing and industrial decline. Academy of Management Review, Executive 6, p. 7-22
199
Bezant, M. (1998): The use of IP as security for debt finance. Journal of Knowledge Management, 1, p. 237-263 Birkenmeier, B. (2003): Externe Technologie-Verwertung: Eine komplexe Aufgabe des Integrierten Technologie-Managements, PhD dissertation No. 15240. Zürich: ETH Zürich Birkinshaw, J. (2004): External sourcing of knowledge in the international firm. Malden, MA: Blackwell Publ. Bittelmeyer, C. (2007): Patente und Finanzierung am Kapitalmarkt: eine theoretische und empirische Analyse. Wiesbaden: Dt. Univ.-Verl. Bittelmeyer, C., Ehrhart, N., Mark, K. and Zimmermann, V. (2008): Immaterielle Vermögensgegenstände als Kreditsicherheiten: ein Potenzial für die Mittelstandsfinanzierung in Deutschland? Die moderne Finanzfunktion. Wiesbaden: Gabler, p. 249-277 Blair, M. and Wallman, S. (2003): The growing intangibles reporting discrepancy. In: Hand, J. R. M. and Lev, B., eds. Intangible assets: Oxford Univ. Press, p. 449-468 Blair, M. M. and Wallman, S. M. H. (2001): Unseen wealth: report of the Brookings Task Force on Intangibles. Washington, D.C: Brookings Institution Press Blind, K., Edler, J., Frietsch, R. and Schmocha, U. (2006): Motives to patent: Empirical evidence from Germany. Research policy, 35, p. 655-672 Bloom, N. and Reenen, J. v. (2000): Real options, patents, productivity and market value: Evidence from a panel of British firms. Working Paper 00/21, IFS, The Institute for Fiscal Studies, London BMW AG (2008): Annual report 2007 Borod, R. S. and Cassidy, T. J. (2005): IP finance - clearing the hurdles for IP securitisation in the US. iam management, October/November 2005, p. 55-58 Brealey, R. A., Myers, S. C. and Allen, F. (2006): Principles of corporate finance. Boston, MA: McGraw-Hill/Irwin Brockhoff, K. (1999): Forschung und Entwicklung: Planung und Kontrolle. München: Oldenbourg Brockmann, M. (2006): Leasing - Schlummernde Werte wecken. Financial Times Deutschland, 19.10.2006 Brooking, A. (1996): Intellectual capital: core asset for the third millennium enterprise. London: International Thomson Business Press Bühl, A. and Zöfel, P. (2000): SPSS Version 9: Einführung in die moderne Datenanalyse unter Windows. München: Addison-Wesley Carter, A. W. and Bloomer, F. A. (2004): Generating cash from a patent portfolio: an overview. Patent Strategy and Management August, p. 5-6
200
Cassima, B. and Veugelers, R. (2000): External technology sources: embodied or disembodied technology acquisition. Departament d'Economia i Empresa, UPF; 444 Barcelona Cassima, B. and Veugelers, R. (2003): In search for complementarity in the innovation strategy: internal R&D and external knowledge acquisition. Documentos de Trabajo Cassiman, B. and Veugelers, R. (2006): In search for complementarity in the innovation strategy: internal R&D and external knowledge acquisition. Management Science, 52, p. 68-82 Catasus, B. and Gröjer, J. (2003): Intangibles and credit decisions: results from an experiment. European Accounting Review, 12, p. 327-355 Chan, L. K. C., Lakonishok, J. and Sougiannis, T. (2001): The stock market valuation of research and development expenditures. Journal of Finance, 66, p. 2431-2456 Chatterji, D. (1996): Accessing external sources of technology. Research Technology Management, 39, p. 48-57 Chesbrough, H. (2003a): The logic of open innovation: Managing intellectual property. California Management Review, 45 (3), p. 33-58 Chesbrough, H. (2003b): Open innovation, the new imperative for creating and profiting from technology: Harvard Business School Press Chesbrough, H. (2004): Open innovation. In: Crainer, S. and Dearlove, D., eds. Financial times handbook of management. London: Pearson/Financial Times Prentice Hall, p. 575-580 Chesbrough, H. (2006): Emerging secondary markets for intellectual property: US and Japan comparisons. Research Report to National Center for Industrial Property Information and Training (NCIPI) Chesbrough, H., Birkinshaw, J. and Teubal, M. (2006): Introduction to the research policy 20th anniversary special issue of the publication of "Profiting from innovation" by David J. Teece. Research policy, 35, p. 1091-1099 Clou Partners GmbH and Deutsche Bank AG (2006): Patent Select I [Verkaufsprospekt] Coenenberg, A. G. (2001): Jahresabschluß und Jahresabschlußanalyse: Grundfragen der Bilanzierung nach betriebswirtschaftlichen, handelsrechtlichen, steuerrechtlichen und internationalen Grundsätzen. Landsberg/Lech: Moderne Industrie Cohen, W. M. and Levinthal, D. A. (1989): Innovation and learning: the two faces of R&D. Economic Journal, 99, p. 569-596 Cohen, W. M., Nelson, R. R. and Walsh, J. P. (2000): Protecting their intellectual assets: appropriability conditions and why U.S. manufacturing firms patent (or not). Working Paper 7552, NBER Working Paper Series
201
Cohnen-Beck, C. (2007): Investieren in geistiges Eigentum. Financial Times Deutschland, 29.05.2007 Comanor, W. S. and Scherer, F. M. (1969): Patent statistics as a measure of technical change. Journal of Political Economy, 77, p. 392-398 Corbett, J. and Jenkinson, T. (1997): How is investment financed? A study of Germany, Japan, the United Kingdom, and the United States. The Manchester School, 65, p. 69-93 Czarnitzki, D., Hall, B. H. and Oriani, R. (2006): The market valuation of knowledge assets in US and European firms. Working Paper, p. 1-23 Czarnitzki, D. and Kraft, K. (2002): Measuring the impact of innovation on firm value: a new approach. Discussion Paper No. 02-73, ZEW Daimler AG (2008): Annual report 2007 Damodaran, A. (2006): Damodaran on valuation: security analysis for investment and corporate finance. Hoboken, NJ: Wiley Davies, I. (2004): Financing of Welsh SMEs: the commodification of IP rights: IP Wales Davies, I. (2006): Secured financing of intellectual property assets and the reform of English personal property security law. Oxford Journal of Legal Studies, 26, p. 559-583 Davis, J. L. and Harrison, S. S. (2001): Edison in the boardroom, how leading companies realize value from their intellectual assets: John Wiley & Sons Demberg, G. (2007): Patente sind Exoten im Leasinggeschäft. Handelsblatt, 01.11.2007 Deng, Z., Lev, B. and Narin, F. (1999): Science & technology as predictors of stock performance. Financial Analysts Journal, 55, p. 20-32 Devaney, S. and Lizieri, C. (2004): Sale and leaseback, asset outsourcing and capital market impacts. Journal of Corporate Real Estate, 6, p. 118-132 Diehl, A. (1984): On Japanese creativity. In: Eto, H. and Matsui, K., eds. R&D management systems in Japanese industry. Amsterdam: North-Holland, p. 73-78 Douma, S. and Schreuder, H. (2008): Economic approaches to organizations. Harlow: Financial Times/Prentice Hall DPMA (2006): Annual report 2006 Economist (2005): Industrial metamorphosis: factory jobs are becoming scarce. It's nothing to worry about. The Economist, 69, p. 69-70 Economist, T. (1851): Amendment of Patent Laws. The Economist, 811 Edler, J., Meyer-Krahmer, F. and Reger, G. (2002): Changes in the strategic management of technology: results of a global benchmarking study. R&D Management, 32, p. 149-164
202
Edvinsson, L. and Malone, M. (1997): Realizing your company’s true value by finding its hidden brain power. New York, NY: HarperCollins Publishers Edwards, D. (2002): Patent Backed Securitization: Blueprint for a New Asset Class 2nd Annual Advancing IP Structured Finance: World Research Group Elton, J. J., Shah, B. R. and Voyzey, J. N. (2002): Intellectual property: partnering for profit. The McKinsey Quarterly 2002, Special Edition Technology Ely, J. W. J. (1992): The guardian of every other right: a constitutional history of property rights: Oxford University Press EPO (2004): Annual report 2004 EPO (2006): Annual report 2006 EPO (2010): Annual report 2009 Ernst, H. (1995): Patenting strategies in the German mechanical engineering industry and their relationship to firm performance. Technovation, 15, p. 225-240 Ernst, H. (2001): Patent applications and subsequent changes of performance: evidence from time-series cross-section analyses on the firm level. Research policy, 30, p. 143-157 Ernst, H. and Omland, N. (2003): Patentmanagement junger Technologieunternehmen. Zeitschrift für Betriebswirtschaft, Ergänzungsheft 2/2003, p. 95-113 European Commission (2006): Intellectual property and access to finance for high growth SMEs. Discussion paper for the workshop. Brussels Fey, C. F. and Birkinshaw, J. (2005): External sources of knowledge, governance mode, and R&D performance. Journal of Management, 31, p. 597-621 Finance System GmbH & Co. KG (2005): Patent Invest 1 [Verkaufsprospekt] Frey, R. and Hussinger, K. (2006): The role of technology in M&As: a firm level comparison of cross-border and domestic deals. Discussion Paper 06-069, ZEW Fries (2006): Rolle von immateriellen Vermögenswerten aus Bankensicht (Commerzbank). Immaterielle Vermögenswerte und ihre Bedeutung für die Unternehmensfinanzierung in der wissensbasierten Technologiegesellschaft, 22.11.2006, Frankfurt Gambardella, A., Giuri, P. and Luzzi, A. (2006a): The market for patents in Europe. LEM working paper series 2006/04, Laboratory of Economics and Management: Sant'Anna School of Advanced Studies Gambardella, A., Giuri, P. and Luzzi, A. (2007): The market for patents in Europe. Research policy, 36, p. 1163-1183
203
Gambardella, A., Giuri, P. and Mariani, M. (2006b): Study on evaluating the knowledge economy what are patents actually worth? The value of patents for today’s economy and society: European Commission Gassmann, O. and Bader, M. A. (2006): Patentmanagement: Innovationen erfolgreich nutzen und schützen. Berlin: Springer Gebhardt, G., Gerke, W. and Steiner, M. (1993): Handbuch des Finanzmanagements: Instrumente und Märkte der Unternehmensfinanzierung. München: Beck Gelb, D. S. (2002): Intangible Assets and Firms' Disclosures: An Empirical Investigation. Journal of Business Finance & Accounting, 29, p. 457-476 Giuri, P., Mariani, M., Brusoni, S., Crespi, G., Francoz, D., Gambardella, A., Garcia-Fontes, W., Geunac, A., Gonzales, R., Harhoff, D., Hoisl, K., Bas, C. L., Luzzi, A., Magazzini, L., Nesta, L., Nomaler, O., Palomeras, N., Patel, P., Romanelli, M. and Verspagen, B. (2007): Inventors and invention processes in Europe: results from the PatVal-EU survey. Research policy, 36, p. 1107-1127 Gräfer, H., Beike, R. and Scheld, G. A. (1998): Finanzierung: Grundlagen, Institutionen, Instrumente und Kapitalmarkttheorie. Berlin: Schmidt Granstrand, O. (1999): The economics and management of intellectual property, towards intellectual capitalism: Edward Elgar Publishing, Inc., Great Britain Granstrand, O. (2007): Industrial innovation economics and intellectual property. Göteborg: Chalmers Reproservice Granstrand, O., Bohlin, E., Oskarsson, C. and Sjöberg, N. (1992): External technology acquisition in large multi-technology corporations. R&D Management, 22, p. 111-134 Greenspan, A. (2003): Remarks by Alan Greenspan. Financial Markets Conference of the Federal Reserve Bank of Atlanta, April 4, 2003, Sea Island, Georgia (US) Griliches, Z. (1981): Market value, R&D, and patents. Economics Letters, 7, p. 183-187 Griliches, Z. (1984): Market Value, R&D, and Patents. In: Griliches, Z., ed. R&D, Patents, and Productivity. Chicago and London: The University of Chicago Press, p. 249-252 Griliches, Z. (1990): Patent statistics as economic indicators: a survey. Journal of Economic Literature, 28, p. 1661-1707 Griliches, Z. (1998): Patent statistics as economic indicators: A survey. In: Griliches, Z., ed. R&D and productivity: The econometric evidence: University of Chicago Press, p. 287-343 Griliches, Z. (2000): R&D, education, and productivity - a retrospecitve: Harvard University Press Griliches, Z., Hall, B. H. and Pakes, A. (1991): R&D, patents, and market value revisited: is there a second technological opportunity factor? Economies of Innovation and New Technology, 1, p. 183-201
204
Grindley, P. C. and Nickerson, J. (1996): Licensing and business strategies in the chemical industry - technology licensing strategies. New York: Wiley Grindley, P. C. and Teece, D. J. (1997): Managing intellectual capital: licensing and cross-licensing in semiconductors and electronics. California Management Review, 39, p. 8 Guimon, J. (2005): Intellectual capital reporting and credit risk analysis. Journal of Intellectual Capital, 6, p. 28-42 Haeussler, C., Harhoff, D. and Mueller, E. (2009): To be financed or not ... – the role of patents for venture capital financing. ZEW Discussion Paper, No. 09-003 Hair, J. F., Black, B., Babin, B. and Anderson, R. E. (2006): Multivariate data analysis. New Jersey: Pearson Prentice Hall Hall, B. H., Graham, S., Harhoff, D. and Mowery, D. C. (2004): Prospects for improving U.S. patent quality via postgrant opposition. NBER, 4, p. 115-143 Hall, B. H., Jaffe, A. and Trajtenberg, M. (2005): Market value and patent citations. RAND Journal of Economics, 35, p. 16-38 Hall, B. H. and Oriani, R. (2005): Does the market value R&D investment by European firms? Evidence from a panel of manufacturing firms in France, Germany, and Italy. Working Paper Hall, B. H., Thoma, G. and Torrisi, S. (2007): The market value of patents and R&D: evidence from European firms. NBER Discussion Paper, 13426 Hall, B. H. and Ziedonis, R. H. (2001): The patent paradox revisited: an empirical study of patenting in the US semiconductor industry, 1979 - 1995. RAND Journal of Economics, 32, p. 101-128 Hall, M. (2003): Measures to increase the effectiveness of credit risk analysis in corporate lending through better understanding of the role of intangibles. PRISM (Policy Research into Innovation and Measurement Practice in The Intangible Economy), Work Package 7 (Banking & VC Metrics): European Commission Information Society Technologies Programme Harhoff, D. (1997): Are there financing constraints for R&D and investment in German manufacturing firms? Discussion Paper, FS IV 97 - 45, Wissenschaftszentrum Berlin Harhoff, D. (2007): Patents and innovation – Portfolio views and beyond RADMA. Bremen Harhoff, D. (2009): The role of patents and licenses in securing external finance for innovation. European Investment Bank: EIB Papers, 14.2009, p. 74-97 Harhoff, D. and Reitzig, M. (2001): Strategien zur Gewinnmaximierung bei der Anmeldung von Patenten: wirtschaftliche und rechtliche Aspekte als Entscheidungsgrößen beim Schutz von Erfindungen. Zeitschrift für Betriebswirtschaft, 71, p. 509-529 Hildebrand, J. (2009): Raubzug der Patenthaie. Die Welt, 23.02.2009
205
Hillery, J. S. (2004): Securitization of intellectual property: recent trends from the United States. Bethesda, MD: Washington CORE Hirn, W. (2007): Philips - Patente Lösung. Manager Magazin, 5, 111 Hirschey, M. and Richardson, V. J. (2004): Are scientific indicators of patent quality useful to investors? Journal of Empirical Finance, 11, p. 91-107 Hirschey, M., Richardson, V. J. and Scholz, S. W. (1998): Value relevance of nonfinancial information: the case of patent data. Working Paper, University of Kansas Hofmann, J. (2005): Value intangibles! Intangible capital can and must be valued – owners and valuers alike will benefit. Deutsche Bank Research International Topics, Current Issues, 19 Hosmer, D. W. and Lemeshow, S. (1989): Applied logistic regression. New York, NY: Wiley Hunt, R. (1999): Patent reform: a mixed blessing for the U.S. economy? Federal Reserve Bank of Philadelphia, Business Review, November/December 1999, p. 15-22 Itami, H. (1987): Mobilizing invisible assets. Cambridge, MA: Harvard Univ. Press IW (2006): Das Innovationsverhalten der technikaffinen Branchen - Forschung, Patente und Innovationen. Köln: Institut der deutschen Wirtschaft Köln Johnson, H. T. and Kaplan, R. S. (1987): Relevance lost - the rise and fall of management accounting. Boston Jorde, T. M. and Teece, D. J. (1990): Innovation and cooperation: implications for competition and antitrust. Journal of Economic Perspectives, 4, p. 75-96 Kamiyama, S., Sheehan, J. and Martinez, C. (2006): Valuation and exploitation of IP. STI Working Paper 2006/5. Statistical Analysis of Science, Technology and Industry: OECD Kaplan, R. S. and Norton, D. P. (1992): The balanced scorecard – measures that drives performance. Harvard Business Review, January-February 1992, p. 71-79 Kaplan, R. S. and Norton, D. P. (2004): Strategy maps: converting intangible assets into tangible outcomes. Boston, MA: Harvard Business School Press Kaplan, S. N. and Strömberg, P. (2002): Financial contracting theory meets the real world: an empirical analysis of venture capital contracts. Review of Economic Studies, (2002) 00, p. 1-35 Katz, D. and Kahn, R. L. (1966): The social psychology of organizations. New York: Wiley Katz, R. and Allen, T. (1982): Investigation the not invented here (NIH) syndrome: a look at the performance, tenure, and communication patterns of 50 R&D project groups. R&D Management, 12, p. 7-19
206
Kessler, E. H., Bierly, P. E. and Gopalakrishnan, S. (2000): Internal vs. external learning in new product development: effects on speed, costs and competitive advantage. R&D Management, 30, p. 213-224 Kessler, H. (2002): Rechnungslegung von Biotechnologieunternehmen. In: Herstatt, C. and Müller, C., eds. Management-Handbuch Biotechnologie: Strategien, Finanzen, Marketing, Recht. Stuttgart: Schäffer-Poeschel, p. 331-349 KfW (2006): Mittelstands- und Strukturpolitik - Sonderband Innovationen in KMU 2006: KfW King, R. G. and Levine, R. (1993): Finance and growth: Schumpeter might be right. The Quarterly Journal of Economics, 434, p. 717-737 Kingston, W. (2001): Innovation needs patents reform. Research policy, 30, p. 403-423 Klawitter, C. (2008): Rechtliche Fallstricke bei der Bewertung von IP. 2. Deutsche Patentbewertungstage, European Patent Office, Munich Klawitter, C. and Hombrecher, L. (2004): Gewerbliche Schutzrechte und Urheberrechte als Kreditsicherheiten. WM Heft, 25/2004, p. 1213-1219 Kleinbaum, D. G., Kupper, L. L., Muller, K. E. and Nazim, A. (1998): Applied regression analysis and other multivariable methods. Pacific Grove: Duxbury Press Kline, D. (2003): Sharing the corporate crown jewels. MIT Sloan Management Review, 44, p. 89-93 Kogut, B. and Zander, U. (1993): Knowledge of the firm and the evolutionary theory of the multinational corporation. Journal of International Business Studies, 24, p. 625-645 Kortum, S. and Lerner, J. (1999): What is behind the recent surge in patenting? Research policy, 28, p. 1-22 Kossovsky, N. (2003): The untapped potential of IP finance. Patent Strategy and Management, June, 2 Küting, K. (2008): Wie sich Volkswagen reich rechnet. FAZ, 14.04.2008 Küting, K. and Koch, C. (2007): Das Sale-and-Lease-back-Verfahren im Jahresabschluss des Verkäufers/Leasingnehmers nach HGB und IFRS. Zeitschrift für internationale und kapitalmarktorientierte Rechnungslegung, 11, p. 607-620 Kwok, B. K. B. (2005): Accounting irregularities in financial statements: a definitive guide for litigators, auditors, and fraud investigators. Aldershot: Gower Landgericht München I (Az. 14HK O 8038/06): Wirtschaftsprüfungsgesellschaft muss 1 Million Euro Schadensersatz zahlen: RiLG Pichlmaier T. (Pressesprecher)
207
Lanjouw, J. O., Pakes, A. and Putnam, J. (1998): How to count patents and value intellectual property: uses of patent renewal and application data. The Journal of Industrial Economics, XLVI, p. 405-433 Lee, C.-F. and Lee, A. C. (2006): Encyclopedia of finance. Boston, MA: Springer Science+Business Media, Inc. Lee, C.-S. and Vonortas, N. S. (2004): Business model innovation in the digital economy. In: Doukidis, G., Mylonopoulos, N. and Pouloudi, N., eds. Social and economic transformation in the digital era. Hershey, PA: Idea Group Publishing, p. 163-181 Lerner, J. (1994): The importance of patent scope: an empirical analysis. RAND Journal of Economics, 25, p. 319-332 Lev, B. (2001): Intangibles: management, measurement, and reporting. Washington, DC: Brookings Inst. Press Lev, B. (2003): Intangibles at a crossroads. Controlling, 3/4 Levin, R., Klevorick, C., Nelson, R. and Winter, S. G. (1987): Appropriating the returns from industrial research and development. Brookings Papers on Economic Activity, 3, p. 783-820 Lichtenthaler, U. (2006): Leveraging knowledge assets: success factors of external technology commercialization. Wiesbaden: Dt. Univ.-Verl. Lichtenthaler, U. and Ernst, H. (2007): The role of technology aggressiveness, RADMA, Bremen Lipfert, S. and Keil, M. (2005): Patentbewertung als Basis für die Unternehmensfinanzierung: Ein praxisorientierter Überblick. Mitteilungen der deutschen Patentanwälte, 96, p. 444-448 Lucier, M. and Milani, M. (2005): The emergence of IP finance - a bright future lies ahead. Patent Strategy and Management, July Mann, R. J. and Sager, T. W. (2007): Patents, venture capital, and software start-ups. Research policy, 36, p. 193-208 Mansfield, E. (1985): The effects of R&D tax credits and allowances in Canada. Research policy, 14, p. 97-107 Mansfield, E. (1986): Patents and innovation: an empirical study. Management Science, 32, p. 173-181 Manthey, C. (2008): IP Acquisition: Die Patenteinkäufer stellen sich vor. IPB Newsletter 06/2008, Hamburg Mayer, M. D. (2003): Venture Finance: zur Finanzierung innovativer Unternehmungen. Wiesbaden: Dt. Univ.-Verl. Miller, M. H. (1988): The Modigliani-Miller propositions after thirty years. The Journal of Economic Perspectives, 2, p. 99-120
208
Millien, R. and Laurie, R. (2007): A summary of established & emerging IP business models. The Sedona Conference, Sedona, AZ (US) Mørck, F., Hall, M. and Vali, E. (2003): Banking and venture capital metrics. Project PRISM (Policy research into innovation and measurement practice in the intangible economy): European Commission Myers, S. C. (2001): Capital structure. The Journal of Economic Perspectives, 15, p. 81-102 Myers, S. C. and Majluf, N. S. (1984): Corporate financing and investment decisions when firms have information that investors do not have. Working Paper, Sloan School of Management Nakamura, L. I. (2001): What is the US gross investment in intangibles? (At least) one trillion dollars a year! Working Paper No. 01-15, Federal Reserve Bank of Philadelphia, p. 1-15 Narat, I. (2007): Wissen ist Rendite. Wirtschafts Woche, new investor, p. 37-40 Narin, F., Noma, E. and Perry, R. (1987): Patents as indicators of corporate technological strength. Research policy, 16, p. 143-155 Neus, W. and Walter, A. (2008): Lines of research in 50 years of corporate financial theory. In: Breuer, W. and Gürtler, M., eds. 50 years after MM: recent developments in corporate finance. Wiesbaden: Gabler, p. 1-38 OECD (2004): Patents, innovation and economic performance: OECD OECD (2005a): Intellectual property as an economic asset: key issues in valuation and exploitation. EPO-OECD-BMWA Conference, Berlin OECD (2005b): Intellectual property as an economic asset: key issues in valuation and exploitation - summary report. EPO-OECD-BMWA Conference, Berlin OECD (2006): Creating value from intellectual assets Pakes, A. (1984): Patents, R&D, and the stock market rate of return: A summary of some empirical results. In: Griliches, Z., ed. R&D, patents, and productivity: University of Chicago Press, p. 253-260 Pakes, A. and Schankerman, M. (1984): The rate of obsolescence of patents, research gestation lags, and the private rate of return to research resources. In: Griliches, Z., ed. R&D, patents, and productivity. Chicago, IL: University of Chicago Press, p. 73-88 Pellens, B., Fülbier, R. U., Gassen, J. and Sellhorn, T. (2008): Internationale Rechnungslegung. Stuttgart: Schäffer-Poeschel Perridon, L. and Steiner, M. (2004): Finanzwirtschaft der Unternehmung. München: Vahlen Pitkethly, R. (1997): The valuation of patents: a review of patent valuation methods with consideration of option based methods and the potential for further research. Working Paper, Judge Institute: Cambridge
209
Pitkethly, R. (1999): The valuation of patents: a review of patent valuation methods with consideration of option based methods and the potential for further research. Judge Institute Working Paper WP 21/97, Cambridge/UK Porter, M. E. (1979): How competitive forces shape strategy. Harvard Business Review, March/April 1979, p. 137-145 Psotta, M. (2008): Bittere Pille für die Pharmaindustrie. FAZ, 07.04.2008 PwC (2007): Exploiting intellectual property in a complex world Rahn, G. (1994): Patentstrategien japanischer Unternehmen. Gewerblicher Rechtsschutz und Urheberrecht Internationaler Teil 5, 377 Rajan, R. G. and Zingales, L. (1995): What do we know about capital structure? Some evidence from international data. The Journal of Finance, 5, p. 1421-1460 Razgaitis, S. (2004): US/Canadian licensing in 2003: survey results. Journal of the Licensing Executive Society, 34, p. 139-151 Reitzig, M. (2002a): Improving patent valuation methods for management - Validating new indicators by understanding patenting strategies. LEFIC WORKING PAPER 2002-09, Copenhagen Business School Reitzig, M. (2002b): Die Bewertung von Patentrechten: eine theoretische und empirische Analyse aus Unternehmenssicht. Wiesbaden: Dt. Univ.-Verl. Reize, F. (2006): KfW-Mittelstandspanel 2006. Frankfurt am Main: KfW Bankengruppe Rigby, D. and Zook, C. (2002): Open-market innovation. Harvard Business Review, 80 (10) 2002, p. 80-89 Rivette, K. and Kline, D. (2000): Discovering new value in intellectual property. Harvard Business Review, January-February 2000, Reprint R00I09, p. 1-12 Roberts, B. (1999): A tale of two patent strategies. Electronic Business, 10, p. 79-84 Rohatschek, R. (2008): Aktuelle Bilanzierungs- und Bewertungsprobleme bei internationaler Rechnungslegung: Intangible Assets Internationale Rechnungslegung und internationales Controlling: Herausforderungen - Handlungsfelder - Erfolgspotenziale. Wiesbaden: Gabler, p. 131-150 Rossi, S. (2005): Patents, capital structure and the demand for corporate securities. 2006 Boston Meetings Paper, AFA Rossman, J. and Sanders, B. S. (1957): The patent utilization study. Patent, Trademark and Copyright Journal of Research and Education, 1, p. 74-111 Rothwell, R., Freeman, C., Horsley, A., Jervis, V. T. P., Robertson, A. B. and Townsend, J. (1974): SAPPHO updated - project SAPPHO phase II. Research policy, 3, p. 258-291
210
Sakkab, N. Y. (2002): Connect and develop complements research and develop at P&G. Research-Technology Management, 45, p. 38-45 Schedl, H. (2005): Patente als Sicherheiten bei der Kreditvergabe. ifo Schnelldienst, 58 Scheffer, G. v. (2006): Creating a market for technology. Patents - from collaterals to assets. EPO-OECD International Conference 2006, British Library Conference Center, London Scheichl, A. (2006): Kosten für Doppelerfindungen um EUR 150 Mio. reduziert pressetexte austria Scherer, F. M. (1965): Firm size, market structure, opportunity, and the output of patented inventions. American Economic Review, 55, p. 1097-1125 Scherer, F. M. and Harhoff, D. (2000): Policy implications for a world with skew-distributed returns to innovation. Research policy, 29, p. 559-566 Schewe, G. (1993): Kein Schutz vor Imitation: Eine empirische Untersuchung zum Paradigma des Markteintrittsbarrieren-Konzeptes unter besonderer Beachtung des Patentschutzes. Schmalenbachs Zeitschrift für betriebswirtschaftliche Forschung, 45, p. 344-360 Schmidt, A. (2002): Immaterielle Vermögenswerte als Werttreiber der Unternehmen. Vom Financial Accounting zum Business Reporting. Stuttgart: Schäffer-Poeschel, p. 295-318 Schneider, D. (1990): Investition, Finanzierung und Besteuerung. Wiesbaden: Gabler Schnell, R., Hill, P. B. and Esser, E. (1999): Methoden der empirischen Sozialforschung. München: Oldenbourg Scholl, A. (2003): Die Befragung: sozialwissenschaftliche Methode und kommunikations-wissenschaftliche Anwendung. Konstanz: UVK Verl.-Ges. Schultz, S. (2008): Finanzhaie zerfressen das Patentrecht. Spiegel Online Schumpeter, J. A. (1924): Theorie der wirtschaftlichen Entwicklung. Eine Untersuchung über Unternehmergewinn, Kapital, Kredit, Zins und den Konjunkturzyklus. Leipzig Schwartz, R. A. and Peng, L. (2006): Market liquidity. In: Lee, C.-F. and Lee, A. C., eds. Encyclopedia of finance. Boston, MA: Springer Science+Business Media, Inc., p. 630-632 Shapiro, C. (2001): Navigating the patent thicket: Cross licenses, patent pools, and standard-setting. In: Jaffe, A., ed. NBER innovation policy and the economy. Cambridge, Mass.: MIT Press, p. 119-150 Sharma, A. (2008): Tech giants join together to head off patent suits. The Wall Street Journal Online, June 30, 2008 Sheehan, J., Martinez, C. and Guellec, D. (2004): Understanding business patenting and licensing: results of a survey, in: Patents, innovation and economic performance
211
Smith, G. V. and Parr, R. L. (2000): Valuation of intellectual property and intangible assets. New York: John Wiley & Sons Smullen, J. and Hand, N. (2005): A dictionary of finance and banking. Oxford: Oxford University Press Specht, D. and Möhrle, M. G. (2002): Gabler Lexikon Technologiemanagement: Management von Innovationen und neuen Technologien im Unternehmen. Wiesbaden: Gabler Storn, A. (2003): Biete Idee, suche Geld: Der Handel mit Patenten wird zum großen Geschäft. Die Zeit, 19.02.2003 Stowell, D. (2010): An introduction to investment banks, hedge funds, and private equity: The new paradigm: Elsevier Science & Technology Süchting, J. (1995): Finanzmanagement: Theorie und Politik der Unternehmensfinanzierung. Wiesbaden: Gabler Sullivan, P. and Fox, S. P. (1996): Establishing an out-licensing activity In: Parr, R. L. and Sullivan, P., eds. Technology licensing: corporate strategies for maximizing value. New York, p. 83-96 Sullivan, P. H. (1998): Profiting from intellectual capital. New York Sveiby, K.-E. and Risling, A. (1986): Kunskapsföretaget (The Knowhow Company): Liber Sveiby, K. (1997): The new organizational wealth. San Francisco, CA: Berret Koehler Teece, D. (1977): Technology transfer by multinational corporations: the resource cost of transferring technological know-how. Economic Journal, p. 242-261 Teece, D. (1986): Profiting from technological innovation. Research policy, p. 285-305 Teece, D. J. (1981): The market for know-how and the efficient international transfer of technology. The Annals of the Academy of Political and Social Science, p. 81-96 Teece, D. J. (1998): Capturing value from knowledge assets: the new economy, markets for know-how, and intangible assets. California Management Review, 40, p. 55-79 Teece, D. J. (2005): Technology and technology transfer: mansfieldian inspirations and subsequent developments. Journal of Technology Transfer, 30, p. 17-33 Tietze, F. (2010): A typology of technology market intermediaries. Technology and Innovations Management Working Paper No. 60 Treacy, W. F. and Carey, M. S. (1998): Credit risk rating at large U.S. banks. Federal Reserve Bulletin, November 1998, p. 898-921 Utterback, J. M. and Abernathy, W. J. (1975): A dynamic model of process and product innovation. The International Journal of Management Science, 3, p. 639-655
212
van Pottelsberghe de la Potterie, B. and Francois, D. (2006): The cost factor in patent systems. Université Libre de Bruxelles Working Paper WP-CEB 06-002, Brussels Vaus, D. A. d. (2002): Surveys in social research Crows Nest, NSW: Allen & Unwin Verburg, R. M., Ortt, J. R. and Dicke, W. M. (2006): Managing technology and innovation: an introduction: London: Routledge Vermont, S. (2002): The economics of patents and litigation, In: Berman, B., ed. From ideas to assets, investing wisely in intellectual property: John Wiley & Sons, p. 327-372 Veugelers, R. (1997): Internal R&D expenditures and external technology sourcing. Research policy, 26, p. 303-315 Veugelers, R. (2006): Literature review on M&A and R&D. In: Cassiman, B. and Colombo, M. G., eds. Merger and acquisitions - the innovation impact Veugelers, R. and Cassiman, B. (1999): Make and buy in innovation strategies: evidence from Belgian manufacturing firms. Research policy, 28, p. 63-80 von der Eichen, S. and Sommerlatte, T. (2007): Kundennutzen als Maß. FAZ, 23.07.2007 Wnuck, C. (2007): Intellectual Property: Die neuen Goldesel. Kompetente Bewertung von Patenten könnte die Bilanzen von Unternehmen stärken. Finance, Dez 2006/Jan 2007, p. 60-62 Woeste, C. (2002): Immaterialgüterrechte als Kreditsicherheit im deutschen und US-amerikanischen Recht. Osnabrück Univ.-Verl. Rasch Wöhe, G. (2002): Grundzüge der Unternehmensfinanzierung. München: Vahlen World Bank (2006): World development database 2006 Wright, B. D. (1983): The economics of invention incentive: patents, prizes, and research contracts. The American economic review, 73(4), p. 691-707 Wurzer, A. (2005): IP and technology intermediaries. EPO-OECD-BMWA International Conference on Intellectual Property as an Economic Asset: Key Issues in Valuation and Exploitation, Berlin Wurzer, A. J. and Müller, H. (2007): Patente steigern den Unternehmenswert - Die finanzielle Bedeutung der Schutzrechte wird immer wichtiger. Neue Zürcher Zeitung, 22.06.2007 Yin, R. K. (2003): Case study research: design and methods. Thousand Oaks: Sage Publ. Zantow, R. (2008): Finanzwirtschaft des Unternehmens: die Grundlagen des modernen Finanzmanagements. München: Pearson Studium