Embed Size (px)
Citation preview

Leveraging Technology to Engage Parents at Scale: Evidence froma Randomized Controlled Trial∗
Peter Bergman Eric W. Chan†
February 2017
Preliminary Draft
Abstract: While leveraging parents has the potential to increase student performance,programs that do so are often costly to implement or they target younger children. We part-ner text-messaging technology with school information systems to automate the gatheringand provision of information to parents at scale. In a field experiment across 22 middleand high schools, we used this technology to send automated text-message alerts to parentsabout their child’s missed assignments, grades and class absences. The intervention reducescourse failures by 39% and increases class attendance by 17%. Students are more likely to beretained in the district. These effects are particularly large for students with below-averageGPA and students in high school. There are no effects on test scores however. As in previousresearch, the intervention appears to change parents’ beliefs about their child’s performanceand increases parent monitoring. Our results show that this type of automated technologycan improve student performance relatively cheaply and at scale.
JEL Codes: I20, I21, I24, I28.
∗This research is funded by the Smith Richardson Foundation and the Teachers CollegeProvost’s Investment fund and received approval from the Institutional Research Board atTeachers College, Columbia University. Bergman has previously received compensation fromthe learning management system company to design the technology tested in this study.†Teachers College, Columbia University, 525 W. 120th Street New York, New York 10027.
Email addresses: [email protected] and [email protected]: www.columbia.edu/~psb2101
I Introduction
Families are both one of the greatest sources of inequality and a powerful determinant of
academic achievement (cf. Heckman 2006; Cunha and Heckman 2007; Todd and Wolpin
2007). While leveraging parents has the potential to increase achievement, most programs
that do so focus on skills-based intervention that are costly to implement, have not been
scaled, or focus on families with young children (Belfield et al., 2006; Olds, 2006; Heckman
et al., 2010; Duncan and Magnuson, 2013; York and Loeb, 2014; Mayer et al., 2015). There
is a dearth of interventions that can successfully improve education outcomes for children
during middle and high school, especially ones that can be implemented and maintained at
a low cost (Cullen et al., 2013).
Though skill deficiencies matter, parents also face a range of information frictions that
make it difficult to foster their child’s human capital, including biased beliefs about their
child’s effort, ability and the education production function (Bonilla et al., 2005; Cunha
et al., 2013; Bergman, 2014; Rogers and Feller, 2016; Dizon-Ross, 2016). Reducing these
information problems can improve students academic performance during middle and high
school, but the potential to do this cheaply and at scale has not been realized. For instance,
Kraft and Dougherty (2013) conducted an experiment in a Boston charter school with 140
students that shows personalized, daily phone calls home to parents from their child’s teach-
ers improve assignment completion and student behaviors. Bergman (2014) randomized
the provision of bimonthly text messages to parents of 279 students detailing their child’s
missing assignments and grades—sent by hand—increased student effort and achievement.
Kraft and Rogers (2014) show that personalized messages from teachers to the parents of
435 students helped retain students in a high school credit recovery program during the
summer. In theory, placing student information online could help resolve these information
issues, however Bergman (2016) finds that parent adoption and usage of this technology is
low, especially in schools serving lower-income students.
1

In this paper, we use a field experiment in 22 middle and high schools to test whether
an education technology platform can push information to parents at scale and improve
outcomes at low cost. We partner with a Learning Management System company to develop
and test a technology that synchronizes with districts’ Student Information Systems and
teacher gradebooks to push information to parents about their child’s absences, missed
assignments and low grades via text message. This medium has been tested in a number
of education settings, often with positive results (Kraft and Rogers, 2014; Bergman, 2014;
Castleman and Page, 2015, 2016; Page et al., 2016; Berlinski et al., 2016; Oreopoulos and
Petronijevic, 2016; Castleman and Page, 2017). The intervention automates sending out
three types of alerts. First, an absence alert was sent weekly detailing the number of classes
a child missed by each course when available, rather than the number of full days a child
was absent. Similarly, if a student missed any assignments, a weekly alert was sent stating
the number of assignments missed in each class. Lastly, a low-grade alert was sent once per
month if the child had a class grade average below 70% at the end of the month. Messages
were randomly assigned to be delivered to either the mother or the father, when possible.
We find that existing contact between schools and parents widely varies. Our surveys
indicate that nearly 50% of parents were contacted less than one time in three months by
the school about their child’s academic progress. Similar to previous research cited above,
we find that parents tend to overestimate their child’s grades and underestimate their child’s
missed assignments. The intervention increases the likelihood parents were contacted by
schools at least once per month by 18 percentage points. In all, we sent 32,472 messages to
treatment group families, or an average of 52 messages per treated family.
As a result of this additional contact, we find substantial decreases in the number of
courses students failed. On average students fail one course and the text-message intervention
reduces this by 40%. GPA improves by a 0.10 of a standard deviation. Treatment group
students attend 17% more classes and district retention increases by 2 percentage points.
However, we do not find any improvements in standardized math and English test scores.
2

Lastly, most of these positive impacts are driven by students with below average GPAs and
high school students.1
Most closely related to our paper is concurrent work by Berlinski et al. (2016), who
conduct an automated-texting intervention in 8 elementary schools Chile.2 They send infor-
mation to parents about their child’s math test scores, grades and attendance. One difference
between their intervention and the one studied in this paper is the information they provided
to parents on math-specific test scores and class behaviors. These data were gathered from
schools and entered by their research team into a digital platform, which is used to send out
the texts to parents. Our intervention leveraged data frequently entered into district student
information systems, which includes grades, attendance and missed assignments, but not
class behaviors or exam scores.
Berlinski et al. (2016) find similar evidence of information problems, such as parents
incorrectly identifying their child’s grades. Encouragingly, they find significant improvements
in math grades, attendance and behaviors as a result of the intervention. The authors
also find evidence of positive spillovers of the intervention through their classroom-level,
randomized design. In a separate paper, we show it is possible to use administrative data to
identify social networks and to analyze spillovers.
The promise of automation is that, relative to other interventions, communicating with
parents via automated text messages is extremely low cost. The marginal cost of each text
message is a fraction of a cent. Despite sending more than 32,000 text messages, the total
cost of all of these messages was approximately $63. The gradebook and personnel training
cost an additional $7 dollars per student. With low overall and marginal costs both in terms
of time and effort, this intervention has a high potential to scale.
The rest of the paper proceeds as follows. Section II describes the background and the1We pre-registered our analysis plan and primary outcomes prior to obtaining outcome data.2Another related paper by Castleman and Page (2017) provides text messages to parents of older children during the college
matriculation process. They conduct a multi-arm, randomized-controlled trial that sends automated text messages to parentsand children designed to assist with the requisite tasks and to connect students with counselors. The messages were sent toeither students or students and their parents. The authors find positive effects on college enrollment for both interventions, butthere are no additional benefits to texting parents as well. Our study differs in its focus on academics during middle and highschool, however the idea of texting students the information we send to parents is an interesting avenue for further research.
3

experimental design. Section III describes the data collection process and outcome variables.
Section IV presents the empirical specifications and discusses experimental validity. Section
V shows our results and Section VI concludes.
II Background and Experimental Design
The experiment took place in 22 middle and high schools during the 2015-2016 school year
in Kanawha County Schools (KCS). KCS is currently the largest school district in West
Virginia with over 28,000 enrolled students as of 2016. The district’s four-year graduation
rate is 71% and standardized test scores are similar to statewide proficiency rates in 2016. In
the school year previous to the study, 2014-15, 44% of students received proficient-or-better
scores in reading and 29% received proficient-or-better scores in math. At the state level,
45% of students were proficient or better in reading and 27% were proficient in math. 83%
of district students are identified as white and 12% are identified as Black. 79% of students
receive free or reduced priced lunch compared to 71% statewide.3
The district has a purchased gradebook system for teachers. Schools records by-class
attendance and teachers mark missed assignments and grades using the same web-based
platform. We worked with the Learning Management System (LMS) provider to design a
tool to automatically draw data from this platform on students’ missed assignments for each
class, their percent grade by class and their class-level absences from the gradebook. This
information was coupled with parents’ contact information so that the system could pull the
information on academic progress from the gradebook and push it out to families using a
text-messaging API developed by Twilio. These text messages form our parent-alert system.
Each of the text messages are designed to be a consistent weekly or monthly update to
parents of students who had at least one absence or missing assignment during the week, or
have a low course average over the course of a month.
3These summary statistics come from the state education website, which can be found athttps://zoomwv.k12.wv.us/Dashboard/portalHome.jsp
4

The gradebook application also has a “parent portal,” which is a website that parents can
log into to view their child’s grades and missed assignments. All parents in the study could
access the platform and any parent could turn on our alerts by logging into the platform and
turning on the alert feature. Bergman (2016) finds that, in general, very few parents adopt
the parent portal and we find this is true in KCS as well; roughly a third of parents had ever
logged in to view their child’s grades. As we discuss further below, only 2% of parents in
the control group received any alert.
We test three types of parent alerts: Low-grade alerts, missed assignment alerts, and by-
class attendance alerts. On Mondays parents received a text-message alert on the number of
assignments their child was missing (if any) for each course during the past week. These as-
signments included homework, classwork, projects, essays, missing exams, tests, and quizzes.
On Wednesdays parents received an alert for any class their child had missed the previous
week. Lastly, and normally on the last Friday of each month, parents received an alert if
their child had a cumulative average below 70% in any course during the current marking
period. Each alert was sent at 4:00 P.M. local time and the text of each alert is provided
in Figure 1. The text messages also included a link to the website domain of the parent
portal, where the parent could obtain specific information on class assignments and absences
if necessary.
Experimental Design
The initial sample frame started with approximately 14,000 total students who were enrolled
in grades five through eleven during the end of the 2014-15 school year. A number of
these students either lived in the same households or did not have all the requisite contact
information we needed to obtain consent, resulting in a final sample frame of under 11,000
households. During the summer of 2015, one consent letter was sent to each household in the
sample frame, which was specifically addressed to one randomly selected parent or guardian
when contact information was available for more than one parent in the data provided by
5

the district. The letter contained the names of all students living in the same household who
were expected to be in our grade-levels of interest.4 Trained interviewers followed up the
letter with a phone call to each selected parent to confirm their participation and contact
information, as required by our Institutional Review Board. We then asked their language
preference and preferred modes of contact—text message or phone calls. As a result, the
parent or guardian of 1,137 students consented to the study and provided their contact
information for inclusion as a participant. Of these participants, 96% of the treatment and
control groups preferred to receive text messages. Though it deviated from our original
design, to simplify our intervention and to save on costs we chose to implement a text-only
intervention and those who could only be contacted by phone did not receive the intervention
even if they were randomized into treatment.
Random assignment was at the school-by-grade level to minimize the potential for spillovers
into the control group. The data were initially collapsed at the grade-by-school level and
randomization was subsequently stratified by indicators for below-median grade point aver-
age (GPA) and grade level. If we had contact information available for both the mother and
father of a child, or had multiple listed guardians, we randomized which parent or guardian
received the text-message alerts. The selected parent was the same as the parent to whom
the consent letter was addressed and the parent who trained personnel obtained consent
from on the phone. All school employees were blinded to the randomization process.
Parents in the control group received the default level of information that the schools and
teachers provided. This included report cards that are sent home after each marking period
every six to nine weeks along with parent-teacher conferences and any phone calls home from
teachers. As discussed above, all parents had access to the online gradebook.
Figure 2 shows the timeline of the experiment and data collection. Baseline data were
collected during June to July 2015. We obtained demographic and enrollment data for
the 2014-15 school year from KCS along with contact and address information. Consent
4Students were in grades 5-11 the previous year and were expected to be in grades 6-12 during the school year of the study.
6

letters were sent out beginning August 2015 during the beginning of the school year. Calls
requesting verbal consent were completed in September. Randomization into treatment and
control was completed in early October 2015. For parents who were selected into treatment,
introductory text messages were sent late that same month. Included in the texts was the
option to stop at any point by replying “stop” or any equivalent variation.5 Over the course
of the study, nine parents or guardians requested the messages stop.6 The intervention ran
between the end of October 2015 through the end of May when the school year was expected
to concluded. Officially, the academic school year ended in early June, but varied slightly
based on make-up days at each school. After the end of the school year we proceeded to
collect endline survey data both by phone and by mail as described below.
III Data Collection
We gathered data from multiple sources: administrative data, gradebook data, survey data,
and texting data. We collected initial baseline data from administrative records on student
grades, courses, attendance, race and ethnicity, English language status, and contact infor-
mation. We also obtained data from the gradebook application, which includes student’s
grades, class-level attendance and parent logins into the parent portal. These baseline data
were available for all students in our sample frame. During the intervention we obtained
monitoring records on the text messages. We used these data to track messaging stop rates,
whether text messages were received by phone numbers, and the total number of text mes-
sages that went out weekly.
After the school year concluded we surveyed parents. The surveys took place during
between June and August 2016. Initially, households were sent a letter stating that they
would be called for a survey. This letter included a $5 unconditional award as an appreciation
for their participation in the study. Households were then called by a trained interviewer
5We manually tracked replies to ensure the service was shut off when requested.6These parents were included in all analyses.
7

to conduct the survey. Around this time, West Virginian residents were afflicted by severe
flooding during several torrential storms in June 2016. Sadly, thousands in Kanawha County
and surrounding areas were affected. KCS also had multiple schools declared as “total losses”
by the Federal Emergency Management Agency because of the flooding. As a result, we
decided to mail surveys home instead of proceeding with subsequent rounds of calling. We
provided a reward of $30 for paper surveys returned postmarked by August 8th, 2016. Our
total response rate was 43%. A copy of our survey can be found in Appendix A.11. The goal
of the endline surveys was to examine parent responses to the intervention not captured by
administrative data. Parents were primarily asked about their communication habits with
the school in recent months, their perception of the child’s academic achievement relative to
peers, and their communication and motivational habits with their child.
After the conclusion of the school year, we obtained administrative data from the dis-
trict and the gradebook application once again. These included standardized exam scores
and suspension data, students’ final grades, daily class-level attendance, alerts received by
treatment and control group, and parent and student logins into the parent portal.
Outcome Measures
Primary achievement-related outcomes are from both the gradebook application and KCS
administrative data. Included in the gradebook data are outcomes related to the number
of missing assignments and class grades by marking periods. Administrative data contained
statewide standardized test scores in math and English.
The standardized test scores are from the Smarter Balanced assessment, which is aligned
to the Common Core. We received scaled standardized test scores for Math and ELA for 2015
and 2016 examinations. These were the first two years in which the assessment was given
after the state switched from the previous standardized test in West Virginia, the Westest.
Currently, students in grades 3-11 are required to take the Smarter Balanced assessment.
We also obtained behavior-related outcomes from the gradebook application and KCS.
8

Included in these measures were suspension data measured as the quantity of occurrences
and the number of days suspended as well as attendance measures including class-level
attendance (present, absent, tardy). We convert the latter into “number of days present”
(days enrolled minus days absent) because retention effects potentially causes an increase in
absences while increasing the number of days enrolled. We code suspensions into an indicator
for ever being suspended.
The survey of parents was designed to examine parent and student responses to the
intervention not captured by administrative and gradebook data. Parents were asked about
their communication with and from the school, their perceptions about how their child was
performing academically, and household behavior such as talking with their child about
their academic progress or taking privileges away as a result of their performance in school.
We use a number of these survey measures, along with other gradebook and administrative
measures, as secondary outcomes in this paper. Tables B.1 and B.2 summarize all the
secondary outcomes variables used in our analysis, their sources, and their construction.
IV Empirical Strategy & Experimental Validity
We estimate treatment-on-the-treated (TOT) effects, as registered in our analysis plan, via
two-stage least squares. In the first stage we instrument an indicator for parent i with a
child in school j and grade k receiving at least one text message alert with the randomly
assignment treatment indicator as follows7
alertedijk = α0 + α1Treatmenti +X ′iα2 + ηijk
Standard errors are clustered at the level of random assignment, which is the grade level
in a given school. Xi is a set of pre-specified, individual-level covariates, which are fraction
of days absent in the previous year, baseline GPA, an indicator for a student identified as7The dependent variable in the first stage is an indicator for ever being alerted post-treatment and not the number of alerts
a family receives. Using the latter slightly increases precision but is less intuitive to interpret.
9

Black, an indicator for English-Language Learner status, an indicator for having ever been
suspended in the previous year, an indicator for gender, and an indicator for having special
needs. When the outcome in the second stage is test scores, the baseline test score is included
as well, if available. All regressions include strata indicators as controls.
The second stage then regresses an outcome on the instrumented alertedijk variable. All
controls are the same across the first and second stage estimating equations. There are 76
clusters, and standard errors are always clustered at the level of treatment assignment as
described above. We analyze subgroups by restricting the sample to each subgroup and
studying outcomes in the same way as described above. We specified several subgroups of
interest: students with below-median GPA, students with male parents or guardians, and
students in middle versus high school.
Baseline Treatment-Control Balance
Table 1 presents baseline summary statistics for the control group, the difference in means
from the treatment group and the p-value showing the statistical significance of these differ-
ences. Demographically, the sample is 49% female, 16% black, and the majority of students
live in two-parent households. On average, students’ baseline GPA is 2.8, they have missed
6% of school days, and 11% have been suspended in the last year. As in Bergman (2016),
many more students have logged into the online gradebook portal than parents. Finally, ran-
domization appears to have created a treatment and control group that are similar in terms
of observable variables; only one of the treatment-controls differences is statistically signifi-
cant at the 10% level, which is the share ever suspended. We also regress baseline covariates
on our treatment indicator and conduct an F-test for whether these baseline covariates are
jointly equal to zero. The test cannot reject that the coefficients on these covariates are
jointly equal to zero (p-value 0.68).
10

Attrition and Non Response
There are several sources of attrition and non response in this study: missing academic
outcomes, missing behavior outcomes, and survey non response. A particular concern is
whether there is differential attrition by treatment status, which would invalidate our ability
to make causal inferences from the data.
Table A.1 shows the effect of treatment status on several measures of attrition as well
as other correlates of attrition. The first column shows there is no treatment effect on the
likelihood a parent responds to the survey; the point estimate is both small and statistically
insignificant. Academic and demographic characteristics are generally poor predictors of
survey response as well, with the exception of “percent of days missed” the previous academic
year, which is significant at the 5% level.
This pattern generally remains true across the remaining indicators of missing data: school
suspensions, math scores and reading scores. There are no treatment effects on any of
these indicators. Only the percent of days missed the previous year is a strong predictor of
missing math and reading score. There are no significant predictors of missing suspension
data. Overall, there is no evidence of differential attrition or non-response by treatment
status. Additionally, attrition from course taking and transcript grades will be an outcome
of retention analyzed below. We define retention in the district as a student taking at least
one course post intervention.
V Results
Descriptive Results
We begin by describing current communications between parents, children and schools as well
as parents beliefs about their child’s performance and their correlates. Figure 3 shows the
frequency of contact parents’ receive from their child’s school about their academic progress,
11

as measured by the control group’s response to our survey. Nearly 50% of parents hear from
the school less than once every three months. On the other hand, 25% of parents hear from
their child’s school twice per month, which shows the variation in families who are contacted
frequently and those who are not. Table A.2 examines the correlates of infrequent contact
in column one. Surprisingly little predicts this infrequency; neither GPA nor behaviors nor
demographics significantly correlate with an indicator for hearing from the school less than
once every three months. This question does not, however, assess whether parents find this
communication useful.8
Figure 4 shows how often parents talk with their child about their progress in school.
The modal parent (55% of respondents) reports talking with their child every day about
their schoolwork. Roughly 75% of parents talk with their child 2-3 times per week or more.
One caveat is that this communication is self-reported, which may be subject to social-
desirability bias. Nonetheless, at face value, it appears their child’s schoolwork is at the top
of parents’ mind. This is also demonstrated in Figure 5, which shows how often parents
talk to another adult in the household about their child’s school work. For this behavior, no
parent reports doing so every day, but 40% of respondents say they talk with another adult
2-3 times per week about their child’s schoolwork or grades. Column two of Table A.2 shows
that, unsurprisingly, two-parent households are much more likely to have intra-household
communication about their child. Little else seems to correlate with this behavior however.
Figure 6 and Figure 7 present control group parents’ beliefs about their child’s academic
performance in terms of assignment completion and math grades, respectively. Figure 6
shows the number of assignments parents believe their child has missed in the past semester.
More than 50% of parents believe their child has not missed any assignments. According to
administrative data, only 20% of respondents’ children have missed no assignments. How-
ever parents have much more accurate perceptions about their child’s math grades: 60%
accurately state their child’s grade in math and around 25% overstate their child’s grade in8Not shown here, we find that 40% of parents disagree with the statement that their child’s school makes it easy to help
them do well in school.
12

math. Many fewer underestimate it. Table A.2 shows that inaccurate beliefs strongly and
negatively correlate with their child’s GPA.
Table A.2 shows a measure of communication between parents and their children: an
indicator for whether parents believe it is difficult to be involved in their child’s education
because their child does not tell them enough about their academic progress. 48% of parents
believe their child does not disclose enough information about their academic progress to be
easily involved in their education. This indicator negatively correlates with student’s GPA
and whether or not they are in high school. Parents with older or lower performing children
perceive that their child is not telling them enough about their schoolwork. In results not
shown, parents who report that their children do not disclose enough also report receiving
significantly fewer report cards from their child’s school as well.
Overall, these descriptives highlight how the information flow between parents and their
children may be particularly impeded when the child is performing poorly in school. While
many parents frequently talk with their child and another adult in the household about their
academic progress, nearly one-half of parents believe it would be easier to be involved in their
child’s education if their child told them more about their schoolwork. The latter correlates
strongly with students’ grades and the receipt of report cards. In terms of parents’ beliefs,
parents tend to have accurate beliefs about student output—their grades—which is in line
with what is provided on report cards. However, parents have much less accurate beliefs
regarding a primary input to their child’s grades, assignment completion. A key question
is whether the automated-texting intervention studied here can increase parents access to
timely, actionable information and improve academic outcomes at scale. The next section
examines the effect of the treatment on school-to-parent communication.
A School-Parent Contact
Table 2 shows the effect of treatment status on alert receipt. The first column shows an
increase in the share of parents who received at least one alert as a result of the treatment.
13

Parents in the treatment group were 71 percentage points more likely to receive an alert than
the control group. Not every family had a cell phone to receive text messages, so compliance
is imperfect. As discussed above, all parents in the study could access the platform and
any parent could turn on our alerts by logging into the platform and turning on the alert
feature. However Table 2 shows that only two percent of the control group received any
alert. The second column shows the additional number of alerts that the treatment group
received over the course of the school year relative to the control group. Treatment group
families received nearly 50 text-message alerts, on average. The remaining columns break
the alerts down by the number of each type parents received. Most messages were absence
and assignment alerts because these were sent out weekly; families received 21 of each of
these alerts, on average. Low-grade alerts went out monthly and so families received about
6 low-grade alerts, on average.
We use survey data to examine whether parents also report receiving more contact from
the school about their child’s academic progress. Note that this includes any form of contact
including phone call, letter, email or text message. Parents could respond: “about twice a
month,” “about once a month,” “once every two or three months,” and “less than once every
three months.” We specified that we would code this into an indicator for being contact-
ing once per month or more, but we show mutually exclusive indicators for every possible
response for completeness.
Table 3 shows the effects of treatment assignment on these parent-reported measures of
contact form the school. Aside from this first column outcome, the remaining columns show
effects on mutually-exclusive indicators of contact from the school. The control group means
at the bottom of the table indicate that nearly 50% of parents hear from their school less
than three times per month about their child’s progress. Column one looks at the indicator
for whether parents are contacted at least once per month. 37% of the control group is
contacted at least once per month, and the treatment increases this by 21 percentage points.
The remaining columns show that much of the increase in contact comes from the likelihood
14

parents are contacted once per month (column three) and there is a 13 percentage point
reduction in the likelihood that a parent reports being contact less than once every three
months.
B Primary Academic Outcomes
In our analysis plan we specified five primary outcomes guided by the nature of the treatment,
which targeted attendance, low grades and missed assignments. These outcomes are the
number of classes students failed, the number of classes attended, retention in the district,
and math and reading standardized test scores.
Table 4 presents the effects on these outcomes. Column one shows that students, on
average, fail one course. Receiving text message alerts reduced this by 39% or 0.38 points.
The outcome in column two is class attendance. The effect of receiving text message alerts is
again large and significant: students attend roughly 50 more classes than the control group,
which is an 18% increase over the control-group mean. Column three examines retention.
3% of students in the control group did not take at least a single course in the district in the
second semester, as opposed to 1% of students whose parents received alerts.
The effects on test scores are small and statistically insignificant. There are several
possible reasons for this given the results discussed above. A key concern is that the exams
are low stakes for students; they have no implications for their grades or their likelihood
of graduating. This issue is evident to district officials, who have expressed concern that
students are spending less time on the exam than is expected. Smarter Balance, the test
provider, estimates that 9th, 10th, and 11th-grade students need approximately 210 minutes
to complete the exams at each grade level. However 9th graders spent 80 minutes on the
exam, 10th graders finished the exam in 67 minutes, and 11th graders took 78 minutes to
complete the exam, on average.9
Second, the intervention may result in additional student effort for educational inputs
9The source for this information comes from a local newspaper, the Charleston Gazette-Mail.
15

that improve course grades but not standardized test scores. The outcomes discussed above
show improvements in students’ coursework and attendance. However, the curricular ma-
terial covered during this additional course time may not necessarily reflect the material
covered in the exams, especially as the exams were only recently implemented in 2015. The
superintendent stated they are “working on standards-based teaching making sure all the
standards are covered.”10 Moreover, because the exams had only recently been introduced,
no accountability measures associated with the exams had been released. These reasons may
attenuate the potential to impact test scores in a substantial way.
C Student Behaviors
Table 5 presents the effects on students’ marking period course grades in more detail. Column
one shows the effects on the number of failed courses, as before, but columns two through
five show the effects on the number of D’s, C’s, B’s and A’s students received as well. The
intervention appears to shift students failing grades to C grades. Column one shows the large
and significant negative effect in the number of F’s students receive presented above. Column
three shows a large and significant positive effect—a 0.3 point increase—in the number of C’s
students receive. The coefficients on the number of B’s and A’s are negative and positive,
respectively, but neither estimate is statistically significant. Overall, the evidence suggests
that the treatment caused students to receive fewer F’s and more C’s. This makes sense
given the nature of the intervention, one facet of which is to alert parents when their child
is getting a low grade. This is also consistent with the positive impacts on below-average
GPA students, which will be discussed later.
In addition to marking period grades, we examined secondary outcomes related to stu-
dent behaviors. Table 6 provides the treatment effects on GPA, suspensions, completed
assignments, and student logins. We find a positive effect on GPA of 0.10 points, which is
significant at the 10% level. The impact on suspensions is small and insignificant. Assign-
10This quote is from the Charleston Gazette-Mail.
16

ment completion increases but not significantly so, as do student logins.
Overall, the net positive impacts on GPA overall is encouraging. It is possible for students
to have held their effort constant and reallocate it toward their failing courses. The latter
would not necessarily be perceived as a negative given that it would result in increased credit
completion, but the evidence suggests an overall net increase in classroom effort.
D Parent Beliefs and Behaviors
We show the effects on parents’ beliefs about the number of assignments their child has missed
in Table 7, similar to Bergman (2014). We asked parents whether they thought their child
missed no assignments, 1-5 assignments, 6-10 assignments, or more than 10 assignments.11
Column one shows that 53% of parents in the control group believed their child missed zero
assignments in the last semester. The treatment reduces this belief by 15 percentage points.
We can see from the remaining columns that the treatment resorts this change away from
no missed assignments across the remaining categories. There a statistically significant, 9
percentage point increase, in the likelihood parents respond that their child has missed 6-10
assignments. Only 6% of the control group believes their child missed 6-10 assignments.
Figure A.8 compares these beliefs about missed assignments to the number of missed
assignments documented in the administrative data. This figure, which depicts the abso-
lute categorical differences in parental beliefs of missed assignments minus actual missed
assignments, makes it apparent that there is no treatment effect on the accuracy of parents’
beliefs about their assignment completion. Figure A.9 shows a similar representation of
parents’ beliefs about their child’s math grades relative to the truth. Here, there is a more
visible improvement in parents’ accuracy: the share of parents accurately reporting their
child’s grade increases by 9 percentage points and the magnitude of their errors tends to be
smaller as well. We show this difference in a regression, discussed below, but a test of these
distributions finds they are significantly different at the 5% level as well.12
11We found this phrasing reduces the potential for outlier responses.12We use Fisher’s exact test to compare the distributions (p-value is 0.048).
17

Table 8 shows several behavioral responses to the treatment by parents. Column one in
Panel A shows that, as found in Bergman (2014), parents are much more likely to contact
the school as a result of the intervention. The share of families who contacted the school
more than once over the course of the semester increased by 17 percentage points.
While the treatment effects on parent logins to view their child’s grades and taking privi-
leges are positive, neither is statistically significant (p values are 0.27 and 0.14, respectively).
Though the question is worded slightly differently, Bergman (2014) found parents were sig-
nificantly more likely to take away privileges from their children.13
As reported above, column two of Panel B shows parents become significantly more
accurate about their child’s grade in math class. Lastly, the third column of Panel B asks
parents if they would like to continue the text message intervention. A high share—94%—of
the control group would like to receive the intervention. The latter is not surprising, but
what is encouraging is that the treatment causes a significant increase in parents’ demand
for the text messages of four percentage points.
Heterogeneity in Effects
Table A.3 presents analysis for subgroups of interest. We are interested in the effects of alerts
on students with below-average grades, students whose father received the messages versus
those whose mother received the messages, and students in middle and students in high
school. Given that the intervention targeted those with low grades and attendance, we are
particularly interested in the subgroup of students who began the study with below-average
GPAs.
Panel A of Table A.3 shows that students with below-average GPA failed 0.9 fewer classes,
attended 64 more classes, and saw retention rates improve by five percentage points; all of
these effects are significant at the 1% level. As before there are no effects on exam scores.
Students’ GPA increases by 0.26 points, which is also significant at the 1% level. These13The question posed to parents in this study asks parents whether they took any privileges away as opposed to how often
they took privileges away.
18

large, positive impacts on students with below-average GPA are important as it shows that
informed parents can play an important role in increasing student achievement for those
struggling more in school. These results are also consistent with our survey results showing
the negative correlation between parents who believe that their child does not disclose their
academic progress sufficiently to help them and GPA. Furthermore, the treatment effect
of message receipt on parents’ desire to continue the intervention is 11 percentage points
and significant at the 1% level (results not shown). This effect on the desire to continue is
significantly different from the effect on parents of children with above-average GPA, who
express no greater desire to continue the intervention than the control group (however the
mean for the latter is already above 90%). All of this suggests particularly large benefits for
those with lower GPAs.
Second, Panel B of Table A.3 high school students were also more positively impacted
than the average student. These students failed 0.7 fewer classes, attend 43 more classes,
and were 4 percentage points more likely to remain in the district. Moreover, these effects
are substantially different from the effects on middle school students, shown in Panel C.
The effects for the latter group are nearly all smaller and statistically insignificant, with the
exception attendance.
Third, Panel D and Panel E show the effects for targeting information to the mother
versus the father, respectively. While there are slight differences in effects by gender of the
treated parent, coefficients are similar in sign and there is no clear pattern. Targeted fathers
saw their children experience slightly better results in terms of classes failed and classes
attended. In this context, we find no clear evidence that targeting one parent versus another
yields different results.
Given the lack of effect on test scores, a question is whether there were effects on test
score for any subgroup. We conducted exploratory analyses to answer this question. We find
that parents who had never logged into the gradebook system to view their child’s grades
show positive effects on math scores and larger effects in other domains. However we checked
19

for these larger effects in a different study on the adoption of texting technology (Bergman
and Rogers, 2017), and there were no differential effects according to this subgroup. Parents
with less than a college education also see positive effects on their child’s test scores, but this
is a small subgroup as the measure of parents’ education is based on surveys. These results
should be viewed with caution as they are exploratory; we only note them here if they prove
useful in defining subgroups worthy of study in future research.
VI Conclusion
Recent research has demonstrated that providing information to parents can produce sig-
nificant gains in student achievement at potentially low cost. To date, the ability to scale
these interventions for parents of older children has not yet been realized. We helped design
and implement an automated-text messaging program to test the ability to engage parents
at scale.
In this paper, our survey results demonstrate a need for improved parent-school commu-
nications. Parents also have inaccurate knowledge of their children’s academics, particularly
for those with below-average GPA students. Our intervention, which sends automated weekly
and monthly text messages in the event that their child misses a class or assignment, or has
a low course average, aims to improve student achievement and attendance. Overall, we
find significant effects on academic performance such as grades and attendance, though not
for test scores. These effects are particularly encouraging for lower-performing students and
students in high school. Notably, the effects are small for middle school students. As in
Bergman (2014), low-achieving students may be increasing effort levels inside the classroom,
thereby improving their grades. Concurrently, parents show evidence of more accurate be-
liefs about their child’s performance, though not about their child’s missed assignments. We
find that parents increase their contact with their child’s school as well.
Moreover the intervention is cheap relative to other education interventions aimed at
20

student achievement. The marginal cost of each text message is less a fraction of one cent.
Though in principal many learning management systems could be used to send information
to parents, if a school were to adopt the entire system in this study and training for how to
use it, the cost would be $7 per student.
Given the low cost and policy relevance, an important question is whether this intervention
would be adopted by parents in practice. This paper does not specifically study the adoption
of the intervention by parents. However, Bergman and Rogers (2017) examine how varying
district opt-in policies can drastically affect take up and, in turn, the efficacy of this particular
intervention. They find that, when schools opt in parents by default, fewer than 5% of parents
choose to subsequently opt out at any point during the school year. In our study, parents
must initially consent to receiving these texts. However, out of the parents who received at
least one alert, less than 2% subsequently decided to opt out over the course of the treatment
period.
There other open questions as well. For instance, in this context, we do not know the
optimal frequency, timing, and amount of information to send to parents. The messages we
send are simple and focus on “negative” information about their child’s performance. We do
not facilitate parents’ ability to transform the information into specific actions that benefit
their child. Further, more research is needed determine the effectiveness of various modes of
contact. In our study, we implicitly target messages to low-performing students but we do
not know if specific alerts could would better for other specific groups. One could envision
tailoring information for students at varying levels of performance to increase achievement
for a wider range of students.
21

References
Belfield, Clive R, Milagros Nores, Steve Barnett, and Lawrence Schweinhart,
“The High/Scope Perry Preschool Program cost–benefit analysis using data from the age-
40 followup,” Journal of Human resources, 2006, 41 (1), 162–190.
Bergman, Peter, “Parent-Child Information Frictions and Human Capital Investment:
Evidence from a Field Experiment,” Columbia University Teachers College Working Paper,
2014.
, “Technology Adoption in Education: Usage, Spillovers and Student Achievement,”
Columbia University Teachers College Working Paper, 2016.
Berlinski, Samuel, Matias Busso, Taryn Dinkelman, and Claudia Martinez, “Re-
ducing parent-school information gaps and improving education outcomes: Evidence from
high frequency text messaging in Chile,” Unpublished Manuscript, 2016.
Bonilla, Sheila, Sarah Kehl, Kenny YC Kwong, Tricia Morphew, Rital Kachru,
and Craig A Jones, “School absenteeism in children with asthma in a Los Angeles inner
city school,” The Journal of pediatrics, 2005, 147 (6), 802–806.
Castleman, Benjamin L and Lindsay C Page, “Summer nudging: Can personalized
text messages and peer mentor outreach increase college going among low-income high
school graduates?,” Journal of Economic Behavior & Organization, 2015, 115, 144–160.
and , “Freshman Year Financial Aid Nudges.,” Journal of Human Resources, 2016, 51
(2).
Castleman, Benjamin L. and Lindsay C. Page, “Parental Influences on Postsecondary
Decision Making,” Educational Evaluation and Policy Analysis, 2017, 20 (10), 1–17.
22

Cullen, Julie Berry, Steven D Levitt, Erin Robertson, and Sally Sadoff, “What Can
Be Done To Improve Struggling High Schools?,” The Journal of Economic Perspectives,
2013, 27 (2), 133–152.
Cunha, Flavio and James Heckman, “The Technology of Skill Formation,” American
Economic Review, 2007, 97 (2), 31–47.
Cunha, Flavio, Irma Elo, and Jennifer Culhane, “Eliciting maternal expectations
about the technology of cognitive skill formation,” Technical Report, National Bureau of
Economic Research 2013.
Dizon-Ross, Rebecca, “Parents perceptions and childrens education: Experimental evi-
dence from Malawi,” Unpublished Manuscript. University of Chicago., 2016.
Duncan, Greg J. and Katherine Magnuson, “Investing in Preschool Programs,” The
Journal of Economic Perspectives, 2013, 27 (2), 109–132.
Heckman, James J, “Skill formation and the economics of investing in disadvantaged
children,” Science, 2006, 312 (5782), 1900–1902.
, Seong Hyeok Moon, Rodrigo Pinto, Peter A Savelyev, and Adam Yavitz, “The
rate of return to the HighScope Perry Preschool Program,” Journal of public Economics,
2010, 94 (1), 114–128.
Kraft, Matthew A and Shaun M Dougherty, “The effect of teacher–family communi-
cation on student engagement: Evidence from a randomized field experiment,” Journal of
Research on Educational Effectiveness, 2013, 6 (3), 199–222.
Kraft, Matthew and Todd Rogers, “The Underutilized Potential of Teacher-to-Parent
Communication: Evidence from a Field Experiment,” 2014.
23

Mayer, Susan E, Ariel Kalil, Philip Oreopoulos, and Sebastian Gallegos, “Using
behavioral insights to increase parental engagement: The parents and children together
(PACT) intervention,” Technical Report, National Bureau of Economic Research 2015.
Olds, David L, “The nurse–family partnership: An evidence-based preventive interven-
tion,” Infant Mental Health Journal, 2006, 27 (1), 5–25.
Oreopoulos, Philip and Uros Petronijevic, “Student Coaching: How Far Can Technol-
ogy Go?,” Technical Report, National Bureau of Economic Research 2016.
Page, Lindsay C, Benjamin Castleman, and Katharine Meyer, “Customized Nudg-
ing to Improve FAFSA Completion and Income Verification,” 2016.
Rogers, Todd and Avi Feller, “Reducing student absences at scale,” Unpublished paper,
2016.
Todd, Petra E and Kenneth I Wolpin, “The production of cognitive achievement in
children: Home, school, and racial test score gaps,” Journal of Human capital, 2007, 1 (1),
91–136.
York, Benjamin N and Susanna Loeb, “One step at a time: the effects of an early
literacy text messaging program for parents of preschoolers,” Technical Report, National
Bureau of Economic Research 2014.
24

VII Figures
Figure 1: Alert Scripts
Alert Frequency Message
Low Class Average Alert monthly “Parent Alert: [Student Name] has a [X]% averagein [Class Name]. For more information, log in to[domain]”
Absence Alert weekly “Parent Alert: [Student Name] has [X] absence(s)in [Class Name]. For more information, log in to[domain]”
Missing Assignment Alert weekly “Parent Alert: [Student Name] has [X] missing as-signment(s) in [Class Name]. For more information,log in to [domain]”
This figure shows the script for each of the three types of alerts sent via text messages: low class average, absence, and missingassignments.
25

Figure 2: Timeline
This figure shows the timeline of the project, which began during the summer of 2015 and lasted through the summer of 2016,when data collection ended.
26

Figure 3: School-to-Parent Contact - Control Group
0.1
.2.3
.4.5
Frac
tion
About
twice
a mon
th
About
once
a mon
th
Once e
very
two o
r three
mon
ths
Less
than
once
every
three
mon
ths
Parent Reported Contact from the School
This figure shows the frequency of school to parent contact regarding student academic progress for the control group.Results are from endline parent survey.
27

Figure 4: How often Parent talks to Child about Schoolwork - Control Group
0.1
.2.3
.4.5
Frac
tion
Never
Once o
r twice
last
month
About
once
a wee
k
2-3 tim
es a
week o
r more
Every
day
How often parents talk w/ their child about school
This figure shows the frequency of parents talking to their child about schoolwork for the control group. Results are fromendline parent survey.
28

Figure 5: How often Parent talks to another Adult about Schoolwork - Control Group
0.1
.2.3
.4.5
Frac
tion
0Nev
er
Once o
r twice
last
month
About
once
a wee
k
2-3 tim
es a
week o
r more
How often parent talks other adult about child's school
This figure shows the frequency of parents talking to another adult about schoolwork for the control group. Results arefrom endline parent survey.
29

Figure 6: Parent Beliefs about Missed Assignments
0.1
.2.3
.4.5
.6Fr
actio
n
None
Betwee
n 1 an
d 5
Betwee
n 6 an
d 10
More th
an 10
Parents' Beliefs on Missed Assignments
This figure shows the fraction of parents in the control group who believe their child missed zero, between one to five,between six and ten, or more than ten assignments in the last semester. Results are from endline parent survey.
30
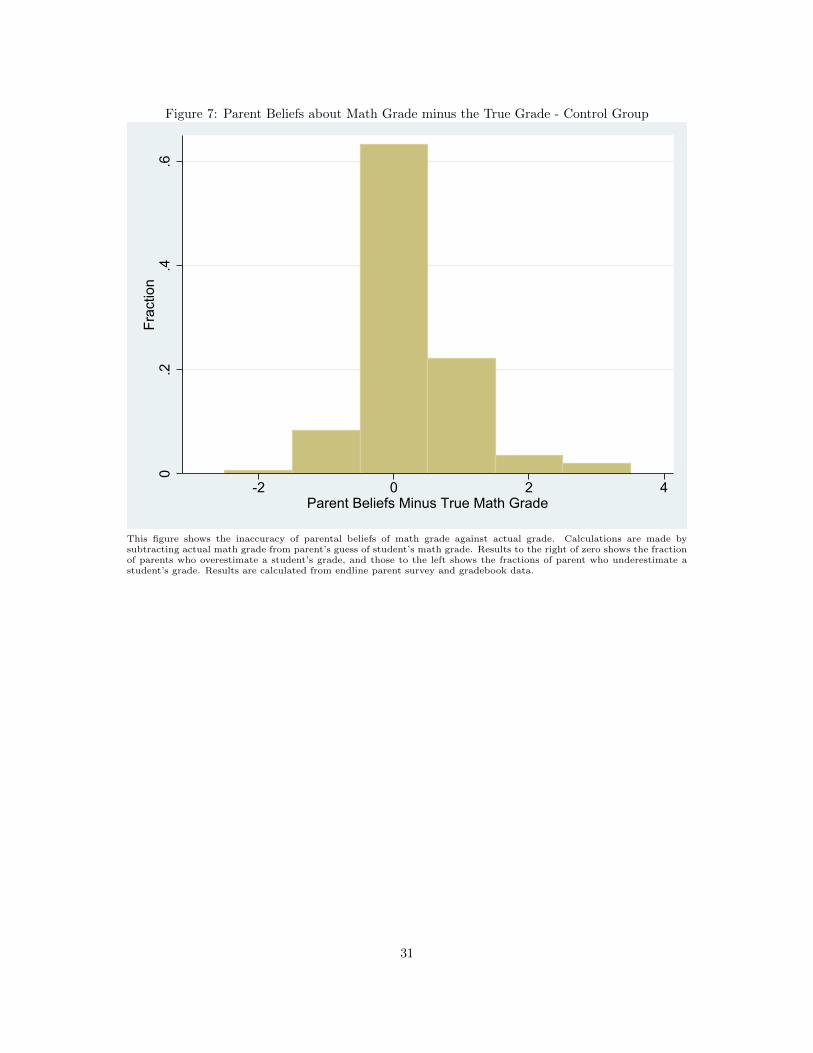
Figure 7: Parent Beliefs about Math Grade minus the True Grade - Control Group
0.2
.4.6
Frac
tion
-2 0 2 4Parent Beliefs Minus True Math Grade
This figure shows the inaccuracy of parental beliefs of math grade against actual grade. Calculations are made bysubtracting actual math grade from parent’s guess of student’s math grade. Results to the right of zero shows the fractionof parents who overestimate a student’s grade, and those to the left shows the fractions of parent who underestimate astudent’s grade. Results are calculated from endline parent survey and gradebook data.
31

VIII Tables
Table 1: Summary Statistics and Treatment-Control Group Balance
Variable Control Mean Treatment-Control Difference P-Value Observations
Female 0.49 -0.01 0.67 1,137Black 0.16 0.04 0.37 1,137ELL 0.02 0.00 0.78 1,137IEP 0.14 0.01 0.73 1,137Baseline Math 0.01 0.05 0.53 1,137Baseline Reading 0.00 0.02 0.81 1,137Suspended Last Year 0.11 0.03 0.06 1,137Baseline Parent Logins 15.07 -0.64 0.84 1,137Baseline Student Logins 93.38 -3.98 0.49 1,137Baseline GPA 2.79 0.01 0.72 1,137Percent of Days Missed 0.06 0.01 0.16 1,137Parents in the Household 1.76 -0.03 0.34 1,137
This table shows the balance on covariates between randomized treatment and control groups. P-values are for tests of equalityof means across the treatment and control group. Standard errors clustered by student. All regressions include strata indicators.
Table 2: Administrative Data on Alerts
Alerted Alerts Assignment Absence Low Grade
Treated 0.71*** 48.92*** 21.61*** 20.81*** 6.46***(0.02) (3.11) (1.19) (2.04) (0.40 )
Control Mean 0.02 0.37 0.06 0.01 0.06
Observations 1,137 1,137 1,137 1,137 1,137
This table shows the likelihood and amount of times parents are alerted due to being randomized intotreatment. While control parents can choose to receive alerts, only a small percentages chooses todo so. Alerted is an indicator for ever alerted. Alerts is the number of alerts received. Assignment,Absence, and Low Grade are the number of alerts received by parents by alert type. All regressionsinclude strata indicators and a set of demographic covariates. Standard errors clustered at the grade-school level. Outcome variables are from gradebook and administrative data. *** p<0.01, ** p<0.05,* p<0.10.
32

Table 3: School to Parent Contact about Child’s Academic Progress
≥ 1x / month 2x / month. 1x / month 1x / 2-3 month < 1x / 3 month
Alerted 0.18*** 0.11* 0.07 -0.03 -0.15**(0.07) (0.06) (0.05) (0.03) (0.06)
Control Mean 0.38 0.25 0.13 0.16 0.45
Observations 424 424 424 424 424
This table shows the results for how often schools contacted parents in the last few months. Results are estimated using2SLS regressions with the instrumented alerted variable, an indicator for parents who received at least one text. Allregressions include strata indicators and a set of demographic covariates. Standard errors clustered at the grade-schoollevel. The outcome variables are from endline parent surveys. *** p<0.01, ** p<0.05, * p<0.10
Table 4: Primary Academic Outcomes
Classes Failed Classes Attended Retained Math Score Reading Score
Alerted -0.38*** 48.46** -0.02** -0.01 -0.08(0.14) (23.08) (0.01) (0.06) (0.05)
Control Mean 0.97 277.70 0.03 0.00 0.00
Observations 1,113 1,137 1,137 927 925
This table shows treatment effects on primary academic outcomes of interest. Treatment effects are estimated using2SLS regressions with the instrumented alerted variable, an indicator for parents who received at least one text. Allregressions include strata indicators and a set of demographic covariates. Standard errors clustered at the grade-schoollevel. Outcome variables are from gradebook and administrative data. Classes failed are total failed courses duringmarking periods after treatment started. Classes attended is the numerical total of classes marked as present aftertreatment started. Retention is proxied by missing GPA, and a negative coefficient is equivalent to more studentsretained. Math and Reading scores are standardized testing results. *** p<0.01, ** p<0.05, * p<0.10
Table 5: Student Grades
F D C B A
Alerted -0.38*** 0.10 0.29** -0.17 0.25(0.14) (0.10) (0.12) (0.12) (0.26)
Control Mean 0.97 0.84 1.32 1.79 3.33
Observations 1,113 1,113 1,113 1,113 1,113
This table shows treatment effects on the prevalence of specific student gradesat the of marking periods. Effects are estimated using 2SLS regressions with theinstrumented alerted variable, an indicator for parents who received at least onetext. All regressions include strata indicators and a set of demographic covariates.Standard errors clustered at the grade-school level. *** p<0.01, ** p<0.05, *p<0.10.
33

Table 6: Other Academic Outcomes and Behaviors
GPA Ever Suspended Assignments Student Logins
Alerted 0.10* -0.01 28.30 4.81(0.06) (0.02) (25.07) (10.58)
Control Mean 2.610 0.230 518.0 209.8
Observations 1,137 967 1,137 1,137
This table shows treatment effects on non-primary outcomes of interest. Effects are estimatedusing 2SLS regressions with the instrumented alerted variable, an indicator for parents whoreceived at least one text. All regressions include strata indicators and a set of demographiccovariates. Standard errors clustered at the grade-school level. Outcome variables are calcu-lated from gradebook and administrative data. Assignments are numerical total assignmentsturned in by student after treatment start. *** p<0.01, ** p<0.05, * p<0.10
Table 7: Parent Beliefs about Missed Assignments
None 1-5 6-10 >10 Don’t Know
Alerted -0.15*** 0.07 0.09** 0.02 -0.01(0.06) (0.05) (0.04) (0.02) (0.02)
Control Mean 0.530 0.310 0.060 0.070 0.030
Observations 403 403 403 403 403
This table shows treatment effects on parent beliefs about missed assignments. Ef-fects are estimated using 2SLS regressions with the instrumented alerted variable, anindicator for parents who received at least one text. All regressions include strataindicators and a set of demographic covariates. Standard errors clustered at thegrade-school level. Outcome variables here is based on survey results asking parentsto guess the number of missed assignments by students during the last semester. ***p<0.01, ** p<0.05, * p<0.10
34

Table 8: Parents’ Behavioral Responses
Panel A. Contacted the School Talked w/ Child Parent Logins
Alerted 0.17*** 0.07 7.07(0.06) (0.06) (6.40)
Control Mean 0.33 0.74 30.1
Observations 443 438 1,137
Panel B. Took Privileges Grade Inaccuracy Continue Texts
Alerted 0.08 -0.19* 0.04**(0.05) (0.10) (0.02)
Control Mean 0.320 0.500 0.940
Observations 401 307 433
This table shows treatment effects on parents’ behavioral responses. Effects are estimatedusing 2SLS regressions with the instrumented alerted variable, an indicator for parents whoreceived at least one text. All regressions include strata indicators and a set of demographiccovariates. Standard errors clustered at the grade-school level. Outcome variables here arebased on survey results and gradebook data. Panel A shows results for an indicator for whetherparents contacted the school, an indicator of whether parents talked to their child about schoolabout schoolwork or grades, and total parent logins into the parent gradebook portal. Panel Bshows the results for parents taking privileges away from student in the last month of school,the difference between actual and parent estimated math grade, and an indicator for parents’desire to being or continue a texting service to inform them on academic progress. *** p<0.01,** p<0.05, * p<0.10
35

Appendix A
Figure A.8: Parent Beliefs about Missed Assignments versus True Missed Assignments0
.1.2
.3.4
.5.6
.7Fr
actio
n
0 1 2 3Parents' Beliefs about Missed Assignments v. Truth
Treatment Control
This figure shows the treatment-control comparisons of parental belief of number of missed assignments versus actualnumber of missed assignments. The calculations are absolute values of the inaccuracy by categorical bins in which parentsestimate their child’s missed assignments - zero (0), one to five (1), six to ten (2), and more than ten (3). For example, ifa parent estimated that their child missed six to ten assignments, but they actually missed more than ten, they would beoff by a category of one.
36

Figure A.9: Parent Beliefs about Math Grade versus True Grade
0.1
.2.3
.4.5
.6.7
Frac
tion
0 1 2 3Parents' Beliefs about Math Grade v. Truth
Treatment Control
This figure shows the treatment-control comparisons of parental belief of their child’s math grade compared to their actualgrade. The calculations are absolute values of the inaccuracy by math grade GPA, based on a 4.0 scale. For example, ifa child received a B, but their parent believed they received an A, the parent would be off by an absolute value of one.
37

Table A.1: Measures of Attrition
Miss Survey Miss Suspension Miss Math Miss Reading
Treatment -0.016 -0.000 0.008 0.010(0.029) (0.010) (0.015) (0.015)
Percent of Days Missed -0.560** 0.294 0.770** 0.830**(0.26) (0.200) (0.320) (0.330)
Baseline GPA 0.016 -0.003 0.008 0.015(0.022) (0.014) (0.016) (0.016)
Black 0.024 -0.007 -0.022 -0.019(0.030) (0.015) (0.014) (0.015)
IEP -0.064 -0.008 0.040 0.042*(0.040) (0.022) (0.017) (0.023)
Female -0.014 -0.010 -0.011 -0.008(0.029) (0.009) (0.014) (0.015)
Baseline Math Score 0.034 0.004 0.026** 0.020*(0.025) (0.004) (0.011) (0.011)
Baseline Reading Score 0.012 0.004 -0.024* -0.021*(0.028) (0.006) (0.012) (0.011)
Observations 1,137 1,137 1,137 1,137
This table shows the correlates of several indicators of attrition and non response: survey non-response, missingendline GPA and missing endline test scores. Standard errors clustered by student. All regressions include strataindicators. *** p<0.01, ** p<0.05, * p<0.10
38

Table A.2: Correlates of Communication
Contact < 1 X/3 mo. Talk to Another Adult Difference from Truth Child Discloses
Fraction Absent -0.285 0.370 0.300 0.135(0.334) (0.295) (0.980) (0.364)
Ever Suspended 0.122 -0.076 -0.055 -0.039(0.078) (0.073) (0.133) (0.076)
GPA 0.025 0.007 -0.168*** -0.178***(0.026) (0.025) (0.062) (0.024)
Black 0.025 -0.049 -0.014 -0.069(0.065) (0.059) (0.088) (0.060)
IEP -0.006 0.012 0.226 0.044(0.078) (0.072) (0.146) (0.076)
Female 0.035 -0.078* 0.104 -0.048(0.051) (0.045) (0.080) (0.048)
Two Parents -0.031 0.183*** 0.044 -0.077(0.057) (0.055) (0.092) (0.052)
Parent Female 0.061 -0.008 -0.014 -0.002(0.054) (0.048) (0.091) (0.050)
High School -0.053 -0.037 0.117 -0.139***(0.050) (0.044) (0.085) (0.046)
Control Mean 0.457 0.685 0.500 0.478
Observations 423 439 307 439
This table shows the correlates of several indicators of parental and student communication behavior. Standard errors clustered bystudent. All regressions include strata indicators. *** p<0.01, ** p<0.05, * p<0.10
39

Table A.3: Primary Academic Outcomes: Subgroups
Panel A. Below Average GPA
Classes Failed GPA Classes Attended Retained Math Score Reading Score
Alerted -0.88*** 0.25*** 64.63*** -0.05*** 0.04 0.00(0.27 ) (0.10 ) (26.94 ) (0.02 ) (0.09) (0.08 )
Observations 550 566 566 566 445 444
Panel B. High School
Classes Failed GPA Classes Attended Retained Math Score Reading Score
Alerted -0.68*** 0.25*** 42.95* -0.04** 0.00 -0.07(0.22) (0.10) (29.88) (0.02) (0.08) (0.07)
Observations 581 566 597 597 419 417
Panel C. Middle School
Classes Failed GPA Classes Attended Retained Math Score Reading Score
Alerted -0.06 -0.08 51.32* 0.01 -0.02 -0.08(0.15) (0.09) (34.02) (0.01) (0.09) (0.08)
Observations 532 540 540 540 508 508
Panel D. Mothers Texted
Classes Failed GPA Classes Attended Retained Math Score Reading Score
Alerted -0.34** 0.25*** 30.02* -0.02* -0.01 0.10*(0.16) (0.10) (20.55) (0.02) (0.07) (0.07)
Observations 423 566 431 431 345 346
Panel E. Fathers Texted
Classes Failed GPA Classes Attended Retained Math Score Reading Score
Alerted -0.51** 0.25*** 41.22* 0.01 0.10 -0.08(0.23) (0.10) (29.10) (0.02) (0.09) (0.09)
Observations 319 566 324 324 266 266
This table shows the results by subgroups of interest as indicated on our pre-analysis plan. Treatment effects are estimatedusing 2SLS regressions with the instrumented alerted variable, an indicator for parents who received at least one text. Allregression include strata indicators and a set of demographic covariates. Standard errors clustered at the grade-school level.All regressions include strata indicators. Outcome variables are from gradebook and administrative data. *** p<0.01, **p<0.05, * p<0.10
40

Appendix B
Table B.1: Secondary outcomes and their sources
Outcome Source
Number of alerts sent Administrative DataNumber of parent logins Administrative DataNumber of student logins Administrative DataEver suspended Administrative DataGPA Administrative DataTotal number of missed assignments Administrative DataTeacher logins Administrative DataWho monitors child Survey Q2Who is in charge of child’s discipline Survey Q15School-to-parent contact Survey Q3Parent-to-school contact Survey Q6School helps parent Survey Q4Child discloses information Survey Q5Accuracy of grade beliefs Survey Q9 & Admin DataAccuracy of missed assignment beliefs Survey Q16 & Admin DataAccuracy of relative grade beliefs Survey Q10 & Admin DataAccuracy of absence beliefs Survey Q11 & Admin DataParent talks to child about schoolwork Survey Q12Parent takes privileges from child over schoolwork Survey Q14Discuss child’s grades with another adult in the household Survey Q13Desire to continue intervention Survey Q19
41

Table B.2: Secondary outcomes and their construction
Outcome Construction
Number of alerts sent Total alerts sent post intervention startNumber of parent logins Total parent logins post intervention startNumber of student logins Total student logins post intervention startEver suspended Indicator for a suspension of any length occurring
post intervention startGPA Average of 2nd semester grades using a 4-point scale
imputing zeros for missing.Total number of missed assignments Total number of assignments missed in the 2nd
semesterTeacher logins Total teacher logins post intervention startSchool-to-parent contact Indicator for once per month or greaterParent-to-school contact Indicator for above median contactSchool helps parent Indicator for agree/disagreeChild discloses information Indicator for agree/disagreeAccuracy of grade beliefs Survey Q9 minus grade from last report card and
indicator for “I don’t know”Accuracy of missed assignment beliefs Survey Q16 minus number from 2nd semester data
and indicator for “I don’t know”Accuracy of relative grade beliefs Indicator for Survey Q10 matches whether child has
above-median letter grade within grade level and in-dicator for “I don’t know”
Accuracy of absence beliefs Survey Q11 - 2nd semester total full-day absencesand indicator for “I don’t know”
Parent talks to child about schoolwork Indicator for 2-3 times per week and above.Parent takes privileges from child overschoolwork
Indicator for true or not
Discuss child’s grades with anotheradult in the household
Indicator for true or not
Desire to continue intervention Indicator for true or not
42

Appendix C
Figure A.10: Endline Survey Letter
This is page 1 of 4 of the endline survey letter sent to participant parents afterthe end of the treatment school year.
43

Figure A.11: Endline Survey Letter
This is page 2 of 4 of the endline survey letter sent to participant parents afterthe end of the treatment school year.
44

Figure A.12: Endline Survey Letter
This is page 3 of 4 of the endline survey letter sent to participant parents afterthe end of the treatment school year.
45

Figure A.13: Endline Survey Letter
This is page 4 of 4 of the endline survey letter sent to participant parents afterthe end of the treatment school year.
46