Embed Size (px)
Citation preview

Leveraging the Power of GIS Technology for Project Management
Pole Replacement Tracking Tool
11/12/15
Scott Hafner – Xcel Energy, strategic resource
planner
Sean Walker - Xcel Energy, field operations
manager
Dan Haglund – Ulteig, GIS analyst
Presenters
Background
Pole replacement program evolution and challenges
The GIS solution
Demonstration
The results
Questions
Overview

Investor owned utility operating in 8 States
NSPM – MN, ND & SD
NSPW – WI & MI
PSCo – CO
SPS – TX & NM
3.5 million electric customers
2.0 million gas customers
12,469 employees
Xcel Energy Corporate Overview
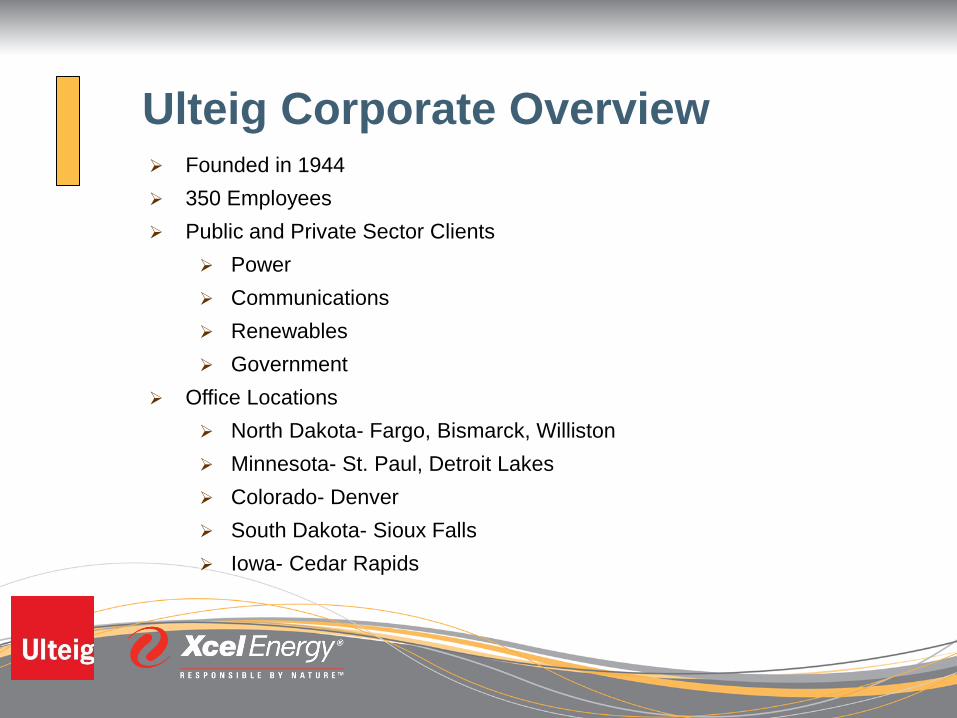
Founded in 1944
350 Employees
Public and Private Sector Clients
Power
Communications
Renewables
Government
Office Locations
North Dakota- Fargo, Bismarck, Williston
Minnesota- St. Paul, Detroit Lakes
Colorado- Denver
South Dakota- Sioux Falls
Iowa- Cedar Rapids
Ulteig Corporate Overview

Background
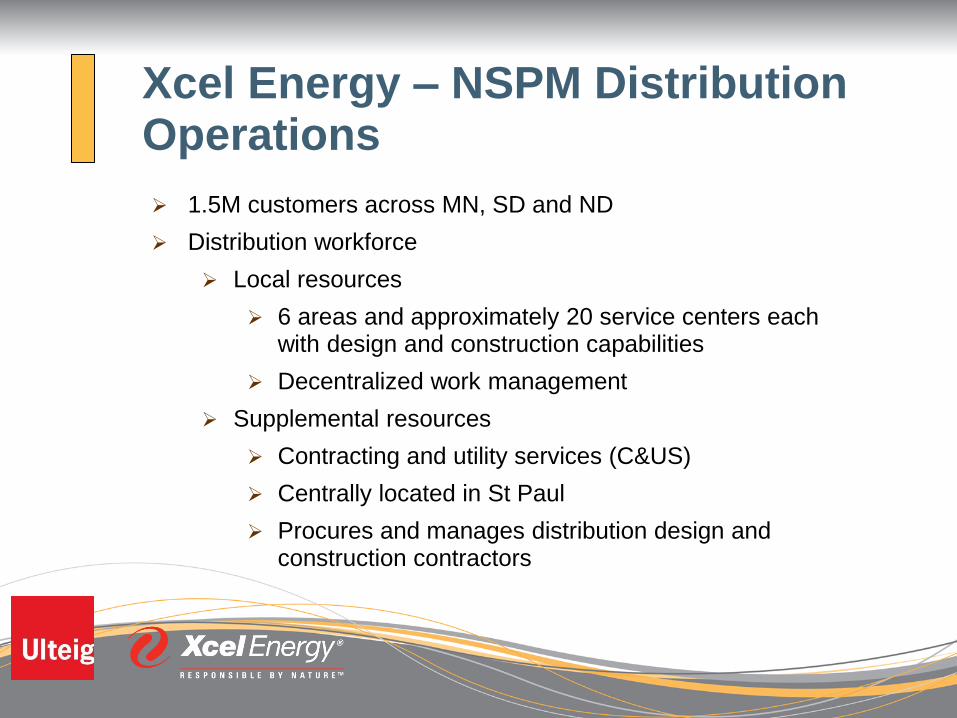
1.5M customers across MN, SD and ND
Distribution workforce
Local resources
6 areas and approximately 20 service centers each with design and construction capabilities
Decentralized work management
Supplemental resources
Contracting and utility services (C&US)
Centrally located in St Paul
Procures and manages distribution design and construction contractors
Xcel Energy – NSPM Distribution Operations
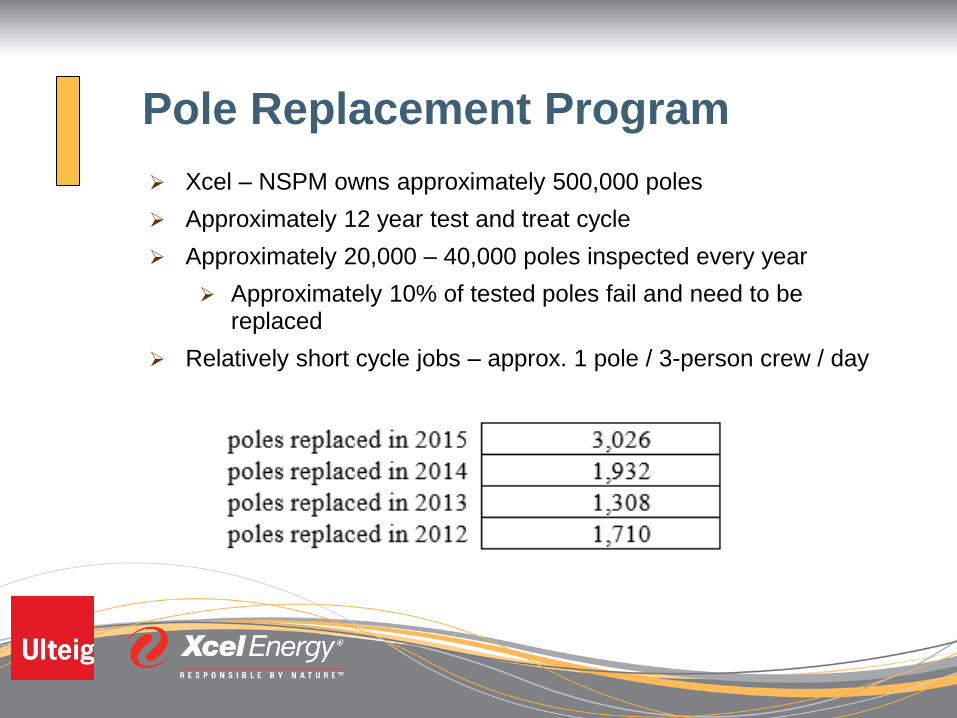
Xcel – NSPM owns approximately 500,000 poles
Approximately 12 year test and treat cycle
Approximately 20,000 – 40,000 poles inspected every year
Approximately 10% of tested poles fail and need to be replaced
Relatively short cycle jobs – approx. 1 pole / 3-person crew / day
Pole Replacement Program
Areas are identified for testing by area engineers
The pole inspection and treatment program is managed across all OpCo’s by the vegetation management group
Vegetation management distributes the final test results (the “pole workload”) to the approx. 12+ area engineers
Local areas responsible for design and construction
Track workload and progress themselves
Spreadsheets managed by design, engineering, supervisors, or some other method as determined by the area.
C&US responsible for forecasting and overall progress tracking
Process Prior to 2014
Pole workload varies greatly from year to year and by area
Difficult to design and/or construction to react
Difficult to maintain consistent practices
Difficult to understand progress replacing poles across NSPM
Often the decision to bring in contractors was made late in the year and greatly increased the CPU
Impossible to develop comprehensive pole by pole view
Areas reported monthly progress as gross counts
Which poles were replaced?
Budget and forecasting
Design challenges
Difficult to group poles geographically
Design and construction made separate trips to the pole
Challenges
Management decided to have C&US centrally manage the replacement program
C&US to design the pole replacements
C&US to manage contractors replacing the poles
Local areas have the option to complete some of this work
The “default switch position” is C&US replacing the poles
C&US implemented a new pricing structure – bid units
We needed pole replacement tracking system!
Process Change

GIS Solution
Centralized GIS database with web and mobile access
Real time data
Intuitive
Collaborative Environment
Cost effective
More powerful than using KML/KMZ files
The Solution
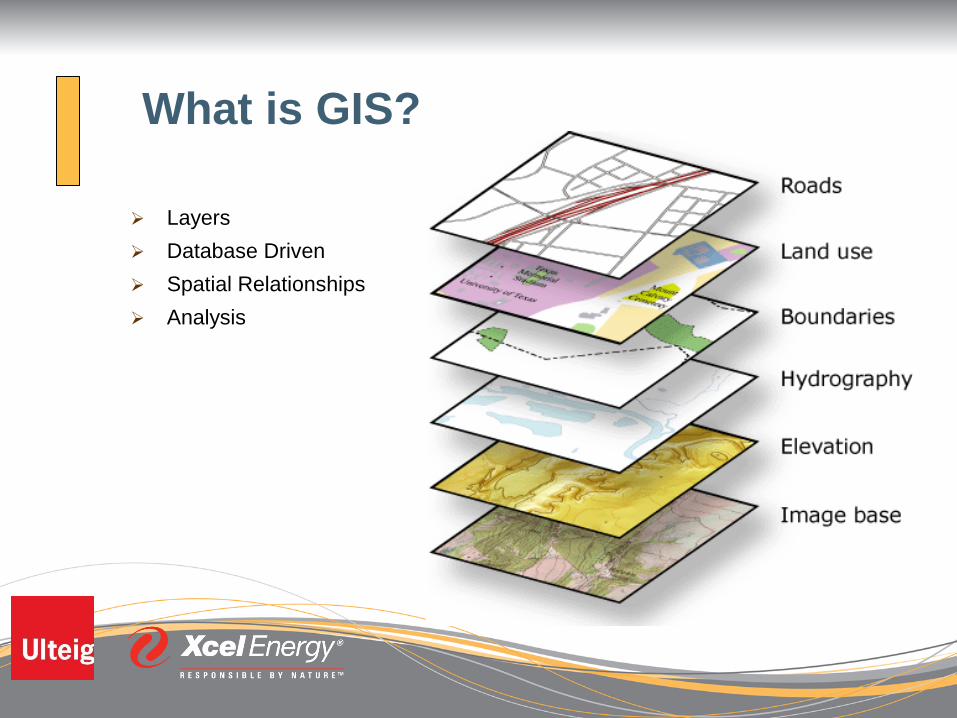
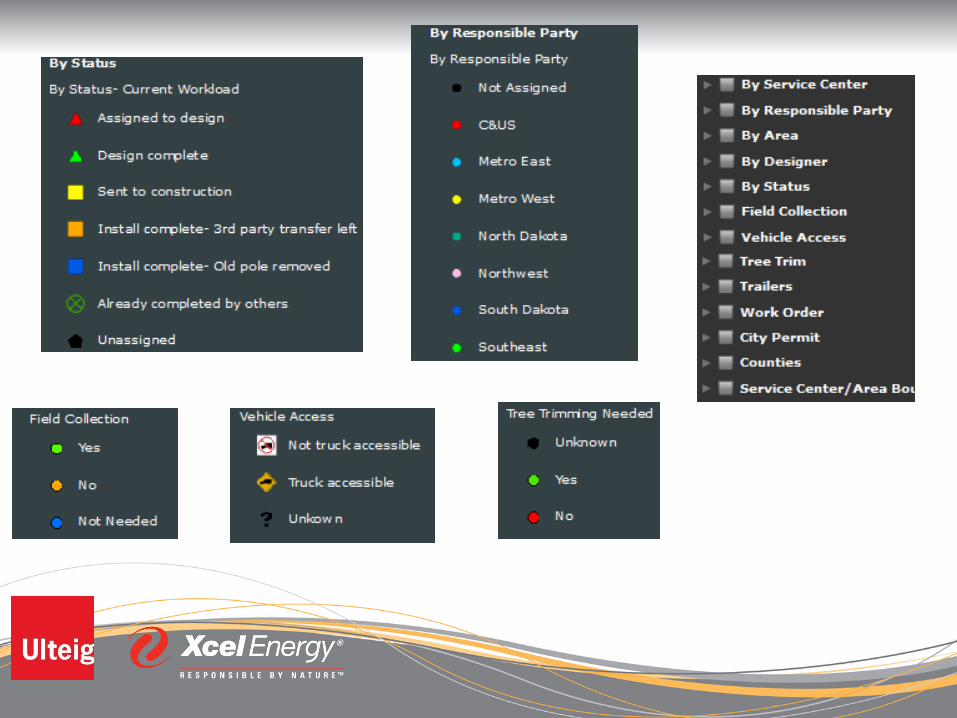
Layers
Database Driven
Spatial Relationships
Analysis
What is GIS?
16
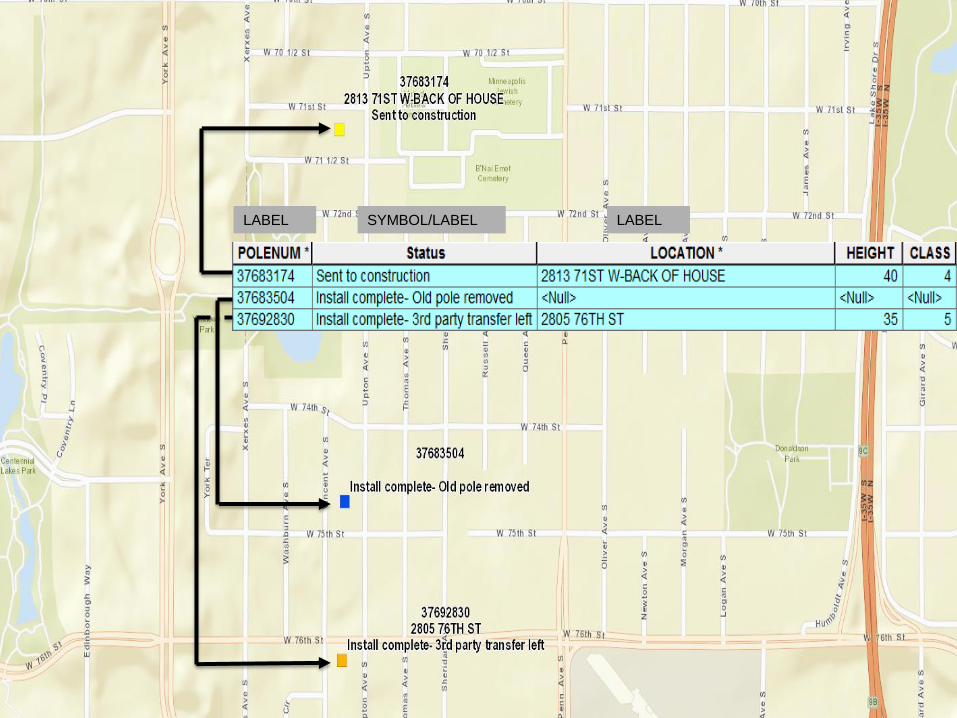
LABEL LABEL SYMBOL/LABEL
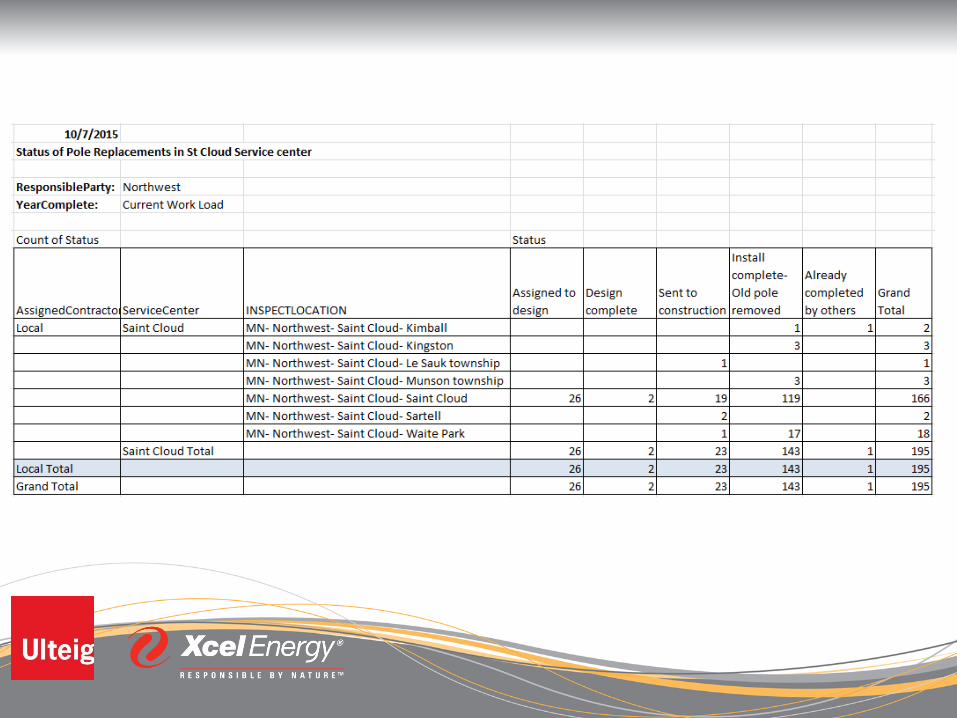
Web Map
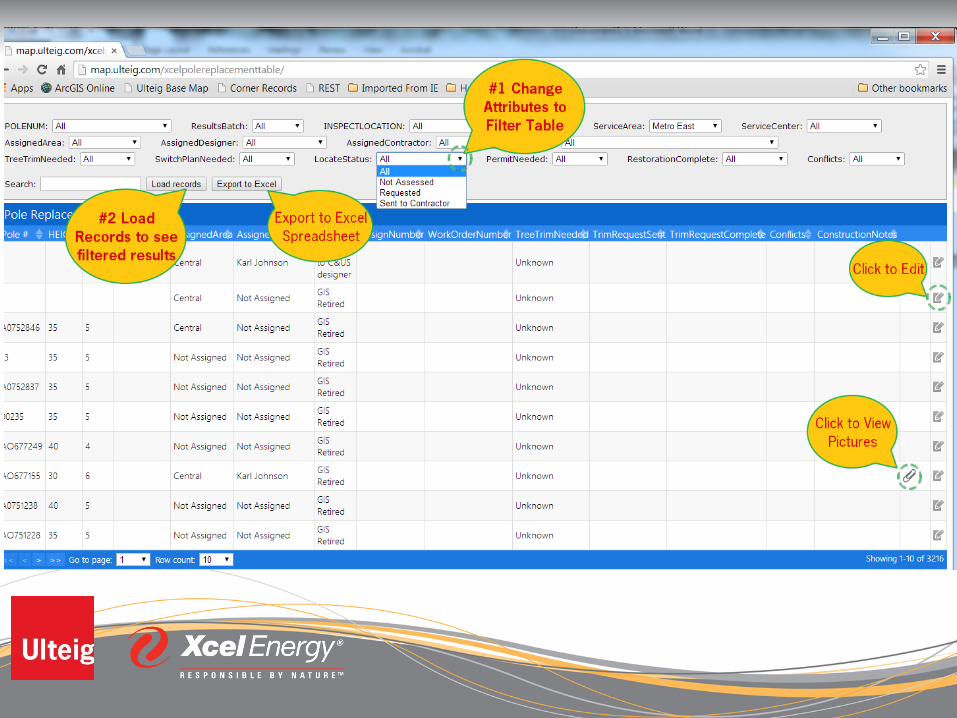
Web Table
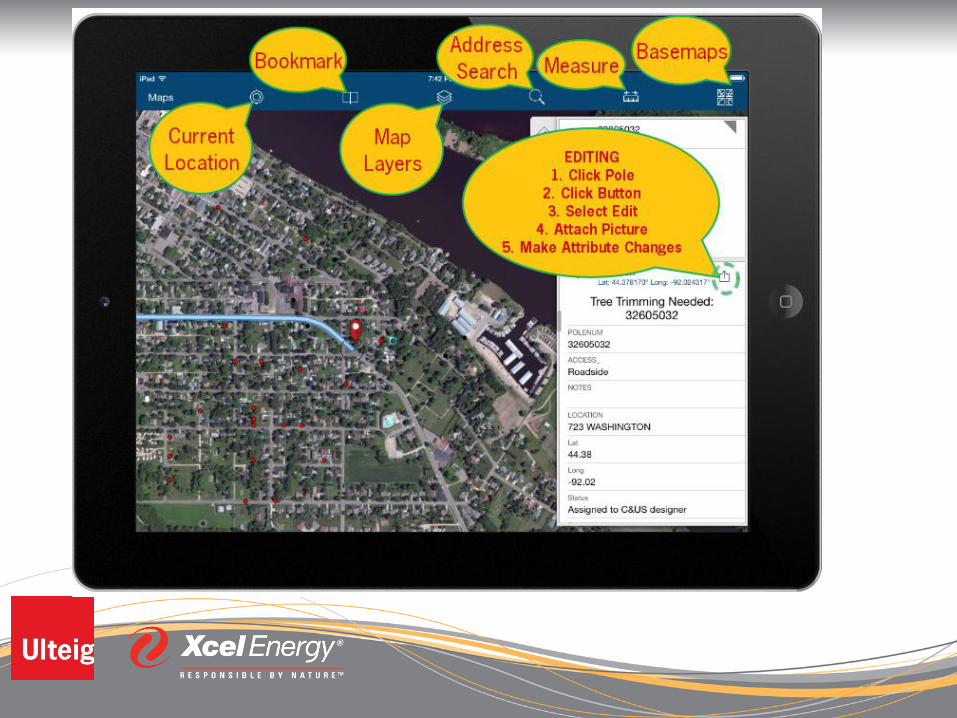
Mobile Mapping Application
End user access
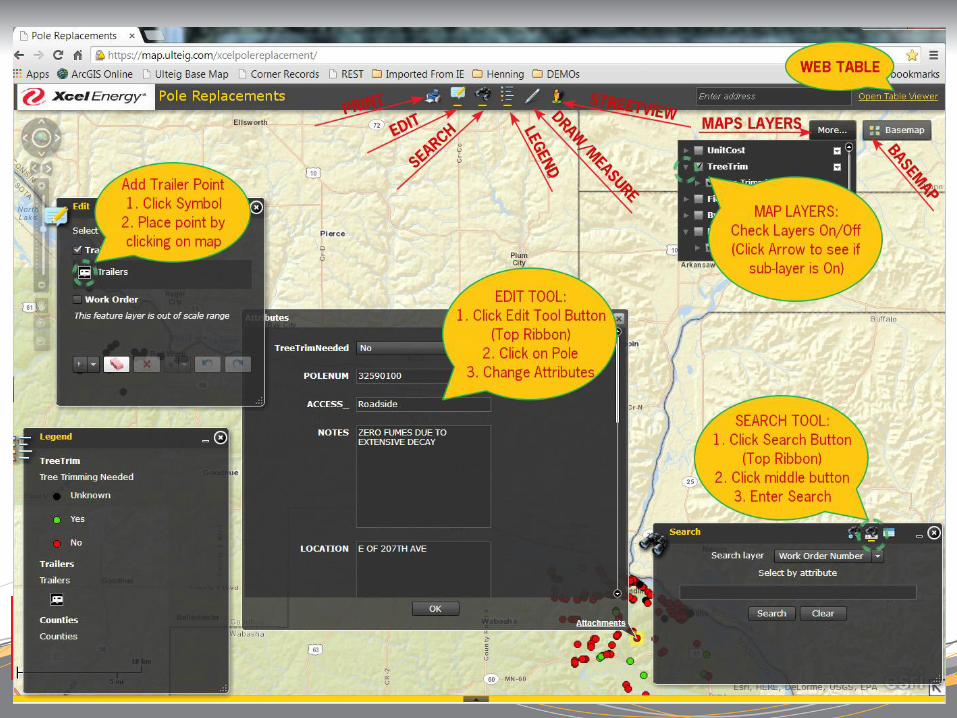
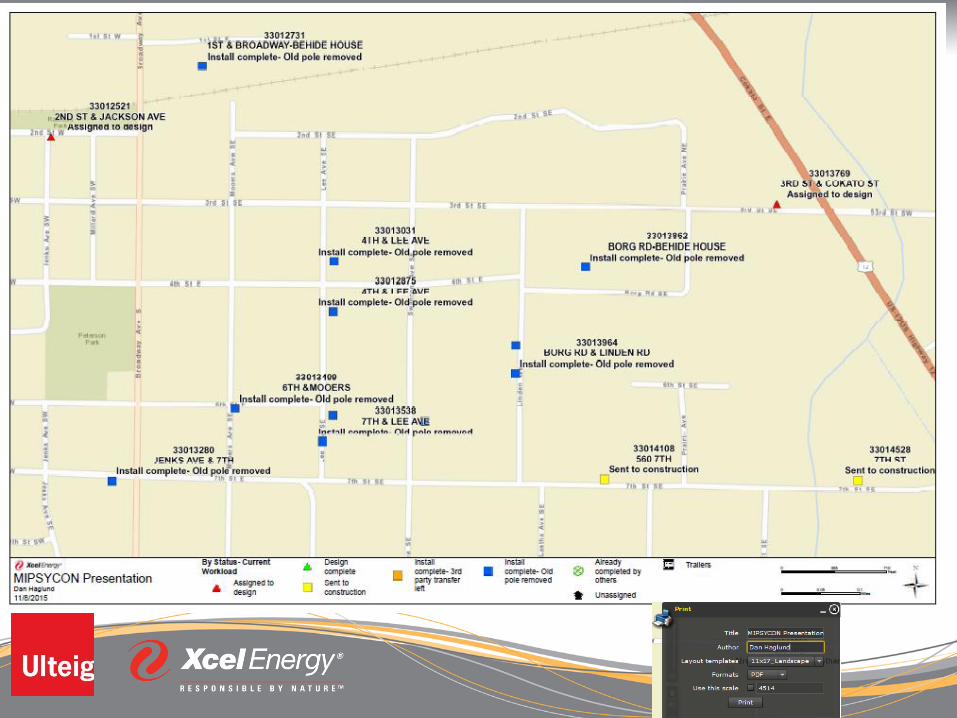
Example:
Demonstration
Overview Process follows the same testing process
Test results sent only to C&US and then uploaded into the system
Then work is distributed across work groups
Records tracked at individual pole level
Local area use the system
Provided training and support
The Process Started in 2014
Contractor Perspective Contractors adapted to the system very quickly
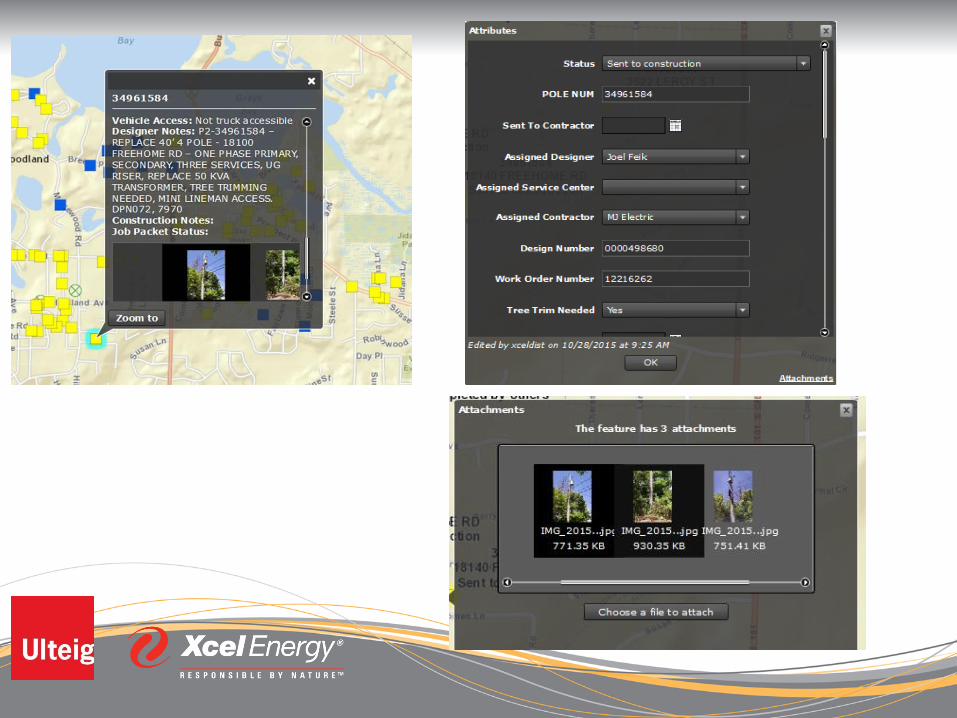
Contractors visit all poles and…
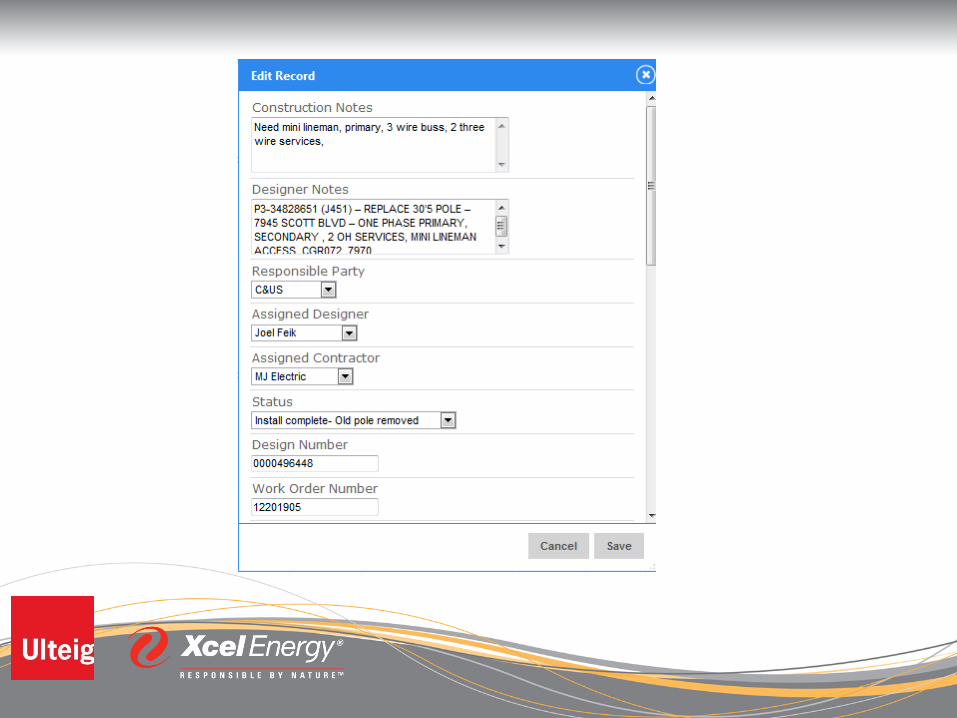
Collect info for design
Upload pictures
Identify need for…
Tree trimming
Switching
Special equipment, etc.
See all poles on a map view to identify laydown yards
Contractors update the tracker on a pole by pole basis
The Process Started in 2014
Design Perspective Designers can easily design from the office using information
collected by contractors
increased productivity and consistency
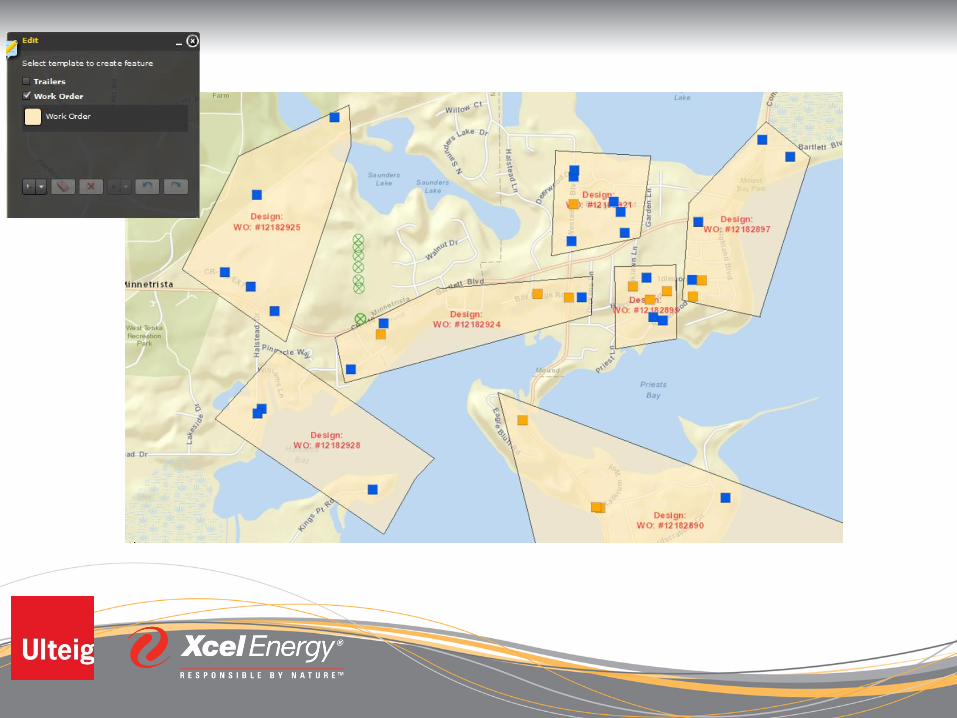
Design progress and assignments can be tracked and revised
Allows designers to manage their workload
Poles can be grouped geographically on work orders
Geographically grouped poles is one of the keys to our bid units contracts
We have seen an approximately 28% CPU decrease comparing poles replaced in 2013 vs 2015 YTD
The Process Started in 2014
C&US Back Office Perspective Easily and accurately…
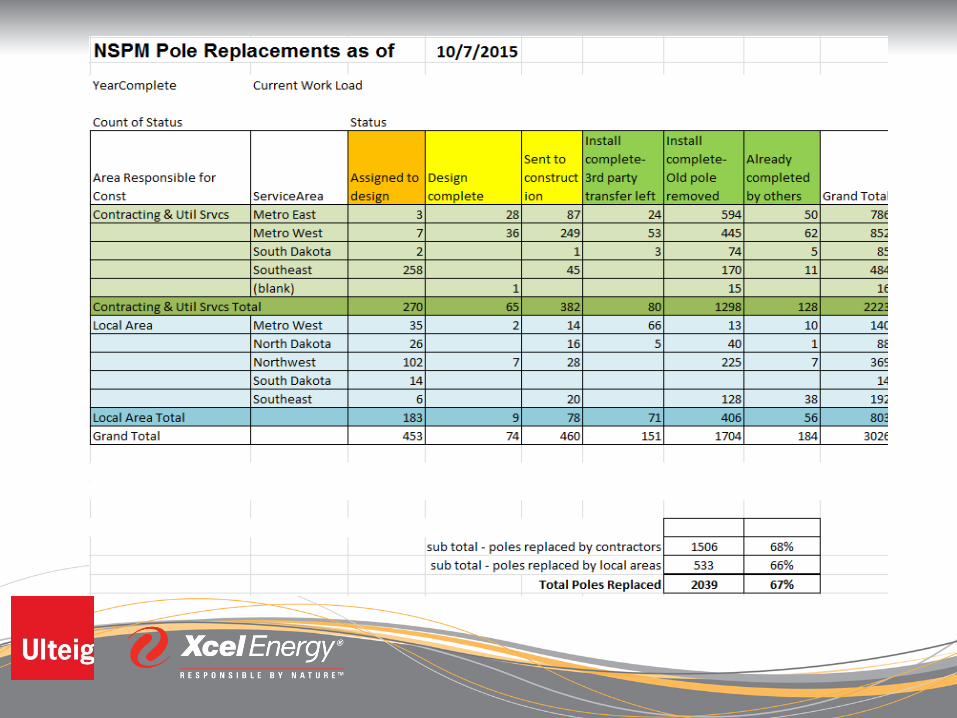
Report on design productivity and progress
Report on construction progress
Including local area progress
Allows for more accurate forecasting
Manage workload between contractors and local areas
Keep track of poles requiring 3rd party transfers
The Process Started in 2014

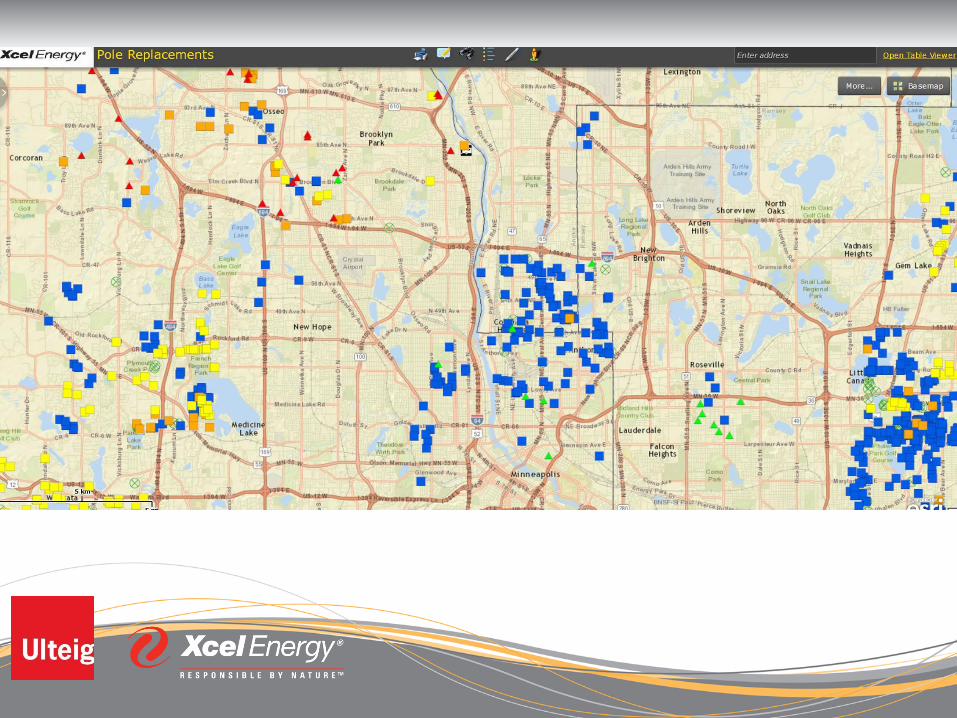
Results & Analysis
Clear map of all poles with status
Easy for multiple work groups to utilize simultaneously
Provides users two ways to access the same data
Table viewer or GIS Map Viewer
Can be accessed with PC, smart phone or tablet
Searchable
Easily generates reporting
Reduced CPU
Is an additional tool for WO closing
Provides back office another view of what happened in the field
Pros
Stand alone system
Not tied in to our GIS system
Not tied into our system of record (PassPort)
Not tied into scheduling or dispatch systems
Cons
Other operating companies
Incorporate the testing process
Identification of test areas and poles
Test crews collect pictures
Improved turn around
Tracking interactions with vegetation management
Tracking other segments of work
Tap level cable replacement
Joint trench projects
Storm restoration rosters and crew tracking
Etc..
Additional Opportunities

Scott Hafner- Xcel Energy
[email protected] 651-229-5537
Sean Walker- Xcel Energy-
[email protected] 651-229-2360
Dan Haglund- Ulteig-
[email protected] 651-415-3843
Contact Information

Questions?