Embed Size (px)
DESCRIPTION
lg ratio
Citation preview
Financial Accounting
LG ElectronicsXZZV11D
Table Of Content
1
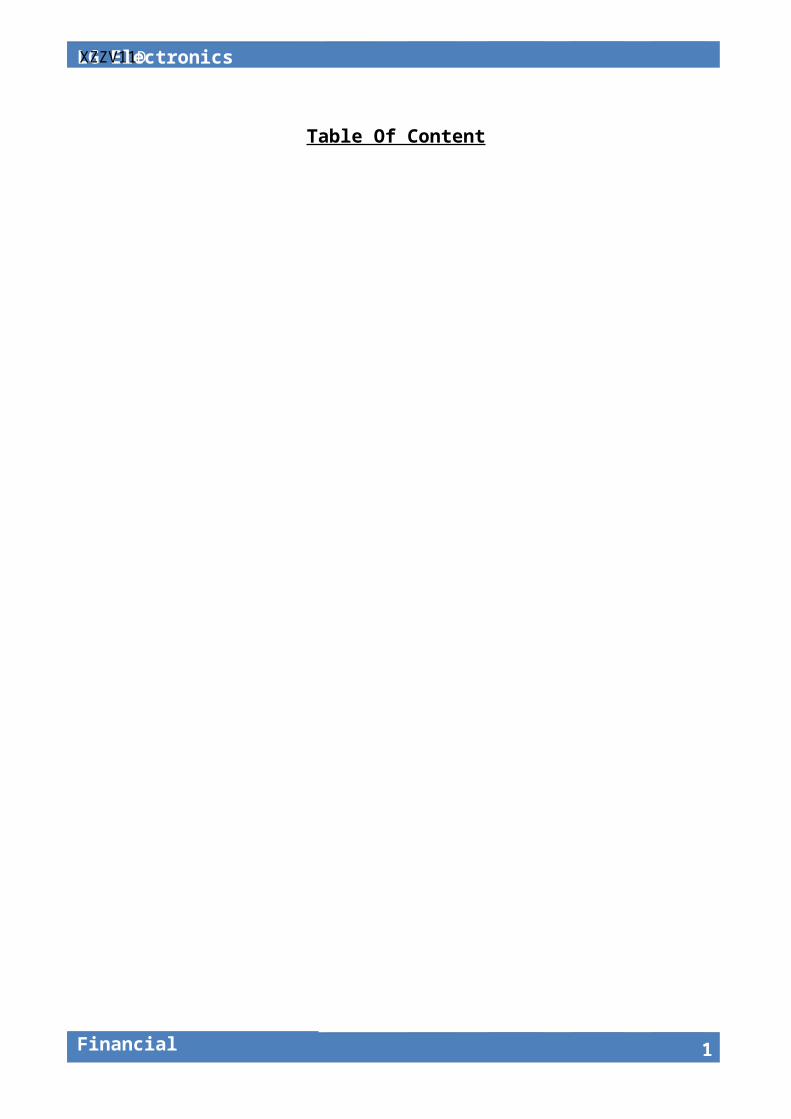
Sr. No. Index Page No.
1. Acknowledgement 2
2. Executive Summary 3
3. Industry Overview 4
4. Company Overview 5
5. Liquidity Ratios 6
6. Turnover Ratios 9
7. Solvency Ratios 13
8. Profit Ratios 16
9. ROI Ratios 19
8. Conclusion 26
10. Bibliography 27
11. Annexure 28
LG Electronics
Financial Accounting
Acknowledgement
I take this opportunity to express my profound gratitude and deep regards to my guide
Mrs.Meghna Dangi for her exemplary guidance, monitoring and constant encouragement
throughout the project.
I am obliged to my batch mates for the valuable information provided by them in their respective
fields. I am grateful for their cooperation during the period of my assignment.
2
Financial Accounting
LG ElectronicsXZZV33D
Executive Summary
LG Electronics’ brand recognition in the global consumer electronics market has increased
exponentially in the past two years. The company successfully achieved “Global Top 3” status in
almost every business area in the first quarter of this year. Much of this success can be attributed to
LG Electronics’ commitment to drive “Innovation” and “Globalization”.
LG Electronics is re-inventing its global procurement organization from highly decentralized to
center-led, establishing streamline procurement leadership across five business units (companies)
and eight regions. LGE’s procurement is currently comprised of 2,200 staff who are part of an
84,000-strong workforce in 115 operations globally, managing US$26 billion direct spend and
US$10 billion general spend, led by Tom Linton, Executive Vice President and Chief Procurement
Officer. The profitability of LG Electronics is heavily dependent on procurement’s performance
and efficiency since its spend represents 80 percent of revenues. LG Electronics procurement is re-
positioning the organization to a new level while maintaining its focus on high quality
manufacturing and becoming a global top brand.
3
LG Electronics
Financial Accounting
Industry Overview
The consumer electronics market is ever evolving with new products being made available on a
frequent basis. Also, the evolution of existing products serves to re-invent what is an already fully
functional product and gives the consumer the feeling that new technology is the new norm. For
example, televisions are entering a new era with the unveiling of the new ‘curved’ television
which gives the viewer a more ‘immersive experience’. This may re-invigorate what may be
considered a stagnating segment within the consumer electronics market and lead to an increase in
revenues.
Another interesting development within the market is the re-introduction of game consoles in
China. In 2000, the Chinese government placed a ban on the sale of foreign game consoles due to
their perception on the effect they have on the mental health of young people. The ban was finally
lifted in 2014, which means that retailers have the opportunity to enter a market, which was not
previously an option and will also have an overall positive effect on the consumer electronics
market as a whole.
Online retailing is also a major trend, which is becoming more prevalent within the industry.
Consumer electronics were traditionally purchased within electrical retailer showrooms so that the
consumer would have the opportunity to try the product before purchase. However, some retailers
have struggled to ‘close the deal’ with sites such as Amazon being able to offer the same product
at a significantly lower price. In recent years, traditional retailers have struggled with this threat of
competition and have led to them placing higher importance on their own online arm.
The global consumer electronics market had total revenues of $253.9bn in 2013, representing a
compound annual growth rate (CAGR) of 0.8% between 2009 and 2013.The Eastern European
markets showed particularly strong growth with CAGRs of 8.5% in comparison to Western
Europe which showed strong decline with compound annual rates of change (CARCs) of -7.8%
over the same period. The United States had the largest consumer electronic retail market in the
world with revenues of $90.5bn in 2013.
4
Financial Accounting
LG ElectronicsXZZV55D
Company Overview
LG is the brand that is Delightfully Smart. "Life's Good" slogan, and futuristic logo are a great
representation of what LG stand for.
Global, Tomorrow, Energy, Humanity and Technology are the pillars that this corporation is
founded on; with the capital letters L and G positioned inside a circle to center our ideals above all
else, humanity. The symbol mark stands for our resolve to establish a lasting relationship with, and
to achieve the highest satisfaction for our customers.
The letters "L" and "G" in a circle symbolize the world, future, youth, humanity, and technology.
Our philosophy is based on Humanity. Also, it represents LG's efforts to keep close relationships
with our customers around the world. The symbol mark consists of two elements: the LG logo in
LG Grey and the stylized image of a human face in the unique LG Red color. Red, the main color,
represents our friendliness, and also gives a strong impression of LG's commitment to deliver the
best. Therefore, the shape or the color of this symbol mark must never be changed.
LG logo is the fundamental visual expression used to identify LG. It expresses the quality and
sophistication that is the hallmark of our products. It is simple, modern and distinctive. Consistent
and proper usage of the logo is absolutely essential. The logo is symbolic of our steadfast
reputation for excellence; therefore, any variation of the logo diminishes the visual identity of LG
Electronics and its products.
LG have two versions of our logo: Corporate Logo and 3D Logo.
The updated 3D Logo retains the heritage and equity of the Corporate Logo, while aligning with
our new positioning. It was redrawn to strengthen the visual impact of our symbol mark and help
communicate our attributes.
5
LG Electronics
Financial Accounting
Ratio Analysis
Liquidity Ratios:
It is the ratio that measures a company’s ability to fulfill its short-term debt obligations or the
ability of a company to pay off its short-term liability, if and when they take a fall.
In case of Liquidity Ration, higher the ratio, higher is the margin of safety to pay off its current
liabilities and other short-term borrowings. Liquidity ration greater than 1, signposts its sound
financial health.
The liquidity ratios are an outcome of dividing cash and other liquid assets (current assets) by the
short-term borrowings (current liabilities). They show the number of times the short-term debt
obligations are covered by the cash and liquid assets. If the value is superior to 1, it means the
short-term obligations are abundantly covered.
The most common Liquidity Ratios are Current Ratio and Acid Test Ratio/Quick Ratio. Short-
term creditors, bankers, government agencies, Bankruptcy analysts and mortgage originators are
readily using the aforementioned ratios. Using these ratios they analyze and forecast the financial
wellbeing of a company and determine their stand accordingly.
6
Financial Accounting
LG ElectronicsXZZV77D
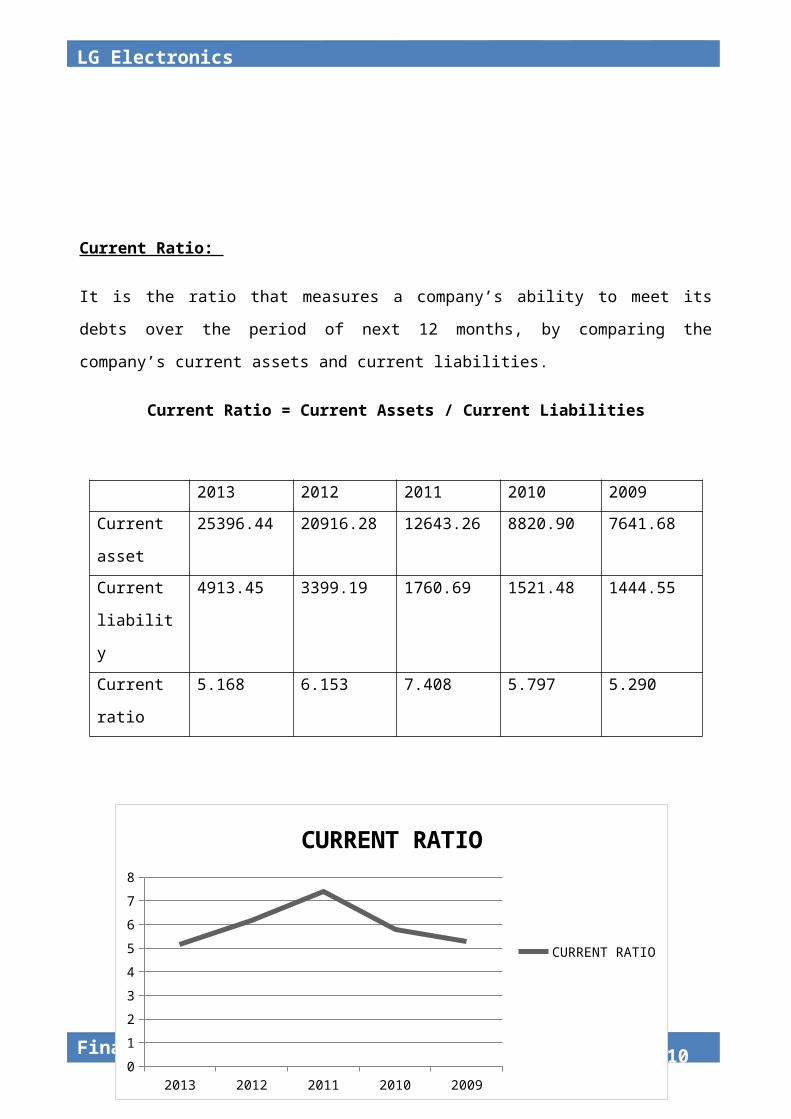
Current Ratio:
It is the ratio that measures a company’s ability to meet its debts over the period of next 12
months, by comparing the company’s current assets and current liabilities.
Current Ratio = Current Assets / Current Liabilities
2013 2012 2011 2010 2009
Current asset 25396.44 20916.28 12643.26 8820.90 7641.68
Current
liability
4913.45 3399.19 1760.69 1521.48 1444.55
Current ratio 5.168 6.153 7.408 5.797 5.290
Interpretation:
The current ratio shows the company’s ability to pay back its short term liabilities with is available
assets. Higher the ratio better is the safety level and payback condition of the company. The above
7
2013 2012 2011 2010 20090
1
2
3
4
5
6
7
8
CURRENT RATIO
CURRENT RATIO
LG Electronics
Financial Accounting
ratios show the gradual increase but after 2011 it decreases which is not a good sign and show that
the company’s capability has decreased. It is a negative sign.
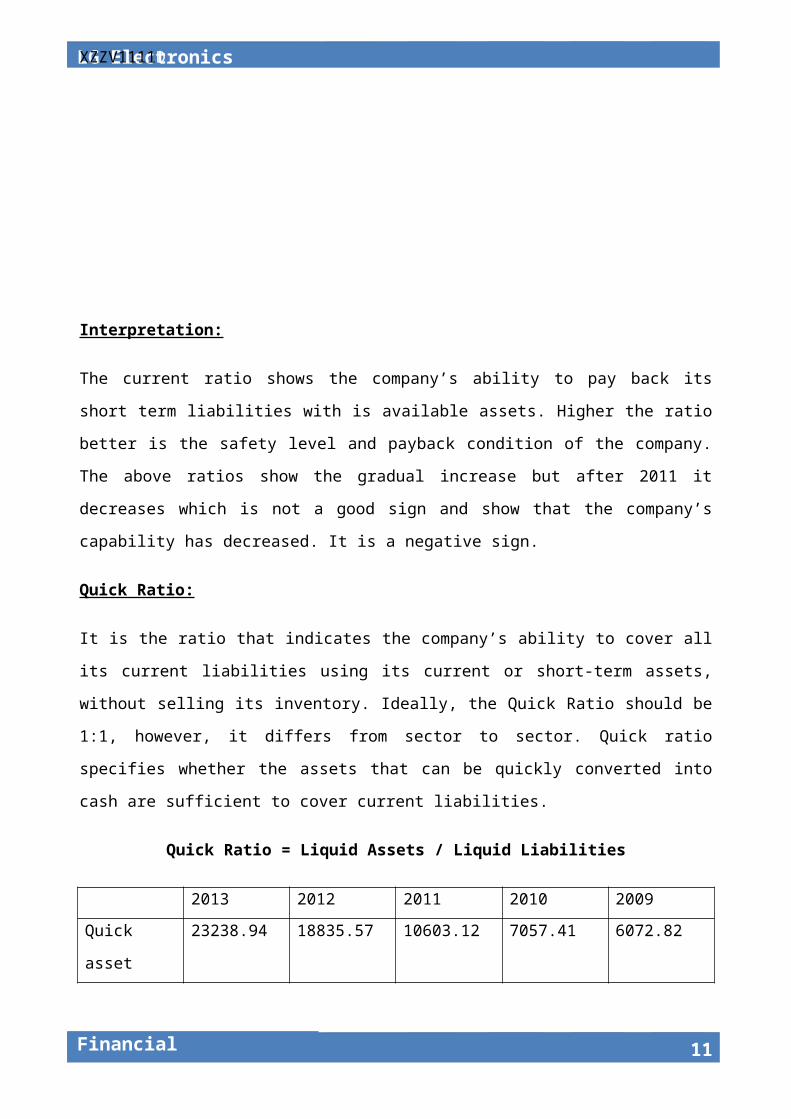
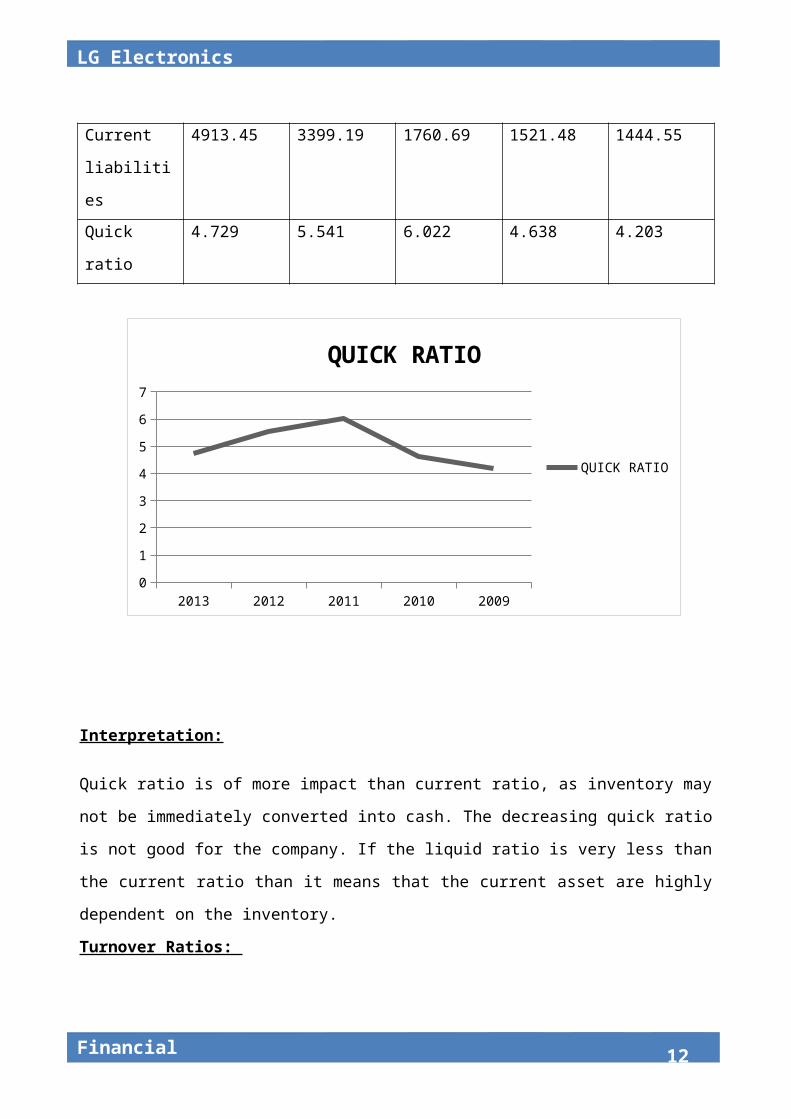
Quick Ratio:
It is the ratio that indicates the company’s ability to cover all its current liabilities using its current
or short-term assets, without selling its inventory. Ideally, the Quick Ratio should be 1:1, however,
it differs from sector to sector. Quick ratio specifies whether the assets that can be quickly
converted into cash are sufficient to cover current liabilities.
Quick Ratio = Liquid Assets / Liquid Liabilities
2013 2012 2011 2010 2009
Quick asset 23238.94 18835.57 10603.12 7057.41 6072.82
Current
liabilities
4913.45 3399.19 1760.69 1521.48 1444.55
Quick ratio 4.729 5.541 6.022 4.638 4.203
Interpretation:
2013 2012 2011 2010 20090
1
2
3
4
5
6
7
QUICK RATIO
QUICK RATIO
8
Financial Accounting
LG ElectronicsXZZV99D
Quick ratio is of more impact than current ratio, as inventory may not be immediately converted
into cash. The decreasing quick ratio is not good for the company. If the liquid ratio is very less
than the current ratio than it means that the current asset are highly dependent on the inventory.
Turnover Ratios:
Turnover ratios are also acknowledged as activity or efficiency ratios. It often refers to the
company’s ability to translate different accounts within their balance sheets into cash or sales.
Companies will normally try to turn their manufacture into cash or sales as fast as possible because
this will, in general, lead to greater revenues. Such ratios are frequently used when performing
fundamental analysis of the company.
There are various types of Turnover Ratios, namely: -
o Inventory turnover ratio
o Debtors turnover ratio
o Average collection period
o Total assets turnover ratio
o Fixed assets turnover ratio
o Capital employed turnover ratio
9
LG Electronics
Financial Accounting
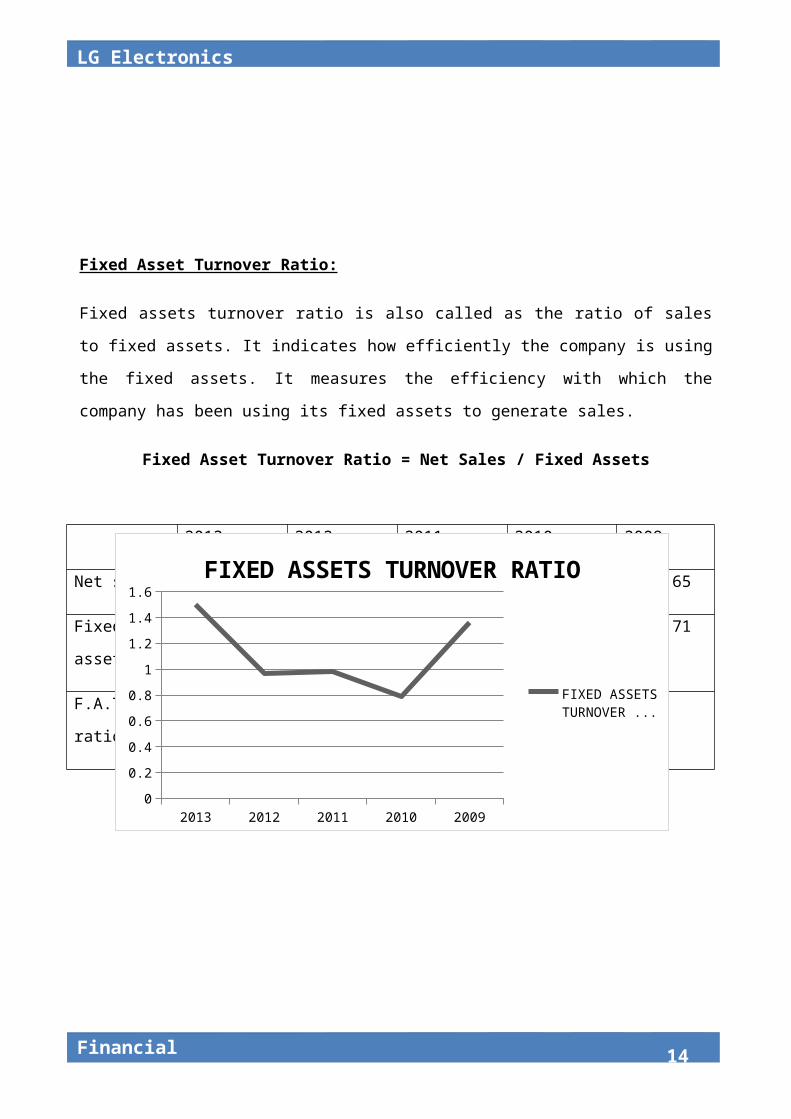
Fixed Asset Turnover Ratio:
Fixed assets turnover ratio is also called as the ratio of sales to fixed assets. It indicates how
efficiently the company is using the fixed assets. It measures the efficiency with which the
company has been using its fixed assets to generate sales.
Fixed Asset Turnover Ratio = Net Sales / Fixed Assets
Interpretation:
2013 2012 2011 2010 20090
0.2
0.4
0.6
0.8
1
1.2
1.4
1.6
FIXED ASSETS TURNOVER RATIO
FIXED ASSETS TURNOVER RA...
10
2013 2012 2011 2010 2009
Net sales 18157.28 12650.72 14409.69 9163.04 9753.65
Fixed assets 12095.96 13028.42 14568.28 11533.81 7177.71
F.A.T ratio 1.50 0.97 0.98 0.79 1.36
Financial Accounting
LG ElectronicsXZZV1111D
The higher fixed asset turn over ratio indicates the ability of the firm to achieve maximum sales
with the least investment in shares.as shown above it was high in 2009 fluctuated over the years
but is maximum in 2013.
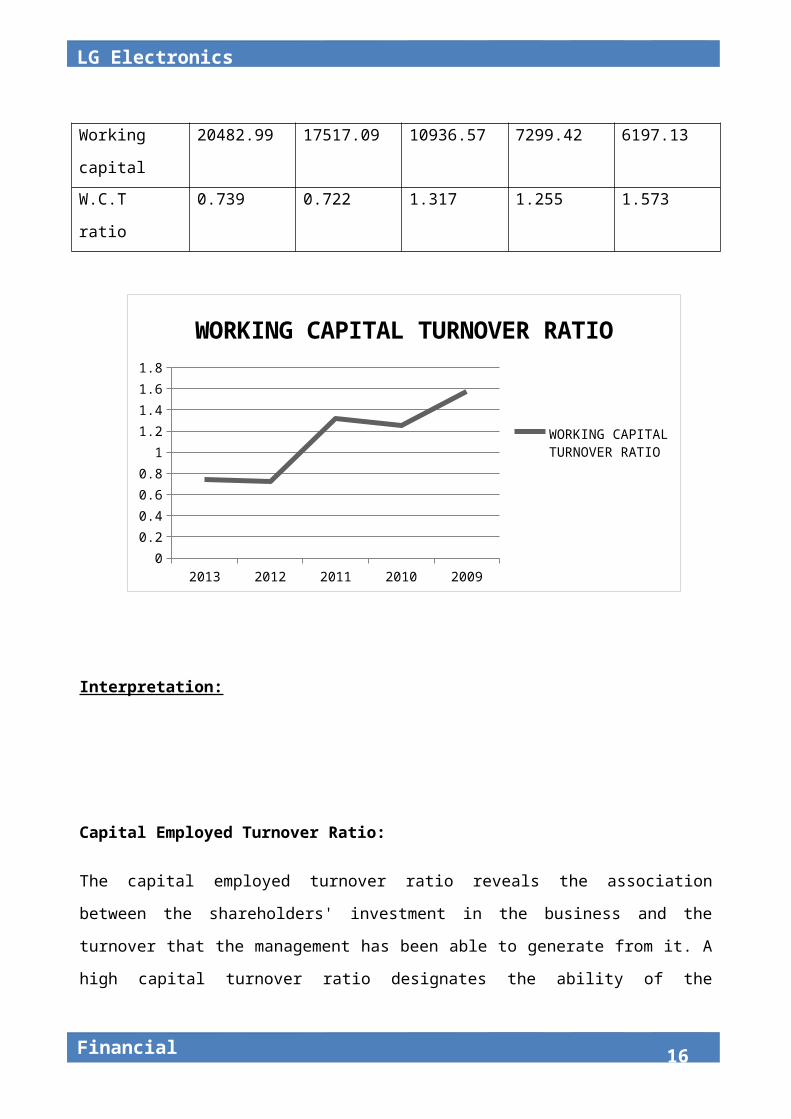
Working Capital Turnover Ratio:
It is a metric equating the reduction of working capital to generate of sales over a given period.
This provides some useful information as to how effectively a company is using its working
capital to generate sales. A company utilizes its working capital to fund operations and acquire
inventory. These operations and inventory are then converted into sales revenue for the company.
The working capital turnover ratio is used to analyze the relationship between the money used to
fund operations and the sales generated from these operations.
Working Capital turnover Ratio = Net Sales / Working Capital
2013 2012 2011 2010 2009
Net sales 15157.28 12650.72 14409.69 9163.04 9753.65
Working capital 20482.99 17517.09 10936.57 7299.42 6197.13
W.C.T ratio 0.739 0.722 1.317 1.255 1.573
Interpretation:
11
2013 2012 2011 2010 20090
0.2
0.4
0.6
0.8
1
1.2
1.4
1.6
1.8
WORKING CAPITAL TURNOVER RATIO
WORKING CAPITAL TURNOVER RATIO
LG Electronics
Financial Accounting
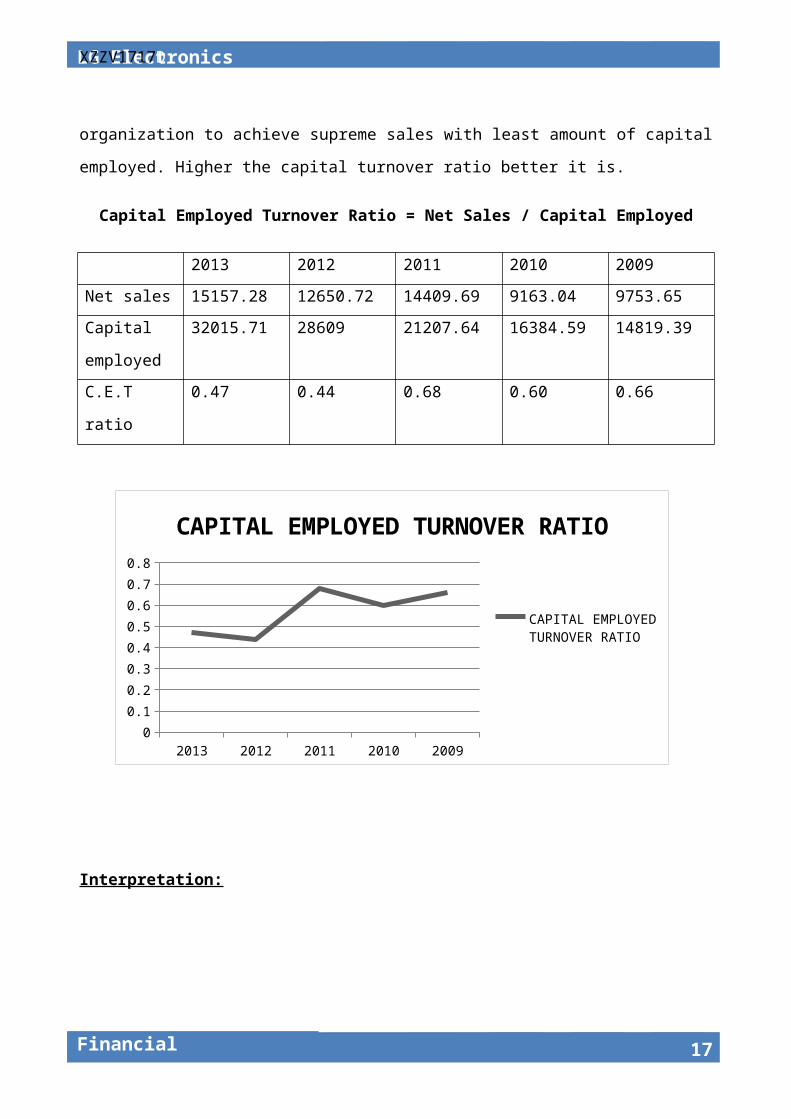
Capital Employed Turnover Ratio:
The capital employed turnover ratio reveals the association between the shareholders' investment
in the business and the turnover that the management has been able to generate from it. A high
capital turnover ratio designates the ability of the organization to achieve supreme sales with least
amount of capital employed. Higher the capital turnover ratio better it is.
Capital Employed Turnover Ratio = Net Sales / Capital Employed
2013 2012 2011 2010 2009
Net sales 15157.28 12650.72 14409.69 9163.04 9753.65
Capital
employed
32015.71 28609 21207.64 16384.59 14819.39
C.E.T ratio 0.47 0.44 0.68 0.60 0.66
Interpretation:
2013 2012 2011 2010 20090
0.1
0.2
0.3
0.4
0.5
0.6
0.7
0.8
CAPITAL EMPLOYED TURNOVER RATIO
CAPITAL EMPLOYED TURNOVER RATIO
12
Financial Accounting
LG ElectronicsXZZV1313D
Solvency Ratios
They measure the capacity of a company to compensate its long-term debt and the interest on it.
Solvency ratios help the business owner conclude the chances of the firm's long-term survival.
These ratios are of interest to long-term creditors and shareholders. These groups are concerned
with the long-term health and survival of business firms. Solvency ratios have to attest that
business can service their debt or pay the interest on their debt as well as pay the principal when
the debt matures.
13
LG Electronics
Financial Accounting
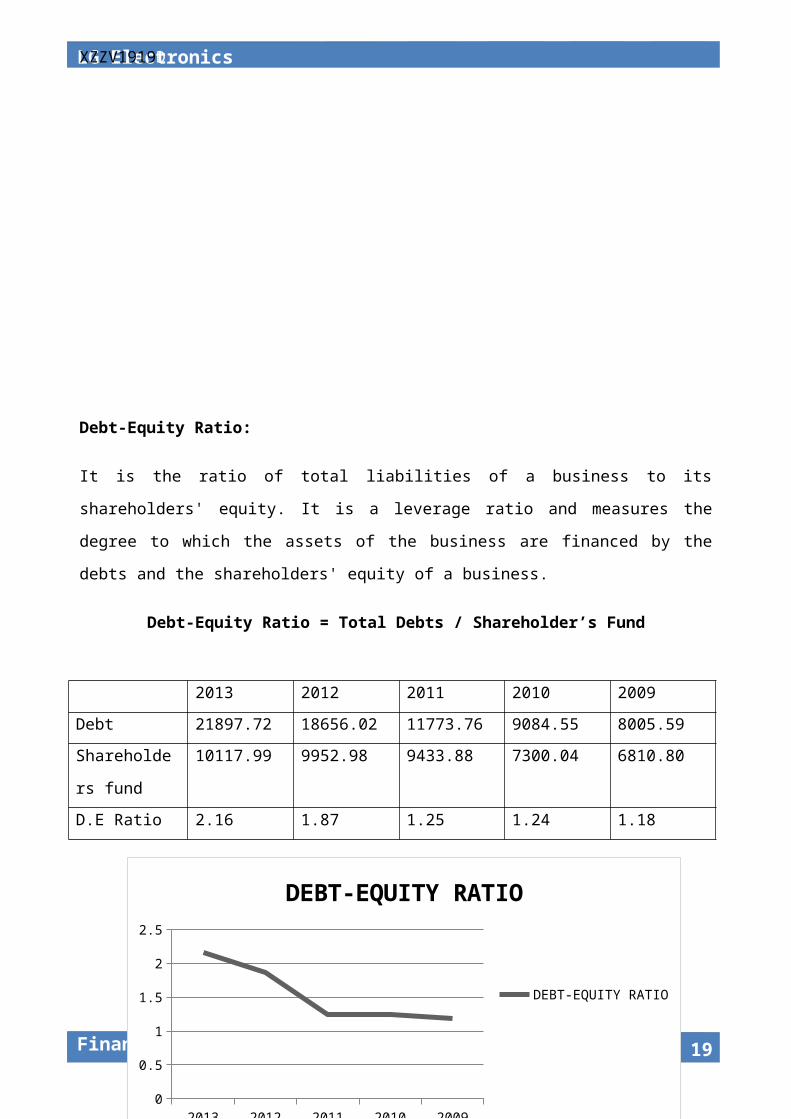
Debt-Equity Ratio:
It is the ratio of total liabilities of a business to its shareholders' equity. It is a leverage ratio and
measures the degree to which the assets of the business are financed by the debts and the
shareholders' equity of a business.
Debt-Equity Ratio = Total Debts / Shareholder’s Fund
Interpretation:
2013 2012 2011 2010 20090
0.5
1
1.5
2
2.5
DEBT-EQUITY RATIO
DEBT-EQUITY RATIO
14
2013 2012 2011 2010 2009
Debt 21897.72 18656.02 11773.76 9084.55 8005.59
Shareholders
fund
10117.99 9952.98 9433.88 7300.04 6810.80
D.E Ratio 2.16 1.87 1.25 1.24 1.18
Financial Accounting
LG ElectronicsXZZV1515D
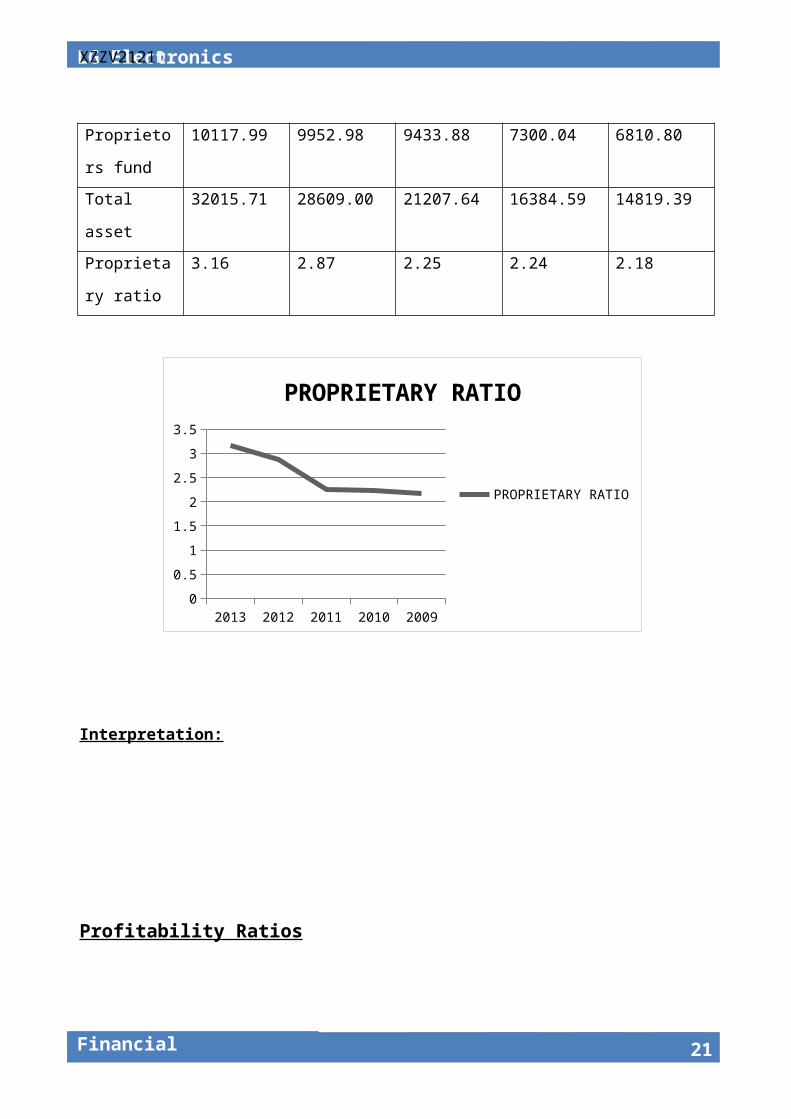
Proprietary Ratio:
Also known as Equity Ratio or the Net Worth to Total Assets Ratio, it is the ratio of shareholders'
funds to total assets. A high ratio indicates that the firm has adequate amount of equity to upkeep
the functions of the business.
Proprietary Ratio = Shareholders funds / Total Assets
2013 2012 2011 2010 2009
Proprietors
fund
10117.99 9952.98 9433.88 7300.04 6810.80
Total asset 32015.71 28609.00 21207.64 16384.59 14819.39
Proprietary
ratio
3.16 2.87 2.25 2.24 2.18
Interpretation:
15
2013 2012 2011 2010 20090
0.5
1
1.5
2
2.5
3
3.5
PROPRIETARY RATIO
PROPRIETARY RATIO
LG Electronics
Financial Accounting
Profitability Ratios
It is a measure of profitability, which measures a company's performance. Profitability is the
ability to make a profit, and a profit is what is left over from income earned after the company has
deducted all costs and expenses related to earning the income
Types of Profitability Ratios:
Common profitability ratios used in analyzing a company's performance include gross profit
margin (GPM), operating margin (OM), return on assets (ROA), return on equity (ROE), return on
sales (ROS), and return on investment (ROI).
16
Financial Accounting
LG ElectronicsXZZV1717D
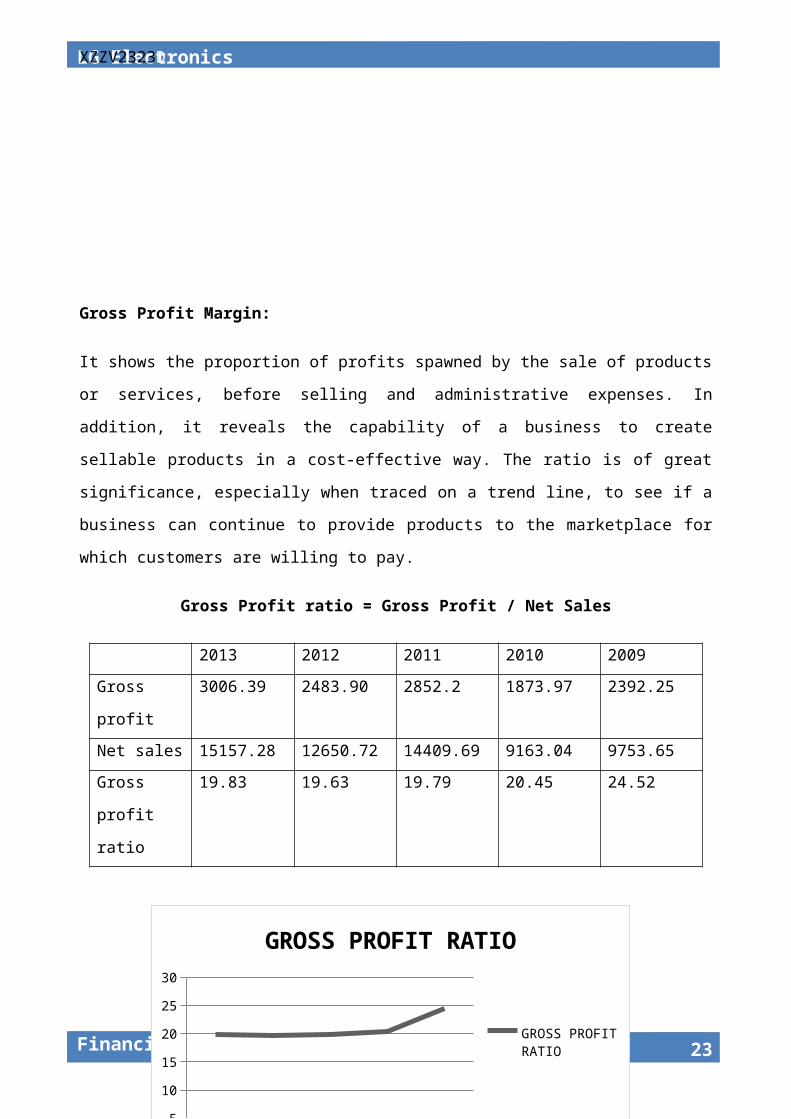
Gross Profit Margin:
It shows the proportion of profits spawned by the sale of products or services, before selling and
administrative expenses. In addition, it reveals the capability of a business to create sellable
products in a cost-effective way. The ratio is of great significance, especially when traced on a
trend line, to see if a business can continue to provide products to the marketplace for which
customers are willing to pay.
Gross Profit ratio = Gross Profit / Net Sales
2013 2012 2011 2010 2009
Gross profit 3006.39 2483.90 2852.2 1873.97 2392.25
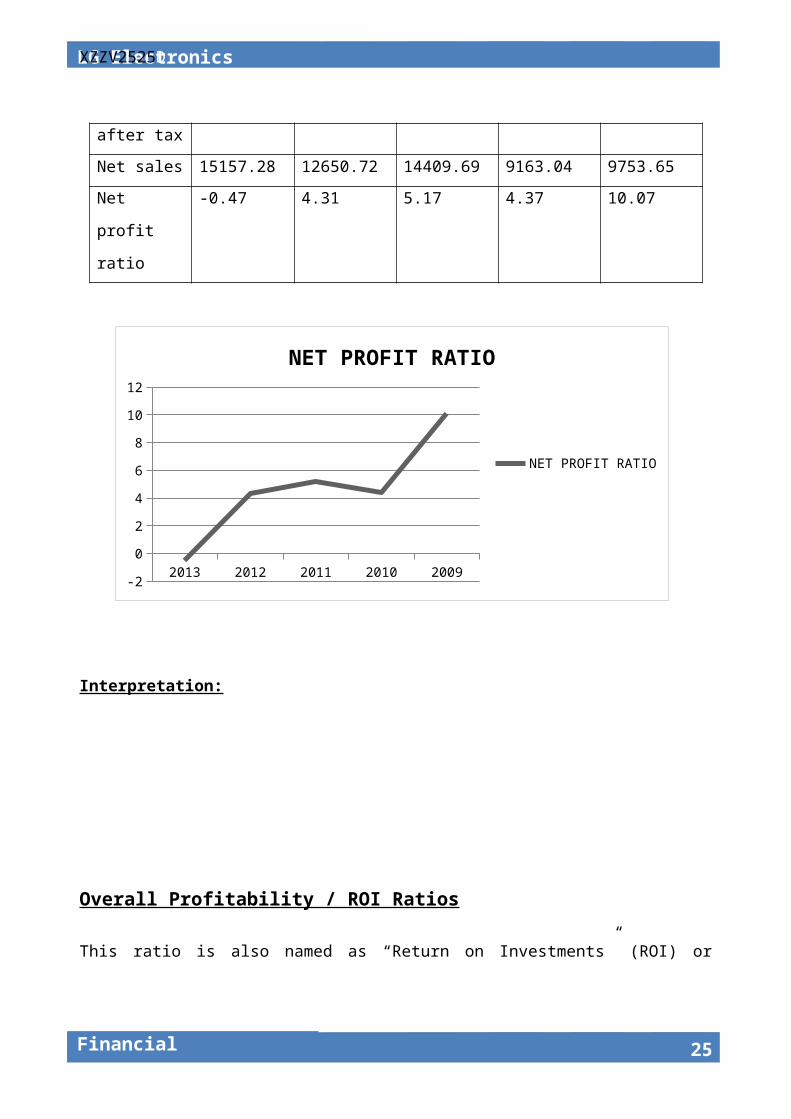
Net sales 15157.28 12650.72 14409.69 9163.04 9753.65
Gross profit
ratio
19.83 19.63 19.79 20.45 24.52
17
2013 2012 2011 2010 20090
5
10
15
20
25
30
GROSS PROFIT RATIO
GROSS PROFIT RATIO
LG Electronics
Financial Accounting
Interpretation:
Net Profit Ratio:
It is the ratio of after-tax profits to net sales. It discloses the remaining profit after all costs of
production, administration, and financing have been subtracted from sales, and income taxes
documented. As such, it is one of the finest measures of the overall performance of a firm,
particularly when shared with an evaluation of how well it is spending its working capital.
Net Profit Ratio = Net Profit / Net Sales
2013 2012 2011 2010 2009
Net profit
after tax
-71.63 545.56 744.69 400.66 982.10
Net sales 15157.28 12650.72 14409.69 9163.04 9753.65
Net profit
ratio
-0.47 4.31 5.17 4.37 10.07
2013 2012 2011 2010 2009-2
0
2
4
6
8
10
12
NET PROFIT RATIO
NET PROFIT RATIO
18
Financial Accounting
LG ElectronicsXZZV1919D
Interpretation:
Overall Profitability / ROI Ratios
This ratio is also named as “Return on Investments” (ROI) or “Return on Capital Employed”
(ROCE). It shows the percentage of return on the total capital employed in the business. This ratio
processes the relationship between net profit before interest and tax and capital employed. The
objective of calculating this ratio is to find out how efficiently the long term funds supplied by the
creditors and the shareholders have been used.
19
LG Electronics
Financial Accounting
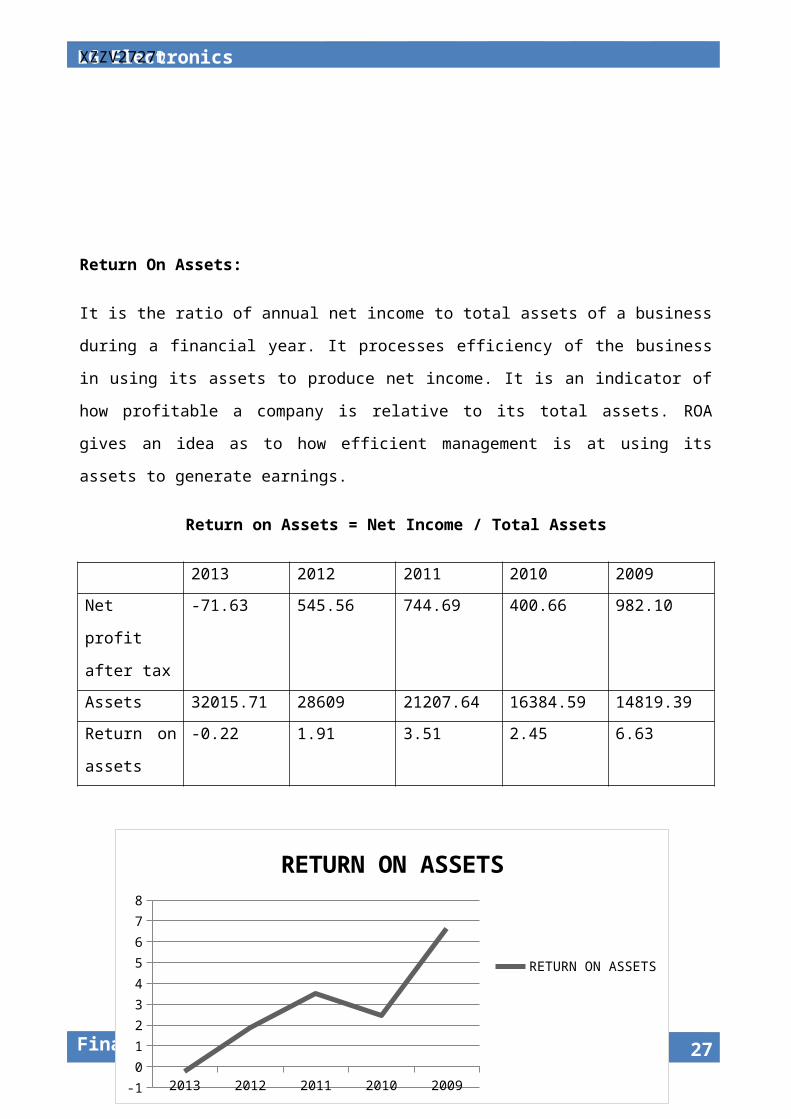
Return On Assets:
It is the ratio of annual net income to total assets of a business during a financial year. It processes
efficiency of the business in using its assets to produce net income. It is an indicator of how
profitable a company is relative to its total assets. ROA gives an idea as to how efficient
management is at using its assets to generate earnings.
Return on Assets = Net Income / Total Assets
2013 2012 2011 2010 2009
Net profit
after tax
-71.63 545.56 744.69 400.66 982.10
Assets 32015.71 28609 21207.64 16384.59 14819.39
Return on
assets
-0.22 1.91 3.51 2.45 6.63
2013 2012 2011 2010 2009-1
0
1
2
3
4
5
6
7
8
RETURN ON ASSETS
RETURN ON ASSETS
20
Financial Accounting
LG ElectronicsXZZV2121D
Interpretation:
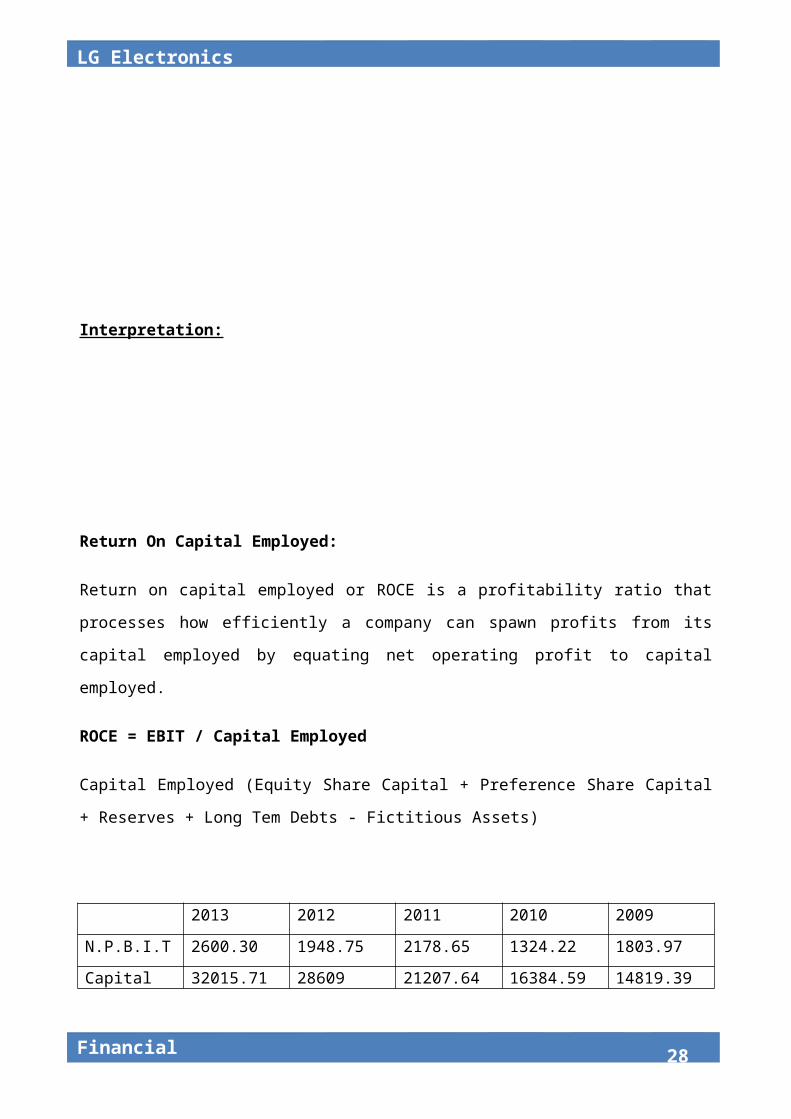
Return On Capital Employed:
Return on capital employed or ROCE is a profitability ratio that processes how efficiently a
company can spawn profits from its capital employed by equating net operating profit to capital
employed.
ROCE = EBIT / Capital Employed
Capital Employed (Equity Share Capital + Preference Share Capital + Reserves + Long Tem Debts
- Fictitious Assets)
2013 2012 2011 2010 2009
N.P.B.I.T 2600.30 1948.75 2178.65 1324.22 1803.97
Capital
employed
32015.71 28609 21207.64 16384.59 14819.39
ROCE 8.12 6.81 10.27 8.08 12.17
212013 2012 2011 2010 2009
0
2
4
6
8
10
12
14
ROCE
ROCE
LG Electronics
Financial Accounting
Interpretation:
Return On Equity:
This ratio determines the amount of net income reverted as a percentage of shareholders equity.
Return on equity processes a corporation's profitability by enlightening how much profit a
company creates with the money shareholders have invested.
ROE = (NPAT – Preference Dividend) / Equity Shareholder’s Fund
2013 2012 2011 2010 2009
N.P.A.T-
Preference
dividend
-74.4 542.18 740.08 396.98 978.42
Equity
shareholders
fund
10117.99 9952.98 9433.88 7300.04 6810.80
ROE -0.74 5.45 7.84 5.44 14.36
2013 2012 2011 2010 2009-2
0
2
4
6
8
10
12
14
16
ROE
ROE
22
Financial Accounting
LG ElectronicsXZZV2323D
Interpretation:
Earning Per Share:
EPS (Earning per Share) measures the profit earned per share by the shareholders. It is the portion
of a company's profit allotted to each outstanding share of common stock. Earnings per share
serves as a pointer of a company's profitability. Higher the value of EPS, higher is the
attractiveness of the stock to the investors.
EPS = (NPAT – Preference Dividend) / Total No. of Equity Shares Outstanding
2013 2012 2011 2010 2009
N.P.AT-
preference
dividend
-74.4 672.42 917.75 477.10 1055.75
No. of equity
shares o/s
49.6 37.35 46.51 27.30 24.66
EPS -1.50 18 19.73 17.47 42.80
23
2013 2012 2011 2010 2009-10
0
10
20
30
40
50
EPS
EPS
LG Electronics
Financial Accounting
Interpretation:
Dividend Payout Ratio:
It is the ratio that depicts the percentage of earnings paid back to the shareholders in the form of
dividend. The amount that is held back by the company is called retained earnings, which is used
for further development of the company.
DPR = Dividend per Share / EPS
2013 2012 2011 2010 2009
-200
-150
-100
-50
0
50
DIVIDEND PAYOUT RATIO
DIVIDEND PAYOUT RATIO
24
2013 2012 2011 2010 2009
D.P.S 2.77 3.38 4.61 3.68 3.68
E.P.S -1.50 18 19.73 17.47 42.80
Dividend pay
out ratio
-184.66 18.77 23.36 21.06 8.59
Financial Accounting
LG ElectronicsXZZV2525D
Interpretation:
Particulars 2013 2012 2011 2010 2009
Current ratio 5.168 6.153 7.408 5.797 5.290
Quick ratio 4.729 5.541 6.022 4.638 4.203
Fixed asset turnover ratio 1.50 0.97 0.98 0.79 1.36
Current asset turnover
ratio
0.71 0.60 1.139 1.038 1.276
Working capital turnover
ratio
0.739 0.722 1.317 1.255 1.573
Capital employed turn
over ratio
0.47 0.44 0.68 0.60 0.66
Debt equity ratio 2.16 1.87 1.25 1.24 1.18
Propriety ratio 3.16 2.87 2.25 2.24 2.18
Gross profit ratio 19.83 19.63 19.79 20.45 24.52
Net profit ratio -0.47 4.31 5.17 4.37 10.07
25
LG Electronics
Financial Accounting
Operating net profit ratio 19.83 19.63 19.79 20.45 24.52
Return on asset ratio -0.22 1.91 3.51 2.45 6.63
Return on capital
employed
8.12 6.81 10.27 8.08 12.17
Return on equity -0.74 5.45 7.84 5.44 14.36
Earning per share -1.50 18 19.73 17.47 42.80
Dividend payout ratio -184.66 18.77 23.36 21.06 8.59
Conclusion
26
Financial Accounting
LG ElectronicsXZZV2727D
References
27
LG Electronics
Financial Accounting
Annexures
28