Embed Size (px)
Citation preview

Liberty Holdings LimitedInvestor conference 20164 & 5 April

Thabo DlotiLiberty Group Chief Executive

3
Our purpose

4
Our group objectives to 2020 are clear and unchanged
Become the No. 1 provider in South Africa to the retail aspirational mid and affluent markets
Become the preferred partner for Standard Bank in all its African geographies
Leverage and ensure seamless transfer of core capabilities of the group to where the opportunities are
Vision: Liberty will be the trusted leader for insurance and investmentsin Africa and in other chosen markets
Being in Top 10 in Nigeria and Top 3 in Kenya and gaining significant growth and insurance market share in the rest of SSA
Become the preferred destination for asset flows destined for Africa
Accelerate growth and market share in the SA corporate market to become a Top 3 player through acquisitions
Liberty’s shares trading at a premium to sector average

5
Our anticipated Africa presence
Current Licensed Presence Anticipated 2020 footprint
8 Life licenses3 Short-term licenses9 STANLIB businessesHealth presence in 18 countries
• 4 Liberty licenses (includes Lesotho)• 10 Contracted license, Liberty
administration• 4 Contracted license, Third party
administration
15 Life licenses15 Short-term licenses10 STANLIB businessesHealth presence in 24 countries
• 12 Liberty licenses• 11 Contracted license, Liberty administration• 1 Contracted license, Third party
administration

6
Shifted the business to a new business model – from product houses to integrated value chain business for specific market segments
Ret
ail A
dvis
ory
DFS
(dire
ct s
ales
)
ECM
wor
ksite
sal
es
Cor
pora
teC
AL
STAN
LIB
Afric
a In
sura
nce
Hea
lth
Product push through channel
Overlapping end markets with little or no
segment focus
HNW & institutional funds
(international)
Individual Arrangements
Asset Management
Group Arrangements
Aspirational & affluent (SA)
Multinationals, Corporates,
SME’s, affinities,
(SSA)
Integrated value chain businesses… designed for specific segments
Product houses geared to fulfil propositions

7
We have unique capabilities to unlock these opportunities
• Strong relevant brand to the affluent market
• Strong distribution capability
• Attractive product set and product development capability
• Understanding of existing customers, their needs and buying behaviour
• Solid track record in the SME market
• Extensive African footprint and expertise
• Capability to serve companies in multiple geographies (e.g. healthcare)
• Insurance in a box
Individual Arrangements Group Arrangements Asset Management
• Multi-specialist franchise model with unique and strong investment propositions
• African footprint with expertise and product set
• Shared services platform leveraged across multiple geographies
• Offshore partners relationship and footprint – access to global investors
• Relationship with Standard Bank • Balance sheet management• Group functions to enable cost- and time-efficient operations
Group-wide

8
Life Insurance• In-country presence key to customer acquisition, servicing and risk management• Low cost operating model – competitive markets and/ or low price points• Market penetration versus market share acquisition – innovation, access and regulation• Standard Bank a key differentiator to access target customer segments
Health• Underwrite on Liberty licenses to capture additional margin and synergies• Cross sell to existing Health multinational client base • Expand health insurance offering to commercially viable target segments • Leverage health data for risk selection and management
We understand business imperatives required for success

9
STANLIB• A highly competitive market characterised by low fees in the pensions market
o Develop a suite of high margin products• Evolving demand profiles and expectations from institutional and retail investors results
in a need for diversified investment optionso Build additional distribution capacity
• The regulatory landscape may become increasingly stringent once reforms are implementedo Engage with regulators help influence policy changes that are supportive of the
industry
And Asset Management

10
IndividualArrangements
GroupArrangements
STANLIB Other 2015 Expectedlong-term rate
of return –SIP
67% 23%
How are we tracking against strategy ?
Our strategy has been to improve the quality of earnings, this has continued despite headwinds
Individual Arrangements• Good free cash generation• New generation products
are more capital efficient
Group Arrangements• Africa contribution growing
with footprint with better margins
STANLIB• New capabilities attracting
3rd party flows • Margin improvement
Contribution to operating earnings 2015 (Rm)
IndividualArrangements
GroupArrangements
STANLIB Other 2011 Expectedlong-term rate
of return –SIP
-2%
Contribution to operating earnings 2011 (Rm)
33% of Coreearnings
1 869225
629 49 2 772
1 379
2014/15 growth %
1 335 (38)
546 (75) 1 768
1 097
37% of Coreearnings
8% 2%
73% 31% -4%

11
9511 130
188
982
1 353
187
Agency BrokerConsultant
2013 2014 2015
Individual Arrangements, managed to model with focus on quality
• Decline in Agency force due to focus on improving productivity
• On-going growth of experienced advisers in tied channels maintains quality of sales
• Successful sales efforts and continued focus on retention initiatives in a tough environment
• Focus on quality new business volumes
• Good sales in STANLIB Linked Life Annuities and RAs
• New product launched – Liberty Agile with sales of R157m in first three months of launch
• Good returns on a higher asset base
• Positive risk and persistency variances
• On-going tight expense management and cost control
Focused distribution efforts maintains quality
Gross sales reflect difficult consumer environment
Solid earnings growth
22 414
25 21625 622
2013 2014 2015
1 467
1 689
1 869
2013 2014 2015

12
545551
579
2013 2014 2015
Asset Management
1. Excludes intergroup
• Continue to attract positive non-money market flows
• Money market flows are positive following improved sentiment
• Positive flows from group channels combined with improved retention benefitted cash flows
• Gaining traction in passives –R1bn mandates won.
• Margins benefited from a better flows mix
• Alternative capabilities, unlisted property (double digit returns) and infrastructure funds (50% return), have delivered superior returns
• Improved flows to own unit trusts via STANLIB LISP
• Strong growth in other African territories
• And good contribution to earnings
• REIT listed and secured $35m, target properties secured
Significant improvementin cash flows¹ (Rm)
South African margin growthfrom good inflows
Business continues toattract 3rd party flows
31 31
33
2013 2014 2015
13 527
2 1986 417
(13 738)
7 343
1 111
Non-moneymarket
Money market
2013 2014 2015Bps Rbn

13
78
90
105
68 68 71
2013 2014 2015Health Cover lives (000)
7 1727 270
7 810
2013 2014 2015
55%
2%
38%
5%
Brokerbancassurance
Group Arrangements, operational focus and expansion continues
• Improved diversification of sales volumes through multiple channels – a key focus
• Launched new market leading index tracking investment range
• Expanding consulting business
• Lower single premium sales • Stable Growth Fund top
performing fund of its kind• Improved service delivery to
umbrella fund customers• Total recurring premiums up 7%
in a challenging market
• Continue to see good contribution from the rest of Africa, aided by rand weakness
• Claims loss ratio is within target
Liberty Corporate expanded South African distribution channels
Liberty Corporate recurring gross insurance premiums supported by new product offerings
Increased focus on efficienciesand product offering in Health
Rm

14
Short term challenges are outweighed by the long term opportunity
In conclusion
Liberty is committed to capturing long term growth in Africa
1
2
Our core skills and strengths in insurance and investments combined with our footprint provides a competitive advantage
3

Questions

Private and confidential
Analyst Certification: This material is "non-independent research" and constitutes a "marketing communication" as defined in the UK FCA Handbook.It has not been prepared in accordance with the full legal requirements designed to promote independence of research and is not subject to any prohibition on dealing ahead of the dissemination of investment research
Macroeconomic Update
East Africa will be the crown jewel in SSA; Take two
Jibran Qureishi
Regional East Africa Economist
4 April 2016

11
Commodity prices remain key transmission mechanism between globe and Africa
Hydro carbon exporters
Non-Oil Resources
Guinea
26%
86%
Botswana
27%
92%
Zambia
13%
73%
Rep ofCongo
74%%
76%
Cameroon
24%
51%
Nigeria
14.4%
97%
Gabon
66%
84%
Namibia
27%
39%
Angola
38%
97%
Cote d’Ivoire
20%
15%
LEGEND
Mining (% of GDP)
Fuel, Minerals & Metals (% of
Exports)
Ghana
17%
46%
SSA – contribution of extractive industries
Nigeria and Angola are particularly vulnerable to downside pressure on oil prices
Source: statistics agencies, central banks, Standar d Bank Research
* Nigeria contribution to GDP reflects Crude Oil in dustry in rebased national accounts
(South) Sudan
60%
78%

2
China’s new normal
Geography of commodities Chinese imports (USD bn)
PGM, Gold and other industrial metals in S.
Africa
Oil in Nigeria,
Sudan and Libya
Copper and Cobalt in
Zambia and the DRC
Bauxite and
alumina in Guinea
Gold in West Africa
Various other commodities,
including Uranium, Coal, and industrial
metals found throughout Africa
Less than USD100mnUSD100mn – USD500mnUSD500mn – USD1bnUSD1bn – USD4bn
USD4bn – USD10bn
More than USD10bn
Africa’s share of world commodities
And don’t forget agricultural potential
024681012
0
30
60
90
120
Sud
an
DR
C
Nig
eria
Mal
i
Tan
zani
a
Alg
eria
Moz
ambi
que
Ang
ola
Nam
ibia
Cot
e d'
Ivoi
re
Cultivable area Cultivated area Irrigation RHS
% of cultivated areaMn ha
0 25 50 75 100
PGMPhosphate
GoldChromiumMaganese
CobaltDiamonds
Bauxite
Reserves Mine production (2010)
Share of world total, %

3
SARB caught between a rock and a hard place?
What does the SARB do in this precarious situation?
-2
-1
0
1
2
3
4
5
6
2000 2001 2002 2003 2004 2005 2006 2007 2008 2009 2010 2011 2012 2013 2014 2015 2016f 2017f
4.8% average
2% average
1.1% average
GDP growth, annual percent

POOR GDP GROWTH BLIGHTS SA’S STATUS
Sources: Fitch, Moody’s, S&P, Standard Bank
Research
'94 '95 '96 '97 '98 '99 '00 '01 '02 '03 '04 '05 '06 '07 '08 '09 '10 '11 '12 '13 '14
S&P
Moody’s
Fitch
B+
BB-
BB
BB+
BBB-
BBB
BBB+
A-
A
A+
B
B1
Ba3
Ba2
Ba1
Baa3
Baa2
Baa1
A3
A2
A1
B2
Non-investment grade

5
Major central banks have printed a lot of money but there’s been no inflation
The brown line is a rough estimate of global dollar liquidity – and it has been rising sharply since around 2000…
…and yet global inflation has fallen
But this is goods price inflation. Asset price inflation, like bond prices, stock prices and property prices have risen

6
Global debt still surgingGlobal debt now around 300% of GDP…
…or around USD200tr
0
50
100
150
200
250
Q4 2000 Q4 2007 Q4 2014
Financial Government Corporate Household
269% of GDP
299% of GDP
$ tr
246% of GDP
Source: McKinsey

7
What’s wrong with debt? Key points
Economic growth helps to pay off debt
But if nominal growth is less than the interest rate charged on debt, it is difficult to reduce the debt
In this example the sink stays full with debt
Source: Standard Bank Research
Interest rates
Growth
Debt

8
Are Democrats good for the dollar?Key points
Shaded areas represent Democrat presidents
The dollar tends to rise during Democrat presidency and fall when Republican president is in charge
Recessions have tended to occur during Republican presidencies, not Democrat

Political dangers – the US
For Trump
• Voters are railing against
government
• Sufficient finance
• Hard for Democrats to win the
presidency after a two-term
stint for Obama
• Obama’s popularity rating is
low
• Clinton supported by big
business, especially Wall Street
• Clinton is seen as an
‘untrustworthy’ candidate
Against Trump
• ‘Offended’ minorities dominate many swing
states
• Demographics – the US is becoming less
‘white’
• He’s offended the Republican Party
• Swing voters could align against him
• He’s not been strongly challenged on issues
• He’s seen as an ‘untrustworthy’ candidate
• He’s not attracted much negative
campaigning
Key points
High debt and modest growth are sowing the seeds of political fragmentation and disenchantment
One place we see this is in the US with the rise of Republican candidate Donald Trump

10
Who do you trust in the Brexit polling debate?Key points
Opinion polls show consistently different results depending on whether people are called on the telephone or fill in an online poll
What does this reflect?
Possibly people feel more pressurised to give an opinion on the telephone
It may also be because they feel they ‘should’ express a bias to remain
5
15
25
35
45
55
Remain Leave Undecided Remain Leave Undecided
Remain Leave Undecided Remain Leave Undecided
Internet polls Telephone polls
Source: Mori, Ipsos, ICM. Opinion polls Dec 1 st – Feb 19th

11
Currency forecastsKey points
Dollar seen firm –but volatile
The dollar’s long-term uptrend dating back to 2011 is seen coming to an end in the 1-2 year horizon
Source: Standard Bank Research
1 month 3 months 6 months 1 year 2 years
EUR/USD 1.10 1.15 1.05 1.00 1.20
USD/JPY 112 115 120 125 100
GBP/USD 1.43 1.35 1.30 1.33 1.50
USD/CNY 6.55 6.65 7.0 7.2 6.90

12
Key pointsKey points
Growth expected to expand by 5.7% y/y in 2016
Inflation depends largely on food inflation outlook
USD/KES likely to trade at levels around 107.0 by end of 2016
Consistency between monetary and fiscal policy needed
Kenya: Politics could take centre stage in the coming years
7580859095100105110115120
Dec-10 Sep-13 Jun-16
USD/KES
USD/KESUSD/KESUSD/KESUSD/KES
History Forwards Forecast
5.45
5.95
6.45
6.95
7.45
Jan-15 Apr-15 Jul-15 Oct-15
USDbn
FX ReservesFX ReservesFX ReservesFX Reserves
-15000.0
-10000.0
-5000.0
0.0
5000.0
10000.0
2008 2010 2012 2014f 2016f
USD m
Current Account DevelopmentsCurrent Account DevelopmentsCurrent Account DevelopmentsCurrent Account Developments
Trade balance ServicesIncome Transfers
-9.0
-8.0
-7.0
-6.0
-5.0
-4.0
-3.0
-2.0
-1.0
0.0
FY2011/12 FY2013/14 FY2015/16
% of GDP
Deficit incl. grantsDeficit incl. grantsDeficit incl. grantsDeficit incl. grants

13
FX reserves recover after financial outflows in 201 5
Source: KNBS; CBK; Standard bank research
Key pointsKey points
Balance of payment shock in 2015 was largely owing to financial account.
Reversal of financial flows began in Q4:15, albeit modestly.
When will equity market rebound?
CBK has a war chest with FX reserves being boosted by syndicated loan issuance as well as IMF precautionary facility at their disposal.
CBK has more than enough ammunition to ensure KES operates in an orderly manner.
5.45
5.65
5.85
6.05
6.25
6.45
6.65
6.85
7.05
7.25
7.45
Jan-15 Mar-15 May-15 Jul-15 Sep-15 Nov-15
USDbn
Financial
outflows
Boosted by
Eurobond
Boosted by
syndicated loan

14
Input costs have risen continuously in 2015 often t hanks to the weaker KES
Input prices PMI …Prices charged PMI
Sources: Markit; CfC Stanbic Bank
Drop in prices driven by
oil price reductions.
KES depreciation

15
SGR will be a silver bullet for the region
Source: Standard bank research
Key pointsKey points
SGR completion will provide a strong platform for the incumbent to demonstrate progress at pre-election rallies.
Intra East African trade will inevitably be boosted by the SGR.
Will be the catalyst for the industrialization process in the region.
Projected is mostly funded offshore.

16
Key pointsKey points
Magufuli has so far lived up to his nickname ‘tingatinga’ which means bulldozer.
Fiscal deficit inclgrants likely to be lower at 10.3% of GDP in FY15/16 as we suspect planned expenditure by the govt was lower due to delays in obtaining donor funding.
Tax collections been abysmal over the years. Magufuli, suspends TRA chief after TZS80bn couldn’t be accounted for.
Eurobond or private placement?
Credit rating delay?
Tanzania: Magafuli clamping down on spending

Magufuli has started well, but he must;
• Find a swift solution to the stalemate in Zanzibar.
• Hold the referendum vote for the new constitution.
• Fight corruption and continue his on-going house cleaning exercise.
• Sort out the petroleum act to boost FDI in the natural gas sector.

18
Key pointsKey points
Food prices are likely to mirror the trend in the rest of the region and rise in Q1:16.
Food stocks held by the National Food Reserve Agency (NFRA) have been falling since Dec 14. This is potentially a further upside risk to food prices.
The BOT increased the SMR ration to 10% from 8% and also lowered commercial banks prudential limit on foreign currency NOP, to 5.5% from 7.5% of core capital.
BOT will remain circumspect around the TZS and thus prefer to leave the policy stance unchanged.
Tanzania: Time for an inflation index rebase?
0.00
5.00
10.00
15.00
20.00
25.00
0
5
10
15
20
25
30
35
40
45
Jan-11 Jun-11 Nov-11 Apr-12 Sep-12 Feb-13 Jul-13 Dec-13 May-14 Oct-14 Mar-15 Aug-15
RHS Food inflation%
91-day Food inflation Headline inflation (y/y) Core inflation
Core inflation actually subsided in
period of extreme TZS
depreciation. Been trending
sideways since then.

19
Key pointsKey points
We expect GDP growth to register 5.4% y/y and 5.7% y/y in 2016 and 2017 respectively. This is up from an estimated 4.8% y/y in 2015.
Coffee productivity too low. South Sudan peace agreement remains in the balance?
C/A deficit probably eased to 7.7% of GDP in 2015.
USD/UGX likely to trade around 3700 by year end.
BOU likely to commence on a gradual easing cycle in H2:16.
Uganda: What next after elections?
1 800
2 300
2 800
3 300
3 800
4 300
4 800
Dec-10 Sep-13 Jun-16
USD/UGX
USD/UGXUSD/UGXUSD/UGXUSD/UGX
History Forwards Forecast
2 500.0
2 600.0
2 700.0
2 800.0
2 900.0
3 000.0
3 100.0
Jan-15 Apr-15 Jul-15 Oct-15
USDmn
FX ReservesFX ReservesFX ReservesFX Reserves
-4000
-3000
-2000
-1000
0
1000
2000
2004 2006 2008 2010 2012 2014 2016f
USDmn
Current Account DevelopmentsCurrent Account DevelopmentsCurrent Account DevelopmentsCurrent Account Developments
Trade Services Income
Transfers C/A
-7.5
-7.0
-6.5
-6.0
-5.5
-5.0
-4.5
-4.0
FY2010/11 FY2013/14 FY2016/17
% of GDP
Deficit incl. grantsDeficit incl. grantsDeficit incl. grantsDeficit incl. grantsInfrastructure
imports and drop
in FDI.
20
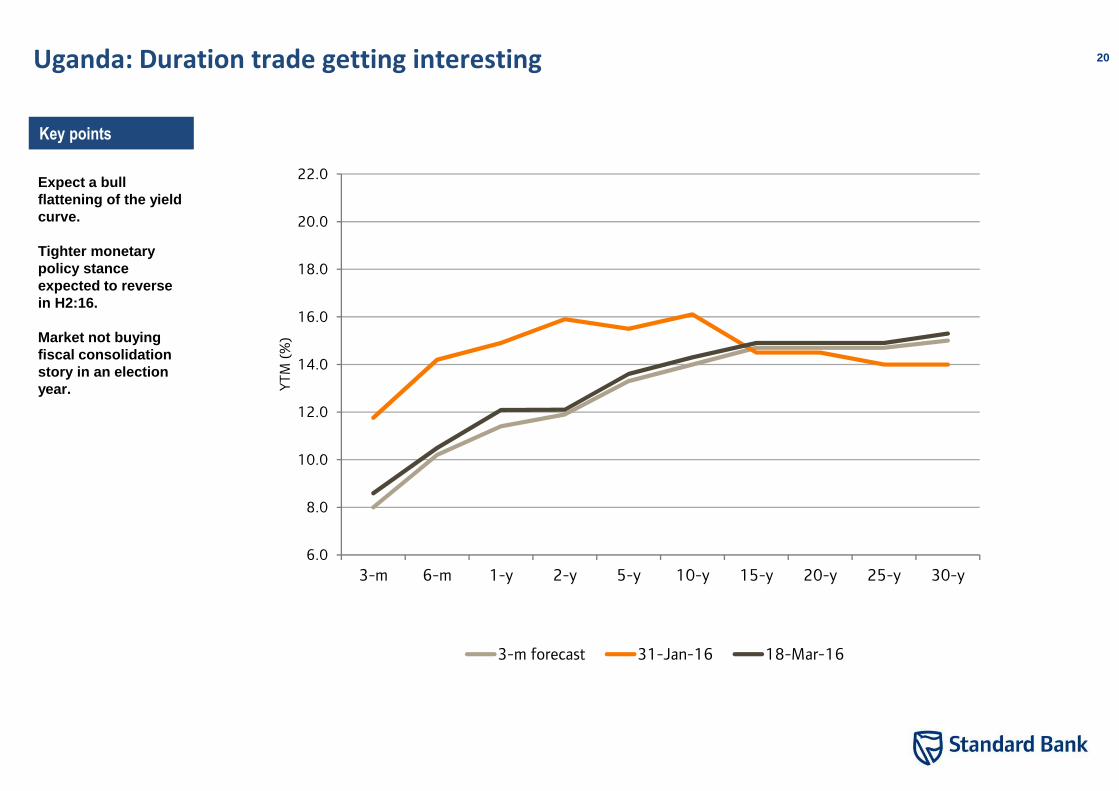
Key pointsKey points
Expect a bull flattening of the yield curve.
Tighter monetary policy stance expected to reverse in H2:16.
Market not buying fiscal consolidation story in an election year.
Uganda: Duration trade getting interesting
6.0
8.0
10.0
12.0
14.0
16.0
18.0
20.0
22.0
3-m 6-m 1-y 2-y 5-y 10-y 15-y 20-y 25-y 30-y
YTM (%)
3-m forecast 31-Jan-16 18-Mar-16

21
Key pointsKey points
By its own admission, the BOU believes the pass through effects of the weaker UGX, will increase core inflation.
BOU inflation forecasts are worrying. See 10% for core inflation in Q3:15.
Are they expecting further UGX weakness from a potential pre-election spending binge.
Money printing in 2011, admitted by BOU Governor.
Uganda: BOU’s concerns around core inflation
-20.0
-10.0
0.0
10.0
20.0
30.0
40.0
50.0
60.0
Feb-06 Jan-08 Dec-09 Dec-11 Nov-13 Oct-15
%, y/y
Headline Food Core

22
Key pointsKey points
BOU consistently implies that macroeconomic instability in 2015 came about due to faster economic activity.
PSC and M3 growth not painting a true picture of this.
Soft GDP growth underscores our thoughts.
Uganda: Real output within target, contrary to what BOU thinks
0.00%
5.00%
10.00%
15.00%
20.00%
25.00%
30.00%
35.00%
40.00%
45.00%
50.00%
Jan-10 Sep-10 May-11 Jan-12 Sep-12 May-13 Jan-14 Sep-14 May-15
M3 y/y PSC y/y
UGX revaluation effects on
the two metrics.

23
Key pointsKey points
How sensible is the ‘overvaluation’ chatter in East Africa?
UGX REER reversing course.
Will this improve BOU’s tolerance for a stable and possibly a stronger UGX?
We think so.
No point in looking at trade weighted models without factoring in productivity.
Uganda: UGX not ‘overvalued’ anymore?
-
20.0
40.0
60.0
80.0
100.0
120.0
140.0
160.0
Jan-10 Aug-10 Mar-11 Oct-11 May-12 Dec-12 Jul-13 Feb-14 Sep-14 Apr-15 Nov-15
UGX REER 5-y Avg
REER Depreciation
REER
Appreciation

24
Key pointsKey points
Service exports supported by tourism briefly in 2015.
Value benefitting from stronger USD, but volumes remain upsettingly low.
Numbers show South Sudan impact not as bad as thought.
Uganda: How reasonable is the UGX overvaluation paradigm?
0.0
50.0
100.0
150.0
200.0
250.0
300.0
0.0
50.0
100.0
150.0
200.0
250.0
300.0
Jan-14 Apr-14 Jul-14 Oct-14 Jan-15 Apr-15 Jul-15 Oct-15
Goods exports Service exports

25
East African urbanisation plays to manufacturing se ctors competitive advantage
By 2050, 2/3 will live in cities African megacities will emerge
Sources: UN Habitat, Standard Bank Research
0%
25%
50%
75%
100%
1950 1975 2000 2020 2045
Rural population Urban population
Construction-related sales benefit
Electric lampsInsulated wires/cablesTaps & valvesAir conditionersStatic convertorsConstruction machinery
USD500mn
USD250mn
USD100mn USD50mn USD25mn

26
Divergence in growth is a dominant theme for Africa in 2016
Conclusion
� Commodity exporters (specifically metals, oil) will likely experience a marked slowdown in economic growth
– Financing of growth will prove challenging
– Pressure on currencies to depreciate
� Non-metals, non-oil exporters should fare much better
– Monetary policy independence
– Less pressure for currency depreciation

27Disclaimer
This material is non-independent research. Non-inde pendent research is a "marketing communication".
This material is "non-independent research". Non-independent research is a "marketing communication" as defined in the UK FCA Handbook. It has not been prepared in accordance with the full legal requirements designed to promote independence of research and is not subject to any prohibition on dealing ahead of the dissemination of investment research.
Additional information with respect to any security referred to herein may be made available on request. This material is for the general information of institutional and market professionals’ clients of Standard Bank Group (SBG) only. Recipients who are not market professionals or institutional investor customers of SBG should seek advice of their independent financial advisor prior to taking any investment decision based on this communication or for any necessary explanation of its content. It does not take into account the particular investment objectives, financial situation or needs of individual clients. Before acting on any advice or recommendations in this material, clients should consider whether it is suitable for their particular circumstances and, if necessary, seek professional advice. The information, tools and material presented in this marketing communication are provided to you for information purposes only and are not to be used or considered as an offer or the solicitation of an offer to sell or to buy or subscribe for securities or other financial instruments, nor shall it, or the fact of its distribution, form the basis of, or be relied upon in connection with, any contract relating to such action. This material is based on information that we consider reliable, but SBG does not warrant or represent (expressly or impliedly) that it is accurate, complete, not misleading or as to its fitness for the purpose intended and it should not be relied upon as such. The information and opinions contained in this document were produced by SBG as per the date stated and may be subject to change without prior notification Opinions expressed are our current opinions as of the date appearing on this material only. We endeavour to update the material in this report on a timely basis, but regulatory compliance or other reasons may prevent us from doing so.
SBG or its employees may from time to time have long or short positions in securities, warrants, futures, options, derivatives or other financial instruments referred to in this material. Where SBG designates NON- INDEPENDENT Research to be a “marketing communication”, that term is used in SBG’s Research Policy. This policy is available from the Research Compliance Office at SBG. SBG does and seeks to do business with companies covered in its non-independent research reports including Marketing Communications. As a result, investors should be aware that the Firm may have a conflict of interest that could affect the objectivity of this report. Investors should consider this report as only a single factor in making their investment decision.
SBG has published a Conflicts of Interest Policy that is available upon request which describes the organisational and administrative arrangements for the prevention and avoidance of conflicts of interest. Further disclosures required under the FCA Conduct of Business Sourcebook and other regulatory bodies are available on request from the Research Compliance Department and or Global Conflicts Control Room, unless otherwise stated, share prices provided within this material are as at the close of business on the day prior to the date of the material. None of the material, nor its content, nor any copy of it, may be altered in any way, transmitted to, copied or distributed to any other party, without the prior express written permission of SBG. All trademarks, service marks and logos used in this report are trademarks or service marks or registered trademarks or service marks of SBG or its affiliates.
SBG believes the information and opinions in the Disclosure Appendix of this report are accurate and complete. Information and opinions presented in the other sections of this communication were obtained or derived from sources SBG believes are reliable, but SBG makes no representations as to their accuracy or completeness. Additional information is available upon request. SBG accepts no liability for loss arising from the use of the material presented in this report, except that this exclusion of liability does not apply to the extent that liability arises under specific statutes or regulations applicable to SBG.
The services, securities and investments discussed in this material may not be available to nor suitable for all investors. Investors should make their own investment decisions based upon their own financial objectives and financial resources and it should be noted that investment involves risk, including the risk of capital loss. Past performance is no guide to future performance. In relation to securities denominated in foreign currency, movements in exchange rates will have an effect on the value, either favourable or unfavourable. Some investments discussed in this marketing communication have a high level of volatility. High volatility investments may experience sudden and large falls in their value causing losses when that investment is realised. Those losses may equal your original investment. Indeed, in the case of some investments the potential losses may exceed the amount of initial investment, in such circumstances you may be required to pay more money to support those losses. Income yields from investments may fluctuate and, in consequence, initial capital paid to make them investment may be used as part of that income yield. Some investments may not be readily realisable and it may be difficult to sell or realize those investments, similarly it may prove difficult for you to obtain reliable information about the value, or risks, to which such an investment is exposed.

28Disclaimer (continued)
This report is issued in Europe and approved as a financial promotion for the purposes of distribution in the UK by Standard Advisory London Limited 20 Gresham Street, London EC2V 7JE which is authorised by the Financial Conduct Authority (“FCA”). This report is being distributed in Kenya by CfC Stanbic Bank Limited; in Nigeria by Stanbic IBTC; in Angola by Standard Bank de Angola S.A.; in China by Standard Bank Limited; in Botswana by Stanbic Bank Botswana Limited; in Democratic Republic of Congo by Stanbic Bank Congo s.a.r.l.; in Ghana by Stanbic Bank Ghana Limited; in Hong Kong by Standard Advisory Asia Limited; in Isle of Man by Standard Bank Isle of Man Limited; in Jersey by Standard Bank Jersey Limited; in Madagascar by Union Commercial Bank S.A.; in Mozambique by Standard Bank s.a.r.l.; in Malawi by Standard Bank Limited; in Namibia by Standard Bank Namibia Limited; in Mauritius by Standard Bank (Mauritius) Limited; in Tanzania by Stanbic Bank Tanzania Limited; in Swaziland by Standard Bank Swaziland Limited; in Zambia by Stanbic Bank Zambia Limited; in Zimbabwe by Stanbic Bank Zimbabwe Limited; in UAE by The Standard Bank of South Africa Limited, Dubai branch.
In respect of the United States, this report is solely intended for distribution to US institutional investors that qualify as Major US Institutional Investors under Securities Exchange of 1934 Rule 15a-6.In jurisdictions where Standard Bank Group is not already registered or licensed to trade in securities, transactions will only be effected in accordance with the applicable securities legislation, which will vary from jurisdiction to jurisdiction and may require that the trade be made in accordance with applicable exemptions from registration or licensing requirements.
Standard Bank Group Ltd Reg.No.1969/017128/06) is listed on the JSE Limited. SBSA is an Authorised Financial Services Provider and it also regulated by the South African Reserve Bank.
Copyright 2015 SBG. All rights reserved. This report or any portion hereof may not be reprinted, sold or redistributed without the written consent of Standard Bank Group Ltd.

Liberty Holdings LimitedInvestor conference 20164 April

Unlocking growth in AfricaSandile Hlophe, CE: Group Arrangements

3
Why Africa….
$1.4 trillionconsumer spending
1 billion15% of the world’s
population
$2.6 trillionEst. GDP in 2020
6 out of 10fastest growing
economies
128 millionAfricans buying consumer goods
5.5% GDPp.a. forecast to
2017
Sources: World Bank, IMF, Economist

4
Positive progress across the continent over last 10 years
Fundamentals remain positive• Growing population is increasing demand
• Increased urbanisation
• Improved political landscape
• Evolving regulatory frameworks
• Improved stock markets and oversight
Democracies are beginning to strengthen• Zambia, Nigeria, Kenya – democratic elections
Long-term policy decision making is positive• Regulatory reform and financial market stability remains key on government
agendas
• These are catalysts for growth and stability of the areas
Favourable market conditions for pensions and insurance business

5
Distinct regional growth trajectories
Western region is potentially the most significant opportunity but vulnerable to market volatility • Large and fast growing affluent consumer
market in Nigeria• Strong and increasing foreign investment
inflows• Significant commodity-based economy,
especially oil• Demand creates ‘Expensive’ entry premium• Planned risk-based capital requirements in
Nigeria and Ghana will improve prospects for well-capitalised insurers like Liberty
Southern region is more mature and expected to grow at a slower rate
• Stronger economies, highly resource dependent and linked to SA economy
• Low population growth rate expected over the next 50 years
• Power supply challenges
• Largely a market share strategy
Eastern region is an attractive opportunity with high growth expected in the near term• Regionalisation of EA
communities• Regulatory developments
create opportunities• Technology savvy consumers
and economy• Oil and gas deposits found

6
We have unique capabilities to unlock these opportunities …
• Extensive Africa footprint, expertise and product set
• Capability to serve multinationals and other large corporates in multiple geographies (e.g. healthcare)
• Solid track record in the SME market and partnering with Affinity groups
• Insurance in a box (life and short-term)
• Maximising current efficiencies and cross-selling opportunities
Life Insurance
• In-country presence key to customer acquisition and risk management
• Low-cost operating model
• Market penetration vs market share acquisition: innovation, regulation, access
• Standard Bank a differentiator to access target customer segments
• Leverage Johannesburg head office for scale and technical resources
Health
• Underwrite on Liberty licenses to capture margin and synergies
• Cross sell to existing Health multinational client base
• Expand health insurance offering to commercially viable target segments
• Leverage central processing for scale, technical resources, expertise
• Health data for risk selection and management
• Develop strategic partnerships with provider networks and other insurers to access all geographies
Short-term insurance
• Business in a Box
• Specialist underwriting including trade credit insurance, motor mechanical warranties, pay-as-go drive insurance, oil & gas
• Leverage skills and centre of excellence in Kenya
• Common IT platform
• Build scale through acquisitions & partnerships
• China opportunity

The business model to succeed

8
Key aspects of our insurance business model
Segment groupsFocus will vary by country, based on
commerciality
Commerciality of segments
• Customer value propositions developed per segment
• Multinational and Corporate clients provide scale
• Regulatory reform will make the corporate business opportunity incrementally more attractive and open to cost-efficient standardised solutions
• Market expansion will also be in the ‘bulk retail’ (worksite / affinities) markets. Customer relevance and affordable products are key to most markets with mainly low-income consumers
• Our ability to service seamlessly across jurisdictions will be a competitive advantage
Multinationals
Corporates
SMEs
Worksites and Affinities

9
• Liberty as an ingredient brand
• Technology• Enablement and
innovation • Scale of markets
facilitates opportunity
• Micro SMEs vs larger SMEs
• Access via intermediaries and partners
• Access and innovation to succeed
• Local relationships –brokers and clients
• Own sales team / consulting
• Expertise• Specialist needs
Capabilities are supported by distribution ability and efficiencies
Corporates SMEs Worksites and Affinities
• Footprint • ‘Local’ knowledge and
expertise• Consistency across
countries• Own sales team /
consulting• Expat solutions
Multinationals
• Business is ‘local’, supported centrally
• 80% standardisation/ 20% localisation
• Speed to market, operational risk management and economies of scale are enabled by a ‘business in a box’ approach
Operations and capability
• Embedded bancassurance and corporate business are low risk opportunities of entry
• Key opportunities, competitive landscape, and operating environment determine next phase of growth
• Greenfields growth and acquisitions are both available as options for entry into targeted jurisdictions
Market entry
• Match Standard Bank’s footprint• Entry method depends on
availability of suitable acquisitions, size of existing players and whether new licenses are being issued
• Use partner licenses where appropriate e.g. Francophone Africa
Expansion

10
Bancassurance, remains a key differentiator
Liberty’s strategy is to partner with the bank to build scale and customer base

11
The outlook informs our strategy
Current Licensed Presence Anticipated 2020 footprint
8 Life licenses3 Short-term licenses9 STANLIB businessesHealth presence in 18 countries
• 4 Liberty licenses (includes Lesotho)• 10 Contracted license, Liberty
administration• 4 Contracted license, Third party
administration
15 Life licenses15 Short-term licenses10 STANLIB businessesHealth presence in 24 countries
• 12 Liberty licenses• 11 Contracted license, Liberty administration• 1 Contracted license, Third party
administration

Progress so far…

13
Operating environment in 2015
We believe our strategy is sufficiently aligned to current trends and opportunities in the market
New businessesEconomic & Political environment• Political stability in all countries, although terrorism risk is
still a concern in Kenya;• Market volatility in Kenya from the end of April – equity
market fell 26% between April and October – short-term bond yields rose +700bps;
• Tanzania and Uganda macroeconomic fundamentals improved – inflation at single digits;
• Business confidence has fallen in Southern Africa; A possible downgrade of SA’s sovereign credit rating could affect the Southern region
• Currency depreciation and ratings downgrade in Zambia
Regulatory developments
• Progress in liberalising Bancassurance regulations in Kenya and Uganda;
• Enhanced importance around TCF and policyholder protection principles in Kenya and Swaziland;
• New regulations in Namibia around insurer prescribed assets and unlisted investments
• Higher scrutiny of tax and other regulatory compliance across geographies/borders, in growth markets of Kenya and Nigeria
Competitive Landscape• M&A and greenfield opportunities explored by SA insurers; • Renewed interest by European Insurers in the African
continent e.g. Prudential & AXA; • Kenya insurers looking to aggressively expand in the East
Africa region;• Underwriting margin pressure• Opportunities from the growth of Chinese and Indian FDI,
particularly in East Africa• Aggressive bonus declarations on deposit administration
business

14
Continued good progress on expanded footprint
Insurance• Gross earnings R152m • VNB R49m
Health (Liberty Health Cover)• CLR 63%• Lives covered R105 000
2009
Insurance• Gross earnings R42m • VNB R9m
Health (Liberty Blue)• CLR 78%• Lives covered 17 000
Licence and people
Additional business lines
Partners
2015

15
Key initiatives delivered in 2015Product Bancassurance
Affinity Partners Other Channels
• Unit-linked pensions products in Kenya• Education Plans• Launch of hospital cash plan in Botswana• SME Coupon Product• Legacy funeral plan launched in Kenya• Retail products Simple Life Plan and
Platinum Life Plan rolled out in Namibia, Swaziland, Botswana and Zambia
• Group Risk product launched in Zambia and Lesotho
• Credit life products launched in Zambia on back of Stanbic partnership
• Kenya Agency licence approved• Working closely with legislators and
regulators in Uganda on reform of insurance legislation
• Transactional channel rollout implemented in Botswana, Namibia and Swaziland
• Banking• Micro finance institutions• Unions• Medical aids• Funeral parlours• Churches• Police and defence forces• Partnership with top motor dealer in Kenya
to sell short-term insurance products
• Franchise model operational in Namibia and Botswana
• Underwriting health business on insurance licences
• Direct Sales Agents remuneration model;• Strategic insurers • Chinese speaking sales agents in East
Africa• Online sales & service platform in Kenya

Building for growth …

17
2016/2017 focus areas
Establish and integrate new businesses
Life
Short-term
Diversify channels
• Tier 2 brokers;• Bancassurance
− Transactional and institutional channels− Kenya and Uganda
• Additional affinities and worksites• Synergies between Liberty Africa Insurance, Health and
Corporate capabilities to enhance multinational, large corporate and SME propositions
• Partner with global insurers without an African footprint to target their multinational clients
• Develop a comprehensive SME proposition – taking into account economic structure in most African countries
• Short-term retail insurance capability in Kenya and Tanzania
• China business community and Chinese insurers
• Nigeria• Lesotho• Tanzania• Zimbabwe
• Botswana• Malawi• Namibia• Nigeria• Zimbabwe
Bulk up existing businesses• Acquisitions• Bolt-on acquisitions• Joint ventures• Stakeholder engagement programmes
• Unit-linked pensions products in Kenya;• Embedded products for Standard Bank in
Kenya, Uganda, Namibia and Botswana • New retail products (annuities) • Pension solutions for the continent
Product

18
Fundamentals are in place, however there are considerations
Political and Economic stability
• New governments – continued terrorist threats
• Currency volatility
Competition
• Impact on margins and risk management practices
• Availability of suitable acquisitions
• Price of acquisitions
Regulatory and tax environment
• Evolving bancassurance legislation
• Transfer pricing
• Governments need for tax revenues
• Introduction of risk based capital models
People
• Skills shortage across Sub-Sahara Africa
• Scale of operations makes succession planning difficult
• Not easy to expatriate

19
• Liberty is committed to capturing the long-term growth in Africa
• Strategic investments on the continent remain a focus
• The short-term challenges are outweighed by the long-term opportunity
• Our core skills and strengths in insurance and investments, and our on-the-ground presence gives us a competitive advantage
• Our bank partner remains a key differentiator for expansion and growth
• Effective and considered deployment of capital to chosen growth markets will drive shareholder value for the future
• Liberty is committed to working with equity partners and regulators to improve access and integrity of wealth solutions
• Stepped up stakeholder engagement to drive brand presence in Africa
In conclusion

Questions

Kenya Investor DayApril 2016
Seelan Gobalsamy

STANLIB Overview

A Leading Investment Business
Active asset managementMulti‐ManagerPassive asset management
We are a multi‐specialist investment company in 10 African countries with business partners in North America, United Kingdom, Europe, Middle East and Asia
R579bn(USD 37bn)Assets under management and administration
INVESTMENTS
31 December 2015
INSTITUTIONAL•10 of the top 20 JSE Companies•4 of the top 6 listed Insurers •R60bn – Parastatals, unions etc•R30bn ‐ Universities
OUR CUSTOMERS
RETAILMore than 500 000 across Africa.
OUR PEOPLE
100+ Investmentprofessionals
With over1500 yearsof collective investment experience
82 Raging Bull Awards92 Morningstar AwardsLevel 2 BBBEE StatusActive asset management
Multi‐ManagerPassive asset management

Asset Management Strategy

Our physical presence in 10 African countriesBest Asset Manager in Frontier Markets
Ghana – Alex Asiedu
Managing Director
Namibia – Brown Amuenje
Managing Director
Botswana – Moipone Lopang
Managing Director
South Sudan – Isaiah Malith
Managing Director
Uganda – Annette Rumanyika
Managing Director
South Africa – Seelan Gobalsamy
CEO, STANLIB
Managing Director
Swaziland – Mandla Ndlovu
Kenya – James Muratha
Managing Director
Lesotho – Kello Rametse
Managing Director
Managing Director
Tanzania – GeofreyMwakagenda

Our multi‐franchise model
Active Fund Management
Alternative Investments
Fixed Interest, Equity, Property and Multi‐Asset capabilities.
Passive Investments
Multi‐Manager Funds
OFFSHORE PARTNERS
Bonds
Cash and Multi‐asset
Equities
REST OF AFRICASOUTH AFRICA
Multi‐Specialist Franchise Model

STANLIB in the Rest of Africa

• High GDP growth rate• Increased political stability and pragmatic economic policy• It has a young, rapidly growing population• Emerging middle‐class• Urbanisation and increasing retail sector
Why are we passionate about Africa?

• Financial market reform attracted international investors• STANLIB offers traditional and alternative investment
options• In the traditional space, there is room for targeted product
development in specific segments• Alternatives focus on:
– Direct Property– Infrastructure– Private Equity
What do we offer Africa?

Closing
10
Leverage multi‐specialist investment capabilities to deliver consistent investment performance
Enhance our product range – alternatives and customised solutions
Build our international distribution capability – build capacity in local distribution
Invest in our people – truly Pan‐African investment professionals
1.
2.
3.
4.
Strategic Objective

Thank You

STANLIB’s Alternatives CapabilitiesKenya Investor Day
Amelia Beattie and Patrick Mamathuba04 April 2016

Alternatives overview
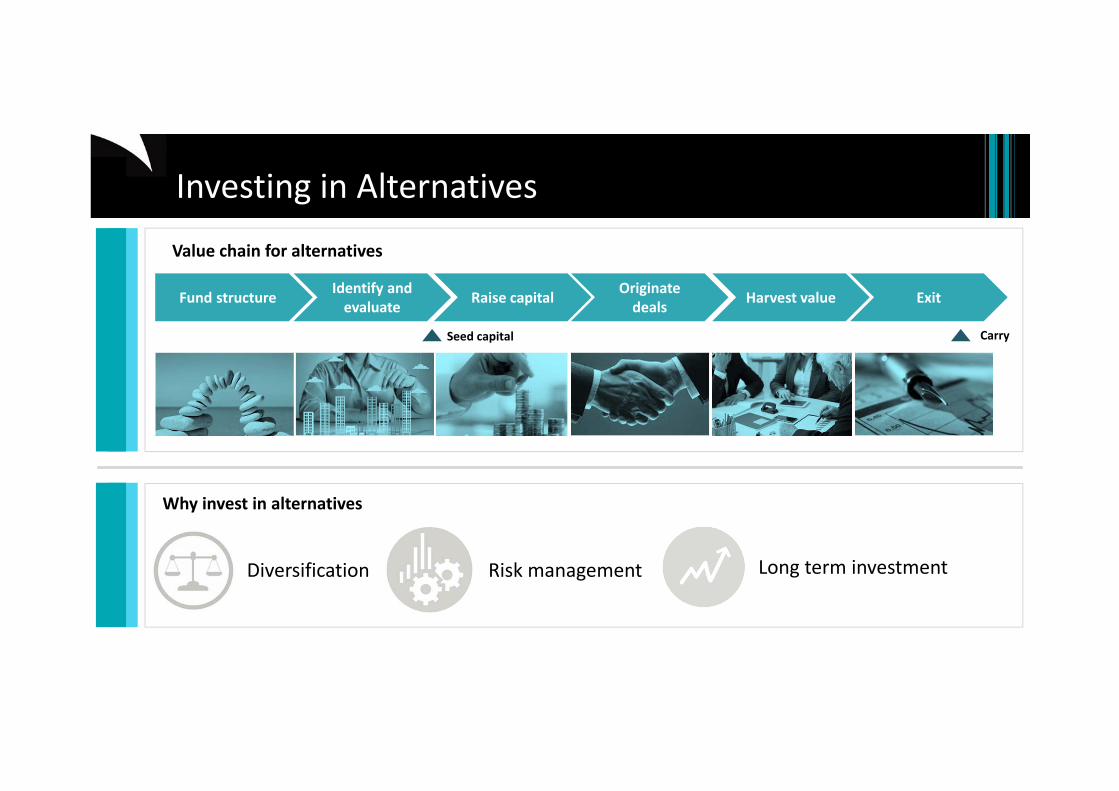
Value chain for alternatives
Diversification Risk management Long term investment
Investing in Alternatives
Why invest in alternatives
Fund structure Identify and evaluate Raise capital Originate
deals Harvest value Exit
CarrySeed capital

Alternatives investment team
Amelia Beattie
Patrick Mam
athu
ba
420+Years of collective
investment experience
Experience
Degrees includingMCom, MPhil, BCom(Hons), BAcc(Hons), BSc, BAcc, BCom,
BA(Hons), BA, MSc, PhD
CA (SA) CFA MBA
Qualifications
Direct Property Infrastructure Private Equity (Exeo Capital)
Liberty Property Portfolio
Alex Phakathi
Pan‐Africa Development Fund
Robe
rto Ferreira
Fahari Income‐REIT
Anton Bo
rkum
Ghana Income Fund
Neysa Harilal
Herm
an M
arais
Paul Nguru
Managing Partner Exeo Capital
Partner Exeo Capital
Gregg Babaya
Head of Infrastructure
MoyahaboMpanza
Andy
Louw
Principal Investment Analyst
Senior Partner Exeo Capital
Izak
Strauss
Direct Property Infrastructure Private Equity (Exeo Capital)

Direct property

6
INVESTMENT PHILOSOPHYTo be the Asset Manager of choice for investors with a long‐term investment appetite in quality real estate in carefully chosen economically growing nodes on the African continent

Strategic focus areas
LIBERTY PROPERTYPORTFOLIORemains a key focus area with dedicated investment team to drive investment returns for policyholders and match exposure needs
PAN AFRICA OFFERINGFocus dedicated efforts on building Pan African investment opportunities through creating quality stock in high growth areas
IN‐COUNTRY APABILITIESEnsure that we stay in touch with the market to offer investment solutions for investors to key opportunities and economically growing nodes
Making real estate accessible sustainably
DEVELOPMENT MANAGEMENTFocused property development team to provide development management and leasing management capabilities to grow the portfolio assets under management

0.00%
2.00%
4.00%
6.00%
8.00%
10.00%
12.00%
2010 2011 2012 2013 2014 2015Income return Capital growth CPI + 5%
Liberty Property Portfolio returns (gross) 2010 ‐ 2015
• 10.37% total return in 2015• Outperformed benchmark of CPI + 5%
Eastgate Shopping Centre
Promenade Shopping Centre
Liberty Midlands Mall
Liberty Property Portfolio
Sandton City

STANLIB Africa Direct Property Development Fund
Project Location Property Type
Estimated Size (m2)
Fund's Equity (millions)
Project Orca
Tema, Ghana Retail 20 064 $30.3
Project Honour
Lagos, Nigeria Office 44 000 $42.0
Total $ 165.3
Project Diamond
Oweri, Nigeria Retail 14 000 $10.0
Project Masai
Nairobi, Kenya Retail 13 000 $16.7
Project Audit
Accra, Ghana Office 10 200 $15.0
Project Sinatra
Asaba, Nigeria Retail 15 000 $18.6
Project West
Lagos, Nigeria Retail 20 000 $17.7
Project Nile
Kampala, Uganda Retail 13 600 $15.0
Pipeline of investment opportunities

• First listed Kenyan Property Fund (size of capital raise: KSH 3.6Bn)• Offering investors access to the following key benefits:
o A high quality, professionally managed property portfolio, which will yieldo Tax efficient dividend distributions plus capital gains within a regulated
environmento Diversification, transparent pricing, liquidityo Internal and external governance (IFRS reporting)
Trading price of Fahari Income‐REIT (KES)
1819202122232425
List Price Closing Price
Update on Inward Asset Transfers• Greenspan Mall transferred Feb‐16• Transfers of Signature International
and Bay Holdings are underway
Fahari Income‐REIT


Make a difference to peoples’ lives

Bring hope to the communities we serve

Make the planet a better place to live…and translate into creating real value

We build hospitals that provide 385 beds to the children and people of South Africa

Ghana – Meridian Square Mall
In Africa we convert barren land into income generating legacies

Our retail development in Athi River will create 893 construction jobs and 1,155 permanent jobs on completion

Infrastructure

MatureGrowthRamp UpConstructionGreenfield
Investment Stage of Life
Risk
level
Asset
value
Project Life
Multi fund strategy driven by investment life cycle
Yield Fund
PE Funds
Infrastructure strategy
Target project life cycle

Wind farms
Our investments generate a combined 340 MW of power
Solar
80 MW Wind Farm Combined 265MW Solar PV
Infrastructure Private Equity Fund I investments

Investors at final close CommitmentR’million
Commitment%
Total Fund commitments 1 189 100%
61%2%
37%Assets at marketvalueManagement fees &expensesAvailable funds
Investments as at 30/09/2015 Fund shareholding Cost (R’million)
Project Kalkbult 10% 63.5
Kouga Wind Farm 35% 169.2
Project Linde 10% 24.6
Project Dreunberg 20% 96.2
Project Kathu 12.5%˜ 223.0
Total investments 576.5
13%
40%
4%
17%
26%Project KalkbultKouga Wind FarmProject LindeProject DreunbergProject Kathu
Infrastructure Private Equity Fund I summary
Utilisation of funds
Breakdown on value basis

Private Equity

Retains distinct branding and management independence
A 50/50 partnership between STANLIB and the founders of Agrie Vie Private Equity
Introducing Exeo Capital
Sector focus:
Food and agribusiness Household goods manufacturing and distribution
Transport and logistics Specialised financial services
Media and e‐commerce Industrial services Healthcare Private education
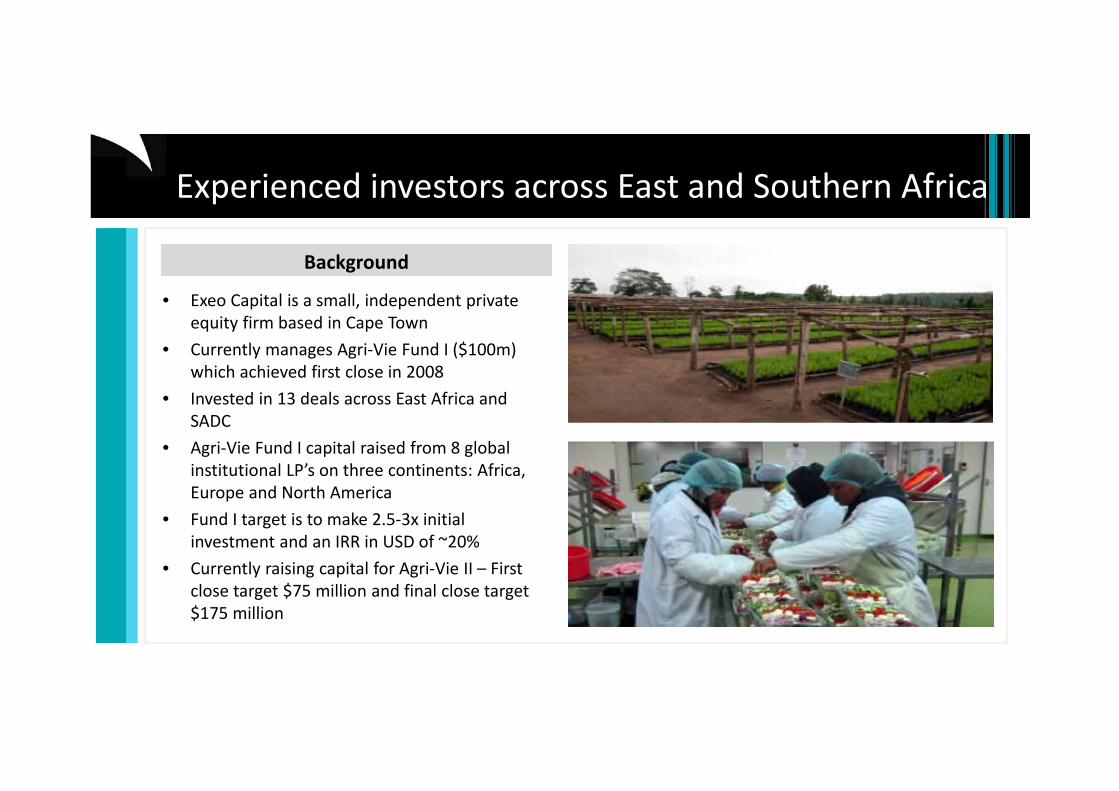
Background
• Exeo Capital is a small, independent private equity firm based in Cape Town
• Currently manages Agri‐Vie Fund I ($100m) which achieved first close in 2008
• Invested in 13 deals across East Africa and SADC
• Agri‐Vie Fund I capital raised from 8 global institutional LP’s on three continents: Africa, Europe and North America
• Fund I target is to make 2.5‐3x initial investment and an IRR in USD of ~20%
• Currently raising capital for Agri‐Vie II – First close target $75 million and final close target $175 million
Experienced investors across East and Southern Africa

Agri‐Vie Fund II – pipeline for investments
ZambiaUgandaTanzaniaSouth Africa
RwandaMozambiqueKenyaGhana
$ millions
90
80
70
60
50
40
30
20
10
0Ethiopia
Investment focus:
4
6
2 22 2
2
2
1
Agri‐inputs and services
Storage and logistics
Food, beverage and fibre processing
Food ingredients

In‐closing

• Ability to offer our customers the full spectrum of alternative investments
• Critical to gaining flows in more lucrative asset classes, and driving future profitability
• Increased customer demand for this offering, alternatives industry CAGR of 12% since 1999 (SAVCA/KPMG, 2014)
• Growth is expected to accelerate driven by:
Regulatory changes that have increased the allocation that pension funds can make towards the asset class
Global capital is seeking higher returns in Africa and emerging markets
• Aligned to the Group’s Vision 2020 strategic intent of gaining flows destined for Africa
Concluding remarks
At STANLIB our alternative capabilities deliver real value
INVESTORS SHAREHOLDERS COMMUNITIESConsistently meet/exceed benchmark returns
Build sustainable earning streams
We change the lives of people we touch
Thank you.