Embed Size (px)
Citation preview

LibQUAL Results & Analysis
Wendy BegayService Quality Librarian
Kansas State University LibrariesNovember 2011

Overview
• Survey• background• design
• Analysis• Quantitative• Qualitative
• Summaries & Conclusions• What next? Libraries’ focus

LibQual Survey
HISTORY• ARL & Texas A&M developed from SERVQUAL
instrument in 2000• Standardized National Assessment tool for
libraries• More than 1,000 libraries have conducted
LibQual Survey in over 17 countries

LibQual Survey
Instrument• 3 dimensions
1) Affect of Service (9 questions)2) Information Control (8 questions)3) Library as Place (5 questions)
• Five additional questions we selected• 3 Overall general satisfaction questions on
• Use of libraries• web browsers questions
• 5 Information Literacy questions

LibQual Survey
• Respondents were asked to provide three ratings for each Question
• Ratings range from 1(low) to 9 (high)• Minimum (where should this service level start)• Desired (where should this service level be)• Perceived (where is this service level now)
• Measuring the Gaps• Adequacy Mean (Perceived – Minimum)• Superiority Mean (Perceived – Desired)

2011 LibQual
• LibQual Lite, a shorter version of the survey with core and rotating questions
• ARL provides a Results Notebook (summaries) of survey responses and demographics
• K-State Libraries conducted full version of LibQual in 2007

Demographics
User Groups n %Undergraduates 1206 54.20%
Graduates 536 24.09%
Faculty 299 13.44%
Staff 153 6.88%
Library Staff 31 1.39%
Total 2225
Library that you use most oftenHale Library 1673 76.57%
Architecture Library 153 7.00%
Engineering Library 159 7.28%
Math/Physics 15 0.69%
Veterinary Medical Library 80 3.66%
Salina Library 39 1.78%
Other 66 3.02%
Total 2185
• For all analysis, we filtered out Library Staff.
• Undergrads were under-represented (74.92% of campus population)
• Majority of respondents were users of Hale Library
• “Other” library could be labs or library-like space on campus

Analysis Overview
• Data Analysis – Using averages• Standard Deviation• Central Tendency: Mean, Median and Mode• Graphs: frequency histogram, radar charts
• Reliability• Cronbach's Alpha
• Validity• Representativeness

Analysis Tools
• Graphs• Frequency graphs – shape of the data• Histograms – Is it normal?• Radar – how did we do (viewing all 3 dimensions)
• Reliability• Cronbach’s Alpha – measures internal consistency.
Helps to answer the question of ‘Should I trust the average?’
• Validity• Representative – Need to be careful to making
generalizations about Undergraduates, Business and Science/Math Disciplines

Ratings & Gaps
• Adequacy Means ratings measure the gap between the Perceived and Minimum ratings
• Superiority Means ratings measure the gap between the Perceived and the Desired ratings
• Large negative gaps could indicate problem areas
• Higher Desired ratings indicate areas that are important to users
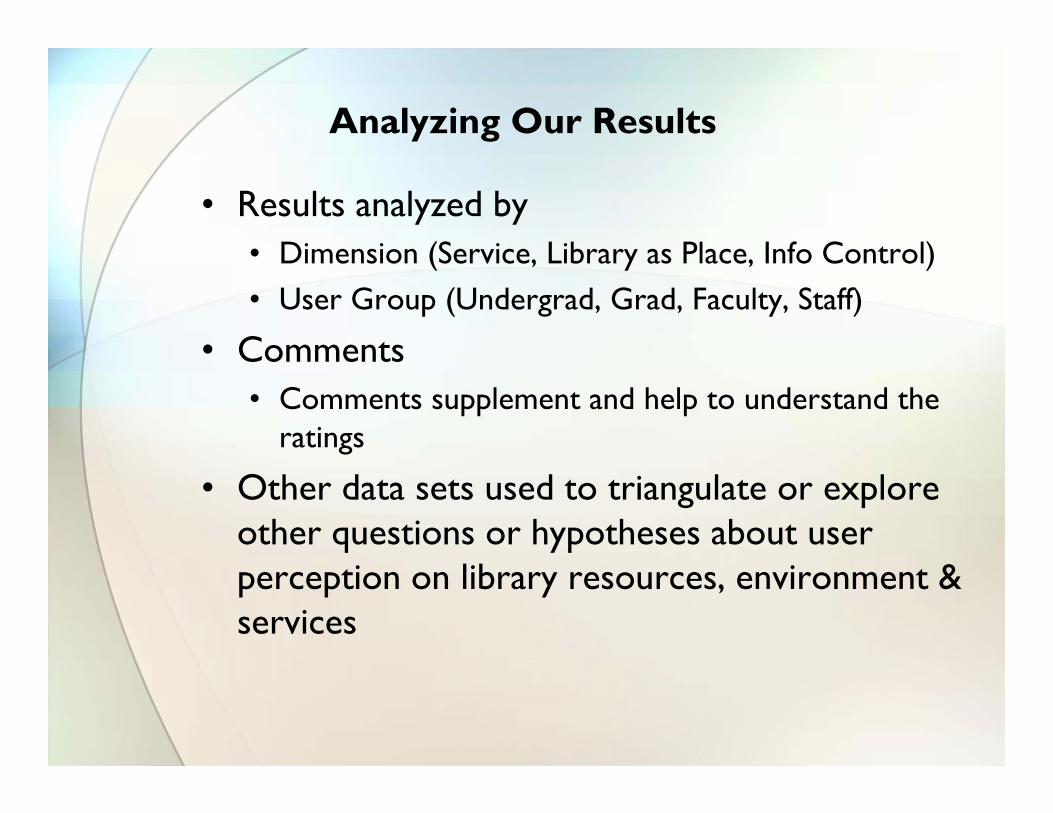
Analyzing Our Results
• Results analyzed by • Dimension (Service, Library as Place, Info Control)• User Group (Undergrad, Grad, Faculty, Staff)
• Comments• Comments supplement and help to understand the
ratings
• Other data sets used to triangulate or explore other questions or hypotheses about user perception on library resources, environment & services

• Blue bands are the Adequacy Gaps (shows where the service level starts)
• Yellow bands are Superiority Gaps. We want to close this gap.
• Green bands are where we exceeded the desired level
• Red bands are where we’re not meeting the minimum level

Perceived Above or Equal to Desired – where we weexceeded customer’s desired level
• LP05: Community space for group learning and group study (0.23)
Top 3 Desired (Desired Mean) – what customers identified they want the most
• IC-02: A library Web site enabling me to locate information on my own (8.06)
• IC-01: Making electronic resources accessible from my home or office (8.05)
• IC-05: Modern equipment that lets me easily access needed information (8.01)
Largest Gaps Between Perceived and Desired (Superiority Gap) – areas identified by customers to improve
• IC-02: A library Web site enabling me to locate information on my own (-0.99)
• IC-01: Making electronic resources accessible from my home or office (-0.78)
• IC-08: Print and/or electronic journal collections I require for my work (-0.73)
Top 3 Perceived (Perceived Mean) – customers identified we’re doing well
• AS-03: Employees who are consistently courteous (7.80) • AS-08: Willingness to help users (7.71) • AS-06: Employees who deal with users in a caring fashion
(7.67)
Overall Results

Analysis of DIMENSIONS
Largest Superiority gaps are for Information Control and Library as PlaceFACULTY AND GRADS• IC-2 A library Web site enabling me to locate
information on my own -1.68/-1.10• IC-8 Print and/or electronic journal collections I require
for my work -1.63/-1.20
UNDERGRADS• LP-02 Quiet space for individual activities -0.80• LP-01 Library space that inspire study and learning -0.80

Analysis of DIMENSIONS
What are we doing well?• Overall Lowest Superiority Gaps are for Affect
of Service• LP-5 Community space for group learning & group study (0.23)• AS-2 Giving users individual attention (-0.08)• AS-8 Willingness to help users (-0.09)• AS-4 Readiness to respond to users’ questions (-0.13)

Analysis of DIMENSIONS
Not meeting Users’ Minimums – 2 areas• Faculty have high Desired level re: Library
Resources. 2 Information Control questions are not meeting Faculty minimum levels• IC-8 Print and/or electronic journal collections I
require for my work (Fac) -0.63• IC-2 A library Web site enabling me to locate
information on my own (Fac) -0.26

Finding a balance
What does all of it mean?• We exceed users’ perception re: group space• Need to work on noise/quiet for individuals• Continue to provide high level of
service/resources/environment• Improve areas identified for improvement
• Overall, we’re very close to users’ desired level of service

Analysis For Undergraduates
What are we doing well?• LP-5 Community space for group learning & group study (0.11
- exceeding desired level)• AS-4 Readiness to respond to users’ questions (0.01 –
exceeding desired level)
What needs attention?• LP-2 Quiet space for individual activities (-0.85)• LP-1 Library space that inspires study and learning (-.80)
What are we doing (Library’s Plan of Action)?• Power (strips) needs in Great Room• More quiet space• Power/outlet/strips needs for laptops in Hale Library

Analysis For Graduate Students
What are we doing well?• LP-5 Community space for group learning and group study
(0.12 – exceeding desired level)• AS-3 Employees who are consistently courteous (-0.06)
What needs attention?• IC-8 Print and/or electronic journal collections I require for my
work (-1.20)• IC-2 A library Web site enabling me to locate information on
my own (-1.10)
What are we doing (Library’s Plan of Action)?• Create a Graduate Student Study space• We redesigning the library website

Analysis For Faculty
What are we doing well?• LP-5 Community space for group learning and group study
(0.95 – exceeding desired level)• LP-2 Quiet space for individual activities (0.70 – exceeding
desired level)
What needs attention?• IC-2 A library Web site enabling me to locate information on
my own (-1.68)• IC-8 Print and/or electronic journal collections I require to my
work (-1.63)
What are we doing (Library’s Plan of Action)?• Meet with faculty/departments to find out what resources we
don’t own that they need for their research

2007-2011 Overall Trend
• Overall, Users’ minimum and desired levels have decreased while their perceived level has increased.
• We improved by .37 to achieving their desired level
• Increase in survey respondents and comments

• Superiority Gap shows our progress to Desired (0.00)• Affect of Service .44• Information Control .39• Library as Place .24
• Adequacy Gap shows progress from minimum• Affect of Service .26• Information Control .38• Library as Place .23
Trend Charts

LibQual Comments
• Comments are sorted by categories• Single largest category was Staff&Service,
then General-Satisfied.• Facilities-Noise/Quiet is a big issue, mostly
negative. This is also an issue in the quantitative part of the survey.
• Comments will be further analyzed and coded for dimensions • Tone (positive, negative, neutral) • Causal or intervening conditions
• Comments were used to supplement and clarify quantitative results
LibQual Comments
Information Resources 274
Library Catalog 70
Subtotal 344
Facilities 349
Computers 50
Library Hours 46
Subtotal 445
Other Library Services 90
Staff&Service 220
Interlibrary Loan 93
Access/Circulation 59
Other Services 4
Subtotal 466
General 149
Type of User-Distance 33
Subtotal 182
Survey 18
total comments 1455

Peer Institutions Comparison
• The blue line of Superiority Gap chart is our target. The closer we are, the better.
• The black line is the ARL average. • The Adequacy Gap measures how far we
are from customer’s minimum level of service.
• We’re well above the customer’s minimum level. Our overall average is better than the ARL average.
• Some of these peer institutions were mentioned in K-State 2025
• Colorado State, Iowa State and Oregon State are our closest peers. NCSU has never conducted LibQual Survey. Oklahoma State was not included as it is their policy not to disseminate LibQual data.
• Years are included also because not all institutions conduct LibQual Survey annually

Next Steps
• Share findings/conclusions: Participants, LibQual Results Website & Summit (coming in Spring 2012)
• What is actionable? Which areas do we address? What’s the priority?
• QUESTIONS?