Embed Size (px)
Citation preview

Life Cycle Analysis of a Ceramic Three-Way Catalytic Converter
Elizabeth Lynn Belcastro
Thesis submitted to the faculty of the Virginia Polytechnic Institute and State University in partial fulfillment of the requirements for the degree of
Master of Science
In Materials Science and Engineering
David E. Clark, Chair Sean P. McGinnis Gary R. Pickrell
Michele M. Holbrook
04-23-12 Blacksburg, VA
Keywords: Catalytic converter, Life cycle analysis, Air emission,
Cordierite ceramic, and Passenger car
Copyright 2012, Elizabeth Belcastro

Life Cycle Analysis of a Ceramic Three-Way Catalytic Converter
Elizabeth Lynn Belcastro
ABSTRACT The life cycle analysis compares the environmental impacts of catalytic converters and the effects of not using these devices. To environmentally evaluate the catalytic converter, the emissions during extraction, processing, use of the product are considered. All relevant materials and energy supplies are evaluated for the catalytic converter. The goal of this life cycle is to compare the pollutants of a car with and without a catalytic converter. Pollutants examined are carbon monoxide (CO), carbon dioxide (CO2), hydrocarbons (HC), and nitrogen oxides (NOx). The main finding is that even considering materials and processing, a catalytic converter decreases the CO, HC and NOx pollutant emissions. The CO2 emissions are increased with a catalytic converter, but this increase is small relative to the overall CO2 emissions. The majority of catalytic converter pollutants are caused by the use phase, not extraction or processing. The life cycle analysis indicates that a catalytic converter decreases damage to human health by almost half, and the ecosystem quality damage is decreased by more than half. There is no damage to resources without a converter, as there are no materials or energy required; the damages with a converter are so small that they are not a significant factor. Overall, catalytic converters can be seen as worthwhile environmental products when considering short term effects like human health effects of smog, which are their design intent. If broader environmental perspectives that include climate change are considered, then the benefits depend on the weighting of these different environmental impacts.

iii
Acknowledgements
I would like to express my sincere gratitude to my advisor, Dr. David Clark. Throughout
this experience, he has been a great source of guidance and motivation. I would especially like
to thank him for being a constant motivator and pushing me to get my writing done. I would also
like to sincerely thank Dr. Sean McGinnis for his invaluable help with this life cycle analysis.
Without his help, this project would not be nearly as thorough or complete.
I would like to thank Ms. Michele Holbrook for her interest and guidance with this
project. I appreciate all of the time and help that you were able to give.
I would also like to thank Dr. Gary Pickrell and Ms. Diane Folz for their ideas and
assistance throughout this thesis. I am grateful for the time you both have contributed.
I would like to thank Moore Cadillac, especially Mr. Jerry Kerns for their knowledge and
donation of a catalytic converter.
Finally, I would like to thank my parents, Marc and Shawn Belcastro, because without
them, I would not have this opportunity. I am so very grateful to them for the love, support and
educational opportunities that they have provided for me throughout the years.

iv
Table of Contents
ACKNOWLEDGEMENTS iii
TABLE OF CONTENTS iv
LIST OF FIGURES vi
LIST OF TABLES vii
LIST OF EQUATIONS x
CHAPTER 1 – INTRODUCTION 1
1.1 – THE CATALYTIC CONVERTER 1
1.1.1 – EXHAUST POLLUTANTS 2
1.1.2 – ENVIRONMENTAL PROTECTION AGENCY
REGULATION HISTORY 3
1.1.3 – DESIGN AND MATERIALS 5
1.2 – LIFE CYCLE ANALYSIS 11
1.2.1 – LIFE CYCLE INVENTORY 12
1.2.2 – GOAL 13
1.2.3 – TASKS 13
1.2.4 – SCOPE 14
1.2.5 – ASSUMPTIONS 16
CHAPTER 2 – LIFE CYCLE ANALYSIS MODEL 18
2.1 – ASSESSMENT METHODOLOGIES 18
2.2 – MATERIALS 20
2.3 – PROCESSING 27
2.4 – USAGE 33

v
2.5 – DISPOSAL 36
CHAPTER 3 – RESULTS OF ANALYSIS 39
3.1 – COMPARISON OF KEY EMISSIONS 39
3.1.1 – SENSITIVITY ANALYSIS 42
3.2 – ECO-INDICATOR 99 (H) 45
3.3 – CUMULATIVE ENERGY DEMAND 48
CHAPTER 4 – DISCUSSION OF ANALYSIS RESULTS 49
4.1 – KEY EMISSIONS 49
4.1.1 – SENSITIVITY ANALYSIS 52
4.2 – ECO-INDICATOR 99 (H) 54
4.3 – CUMULATIVE ENERGY DEMAND 55
CHAPTER 5 – CONCLUSIONS 57
CHAPTER 6 – FUTURE WORK 58
REFERENCES 59
APPENDIX A: Calculations 63
A.l: Cordierite composition work 63
A.2: Washcoat mass calculation 70
A.3: Vehicle emission calculations 71
A.4: Microwave firing calculations 73
APPENDIX B: Emission tables 75
vi
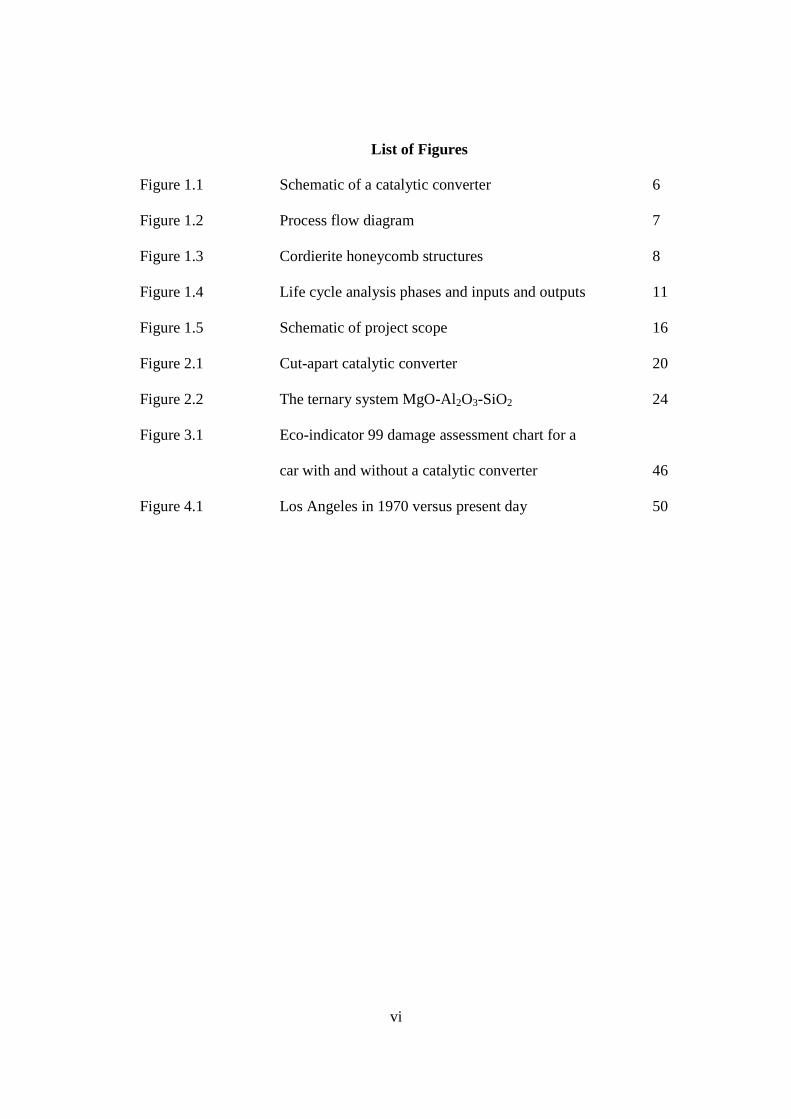
List of Figures
Figure 1.1 Schematic of a catalytic converter 6
Figure 1.2 Process flow diagram 7
Figure 1.3 Cordierite honeycomb structures 8
Figure 1.4 Life cycle analysis phases and inputs and outputs 11
Figure 1.5 Schematic of project scope 16
Figure 2.1 Cut-apart catalytic converter 20
Figure 2.2 The ternary system MgO-Al2O3-SiO2 24
Figure 3.1 Eco-indicator 99 damage assessment chart for a
car with and without a catalytic converter 46
Figure 4.1 Los Angeles in 1970 versus present day 50

vii
List of Tables
Table 1.1 American emission standards (gram/mile) set by
federal legislation 4
Table 2.1 Materials weighed from sample catalytic converter 21
Table 2.2 Extruded ceramic cordierite batch composition 21
Table 2.3 Masses for all inputs and outputs for the cordierite
substrate 23
Table 2.4 Materials used in a catalytic converter 27
Table 2.5 Electricity fuel mix for southwest Virginia per kWh 28
Table 2.6 Energy consumption data for the processing of
magnesia refractory bricks 29
Table 2.7 Microwave energy savings potential in ceramics
manufacturing 30
Table 2.8 Energy data entered into SimaPro for the processing
phase 32
Table 2.9 Average passenger car emissions with and without a
catalytic converter 34
Table 2.10 Converted emissions for an average passenger car 34
Table 2.11 Vehicle emissions for one functional unit 36
Table 2.12 Processing versus recycling energies for type
409 stainless steel 37
Table 2.13 Processing versus recycling energies for platinum
and rhodium 38
viii
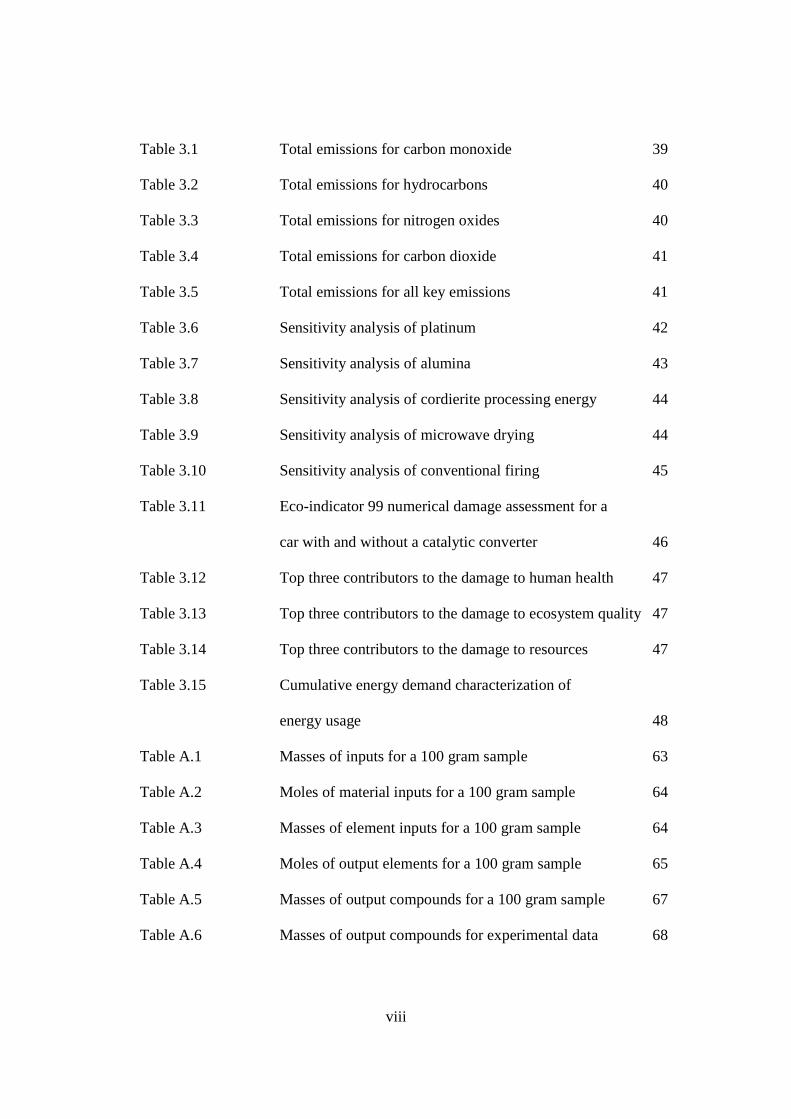
Table 3.1 Total emissions for carbon monoxide 39
Table 3.2 Total emissions for hydrocarbons 40
Table 3.3 Total emissions for nitrogen oxides 40
Table 3.4 Total emissions for carbon dioxide 41
Table 3.5 Total emissions for all key emissions 41
Table 3.6 Sensitivity analysis of platinum 42
Table 3.7 Sensitivity analysis of alumina 43
Table 3.8 Sensitivity analysis of cordierite processing energy 44
Table 3.9 Sensitivity analysis of microwave drying 44
Table 3.10 Sensitivity analysis of conventional firing 45
Table 3.11 Eco-indicator 99 numerical damage assessment for a
car with and without a catalytic converter 46
Table 3.12 Top three contributors to the damage to human health 47
Table 3.13 Top three contributors to the damage to ecosystem quality 47
Table 3.14 Top three contributors to the damage to resources 47
Table 3.15 Cumulative energy demand characterization of
energy usage 48
Table A.1 Masses of inputs for a 100 gram sample 63
Table A.2 Moles of material inputs for a 100 gram sample 64
Table A.3 Masses of element inputs for a 100 gram sample 64
Table A.4 Moles of output elements for a 100 gram sample 65
Table A.5 Masses of output compounds for a 100 gram sample 67
Table A.6 Masses of output compounds for experimental data 68

ix
Table A.7 Moles of output compounds for experimental data 68
Table A.8 Masses of input compounds for experimental data 69
Table A.9 Vehicle emissions 71
Table A.10 Carbon dioxide emissions due to gasoline 71
Table A.11 Carbon dioxide emissions 72
Table A.12 Pollutant emission calculations 72
Table B.1 Emission Totals 75

x
List of Equations
Eqn. 1.1 2
Eqn. 1.2 2
Eqn. 1.3 9
Eqn. 1.4 9
Eqn. 1.5 9
Eqn. 1.6 10
Eqn. 1.7 10
Eqn. 2.1 22
Eqn. 2.2 22
Eqn. 2.3 31
Eqn. 2.4 31
Eqn. 2.5 31
Eqn. 2.6 35
Eqn. 2.7 35
Eqn. 2.8 35
Eqn. A.1 63
Eqn. A.2 65
Eqn. A.3 66
Eqn. A.4 66
Eqn. A.5 66
Eqn. A.6 66
Eqn. A.7 67

xi
Eqn. A.8 67
Eqn. A.9 69
Eqn. A.10 69
Eqn. A.11 73
Eqn. A.12 73
Eqn. A.13 73
1
1.0 Introduction
Air pollution is a very important topic in current society as it affects the quality of human
life and the environment. Any substance that is introduced into the atmosphere that has
damaging effects on the environment and living species is considered air pollution [1]. The
sources of air pollution include, but are not limited to, transportation, power plants, and human
activities that involve the burning of fossil fuels; an example of a human activity that causes air
pollution is heating and cooling a home or workplace [1]. The emissions created by an
individual vehicle are generally low, compared to many other pollutant sources; however,
emissions from millions of vehicles add up. The personal vehicle is the single greatest
contributor to air pollution, by mass, in the United States [2].
1.1 The Catalytic Converter
In order to move a car, power is generated in the engine by burning fuel. The combustion
of fuel creates emissions. Gasoline, which is the fuel source for 98 percent of passenger cars, is
a mixture of hydrocarbons (HC) [3]. These are compounds that contain hydrogen and carbon
atoms. In a “perfect” engine, all of the hydrogen and carbon in the fuel would be converted to
water vapor and carbon dioxide, respectively, by combustion with the oxygen from the air. The
nitrogen from the air would not be affected in the combustion process [2]. This can be seen in
Equation 1.1 below. However, engines are not “perfect”, and the combustion process creates
other chemical byproducts which contribute to air pollution. This can be seen in Equation 1.2
below [Environmental Protection Agency, EPA National Vehicle and Fuel Emissions Laboratory. (n.d.).
Automobile emissions: An overview (EPA 400-F-92-007). Retrieved from Office of Mobile Sources website:
http://www.epa.gov/otaq/consumer/05-autos.pdf]. (Used under fair use, 2012).

2
“Perfect” Engine: (1.1) Fuel (hydrocarbons) + Air (O2 and N2) → Carbon Dioxide (CO2) + Water Vapor (H2O) + Unchanged Nitrogen (N2) Typical Engine: (1.2) Fuel (hydrocarbons) + Air (O2 and N2) → Unburned Hydrocarbons (gases and solid particulate matter) + Carbon Dioxide (CO2) + Water Vapor (H2O) + Nitrogen Oxides (NOx) + Carbon Monoxide (CO)
1.1.1 Exhaust pollutants
When fuel molecules do not burn, or partially burn during the combustion process,
hydrocarbon emissions are created [2]. Reacting in the presence of NOx and sunlight,
hydrocarbons form ground-level ozone (O3). A major contributor to smog, ozone is the most
widespread and hard to control urban air pollution problem. It can be an eye irritant, cause lung
damage, and aggravate respiratory problems. Hydrocarbons themselves can be toxic and
potentially carcinogenic. Benzene (C6H6) is an example of a hazardous hydrocarbon. This
pollutant can prevent proper production of red blood cells and the loss of white blood cells [4].
Toluene (C7H8) is another common hydrocarbon emission that can cause asthma [5].
Due to high pressures and temperatures occurring in the combustion process, oxygen and
nitrogen react to form various nitrogen oxides [2]. NOx contributes to the formation of ozone
and acid rain. Ozone is the primary component of smog, and therefore NOx creates similar
impacts to hydrocarbons. Nitrogen oxides are potentially toxic to plants, as they can reduce
growth and damage leaves [6]. These pollutants are also known to irritate lungs and cause
respiratory infections.
Carbon monoxide is created when carbon only partially oxidizes [2]. CO is dangerous to
health as it decreases the flow of oxygen in the bloodstream. It can impair several sites within

3
the body, but has the greatest effect on the organs with the highest oxygen requirements (brain,
heart, etc) [7].
Carbon dioxide is the largest emission by mass from both perfect and real engines.
Historically, it has not been considered an environmental impact and there are currently no
emission standards for it. However, in the past few decades, CO2 has been viewed as a greater
environmental concern. While CO2 is not a short term threat to human and environmental
health, it is a greenhouse gas. This means it traps the heat from the earth and is a contributor to
global warming potential [2].
1.1.2 Environmental Protection Agency Regulation History
The Environmental Protection Agency (EPA) established the Clean Air Act, which was
first enacted in 1970, to set vehicle air emission standards throughout the years [2,3]. Table 1.1
below provides the emission standards for a light passenger car from 1968 to 1994. The
standards set in 1994 are the current emission standards for an individual light passenger car.
The values are given in grams per mile. These values are different for trucks and sport utility
vehicles.

4
Table 1.1: American emission standards (gram/mile) set by federal legislation [Degobert, P.
(1995). Automobiles and pollution. (2 ed., pp. 124-129). Warrendale, PA: Society of Automotive Engineers, Inc.].
(Used under fair use, 2012).
Year
Carbon
monoxide Hydrocarbons
Nitrogen
oxides
Light Passenger Cars
1968-69 51 6.3 -
1970-71 34 4.1 -
1972 28 3.0 -
1973-74 28 3.0 3.1
1975-76 15 1.5 3.1
1977-79 15 1.5 2.0
1980 7.0 0.41 2.0
1983 3.4 0.41 1.0
1994 3.4 0.25 0.4
The Clean Air Act of 1970 set strict emission regulations that would be enforced starting
in 1975 [2]. The emission regulations can be seen in Table 1.1 above. From 1968 to 1972, the
nitrogen oxide emissions were not measured, and are therefore represented by a dash. From
1970 to 1974, car manufacturers attempted to decrease CO and HC emissions; however, despite
these attempts to meet the regulations by adjusting the engine alone, the catalytic converter was
introduced in order to reach the standards. The first generation was known as two-way catalytic
converters because they converted hydrocarbons and carbon monoxide into water vapor and
carbon dioxide.
The introduction of the catalytic converter also indirectly decreased ambient lead levels
[2]. Because the catalysts in catalytic converters are poisoned and inactivated by lead, unleaded

5
gasoline was widely introduced across the United States. This helped to lessen human health and
environmental concerns due to lead pollution. Once a human ingests lead, it distributes
throughout the body, in the blood, and accumulates in the bones [9]. The most common health
effects from lead are neurological effects in children and cardiovascular effects in adults, such as
high blood pressure and heart disease. In the environment lead accumulates in soils and
sediments. Ecosystems near point sources of lead can have adverse effects, such as losses in
biodiversity, changes in community composition, decreases in plant and animal growth and
reproduction rates, and neurological effects in vertebrates [9].
In 1977, the Clean Air Act was amended to more strictly regulate emissions [10]. As per
the request of automakers, the standards were delayed until 1980 and 1981. The emission
regulations for the amendment can also be seen in Table 1.1 above. The new HC and CO
standard was put into effect in 1980. A new standard to regulate NOx also went into effect in
1981; this can be seen in Table 1.1 by the year 1983. The second generation technology was
known as the three-way catalytic converter because it managed all three primary vehicle
emissions (HC, CO and NOx).
1.1.3 Design and Materials
Figure 1.1 below depicts two ceramic monoliths, which are the key to the catalytic
converter; the first monolith contains the reduction catalyst [11]. The second monolith contains
the oxidation catalyst. A two-way converter only employed the second monolith, while both
make up the three-way converter. The Lambda probe was another improvement to the catalytic
converter that came about with the three-way converter [11]. A control system monitors the
exhaust stream by the way of the oxygen sensor, the Lambda probe. The system controls the

6
fuel injection system, which allows the engine to run as efficiently as possible while producing
the least emissions.
Figure 1.1: Schematic of a catalytic converter [Motor vehicle emission controls: Technologies. (n.d.).
Retrieved from http://www.air-quality.org.uk/25.php]. (Used under fair use, 2012).
Figure 1.2 below provides the typical process flow for the creation of a catalytic
converter. In the production, the catalytic converter is processed in three phases. The boxes
outlined in red indicate the processes that will be considered in scope for this analysis.

7
Figure 1.2: Process flow diagram
Fired Inspection
Packaging
Transportation of Product
Dry Blend
Extrusion
Wet Cutting
Microwave Drying
Green Cutting
Firing
Ceramic Material Acquisition
Precious Metal Acquisition
Dip honeycomb in washcoat mix
Sinter in contact with air
Dip honeycomb in catalyst mix
Dry and sinter in contact with
air
Transportation of Product
Stainless Steel Acquisition
Deep Drawing of Metal Casing
Assembly of Parts
Inspection
Inspection
Packaging
Transportation of Product
Inspection
Inspection
Packaging

8
The ceramic component of the catalytic converter is formed from a honeycomb structure
made of extruded cordierite, as seen in Figure 1.3 below [12]. Cordierite (2MgO-2Al2O3-5SiO2)
is appropriate for application in automotive exhaust because it has a relatively low thermal
expansion, which is needed for thermal shock resistance. The coefficients of thermal expansion
generally fall in the range of 0.7 – 1.0 · 106 per degrees Celsius from 25° – 1000° C [12]. With a
melting point of 1500 – 1700 °C, this material is also a refractory; this allows cordierite to
operate at high temperatures [12, 13]. Cordierite is inert to the catalysts and coatings that are
used. This material can also be engineered to provide other features, such as, open porosity and
good mechanical strength [12]. The tensile strength and fracture toughness of cordierite is 48 –
53 MPa and 2 – 3 MPa·m0.5, respectively [13].
Figure 1.3: Cordierite honeycomb structures [Lachman, I., Bagley, R., & Lewis, R. (1981). Thermal expansion of extruded cordierite ceramics. Ceramic Bulletin, 60(2), 202-205.]. (Used under fair use, 2012).
Each ceramic monolith is coated with a washcoat and a catalyst coating made with a
precious metal. The washcoat is made of alumina and/or silica and a rare earth metal oxide such
as cerium oxide [14]. The cerium oxide can release or capture oxygen in the exhaust [15]. It can
also work with the other catalytic materials to aid in emission conversion. It is applied in order

9
to coat the smooth ceramic substrate walls. The washcoat helps to provide a much larger surface
area by forming a rough and irregular surface. The greater surface area allows for a larger
number of sites for the precious metals to coat to [14]. Precious metals are used for the catalytic
coating; platinum and/or palladium are used for the oxidizing catalyst, and rhodium is used for
the reducing catalyst. The platinum and/or palladium are responsible for dissociating the
hydrocarbons and carbon monoxide molecules [16]. When the hot gases encounter the platinum
or palladium particles, they react to form water and carbon dioxide molecules. The platinum
and/or palladium molecules lower the energy barrier that slows down the conversion of the
emissions.
Surrounding the coated ceramic monoliths is an expanding mat. This mat insulates and
protects the ceramic monoliths. Finally, the entire structure is encased by a stainless steel
housing [11]. Type 409 ferritic stainless steel is commonly used for this structure because it
provides corrosion and oxidation resistance with ease of fabrication [17, 18].
The two-way converter is also known as an oxidation catalyst [18]. The metal catalyst
(platinum and/or palladium and rhodium) is used to super heat the HC and CO gases. The heat
converts the HC and CO gases by oxidizing them with oxygen. Equations 1.3 and 1.4 below
give the oxidation equations for CO and HC gases. Since there are various forms of
hydrocarbons, Equation 1.5 below gives the oxidation equation for benzene (C6H6), which is a
very common form of hydrocarbon [19].
2�� � �� → 2��� (1.3)
4�� � 5�� → 2�� � 4���� (1.4)
2� � 15�� → 12��� � 6�� (1.5)

10
The three-way catalytic converter is also known as the reduction-oxidation converter
[11]. Since catalytic converter technology, up until this point, did not regulate NOx, an
additional reduction catalyst was created; this was used with the oxidation catalyst in the two-
way converter. The reduction catalyst uses the precious metals to help reduce NOx emissions.
Rhodium is responsible for dissociating the nitrogen oxide molecules. In the same manner as
platinum and palladium, when the hot gas encounters the rhodium molecules, the nitrogen and
oxygen atoms separate on the metal’s surface. These atoms recombine into nitrogen and oxygen
molecules [16]. Equations 1.6 and 1.7 below give possible reduction equations of NOx.
2�� → �� � �� (1.6)
2��� → �� � 2�� (1.7)
In the creation of a catalytic converter, many steps must be taken, including raw material
gathering and various forms of processing. After the converter is created, it goes through a
period of use, in which pollutants are converted to less harmful substances. Once the converter is
no longer in use, it is disposed of. Parts of the catalytic converter can be recycled, such as the
metals, and the other parts are landfilled, such as the ceramic monoliths. In each of these steps,
materials, energies and wastes are necessary. While the use and recycling phases offer positive
environmental impacts, the raw materials, processing and disposal steps create negative impacts.
In order to determine the environmental impact of the catalytic converter over its whole life
cycle, a life cycle analysis (LCA) is used. This analysis will compare the positive to the negative
environmental impacts of a catalytic converter over the whole life cycle in order to better assess
this product from an environmental perspective.

11
1.2 Life Cycle Analysis
Life cycle analysis (LCA) is a method of assessing the environmental impact of a product
over its lifetime [20]. The lifetime of most products typically includes four phases: extraction of
raw materials, manufacturing/processing of the raw materials, use and disposal of the product.
Environmental impacts from each phase can be estimated to provide an overall impact of the
product’s life. This evaluation provides a more accurate depiction of the environmental trade-
offs that come with the selection and design of a product. Figure 1.4 below depicts the phases
and the inputs and outputs that are associated with an LCA [20]. The inputs are the raw
materials and energies that are used in the various life cycle phases. The outputs are any
emissions or byproducts created from any of the phases. The system boundary is the box around
the life cycle phases. It defines the limitations of analysis, including what will and will not be
considered [20].
Figure 1.4: Life cycle analysis phases and inputs and outputs [Curran, M. A. U.S. Environmental
Protection Agency, Office of Research and Development. (2006). Life cycle assessment: Principles and practice
(EPA/600/R-06/060). Reston: Scientific Applications International Corporation (SAIC).]. (Used under fair use,
2012).
Emissions to Air
Emissions to Water
Byproducts
Other
Manufacture
Use
Disposal
Extraction
Energy
Raw Materials

12
1.2.1 Life Cycle Inventory
A life cycle inventory (LCI) is a collection of quantitative inputs and outputs for the
entire life cycle of a product. This step of the LCA is basically an inventory of all relevant
energies, materials, emissions and wastes [20]. An LCI is an important part of an LCA because
it provides the evaluation basis for comparing environmental impacts or potential improvements.
The LCI can help to compare products or processes while considering environmental factors
during material selection and design. The results of an LCI provide a quantitative list of
pollutants released to the environment as well as the total amount of energy and raw materials
consumed. There are four basic steps of a life cycle inventory defined by the EPA [20]. In the
first step of an LCI, a flow diagram of the product being evaluated is developed. This diagram
will define the inputs and outputs in the system. The system is defined by the system
boundaries. The more complex the flow diagram, the more accurate the results will be;
conversely, the more complex the flow diagram, the more time and resources will be required.
The second step of an LCI is to develop a data collection plan and acquire the necessary data.
This step ensures that the data collection is planned, organized and of the quality and accuracy
desired. The collection must include any and all data required for the entire LCA. It should
correspond to the flow diagram developed. The third step of the LCA is the impact assessment
(LCIA) which translates LCI input and outputs to specific environmental impacts based on the
best available science. The final step of an LCIA is the evaluation and documentation of the LCI
results. The explanation of the LCA should explicitly define the system, assumptions, inputs,
and resulting outputs.
13
1.2.2 Goal
The goal of the thesis is to gather and assess existing data that will be used to develop a
model of the life cycle of a ceramic three-way catalytic converter. More specifically, the goal is
to compare the embodied energy and production of pollutants developed during extraction,
manufacturing and disposal to prevention of pollutants during use. The research will compare
the pollutants phase by phase; for example, the pollutants of materials can be compared to those
of manufacturing to show which phase contributes more to the overall pollution. This
comparison can also provide insight on which phase could use the most improving if trying to
decrease the pollution to the environment. The same can be done within each phase to show
which portion or step of the phase can use the most improving.
1.2.3 Tasks
In order to accomplish the goal stated above, the following key tasks that must be
completed:
1. Determine and set a boundary for the research. This boundary will set what will
and what will not be included in the analysis.
2. Collect information on the materials and processing required to create a catalytic
converter. Information is also needed on the emissions during use for both a car
with and without a catalytic converter.
3. Create and develop two life cycle models; one for the entire life of a catalytic
converter, and one for the use phase of a car without a catalytic converter.
4. Run model and analyze results to determine the environmental impact of a car
with a catalytic converter compared to a car without a catalytic converter.

14
The first life cycle model is a car without a catalytic converter. In this model, only the
emissions during the use phase will be analyzed. The second life cycle model is a car with a
catalytic converter. This model will analyze the extraction and processing of raw materials,
manufacturing of the catalytic converter and the emissions during the use phase. The car itself is
not included in this analysis since all of its environmental impacts are the same except for the
catalytic converter and emissions.
1.2.4 Scope
The scope of this project is defined by the function of a catalytic converter, the functional
unit, and the system boundaries. The function of a catalytic converter is to convert engine
exhaust from hazardous to less hazardous chemicals. The functional unit, which serves as the
basis of comparison, is the average lifetime of a catalytic converter for a typical light passenger
car. The guaranteed service lifetime of this catalytic converter is 80,000 miles [21]. A specific
vehicle was chosen in the research for ease and accuracy of data; however, this methodology
could be applied to any vehicle to obtain similar results.
The system boundaries include the inputs and outputs of energy, materials, and
transportation for all phases of the LCI. The emissions that will be primarily analyzed in this
study are carbon monoxide, carbon dioxide, nitrogen oxides, and hydrocarbons. The system
boundaries exclude all capital goods (such as the existing manufacturing equipment), human
labor and incidentals. These categories are excluded because over time and divided between all
of the components created, their effect becomes negligible. The Society of Environmental
Toxicology and Chemistry (SETAC) guidelines for life cycle assessment state that inputs of a
process do not need to be included in the LCI if (i) they are less than 1% of the total mass of the

15
processed materials or product; (ii) they do not contribute significantly to a toxic emissions; and
(iii) they do not have a significant associated energy consumption [22]. Similarly, the organic
binders used during ceramic processing are out of scope. The binders are not included because
they are highly proprietary and likely fall within the SETAC guidelines. To include them would
require unreliable information and estimation, therefore compromising the integrity of this
report. The oxygen sensor is not considered a part of the catalytic converter. While it functions
in conjunction with a catalytic converter, it is not an integral part of the component, and is
manufactured separately. The energy necessary to weld the stainless steel canister is negligible.
Compared to the rest of processing, there is very little energy used during welding since the area
welded is very small. The plastic used during packaging is negligible. Only a small amount of
plastic is used during packaging for an entire box, but divided between the multiple components,
even less is required. Fuel mileage and car performance will also be excluded from the research,
due to the lack of impact the catalytic converter has on them (Dr. Al Kornhauser, Virginia Tech,
personal communication) [23]. The expanding mat that lies between the ceramic monolith and
the stainless steel casing will be left out of scope. The composition of the mat is proprietary, and
therefore any estimation would also be inaccurate. During manufacturing, the processing
energies associated with applying the metal washcoat and catalysts are not included in this
analysis. The methodology and energies associated with these processing steps are proprietary
and no acceptable estimates could be found in the literature. The plastic packaging materials and
the paper filler are left out of scope as they have very small masses compared to the cardboard
box, and can be considered insignificant. Finally, anything that falls into the aforementioned
categories is depicted in the scope and boundary figure below. Everything in the outside box is
excluded in the scope of the project, while the inner box is included in the study.

16
Figure 1.5: Schematic of project scope
1.2.5 Assumptions
It is important to list any and all assumptions for an LCA since they strongly influence
the results. This helps to make processes and decisions explicit to the reader. Below is a list of
the assumptions used in this life cycle.
• The catalytic converter is manufactured in southwest Virginia. To allow for accurate
production energy mix, all of the electricity entered into SimaPro will use the southwest
Virginia energy mix provided by American Electric Power.
• The catalytic converter is manufactured in three phases at different manufacturers
(ceramic, catalyst coating, and steel housing).
• The cordierite processing energies are the average of the magnesia brick processing
energies. This assumption will be tested with sensitivity analysis by taking 50% and 75%
of the average drying and firing energies. Magnesia is fired at higher temperatures than
cordierite. Magnesia brick is fired between 1500°C – 1750°C, while cordierite is usually
Catalytic Converter
In Scope – Life Cycle Inventory
Raw materials for metal catalyst
Raw materials and processing for stainless steel canister
Ceramic raw materials and processing
Energy
Emissions
Capital Goods
Incidentals
Human Labor
Fuel Mileage
Car Performance
Expanding Mat
Out of Scope
Processing for Metal Catalyst
Organic binders
Packaging materials other than cardboard Oxygen sensor
Welding energy

17
fired around 1400°C [12, 24]. This suggests that MgO uses greater energy; therefore the
analysis will look at decreasing the energy.
• Platinum is solely used for the oxidation catalyst. The use of palladium or a mix of the
two metals will be tested with a sensitivity analysis.
• The precious metal coating is a mix of platinum, rhodium and lanthanum oxide, and it
will be used on both substrates according to Patent Number 4,624,941 [25].
• Alumina is solely used as the bulk of the washcoat. Silica and a mix of the two materials
will be tested with a sensitivity analysis.
• Microwave drying is used to draw water out of the wet extruded ceramic (confidential,
ceramic manufacturing company, verbal communication). This assumption will be tested
with a sensitivity analysis of using conventional drying instead.
• Conventional firing is used (confidential, ceramic manufacturing company, verbal
communication). Microwave firing will be tested with a sensitivity analysis.
• Twelve ceramic substrates are placed in a cardboard box for shipping (at the ceramic and
catalyst coating facilities) (confidential, ceramic manufacturing company, verbal
communication).
• One catalytic converter is placed in a cardboard box for shipping (at the steel housing
facility) (Matthew Bentel, Harrisonburg Honda, verbal communication).
• The converted nitrogen, oxygen and water vapor do not pose a risk to the environment
compared to carbon dioxide, carbon monoxide, hydrocarbons and nitrogen oxides and are
therefore not modeled as emissions.
• The catalytic converter is not broken or does not malfunction over time.
18
2.0 Life Cycle Analysis Method
In order to complete the life cycle analysis, a collection of all materials, energies,
emissions and other data is required. The life cycle is conducted using the software program
SimaPro 7.3. SimaPro, developed by PRé Consultants, is a leading life cycle analysis software
[26]. This program offers standardization but also flexibility when modeling or designing.
SimaPro is used for various applications, including:
• Carbon footprint calculation
• Product design and eco-design
• Environmental Product Declarations (EPD)
• Environmental impact of products or services
• Environmental reporting (GRI)
• Determining of key performance indicators
This thesis will utilize many of these features in order to model and compare passenger cars with
and without a catalytic converter.
2.1 Assessment Methodologies
Within SimaPro, two analysis methodologies will be used: Eco-indicator 99 (hierarchist)
and Cumulative Energy Demand. Eco-indicator 99 is a commonly used European model with a
damage-oriented approach [27]. Eco-indicator 99 assesses the type of damage caused by various
impact categories. The damage points are split up into three categories: Damage to Human
Health, Damage to Ecosystem Quality, and Damage to Resources. Damage to Human Health is
the number of years life lost and the number of years lived disabled. The combination of these
two numbers is also known as Disability Adjusted Life Years (DALYs). Damage to Ecosystem
19
Quality is the loss of species over a certain time, in a certain area. Damage to Resources is the
surplus energy required for future extractions of minerals and fossil fuels [27]. The hierarchist
perspective of Eco-indicator 99 is used in this analysis. This version is moderate, assuming no
extremes. The assumptions of this version include:
• Long-term time perspective
• Damages are avoidable by good management
• Fossil fuels are not substituted easily
• Age is not a factor in determining the Damage to Human Health (or DALYs)
The hierarchist perspective is the default method of Eco-indicator 99. In general, the
assumptions made in this perspective are scientifically and politically accepted [27].
Cumulative Energy Demand is a single issue analysis methodology that combines all of
the energy used throughout the life cycle of a product. Single issue means that the analysis only
evaluates one subject, such as energy in this case. Cumulative Energy Demand divides energy
resources into five impact categories [27]:
1. Non-renewable, fossil
2. Non-renewable, nuclear
3. Renewable, biomass
4. Renewable, wind, solar, geothermal
5. Renewable, water
In order to assess the relative contribution to the overall environmental impact based on
assumptions, such as the precious metal used for the catalyst, sensitivity analysis will be used.
This technique tests the original assumption by changing it to another possibility and
recalculating the entire LCA. Sensitivity analysis determines how large of an effect a change to

20
an input can have on the output [27]. The sensitivity analysis tests will analyze the emissions
required during extraction and/or manufacture. This method will not assess the monetary cost of
a material or product.
2.2 Materials
Figure 2.1 below is a picture of a disassembled sample catalytic converter from a typical
passenger car under investigation in this LCA.
Figure 2.1: Cut-apart catalytic converter. (Photo by author, 2012).
The ceramic substrates are the three pieces at the top of the picture while the stainless
steel casing is the four pieces at the bottom of the picture. Unlike many catalytic converters, this
sample has two smaller reduction catalysts instead one large one, like the oxidation catalyst. The
flow of pollutants goes from left to right; this can be seen by how much dirtier the reduction
catalysts are versus the oxidation catalyst. Table 2.1 gives the weighed masses of the major
components seen in Figure 2.1.
21
Table 2.1: Materials weighed from sample catalytic converter
Component Mass (grams)
Ceramic substrates 832.3
Stainless steel casing 3865
As explained in the introduction, there are many materials that are necessary for the
creation of a catalytic converter. There are also auxiliary materials, such as cardboard and
plastic, used for the transportation of parts.
The exact mass of the ceramic substrate is dependent on the manufacturer, car model and
engine. The total weight of the test ceramic substrates is 832.3 grams. Using the following
weight percentages in Table 2.2, found from Thermal Expansion of Extruded Cordierite
Ceramics by Lachman, Bagley, & Lewis, the amount of each material was found, and entered
into the SimaPro model.
Table 2.2: Extruded ceramic cordierite batch composition [Lachman, I., Bagley, R., & Lewis, R. (1981). Thermal expansion of extruded cordierite ceramics. Ceramic Bulletin, 60(2), 202-205.]. (Used under fair use,
2012).
Raw Material Amount in composition (wt%)
Kaolin, Al 2(Si2O5)(OH)4 21.74
Talc, raw, Mg3(Si2O5)2(OH)2 39.24
Alumina, Al 2O3 11.23
Aluminum hydroxide, Al(OH)3 17.80
Silica, SiO2 9.99
Totals 100.0
These raw materials will form into cordierite after processing. Equation 2.1 below
provides the transformation of raw materials into cordierite

22
Al2(Si2O5)(OH)4 + Mg3(Si2O5)2(OH)2 + Al2O3 + Al(OH)3 + SiO2 → Cordierite + Water ↑ (2.1)
As seen from this equation, cordierite is a combination of alumina (Al2O3), magnesia
(MgO), and silica (SiO2); the water is dried out during multiple processes. The energy for the
water is accounted for in the materials in the SimaPro model. For ease of calculation, it is
assumed that there is a 100 gram sample. The results will be scaled up to correlate to the actual
data. The balanced form of Equation 2.1 for a 100 gram sample can be seen in Equation 2.2
below. The calculations and work for these numbers can be seen in Appendix A.1 on page 61.
0.08 Al2(Si2O5)(OH)4 + 0.10 Mg3(Si2O5)2(OH)2 + 0.11 Al2O3 + 0.23 Al(OH)3 + 0.17 SiO2 →
0.31 Al2O3 + 0.75 SiO2 + 0.31 MgO + 0.61 H2O (2.2)
The output moles of each compound can be converted into output masses by multiplying these
moles by the molecular weight of each compound. This will determine the masses of cordierite
and water for the 100 gram sample. The mass of cordierite for the sample in the experiment was
determined to be 832.3 grams. The masses of alumina, magnesia, silica and water can be found
by scaling the 100 gram sample to the experimental data. Once the output data is known for the
experimental data, the input masses can be determined. The work all of these numbers can also
be seen in Appendix A.1 on page 61. Table 2.3 below gives the input and output masses for the
experimental data. The input and output mass totals are slightly different due to rounding
throughout the calculation. The input masses for kaolin, talc, alumina, aluminum hydroxide and
silica are entered into SimaPro.

23
Table 2.3: Masses for all inputs and outputs for the cordierite substrate
Material Mass (grams)
Inputs
Kaolin 194
Talc 357
Alumina 102
Aluminum Hydroxide 172
Silica 96
Outputs
Alumina 300
Silica 416
Magnesia 117
Water 103
The output masses can be used to determine the placement of this composition on a
ternary phase diagram. Figure 2.2 below gives the ternary system for MgO- Al2O3- SiO2 [28].
In this system, there is a cordierite phase section. In this phase there are varying compositions of
cordierite that are stable. The composition of cordierite used in this analysis, see Table 2.2 for
the batch mixture, can be pinpointed on this system. The black ‘o’ indicates the location of this
composition of cordierite. Found by using the output weight percent of silica, magnesia and
alumina, this location is the placement of 2 Al2O3 – 2 MgO – 5 SiO2. There is a total of
approximately 833 grams of cordierite in the analysis sample. From Table 2.3, the cordierite
composition is about 50 weight percent silica; therefore, the placement is determined by going
five arrow notches down from the silica peak. The composition is about 36 weight percent
alumina; in the same manner, a line is drawn six and a half arrow notches away from the alumina
peak. The composition is about 14 weight percent magnesia; the line placement is about nine
24
and a half arrow notches away from the magnesia peak. Three lines can be drawn from these
placements, and where they intersect the cordierite composition can be seen.
Figure 2.2: The ternary system MgO-Al2O3-SiO2 (in weight percent) [Benito, J.M., Turrillas, X.,
Cuello, G.J., De Aza, A.H., De Aza, S., Rodríguez, M.A. (2012). Cordierite synthesis. A time-resolved neutron
diffraction study. Journal of the European Ceramic Society, 32(2), 371-379, Retrieved from
http://www.sciencedirect.com/science/article/pii/S0955221911004766]. (Used under fair use, 2012)
The catalyst is applied to the ceramic substrate in two steps. First, a washcoat is applied
to the bare monolith. This coating was found to weigh approximately 278.5 grams. This
calculation can be seen in Appendix A.2 on page 68. The washcoat is made by mixing 100 parts
by weight of fine-grained alumina with 4 parts by weight of one or more fine-grained powders of

25
a rare earth metal oxide, such as cerium oxide [25]. This mixture is then suspended in 250 parts
by weight of water.
Second, a metal catalyst coating is applied to the washcoated ceramic substrate. A
composite powder of 5 parts platinum, 1 part rhodium, and 60 parts lanthanum oxide is mixed
together. In a similar manner as the washcoat, the ceramic substrate is dipped into a mixture of 1
part composite powder and 50 parts water. The substrate is dipped until 1.5 grams of noble
metals have been applied on the substrate per liter of the volume of the substrate [25]. The
geometric volume of the substrates is estimated to be 2.2 liters; this volume is found by
measuring the geometry of the substrate and calculating the volume. This equates to a total of
3.3 grams of noble metal. The components are placed into a canister made of type 409 stainless
steel. The canister used for the study weighed approximately 3865 grams.
Auxiliary materials are those required during the production of the product, but are not an
actual material in the product. The packaging necessary for shipping and transporting a catalytic
converter from manufacturers are auxiliary materials. When the ceramic monolith leaves the
first manufacturer, six to twenty-four are placed in a cardboard box with low density
polyethylene (LDPE) plastic supporting the tops and bottoms. The same kind of packaging is
used once the ceramic monolith has been coated and leaves the second manufacturer. After the
third manufacturer, where the stainless steel housing is fitted, a single converter is placed in a
plastic bag in a cardboard box, and filled with packing paper. The packaging materials are
assumed to be small since in the first two steps, multiple substrates were in each box. The plastic
and paper filler are left out of the analysis because there is so little used per converter. Using a
packaging calculator, the weight of a box 24 inches in length, 12 inches in width and 12 inches in
height, is 628.2 grams [29]. Assuming twelve ceramic substrates are in each box, and two are

26
used per converter, the combined weight of the boxes for the first and second manufacturer is
209.4 grams. The third manufacturer uses an entire box, 628.2 grams, for one converter. The
material required for all three manufacturers is 837.6 grams.
Table 2.4 below gives the major materials necessary for the creation of a catalytic
converter. The table is broken up into five parts, the substrate, the catalyst coating (washcoat),
the catalyst coating (metal), the canister, and the packaging. The masses are weighed and
estimated from the sample catalytic converter. The last column in the table provides details on
the material processes selected in SimaPro. The specific name of the material is given and the
database where the information came from is in the parentheses. These processes are essentially
LCA studies of the inputs and outputs required to extract and manufacture these materials which
are then used as inputs in this catalytic converter model.

27
Table 2.4: Materials used in a catalytic converter
Catalytic converter component Material Mass
(grams) SimaPro selection
Ceramic substrate
Kaolin 194 Kaolin, at plant/RER U (from Ecoinvent)
Talc, raw 357 Talc, in ground (from Raw materials)
Alumina 102 Alumina, at plant/US (from U.S. LCI Database)
Aluminum hydroxide 172 Aluminum hydroxide, at plant/RER U (from Ecoinvent)
Silica 96 Silica sand, at plant/DE U (from Ecoinvent)
Catalyst coating (washcoat)
Alumina 268 Alumina, at plant/US (from U.S.
LCI Database)
Rare earth oxide 10.7 Cerium oxide, at plant S (from
Ecoinvent)
Catalyst coating (metal)
Lanthanum oxide 3.02 Lanthanum oxide, at plant/CN S (from Ecoinvent)
Platinum 0.25 Platinum, primary, at refinery/RU S (from Ecoinvent)
Rhodium 0.050 Rhodium, primary at refinery/RU S (from Ecoinvent)
Canister Stainless steel (type 409) 3865 Stainless steel hot rolled coil,
grade 304 RER S (from ELCD 2.0)
Packaging Cardboard 837.6 Corrugated board boxes,
technology mix (from ELCD 2.0)
2.3 Processing
Various processing steps are necessary to convert the raw materials into the catalytic
converter. Figure 1.2 provides the process flow diagram. The electricity used for processing of

28
the ceramic is assumed to be from southwest Virginia. The electricity mix from American
Electric Power for southwest Virginia was used in SimaPro can be seen in Table 2.5 below [30].
Table 2.5: Electricity fuel mix for southwest Virginia per kWh [AEP’s average fuel mix of electricity
provided to Virginia customers. In (2010). 2010 Environmental Information.]. (Used under fair use,
2012).
Electricity type Amount (kWh)
Electricity, hard coal, at power
plant/US U 0.842
Electricity, nuclear, at power
plant/US U 0.12
Electricity, natural gas, at
power plant/US U 0.022
Electricity, hydropower, at
power plant/ SE U 0.005
Electricity, at wind power
plant/RER U 0.011
The first processing step is the creation of the ceramic monolith structure. This process is
just one of the various methods used for the ceramic substrates. Different manufacturers may
use different methods, including various techniques of shaping, drying and firing. The ceramic
raw materials are received at plant and are measured and mixed together. Next, the raw
materials, including organic binders, are extruded into long continuous logs. The ceramic is wet
cut into smaller pieces. The wet ceramic is then microwave dried to remove moisture. The dried
ceramic is green cut into the desired size for the catalytic converter. Using a progressive kiln or
tunnel kiln, the ceramic pieces are fired. During firing, the organic binders and water are
released from the product and into the air without collection; the organic binders are not included

29
in this analysis as mentioned previously. After firing, the ceramic piece goes through inspection
and packaging. This structure is then transported to the second facility for the addition of the
metal catalyst. Table 2.6 below gives energies for various processing methods for magnesia
brick refractories [31]. Due to a lack of published data on cordierite processing energies, these
energies will be used in the analysis. To account for variability between the energies for
cordierite compared to magnesia brick, the drying and firing energies will be tested with
sensitivity analysis. One test will take 50% of these energies to provide analysis results for the
event that the cordierite processing energy far less than that for magnesia brick. The second test
will take 75% of the drying and firing energies to provide analysis results for the event that the
cordierite processing energy is somewhat smaller that for magnesia brick.
Table 2.6: Energy consumption data for the processing of magnesia refractory bricks
[Reference document on best available techniques in the ceramic manufacturing industry. (2007). Retrieved from
http://eippcb.jrc.es/reference/BREF/cer_bref_0807.pdf]. (Used under fair use, 2012).
Process MJ/kg
Preparation, screening 0.35-0.50
Weighing, dosing, mixing 0.045-0.070
Shaping 0.13-0.20
Conventional drying and firing 3.0-6.3
Subsequent treatment, packaging 0.08
The averages of these ranges were used in the SimaPro model for each process. Cutting
and extrusion both fall under the shaping, and there are two forms of cutting; therefore, this
energy is multiplied times three. The drying, firing process uses the average value, but is
30
modified based on the fact that it is a combined range using conventional methods for drying and
firing. The modifications will divide the energy range into microwave drying and conventional
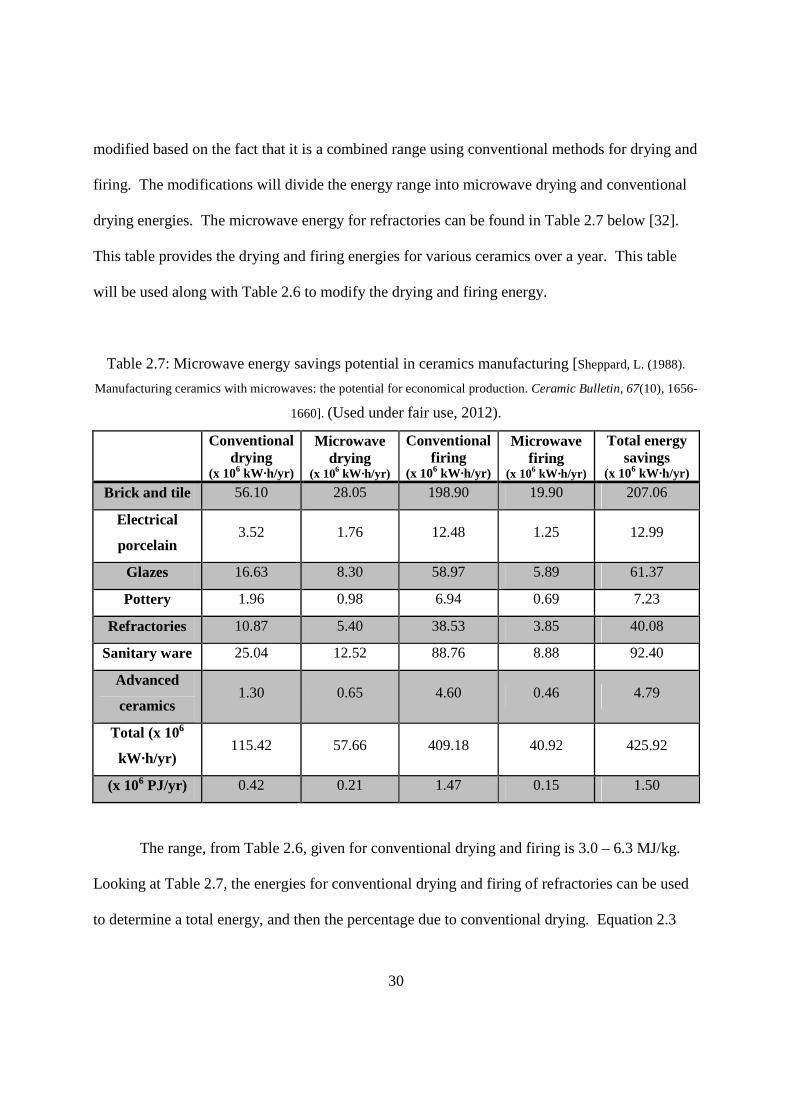
drying energies. The microwave energy for refractories can be found in Table 2.7 below [32].
This table provides the drying and firing energies for various ceramics over a year. This table
will be used along with Table 2.6 to modify the drying and firing energy.
Table 2.7: Microwave energy savings potential in ceramics manufacturing [Sheppard, L. (1988).
Manufacturing ceramics with microwaves: the potential for economical production. Ceramic Bulletin, 67(10), 1656-
1660]. (Used under fair use, 2012).
Conventional
drying (x 106 kW ·h/yr)
Microwave drying
(x 106 kW ·h/yr)
Conventional firing
(x 106 kW ·h/yr)
Microwave firing
(x 106 kW ·h/yr)
Total energy savings
(x 106 kW ·h/yr)
Brick and tile 56.10 28.05 198.90 19.90 207.06
Electrical
porcelain 3.52 1.76 12.48 1.25 12.99
Glazes 16.63 8.30 58.97 5.89 61.37
Pottery 1.96 0.98 6.94 0.69 7.23
Refractories 10.87 5.40 38.53 3.85 40.08
Sanitary ware 25.04 12.52 88.76 8.88 92.40
Advanced
ceramics 1.30 0.65 4.60 0.46 4.79
Total (x 106
kW ·h/yr) 115.42 57.66 409.18 40.92 425.92
(x 106 PJ/yr) 0.42 0.21 1.47 0.15 1.50
The range, from Table 2.6, given for conventional drying and firing is 3.0 – 6.3 MJ/kg.
Looking at Table 2.7, the energies for conventional drying and firing of refractories can be used
to determine a total energy, and then the percentage due to conventional drying. Equation 2.3

31
provides the total energy for these processes. Equation 2.4 gives the conventional drying as a
percentage of the total energy.
Total conventional energy for a refractory = Refractory conventional drying energy +
Refractory conventional firing energy
������������������������������������� � 10.87x10 kW ∙ h/yr �
38.53x10 kW ∙ h/y � 49x10 kW ∙ h/yr (2.3)
������������-�����.��������� � /0.123/0456∙7/89:;.:3/0456∙7/89 < 100% � 22.00% (2.4)
This percentage can be applied to the given range for drying and firing in Table 2.6 to estimate
how much energy is due to the drying. Applying 22% to the drying, firing range of 3.0 – 6.3
MJ/kg yields a drying range of 0.66 – 1.39 MJ/kg. The remaining 2.34 – 4.91 MJ/kg is the range
for conventional firing of a refractory.
Referencing Table 2.7 again, the conventional drying and microwave drying energies for
a refractory can be compared. Equation 2.5 gives the microwave drying energy as a percentage
of conventional drying energy.
Microwave drying percentage for a refractory = Refractory microwave drying energy /
Refractory conventional drying energy
>����?���-�����.��������� � @.:0/0.12 < 100% � 49.7% (2.5)
This percentage can be applied to the conventional drying range, 0.66 – 1.39 MJ/kg, to
find the microwave drying range. This range is found to be 0.328 – 0.689 MJ/kg. Since this

32
range is characteristic of refractories, and not specifically cordierite, the average value, 0.508
MJ/kg, is used in the analysis.
Table 2.8 below provides the energies per weight basis for all of the ceramic processing
methods. As stated above, the average value for each range is used in the SimaPro model. The
last two columns provide the energies used in the two sensitivity analysis tests. Only the drying
and firing energies will be tested since the screening, mixing, shaping and packaging energies are
not expected to vary between the two materials.
Table 2.8: Energy data entered into SimaPro for the processing phase [31, 32]
Process MJ/kg 50% of the drying and
firing energy MJ/kg
75% of the drying and
firing energy MJ/kg
Preparation, screening 0.425 0.425 0.425
Weighing, dosing, mixing 0.058 0.058 0.058
Shaping 0.165 0.165 0.165
Microwave Drying 0.508 0.254 0.381
Firing 3.627 1.814 2.720
Subsequent treatment,
packaging 0.08 0.08 0.08
Total 4.863 2.796 3.829
When the ceramic structure arrives at the second facility, it is coated with a washcoat and
metal catalyst. The alumina, rare earth metal oxide, and water are mixed, and the ceramic
structure is dipped into this mixture and subsequently sintered at 500°C in contact with air [25].
In order to create the composite powder of noble metals, chloroplatnic acid (H2PtCl6), rhodium
nitrate (Rh(NO3)3), and lanthanum nitrate (La(NO3)3) are sprayed into a reactor with an
atmosphere containing oxygen at approximately 950°C. The resulting composite powder is

33
again mixed with water. The washcoated ceramic structure is dipped, dried and sintered at
500°C in contact with air. As explained above, this process of dipping, drying and sintering the
catalyst mix is repeated until a desired amount of noble metal is reached [25]. Once the catalyst
coated ceramic passes inspection, it is packaged and shipped to the third and final manufacturing
facility.
The final processing necessary for a catalytic converter is the stainless steel housing.
Made out of type 409 ferritic stainless steel, the canister has a tube-like body with one open end
and one end tapered to a reduced diameter to allow for a connection to the exhaust system pipe
[33]. The housing shells are processed by deep drawing, in which the usual conical ends are
modified to provide the open and tapered ends. SimaPro has a deep drawing process built into
the software that is used in the model for this process step. Various pressures for deep drawing
were available, but a high pressure of 38000 kN was chosen. This decision was based on the fact
that ferritic stainless steels work-harden faster than carbon steels, and therefore need higher
pressures to form [34]. The process selected in SimaPro is, “deep drawing, steel, 38000 kN
press, automode operation/kg/RER”. The data for the process is published in Life Cycle
Inventories of Metal Processing and Compressed Air Supply in 2007 by R. Steine and R.
Frischknecht. The shells are joined together, generally by welding [33]. Once the catalytic
converter is fully constructed, it is packaged and shipped to the customer.
2.4 Usage
Once the catalytic converter is installed in a vehicle, it begins its use phase. It is in this
phase that the product makes a positive environmental contribution. In order to examine the
benefits of the catalytic converter in use, a comparison of a vehicle with and without the catalytic

34
converter will be used. The emissions for both of these models can be seen in Table 2.9 below.
This data is for an average passenger car taken from the second edition of Air Pollution:
Measurement, Modeling and Mitigation by Jeremy Colls [35]. The data has been converted from
grams per kilometer to grams per mile.
Table 2.9: Average passenger car emissions with and without a catalytic converter [Colls, J. (2002).
Air pollution: measurement, modelling, and mitigation. (Second ed., pp. 127-137). New York, NY: Spon Press.].
(Used under fair use, 2012).
Carbon monoxide
(g/mi)
Hydrocarbons
(g/mi)
Nitrogen oxides
(g/mi)
Gasoline car without a
catalytic converter 43.5 4.51 2.74
Gasoline car with a
catalytic converter 3.22 0.322 0.644
The numerical difference between the car without a catalytic converter and the car with a
catalytic converter is the amount of emissions converted to less harmful pollutants. Both carbon
monoxide and hydrocarbons are converted to carbon dioxide by the catalytic converter. Table
2.10 provides the converted emissions.
Table 2.10: Converted emissions for an average passenger car [Colls, J. (2002). Air pollution:
measurement, modelling, and mitigation. (Second ed., pp. 127-137). New York, NY: Spon Press.]. (Used under
fair use, 2012).
Carbon monoxide
(g/mi)
Hydrocarbons
(g/mi)
Nitrogen oxides
(g/mi)
Converted emission 40.2 4.18 2.09
35
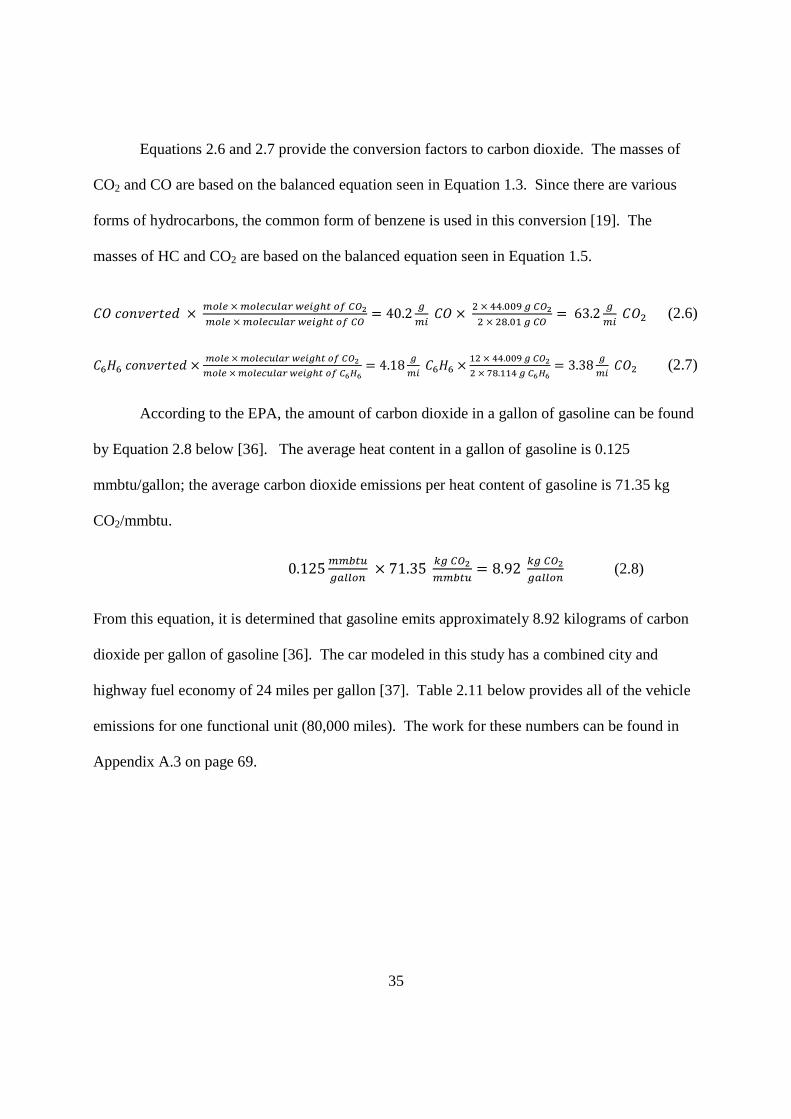
Equations 2.6 and 2.7 provide the conversion factors to carbon dioxide. The masses of
CO2 and CO are based on the balanced equation seen in Equation 1.3. Since there are various
forms of hydrocarbons, the common form of benzene is used in this conversion [19]. The
masses of HC and CO2 are based on the balanced equation seen in Equation 1.5.
����������A < BCDE<BCDEFGDHIJEKLMNCOPQR
BCDE<BCDEFGDHIJEKLMNCOPQ � 40.2 LBK �� < �<::.00;LPQR
�<�1.0/LPQ � 63.2 LBK ��� (2.6)
� ��������A < BCDE<BCDEFGDHIJEKLMNCOPQRBCDE<BCDEFGDHIJEKLMNCOP4S4
� 4.18 LBK � < /�<::.00;LPQR
�<21.//:LP4S4� 3.38 L
BK ��� (2.7)
According to the EPA, the amount of carbon dioxide in a gallon of gasoline can be found
by Equation 2.8 below [36]. The average heat content in a gallon of gasoline is 0.125
mmbtu/gallon; the average carbon dioxide emissions per heat content of gasoline is 71.35 kg
CO2/mmbtu.
0.125 BBTNGLHDDCU < 71.35 VLPQR
BBTNG � 8.92 VLPQRLHDDCU (2.8)
From this equation, it is determined that gasoline emits approximately 8.92 kilograms of carbon
dioxide per gallon of gasoline [36]. The car modeled in this study has a combined city and
highway fuel economy of 24 miles per gallon [37]. Table 2.11 below provides all of the vehicle
emissions for one functional unit (80,000 miles). The work for these numbers can be found in
Appendix A.3 on page 69.
36
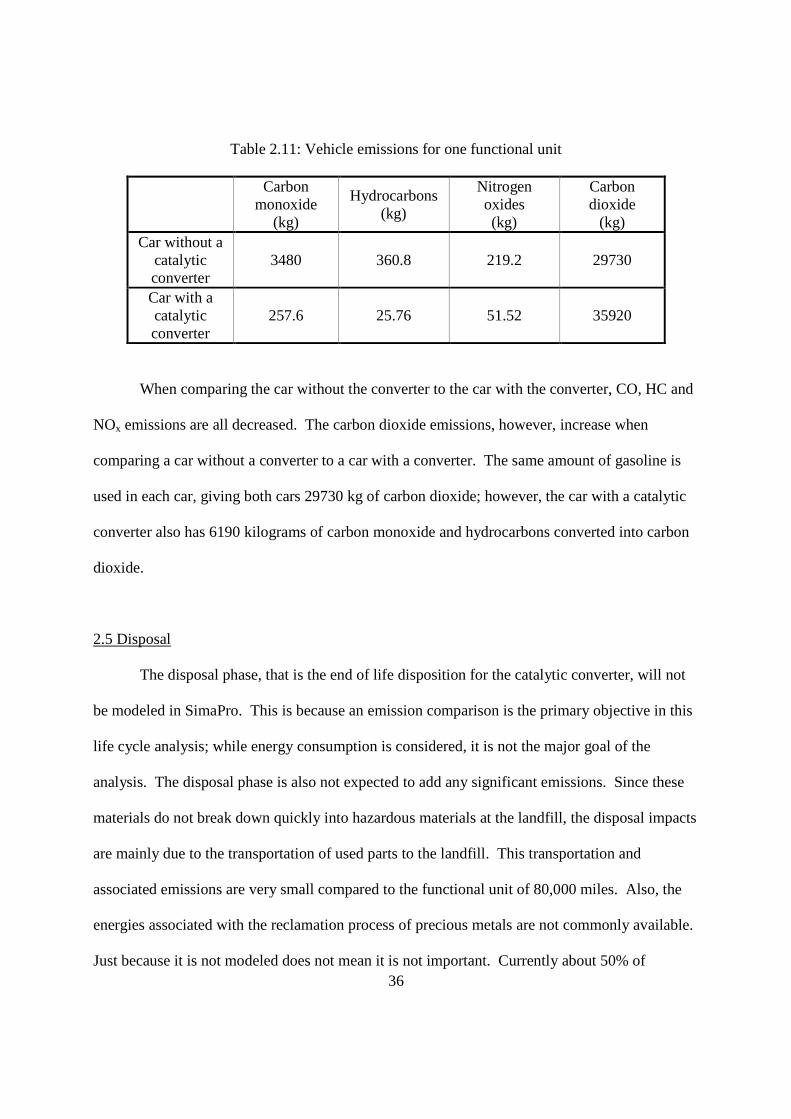
Table 2.11: Vehicle emissions for one functional unit
Carbon
monoxide (kg)
Hydrocarbons (kg)
Nitrogen oxides (kg)
Carbon dioxide
(kg) Car without a
catalytic converter
3480 360.8 219.2 29730
Car with a catalytic converter
257.6 25.76 51.52 35920
When comparing the car without the converter to the car with the converter, CO, HC and
NOx emissions are all decreased. The carbon dioxide emissions, however, increase when
comparing a car without a converter to a car with a converter. The same amount of gasoline is
used in each car, giving both cars 29730 kg of carbon dioxide; however, the car with a catalytic
converter also has 6190 kilograms of carbon monoxide and hydrocarbons converted into carbon
dioxide.
2.5 Disposal
The disposal phase, that is the end of life disposition for the catalytic converter, will not
be modeled in SimaPro. This is because an emission comparison is the primary objective in this
life cycle analysis; while energy consumption is considered, it is not the major goal of the
analysis. The disposal phase is also not expected to add any significant emissions. Since these
materials do not break down quickly into hazardous materials at the landfill, the disposal impacts
are mainly due to the transportation of used parts to the landfill. This transportation and
associated emissions are very small compared to the functional unit of 80,000 miles. Also, the
energies associated with the reclamation process of precious metals are not commonly available.
Just because it is not modeled does not mean it is not important. Currently about 50% of

37
catalytic converters are recycled [38]. When a catalytic converter is recycled, the stainless steel
canister and precious metals are recycled, and the remaining ceramic is landfilled. In order to
recycle type 409 stainless steel, energy is required. Table 2.12 provides the energy required to
produce virgin steel versus recycle the steel. Embodied energy is the total of all energy required
for a product throughout its entire product lifecycle [39]. More than three times the energy is
required to process virgin stainless steel instead of recycling it.
Table 2.12: Processing versus recycling energies for type 409 stainless steel [Stainless steel, ferritic,
AISI 409, wrought, annealed. In (2011). CES EduPack 2011]. (Used under fair use, 2012).
Type of Energy Energy (MJ/kg)
Embodied energy, primary production 77.2 – 85.3
Embodied energy, recycling 21.6 – 23.9
Energy savings 55.6 – 61.4
Catalytic converters utilize about one third of the world’s supply of platinum, and 87% of
the world’s supply of rhodium [40]. The precious metals are valuable when recycled because of
their resource rarity and monetary value. In the same manner as stainless steel, when precious
metals are recycled, energy is required. Table 2.13 below provides the energy required to
produce platinum and rhodium versus recycle the metals [41, 42].

38
Table 2.13: Processing versus recycling energies for platinum and rhodium [Platinum, commercial
purity, P04995, annealed. In (2011). CES EduPack 2011, and Platinum-rhodium alloy, annealed. In (2011). CES
EduPack 2011]. (Used under fair use, 2012).
Precious Metal Type of Energy Energy (MJ/kg)
Platinum
Embodied energy, primary production 1.14·105
Embodied energy, recycling 1.08·103 – 1.2·103
Energy savings 1.13·105 – 1.13·105
Rhodium
Embodied energy, primary production 1.22·105 – 1.35·105
Embodied energy, recycling 2.44·103 – 2.7·103
Energy savings 1.20·105 – 1.32·105
Tremendous amounts of energy can be saved when these precious metals are recycled
compared to virgin production. While the energy savings are important, the available metal for
reuse is the primary desire. During the reclamation of the precious metals, 80 to 94 percent of
platinum can be recovered, while 65 to 90 percent of rhodium can be recovered [43]. Comparing
Tables 2.12 and 2.13, it can be seen how much more energy is required to produce platinum and
rhodium over stainless steel. More energy is required to extract and process these rare metals
because it is a time and energy intensive process.
According to the United States Bureau of Transit Statistics for 2009, there are over 254
million registered passenger vehicles in the United States [44]. If only half of these will be
recycled at some point in time, then approximately 127 million catalytic converters will be
landfilled. This number is also assuming only one catalytic converter is used per car, when in
reality this number would be even greater. The average landfill is 116 acres [45]. The size of
the catalytic converter is less than two square feet, and there are 43,560 square feet in one acre.
While there is some land use, the amount of volumetric space that would be required for this
many components is not significant.

39
3.0 Results of Analysis
Once all of the data was entered into SimaPro, two models, Car with Catalytic Converter
and Car without Catalytic Converter, were compared. In this comparison, the life cycle
inventory was used to determine the total of the key emissions (carbon monoxide, hydrocarbons,
nitrogen oxides and carbon dioxide). The environmental impact and total energy usage were
quantified as well.
3.1 Comparison of Key Emissions
Table 3.1 below gives the inventory results for total carbon monoxide. There is a row
specifically for the emissions occurring during the use phase, and a row for the emissions during
extraction and processing (labeled manufacture). How the emission is input or output can be
found in the column “Compartment”. The full emission tables for all of the key emissions can be
found in Appendix B on page 73.
Table 3.1: Total emissions for carbon monoxide
Emission Compartment Unit
Car with
Catalytic
Converter
Car without
Catalytic
Converter
Carbon monoxide,
usage Air kg 258 3480
Carbon monoxide,
manufacture Air kg 0.192 -
Total kg 258 3480

40
Table 3.2 below gives the total emissions for hydrocarbons. Again, one row is the
hydrocarbons emitted during usage, and the second row is the hydrocarbons emitted due to the
creation of a catalytic converter.
Table 3.2: Total emissions for hydrocarbons
Emission Compartment Unit Car with Catalytic
Converter
Car without
Catalytic
Converter
Hydrocarbons,
usage Air kg 25.8 360
Hydrocarbons,
manufacture Air and Water kg 0.000158 -
Total kg 25.8 360
Table 3.3 below gives the total emissions for nitrogen oxides. The NOx emitted during
use is in one row while the extraction and processing NOx emissions are in a separate row.
Table 3.3: Total emissions for nitrogen oxides
Emission Compartment Unit Car with Catalytic
Converter
Car without Catalytic
Converter
Nitrogen oxide
(NOx) usage Air kg 51.5 219
Nitrogen oxide
(NOx)
manufacturing
Air kg 0.1 -
Total kg 51.6 219

41
Table 3.4 below gives the total emissions for carbon dioxide. The emissions due to usage
and manufacture are again split into two separate rows, with a total CO2 emission for a car with
and without a catalytic converter.
Table 3.4: Total emissions for carbon dioxide
Emission Compartment Unit
Car with
Catalytic
Converter
Car without
Catalytic
Converter
Carbon dioxide,
Usage Air kg 35920 29730
Carbon dioxide,
manufacture Air and Raw kg 23.6 -
Total kg 35940 29730
Table 3.5 below gives the total emissions for all key emissions. The last column,
“emission differences” gives the increase or decrease of emissions based on a car without a
catalytic converter compared to a car with a catalytic converter.
Table 3.5: Total emissions for all key emissions
Emission Unit
Car without
Catalytic
Converter
Car with
Catalytic
Converter
Emission
Differences
Carbon monoxide kg 480 258 – 222
Hydrocarbons kg 360 25.8 – 334
Nitrogen oxides kg 219 51.6 – 167
Carbon dioxide kg 29730 35940 + 6210

42
3.1.1 Sensitivity Analysis
As previously discussed, sensitivity analysis was used in order to test the effect that
assumptions may have on the outcome of the life cycle. Five assumptions were tested:
• Platinum is solely used as the oxidation catalyst.
• Alumina is solely used as the bulk of the washcoat.
• The ceramic processing energies are the averages for the magnesia brick.
• Microwave drying is used.
• Conventional firing is used.
The assumption that solely platinum was used as the oxidation catalyst was tested by
changing the assumption to include palladium as the oxidation catalyst. Platinum was initially
used as the oxidation catalyst, but was eventually switched to palladium because it is cheaper
[40]. In 2000, palladium prices peaked and car makers switched back to platinum, but they are
now going back to platinum. Since cars currently on the road can have platinum or palladium, a
sensitivity tests was run. In this test, 100% palladium was used for the oxidation catalyst. Table
3.6 below gives the total emissions for the initial scenario of 100% platinum and the difference
in emissions for the sensitivity analysis test.
Table 3.6: Sensitivity analysis of platinum
Emission Unit Emissions for a car
with 100% platinum
Emission differences for a
car with 100% palladium
Carbon monoxide kg 258 - 0.0046
Hydrocarbons kg 25.8 - 0.0000041
Nitrogen oxides kg 51.6 + 0
Carbon dioxide kg 35920 - 1.11

43
The assumption that all alumina was used as the bulk of the washcoat was tested by
changing the assumption to include silica. The first sensitivity test replaces all alumina with all
silica. The second sensitivity test uses a composite of 50% alumina and 50% silica. The results
of the sensitivity analysis can be seen in Table 3.7 below.
Table 3.7 Sensitivity analysis of alumina
Emission Unit
Emissions for
a car with
100% alumina
Emission differences
for a car with 100%
silica
Emission differences for
a car with 50% alumina
and 50% silica
Carbon monoxide kg 258 - 0.001 + 0.020
Hydrocarbons kg 25.8 + 0 + 0.000016
Nitrogen oxides kg 51.6 + 0 + 0
Carbon dioxide kg 35920 - 0.35 + 2.54
The assumption that the cordierite processing energies are the average of the magnesia
brick processing energies (total of 4.863 MJ/kg) was tested by changing the assumption to 50%
and 75% of the drying and firing energies. The first sensitivity test replaces the average energy
values for drying and firing with half of the average energy values (total of 2.796 MJ/kg). The
second sensitivity test uses three-quarters of the average energy values for drying and firing
(total of 3.829 MJ/kg). The results of the sensitivity analysis can be seen in Table 3.8 below.

44
Table 3.8 Sensitivity analysis of cordierite processing energy
Emission Unit
Emissions for a car
with average energy
(4.863 MJ/kg)
Emission differences
for a car with 50%
energy (2.796 MJ/kg)
Emission differences
for a car with 75%
energy (3.829 MJ/kg)
Carbon monoxide kg 258 - 0.0002 - 0.0009
Hydrocarbons kg 25.8 - 0.000022 - 0.000011
Nitrogen oxides kg 51.6 + 0 + 0
Carbon dioxide kg 35920 - 0.29 - 0.15
Sensitivity analysis is conducted on the assumption that microwaves are used during the
drying process of the ceramic substrates. The assumption is changed so that conventional drying
is used instead of microwave drying. The energy used for conventional drying 1.023 MJ/kg.
This is the average of the energy range determined by Equations 2.3 and 2.4. The results of the
analysis can be found in Table 3.9 below.
Table 3.9 Sensitivity analysis of microwave drying
Emission Unit
Emissions for a car
with microwave
drying
Emission differences
for a car with
conventional drying
Carbon monoxide Kg 258 + 0.0011
Hydrocarbons Kg 25.8 - 0.00000051
Nitrogen oxides Kg 51.6 + 0
Carbon dioxide Kg 35920 + 0.23
Sensitivity analysis is also conducted on the assumption that conventional furnaces are
used during the firing process of the ceramic substrates. The assumption is changed so that
microwave firing is used instead of conventional firing. The energy used for microwave firing is

45
0.7248 MJ/kg. This is the average of the energy range determined by Equations A.11, A.12 and
A.13 Appendix A.4 on page 71. The results of the analysis can be found in Table 3.10 below.
Table 3.10 Sensitivity analysis of conventional firing
Emission Unit
Emissions for a car
with
conventional firing
Emission differences
for a car with
microwave firing
Carbon monoxide kg 258 - 0.0008
Hydrocarbons kg 25.8 - 0.000043
Nitrogen oxides kg 51.6 + 0
Carbon dioxide kg 35920 - 0.02
3.2 Eco-indicator 99 (H)
Using Eco-indicator 99 (H), Figure 3.1 below compares the damages for human health,
ecosystem quality and resources in terms of percentage. Each of the three damage categories
compares the damages for a car with and without a catalytic converter, setting the higher value at
100% for ease of comparison. These values are normalized by the total amount of damage in
Europe assigned to an average citizen (per capita).

46
Figure 3.1 Eco-indicator 99 damage assessment chart for a car with and
without a catalytic converter
Table 3.11 below corresponds to the figure above, providing numbers to relate to the
percentages. For example, 0.0125 DALY is about 46% of 0.0273 DALY; therefore, the human
health bar for a car without a catalytic converter is 100%, and the bar for a car with a catalytic
converter is approximately 46%. In this table, the unit PDF · m2 · yr is the percentage of loss
species, multiplied by the area, multiplied by a time increment [27]. The unit MJ surplus is the
surplus energy needed for future extractions of minerals and fossil fuels.
Table 3.11 Eco-indicator 99 numerical damage assessment for a car with and
without a catalytic converter
Damage category Unit Car with catalytic
converter
Car without catalytic
converter
Human Health DALY 0.0125 0.0273
Ecosystem Quality PDF · m2 · yr 304 1250
Resources MJ surplus 19.6 0
Method: Eco-indicator 99 (H) V2.07 / Europe EI 99 H/H / Damage assessmentComparing 1 p 'Vehicle with Catalytic Converter' with 1 p 'Vehicle without Catalytic Converter';
Vehicle with Catalytic Converter Vehicle without Catalytic Converter
Human Health Ecosystem Quality Resources
%
100
90
80
70
60
50
40
30
20
10
0

47
Tables 3.12, 3.13 and 3.14 below provide the top three contributors to the damages seen
above for a car with a catalytic converter. In the case of a car without a catalytic converter, all of
the environmental points come from the process, “emissions during use without a converter”.
Table 3.12: Top three contributors to the damage to human health
Number Process DALY
1 Emissions during use with converter 0.0122
2 Platinum, primary, at refinery 0.000182
3 Rhodium, primary, at refinery 0.0000796
Table 3.13: Top three contributors to the damage to ecosystem quality
Number Process PDF · m2 · yr
1 Emissions during use with converter 294
2 Platinum, primary, at refinery 4.41
3 Stainless steel 2.85
Table 3.14: Top three contributors to the damage to resources
Number Process MJ surplus
1 Stainless steel 6.86
2 Platinum, primary, at refinery 4.77
3 Rhodium, primary, at refinery 2.09

48
3.3 Cumulative Energy Demand
Using Cumulative Energy Demand, Table 3.15 provides the total energy required to
create a single catalytic converter, including extraction and manufacturing. A car without a
catalytic converter does not require excess energy to create the component, and therefore does
not have any energy associated with it. The energy is divided into six impact categories; these
categories are the various forms of energy used during extraction and manufacturing.
Table 3.15: Cumulative energy demand characterization of energy usage
Impact Category Material (MJ) Processing (MJ) Usage (MJ) Total (MJ)
Non-renewable, fossil 195 26.7 0 221.7
Non-renewable, nuclear 23.4 3.48 0 26.88
Non-renewable, biomass 0.00293 1.77·10-5 0 0.0029477
Renewable, biomass 1.08 0.441 0 1.512
Renewable, wind, solar,
geothermal 7.12 0.0597 0 7.1797
Renewable, water 2.8 0.33 0 3.13
Total 229.4 31.01 0 260.4

49
4.0 Discussion of Analysis Results
The purpose of this life cycle analysis is to determine whether or not a catalytic converter
is a positive environmental product; so the basic question is, is it? Overall, the catalytic
converter can be seen as having both positive and negative environmental impacts. The carbon
monoxide, hydrocarbons and nitrogen oxides are all significantly decreased with the use of a
catalytic converter. On the other hand, resources and energy are utilized, and the carbon dioxide
emissions are increased considerably. While the car with a catalytic converter uses more energy,
resources and outputs more carbon dioxide, it still has a lower environmental impact compared
to a car without a catalytic converter. Whether or not the prevented pollutants outweigh the
resources used is dependent upon the subjective weighting of importance for each category by
individuals, corporations or governments. The air pollutant reductions lead to better short term
health effects in the current population while the carbon dioxide emissions warm the atmosphere
and have more uncertain long term health and ecosystem effects.
4.1 Key emissions
The use of a catalytic converter decreases the carbon monoxide emission by 222 kg, per
functional unit, which is 80,000 miles. Carbon monoxide can disrupt the flow of oxygen in the
bloodstream, causing serious problems with the brain, heat and other vital organs. Since carbon
monoxide can be extremely hazardous to human health, the more that can be prevented, the
better. The EPA has determined standards for safe carbon monoxide exposure; any exposure
beyond these limits can be toxic [46]. The standards are 9 parts per million (ppm) over an 8-
hour time span or 35 ppm over a 1-hour time span. Across the United States, concentrations
above these standards have declined nearly 70% since 1990 [46].

50
In addition to carbon monoxide from the use phase emissions, there are some small CO
emissions from the rest of the process including energy use. In the model, the majority, or 88%,
of the carbon monoxide produced is from the manufacture of stainless steel. Alumina extraction
and processing and deep drawing are the next largest contributors. Overall, the carbon monoxide
emissions created from extraction and processing are small compared to the use phase. This
indicates that creating the catalytic converter does not contribute a substantial amount of carbon
monoxide emissions.
Hydrocarbons are reduced by 334 kg per 80,000 miles. In large cities where there is
greater population and vehicles, the prevention of hydrocarbons and smog is very important.
Figure 4.1 below shows Los Angeles, California in 1970 versus present day [47, 48].
Figure 4.1: Los Angeles in 1970 versus present day [Kempler, S. NASA, (2011). Amateur guide for air
quality testing . Retrieved from website: http://disc.sci.gsfc.nasa.gov/oceancolor/
additional/science-focus/locus/amateur_guide_for_air_quality_000.shtml, and (n.d.). Los angeles. [Web Photo].
Retrieved from http://www.stratosjets.com/featured-jet-charter/Jet-Charter-Flights-in-Los-Angeles]. (Used under
fair use, 2012).
In 1970, Los Angeles and other large cities across the nation were plagued with smog. Due to the
introduction of the Clean Air Act of 1970, and catalytic converters, large formations of urban
smog have greatly decreased [10]. This can be seen in the present day photo of the city.

51
Considering a car with a catalytic converter, the hydrocarbons produced from extraction
and processing are negligible. The emissions are so small that they do not even show up in the
total hydrocarbon emissions; the emissions during the use phase completely dominate the
hydrocarbon total.
Nitrogen oxides (NOx) are decreased by 167 kg, per functional unit, with the use of a
catalytic converter. Decreasing the amount of NOx polluted into the air also decreases the
negative environmental and health effects. The effects that can be prevented include acid rain,
smog, lung irritation and respiratory problems. The more NOx converted to less harmful
emissions, the smaller the potential for acid rain and ozone formation. Again, there are very
little emissions of NOx during the extraction and processing of creating a catalytic converter.
The NOx emissions are mostly due to the use phase of a catalytic converter.
Unlike the other key emissions, carbon dioxide is increased with the use of a catalytic
converter. This result is expected. Referring back to Equation 1.2 on page 2, carbon dioxide is
an output, along with carbon monoxide, from a typical engine. This is a key point because
carbon dioxide is expected to be emitted by the engine alone, but the catalytic converter
increases the carbon dioxide further because it is converting the carbon monoxide and
hydrocarbons to carbon dioxide [2]. Carbon dioxide is by far the largest emission output to the
environment compared to the three other emissions. While carbon dioxide is a gas monitored by
the EPA voluntarily, it does not pose a direct short term threat to human health; however, carbon
dioxide may pose a threat to long term human health. Totaling 35,940 kg per catalytic converter,
the carbon dioxide emissions are 6,210 kg greater than those for a car without a catalytic
converter. The use of gasoline is the primary supplier to this large emission total. As explained
before, 8.92 kilograms of carbon dioxide are emitted due to one gallon of gasoline used. For a
52
functional unit of 80,000 miles and a car with an average of 24 miles per gallon, this equates to a
total of 3334 gallons of gasoline over the converter’s lifetime. This yields an approximate total
of 29,730 kg of carbon dioxide; this is the total CO2 emission for the car without a catalytic
converter. In addition to this amount, a total of 6183 kg of CO2 are converted from CO. The
extraction and processing of the catalytic converter create an additional 23.6 kg of carbon
dioxide. Like the other key emissions, carbon dioxide emissions are the greatest during the use
phase of the catalytic converter.
Carbon monoxide, hydrocarbons and nitrogen oxides emissions are all greatly lessened
by the use of a catalytic converter. While this result is expected, the life cycle analysis provides
evidence for this claim. Carbon dioxide emissions are increased because of a catalytic converter.
This is also expected, but the life cycle analysis shows that most all of the emissions are due to
the use of gasoline, not due to carbon monoxide and hydrocarbons converted or to the creation of
the catalytic converter.
4.1.1 Sensitivity Analysis
Sensitivity analysis is used in this LCA to show whether or not an assumptions have a
large effect on the outcome. The results of these five tests show that some assumptions have no
effect, while some assumptions have small effects. Overall, this life cycle model is not very
sensitive to the tested assumptions. This result is due to the fact that the life cycle is dominated
by the use phase, and is therefore very sensitive to that.
Platinum and palladium are both used as an oxidation catalyst. Sometimes it is made
with one or the other, and sometimes it is made with both. The driving force for the selection of
the material used is the cost [40]. This sensitivity analysis compares the use of all platinum and
53
all palladium to determine the environmental effects from manufacturing and processing the raw
material. The results of the analysis show that there are no significant emission differences
between the two tests. The changes in the emissions are so slight that the total emission is not
even changed significantly. This is a good sign because the assumption of using all platinum
does not have any impact on the life cycle. These results allow for platinum, palladium, to be
interchanged without an influence on the emissions.
The second sensitivity analysis tests the assumption of alumina as the bulk of the
washcoat. The results of this analysis indicate that this assumption does have a slight impact on
the emission totals; hydrocarbon, nitrogen oxide and carbon monoxide emissions are not
significantly affected by the changing of materials. Comparing all silica to half silica, half
alumina, the carbon dioxide emissions are increased by 2.5 kg. The slight increases in emissions
may be due to the fact that there are two extraction and manufacturing processes to account for;
there may also be rounding errors within SimaPro causing the increases in emissions.
The cordierite processing energies were assumed to be the average processing energies of
magnesia refractory brick. Sensitivity analysis is used to show whether or not taking 50% or
75% of the drying and firing processing energies will have an influence on the emissions
produces. The results of this analysis show that there are slight decreases associated with
halving these energies. There are also very slight decreases associated with taking 75% of the
drying and firing energies. The results from this analysis indicates that since the use phase
emissions are dominating the life cycle, only minor emission decreases are possible with
changing the processing energies.
This life cycle assumed that microwave drying is used during the creation of the ceramic
substrate. Sensitivity analysis is used to determine if using conventional drying will have an

54
influence on the emissions produced. The results of this analysis show that there is a very small
increase when using conventional drying instead of microwave drying. This result is expected
because conventional drying is a longer process and requires more energy.
The last sensitivity analysis test is comparing the emissions produced from conventional
firing to microwave firing. The assumption is that conventional firing methods are used. The
results from this analysis show that there is a very small decrease in emissions between the two
options. This is an expected result because microwave firing requires less energy.
4.2 Eco-indicator 99 (H)
Eco-indicator 99 (H) is a life cycle analysis tool used to show the damages caused to
human health, ecosystem quality and resources. The damage comparisons can be seen in Figure
3.1. In this figure and the subsequent table, each damage category is compared side by side.
Table 3.11 provides the actual damage in each category’s unit. These numbers show that human
health damage is decreased over 50%, and that ecosystem quality is decreased over 75% when a
catalytic converter is used. The damage to resources is increased by 100% with a catalytic
converter since the other model uses no resources. The decrease in human health damage
directly correlates to less human lives lost and disabled. In the same manner, the decrease in
ecosystem quality damage relates to less species lost, over an area, in a timespan. The increase
in resource damage means that more energy will be required to acquire the resource in the future.
Tables 3.12, 3.13 and 3.14 provide the top three contributors to the human health
damage, ecosystem quality damage and resource damage, respectively, for a car with a catalytic
converter. For the human health damage category, the top three contributors are: emissions
during use with the converter, platinum, and rhodium. The emissions during use with the
55
converter are the majority, or 97.6%, of the human health damage. The platinum and rhodium
have a combined 2.1% of the human health damage. The top three contributors to ecosystem
quality are: emissions during use with the converter, platinum, and stainless steel. Like human
health, emissions during use are 96.7% of the damage to ecosystem quality. The platinum and
stainless steel have a combined ecosystem quality damage total of 2.4%. The top three
contributors to resource damage are: stainless steel, platinum and rhodium. The stainless steel
makes up 35.2% of the resources damage. The platinum has 24.5% of the resources damage,
while the rhodium has 10.7% of the damage. These three materials make up 70.4% of the
damages to resources. These results indicate that emissions during use are the dominant damage
to human health and resources, while the damage to resources is spread out over various sources.
4.3 Cumulative Energy Demand
This single score analysis method is utilized to see exactly how much energy is being
used to create a catalytic converter. The results show that about 260 MJ are used to create a
single catalytic converter. The bulk of the energy, 229 MJ, comes from extraction and
processing of the necessary materials. Almost 95% of this energy is due to stainless steel,
platinum, rhodium, and corrugated board boxes. The stainless steel itself makes of 45.2% of the
total material energy. While the loss of precious metals is important, the energy demand for the
stainless steel resources is greater than the precious metals due to its larger mass. The other three
materials make up 49.3% of the total material energy. Only 11.9% of the total energy is
attributed to the processing of a catalytic converter.
Of the 260 MJ of total energy, 221 MJ is from a non-renewable, fossil energy source.
Like the materials energy, the majority of the fossil energy is created from stainless steel,

56
platinum, rhodium and corrugated board boxes. These four sources make up 82.7% of the total
fossil energy. Overall, stainless steel, platinum and rhodium are the top three contributors to
total energy usage. These three materials make up 76.3% of all energy used to produce a
catalytic converter. It should be noted that the results are indicative of no recycling. The
energies are assuming all virgin materials, but with recycling, these energies and the total energy
could be reduced, as explained in section 2.5 Disposal. This is especially true since platinum and
rhodium are large energy producers in the virgin state.
57
5.0 Conclusions
A life cycle analysis was used to determine the environmental impact of creating and
using a catalytic converter in a car compared to not using a catalytic converter in a car. Two
models were created in SimaPro so allow for a life cycle comparison of a car with and without a
catalytic converter. These models were run and analyzed; they lead to the conclusion that a car
with a catalytic converter impacts the environment less than a car without a catalytic converter in
certain areas. The life cycle inventory showed that the carbon monoxide, hydrocarbon and
nitrogen oxide emissions were decreased significantly in using a catalytic converter. Only
carbon dioxide emissions were increased with the use of a catalytic converter, but this result was
expected. The carbon dioxide emissions can be seen as an environmental issue because this
pollutant is a greenhouse gas; it contributes to global warming potential, and has unknown long-
term health effects. However, this result is an environmental benefit if considering that short
term local atmospheric impacts, such as smog, are more important than long term global
environmental impacts, such as global warming potential. Within the car with a catalytic
converter, the emissions due to the use phase far exceeded the emissions due to the extraction
and manufacturing phase. The life cycle analysis results showed that the damages to human
health and ecosystem quality were significantly decreased with the use of the catalytic converter.
Resource damage and energy required are two categories in which a car with a catalytic
converter surpasses a car without a converter. Overall, this life cycle analysis concludes that a
catalytic converter is a worthwhile environmental product for short term atmospheric benefits.
58
6.0 Future Work
Life cycle analysis has the potential to indicate whether or not a product is or is not
environmentally friendly. This LCA showed that catalytic converters can be seen as a beneficial
environmental product; however, future work can be done to improve this project. As a project
continuation, this research suggests work in the following areas:
• Metal used for the substrate rather than cordierite ceramic.
While ceramic substrates have been more popular in the past, metal substrates are starting to
emerge. An analysis could be done to compare metal versus ceramic as the material used for
the substrate.
• Replace processing energies estimates.
The processing energies used in this analysis were compiled and estimated from various
sources. This analysis could be greatly improved with actual energy usage data from the
manufacturers.
• Processing of the metal catalyst.
The processing of the metal catalyst was left out of scope in this research. The addition of
catalyst processing details would help to more fully encompass processing of the catalytic
converter.
• Diesel or another form of fuel to power the vehicle.
It was assumed that the passenger car was fueled by gasoline in this research. Diesel
catalytic converters are different from gasoline catalytic converters. Diesel converters also
include a filter for particulate matter. An analysis could be done to show the similarities and
differences between diesel and gasoline converters. Also, an analysis could include other
forms of fueling such as biodiesel, electric and hybrid cars.

59
References
[1] Air pollution. (n.d.). Retrieved from
http://environment.nationalgeographic.com/environment/global-warming/pollution-
overview/
[2] Environmental Protection Agency, EPA National Vehicle and Fuel Emissions Laboratory.
(n.d.). Automobile emissions: An overview (EPA 400-F-92-007). Retrieved from Office
of Mobile Sources website: http://www.epa.gov/otaq/consumer/05-autos.pdf
[3] Diesel vehicles to account for 10% of u.s. market by 2015. (2008, September 16).
Environmental Leader: Environmental & Energy Management News, Retrieved from
http://www.environmentalleader.com/2008/09/16/diesel-vehicles-to-account-for-10-of-
us-market-by-2015/
[4] National Institute for Occupational Safety and Health, Centers for Disease Control and
Prevention. (2005). Facts about benzene. Retrieved from website:
http://www.bt.cdc.gov/agent/benzene/basics/facts.asp
[5] United States Department of Labor. Occupational Safety and Health Administration. Safety
and health topics: Toluene. (2004). Retrieved from website:
http://www.osha.gov/dts/chemicalsampling/data/CH_272200.html.
[6] Nitrogen oxides. (n.d.). Retrieved from
http://dwb.unl.edu/teacher/nsf/c09/c09links/www.casahome.org/nitrogen.htm
[7] Shochat, G. (2011, May 19). Carbon monoxide toxicity in emergency medicine. Retrieved
from http://emedicine.medscape.com/article/819987-overview
[8] Degobert, P. (1995). Automobiles and pollution. (2 ed., pp. 124-129). Warrendale, PA:
Society of Automotive Engineers, Inc.
[9] Lead in air: Health. (2012, March 13). Retrieved from http://epa.gov/air/lead/health.html
[10] Environmental Protection Agency, EPA National Vehicle and Fuel Emissions Laboratory.
(1994). Milestones in auto emissions control (EPA 400-F-92-014). Retrieved from Office
of Mobile Sources website: http://www.epa.gov/otaq/consumer/12-miles.pdf
[11] Motor vehicle emission controls: Technologies. (n.d.). Retrieved from http://www.air-
quality.org.uk/25.php

60
[12] Lachman, I., Bagley, R., & Lewis, R. (1981). Thermal expansion of extruded cordierite
ceramics. Ceramic Bulletin, 60(2), 202-205.
[13] Cordierite. In (2011). CES EduPack 2011
[14] Zhang, J. (n.d.). Catalytic converter – part i of automotive after-treatment system. Retrieved
from http://www.bowmannz.com/yahoo_site_admin/assets/docs/CatalyticConverter.
92123507.pdf
[15] Martyn, T., & Anthony, W. (2005). Autocatalysts Structured Catalysts and Reactors (pp.
109-146): CRC Press.
[16] Bloomfield , L. (n.d.). How does a catalytic converter work?. Retrieved from
http://www.physicscentral.com/experiment/askaphysicist/physics-
answer.cfm?uid=20080512095223
[17] Fritz, J. D. (1997). Sensitization and stabilization of type 409 ferritic stainless steel.
Materials performance, 36(8), 57.
[18] Wiley Critical Content - Petroleum Technology, Volume 1-2. (2007). John Wiley & Sons.
Retrieved from http://www.knovel.com.ezproxy.lib.vt.edu:8080/web/portal/browse/
display?_EXT_KNOVEL_DISPLAY_bookid=2125&VerticalID=0 . (pp: 502-507).
[19] United States Environmental Protection Agency, Office of Air Quality Planning and
Standards. (2000). Latest findings on national air quality: 1999 status and trends (EPA-
454/F-00-002). Retrieved from United States Environmental Protection Agency website:
http://www.epa.gov/air/airtrends/aqtrnd99/pdfs/brochure.pdf
[20] Curran, M. A. U.S. Environmental Protection Agency, Office of Research and
Development. (2006). Life cycle assessment: Principles and practice (EPA/600/R-
06/060). Reston: Scientific Applications International Corporation (SAIC).
[21] Warranty and maintenance manual 2003. (n.d.). Retrieved from
http://www.mitsubishicars.com/MMNA/jsp/owners-site/warranty.do
[22] Guidelines for Life-Cycle Assessment: A Code of Practice, Society of Environmental
Toxicology and Chemistry, Pensacola, FL, 1993.
[23] AECC - association for emissions control by catalyst frequently asked questions. (2012).
Retrieved from http://www.aecc.be/en/faq.html
[24] Richard, L. (2004). Magnesia Refractories Refractories Handbook (pp. 109-149): CRC
Press.

61
[25] Berndt, M., & Ksinsik, D. United States Patent and Trademark Office, (1986). Process of
manufacturing a catalyst for purifying the exhaust gases from internal combustion
engines and catalyst prepared by the process (Patent Number 4,624,941). Retrieved from
Doduco K.G. website: http://www.google.com/patents/US4624941?printsec=abstract
[26] About SimaPro. (n.d.). Retrieved from http://www.pre-sustainability.com/content/simapro-
lca-software
[27] Goedkeep, M., Oele, M., de Schryver, A., Vieira, M., & Hegger, S. (2010). Simapro
database manual. In SimPro (4.2 ed. pp. 6-9 and 26). Netherlands: Pre Consultants.
[28] Benito, J.M., Turrillas, X., Cuello, G.J., De Aza, A.H., De Aza, S., Rodríguez, M.A. (2012).
Cordierite synthesis. A time-resolved neutron diffraction study. Journal of the
European Ceramic Society, 32(2), 371-379, Retrieved from
http://www.sciencedirect.com/science/article/pii/S0955221911004766.
[29] Packaging calulator. (2010). Retrieved from http://www.packagingcalculator.com/
[30] AEP’s average fuel mix of electricity provided to Virginia customers. In (2010). 2010
Environmental Information.
[31] Reference document on best available techniques in the ceramic manufacturing industry.
(2007). Retrieved from http://eippcb.jrc.es/reference/BREF/cer_bref_0807.pdf
[32] Sheppard, L. (1988). Manufacturing ceramics with microwaves: the potential for
economical production. Ceramic Bulletin, 67(10), 1656-1660.
[33] Buck, R., Serrels, D., & Myers, S. United States Patent and Trademark Office, (1999).
Catalytic converter with deep drawn shells (Patent Number 6,001,314). Retrieved from
General Motors Corporation website: http://www.freepatentsonline.com/6001314.pdf
[34] Ulintz, P. (2000). Deep drawing stainless steel. Retrieved from
http://www.toolingbydesign.com/sitebuildercontent/sitebuilderfiles/DeepDrawingStainles
sSteel.pdf
[35] Colls, J. (2002). Air pollution: measurement, modelling, and mitigation. (Second ed., pp.
127-137). New York, NY: Spon Press.
[36] U.S. Environmental Protection Agency, (2009). Inventory of U.S. greenhouse gas emissions
and sinks: 1990-2007 (430-R-09-004). Retrieved from website:
http://www.epa.gov/climatechange/emissions/downloads09/GHG2007entire_report-
508.pdf

62
[37] EPA fuel economy. (n.d.). Retrieved from
http://www.fueleconomy.gov/feg/noframes/18573.shtml
[38] Ritter, S. (2009). Future of metals. Science and Technology, 87(23), 53-57. Retrieved from
http://pubs.acs.org/cen/science/87/8723sci1.html
[39] Stainless steel, ferritic, AISI 409, wrought, annealed. In (2011). CES EduPack 2011
[40] Tollefson, J. (2007). Worth its weight in platinum. Nature, 450, 334-335. Retrieved from
http://www.nature.com/news/2007/071114/full/450334a.html
[41] Platinum, commercial purity, P04995, annealed. In (2011). CES EduPack 2011
[42] Platinum-rhodium alloy, annealed. In (2011). CES EduPack 2011
[43] Atkinson, G., Kuczynski, R., & Desmond, D. United States Patent and Trademark Office,
(1992). Cyanide leaching method for recovering platinum group metals from a catalytic
converter catalyst (Patent Number 5,160,711). Retrieved from website:
http://www.freepatentsonline.com/5160711.pdf
[44] Bureau of Transportation Statistics, Research and Innovative Technology Administration.
(n.d.). Number of u.s. aircraft, vehicles, vessels, and other conveyances. Retrieved from
website:
http://www.bts.gov/publications/national_transportation_statistics/html/table_01_11.html
[45] Coal combustion by-products. (n.d.). Retrieved fro
http://www.caer.uky.edu/kyasheducation/whathappens.shtml
[46] U.S. Environmental Protection Agency, Office of Air Quality Planning and Standards.
(2010). Policy assessment for the review of the carbon monoxide national ambient air
quality standards (452/R-10-007). Retrieved from website:
http://www.epa.gov/ttn/naaqs/standards/co/data/20101022copafinal.pdf
[47] Kempler, S. NASA, (2011). Amateur guide for air quality testing . Retrieved from website:
http://disc.sci.gsfc.nasa.gov/oceancolor/additional/science-
focus/locus/amateur_guide_for_air_quality_000.shtml
[48] (n.d.). Los angeles. [Web Photo]. Retrieved from http://www.stratosjets.com/featured-jet-
charter/Jet-Charter-Flights-in-Los-Angeles

63
Appendix A: Calculations A.1 – Cordierite composition work:
The unbalanced equation of cordierite is:
Al2(Si2O5)(OH)4 + Mg3(Si2O5)2(OH)2 + Al2O3 + Al(OH)3 + SiO2 → Cordierite + Water ↑ (A.1)
where the inputs are: kaolin (Al2(Si2O5)(OH)4), talc (Mg3(Si2O5)2(OH)2), alumina (Al2O3),
aluminum hydroxide (Al(OH)3), and silica (SiO2). The weight percent of each input is known,
from Table 2.2. For ease of calculation, it is assumed that there is a 100 gram sample. The
results will be scaled up to correlate to the actual data. Table A.1 below gives the mass of each
input compound for a 100 gram sample.
Table A.1: Masses of inputs for a 100 gram sample
Input Material Mass (gram)
Kaolin 21.74
Talc 39.24
Alumina 11.23
Aluminum hydroxide 17.80
Silica 9.99
Total 100.0
These masses must be converted to moles. This is done by dividing the mass of the material by
the molecular weight of the material. Table A.2 below determines the moles for each material.

64
Table A.2: Moles of material inputs for a 100 gram sample
Material Mass (gram)
divided by
Molecular weight (g/mol)
equals
Moles (mol)
Kaolin 21.74 258.157 0.084212
Talc 39.24 379.259 0.103465
Alumina 11.23 101.961 0.11014
Aluminum
hydroxide 17.80 78.003 0.228196
Silica 9.99 60.083 0.16627
These moles can then be used to determine the masses of each input element. To find these
masses, the moles of the element (in the compound’s formula) are multiplied by the moles of the
compound material, which is then multiplied by the molecular weight of the element.
Table A.3: Masses of element inputs for a 100 gram sample
Material Element Moles of
element (mol) Moles of
compound (mol) Molecular weight of element (g/mol)
Mass of element (g)
Kaolin
Aluminum 2 0.084212 26.982 4.54
Silicon 2 0.084212 28.085 4.73
Oxygen 9 0.084212 15.999 12.13
Hydrogen 4 0.084212 1.008 0.34
Talc
Magnesium 3 0.103465 24.305 7.54
Silicon 4 0.103465 28.085 11.62
Oxygen 12 0.103465 15.999 19.86
Hydrogen 2 0.103465 1.008 0.21
Alumina Aluminum 2 0.11014 26.982 5.94
Oxygen 3 0.11014 15.999 5.29
Aluminum hydroxide
Aluminum 1 0.228196 26.982 6.16
Oxygen 3 0.228196 15.999 10.95
Hydrogen 3 0.228196 1.008 0.69
Silica Silicon 1 0.16627 28.085 4.67
Oxygen 2 0.16627 15.999 5.32

65
The totals for each element were found to be:
• Aluminum = 16.64 grams
• Silicon = 21.02 grams
• Magnesium = 7.54 grams
• Oxygen = 53.55 grams
• Hydrogen = 1.24 grams
These total input masses must be the same in the output. The masses are converted by taking the
mass of the element, and dividing it by the molecular weight of the element. Table A.4 below
gives the output moles of each element.
Table A.4: Moles of output elements for a 100 gram sample
Element Mass (gram)
divided by
Molecular weight (g/mol)
equals
Moles (mol)
Aluminum 16.64 26.982 0.6169
Silicon 21.02 28.085 0.7486
Magnesium 7.54 24.305 0.3104
Oxygen 53.55 15.999 3.347
Hydrogen 1.24 1.008 1.228
The right side of equation A.1 can be broken down into output compounds. Equation A.2
provides this breakdown.
Cordierite + Water → Al2O3 + SiO2 + MgO + H2O (A.2)
The moles of each element, seen in Table A.4, can be used to determine the moles of each output
compound. Referencing Equation A.2, there are two moles of aluminum in alumina; therefore,
the moles of alumina are half of the moles of aluminum. This means that there are

66
approximately 0.31 moles of alumina in a 100 gram sample. In the same manner, there is one
mole of silicon in silica; therefore, the moles of silica are equal to the moles of silicon. This
means that there is 0.75 moles of silica in a 100 gram sample. There is one mole of magnesium
in magnesia, so there are equal moles of magnesia and magnesium. From this, it is known that
there is 0.31 moles of magnesia in a 100 gram sample. Finally, there are two moles of hydrogen
in water. The moles of water are half of the moles of hydrogen; this is 0.61 moles of water in a
100 gram sample. All of these numbers can be checked by verifying the moles of the oxygen.
Equation A.3 below shows this verification. The result of Equation A.3 matches the oxygen
mole value found in Table A.4 above
(mol Al2O3 < mol O) + (mol SiO2 < mol O) + (mol MgO < mol O) + (mol H2O < mol O)
(0.31 < 3) + (0.75 < 2) + (0.31 < 1) + (0.61 < 1) = 3.35 (A.3)
Equation A.2 can now be modified to include the balanced mole count. This can be seen
in Equation A.4 below.
Cordierite + Water → 0.31 Al2O3 + 0.75 SiO2 + 0.31 MgO + 0.61 H2O (A.4)
This equation can be modified by dividing all coefficients 0.31 to give the following equation:
Cordierite + Water → Al2O3 + 2.5 SiO2 + MgO + 2.03 H2O (A.5)
This equation can again be modified by multiplying all coefficients 2 to give the following
equation:
Cordierite + Water → 2 Al2O3 + 5 SiO2 + 2 MgO + 4.07 H2O (A.6)

67
Equation A.6 shows that the composition found in Tables 2.2 and A.1 provides the expected
cordierite composition, seen in section 1.1.3, of two parts alumina, two parts magnesia and five
parts silica.
The moles calculated from the data in Table A.4 can be used to determine the masses of
each output compound. This is done in Table A.5 below.
Table A.5: Masses of output compounds for a 100 gram sample
Material Moles (mol)
multiplied
by
Molecular weight (g/mol)
equals
Mass (gram)
Alumina 0.31 101.961 31.6
Silica 0.75 40.304 12.5
Magnesia 0.31 60.083 45.0
Water 0.61 18.015 10.9
From this table, it is determined that of the initial 100 gram sample, cordierite is 89.1 grams, and
water is 10.9 grams.
This data must be scaled up to be used with the experimental data in this analysis. The
output cordierite was measured to be 832.3 grams. This number and Table A.5 can be used to
determine the output water. Equation A.7 below determines the total output mass, where ‘x’ is
the total output mass.
832.3 grams of cordierite + 10.9% (x) = x (A.7)
Solving for ‘x’, the total output mass is found to be 935.169 grams. From this, the amount of
output water is determined in Equation A.8 below. The percent of water is multiplied by the
total output mass.
10.9% (935.169 grams) = 102.768 grams (A.8)

68
The remaining output compounds are scaled up to the experimental data by dividing the
mass of each compound by the total cordierite mass for the 100 gram sample. This number is
then multiplied by the total cordierite mass for the experimental data. Table A.6 below gives the
conversion for the 100 gram sample to the experimental data.
Table A.6: Masses of output compounds for experimental data
Material Percent contribution Experimental Cordierite
mass (grams)
Experimental mass of
output compound (grams)
Alumina W31.689.1X � 0.36 < 100% � 35.5% 832.2 295.431
Silica W45.089.1X � 0.50 < 100% � 50.5% 832.2 420.261
Magnesia W12.589.1X � 0.14 < 100% � 14% 832.2 116.508
These masses can be converted back to moles to determine the moles of the inputs. Table A.7
below determines the moles of output compounds for the experimental data.
Table A.7: Moles of output compounds for experimental data
Material Mass (gram)
divided by
Molecular weight (g/mol)
equals
Moles (mol)
Alumina 295.431 101.961 2.9
Silica 420.261 60.083 6.9
Magnesia 116.508 40.304 2.9
Water 102.768 18.015 5.7
The output moles for the experimental data are about 9.35 times greater than the output moles for
the 100 gram sample. This factor can be applied to the input moles for the 100 gram sample to

69
determine the input moles for the experimental data. Equation A.9 below gives the balanced
equation for the 100 gram sample.
0.08 Al2(Si2O5)(OH)4 + 0.10 Mg3(Si2O5)2(OH)2 + 0.11 Al2O3 + 0.23 Al(OH)3 + 0.17 SiO2 →
0.31 Al2O3 + 0.75 SiO2 + 0.31 MgO + 0.61 H2O (A.9)
This equation can be scaled up for the experimental data by the multiplying the mole of each
compound by the factor determined above, 9.35. This can be seen in equation A.10 below.
0.75 Al2(Si2O5)(OH)4 + 0.94 Mg3(Si2O5)2(OH)2 + 1.0 Al2O3 + 2.2 Al(OH)3 + 1.6 SiO2 →
2.9 Al2O3 + 7.0 SiO2 + 2.9 MgO + 5.7 H2O (A.10)
The moles of the input compounds can be converted into masses by multiplying the moles by the
molecular weight of the input compounds. This conversion can be seen in Table A.8 below.
These masses will be input into SimaPro for the car with a catalytic converter model.
Table A.8: Masses of input compounds for experimental data
Material Moles (mol)
multiplied
by
Molecular weight (g/mol)
equals
Mass (gram)
Kaolin 0.75 258.157 193.62
Talc 0.94 379.259 356.50
Alumina 1.0 101.961 101.96
Aluminum
hydroxide 2.2 78.003 171.61
Silica 1.6 60.083 96.13

70
A.2 – Washcoat mass calculation
The washcoat is 100 parts by weight alumina and 4 parts by weight rare earth element
oxide are suspended in 250 parts by weight of water. The washcoat is 25 weight percent of the
cordierite substrate. The sample substrate was weighed at 1114.04 grams; therefore, the
washcoat is 278.51 or 25 weight percent of the substrate.

71
A.3 – Vehicle emission calculations
Table A.9 below gives the vehicle emissions in grams per mile. The emissions converted
are also included. As stated in the assumptions, the nitrogen oxides converted are negligible in
this study.
Table A.9: Vehicle emissions
Carbon monoxide
(g/mi) Hydrocarbons
(g/mi) Nitrogen oxides
(g/mi) Car without a catalytic
converter 43.5 4.5 2.74 Car with a catalytic
converter 3.22 0.3 0.644
Emissions converted 40.2 4.2 2.09
Table A.10 below determines the carbon dioxide emissions due to gasoline. This
emission amount is the total carbon dioxide emissions in the car without a catalytic converter.
The car with a catalytic converter will add this emission amount, plus the converted amounts
from Table A.9, plus any carbon dioxide emissions from extraction and processing.
Table A.10: Carbon dioxide emissions due to gasoline
Carbon dioxide emissions
8.92 kilograms CO2 per gallon of gasoline
divided by
24 miles per gallon
Equals
0.371667 kilograms CO2 per mile
Times
80000 miles (functional unit)
Equals
29733.33 kilograms of CO2

72
Table A.11 below provides the vehicle emissions in grams per mile for carbon dioxide.
This table has the converted hydrocarbon and carbon monoxide emissions as well as the
emissions due to gasoline.
Table A.11: Carbon dioxide emissions
Carbon dioxide (g/mi)
CO emissions converted 63.162
HC emissions converted 14.130
Gasoline 371.667
Total 448.958
Table A.12 below calculates the emissions for the pollutants for a car with and without a
catalytic converter. The emission in grams per mile is multiplied by the functional unit, giving a
total in grams. The grams are then converted to kilograms.
Table A.12: Pollutant emission calculations
Pollutant Emission Unit
Functional Unit
Pollutant Emission Unit
CO 43.5 g/mi
CO 3480 kg
HC 4.5 g/mi
HC 360.8 kg
NOx 2.74 g/mi
NOx 219.2 kg
CO 3.22 g/mi * 80000 miles = CO 257.6 kg
HC 0.3 g/mi
HC 25.76 kg
NOx 0.644 g/mi
NOx 51.52 kg CO converted
to CO2 63.162 g/mi
CO converted to CO2
5052.943 kg
HC converted to CO2
14.130 g/mi
CO converted to CO2
1130.395 kg

73
A.4 – Microwave firing calculations:
The range given for conventional drying and firing is 3.0 – 6.3 MJ/kg. Using the
energies for conventional drying and firing of refractories, a total energy can be found. Equation
A.11 provides the total energy for these processes. Equation A.12 gives the conventional drying
as a percentage of the total energy.
Total conventional energy for a refractory = Refractory conventional drying energy +
Refractory conventional firing energy
������������������������������������� � 10.87x10 kW ∙ h/yr �
38.53x10 kW ∙ h/y � 49x10 kW ∙ h/yr (A.11)
������������-�����.��������� � /0.123/0456∙7/89:;.:3/0456∙7/89 < 100% � 22.00% (A.12)
This percentage can be applied to the given range for drying and firing to show how much is the
drying itself. Applying 22% to the drying, firing range of 3.0 – 6.3 MJ/kg yields a drying range
of 0.66 – 1.386 MJ/kg. The remaining 2.34 – 4.914 MJ/kg is the range for conventional firing of
a refractory.
Referencing Table 2.7 on page 30, the conventional firing and microwave firing can be
compared. Equation A.13 gives the microwave firing energy as a percentage of conventional
firing energy.
>����?���Y�����.��������� � Z.1@3/0456∙7/89Z1.@Z3/0456∙7/89 < 100% � 9.992% (A.13)

74
This percentage can be applied to the conventional firing range, 2.34 – 4.914 MJ/kg, to
find the microwave firing range. This range is found to be 0.2338 – 0.4910 MJ/kg. Since this
range is characteristic of refractories, and not specifically cordierite, the average value, 0.7248
MJ/kg, is used in the analysis.
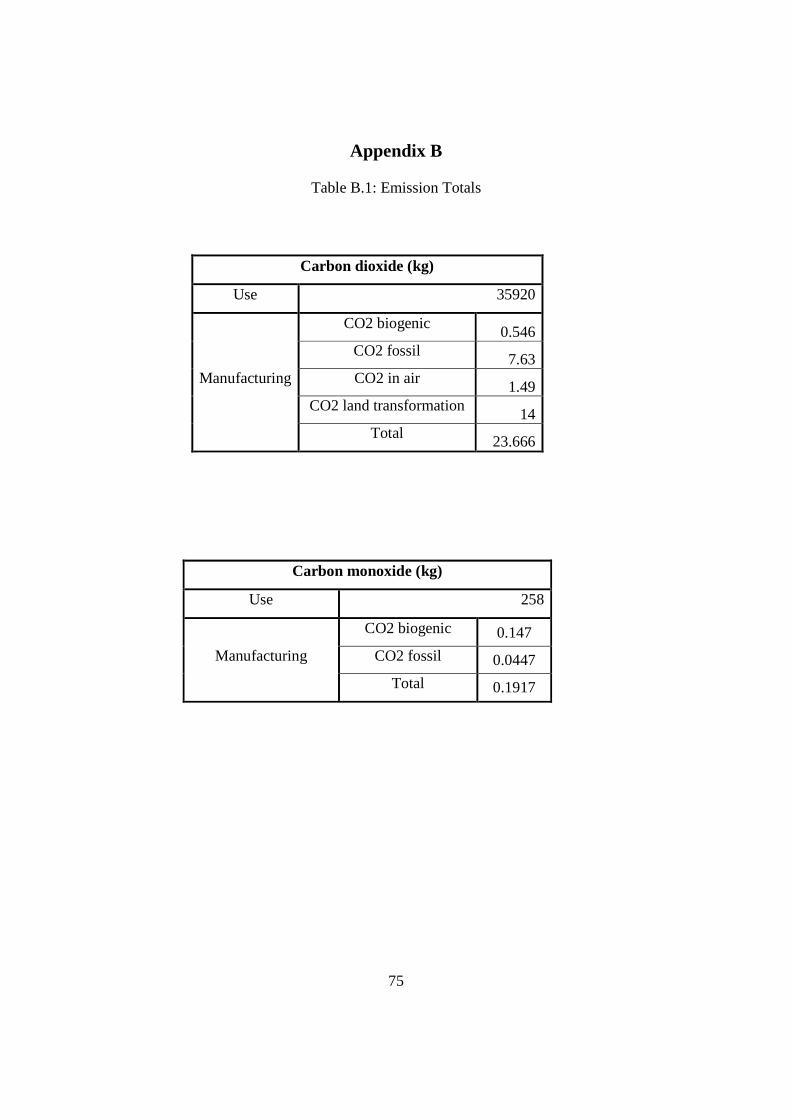
75
Appendix B
Table B.1: Emission Totals
Carbon dioxide (kg)
Use 35920
Manufacturing
CO2 biogenic 0.546
CO2 fossil 7.63
CO2 in air 1.49
CO2 land transformation 14
Total 23.666
Carbon monoxide (kg)
Use 258
Manufacturing
CO2 biogenic 0.147
CO2 fossil 0.0447
Total 0.1917

76
Hydrocarbons (kg)
Use 25.8
Manufacturing
Hydrocarbons, aliphatic, alkanes, cyclic 0.000000133
Hydrocarbons, aliphatic, alkanes,
unspecified, air 0.0000275
Hydrocarbons, aliphatic, alkanes,
unspecified, water 0.00000281 Hydrocarbons, aliphatic, unsaturated, air
0.0000069 Hydrocarbons, aliphatic, unsaturated, water
0.000000259 Hydrocarbons, aromatic, air 0.0000531
Hydrocarbons, aromatic, water 0.0000121
Hydrocarbons, chlorinated 0.000000412
Hydrocarbons, unspecified, water 0.0000924 Total
0.000158012
Nitrogen Oxides (kg)
Use 51.5
Manufacturing 0.1