Embed Size (px)
Citation preview

Life Cycle Analysis of Coal and
Natural Gas-fired Power Plants
Phil DiPietro
U.S. DOE, National Energy Technology Laboratory
Presented to EPRI Coal Fleet July 20, 2010
Attachment A.ANR:VGS.RTP.3-1i
VGS013315

NATIONAL ENE,GY TECHNOLOGY LA30?ATOVY 2
MISSION
Advancing energy options to fuel our economy,
strengthen our security and improve our
environment
National Energy Technology Laboratory
Pittsburgh, PA
Morgantown,
WV
Fairbanks, AK
Sugar Land,
TX
West VirginiaPennsylvaniaOregon
Albany,
OR
VGS013316

I
I I
NATIONAL ENE,GY TECHNOLOGY LA3CRATOVY 3
NETL FY 2010 Budget ($M)
FY10
AppropriationFY11 Request
FE Coal R&D 407.4 402.3
CCPI/FutureGen 643.0 0.0
FE Oil & Gas R&D 87.8 0.0
FE Program Direction 125.2 120.4
Plant & Capital Equip. 20.0 20.0
Envir. Restoration 9.9 9.9
FE Earmarks 36.9 0.0
EERE R&D 425.0 430.0
OE 81.0 97.0
Other-DOE 5.0 6.0
Non-DOE/WFO 29.0 25.0
NETL Total 1,870.2 1,110.6
PMC (Golden/NREL) 950.0 850.0
TOTAL 2,820.2 1,960.6
VGS013317

NATIONAL ENE,GY TECHNOLOGY LA30?ATOVY 4
Context
On April 13, 2010, representatives from EPRI and NETL
met at the Pittsburgh Marriott to discuss collaborations
between the two entities.
The purpose of this presentation is to share
information with EPRI and look for ways to follow up.
NETL became interested in full life cycle analysis when
considering liquid fuels and biomass co-firing, will
soon publish LCA documents on power platforms.
VGS013318

NATIONAL ENE,GY TECHNOLOGY LA3CRATOVY 5
Life Cycle Assessment
Compilation and evaluation of the inputs, outputs and the
potential environmental impacts of a product or process
throughout its life cycle, from raw material acquisition to
the final disposal
LC Stage #1
Raw Material Acquisition
(RMA)
LC Stage #2
Raw Material Transport
(RMT)
LC Stage #3
Energy Conversion
Facility
(ECF)
LC Stage #4
Product Transport
(PT)
LC Stage #5
End Use
Upstream Emissions Downstream Emissions
VGS013319

NATIONAL ENE,GY TECHNOLOGY LA30?ATOVY 6
Why LCA? #1
• Upstream greenhouse gas emissions factors
(kg CO2e/MMbtu @ plant gate)
– Subbituminous coal 1.2
– Domestic crude oil 4.9
– Lignite coal 5.2
– Bituminous coal 9.2
– Imported crude oil 11.0
– Corn Stover 20.0
– Oil Sands, Canada 21.0
– Natural gas 23.2
– Switch Grass 27.0
– LNG (Trinidad) 39.9
Coal has favorable
upstream GHG
emissions compared to
other fuels
VGS013320

NATIONAL ENE,GY TECHNOLOGY LA30?ATOVY 7
797
103
948
218
0
100
200
300
400
500
600
700
800
900
1000
IGCC IGCC/CCS
Glo
bal
War
min
g P
ote
nti
al(k
g C
O2e
/MW
H)
Combustion Only (Busbar) Total Life Cycle
Why LCA? #2
Non-combustion emissions
become more significant after
CCS is applied
VGS013321

NATIONAL ENE,GY TECHNOLOGY LA30?ATOVY 8
Why LCA? #3
• Life Cycle Analysis establishes a platform for talking
about embodied GHG emissions and trade impacts
– Heavy crudes versus enhanced oil recovery
– LNG versus shale gas
– Imported manufactured goods due to higher energy
prices
VGS013322

NATIONAL ENE,GY TECHNOLOGY LA30?ATOVY 9
Why Not LCA?
• Two of the non-intuitive things that LCA gets right
are not significant in fossil power pathways
– Cost of construction and decommissioning
– Nuances of allocating interventions among by-
products
• Differences between apples and oranges (farms and
coal mines) can get lost in the LCA structure, no way
to combine disparate interventions
VGS013323

NATIONAL ENE,GY TECHNOLOGY LA30?ATOVY 10
Five Baseload Power Plant Technologies
Evaluated with and without CCS
• Coal Cases
– Integrated Gasification Combined Cycle (IGCC)
– Super-Critical Pulverized Coal (SCPC)
– Existing Sub-Critical Pulverized Coal (EXPC)
• Natural Gas Cases
– Combined Cycle with Liquefied Gas (NGCC-LNG)
– Combined Cycle with Domestic (NGCC)
VGS013324
NATIONAL ENE,GY TECHNOLOGY LA30?ATOVY 11
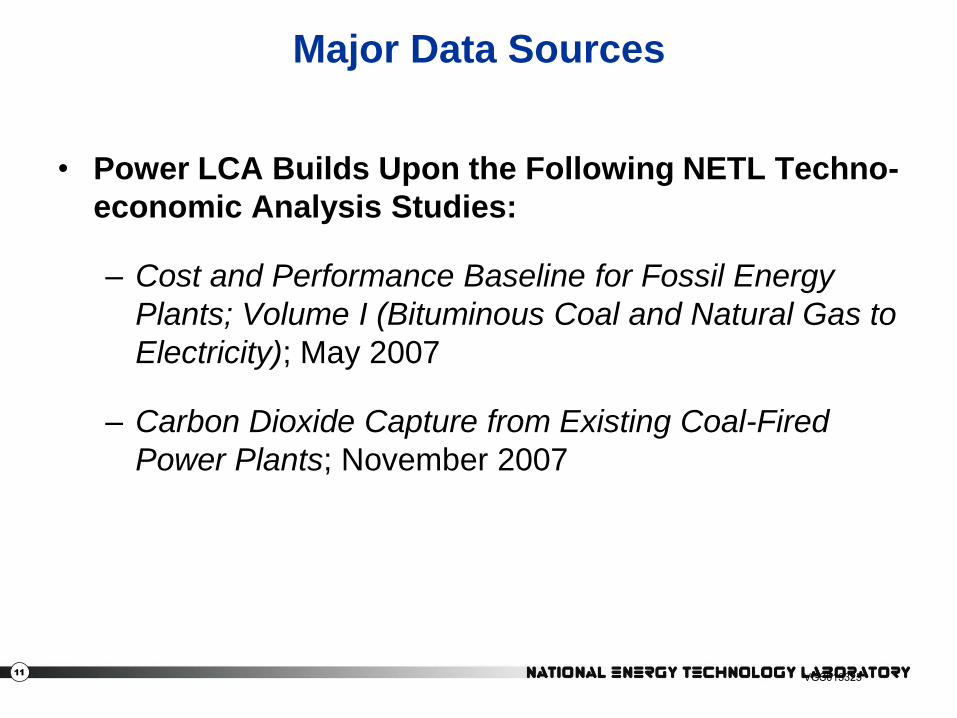
Major Data Sources
• Power LCA Builds Upon the Following NETL Techno-
economic Analysis Studies:
– Cost and Performance Baseline for Fossil Energy
Plants; Volume I (Bituminous Coal and Natural Gas to
Electricity); May 2007
– Carbon Dioxide Capture from Existing Coal-Fired
Power Plants; November 2007
VGS013325
• • • •
NATIONAL ENE,GY TECHNOLOGY LA30?ATOVY 12
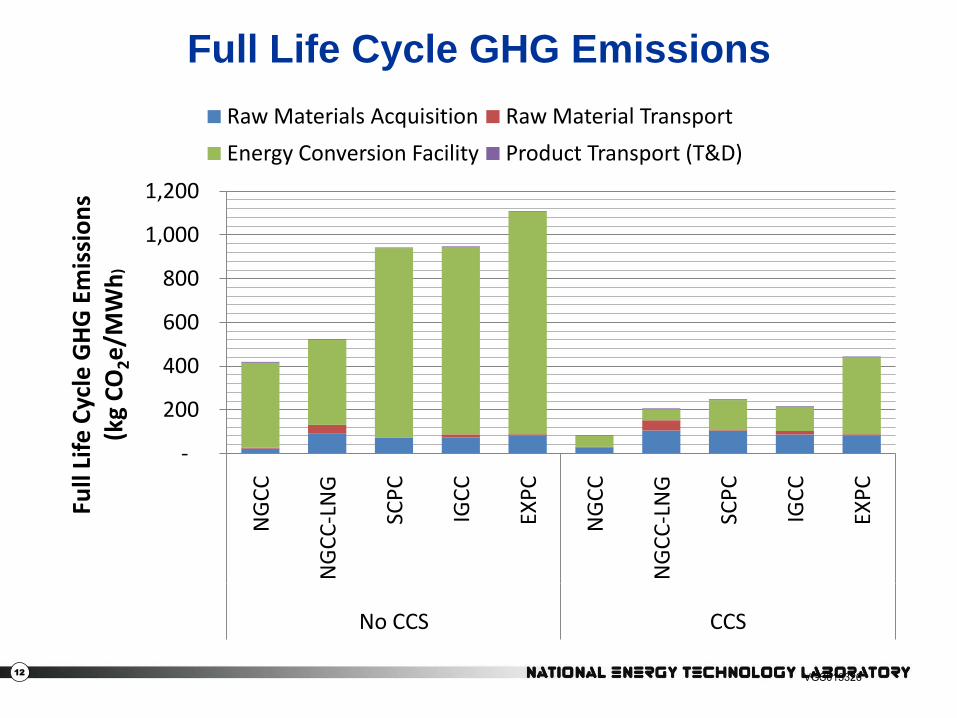
Full Life Cycle GHG Emissions
-
200
400
600
800
1,000
1,200
NG
CC
NG
CC
-LN
G
SCP
C
IGC
C
EXP
C
NG
CC
NG
CC
-LN
G
SCP
C
IGC
C
EXP
C
No CCS CCS
Full
Life
Cyc
le G
HG
Em
issi
on
s (k
g C
O2e
/MW
h)
Raw Materials Acquisition Raw Material Transport
Energy Conversion Facility Product Transport (T&D)
VGS013326

NATIONAL ENE,GY TECHNOLOGY LA30?ATOVY 13
Full Life Cycle and Combustion Only GHG
Emissions
797
103
948
218
0
100
200
300
400
500
600
700
800
900
1000
IGCC IGCC/CCS
Glo
bal
War
min
g P
ote
nti
al(k
g C
O2e
/MW
H)
Combustion Only (Busbar) Total Life Cycle
VGS013327

NATIONAL ENE,GY TECHNOLOGY LA30?ATOVY 14
Factors Driving the Difference Between
Combustion-only GHG Emissions and LCA
IGCC/CCS Case
GWP SourceContribution to the delta Assumptions
Coal Mine Methane 65.3% 360 scf CH4/ton coal (Illinois No. 6)
Train Transport 13.1% 1,200 miles (Ill to Mississippi), 328 BTU/ton-mile
T&D Losses 6.8% 7% resistive loss
CO2 Storage Leaks 5.7% 1% over 100 years
CO2 Pipeline Leaks 2.8% 0.5% per 100 miles
Coal Mining 2.7% 33 kWh electricity per ton coal mined
SF6 emissions 2.5%4 transformers, 690 lbs of fluid/transformer,0.1% loss/year
Plant Const. & Decomm.
1.0%Decommissioning emissions are 10% of construction emissions
VGS013328

Stage #1: Raw Material Acquisition
Coal ExtractionOperation Mine Decommissioning
Stage #3:Energy Conversion Facility With CCS System Construction Installation Plant Construction/
Installation 1
Plant Operation >-10. Carbon Capture (CC),
Operation
fi r Plant
Decommissioning
-111.• CO2 Pipeline, Operation -111' CO2 Sequestration,
Operation
• • • Deinstallation •
Stage #2:Raw Material Transport
Train Operation Train & Rail
Manufacturing
Stage #4:Product Transport
Transmission & Distribution, Operation
End Use
Mine Constructions
NATIONAL ENE,GY TECHNOLOGY LA3CRATCRY 15
LCA’s Expanded Boundary for IGCC
Traditional
Power
Study
Boundary
LCA study boundary
extends from extraction of
raw materials from the
earth (e.g., coal mining)
thru delivery of the power
to the end customer.
VGS013329

Train & Rail Manufacturing
Train Operation
Deinsta I lation
Plant Decommissioning
ge #2:Raw Material Transport
'Stage #3:Energy Conversion Facility
Plant Construction/ Installation
Plant Operation
rWFth CCS System
Carbon Capture (CC), Operation
Construction & Installation
-*COQ Pipeline, Operation CO2 Sequestration,
Operation
I-Stage #4:Product Transport
Transm ssion & Distribution, Operation
Mine Constructions 1Coal Extraction Operation
ic
(Stage #1: Raw Material Acquisition
Mine Decommissioning
End Use
NATIONAL ENE,GY TECHNOLOGY LA3CRATOVY 16
Coal Mining is a Critical Source of Emissions
in a CCS System
VGS013330

cast iron zinc
V Longwall Mining System,
Con struction • Hydraulic Shield, 28.2 Tons, 2
Meter • line Pan, 2.5 Tom • Electric Head Drive, 65 Tons • Electric Tail Drive, 45 Tons • I K —ectr.c Shearer, 62.5 Tons • Electric Stage Loader, 90 Tons
Illinois No. 6 Underground Coal Mine System, Construction
• Continuous Miner, 755 HP .• Conveyor System, 48 Inch •• Shuttle Car, 95 Horsepower
V
Buildings and Pavement for
Illinois No. 6 Coal Mine, Construction
Commissioning/ Decommissioning
water
asphalt) (rubber steel
✓ T V V
Coal Preparation Facility for Illinois No. 6 Coal Mine, Construction
Steel Coal Loading Silo, 325 Tons Coal Stockpile Stacker, 450 Tonnes Coal Crusher, 25400016 Coal Cleaning Facility Wastewater Treatment Plant, Underground Coal Mine
■
Illinois No. 6 Underground Bituminous Coal Mine Construction
Illinois No, 6 Underground Bituminous Coal
Mine Operation
coal
NATIONAL ENE,GY TECHNOLOGY LA3CRATOVY 17
Detail of Illinois No. 6 Coal Acquisition Processes
VGS013331

tb fb. 0 \ \ ' 'c\ \
ric Ic Ic ' ts\OC% 1 . 03 •SO •00 \-.
,_<2716 • & Ov ,,S% A‘9'c
i
NV .r _ ‘ e,c 7 .e • •c• ns; _c,G)
6A- \c\ • \)..\cf6 ,zo \,,
N Q9 N?
1?0 0.<7 • 'C.•
•
MC; NATIONAL ENE,GY TECHNOLOGY LA30?ATOVY 18
Methane Content by Coal Origin
242
342 344379
445
360
0
100
200
300
400
500
Co
al C
H4
Co
nte
nt
(scf
/to
n)
VGS013332

• •
NATIONAL ENE,GY TECHNOLOGY LA30?ATOVY 19
NGCC-LNG Global Warming Potential
362
42
524
206
0
100
200
300
400
500
600
NGCC-LNG NGCC-LNG/CCS
Glo
bal
War
min
g P
ote
nti
al(k
g C
O2e
/MW
h)
Combustion Only (Busbar) Total Life Cycle
VGS013333

NATIONAL ENE,GY TECHNOLOGY LA30?ATOVY 20
Factors Affecting the Difference Between Combustion
and Full Life Cycle Emissions, NGCC-LNG
NGCC-LNG/CCS Case
GWP Source Contribution Assumptions
Liquefaction 44.3%Port Fortin, Trinidad; uses 23% of incoming NG for liquefaction
Drilling Operation 19.6% Offshore gas-only well
Regasification 12.4% Via combustion of a portion of the NG
Tanker Operation 8.8% Boil-off rate: 0.15%/day to, 0.10%/day return
Natural gas pipeline 7.5% 334.6 km, 0% loss factor assumed
Power T&D Losses 2.1% “Make-up power” for 7% Transmission & Distribution Loss
Substation SF6 2.0% 4 transformers, 690 lbs of fluid/transformer, 0.1% loss/year
CO2 Storage Leak 2.0% 1% over 100 years
CO2 Pipeline Operation 1.0% 0.5% per 100 miles
Plant Const. & Decomm. 0.3%Decommissioning emissions are 10% of construction emissions
VGS013334

It a 23 ice
MC; NATIONAL ENE,GY TECHNOLOGY LA30?ATOVY 21
NG Consumed or Lost for LNG process
Nature
LC Stage #1
NG Extraction + Pipeline
LC Stage #1
NG Lique-faction
LC Stage #2
LNG Water Tanker
Transport
LC Stage #2
LNG Water Tanker
Docking
LC Stage #2
NG Regasific
ation
LC Stage #2
Pipeline Delivery to NGCC
LC Stage
#3
• 1.3 kg of gas extracted for every 1 kg delivered
– 0.29 kg (22%) consumed as fuel
– 0.008 kg (1%) lost to atmosphereVGS013335

h 1
• •
M
MC; NATIONAL ENE,GY TECHNOLOGY LA3CRATOVY 22
Power LCA Study Results:
Criteria Air Pollutants (NOX)
0.0
0.5
1.0
1.5
2.0
2.5w
o/C
CS
w/C
CS
wo
/CC
S
w/C
CS
wo
/CC
S
w/C
CS
wo
/CC
S
w/C
CS
wo
/CC
S
w/C
CS
IGCC NGCC-LNG NGCC SCPC EXPC
Life
Cyc
le N
Ox
(kg/
MW
h)
RMA RMT ECF
VGS013336

NATIONAL ENE,GY TECHNOLOGY LA30?ATOVY 23
Ranked Results
• By assigning ranks in each of 3 major categories for
each generation type, there are no clear winners, and
lots of tradeoffs
Ranks
GWP LCOECapital
Cost
No CCS
IGCC 9 5 8
NGCC-LNG 7 3 2
NGCC 6 3 2
SCPC 8 2 6
EXPC 10 1* 1*
With CCS
IGCC 3 9 9
NGCC-LNG 2 7 4
NGCC 1 7 4
SCPC 5 10 10
EXPC 4 6* 7*
* These ranks are based on the incremental cost of adding decommissioning and CCS with
replacement power to and existing plant.
VGS013337

• • ■
x
0 NATIONAL ENE,GY TECHNOLOGY LA30?ATOVY 24
Cost of Power vs. LC GWP Performance
IGCC
NGCC-LNG NGCC
SCPC
EXPC
EXPC/CCS
IGCC/CCS NGCC-LNG/CCS
NGCC/CCS
SCPC/CCS
$0.00
$0.02
$0.04
$0.06
$0.08
$0.10
$0.12
0 200 400 600 800 1,000 1,200
LCO
E ($
/kW
h)
Life Cycle Global Warming Potential (kg CO2e/MWh)
VGS013338

NATIONAL ENE,GY TECHNOLOGY LA30?ATOVY 25
Power LCA Study Results
CaseNameplate
Capacity (MW)
Capacity Factor
Capital Cost
($/kW)
LCOE(Mills/kWh)
Criteria Air Pollutants(kg/MWh)
Water Use(liters/MWh) GWP
(kg CO2e /MWh)NOx SOx PM Withdrawal Consumption
IGCC 640 80% $2,106 77.4 0.28 0.08 0.08 1,694 1,107 948
IGCC/CCS 556 80% $2,911 104.0 0.29 0.08 0.09 2,203 1,366 218
NGCC-LNG 560 85% $712 68.3 0.44 0.20 0.01 1,136 908 524
NGCC-LNG/CCS 482 85% $1,547 97.2 0.51 0.23 0.01 2,031 1,596 206
NGCC 560 85% $712 68.3 0.56 0.004 0.004 1,132 819 419
NGCC/CCS 482 85% $1,547 97.2 0.65 0.005 0.005 2,027 1,493 84
SCPC 550 85% $1,853 65.1 0.31 0.38 0.06 2,570 1,688 943
SCPC/CCS 546 85% $3,469 115.1 0.45 0.03 0.09 4,895 3,366 248
EXPC 430 85% $196 27.7 2.06 2.38 0.70 3,079 2,003 1,109
EXPC/CCS + RP 430 85% $2,020 125.3 0.46 1.31 0.02 6,038 3,407 444
EXPC/CCS 336 85% $2,020 88.7 0.03 0.03 0.03 5,343 4,086 296
VGS013339

NATIONAL ENE,GY TECHNOLOGY LA30?ATOVY 26
Upstream Emissions: kg CO2e/MMBtu Fuel
Coal Crude Oil Natural Gas BiomassB
itu
min
ou
s (I
ll #6
) U
nd
ergr
ou
nd
Min
e
Sub
-Bit
um
ino
us
Surf
ace
Min
e
Lign
ite
U
nd
ergr
ou
nd
Min
e
Imp
ort
D
rilli
ng
Do
me
stic
D
rilli
ng
Oil
San
ds
Surf
ace
Min
e
Do
me
stic
D
rilli
ng
LNG
(Tr
inid
ad)
Off
sho
re D
rilli
ng
Co
rn G
rain
Fa
rm H
arve
st
Co
rn S
tove
r Fa
rm H
arve
st
Swit
chgr
ass
Farm
Har
vest
SRW
C
Pla
nta
tio
n H
arve
st
Material Acquisition
7.69 0.824 4.66 9.2 4.2 20.0 19.9 27.2 23.9 19.7 26.7 32.4
Transport Method
Unit Train PipelinePipelin
eTanker, Pipeline
Truck
Material Transport
1.46 0.373 0.492 1.8 0.7 1.0 3.3 12.7 0.182 0.304 0.377 0.133
Total Upstream
9.2 1.20 5.2 11.0 4.9 21.0 23.2 39.9 24.1 20.0 27.1 32.5
VGS013340

NATIONAL ENE,GY TECHNOLOGY LA30?ATOVY 27
Contact Information
Timothy SkoneLead General Engineer
Situational Analysis & Benefits(412) 386-4495
Robert JamesGeneral Engineer
Situational Analysis & Benefits(304) 285-4309
Joe Marriott, PhDAssociate
Booz Allen Hamilton(412) 928-4700
VGS013341