Embed Size (px)
Citation preview
Int. J. Environ. Res., 6(3):801-814, Summer 2012ISSN: 1735-6865
Received 23 Nov. 2011; Revised 4 May 2012; Accepted 14 May 2012
*Corresponding author E-mail: [email protected]
801
Life Cycle Assessment of Advanced Zero Emission CombinedCycle Power Plants
Ataei, A.*, Iranmanesh, A. and Rashidi, Z.
Department of Energy Engineering, Graduate School of the Environment andEnergy, Science and Research Branch, Islamic Azad University, Tehran, Iran
ABSTRACT:This study investigated different concepts for natural-gas-fired power plants with the CO2
capture, and compared them based on the net plant efficiency and emission of CO2. The cycles were based ona six oxy-fuel, one post-combustion and two pre-combustion capture concept. This paper presented theresults of an environmental evaluation performed by the application of the Life Cycle Analysis (LCA) methodusing SimaPro model to compare an Advanced Zero Emission Power Plant (AZEP) concept with a conventionalcombined cycle power plant from 50MW to 400MW. The LCA study was built upon the calculation and thecomparison of several impacts (emissions of CO2, CO, NOX, and SOX, consumption of water and primaryenergy) and several impact categories (climate change, acid rain, ozone depletion and Ecotoxicity). The workwas developed entirely using the Eco-indicator99 of the LCA method. The results showed that for all studiedimpacts, the AZEP power plants have fewer impacts. However, compared to the conventional combined cyclepower plants, the total primary energy consumption in the AZEP concept is bigger due to the lower electricefficiency.
Key words: CO2 capture, zero emissions, combined cycles, LCA, Simapro, Eco-indicator99
INTRODUCTIONThe target of the LCA study was the comparison of
the environmental burdens associated with differentelectric power production systems. Some differentcases of the same plant size (50 to 400 MW) wereconsidered: the conventional CCGT without CO2capture, a CCGT including the AZEP (85,100%) concept(Bolland and Undrum, 2003; Bolland and Saether, 1992;Sundkvist et al., 2001). The LCA study was built uponthe calculation and the comparison of several impacts(emissions of CO2, CO, NOX, and SOX, consumption ofwater and primary energy) and several impact categories(Greenhouse Effect, Acid Rain, Ozone Depletion, andPhotochemical Formation). Alternatively, combustionin O2 / CO2 atmospheres, whilst enabling almost totalCO2 and NOX recovery, require expensive and energy-consuming oxygen supplies.A less energy-intensiveproposition is based on Mixed Conducting Membranes(MCM), which produce pure oxygen from air. MixedConducting Membranes are made from non-porous,metallic oxides that operate at high temperatures of over700°C, and they have high oxygen flux and selectivity
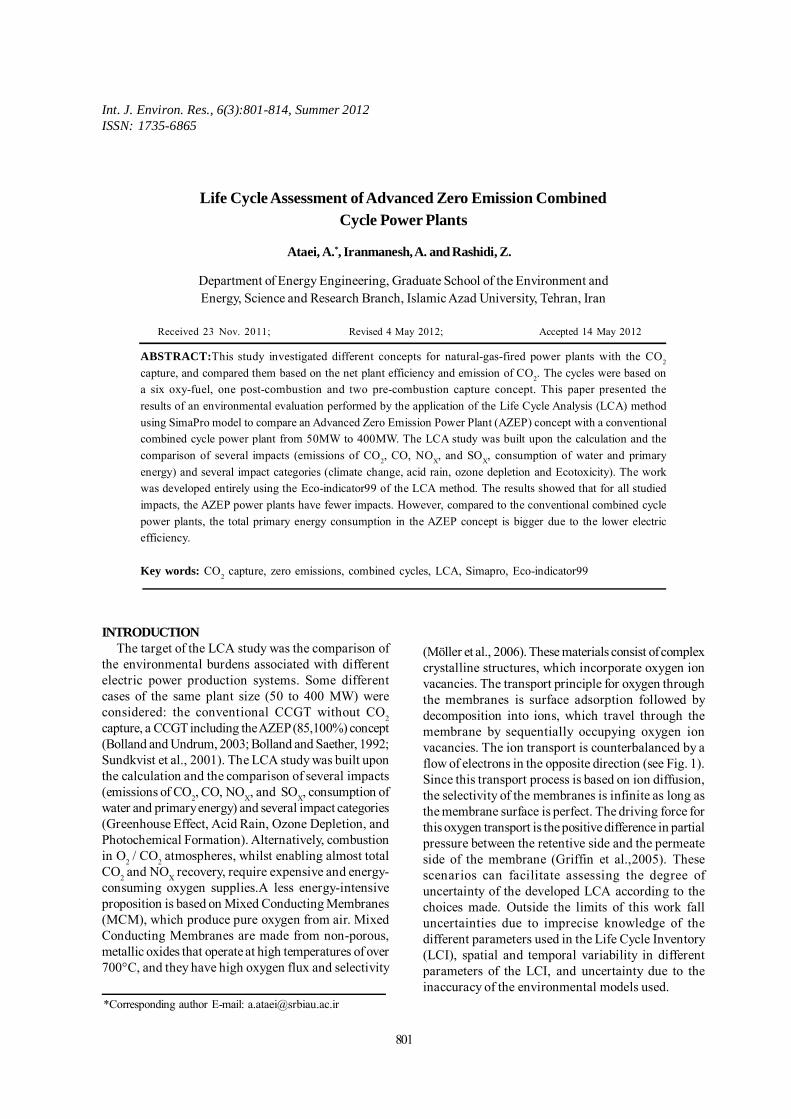
(Möller et al., 2006). These materials consist of complexcrystalline structures, which incorporate oxygen ionvacancies. The transport principle for oxygen throughthe membranes is surface adsorption followed bydecomposition into ions, which travel through themembrane by sequentially occupying oxygen ionvacancies. The ion transport is counterbalanced by aflow of electrons in the opposite direction (see Fig. 1).Since this transport process is based on ion diffusion,the selectivity of the membranes is infinite as long asthe membrane surface is perfect. The driving force forthis oxygen transport is the positive difference in partialpressure between the retentive side and the permeateside of the membrane (Griffin et al.,2005). Thesescenarios can facilitate assessing the degree ofuncertainty of the developed LCA according to thechoices made. Outside the limits of this work falluncertainties due to imprecise knowledge of thedifferent parameters used in the Life Cycle Inventory(LCI), spatial and temporal variability in differentparameters of the LCI, and uncertainty due to theinaccuracy of the environmental models used.
802
Ataei, A. et al.
Fig. 1. Mixed Conducting Membrane(Griffin et al., 2003)
MATERIALS & METHODSLife cycle assessment (LCA) is a method to evaluate
the environmental impacts of product systems ‘fromthe cradle to the grave’. The life cycle inventory (LVI)includes emissions and resources used from resourceextraction, production, and distribution, to the disposalphase. The impact assessment evaluates thecontribution of these emissions and resource uses tospecific environmental impacts such as global warming,human toxicity, and biotic resource extraction(Kanokporn and Iamaram, 2011; Veltman et al., 2010).LCA has been developed independently in a numberof applications and disciplines, including chemicalengineering and energy analysis. The assessment ofalternative energy technologies has been one of themost important application areas, and initialassessments have focused on the cumulative (fossil)energy demand, including embodied or “grey” energy.An important motivation in the 1970s was to comparefossil and renewable energy technologies consistentlyin terms of the energy services they delivered for agiven amount of fossil fuel. LCA has since beenextended to address a wide range of environmentalconcerns. It has been standardized by ISO.
In order to facilitate the understanding of the workpresented in this paper, the author presents a briefsummary of the LCA that serves as the basis for thestudy: a LCA model of a natural gas combined-cyclepower plant with or without CO2 capture with theobjective of identifying the main types ofenvironmental impact throughout the life cycle, in order
to deûne possible ways of achieving environmentalimprovements (Bolland and Undrum, 2003; Bolland andSaether, 1992; Saeedi and Amini, 2007; Salehi et al.,2010;Singh et al., 2011). The ûnal environmental effect aftera lifespan of 20 years, and the reduction in emissionsand pollution due to the use of a clean energy sourcewas also evaluated. It was analyzed during the differentstages of its life cycle, taking into consideration theproduction of each of its component parts, thetransport, the installation, the start-up, and theoperation (Clerici,2003). The software used in theenvironmental analysis was SimaPro7.0 by PréConsultants (Pre Consultants, 2011). The procedures,details, and results obtained were based on theapplication of the existing international standards ofLCA .In addition, environmental details and indicationsof materials and energy consumption provided by thevarious companies related to the production of thecomponent parts were certiûed by the application ofthe environmental management system ISO14001.According to the requirements of the standardISO14044, allocation was avoided, since only theproduction of electrical power was considered as thefunction of the system in the study. LCA methodologywas based on Eco-indicator99. A series of cut-offcriteria was established in order to develop the studyin practice by deûning the maximum level of detail inthe gathering of data for the different components.The main cut-off criterion chosen was the weight ofeach element in relation to the total weight. Thislimitation in data collection did not mean a signiûcantweakening of the ûnal results obtained; it simplyallowed the researchers to streamline, facilitate, andadjust the LCA study to make it more ûexible. Thecharacterization of each component was obtained fromthe most important basic data of its manufacture: theraw material required, the direct consumption of energyinvolved in the manufacturing processes, and theinformation regarding transport used. This informationfor speciûc substances included the primary energyconsumption use related to the production,transportation, and manufacture of 1 kg of material.Due to limitations of time and cost, the LCA wasperformed under the following conditions: The cut-offcriterion used was the weight of the components.Previous work has indicated that the most efficientand cost-effective utilization of the MCM reactor is itsintegration into a conventional gas turbine system toproduce an Advanced Zero Emissions Power Plant,the AZEP concept (Amini et al., 2008; Ataei et al., 2011;Ataei and Yoo, 2010; Yoo et al., 2010). The combustionchamber in an ordinary gas turbine is here replaced bythe MCM-reactor, which includes a combustionchamber, a ‘low’ temperature heat exchanger, an MCMmembrane, and a high temperature heat exchanger
Int. J. Environ. Res., 6(3):801-814, Summer 2012
803
(Bruun,2000). After compression in the ordinary gasturbine compressor, the compressed air at about 18 baris heated to about 800 - 900°C in the ‘low’ temperatureheat exchanger before it enters the MCM membrane(Ataei et al., 2011). The MCM section combines heattransfer and oxygen transport between the air streamand a sweep gas stream. Permeated oxygen is pickedup by means of the circulating sweep gas containingmainly CO2 and H2O. The concentration of oxygen inthe circulating gas is about 10% at the inlet of theburner. Hot combusted gas then enters the hightemperature heat exchanger co-current to the oxygendepleted air stream. This air stream is then heated to1200°C (up to 1400°C). The pressure difference overthe membrane should be kept low (below 0.5 bar) tominimize any leakage. About 10% of the combustedgas is bled off at about 18 bar and heat is recovered byheating a smaller part of the compressed air. The hotoxygen-depleted air is then expanded in the turbine togenerate electrical power. Waste heat in both theoxygen-depleted air stream and the CO2 containingbleed gas stream is recovered in HRSG’s by generatingsteam at various pressure levels and by pre-heatingthe fuel gas. The steam is utilized in a steam turbine forpower generation. The CO2 containing bleed gas isfurther cooled to condense water. CO2 is recovered,compressed from about sweep gas pressure, liquefied,and then pumped to its final pressure (100 bar). Theconcept allows 100% CO2 capture, and in this case,has less than 1 ppm v/v NOx in the oxygen-depletedoutlet air.
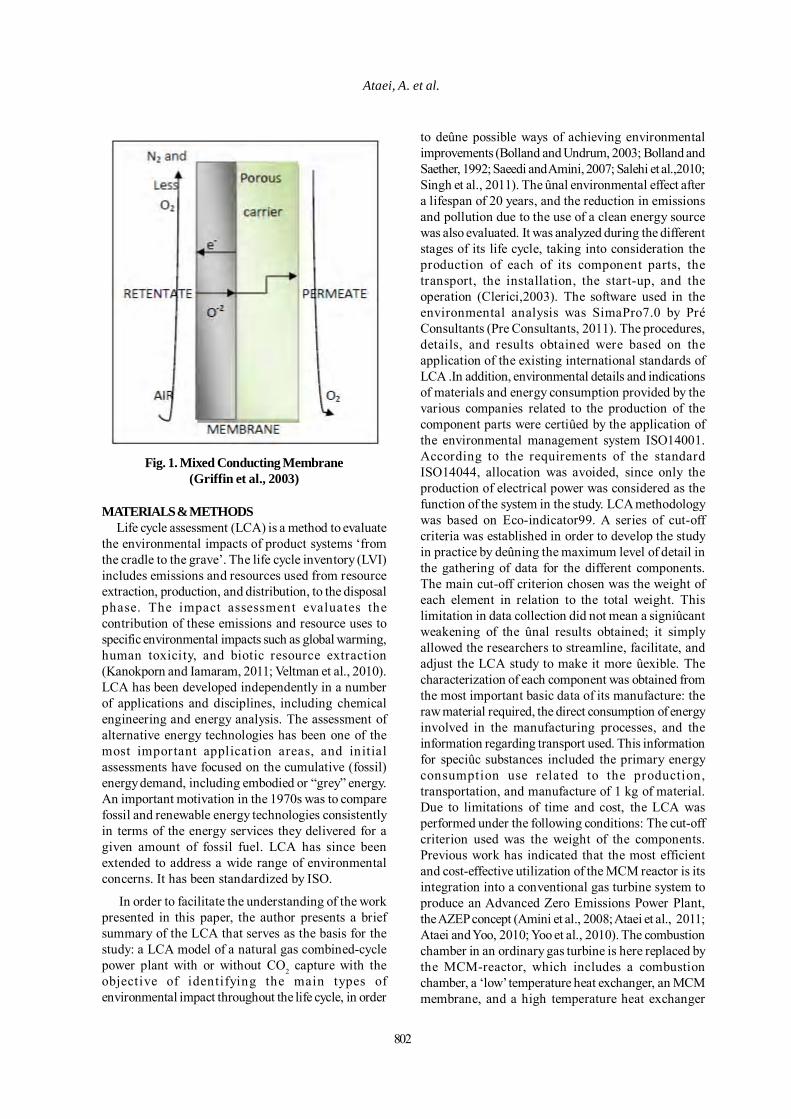
The first system design modeled is a referencesystem. As such, a traditional CCGT power plant waschosen (see Fig. 2). Data from such plants are inabundance, both in terms of thermo-dynamicalperformance used as a base in the modeling, and tosome extent, cost data. The AZEP 100% case is a“traditional” type of combined-cycle arrangement, butwith an MCM-reactor system replacing the traditionalcombustion chamber (Sundqvist et al., 2001). Air iscompressed in the gas turbine and is then heated inthe MCM-reactor. Due to MCM material and reactordesign limitations, the MCM-reactor outlet temperaturewas restricted to 1200°C, which is considerably lowerthan the reference CCGT. A percentage of the oxygencontained in the air, typically 50%, is transferredthrough the membrane, and is carried along by theCO2/H2O sweep gas. The oxygen containing sweepgas then reacts with natural gas to generate heat in acombustion chamber. A share of the sweep gas is bledoff to keep the sweep gas mass flow constant in theMCM- reactor. The heat contained in the bleed gas isrecovered in a separate CO2/H2O HRSG, providing extrasteam for the steam cycle and preheating the naturalgas fuel. The heat recovery has to be terminated at ahigher temperature than in the ordinary HRSG due to
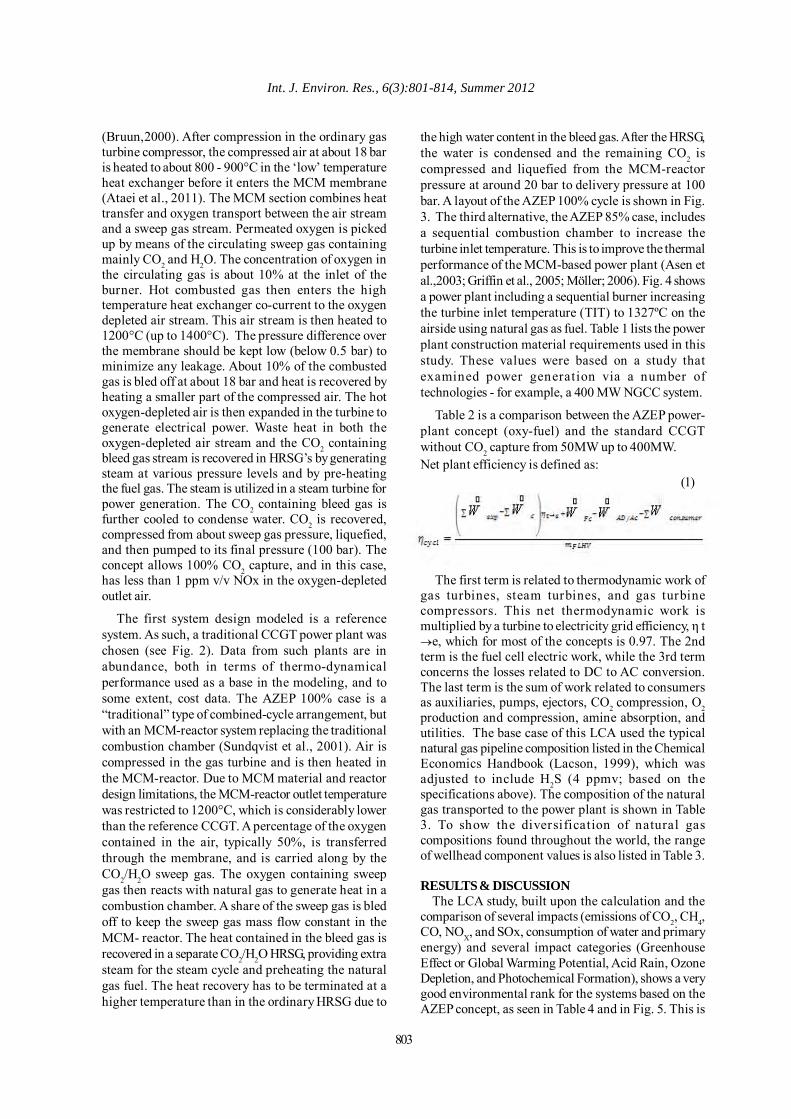
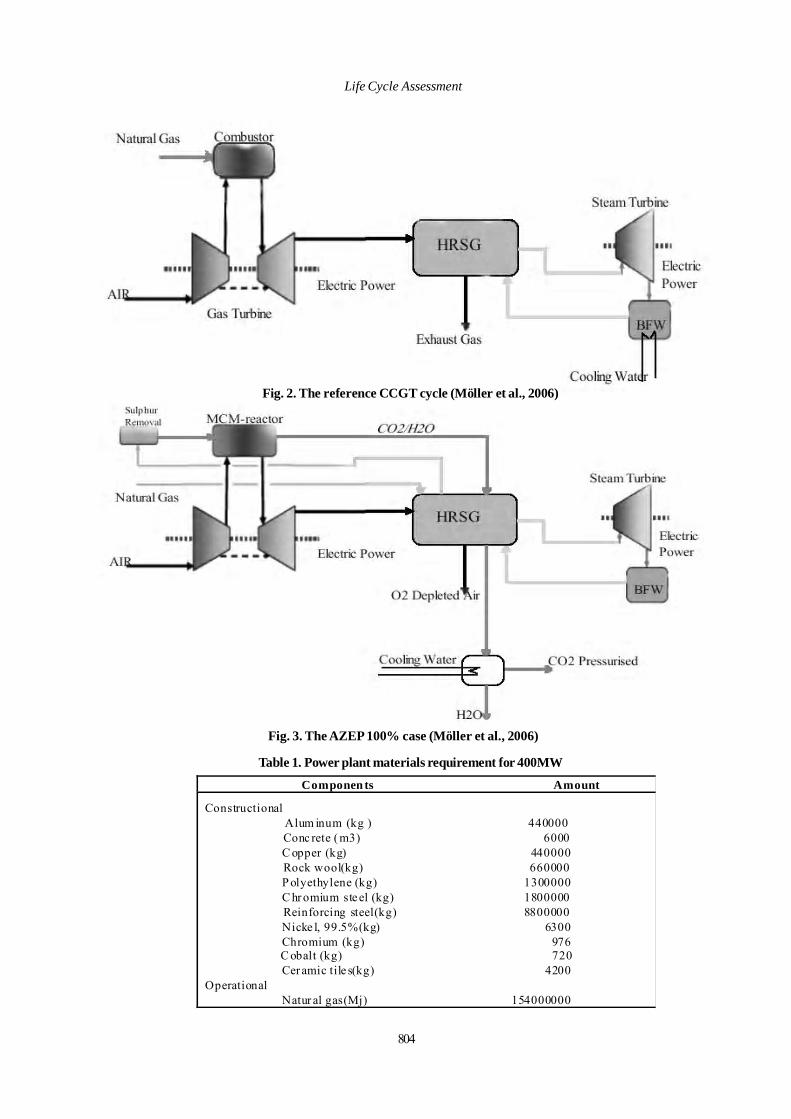
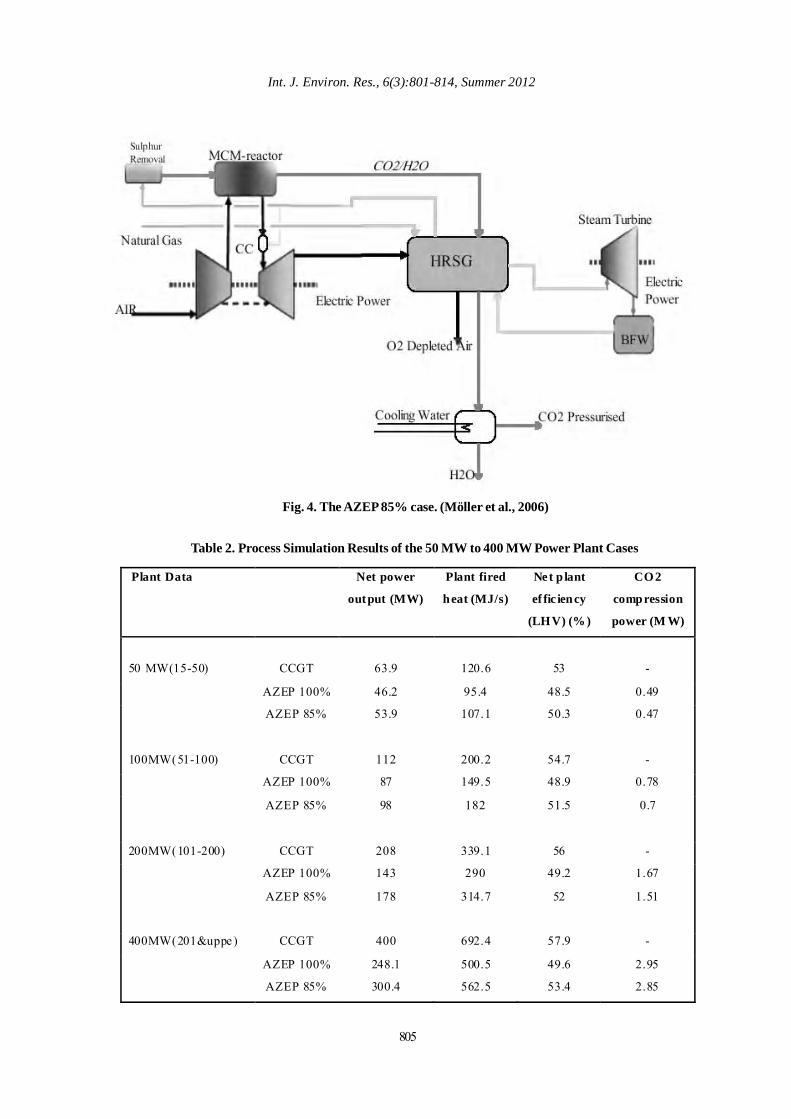
the high water content in the bleed gas. After the HRSG,the water is condensed and the remaining CO2 iscompressed and liquefied from the MCM-reactorpressure at around 20 bar to delivery pressure at 100bar. A layout of the AZEP 100% cycle is shown in Fig.3. The third alternative, the AZEP 85% case, includesa sequential combustion chamber to increase theturbine inlet temperature. This is to improve the thermalperformance of the MCM-based power plant (Asen etal.,2003; Griffin et al., 2005; Möller; 2006). Fig. 4 showsa power plant including a sequential burner increasingthe turbine inlet temperature (TIT) to 1327ºC on theairside using natural gas as fuel. Table 1 lists the powerplant construction material requirements used in thisstudy. These values were based on a study thatexamined power generation via a number oftechnologies - for example, a 400 MW NGCC system.
Table 2 is a comparison between the AZEP power-plant concept (oxy-fuel) and the standard CCGTwithout CO2 capture from 50MW up to 400MW.Net plant efficiency is defined as:
(1)
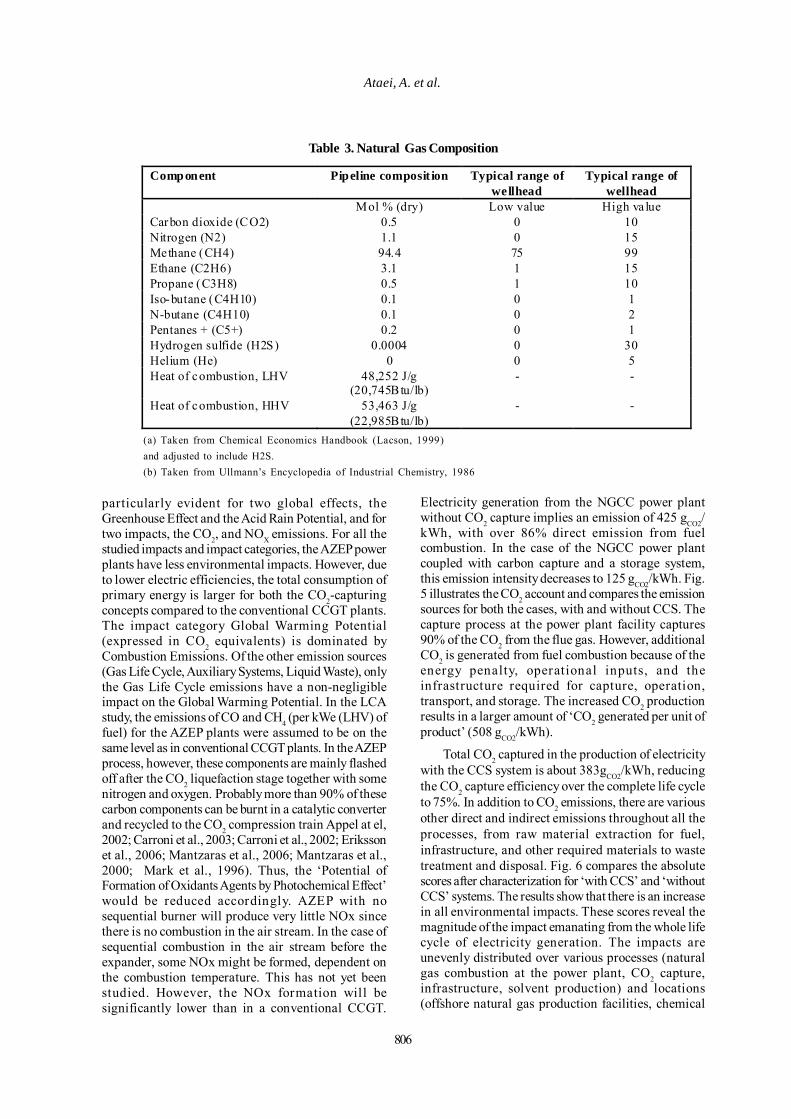
The first term is related to thermodynamic work ofgas turbines, steam turbines, and gas turbinecompressors. This net thermodynamic work ismultiplied by a turbine to electricity grid efficiency, η t→e, which for most of the concepts is 0.97. The 2ndterm is the fuel cell electric work, while the 3rd termconcerns the losses related to DC to AC conversion.The last term is the sum of work related to consumersas auxiliaries, pumps, ejectors, CO2 compression, O2production and compression, amine absorption, andutilities. The base case of this LCA used the typicalnatural gas pipeline composition listed in the ChemicalEconomics Handbook (Lacson, 1999), which wasadjusted to include H2S (4 ppmv; based on thespecifications above). The composition of the naturalgas transported to the power plant is shown in Table3. To show the diversification of natural gascompositions found throughout the world, the rangeof wellhead component values is also listed in Table 3.
RESULTS & DISCUSSIONThe LCA study, built upon the calculation and the
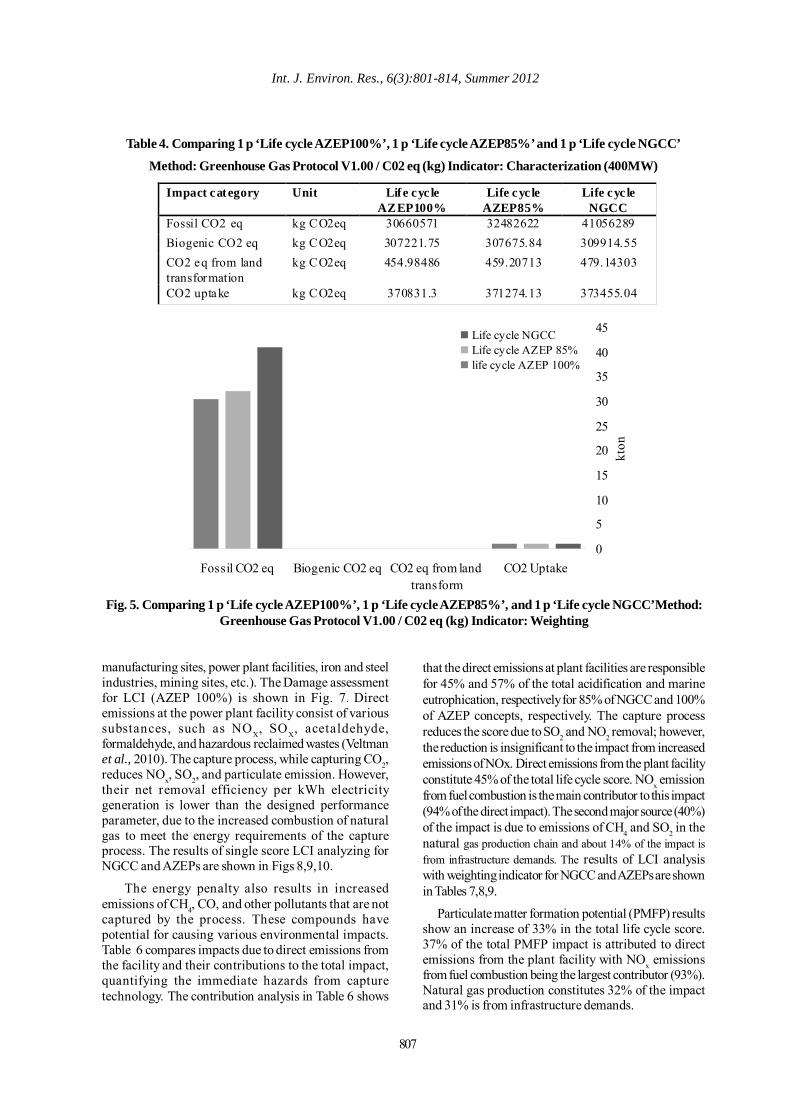
comparison of several impacts (emissions of CO2, CH4,CO, NOX, and SOx, consumption of water and primaryenergy) and several impact categories (GreenhouseEffect or Global Warming Potential, Acid Rain, OzoneDepletion, and Photochemical Formation), shows a verygood environmental rank for the systems based on theAZEP concept, as seen in Table 4 and in Fig. 5. This is
804
Life Cycle Assessment
Fig. 2. The reference CCGT cycle (Möller et al., 2006)
Fig. 3. The AZEP 100% case (Möller et al., 2006)
Table 1. Power plant materials requirement for 400MW
Componen ts Amount
Constructional Alum inum (kg ) 440000 Conc rete ( m3) 6000 C opper (kg) 440000 Rock wool(kg) 660000 P olyethylene (kg) 1300000 C hr omium ste el (kg) 1800000 Reinforcing steel(kg) 8800000 Nicke l, 99.5%(kg) 6300 Chromium (kg) 976 C obalt (kg) 720 Cer amic tile s(kg) 4200
Operational Natur al gas(Mj) 154000000
805
Int. J. Environ. Res., 6(3):801-814, Summer 2012
Fig. 4. The AZEP 85% case. (Möller et al., 2006)
Table 2. Process Simulation Results of the 50 MW to 400 MW Power Plant Cases
Plant Data
Net power
output (MW)
Plant fired
heat (MJ/s)
Net p lant
ef fic iency
(LHV) (%)
CO2
compression
power (M W)
50 MW(15-50)
CCGT
63.9
120.6
53
-
AZEP 100% 46.2 95.4 48.5 0.49
AZEP 85% 53.9 107.1 50.3 0.47
100MW(51-100) CCGT 112 200.2 54.7 -
AZEP 100% 87 149.5 48.9 0.78
AZEP 85% 98 182 51.5 0.7
200MW(101-200) CCGT 208 339.1 56 -
AZEP 100% 143 290 49.2 1.67
AZEP 85% 178 314.7 52 1.51
400MW(201&uppe) CCGT 400 692.4 57.9 -
AZEP 100% 248.1 500.5 49.6 2.95
AZEP 85% 300.4 562.5 53.4 2.85
806
Ataei, A. et al.
Table 3. Natural Gas Composition
Component Pipeline composit ion Typical range of wellhead
Typical range of wellhead
Mol % (dry) Low value High va lue Carbon dioxide (CO2) 0.5 0 10 Nitrogen (N2) 1.1 0 15 Methane (CH4) 94.4 75 99 Ethane (C2H6) 3.1 1 15 Propane (C3H8) 0.5 1 10 Iso-butane (C4H10) 0.1 0 1 N-butane (C4H10) 0.1 0 2 Pentanes + (C5+) 0.2 0 1 Hydrogen sulfide (H2S) 0.0004 0 30 Helium (He) 0 0 5 Heat of combustion, LHV 48,252 J/g
(20,745Btu/lb) - -
Heat of combustion, HHV 53,463 J/g (22,985Btu/lb)
- -
particularly evident for two global effects, theGreenhouse Effect and the Acid Rain Potential, and fortwo impacts, the CO2, and NOX emissions. For all thestudied impacts and impact categories, the AZEP powerplants have less environmental impacts. However, dueto lower electric efficiencies, the total consumption ofprimary energy is larger for both the CO2-capturingconcepts compared to the conventional CCGT plants.The impact category Global Warming Potential(expressed in CO2 equivalents) is dominated byCombustion Emissions. Of the other emission sources(Gas Life Cycle, Auxiliary Systems, Liquid Waste), onlythe Gas Life Cycle emissions have a non-negligibleimpact on the Global Warming Potential. In the LCAstudy, the emissions of CO and CH4 (per kWe (LHV) offuel) for the AZEP plants were assumed to be on thesame level as in conventional CCGT plants. In the AZEPprocess, however, these components are mainly flashedoff after the CO2 liquefaction stage together with somenitrogen and oxygen. Probably more than 90% of thesecarbon components can be burnt in a catalytic converterand recycled to the CO2 compression train Appel at el,2002; Carroni et al., 2003; Carroni et al., 2002; Erikssonet al., 2006; Mantzaras et al., 2006; Mantzaras et al.,2000; Mark et al., 1996). Thus, the ‘Potential ofFormation of Oxidants Agents by Photochemical Effect’would be reduced accordingly. AZEP with nosequential burner will produce very little NOx sincethere is no combustion in the air stream. In the case ofsequential combustion in the air stream before theexpander, some NOx might be formed, dependent onthe combustion temperature. This has not yet beenstudied. However, the NOx formation will besignificantly lower than in a conventional CCGT.
Electricity generation from the NGCC power plantwithout CO2 capture implies an emission of 425 gCO2/kWh, with over 86% direct emission from fuelcombustion. In the case of the NGCC power plantcoupled with carbon capture and a storage system,this emission intensity decreases to 125 gCO2/kWh. Fig.5 illustrates the CO2 account and compares the emissionsources for both the cases, with and without CCS. Thecapture process at the power plant facility captures90% of the CO2 from the flue gas. However, additionalCO2 is generated from fuel combustion because of theenergy penalty, operational inputs, and theinfrastructure required for capture, operation,transport, and storage. The increased CO2 productionresults in a larger amount of ‘CO2 generated per unit ofproduct’ (508 gCO2/kWh).
Total CO2 captured in the production of electricitywith the CCS system is about 383gCO2/kWh, reducingthe CO2 capture efficiency over the complete life cycleto 75%. In addition to CO2 emissions, there are variousother direct and indirect emissions throughout all theprocesses, from raw material extraction for fuel,infrastructure, and other required materials to wastetreatment and disposal. Fig. 6 compares the absolutescores after characterization for ‘with CCS’ and ‘withoutCCS’ systems. The results show that there is an increasein all environmental impacts. These scores reveal themagnitude of the impact emanating from the whole lifecycle of electricity generation. The impacts areunevenly distributed over various processes (naturalgas combustion at the power plant, CO2 capture,infrastructure, solvent production) and locations(offshore natural gas production facilities, chemical
(a) Taken from Chemical Economics Handbook (Lacson, 1999)and adjusted to include H2S.(b) Taken from Ullmann’s Encyclopedia of Industrial Chemistry, 1986
807
Int. J. Environ. Res., 6(3):801-814, Summer 2012
Table 4. Comparing 1 p ‘Life cycle AZEP100%’, 1 p ‘Life cycle AZEP85%’ and 1 p ‘Life cycle NGCC’
Method: Greenhouse Gas Protocol V1.00 / C02 eq (kg) Indicator: Characterization (400MW)
Impact category Unit Life cyc le AZEP100%
Life cyc le AZEP85%
Life cyc le NGCC
Fossil CO2 eq kg CO2eq 30660571 32482622 41056289 Biogenic CO2 eq kg CO2eq 307221.75 307675.84 309914.55 CO2 eq from land transformation
kg CO2eq 454.98486 459.20713 479.14303
CO2 uptake kg CO2eq 370831.3 371274.13 373455.04
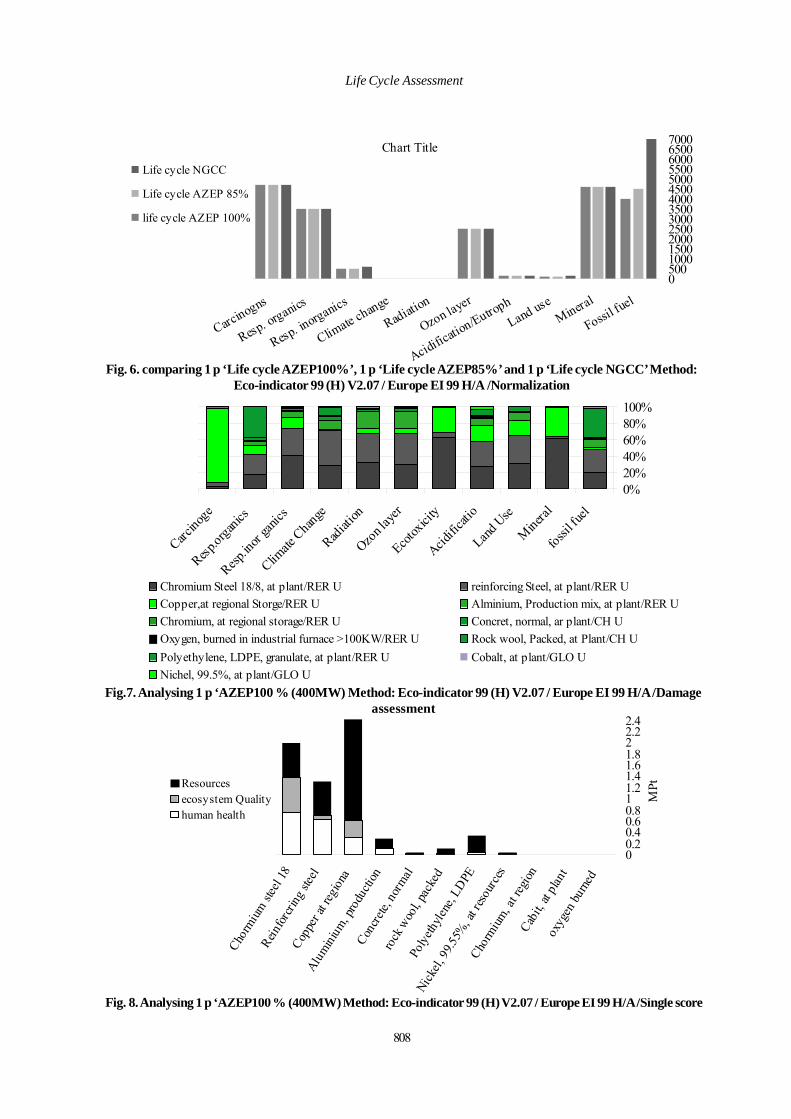
manufacturing sites, power plant facilities, iron and steelindustries, mining sites, etc.). The Damage assessmentfor LCI (AZEP 100%) is shown in Fig. 7. Directemissions at the power plant facility consist of varioussubstances, such as NOX, SOX, acetaldehyde,formaldehyde, and hazardous reclaimed wastes (Veltmanet al., 2010). The capture process, while capturing CO2,reduces NOx, SO2, and particulate emission. However,their net removal efficiency per kWh electricitygeneration is lower than the designed performanceparameter, due to the increased combustion of naturalgas to meet the energy requirements of the captureprocess. The results of single score LCI analyzing forNGCC and AZEPs are shown in Figs 8,9,10.
The energy penalty also results in increasedemissions of CH4, CO, and other pollutants that are notcaptured by the process. These compounds havepotential for causing various environmental impacts.Table 6 compares impacts due to direct emissions fromthe facility and their contributions to the total impact,quantifying the immediate hazards from capturetechnology. The contribution analysis in Table 6 shows
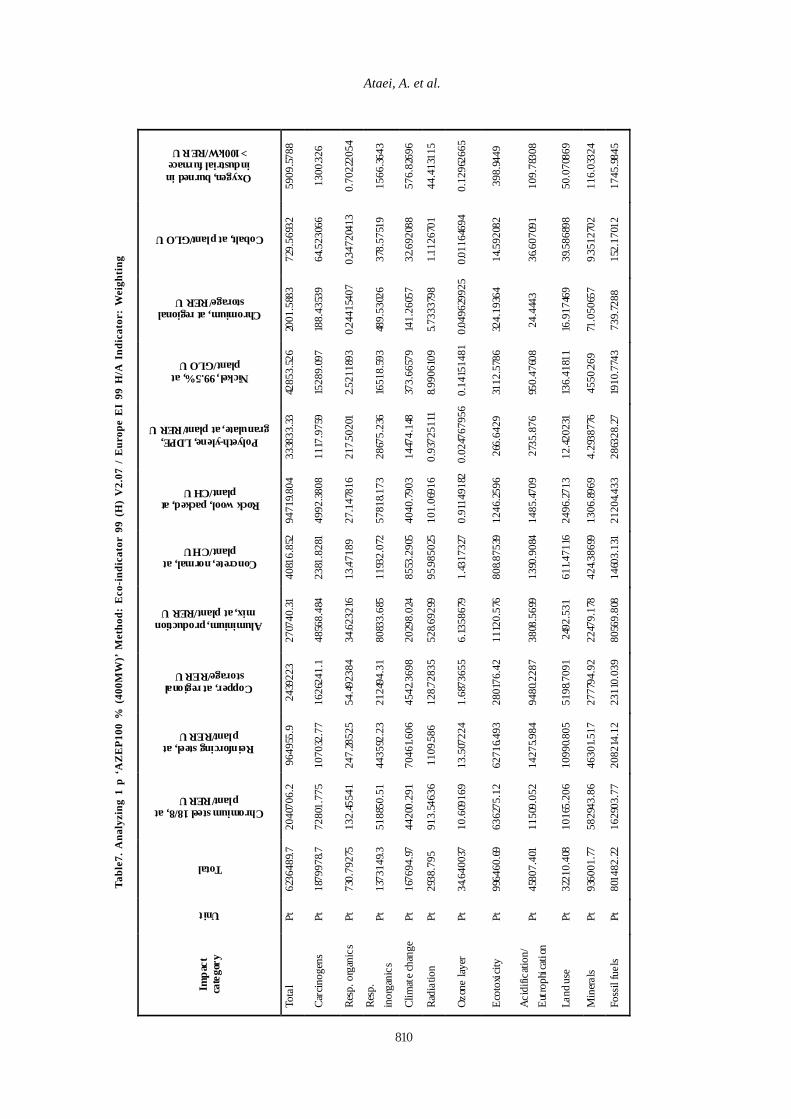
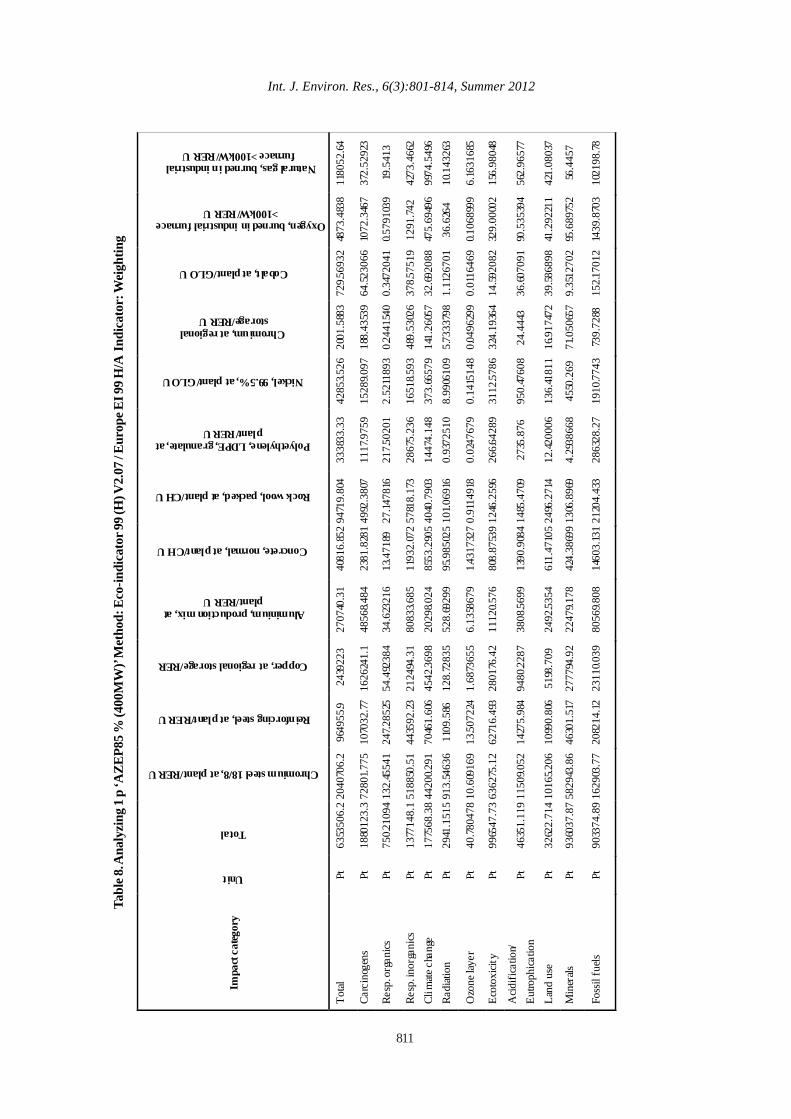
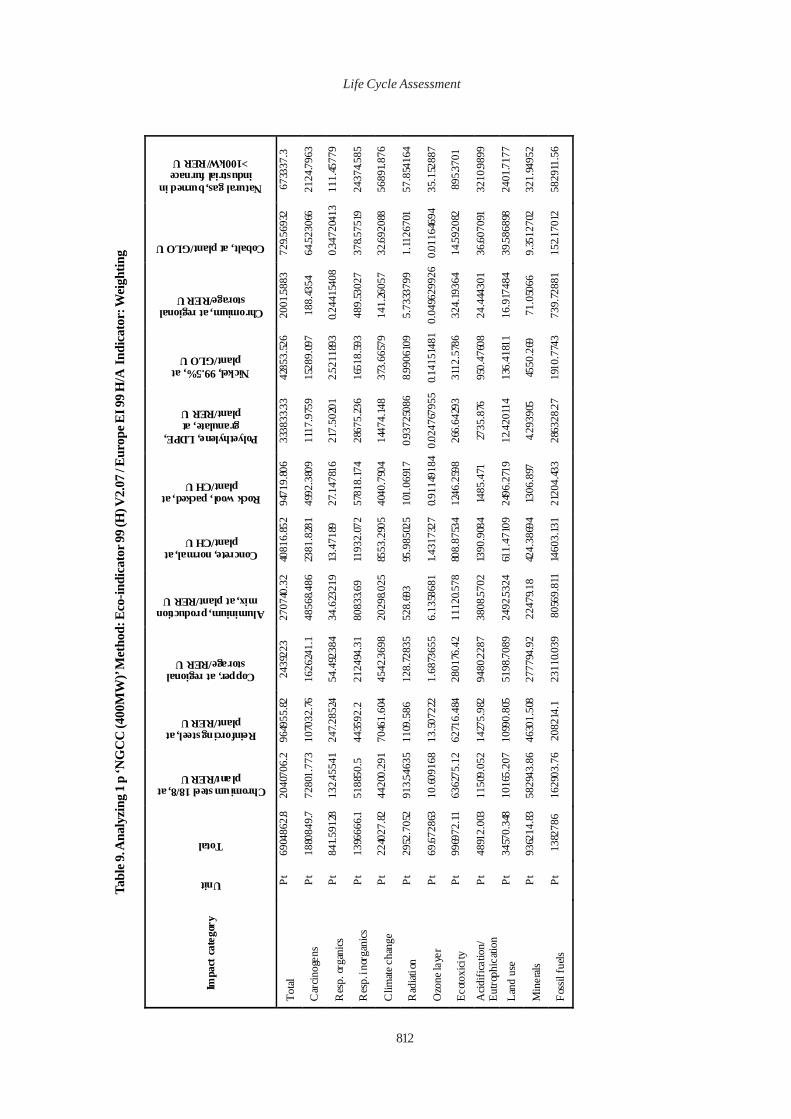
that the direct emissions at plant facilities are responsiblefor 45% and 57% of the total acidification and marineeutrophication, respectively for 85% of NGCC and 100%of AZEP concepts, respectively. The capture processreduces the score due to SO2 and NO2 removal; however,the reduction is insignificant to the impact from increasedemissions of NOx. Direct emissions from the plant facilityconstitute 45% of the total life cycle score. NOx emissionfrom fuel combustion is the main contributor to this impact(94% of the direct impact). The second major source (40%)of the impact is due to emissions of CH4 and SO2 in thenatural gas production chain and about 14% of the impact isfrom infrastructure demands. The results of LCI analysiswith weighting indicator for NGCC and AZEPs are shownin Tables 7,8,9.
Particulate matter formation potential (PMFP) resultsshow an increase of 33% in the total life cycle score.37% of the total PMFP impact is attributed to directemissions from the plant facility with NOx emissionsfrom fuel combustion being the largest contributor (93%).Natural gas production constitutes 32% of the impactand 31% is from infrastructure demands.
0
5
10
15
20
25
30
35
40
45
CO2 UptakeCO2 eq from landtransform
Biogenic CO2 eqFossil CO2 eq
kton
Life cycle NGCCLife cycle AZEP 85%life cycle AZEP 100%
Fig. 5. Comparing 1 p ‘Life cycle AZEP100%’, 1 p ‘Life cycle AZEP85%’, and 1 p ‘Life cycle NGCC’Method:Greenhouse Gas Protocol V1.00 / C02 eq (kg) Indicator: Weighting
808
Life Cycle Assessment
Chart Title
05001000150020002500300035004000450050005500600065007000
Fossil fuel
Mineral
Land use
Acidificatio
n/Eutroph
Ozon layer
Radiation
Climate change
Resp. inorganics
Resp. organics
Carcinogns
Life cycle NGCC
Life cycle AZEP 85%
life cycle AZEP 100%
Fig. 6. comparing 1 p ‘Life cycle AZEP100%’, 1 p ‘Life cycle AZEP85%’ and 1 p ‘Life cycle NGCC’ Method:Eco-indicator 99 (H) V2.07 / Europe EI 99 H/A /Normalization
Fig. 8. Analysing 1 p ‘AZEP100 % (400MW) Method: Eco-indicator 99 (H) V2.07 / Europe EI 99 H/A /Single score
00.20.40.60.811.21.41.61.822.22.4
oxyg
en bu
rned
Cabit,
at pla
nt
Chorm
ium, a
t reg
ion
Nickel,
99.55
%, a
t reso
urce
s
Polye
thylen
e, LD
PE
rock
woo
l, pac
ked
Concre
te, no
rmal
Alumini
um, p
rodu
ction
Coppe
r at r
egion
a
Reinfor
cring
stee
l
Chorm
ium st
eel 1
8
MPtResources
ecosystem Qualityhuman health
0%20%40%60%80%100%
fossil fu
el
Mineral
Land Use
Acidific
atio
Ecotox
icity
Ozon l
ayer
Radiation
Climate
Change
Resp.in
or gan
ics
Resp.organi
cs
Carcinog
e
Chromium Steel 18/8, at plant/RER U reinforcing Steel, at plant/RER UCopper,at regional Storge/RER U Alminium, Production mix, at plant/RER UChromium, at regional storage/RER U Concret, normal, ar plant/CH UOxygen, burned in industrial furnace >100KW/RER U Rock wool, Packed, at Plant/CH UPolyethylene, LDPE, granulate, at plant/RER U Cobalt, at plant/GLO UNichel, 99.5%, at plant/GLO U
Fig.7. Analysing 1 p ‘AZEP100 % (400MW) Method: Eco-indicator 99 (H) V2.07 / Europe EI 99 H/A /Damageassessment

809
Int. J. Environ. Res., 6(3):801-814, Summer 2012
00.20.40.60.811.21.41.61.822.22.4
Natural
gas, burn
ed
oxygen
burne
d
Cabit, at p
lant
Chorm
ium, a
t regio
n
Nickel,
99.55%
, at re
sources
Polyethyle
ne, LDPE
rock woo
l, pack
ed
Concre
te, norm
al
Aluminium, produ
ction
Copper
at re
giona
Reinfor
cring s
teel
Chorm
ium ste
el 18
MPt
human health ecosystem Quality Resources
00.20.40.60.811.21.41.61.822.2
Natu
ral g
as, b
urne
d
Cera
mict
iles,
at pl
ant
oxyg
en b
urne
d
Cabi
t, at
plan
t
Chor
miu
m, a
t reg
ion
Nick
el, 9
9.55%
, at r
esou
rces
Poly
ethyl
ene,
LDPE
rock
woo
l, pa
cked
Conc
rete,
nor
mal
Alum
iniu
m, p
rodu
ction
Copp
er at
regi
ona
Rein
forc
ring
steel
Chor
miu
m st
eel 1
8
MPt
Resources
Ecosystem Quality
human health
Fig. 9. Analysing 1 p ‘AZEP85 % (400MW) Method: Eco-indicator 99 (H) V2.07 / Europe EI 99 H/A /Single score
Fig .10. Analysing 1 p ‘NGCC (400MW) Method: Eco-indicator 99 (H) V2.07 / Europe EI 99 H/A /Single score
Table 6. Comparing 1 p ‘Life cycle AZEP100%’, 1 p ‘Life cycle AZEP85%’, and 1 p ‘Life cycleNGCC’Method: Selected LCI results V1. Indicator: Characterization (400MW)
Impact category Unit Life cycle AZEP100%
Life cyc le AZEP85%
Life cycle NGCC
NMVOC kg 21853.981 22566.673 25920.419 Carbon dioxide fossil kg 27636454 29348681 37405562 Sulphur dioxide kg 129772.91 130391.17 133306.27 Nitrogen oxides kg 71098.875 72204.554 77410.575 Particulates, <2.5 m kg 32127.573 32151.153 32299.169 Land occupation m2 1134838.7 1135914.5 1141244.4 BOD kg 42844.845 42961.601 43514.316 Cadmium kg 0.003472432 0.00347964 0.003514453
µ
810
Ataei, A. et al.
Tabl
e7. A
naly
zing
1 p
‘A
ZE
P100
% (
400M
W)’
Met
hod:
Eco
-ind
icat
or 9
9 (H
) V
2.07
/ E
urop
e E
I 99
H/A
Ind
icat
or:
Wei
ghti
ng
Impa
ct
cate
gory
Unit
Total
Chromium steel 18/8, at plant/RER U
Reinforcing steel, at plant/RER U
Copper, at regional storage/RER U
Aluminium, production mix, at plant/RER U
Concrete, normal, at plant/CH U
Rock wool, packed, at plant/CH U
Polyeth-ylene, LDPE, granulate, at plant/RER U
Nickel, 99.5%, at plant/GLO U
Chromium, at regional storage/RER U
Cobalt, at plant/GLO U
Oxygen, burned in industrial furnace >100kW/RER U
Tota
l Pt
62
3648
9.7
2040
706.
2 96
4955
.9
2439
223
2707
40.31
40
816.
852
9471
9.804
33
3833
.33
4285
3.52
6 20
01.5
883
729.
5693
2 59
09.57
88
Carc
inog
ens
Pt
1879
978.7
72
801.
775
1070
32.7
7 16
2624
1.1
4856
8.48
4 23
81.8
281
4992
.3808
11
17.9
759
1528
9.09
7 18
8.43
539
64.5
2306
6 13
00.32
6
Resp
. org
anic
s Pt
73
0.79
275
132.
4554
1 24
7.28
525
54.49
2384
34
.6232
16
13.47
189
27.1
4781
6 21
7.502
01
2.521
1893
0.2
4415
407
0.347
2041
3 0.
7022
2054
Resp
. in
orga
nics
Pt
13
7314
9.3
5188
50.5
1 44
3592
.23
2124
94.3
1 80
833.
685
1193
2.07
2 57
818.1
73
2867
5.23
6 16
518.
593
489.
5302
6 37
8.57
519
1566
.3643
Clim
ate c
hang
e Pt
16
7694
.97
4420
0.29
1 70
461.6
06
4542
.369
8 20
298.
024
8553
.290
5 40
40.79
03
1447
4.14
8 37
3.66
579
141.
2605
7 32
.692
088
576.
8269
6
Radi
atio
n Pt
29
38.7
95
913.
5463
6 11
09.58
6 12
8.728
35
528.6
9299
95
.9850
25
101.
0691
6 0.
9372
5111
8.9
9061
09
5.733
3798
1.1
1267
01
44.4
1311
5
Ozon
e lay
er
Pt
34.6
4003
7 10
.609
169
13.5
0722
4 1.
6873
655
6.13
5867
9 1.
4317
327
0.91
1491
820.
0247
6795
6 0.
1415
1481
0.0
4962
9925
0.0
1164
694
0.12
9626
65
Ecot
oxic
ity
Pt
9964
60.69
63
6275
.12
6271
6.493
28
0176
.42
1112
0.57
6 80
8.875
39
1246
.2596
26
6.64
29
3112
.578
6 32
4.19
364
14.5
9208
2 39
8.94
49
Acid
ifica
tion/
Eu
troph
icati
on
Pt
4580
7.40
1 11
509.
052
1427
5.984
94
80.2
287
3808
.569
9 13
90.9
084
1485
.4709
27
35.8
76
950.
4760
8 24
.444
3 36
.607
091
109.
7830
8
Land
use
Pt
32
210.
408
1016
5.20
6 10
990.8
05
5198
.709
1 24
92.5
31
611.4
7116
24
96.27
13
12.42
0231
13
6.41
811
16.9
1746
9 39
.586
898
50.0
7086
9
Min
erals
Pt
9360
01.77
58
2943
.86
4630
1.517
27
7794
.92
2247
9.17
8 42
4.386
99
1306
.8969
4.
2938
776
4550
.269
71.0
5065
7 9.3
5127
02
116.
0332
4
Foss
il fu
els
Pt
8014
82.22
16
2903
.77
2082
14.1
2 23
110.
039
8056
9.80
8 14
603.
131
2120
4.433
28
6328
.27
1910
.774
3 73
9.72
88
152.
1701
2 17
45.98
45
811
Int. J. Environ. Res., 6(3):801-814, Summer 2012
Tabl
e 8. A
naly
zing
1 p
‘AZ
EP8
5 %
(400
MW
)’ M
etho
d: E
co-in
dica
tor 9
9 (H
) V2.
07 / E
urop
e EI 9
9 H
/A I
ndic
ator
: Wei
ghtin
g
Impa
ct ca
tegor
y Unit
Total
Chromium steel 18/8, at plant/RER U
Reinforcing steel, at plant/RER U
Copper, at regional storage/RER
Aluminium, production mix, at plant/RER U
Concrete, normal, at plant/CH U
Rock wool, packed, at plant/CH U
Polyethylene, LDPE, granulate, at plant/RER U
Nickel, 99.5%, at plant/GLO U
Chromium, at regional storage/RER U
Cobalt, at plant/GLO U
Oxygen, burned in industrial furnace >100kW/RER U
Natural gas, burned in industrial furnace >100kW/RER U
Total
Pt
63
5350
6.2
2040
706.
2 96
4955
.9 24
3922
3 27
0740
.31
4081
6.85
2 94
719.
804
3338
33.3
3 42
853.5
2620
01.5
883
729.5
6932
48
73.4
838
1180
52.64
Carc
inog
ens
Pt
1880
123.
3 72
801.7
75
1070
32.77
1626
241.
1 48
568.4
84
2381
.828
1 49
92.3
807
1117
.975
9 15
289.0
9718
8.43
539
64.52
3066
10
72.3
467
372.
5292
3
Resp
. org
anics
Pt
75
0.210
94 1
32.45
541
247.2
8525
54.4
9238
4 34
.623
216
13.4
7189
27
.1478
16
217.5
0201
2.
5211
893
0.244
1540
0.34
7204
1 0.5
7910
3919
.541
3
Resp
. inor
gani
cs
Pt
1377
148.
1 51
8850
.51
4435
92.23
2124
94.3
1 80
833.6
85
1193
2.07
2 57
818.
173
2867
5.23
6 16
518.5
9348
9.53
026
378.5
7519
12
91.74
2 42
73.4
662
Clim
ate c
hang
e Pt
17
7568
.38
4420
0.291
70
461.
606
4542
.3698
20
298.0
24
8553
.290
5 40
40.7
903
1447
4.14
8 37
3.66
579
141.
2605
732
.6920
88
475.
6949
699
74.5
496
Radi
ation
Pt
29
41.1
515
913.
5463
6 11
09.5
86
128.
7283
5 52
8.69
299
95.9
8502
5 10
1.069
16
0.93
7251
0 8.
9906
109
5.733
3798
1.11
2670
1 36
.626
4 10
.143
263
Ozo
ne la
yer
Pt
40.78
0478
10.
6091
69
13.50
7224
1.68
7365
5 6.
1358
679
1.431
7327
0.9
1149
18
0.02
4767
9 0.
1415
148
0.049
6299
0.01
1646
9 0.1
0689
996.
1631
685
Ecot
oxici
ty
Pt
9965
47.7
3 63
6275
.12
6271
6.49
328
0176
.42
1112
0.576
80
8.87
539
1246
.259
6 26
6.642
89
3112
.5786
324.
1936
414
.5920
82
329.
0000
215
6.98
048
Acid
ifica
tion/
Eu
troph
icatio
n Pt
46
351.
119
1150
9.052
14
275.
984
9480
.2287
38
08.56
99
1390
.908
4 14
85.4
709
2735
.876
95
0.47
608
24.4
443
36.60
7091
90
.535
394
562.
9657
7
Land
use
Pt
32
622.
714
1016
5.206
10
990.
806
5198
.709
24
92.53
54
611.
4710
5 24
96.2
714
12.42
0006
13
6.41
811
16.9
1747
239
.5868
98
41.2
9221
142
1.08
037
Min
erals
Pt
93
6037
.87
5829
43.8
6 46
301.
517
2777
94.9
2 22
479.1
78
424.
3869
9 13
06.8
969
4.29
3866
8 45
50.2
69
71.0
5065
79.
3512
702
95.6
8975
256
.445
7
Foss
il fu
els
Pt
9033
74.8
9 16
2903
.77
2082
14.12
2311
0.039
80
569.8
08
1460
3.13
1 21
204.
433
2863
28.2
7 19
10.77
4373
9.72
88
152.1
7012
14
39.8
703
1021
98.78
812
Tabl
e 9. A
naly
zing
1 p
‘NG
CC
(400
MW
)’ M
etho
d: E
co-in
dica
tor 9
9 (H
) V2.
07 / E
urop
e EI 9
9 H
/A I
ndic
ator
: Wei
ghtin
g
Impa
ct ca
tego
ry
Unit
Total
Chromium steel 18/8, at plant/RER U
Reinforcing steel, at plant/RER U
Copper, at regional storage/RER U
Aluminium, production mix, at plant/RER U
Concrete, normal, at plant/CH U
Rock wool, packed, at plant/CH U
Polyethylene, LDPE, granulate, at plant/RER U
Nickel, 99.5%, at plant/GLO U
Chromium, at regional storage/RER U
Cobalt, at plant/GLO U
Natural gas, burned in industrial furnace >100kW/RER U
Total
Pt
69
0486
2.8
2040
706.
2 96
4955
.82
2439
223
2707
40.3
2 40
816.
852
9471
9.80
6 33
3833
.33
4285
3.52
6 20
01.58
83
729.5
6932
67
3337
.3
Car
cinog
ens
Pt
1880
849.7
72
801.
773
1070
32.76
16
2624
1.1
4856
8.486
23
81.8
281
4992
.380
9 11
17.9
759
1528
9.09
7 18
8.43
54
64.52
3066
21
24.79
63
Res
p. or
gani
cs
Pt
841.5
9128
13
2.455
41
247.2
8524
54
.492
384
34.6
2321
9 13
.471
89
27.1
4781
6 21
7.50
201
2.521
1893
0.2
4415
408
0.347
2041
3 11
1.45
779
Res
p. in
orga
nics
Pt
13
9666
6.1
5188
50.5
44
3592
.2
2124
94.3
1 80
833.6
9 11
932.
072
5781
8.17
4 28
675.
236
1651
8.59
3 48
9.53
027
378.5
7519
24
374.5
85
Clim
ate c
hang
e Pt
22
4027
.82
4420
0.29
1 70
461.
604
4542
.3698
20
298.0
25
8553
.290
5 40
40.7
904
1447
4.14
8 37
3.66
579
141.
2605
7 32
.6920
88
5689
1.876
Rad
iatio
n Pt
29
52.7
052
913.5
4635
11
09.5
86
128.
7283
5 52
8.69
3 95
.985
025
101.
0691
7 0.9
3725
086
8.990
6109
5.
7333
799
1.11
2670
1 57
.854
164
Ozo
ne la
yer
Pt
69.67
2863
10
.6091
68
13.50
7222
1.
6873
655
6.13
5868
1 1.4
3173
27
0.911
4918
4 0.0
2476
7955
0.1
4151
481
0.04
9629
926
0.011
6469
435
.152
887
Ecoto
xici
ty Pt
99
6972
.11
6362
75.1
2 62
716.
484
2801
76.4
2 11
120.5
78
808.
8753
4 12
46.2
598
266.
6429
3 31
12.5
786
324.
1936
4 14
.5920
82
895.3
701
Acid
ifica
tion/
Eu
troph
icati
on
Pt
4891
2.00
3 11
509.
052
1427
5.98
2 94
80.22
87
3808
.5702
13
90.9
084
1485
.471
27
35.8
76
950.
4760
8 24
.444
301
36.60
7091
32
10.98
99
Land
use
Pt
34
570.
348
1016
5.20
7 10
990.
805
5198
.7089
24
92.53
24
611.
4710
9 24
96.2
719
12.4
2011
4 13
6.41
811
16.9
1748
4 39
.5868
98
2401
.7177
Min
erals
Pt
93
6214
.83
5829
43.8
6 46
301.
508
2777
94.9
2 22
479.1
8 42
4.38
694
1306
.897
4.2
9390
5 45
50.2
69
71.0
5066
9.
3512
702
321.
9495
2
Foss
il fu
els
Pt
1382
786
1629
03.7
6 20
8214
.1
2311
0.039
80
569.
811
1460
3.13
1 21
204.
433
2863
28.27
19
10.7
743
739.
7288
1 15
2.170
12
5829
11.5
6
Life Cycle Assessment
CONCLUSIONThe different uncertainties arising from the options
given during the development of the LCA of a combinedcycle power plant (or AZEP) have been analyzed inthis study, using the Eco-indicator99 LCA method. Inaddition, the impact that these scenarios may presenton the ûnal LCA has also been assessed. Undoubtedly,the choices made at the turbine maintenance stagehave an important effect on the results of the LCA.Therefore, it is necessary to precisely analyze theaverage of major corrections that a model of combinedcycle power plant (or AZEP) may experience along its20 years of life. Another issue that signiûcantlyinûuences the ûnal results of the LCA study of anAZEP is the considerations made about recycling andreuse of components and materials from anenvironmental point of view. Compared with aconventional CCGT the optimized AZEP concept forthe 50 MW size gives 4.5 percentage points reductionin thermal efficiency (LHV) with 100% CO2 captureincluding pressurization of CO2 to 100 bar. In the AZEP50 MW case with a CO2 capture of 85% the penalty inthermal efficiency is less than 3.0 percentage pointscompared to a standard CCGT. The 400 MW size hasmore penalty for the 100% CO2 capture case andtherefore needs a sequential combustion before theexpander to improve the thermal efficiency. In an AZEP400 MW case with 85% CO2 capture the penalty inthermal efficiency (LHV) is 4.5 percentage points. TheLCA study shows a very good environmental rank forthe systems based on the AZEP concept. This isparticularly evident for two global effects, theGreenhouse Effect (Global Warming Potential) and theAcid Rain Potential, and for two impacts, the CO2 andNOx emissions. For all studied impacts and impactcategories, the AZEP power plants have fewer impacts.However, compared to the conventional CCGT plantsthe total consumption of primary energy is bigger forboth the CO2 capturing concepts due to lower electricefficiencies for these concepts.
Abbreviation
AZEP Advanced Zero Emissions PlantLCA Life Cycle AssessmentLCI Life Cycle InventoryLCIA Life Cycle Impact AssessmentBFW Boiler Feed Water SystemCCGT Combined Cycle Gas TurbineHP High PressureLP Low PressureHRSG Heat Recovery Steam GeneratorMCM Mixed Conducting MembraneTIT Turbine Inlet TemperatureHTP Human Toxicity Potential
PMFP Particulate Matter Formation PotentialBOD Biological Oxygen DemandNMVOC Non-Methane Volatile Organic CompoundsWFC Fuel cell electrical workWexp , WC Thermodynamic work of gasturbines, steam turbines, and gas turbine compressorsWAD/AC Losses related to DC to AC conversionWconsumers Work related to auxiliaries, pumps,ejectors, CO2 compression, O2 production andcompression.ήt → e Electricity grid efficiency
REFERENCESAmini, H. R., Saeedi, M. and Baghvand, A. (2008).Solidification/stabilization of heavy metals from air heaterwashing wastewater treatment in thermal power plants.International Journal of Environmental Research, 2 (3), 297-306.
Appel, C., Mantzaras, J., Schaeren, R., Bombach, R., Inauen,A., Kaeppeli, B., Hemmerling, B., and Stampanoni, A.(2002). An experimental and numerical investigation ofhomogeneous ignition in catalytically stabilized combustionof hydrogen-air mixtures over platinum. Combustion andFlame, 128, 340–368.
Asen, K. and Wilhelmsen, K. (2003). CO2 capture in powerplants using mixed conducting membranes (MCM). Paperpresented at the 10th Power Gen Europe Conference,Düsseldorf, Germany.
Ataei. A., Lee, K. S., Lim, J. J., Kim, M. J., Liu, H. B., Kang,O. Y., Oh, T. S. and Yoo, C. K. (2011). A review onenvironmental process engineering. International Journal ofEnvironmental Research, 5 (4), 875-890.
Ataei, A. and Yoo, C. K. (2010). Combined pinch and exergyanalysis for energy efficiency optimization in a steam powerplant. International Journal of the Physical Sciences, 5 (7),1110-1123.
Bolland, O. and Undrum, H. M. (2003). A novel methodologyfor comparing CO2 capture options for natural gas firedcombined cycle plants. Advances in Environmental Research,7 (4), 901-911.
Bolland, O. and Saether, S. (1992). New concepts for naturalgas fired power plants which simplify the recovery of carbondioxide, Energy Conversion and Management, 33, 467-475.
Bruun, T., Werswick, B., Grönstad, L., Kristiansen, K. andLinder, U. (2000). A device and a method for operating saiddevice, Norwegian Patent Application NO. 20006690.
Carroni, R., Griffin, T., Mantzaras, J. and Reinke, M. (2003).High-pressure experiments and modeling of methane-aircatalytic combustion for power generation applications.Catalysis Today, 83, 157–170.
Carroni, R., Schmidt, V. and Griffin, T. (2002). Catalyticcombustion for power generation. Catalysis Today, 75, 287–295.
Int. J. Environ. Res., 6(3):801-814, Summer 2012
813
Clerici, G., Pulvirenti, G. and Serenellini, S. (2003).Environmental analysis of different options of CO2 capturein power generation from natural gas. (In J. Gale and Y.Kaya (Eds), Greenhouse Gas Control Technologies. ElsevierScience Ltd.
Eriksson, S., Wolf, M., Schneider, A., Mantzaras, J.,Raimondi, F., Boutonnet, M. and Jaras, S. (2006). Fuel richcatalytic combustion of methane in zero emissions powergeneration processes. Catalysis Today, 117, 447–453.
Griffin, T., Sundkvist, S. G., Asen, K. I. and Bruun, T. (2005).Advanced zero emission gas turbine power plant.Journal of Engineering for Gas Turbines and Power, 127, 81–85.
Kanokporn, K. and Iamaram, V. (2011). Ecological ImpactAssessment; Conceptual Approach for Better Outcomes.International Journal of Environmental Research, 5 (2), 435-446.
Lacson, J. G. (1999). CEH Product Review: Natural Gas.Chemical Economics Handbook. Menlo Park, California:SRI International.
Mantzaras, J. (2006). Understanding and modeling ofthermofluidic processes in catalytic combustion. CatalysisToday, 117, 394–406.
Mantzaras, J., Appel, C., Benz, P. and Dogwiler, U. (2000).Numerical modelling of turbulent catalytically stabilizedchannel flow combustion. Catalysis Today, 53, 3–17.
Mark, M. F. and Maier, W. F. (1996). CO2-reforming ofmethane on supported Rh and Ir catalysts. Journal ofCatalysis, 164, 122–130.
Möller, B.F., Torisson, T., Assadi, M., Sundkvist, S. G.,Sjödin, M., Klang, A., Asen, K. I. and Wilhelmsen, K. (2006).AZEP gas turbine combined cycle power plants- Thermo-economic Analysis. International Journal ofThermodynamics, 9 (1), 21-28.
PRe´ Consultants. (2011). SIMAPRO. Database Manual,Netherland.
Saeedi, M. and Amini, H. R. (2007). Chemical, physical,mineralogical, morphology and leaching characteristics of athermal power plant air heater washing waste. InternationalJournal of Environmental Research, 1(1), 74-79.
Salehi, F., Monavari, S . M., Arjomandi, R., Dabiri, F. andSamadi, R. (2010). A New Approach Towards EnvironmentalMonitoring Plan in Steam Power Plants. International Journalof Environmental Research, 4 (3), 433-438.
Singh, B., Strømman, A. H. and Hertwich, E. (2011).Life cycle assessment of natural gas combined cycle power plant withpost-combustion carbon capture, transport and storage.International Journal of Greenhouse Gas Control, 5 (3), 457-466. Sundqvist, S. G., Griffin, T. and Thorshaug, N. P. (2001).AZEP-Development of an integrated air separationmembrane–gas turbine. Paper presented at the 2nd NordicMinisymposium on Carbon Dioxide Capture and Storage,Gothenburg, Sweden.
Veltman, K., Singh, B. and Hertwich, E. (2010). Human andenvironmental impact assessment of post-combustion CO2capture focusing on emissions from amine-based scrubbingsolvents. Environmental Science and Technology, 44, 1496–1502.
Yoo, C. K., Ataei, A., Kim, Y. S., Kim, M. J., Liu, H. B. andLim. J. J. (2010). Environmental systems engineering: Astate of the art review. Scientific Research and Essays, 5(17), 2341-2357.
Ataei, A. et al.
814