Embed Size (px)
Citation preview
Department of Energy and Environment Division of Environmental System Analysis CHALMERS UNIVERSITY OF TECHNOLOGY Gothenburg, Sweden 2014 Report no. 2014:17
Life cycle assessment of bio-based sodium poly-acrylate production from pulp mill side streams-Case at a TMP and sulphite pulp mill Master’s Thesis within Industrial Ecology programme
Paul Gontia

REPORT NO. 2014:17
Life cycle assessment of bio-based sodium poly-
acrylate production from pulp mill side streams
- Case at a TMP and sulphite pulp mill
PAUL GONTIA
Department of Energy and Environment
Division of Environmental System Analysis CHALMERS UNIVERSITY OF TECHNOLOGY
Gothenburg, Sweden 2014
Life cycle assessment of bio-based sodium poly-acrylate production from pulp mill side streams
- Case at a TMP and sulphite pulp mill
PAUL GONTIA
Supervisor: Matty Janssen
Examiner: Matty Janssen
© PAUL GONTIA, 2014
Report no. 2014:17
Department of Energy and Environment
Division of Environmental System Analysis
CHALMERS UNIVERSITY OF TECHNOLOGY
SE-412 96 Göteborg
Sweden
Telephone + 46 (0)31-772 1000
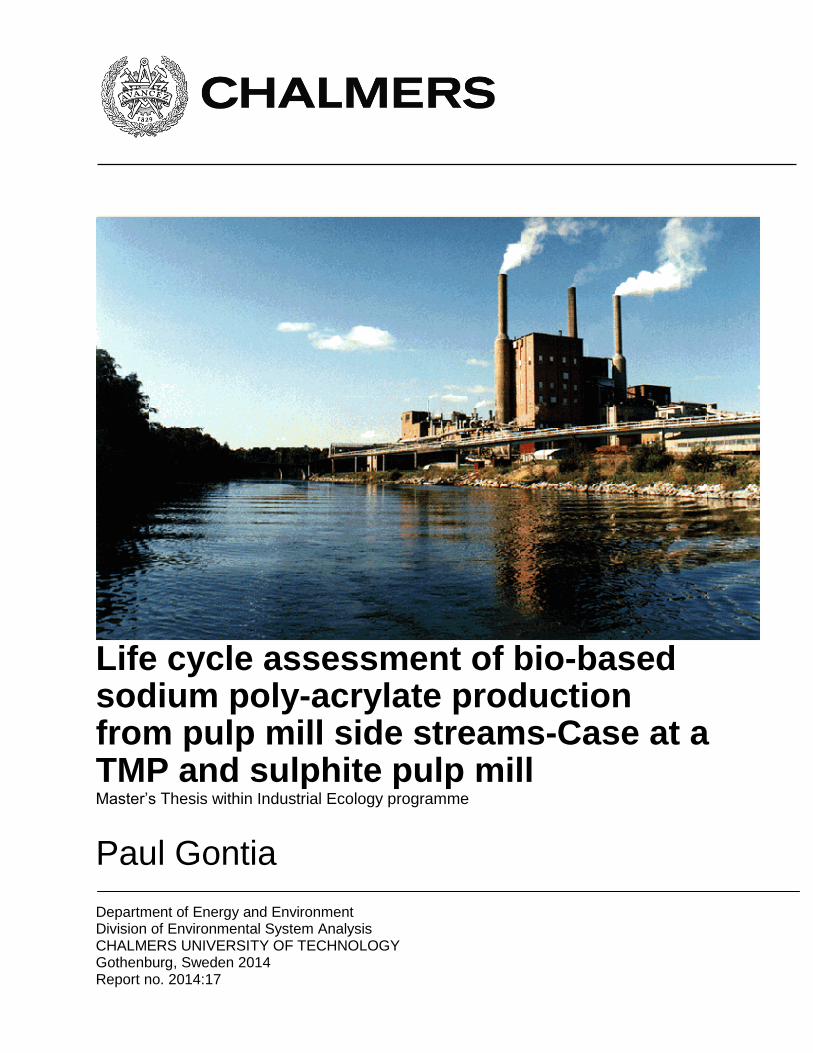
Cover:
Photograph of Domsjo pulp mill
Chalmers Reproservice
Göteborg, Sweden 2014
i
Abstract
Sodium poly-acrylate is a super absorbent polymer which can be used in diverse hygiene products. The
polymer is currently produced from fossil feedstock. The environmental issues and the depletion of
fossil resources are the main drivers for exploring a more sustainable polymer product. Thus, integrating
the production of the sodium-poly-acrylate in two different pulp mills (Ortviken pulp and paper mill in
Sundsvall, and the Domsjö pulp mill in Örnsköldsvik) can potentially be a successful way to achieve
sustainability. The main innovative part of the development is the conversion of the hemicellulose,
derived from five diluted side streams into 3-hydroxypropionic (3-HP) acid by genetically modified yeasts
developed at Chalmers.
In order to reveal the environmental tradeoffs between renewable, bio-based and non-renewable, fossil
based sodium poly-acrylate a comparative, cradle-to-gate life cycle assessment (LCA) was conducted.
For bio-based polymers, forestry activities, pulp and paper mills operations, acrylic acid production
(including: concentration, hydrolysis, and detoxification of the side streams; fermentation of the free
sugars; recovery, dehydration and distillation of 3-HP), and the polymerization of acrylic acid were the
production steps considered in this study. The goals of the LCA study were: 1) to compare the
renewable, bio-based and non-renewable, fossil based production of sodium poly-acrylate; 2) to identify
the environmental hotspots at a very early stage of the development.
According to the results three of the bio-based polymers have a lower global warming potential (GWP)
than the fossil-based polymer. However, the fossil-based polymer shows a lower environmental impact
than its bio-based counterparts for three of the other environmental impact categories considered
(acidification potential, eutrophication potential, and photochemical ozone creation potential). For the
polymers produced at Ortviken, the concentration of the side streams is the hotspot identified. For the
polymers produced at Domsjö, the hotspots identified are the detoxification, fermentation and recovery
processes. Forestry activities, pulp mill operations, dehydration and distillation processes have very
small contribution to the overall environmental impacts.
Key words: Sodium poly-acrylate, Pulp mills, Life cycle assessment, Biorefinery, Superabsorbent

ii
Acknowledgements
First of all I would like to thank my supervisor Matty Janssen for supporting me constantly during the
entire project by generously offering needed insight and thoughtful advice. Also, I thank him for
introducing me to very new topics like the biorefinery concept and life cycle assessment methodology.
Furthermore, I would like to acknowledge Charilaos Xiros, and Yun Chen (from Chalmers University),
Maria Wallenius from Domsjö Company, and Kent Malmgren from SCA Company for kindly providing me
with the necessary data for the LCA study.
I would also like to express my sincere gratitude to my beloved Maria for spoiling me with the best
Russian ‘goodies' the entire time. Last but not least, I am thankful to the Mother Nature for creating
such beauties like Bergsjön Lake and its surroundings that I enjoyed so much during the long breaks.
iii
Abbreviation
3-HP
ALCA
AP
BC
C3
C6
CH4
CLCA
CO2
CO
EP
FU
GWP
HC
LCA
NOx
N2O
PCOP
SO2
SPA
SS1
SS2
SS3
SS4
TMP-E
TMP-UE
3 hydroxyproprionic acid
Atributional life cycle assessment
Acidification potential
Base case scenario
Three atoms of carbon in a chemical compound
Six atoms of carbon in a chemical compound
Methane
Consequential life cycle assessment
Carbon dioxide
Carbon monoxide
Eutrophication potential
Functional unit
Global warming potential
Hydrocarbons
Life cycle assessment
Nitrogen oxides
Dinitrogen monoxide
Photochemical ozone creation potential
Sulfur dioxide
Super absorbent
Sodium poly-acrylate produced from side stream 1 at Domsjo pulp mill
Sodium poly-acrylate produced from side stream 2 at Domsjo pulp mill
Sodium poly-acrylate produced from side stream 3 at Domsjo pulp mill
Sodium poly-acrylate produced from side stream 4 at Domsjo pulp mill
Sodium poly-acrylate produced from side stream thermo-mechanical pulping side
stream concentrated via evaporation
Sodium poly-acrylate produced from side stream thermo-mechanical pulping side
stream concentrated via ultrafiltration
iv
Contents
1. Introduction .......................................................................................................................................... 1
2. Literature review ................................................................................................................................... 2
2.1. Biochemical conversion of lignocellulose ..................................................................................... 2
2.2. Overview of biorefinery LCAs........................................................................................................ 3
2.3. Methodological choices discussion ............................................................................................... 7
2.4. Discussion and conclusions for literature review ......................................................................... 8
3. Method ............................................................................................................................................... 10
3.1. LCA framework ............................................................................................................................ 10
................................................................................................................................................................ 10
3.2. Goal of the study ......................................................................................................................... 11
3.3. Scope of the study ...................................................................................................................... 11
3.4. Scenarios description .................................................................................................................. 19
4. Life cycle inventory ............................................................................................................................. 20
4.1. Bio-based poly-acrylate .............................................................................................................. 20
4.1.1. Forestry activities ................................................................................................................ 20
4.1.2. Pulp and paper mill operations ........................................................................................... 21
4.1.3. Acrylic acid production in an integrated bio-refinery ......................................................... 24
4.1.4. Polymerization process ....................................................................................................... 28
4.2. Fossil-based sodium poly-acrylate .............................................................................................. 29
4.2.1. Conventional acrylic acid production.................................................................................. 29
............................................................................................................................................................ 29
4.2.2. Polymerization process ....................................................................................................... 29
5. Results and discussion ........................................................................................................................ 30
5.1. Global warming potential (GWP) ................................................................................................ 30
5.2. Acidification Potential (AP) ......................................................................................................... 31
5.3. Eutrophication potential (EP) ...................................................................................................... 32
v
5.4. Photochemical ozone creation potential (POCP)........................................................................ 33
5.5. Renewable and non-renewable energy ...................................................................................... 34
5.6. Sensitivity analysis ...................................................................................................................... 35
5.6.1. Concentrated streams scenario .......................................................................................... 35
5.6.2. Fermentation yields scenarios ............................................................................................ 37
5.6.3. Fossil heat sources scenarios .............................................................................................. 38
5.6.4. 2025 electricity scenario for direct electricity input ........................................................... 39
5.6.5. Economic allocation scenario.............................................................................................. 40
6. Conclusions ......................................................................................................................................... 41
References .................................................................................................................................................. 42
Appendix ..................................................................................................................................................... 45
Appendix A: Introduction ........................................................................................................................ 45
Appendix B: Inventory ............................................................................................................................ 45
Annex C: Results ...................................................................................................................................... 50
1
1. Introduction
The environmental issues and the scarcity of natural resources are the main drivers of exploring a more
sustainable material production. The substitution of non-renewable materials with renewable ones is
one solution to succeed achieving a sustainable society. Therefore, in the near future, bio-based fuels,
chemicals and materials are expected to become a large share of these economic goods (Haveren et al.,
2008). However, the current production of biomass based products (1st generation products) is in
competition with the food and feed industry (corn, sugarcane, rapeseed, etc.). The competition raises
ethical and environmental concerns regarding the sustainable production of these bio-products
(Cherubini, 2010). Therefore, much effort is put into shifting to lignocellulosic feedstock (non-food
crops) as the raw material for bio-products (2nd generation products). Lignocellulose is the most
abundant renewable organic resource on Earth and is composed of carbohydrate polymers (cellulose
(35-50%), hemicellulose (25-35%) and lignin (5-30%)) (Jäger and Büchs, 2012).
In this study the use of lignocellulosic residue biomass released, in the form of diluted side streams,
from two different pulp mills are the feedstocks considered for the production of sodium poly-acrylate.
Sodium poly-acrylate is a polymer with high absorbent properties which can be used in diverse products
such as hygiene products. The polymer is currently produced from fossil feedstock in a conventional
refinery. As the pulp industry is losing economic value because of the decrease in paper consumption
there is a need for developing new value added products. Thus, the use of the side streams for
producing poly-acrylates in an integrated biorefinery concept is a good way to increase the
competitiveness of the pulp and paper industry. The concept of the biorefinery has been defined in
different ways depending on the context in which it has been used. For instance, in a forest industry
context, the biorefinery has been defined as the “full utilization of the incoming biomass and other raw
materials for simultaneous and economically optimized production of fibers, chemicals and energy.”
(Berntsson et al., 2012). Biorefineries are very diverse and hard to be classified. For instance, depending
on their input (feedstock), biorefineries have been classified into three types: the lignocellulose
feedstock (LCF) biorefinery, the whole crop biorefinery (cereals and maize) and the green biorefinery
(grassland and green crops) (Cherubini et al., 2009). Depending on their process design, biorefineries can
be a single plant producing one or more products, or can be integrated with existing plants (such as pulp
and paper mills) or other biorefineries. Thus, biorefineries can be characterized by their biomass
feedstock inputs, large spectrum of products and their diverse and integrated processes.
Life cycle assessment (LCA) has been used to assess the environmental impacts of different types of
biorefineries. A comparative life cycle assessment of renewable, bio-based and non-renewable, fossil-
based sodium poly-acrylate production is the aim of this thesis. The fossil-based polymer is currently
produced by using a conventional chemical process whereas for the bio-based polymer a bioprocess is in
its early stages of development. Therefore, life cycle assessment is used, in this case, as a tool that can
direct the technology development when comparing the two alternatives from an environmental
perspective. By identifying environmental hotspots or energy intensive processes a better design of the
new bioprocess technology can be made at a very early stage of the development.
2
2. Literature review
2.1. Biochemical conversion of lignocellulose
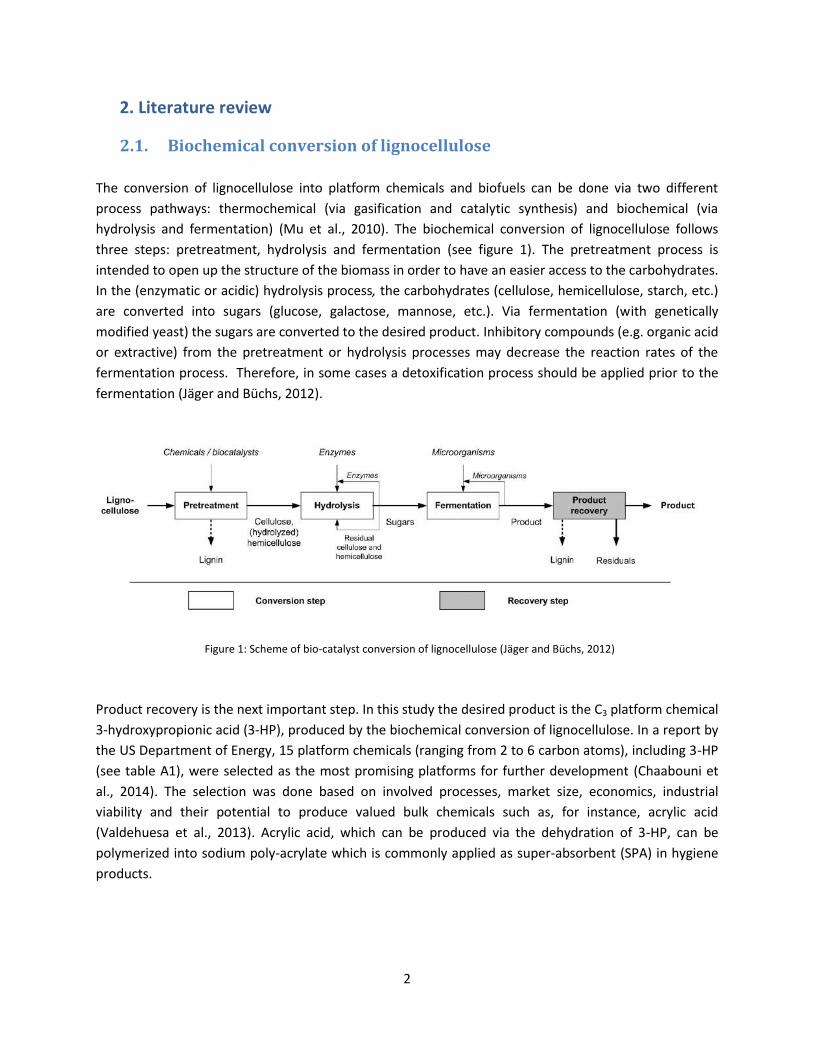
The conversion of lignocellulose into platform chemicals and biofuels can be done via two different
process pathways: thermochemical (via gasification and catalytic synthesis) and biochemical (via
hydrolysis and fermentation) (Mu et al., 2010). The biochemical conversion of lignocellulose follows
three steps: pretreatment, hydrolysis and fermentation (see figure 1). The pretreatment process is
intended to open up the structure of the biomass in order to have an easier access to the carbohydrates.
In the (enzymatic or acidic) hydrolysis process, the carbohydrates (cellulose, hemicellulose, starch, etc.)
are converted into sugars (glucose, galactose, mannose, etc.). Via fermentation (with genetically
modified yeast) the sugars are converted to the desired product. Inhibitory compounds (e.g. organic acid
or extractive) from the pretreatment or hydrolysis processes may decrease the reaction rates of the
fermentation process. Therefore, in some cases a detoxification process should be applied prior to the
fermentation (Jäger and Büchs, 2012).
Product recovery is the next important step. In this study the desired product is the C3 platform chemical
3-hydroxypropionic acid (3-HP), produced by the biochemical conversion of lignocellulose. In a report by
the US Department of Energy, 15 platform chemicals (ranging from 2 to 6 carbon atoms), including 3-HP
(see table A1), were selected as the most promising platforms for further development (Chaabouni et
al., 2014). The selection was done based on involved processes, market size, economics, industrial
viability and their potential to produce valued bulk chemicals such as, for instance, acrylic acid
(Valdehuesa et al., 2013). Acrylic acid, which can be produced via the dehydration of 3-HP, can be
polymerized into sodium poly-acrylate which is commonly applied as super-absorbent (SPA) in hygiene
products.
Figure 1: Scheme of bio-catalyst conversion of lignocellulose (Jäger and Büchs, 2012)
3
2.2. Overview of biorefinery LCAs
By searching at the library of Chalmers University and the Google Scholar search engine (articles from
2007 to 2014), 32 relevant LCA peer-reviewed papers were found. The search terms used were: LCA
biomass feedstock, LCA biomass waste, LCA biorefineries, LCA polymers, LCA chemicals, LCA acrylates
and LCA 3-HP. Two additional conditions were defined for the screening process. First, the feedstock
used in the process should be biomass and second, the technical system analyzed should be a
biochemical process. The papers found through this screening were classified into: first generation
biofuels (5 papers), second generation biofuels (12 papers), bio-materials/bio-chemicals (11 papers) and
integrated bio-refineries (4 papers).
On the one hand, second generation biofuel LCAs are more relevant because they use lignocellulosic
feedstock which is similar to the current study. Many other chemical and technical similarities exist like
the lignocellulose which is converted to sugars via hydrolysis and subsequently used for fuels or
chemicals production. On the other hand, it is interesting to look at the first generation biofuels’ large
scale production. First generation biofuels are produced nowadays at an industrial scale whereas the
second generation biofuels (also lignocellulose-based chemicals) are not yet mass produced.
Because of the intended shift to sustainable platform and bulk chemical production, several LCA studies
have been done to assess the environmental impacts of such bio-processes. Whole-crop biorefinerires
for the production of polymers were most often assessed (7 articles out of 11). For example, Groot and
Borén (2010) looked at poly-lactic acid production (from sugarcane) and Alvarenga et al. (2013) analyzed
PVC production (from sugarcane). Fewer studies considered platform chemicals production from
lignocellulosic feedstock. For instance, the production of poly-itaconic (Nuss and Gardner, 2013) or the
production of propionic acid (Ekman and Börjesson, 2011) was assessed in an LCA study (see table 1).
Furthermore, another type of LCA studies investigated the integration of biorefineries with other
production systems. For instance González‐García et al. (2011) looked at bioethanol production (via
fermentation) integrated at a pulp and paper mill. Cherubini and Ulgiati (2009) and Uihlein and Schebek
(2009) investigated the multi-product output biorefinery concept in which several high valued products
(bioethanol, electricity and chemicals) are produced (see table 1).
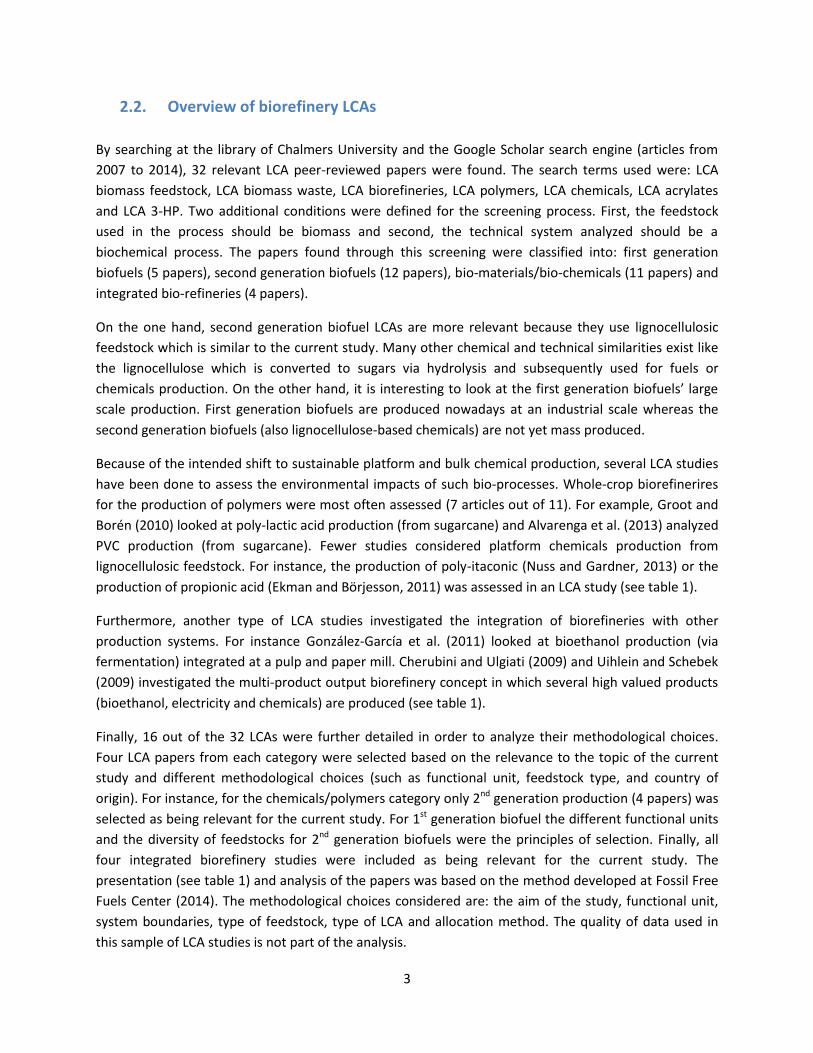
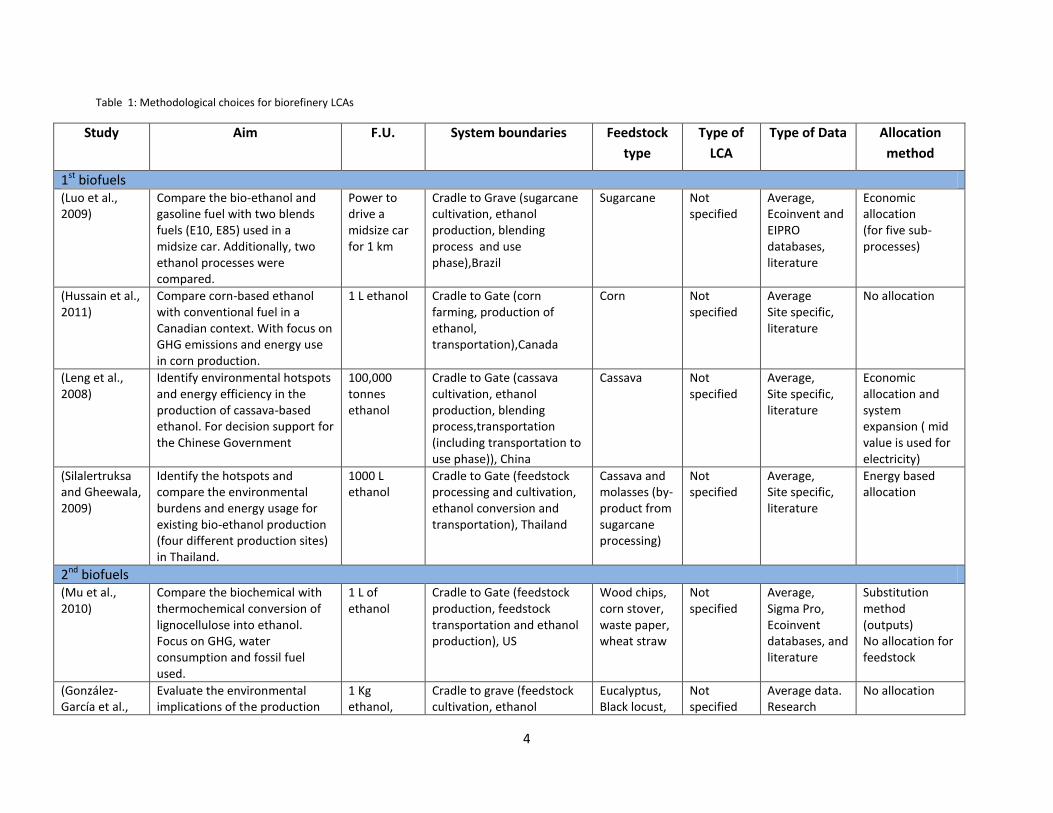
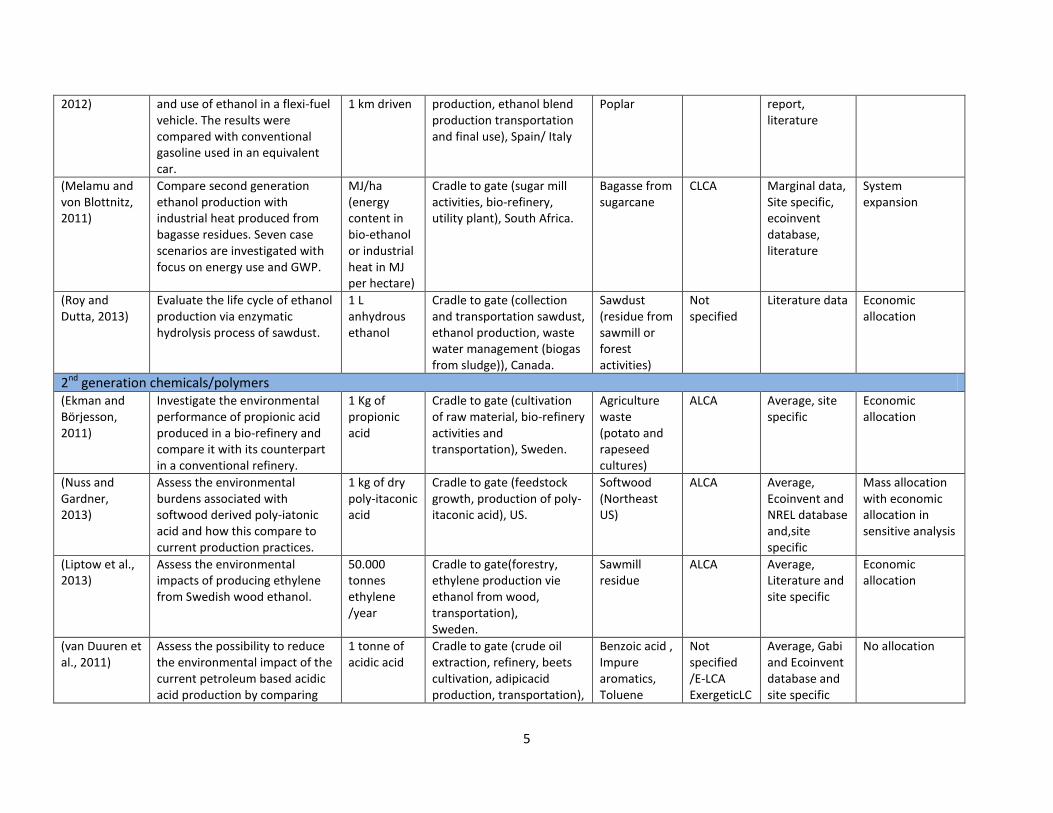
Finally, 16 out of the 32 LCAs were further detailed in order to analyze their methodological choices.
Four LCA papers from each category were selected based on the relevance to the topic of the current
study and different methodological choices (such as functional unit, feedstock type, and country of
origin). For instance, for the chemicals/polymers category only 2nd generation production (4 papers) was
selected as being relevant for the current study. For 1st generation biofuel the different functional units
and the diversity of feedstocks for 2nd generation biofuels were the principles of selection. Finally, all
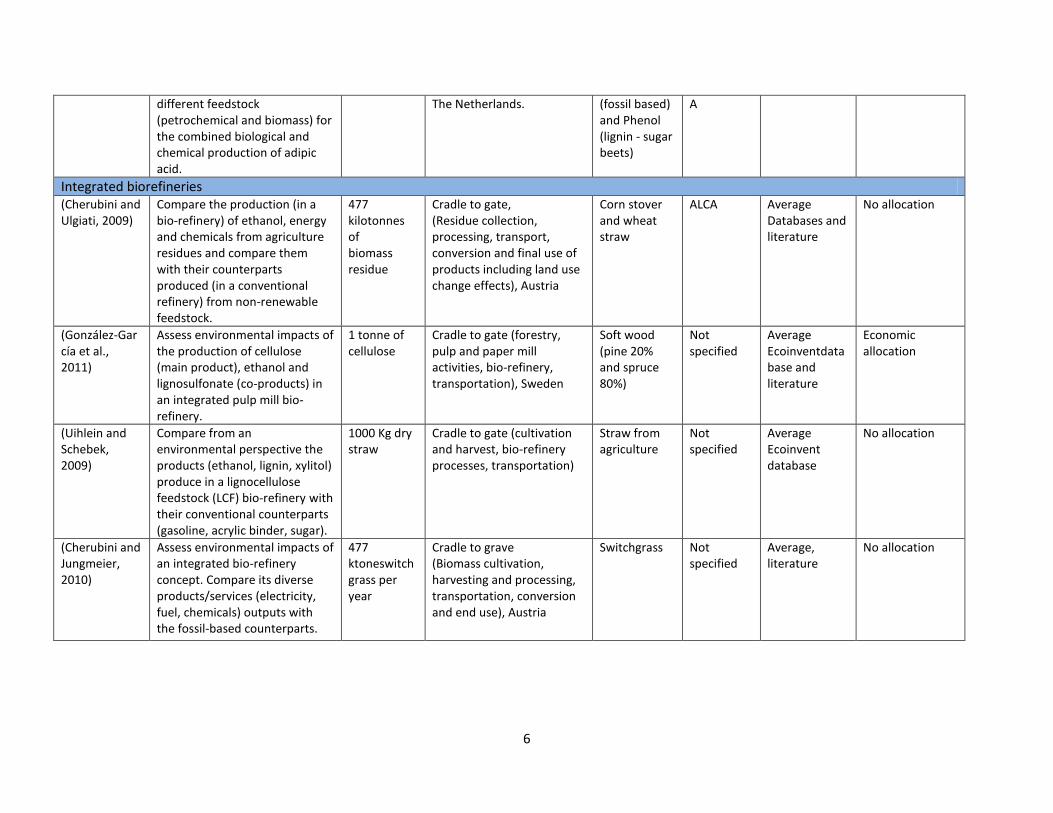
four integrated biorefinery studies were included as being relevant for the current study. The
presentation (see table 1) and analysis of the papers was based on the method developed at Fossil Free
Fuels Center (2014). The methodological choices considered are: the aim of the study, functional unit,
system boundaries, type of feedstock, type of LCA and allocation method. The quality of data used in
this sample of LCA studies is not part of the analysis.
4
Table 1: Methodological choices for biorefinery LCAs
Study Aim F.U. System boundaries
Feedstock
type
Type of
LCA
Type of Data Allocation
method
1st biofuels (Luo et al., 2009)
Compare the bio-ethanol and gasoline fuel with two blends fuels (E10, E85) used in a midsize car. Additionally, two ethanol processes were compared.
Power to drive a midsize car for 1 km
Cradle to Grave (sugarcane cultivation, ethanol production, blending process and use phase),Brazil
Sugarcane Not specified
Average, Ecoinvent and EIPRO databases, literature
Economic allocation (for five sub-processes)
(Hussain et al., 2011)
Compare corn-based ethanol with conventional fuel in a Canadian context. With focus on GHG emissions and energy use in corn production.
1 L ethanol
Cradle to Gate (corn farming, production of ethanol, transportation),Canada
Corn Not specified
Average Site specific, literature
No allocation
(Leng et al., 2008)
Identify environmental hotspots and energy efficiency in the production of cassava-based ethanol. For decision support for the Chinese Government
100,000 tonnes ethanol
Cradle to Gate (cassava cultivation, ethanol production, blending process,transportation (including transportation to use phase)), China
Cassava Not specified
Average, Site specific, literature
Economic allocation and system expansion ( mid value is used for electricity)
(Silalertruksa and Gheewala, 2009)
Identify the hotspots and compare the environmental burdens and energy usage for existing bio-ethanol production (four different production sites) in Thailand.
1000 L ethanol
Cradle to Gate (feedstock processing and cultivation, ethanol conversion and transportation), Thailand
Cassava and molasses (by-product from sugarcane processing)
Not specified
Average, Site specific, literature
Energy based allocation
2nd biofuels (Mu et al., 2010)
Compare the biochemical with thermochemical conversion of lignocellulose into ethanol. Focus on GHG, water consumption and fossil fuel used.
1 L of ethanol
Cradle to Gate (feedstock production, feedstock transportation and ethanol production), US
Wood chips, corn stover, waste paper, wheat straw
Not specified
Average, Sigma Pro, Ecoinvent databases, and literature
Substitution method (outputs) No allocation for feedstock
(González-García et al.,
Evaluate the environmental implications of the production
1 Kg ethanol,
Cradle to grave (feedstock cultivation, ethanol
Eucalyptus, Black locust,
Not specified
Average data. Research
No allocation
5
2012) and use of ethanol in a flexi-fuel vehicle. The results were compared with conventional gasoline used in an equivalent car.
1 km driven
production, ethanol blend production transportation and final use), Spain/ Italy
Poplar report, literature
(Melamu and von Blottnitz, 2011)
Compare second generation ethanol production with industrial heat produced from bagasse residues. Seven case scenarios are investigated with focus on energy use and GWP.
MJ/ha (energy content in bio-ethanol or industrial heat in MJ per hectare)
Cradle to gate (sugar mill activities, bio-refinery, utility plant), South Africa.
Bagasse from sugarcane
CLCA Marginal data, Site specific, ecoinvent database, literature
System expansion
(Roy and Dutta, 2013)
Evaluate the life cycle of ethanol production via enzymatic hydrolysis process of sawdust.
1 L anhydrous ethanol
Cradle to gate (collection and transportation sawdust, ethanol production, waste water management (biogas from sludge)), Canada.
Sawdust (residue from sawmill or forest activities)
Not specified
Literature data Economic allocation
2nd generation chemicals/polymers (Ekman and Börjesson, 2011)
Investigate the environmental performance of propionic acid produced in a bio-refinery and compare it with its counterpart in a conventional refinery.
1 Kg of propionic acid
Cradle to gate (cultivation of raw material, bio-refinery activities and transportation), Sweden.
Agriculture waste (potato and rapeseed cultures)
ALCA Average, site specific
Economic allocation
(Nuss and Gardner, 2013)
Assess the environmental burdens associated with softwood derived poly-iatonic acid and how this compare to current production practices.
1 kg of dry poly-itaconic acid
Cradle to gate (feedstock growth, production of poly-itaconic acid), US.
Softwood (Northeast US)
ALCA Average, Ecoinvent and NREL database and,site specific
Mass allocation with economic allocation in sensitive analysis
(Liptow et al., 2013)
Assess the environmental impacts of producing ethylene from Swedish wood ethanol.
50.000 tonnes ethylene /year
Cradle to gate(forestry, ethylene production vie ethanol from wood, transportation), Sweden.
Sawmill residue
ALCA Average, Literature and site specific
Economic allocation
(van Duuren et al., 2011)
Assess the possibility to reduce the environmental impact of the current petroleum based acidic acid production by comparing
1 tonne of acidic acid
Cradle to gate (crude oil extraction, refinery, beets cultivation, adipicacid production, transportation),
Benzoic acid , Impure aromatics, Toluene
Not specified /E-LCA ExergeticLC
Average, Gabi and Ecoinvent database and site specific
No allocation
6
different feedstock (petrochemical and biomass) for the combined biological and chemical production of adipic acid.
The Netherlands.
(fossil based) and Phenol (lignin - sugar beets)
A
Integrated biorefineries (Cherubini and Ulgiati, 2009)
Compare the production (in a bio-refinery) of ethanol, energy and chemicals from agriculture residues and compare them with their counterparts produced (in a conventional refinery) from non-renewable feedstock.
477 kilotonnes of biomass residue
Cradle to gate, (Residue collection, processing, transport, conversion and final use of products including land use change effects), Austria
Corn stover and wheat straw
ALCA Average Databases and literature
No allocation
(González‐García et al., 2011)
Assess environmental impacts of the production of cellulose (main product), ethanol and lignosulfonate (co-products) in an integrated pulp mill bio-refinery.
1 tonne of cellulose
Cradle to gate (forestry, pulp and paper mill activities, bio-refinery, transportation), Sweden
Soft wood (pine 20% and spruce 80%)
Not specified
Average Ecoinventdatabase and literature
Economic allocation
(Uihlein and Schebek, 2009)
Compare from an environmental perspective the products (ethanol, lignin, xylitol) produce in a lignocellulose feedstock (LCF) bio-refinery with their conventional counterparts (gasoline, acrylic binder, sugar).
1000 Kg dry straw
Cradle to gate (cultivation and harvest, bio-refinery processes, transportation)
Straw from agriculture
Not specified
Average Ecoinvent database
No allocation
(Cherubini and Jungmeier, 2010)
Assess environmental impacts of an integrated bio-refinery concept. Compare its diverse products/services (electricity, fuel, chemicals) outputs with the fossil-based counterparts.
477 ktoneswitchgrass per year
Cradle to grave (Biomass cultivation, harvesting and processing, transportation, conversion and end use), Austria
Switchgrass Not specified
Average, literature
No allocation
7
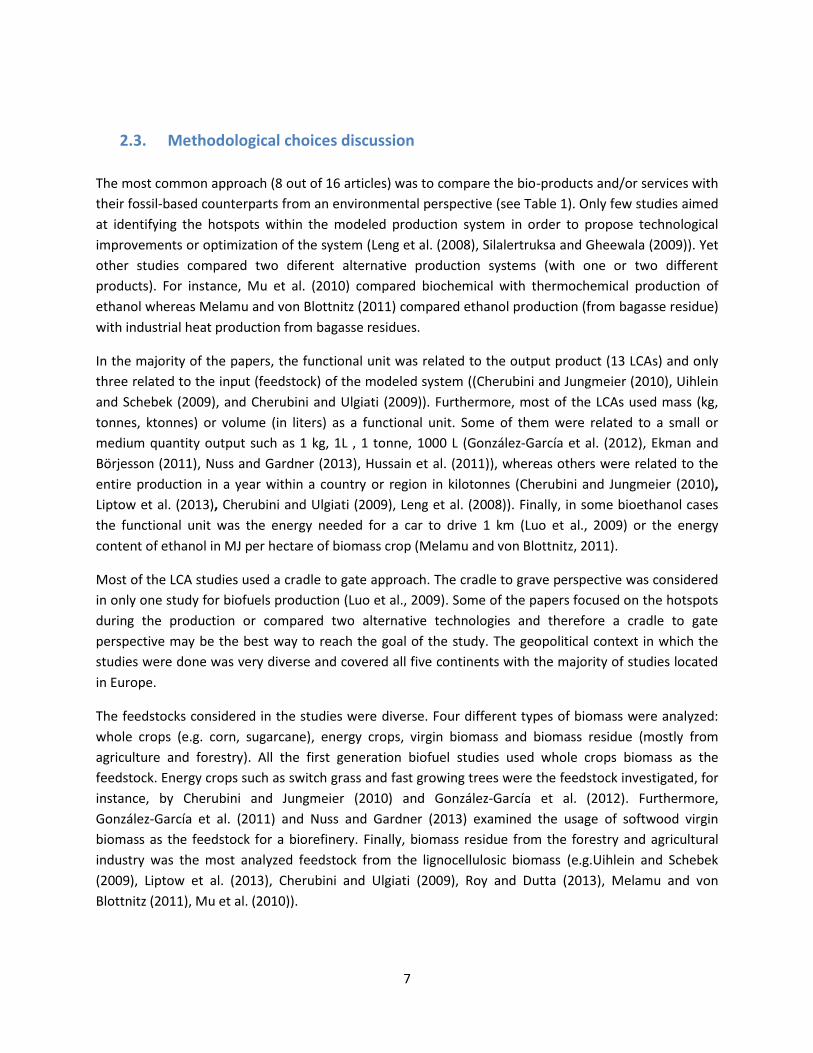
2.3. Methodological choices discussion
The most common approach (8 out of 16 articles) was to compare the bio-products and/or services with
their fossil-based counterparts from an environmental perspective (see Table 1). Only few studies aimed
at identifying the hotspots within the modeled production system in order to propose technological
improvements or optimization of the system (Leng et al. (2008), Silalertruksa and Gheewala (2009)). Yet
other studies compared two diferent alternative production systems (with one or two different
products). For instance, Mu et al. (2010) compared biochemical with thermochemical production of
ethanol whereas Melamu and von Blottnitz (2011) compared ethanol production (from bagasse residue)
with industrial heat production from bagasse residues.
In the majority of the papers, the functional unit was related to the output product (13 LCAs) and only
three related to the input (feedstock) of the modeled system ((Cherubini and Jungmeier (2010), Uihlein
and Schebek (2009), and Cherubini and Ulgiati (2009)). Furthermore, most of the LCAs used mass (kg,
tonnes, ktonnes) or volume (in liters) as a functional unit. Some of them were related to a small or
medium quantity output such as 1 kg, 1L , 1 tonne, 1000 L (González-García et al. (2012), Ekman and
Börjesson (2011), Nuss and Gardner (2013), Hussain et al. (2011)), whereas others were related to the
entire production in a year within a country or region in kilotonnes (Cherubini and Jungmeier (2010),
Liptow et al. (2013), Cherubini and Ulgiati (2009), Leng et al. (2008)). Finally, in some bioethanol cases
the functional unit was the energy needed for a car to drive 1 km (Luo et al., 2009) or the energy
content of ethanol in MJ per hectare of biomass crop (Melamu and von Blottnitz, 2011).
Most of the LCA studies used a cradle to gate approach. The cradle to grave perspective was considered
in only one study for biofuels production (Luo et al., 2009). Some of the papers focused on the hotspots
during the production or compared two alternative technologies and therefore a cradle to gate
perspective may be the best way to reach the goal of the study. The geopolitical context in which the
studies were done was very diverse and covered all five continents with the majority of studies located
in Europe.
The feedstocks considered in the studies were diverse. Four different types of biomass were analyzed:
whole crops (e.g. corn, sugarcane), energy crops, virgin biomass and biomass residue (mostly from
agriculture and forestry). All the first generation biofuel studies used whole crops biomass as the
feedstock. Energy crops such as switch grass and fast growing trees were the feedstock investigated, for
instance, by Cherubini and Jungmeier (2010) and González-García et al. (2012). Furthermore,
González‐García et al. (2011) and Nuss and Gardner (2013) examined the usage of softwood virgin
biomass as the feedstock for a biorefinery. Finally, biomass residue from the forestry and agricultural
industry was the most analyzed feedstock from the lignocellulosic biomass (e.g.Uihlein and Schebek
(2009), Liptow et al. (2013), Cherubini and Ulgiati (2009), Roy and Dutta (2013), Melamu and von
Blottnitz (2011), Mu et al. (2010)).

8
In most of the studies the practitioners did not specify what type of LCA they conducted. If the LCA is an
attributional (ALCA) or a consequential (CLCA) is relevant for further methodological choices that need
to be taken, like the type of data used (average or marginal) or the allocation method. Even if it is not
specified, it can be understood from the type of data used or the allocation method adopted what type
of LCA was conducted. Thus, it can be observed that the majority of studies have conducted an
attributional LCA.
Since most of the studies conducted an attributional LCA, average data were used and only one study
used marginal data (e.g. Melamu and von Blottnitz (2011)). All the studies used combined primary and
secondary sources of data starting from site specific to databases and literature sources.
Some of the articles included in the literature review did not use any allocation procedure (6 articles).
When allocation was done, an economic approach was the most common (6 articles). Few studies used
mass allocation and only two studies used system expansion (Melamu and von Blottnitz (2011)and Mu
et al. (2010)). Finally, in one study a mix of economic allocation and system expansion was used (Leng et
al., 2008). Even all three studies applied system expension, only Melamu and von Blottnitz (2011) did an
CLCA study.
2.4. Discussion and conclusions for literature review
Most of the reviewed LCA studies focused on second generation biofuels. Another popular topic
investigated was the platform chemicals and polymers synthesized from whole crop biomass (1st
generartion polymers/chemicals) In contrast, fewer studies looked at 2nd generation polymers/chemicals
production. None of the studies investigated sodium poly-acrylate production from an environmental
perspective. In one study a product (sodium poly-itaconic acid) with similar properties (absorbent) was
assessed using LCA (Nuss and Gardner, 2013) where the environmental burdens were compared, as in
the present case study, with fossil-based poly-acrylate.
As in the LCA carried out in this work, most of the studies compared the bio-based products with their
fossil-based counterparts. The other aim of the current study is to identify the environmental hotspots
in order to support technical development, an issue that was less examined in the reviewed studies.
The majority of the studies conducted a cradle to gate LCA using an attributional approach. That is also
the case for the current study. The reason for why a cradle to gate perspective was chosen was not
clearly expressed in the reviewed studies. However, the multitude of applications of chemicals/polymers
may explain why this perspective was chosen. For instance, sodium poly-acrylate can be applied in
diverse hygiene products, medicine applications, paint products, etc. Additionally, by doing a cradle to
grave analysis for a final product (for e.g. diapers) would divert the current focus of the study (technical
development of an integrated biorefinery).
Marginal data were used only in one study in which a consequential LCA was done. Because most
studies carried out an attributional LCA, average data from several sources were most commonly used.
The reason for using several data sources is the lack of site specific data sets from biorefinery plants, or
9
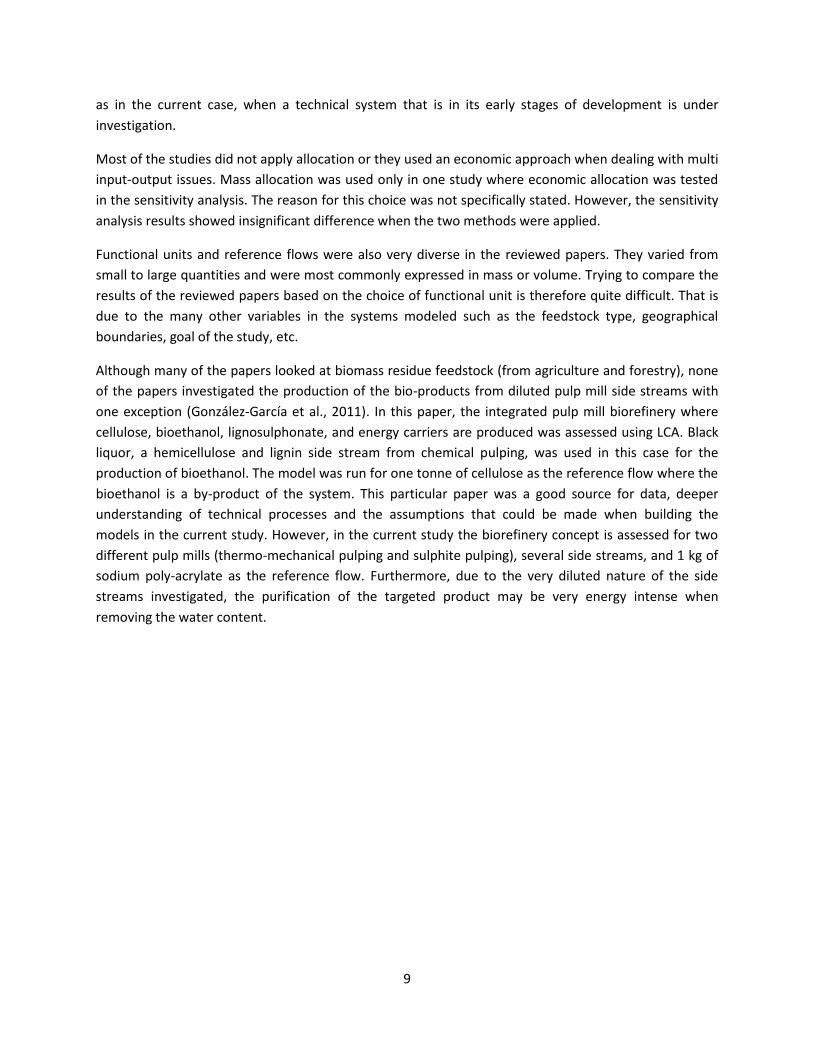
as in the current case, when a technical system that is in its early stages of development is under
investigation.
Most of the studies did not apply allocation or they used an economic approach when dealing with multi
input-output issues. Mass allocation was used only in one study where economic allocation was tested
in the sensitivity analysis. The reason for this choice was not specifically stated. However, the sensitivity
analysis results showed insignificant difference when the two methods were applied.
Functional units and reference flows were also very diverse in the reviewed papers. They varied from
small to large quantities and were most commonly expressed in mass or volume. Trying to compare the
results of the reviewed papers based on the choice of functional unit is therefore quite difficult. That is
due to the many other variables in the systems modeled such as the feedstock type, geographical
boundaries, goal of the study, etc.
Although many of the papers looked at biomass residue feedstock (from agriculture and forestry), none
of the papers investigated the production of the bio-products from diluted pulp mill side streams with
one exception (González‐García et al., 2011). In this paper, the integrated pulp mill biorefinery where
cellulose, bioethanol, lignosulphonate, and energy carriers are produced was assessed using LCA. Black
liquor, a hemicellulose and lignin side stream from chemical pulping, was used in this case for the
production of bioethanol. The model was run for one tonne of cellulose as the reference flow where the
bioethanol is a by-product of the system. This particular paper was a good source for data, deeper
understanding of technical processes and the assumptions that could be made when building the
models in the current study. However, in the current study the biorefinery concept is assessed for two
different pulp mills (thermo-mechanical pulping and sulphite pulping), several side streams, and 1 kg of
sodium poly-acrylate as the reference flow. Furthermore, due to the very diluted nature of the side
streams investigated, the purification of the targeted product may be very energy intense when
removing the water content.
10
3. Method
3.1. LCA framework
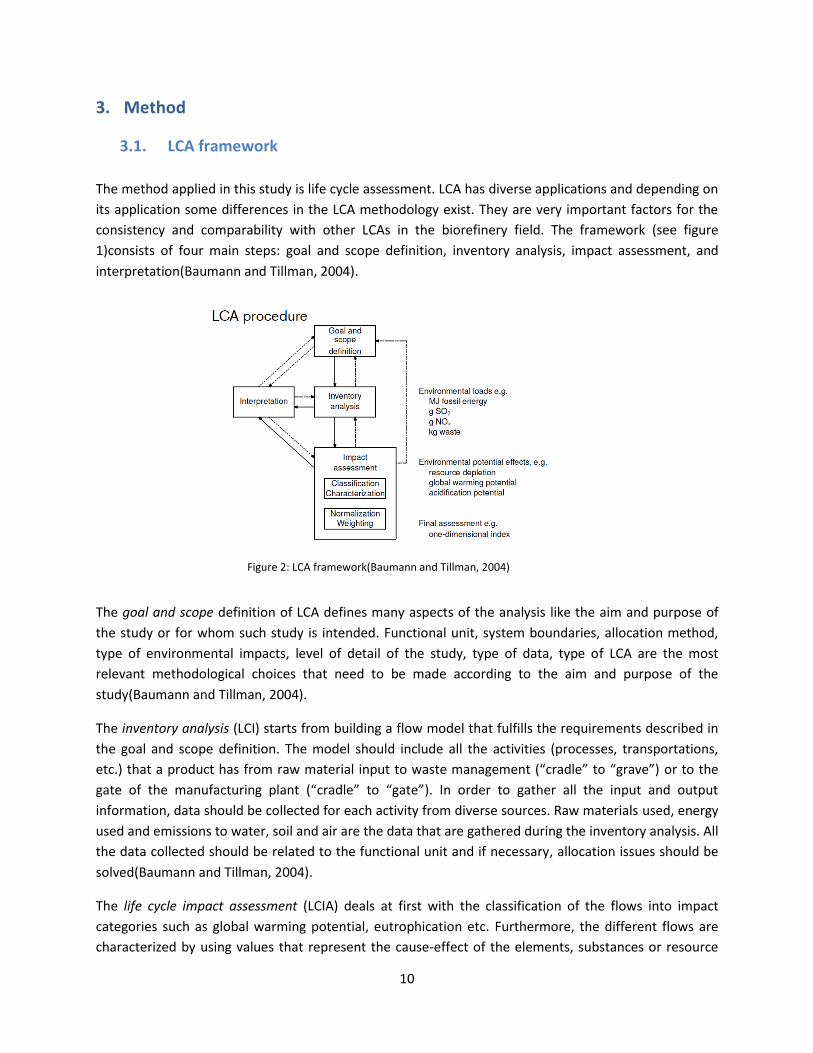
The method applied in this study is life cycle assessment. LCA has diverse applications and depending on
its application some differences in the LCA methodology exist. They are very important factors for the
consistency and comparability with other LCAs in the biorefinery field. The framework (see figure
1)consists of four main steps: goal and scope definition, inventory analysis, impact assessment, and
interpretation(Baumann and Tillman, 2004).
The goal and scope definition of LCA defines many aspects of the analysis like the aim and purpose of
the study or for whom such study is intended. Functional unit, system boundaries, allocation method,
type of environmental impacts, level of detail of the study, type of data, type of LCA are the most
relevant methodological choices that need to be made according to the aim and purpose of the
study(Baumann and Tillman, 2004).
The inventory analysis (LCI) starts from building a flow model that fulfills the requirements described in
the goal and scope definition. The model should include all the activities (processes, transportations,
etc.) that a product has from raw material input to waste management (“cradle” to “grave”) or to the
gate of the manufacturing plant (“cradle” to “gate”). In order to gather all the input and output
information, data should be collected for each activity from diverse sources. Raw materials used, energy
used and emissions to water, soil and air are the data that are gathered during the inventory analysis. All
the data collected should be related to the functional unit and if necessary, allocation issues should be
solved(Baumann and Tillman, 2004).
The life cycle impact assessment (LCIA) deals at first with the classification of the flows into impact
categories such as global warming potential, eutrophication etc. Furthermore, the different flows are
characterized by using values that represent the cause-effect of the elements, substances or resource
Figure 2: LCA framework(Baumann and Tillman, 2004)
11
consumption in the natural environment. Thus, the approximate environmental impact can be
established for each impact category. The impact categories can be even further aggregated into one
index by using weighting procedures, an expert panel, etc. The level of aggregation of the data is directly
dependent on the purpose of the study and who such study is intended for(Baumann and Tillman,
2004).
The interpretation handles the results of the analysis. The interpretation part is very important for the
way the findings are communicated. They should be consistent with the goal and scope definition in
order to reach valued conclusions. The results are often presented with bar diagrams or with a table in
case the results of the LCIare presented. At this part of the LCA sensitivity or uncertainty analysis of the
assumptions, type of data, allocation, etc., can be done for a more in-depth discussion of the
results(Baumann and Tillman, 2004).
3.2. Goal of the study
The goal of the study is to analyze the environmental impacts of sodium poly-acrylate produced in a
pulp mill biorefinery concept and to compare it with its counterpart produced from fossil feedstock. Five
different side streams released from two different pulp mills are the biomass sources considered for the
biopolymer production. Sodium poly-acrylate can be further applied as super-absorbent (SPA), in
hygiene products. The objectives of the study are:
- To determine the environmental hotspots of the bio-based sodium poly-acrylate production for
supporting technology development in order to optimize the overall process;
- To understand the possible environmental benefits and trade-offs of the new bio-process when
compared to the current production of sodium poly-acrylate.
The LCA results are intended to be used by academic researchers, technology developers and decision
makers from involved industries. The LCA is part of a larger project where industry (SCA, Domsjö) and
academia (Chalmers University) are working together to achieve the proposed technology development.
3.3. Scope of the study
Functional unit
Although the polymers are made from different feedstocks (oil and lignocellulose) and via two different
processes (fossil refinery and biorefinery) it is assumed that they have the same functionality and quality
(e.g. chemical properties). The main function of the two technologies is to produce high quality sodium
poly-acrylate. Therefore, to have the same functional unit for both processes is a reasonable choice. The
functional unit is an amount of sodium poly-acrylate.
In addition to the functional unit, the reference flow needs to be established. The reference flow
represents the amount of product used to satisfy the functionality of the system (which is described by
the functional unit). Therefore, the reference flow chosen for the study is 1 kg of sodium poly-acrylate.
12
System boundaries
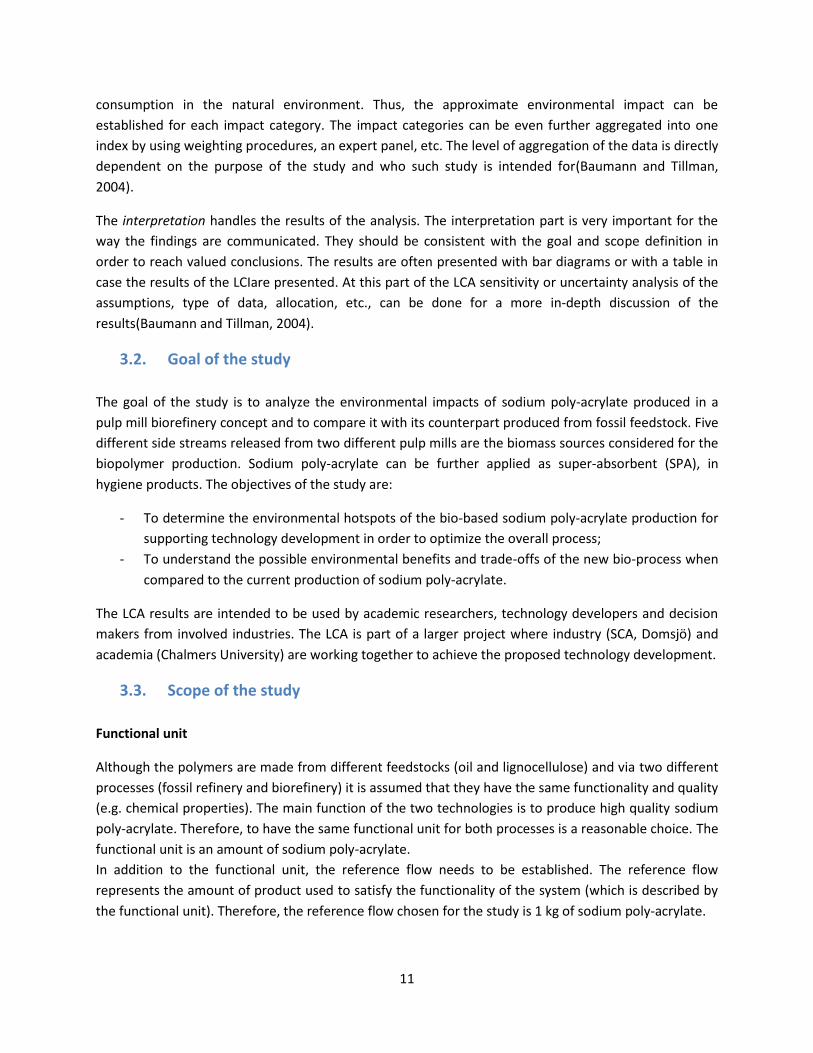
The production of sodium poly-acrylate is assessed using a cradle-to-gate approach. The technical
system contains several main processes and they are different for the two cases (biorefinery and fossil
refinery). However, they are classified into the same three categories: production of sodium poly-
acrylate, auxiliary processes and transportation (see figures 3 and 4).
The first category is related to the production of the sodium poly-acrylate and for the bio-based sodium
poly-acrylate it was divided into four distinctive subsystems (S): forestry activities (S1), pulp and paper
mills operations (S2), acrylic acid production (S3) and finally the polymer production via polymerization
(S4). The subsystem S3 is the focus of this study because this is where the development takes place, and
it contains several steps: hydrolysis and detoxification of the side streams, fermentation of the free
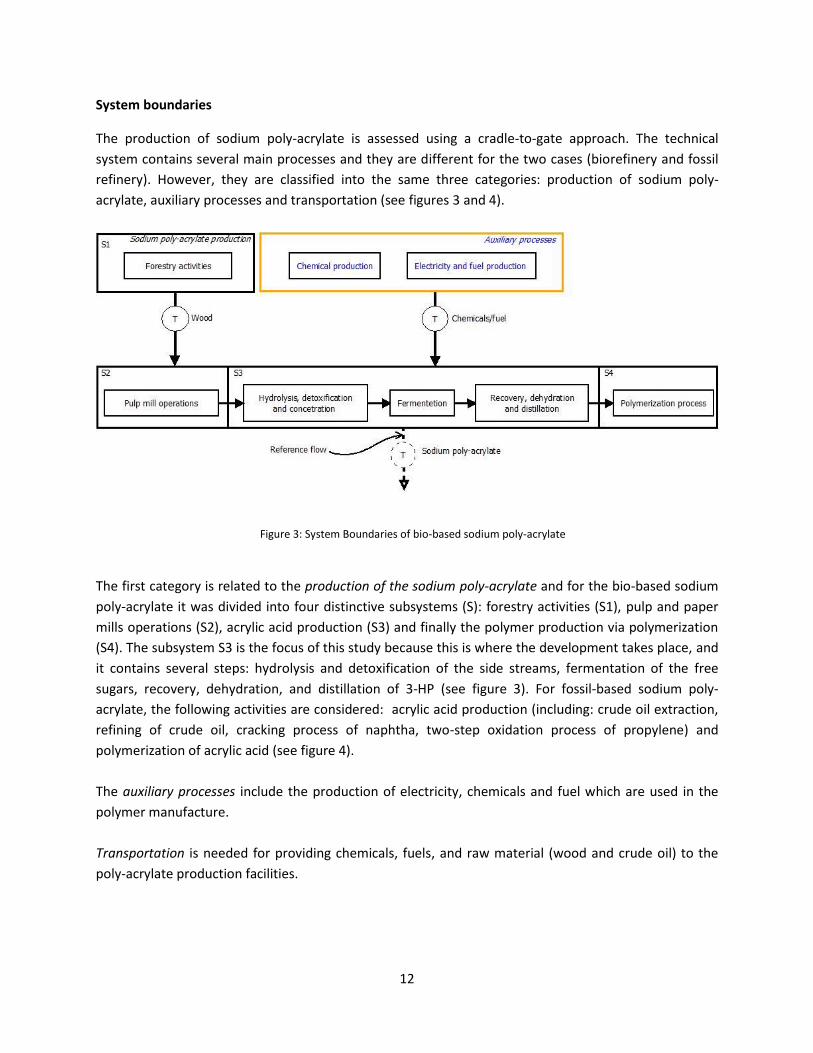
sugars, recovery, dehydration, and distillation of 3-HP (see figure 3). For fossil-based sodium poly-
acrylate, the following activities are considered: acrylic acid production (including: crude oil extraction,
refining of crude oil, cracking process of naphtha, two-step oxidation process of propylene) and
polymerization of acrylic acid (see figure 4).
The auxiliary processes include the production of electricity, chemicals and fuel which are used in the
polymer manufacture.
Transportation is needed for providing chemicals, fuels, and raw material (wood and crude oil) to the
poly-acrylate production facilities.
Figure 3: System Boundaries of bio-based sodium poly-acrylate
13
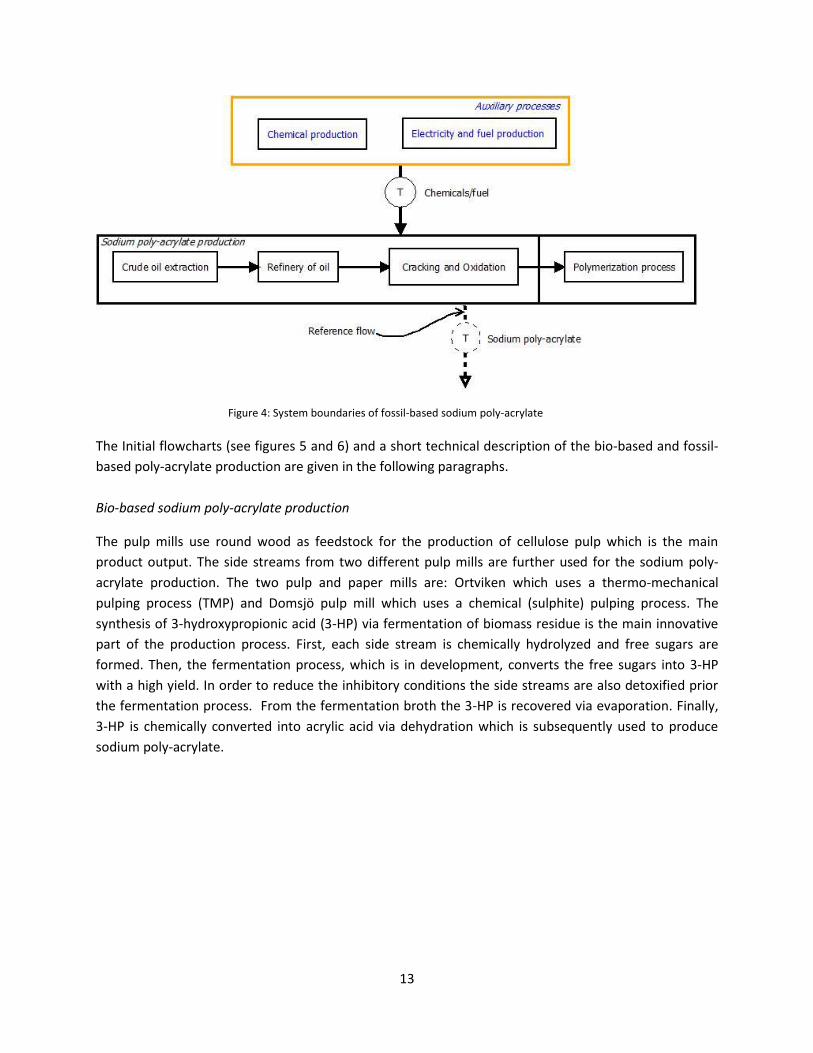
The Initial flowcharts (see figures 5 and 6) and a short technical description of the bio-based and fossil-
based poly-acrylate production are given in the following paragraphs.
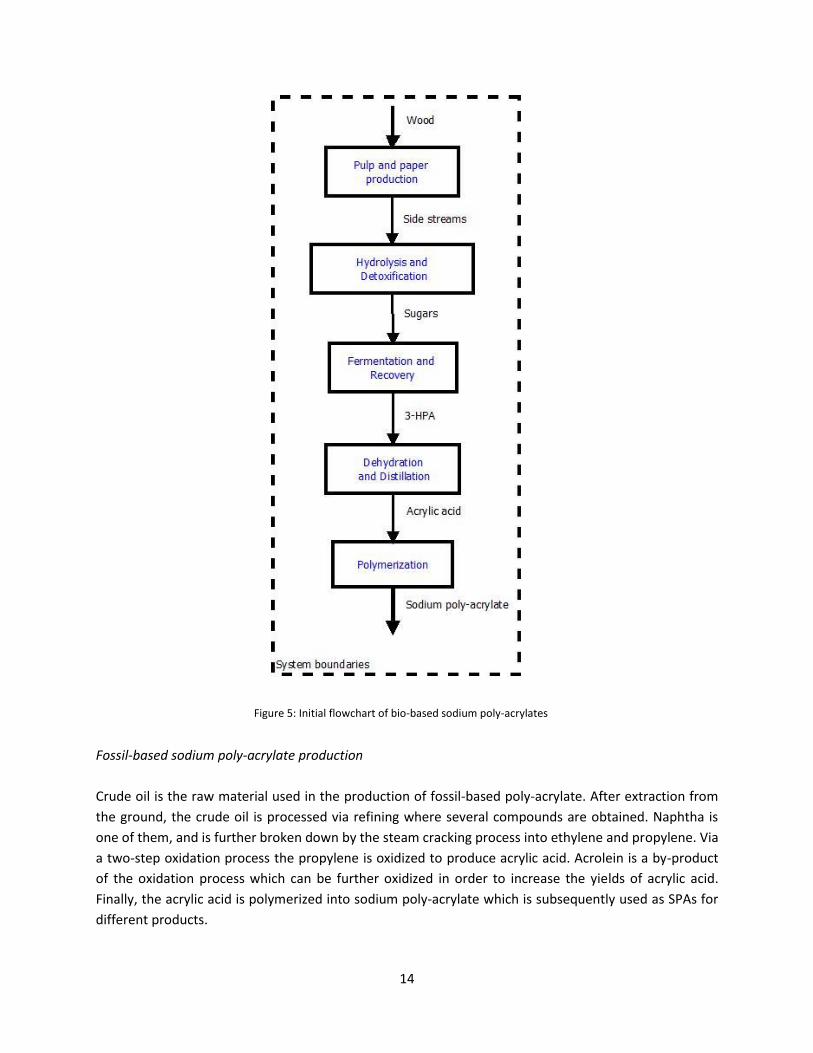
Bio-based sodium poly-acrylate production
The pulp mills use round wood as feedstock for the production of cellulose pulp which is the main
product output. The side streams from two different pulp mills are further used for the sodium poly-
acrylate production. The two pulp and paper mills are: Ortviken which uses a thermo-mechanical
pulping process (TMP) and Domsjö pulp mill which uses a chemical (sulphite) pulping process. The
synthesis of 3-hydroxypropionic acid (3-HP) via fermentation of biomass residue is the main innovative
part of the production process. First, each side stream is chemically hydrolyzed and free sugars are
formed. Then, the fermentation process, which is in development, converts the free sugars into 3-HP
with a high yield. In order to reduce the inhibitory conditions the side streams are also detoxified prior
the fermentation process. From the fermentation broth the 3-HP is recovered via evaporation. Finally,
3-HP is chemically converted into acrylic acid via dehydration which is subsequently used to produce
sodium poly-acrylate.
Figure 4: System boundaries of fossil-based sodium poly-acrylate
14
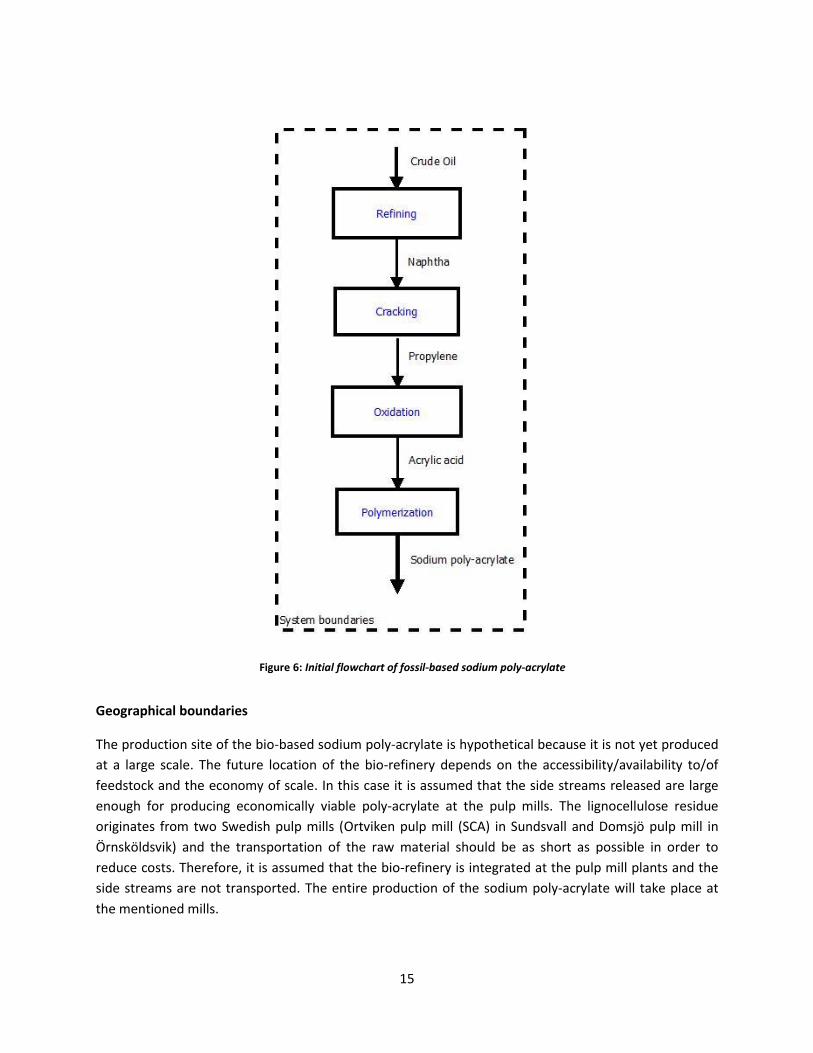
Fossil-based sodium poly-acrylate production
Crude oil is the raw material used in the production of fossil-based poly-acrylate. After extraction from
the ground, the crude oil is processed via refining where several compounds are obtained. Naphtha is
one of them, and is further broken down by the steam cracking process into ethylene and propylene. Via
a two-step oxidation process the propylene is oxidized to produce acrylic acid. Acrolein is a by-product
of the oxidation process which can be further oxidized in order to increase the yields of acrylic acid.
Finally, the acrylic acid is polymerized into sodium poly-acrylate which is subsequently used as SPAs for
different products.
Figure 5: Initial flowchart of bio-based sodium poly-acrylates
15
Geographical boundaries
The production site of the bio-based sodium poly-acrylate is hypothetical because it is not yet produced
at a large scale. The future location of the bio-refinery depends on the accessibility/availability to/of
feedstock and the economy of scale. In this case it is assumed that the side streams released are large
enough for producing economically viable poly-acrylate at the pulp mills. The lignocellulose residue
originates from two Swedish pulp mills (Ortviken pulp mill (SCA) in Sundsvall and Domsjö pulp mill in
Örnsköldsvik) and the transportation of the raw material should be as short as possible in order to
reduce costs. Therefore, it is assumed that the bio-refinery is integrated at the pulp mill plants and the
side streams are not transported. The entire production of the sodium poly-acrylate will take place at
the mentioned mills.
Figure 6: Initial flowchart of fossil-based sodium poly-acrylate
16
The study is placed in a Swedish context. Therefore, the manufacturing of the fossil based sodium poly-
acrylate is assumed to be in The Netherlands (BASF) which is the closest plant to Sweden. BASF is one of
the largest chemical companies in the world and the largest producer of poly-acrylates in Europe
(Nonwovens Industry, 2014). Poly-acrylates in form of SPAs are used in hygiene products by SCA which is
the main consumer of sodium poly-acrylate in Sweden and one of the largest in Europe (Market Reports
Online, 2014).
Temporal boundaries
The time horizon is examined in two perspectives: how long the results of the study are valid for and
how far into the future the technical system is implemented.
The results of the study are valid for short to medium term period (10-20 years) as they are intended to
support technology development. Furthermore, when considering the environmental impacts, the
temporal boundaries may extend long into the future. For instance, greenhouse gases such as CO2 have
a long impact (100 years) on climate change.
Two scenarios are modeled when considering the temporal boundaries for technical system: first, the
present year 2014 and second the year 2025 when the bio-refinery is expected to be implemented at
industrial scale. The second scenario is relevant because the energy system is projected to change to
some degree until the year 2025 (European Commission, 2014).
Type of LCA
The results of the study should indicate the hotspots of the bio-refinery for supporting technical
development. Additionally, they should indicate which of the alternatives performs better from an
environmental perspective. Considering the described goals of the study the intended LCA is an
attributional LCA (ALCA).
All the data collected is implemented in the model described in the goal and scope. For an easier modeling of the data, the free, open source software OpenLCA is used. Allocation method
Some allocation problems related to multi-output and multi-input processes need to be solved when
conducting the analysis. A mass partitioning of the inputs (raw material, energy) and outputs (emissions,
by-products) is the method used. The economic partitioning is avoided in this study due to lack of data.
However, in the sensitivity analysis the model is run using an economic allocation. The allocation
methods are further stated when used in the life cycle inventory (LCI) for each process.
Type of data
Foreground data
The foreground data are site specific and primary source data. For the bio-process, lab-scale data from
Chalmers laboratory are used for the hydrolysis, detoxification and fermentation (yields and nutrients
17
only). For the recovery of 3-HP, fermentation (energy use only), distillation and dehydration of acrylic
acid all the data needed were collected from a simulation report (Cie et al., 2012). Additionally, most of
the data for the pulp mill operations are collected from the industrial partners involved in the project
(SCA and Domsjö). The types of data are:
- Yields for each of these processes;
- Resources used during production (e.g. water, chemicals);
- Types and quantities of energy used.
Background data
The main source of background data is the Ecoinvent database. The database is reliable and relevant for
this study and for the geographical boundaries that have been defined (Swedish context). The database
is used for the fossil-based acrylate production, transportation and auxiliary processes. Moreover,
where data are missing, other secondary sources such as literature data can be used. In case no direct
measurements have been done for bio-based polymers production (e.g. polymerization, forestry etc.)
such sources can be used.
Impact categories
The purpose of environmental impact assessment is to make the inventory results more relevant for
decision making by linking these to impacts to the environment and/or human health (Baumann and
Tillman, 2004). Here, a midpoint assessment is done by using the CML characterization method (Guinée,
2002).
When choosing the impact categories, their relevance to the study should also be considered. For
instance, global warming potential, eutrophication, acidification and direct/indirect land use change are
relevant impacts when biomass is the feedstock used. However direct and indirect land use change are
omitted from this study. The former one is omitted because the Swedish forestry has been well
managed for more than a hundred years (Swedish Wood, 2014) and no virgin forest is used for the
production of poly-acrylates. Furthermore, since indirect land use change accounts for marginal effects
on the system modeled (here an ALCA is intended, where average data is used) this impact category is
also excluded.
In this case study the impact categories considered are:
- Renewable and non-renewable energy used (REU and NREU);
All the energy used during the production of the poly-acrylates is accounted for. Then the energy mix is
divided into renewable and non-renewable sources.
-Global warming potential (GWP);
For GWP, carbon dioxide, methane and nitrous oxide are the main compounds considered. They all
affect the radiative forcing and thereby heat the atmosphere. This fact has further adverse
consequences on global climate. The use of biomass instead of petroleum reduces the global warming
18
impact. However, to what extent depends on many factors, such as land management, land use change,
geographical boundaries of the study, etc.
The biogenic carbon is considered as climate neutral and is not accounted for in this study, although
several recent studies contested the climate neutrality of biomass. The carbon sequestrated in the final
product is also omitted, even for some products (such as diaper) the time period after which the carbon
is released back in the natural cycle is substantially longer than if the hemicellulose is burned for heat
recovery (the present procedure).
-Eutrophication potential (EP);
The use of fertilizers is the main cause of eutrophication of land and water. The imbalance of the
nitrogen and phosphorus biogeochemical cycle has further consequences on climate change and human
health.
-Acidification potential (AP);
Similar to the eutrophication potential the nutrients used in the fermentation process and in the energy
production have direct impact on the acidity of water and soil. SO2, NOx, NH3 are the main compounds
that contribute to pollution of air and water. They have further effects on human and ecosystem health.
-Photochemical ozone creation potential (POCP);
The ozone is created in the presence of NOx and sunlight. It is formed in the troposphere due to
incomplete combustion of fossil fuels and biomass and also from the use of nutrients. The potential
increases when there are other organic substances in the lower atmosphere (e.g. various hydrocarbons).
This affects human health and damages vegetation.
Assumptions
Several assumptions were made when the LCA was conducted:
-The lab scale data (nutrients, chemicals and yields) for hydrolysis, detoxification and fermentation
process are used without considering any possible scale-up effects;
- Much of the data for the biorefinery were collected from a simulation study of a large scale (160
ktonnes/year) acrylic acid production process (Cie et al., 2012). However, in our case the quantity of
biomass feedstock availability maybe much smaller and it is restricted to the amount of biomass residue
available from the mills.
- The entire heat required for the bio-refinery comes from biomass in a cogeneration plant. Alternative
sources of heat are tested in the sensitivity analysis.
- The electricity used in both cases is assumed to be from the grid. For the bio-refinery the Swedish
electricity mix is used. Whereas, for the fossil-refinery (for the polymerization process only) the
electricity mix for The Netherlands is used. These differences in energy mix sources may be very
sensitive for the overall outcome of the LCA when comparing the two products.
19
LCA limitations
Some of the most important limitations are:
- Some of the important environmental impacts such as impacts on biodiversity are not accounted for in
this study
- The lab scale data used in this model may not be relevant when scaling up the sodium poly-acrylate
production. This fact may reduce the reliability of the LCA results. However, some of the variables (e.g.
fermentation yields) of the model are tested in the sensitivity analysis.
3.4. Scenarios description
Base case (BC) model
In the base case (BC) model, sodium poly-acrylate production is assumed to be integrated at the pulp
mills’ locations. The concentrations of the side streams investigated in the LCA study are the same as the
ones tested in the laboratories at Chalmers. For the fermentation process a yield of 90% from 85.77%
the theoretical yield was assumed. The BC model is analyzed for the present year of 2014 with the
current electricity mix (from ecoinvent database). Finally, all the extra heat required for the production
of sodium poly-acrylate is assumed to be produced from biomass in a cogeneration plant1.
Explorative scenarios
Starting from the BC model, several explorative scenarios are tested: (1) concentrating (hypothetically)
side streams 3 and 4 from the Domsjö pulp mill (SS3 and SS4) prior the hydrolysis process, (2) testing
different yields linked to other metabolic pathways for the fermentation process, (3) substituting
biomass with fossil heat, (4) exploring electricity system changes for the year 2025 and (5) applying an
economic allocation to the BC scenario.
1 ‘heat, at cogen 6400kWth, wood, allocation heat’ from Ecoinvent database is used as extra heat needed in the
BC model.
20
4. Life cycle inventory
The inventory for sodium poly-acrylate production is done separately for bio-based and fossil-based
production. Transportation operations (see also table B1) and auxiliary processes are discussed when
needed within the bio and fossil based poly-acrylate inventories. Each process is presented in detail
including technical description, allocation method and the source and type of data used.
4.1. Bio-based poly-acrylate
For bio-based production of poly-acrylates the four subsystems considered are: forestry activities, pulp
and paper mill operations, acrylic acid production in an integrated biorefinery, and the polymerization
process. The final inventory results for each biopolymer are presented in the appendix B (see tables B3
to B7).
4.1.1. Forestry activities
The forestry data were collected for Sweden, the location for which the study was modeled. The
emissions and energy used related to forestry differ depending on the forest management, climate, and
latitude (Berg and Lindholm, 2005). As Sweden expands from 56 to 68 degree latitude three separate
regions (south, central and north of Sweden) were considered by Berg and Lindholm (2005). It was
shown that the energy consumption and related emissions increase from southern to northern regions
of Sweden. However, because the forestry activities have no major impact on the overall environmental
performance of pulp mills (González‐García et al., 2011) average data for the whole country is used.
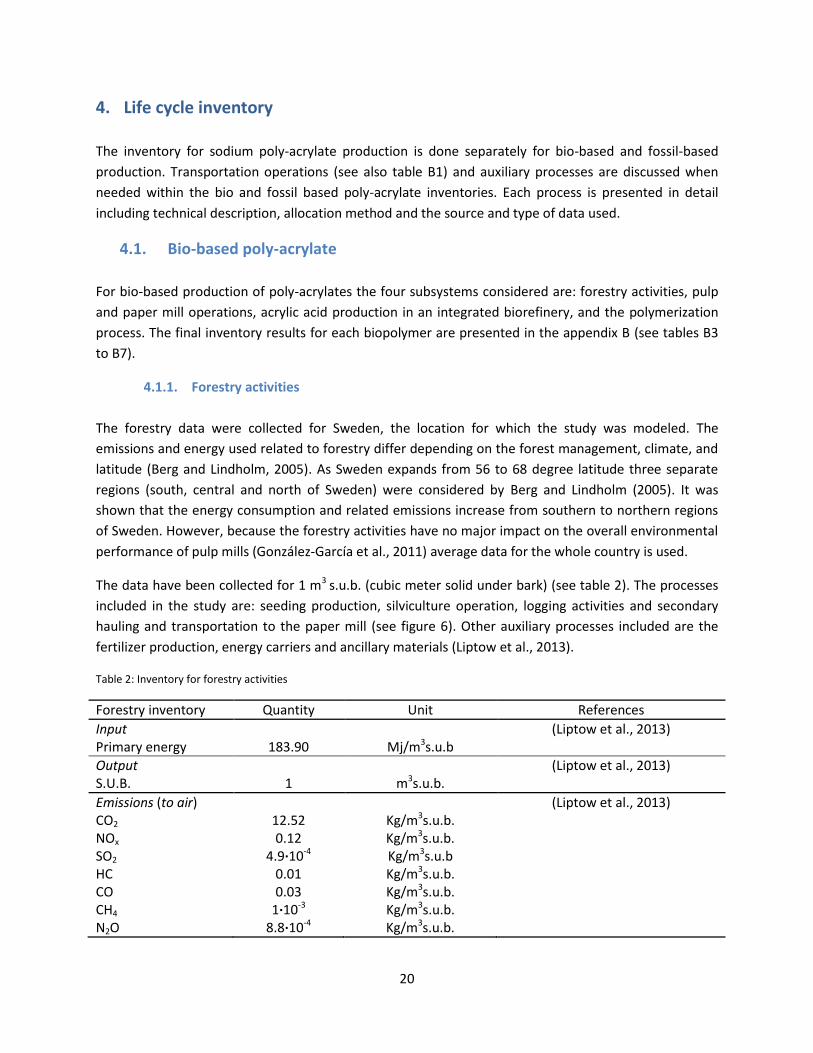
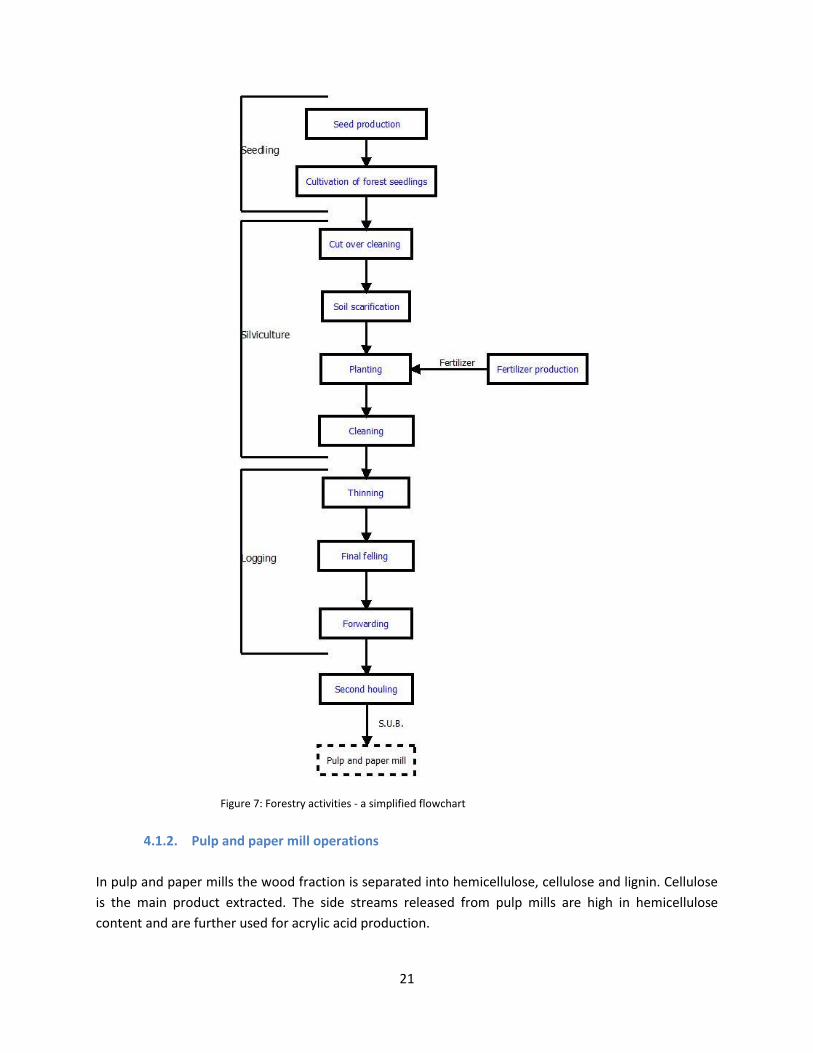
The data have been collected for 1 m3 s.u.b. (cubic meter solid under bark) (see table 2). The processes
included in the study are: seeding production, silviculture operation, logging activities and secondary
hauling and transportation to the paper mill (see figure 6). Other auxiliary processes included are the
fertilizer production, energy carriers and ancillary materials (Liptow et al., 2013).
Table 2: Inventory for forestry activities
Forestry inventory Quantity Unit References
Input Primary energy
183.90
Mj/m3s.u.b
(Liptow et al., 2013)
Output S.U.B.
1
m3s.u.b.
(Liptow et al., 2013)
Emissions (to air) CO2 NOx SO2
HC CO CH4
N2O
12.52 0.12
4.9∙10-4 0.01 0.03
1∙10-3 8.8∙10-4
Kg/m3s.u.b. Kg/m3s.u.b. Kg/m3s.u.b Kg/m3s.u.b. Kg/m3s.u.b. Kg/m3s.u.b. Kg/m3s.u.b.
(Liptow et al., 2013)
21
4.1.2. Pulp and paper mill operations
In pulp and paper mills the wood fraction is separated into hemicellulose, cellulose and lignin. Cellulose
is the main product extracted. The side streams released from pulp mills are high in hemicellulose
content and are further used for acrylic acid production.
Figure 7: Forestry activities - a simplified flowchart
22
For pulp and paper mills, with few exceptions, primary data was collected from the companies involved.
Two different pulp and paper facilities are investigated here: the Ortviken pulp and paper mill (SCA) in
Sundsvall and the Domsjö pulp mill (Domsjö) in Örnsköldsvik. The former one uses a thermo-mechanical
pulping process (TMP) and the latter one uses a chemical (sulphite) pulping process.
Ortviken pulp mill (TMP)
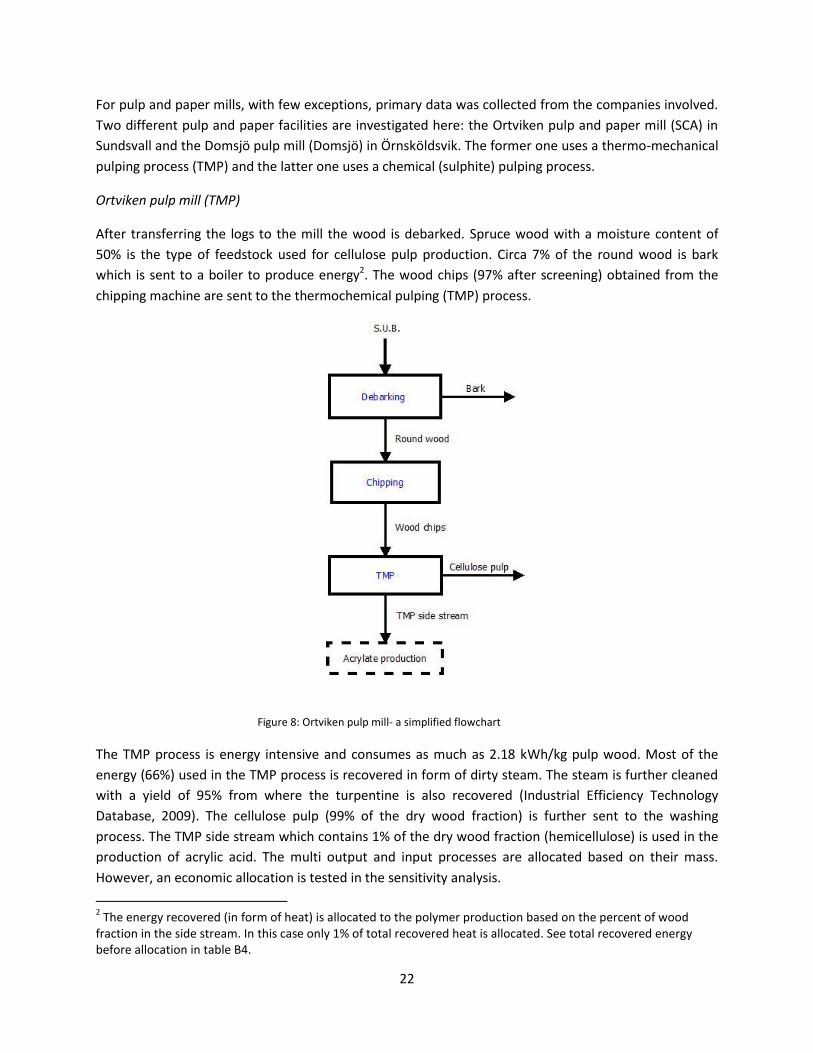
After transferring the logs to the mill the wood is debarked. Spruce wood with a moisture content of
50% is the type of feedstock used for cellulose pulp production. Circa 7% of the round wood is bark
which is sent to a boiler to produce energy2. The wood chips (97% after screening) obtained from the
chipping machine are sent to the thermochemical pulping (TMP) process.
The TMP process is energy intensive and consumes as much as 2.18 kWh/kg pulp wood. Most of the
energy (66%) used in the TMP process is recovered in form of dirty steam. The steam is further cleaned
with a yield of 95% from where the turpentine is also recovered (Industrial Efficiency Technology
Database, 2009). The cellulose pulp (99% of the dry wood fraction) is further sent to the washing
process. The TMP side stream which contains 1% of the dry wood fraction (hemicellulose) is used in the
production of acrylic acid. The multi output and input processes are allocated based on their mass.
However, an economic allocation is tested in the sensitivity analysis.
2 The energy recovered (in form of heat) is allocated to the polymer production based on the percent of wood
fraction in the side stream. In this case only 1% of total recovered heat is allocated. See total recovered energy before allocation in table B4.
Figure 8: Ortviken pulp mill- a simplified flowchart
23
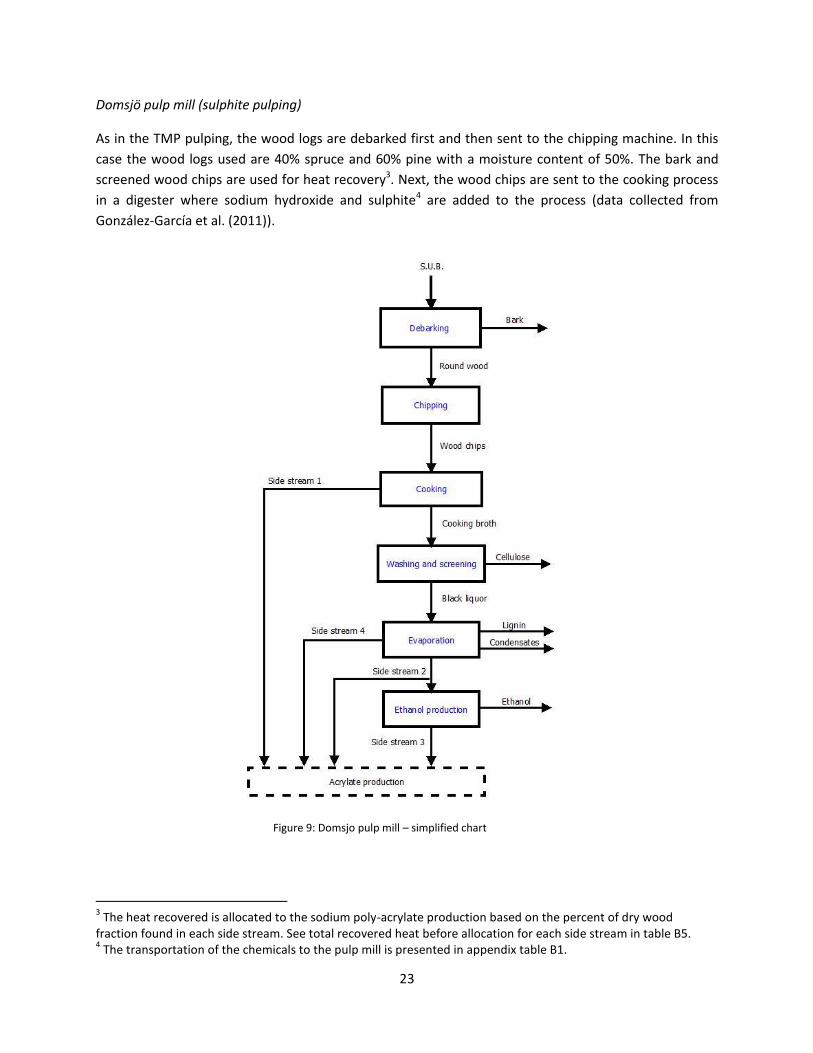
Domsjö pulp mill (sulphite pulping)
As in the TMP pulping, the wood logs are debarked first and then sent to the chipping machine. In this
case the wood logs used are 40% spruce and 60% pine with a moisture content of 50%. The bark and
screened wood chips are used for heat recovery3. Next, the wood chips are sent to the cooking process
in a digester where sodium hydroxide and sulphite4 are added to the process (data collected from
González‐García et al. (2011)).
3 The heat recovered is allocated to the sodium poly-acrylate production based on the percent of dry wood
fraction found in each side stream. See total recovered heat before allocation for each side stream in table B5. 4 The transportation of the chemicals to the pulp mill is presented in appendix table B1.
Figure 9: Domsjo pulp mill – simplified chart
24
From the first cooking step the first side stream (which contains circa 10% of the wood fraction) of the
wood fraction is released (see figure 9). The cooking broth is further washed in a batch diffuser from
where the cellulose is collected (48% of the wood fraction). Black liquor from the washing process is
recovered and sent to the evaporation process. A part of the concentrated liquor stream (side stream 2
with 14% of the wood fraction) is sent to the fermentation process where ethanol is produced. The
same side stream 2 is also tested for the production of sodium poly-acrylate. The lignin content (24% of
wood freaction) and the fourth side stream (less than 0.1% of the wood fraction) are also obtained from
evaporation process. The resulting sludge (4 % of the wood fraction) is sent to the waste water
treatment plant where biogas is produced and chemicals are recovered. From the ethanol fermentation
process the third side stream is released (side stream 3). Most of the wood fraction from side stream 2 is
used in the ethanol production and only circa 5% content can be found in the resulting stream 35.
Finally, all the four side streams are sent to the acrylic acid production. The allocation method used was
based on the mass of wood fraction for each side stream and by-products resulted from the processes.
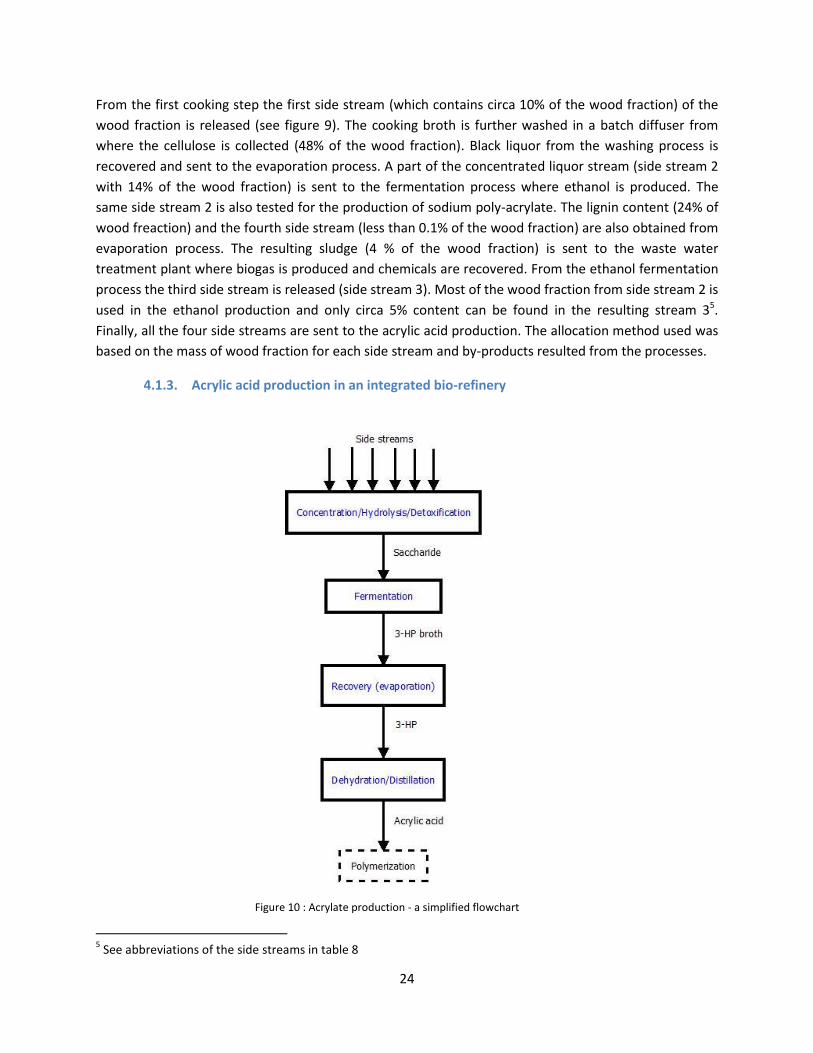
4.1.3. Acrylic acid production in an integrated bio-refinery
5 See abbreviations of the side streams in table 8
Figure 10 : Acrylate production - a simplified flowchart
25
Initially each side stream is chemically hydrolyzed and in most cases detoxified. Some of the waste
streams are very diluted and they need to be concentrated via evaporation or ultrafiltration prior to the
hydrolysis process. Next, the hydrolyzed sugars are fermented where 3-HP is synthesized. From the
fermentation broth the 3-HP is recovered (via evaporation) and is chemically converted into acrylic acid
via dehydration and distillation processes (see figure 10).
The data for the fermentation (energy use only), recovery, dehydration and distillation were collected
from a study in which large scale production of acrylic acid in a biorefinery was simulated (Cie et al.,
2012). For concentration, hydrolysis, detoxification and fermentation (yields and nutrients used) the
data was collected from Chalmers.
Hydrolysis/Concentration/Detoxification
The hydrolysis process (acidic hydrolysis) is the same for all the streams. However, the detoxification
and concentration procedures are different for each side stream. The transportation of chemicals (used
in these processes) to the pulp mill are presented in table C1.
Ortviken side streams
Prior to the hydrolysis process the TMP side stream is (50 times) concentrated via two different
procedures: evaporation (TMP-E) where water is evaporated under vacuum at a temperature of 80 OC;
ultra-filtration (TMP-UE6) where the side stream is ultra-filtrated with two different kDa filters and then
6 times concentrated via evaporation under vaccum at a temperature of 80 OC. Different concentration
methods lead to different sugars content in the TMP side stream (see table 3). Circa 33% of the sugars
are lost from the streams when TMP side stream is ultra-filtrated. For the evaporation process 0.47 MJ
of heat was assumed to be used when evaporating one liter of water from the side stream(Cie et al.,
2012). This value includes the heat recovery and the reuse of it in the process.
Next, both concentrated TMP side streams (TMP-E and TMP-UE) are chemically hydrolyzed with sulfuric
acid (2.5 % concentration in the side stream). In the hydrolysis process, the carbohydrates are converted
into free sugars (glucose, galactose, mannose, etc.) (see table 3). Then TMP-E is detoxified in order to
reduce the inhibitory conditions in the fermentation process. Sodium dithionite (1.54 g/L) was tested for
the TMP-E side stream. TMP-UE showed better results without detoxification and therefore no
detoxifying agents were applied.
Domsjö side streams
Compared to the side streams from the Ortviken mill the four side streams from Domsjö are not
concentrated7. Next, the side streams are chemically hydrolyzed by adding 2.5% sulfuric acid to the
medium. Finally, different detoxification procedures were tested in order to reduce the amount of
6 See abbreviations of the TMP side stream in table 8.
7 A hypothetical scenario where side stream 3 and 4 are concentrated prior to the hydrolysis is tested in the
sensitivity analysis.
26
inhibitors during the fermentation. The alkali pretreatment where 10%(w/v) NaOH is added to the
streams showed the best results.
Table 3: Carbohydrates (sugars) composition of the side streams after hydrolysis and concentration (g/L) (Chalmers University)
Side stream Composition
Ortviken Domsjö
TMP-UE TMP-E SS1 SS2 SS3 SS4
Arabinose (C5) 1.29 3.28 0.42 0.63 0.3 0.81
Galactose (C6) 6.79 11.77 3.15 4.92 1.2 0.23
Glucose (C6) 7.87 14.17 6.95 11.3 1.9 0.11
Xylose (C5) 0.29 0.57 7.91 10.9 10.8 0.21
Mannose (C6) 29.36 39.63 16.4 24.5 5.8 0.105
Total C6 sugars 44.02 65.57 26.45 40.7 8.9 0.445
Fermentation
Via fermentation, genetically modified yeasts metabolize the fermentable sugars from the side streams
and convert them into 3-HP. The fermentation yield data were collected from the laboratories at
Chalmers where different biosynthetic pathways are tested. At the moment only C6 sugars pathways are
investigated. In the base case (BC) model a yield of 90% of the theoretical yield of 85.77% was assumed.
Thus, approximately 1.4 kg of sugars are needed for producing 1 kg of sodium poly-acrylate. In the
sensitivity analysis several different yields and another pathway (malonyl-CoA intermediary with 66.88%
theoretical yield) are explored.
The heat and electricity required for powering the fermentation, seeding and mixing processes are
assumed to be constant regardless the dilution level of the side streams (see table 4). However, more
diluted streams in practice would require larger quantities of energy. On the other hand the quantity of
yeasts and other nutrients that are added to the fermentation process (g/kg sodium poly-acrylate) are
assumed to be dependent on sugar concentration of each side stream. Thus, more diluted side streams
require larger quantities of nutrients and yeasts in the fermentation process (see table B6).
It was also assumed that the yeasts are transported from Sollentuna, Sweden to the pulp mills by
medium truck and the nutrients are transported by large truck from Ludwigshafen, Germany and Engis,
Belgium respectively to the pulp mills (see also table B1).
Table 4: Fermentation process inventory for 1 kg 3-HP in broth
Fermentation Quantity Unit References
Yield Input Fermentable sugars Electricity Heat Yeast (NH4)2SO4
77.4
1.291 1.457
11.181 2 5
%
Kg MJ MJ g/L g/L
Chalmers University
(Cie et al., 2012)
Chalmers University
27
Na3PO4 MgSO4
3 0.5
g/L g/L
Output 3-HP in broth
1
Kg
Recovery
The 3-HP is recovered from the fermentation broth by using the evaporation process. Through heating
in a series of flash vessels, 98.8% of the water is evaporated and 91.4% of the 3-HP is recovered from
the broth (see table 5). The energy used in the evaporation process differs depending on the
concentration level of sugars in the side streams. Each liter of water evaporated requires circa 0.47 MJ
heat(Cie et al., 2012).
Table 5: Recovery process inventory for 1 kg 3-HP
Recovery Quantity Unit References
Yield Input Electricity 3-HP in broth Output 3-HP
91.4
0.472 1.094
1
%
MJ/L Kg
Kg
(Cie et al., 2012) (Cie et al., 2012)
Dehydration/Distillation
The recovered 3-HP is sent to the dehydration process where a strong acid catalyst (phosphoric acid) is
added. Next, a three step-distillation process takes place from where the purified acrylic acid (99.99%)
is obtained. Most (99%) of the bottom product (which contains 3-HP and the acid catalyst) resulted from
the third step distillation process is recovered and sent back to the dehydration process. In the closed-
loop dehydration and distillation process, 97.5% of the 3-HP is converted to acrylic acid. The energy
required for the production of 1 kg acrylic acid can be seen in the table 6. The phosphoric acid
production and transportation were added to the model from the ecoinvent database (see table B1).
Table 6: Inventory for dehydration and distillation processes for 1 kg acrylic acid
Dehydration and Distillation Quantity Unit References
Yield Input 3-HP Electricity Heat H3PO4
CO2
97.5
1.282 0.023 1.515
2.0∙10-4
2.1∙10-5
%
kg MJ MJ kg kg
(Cie et al., 2012) (Cie et al., 2012)
28
Output Acrylic acid
1
kg
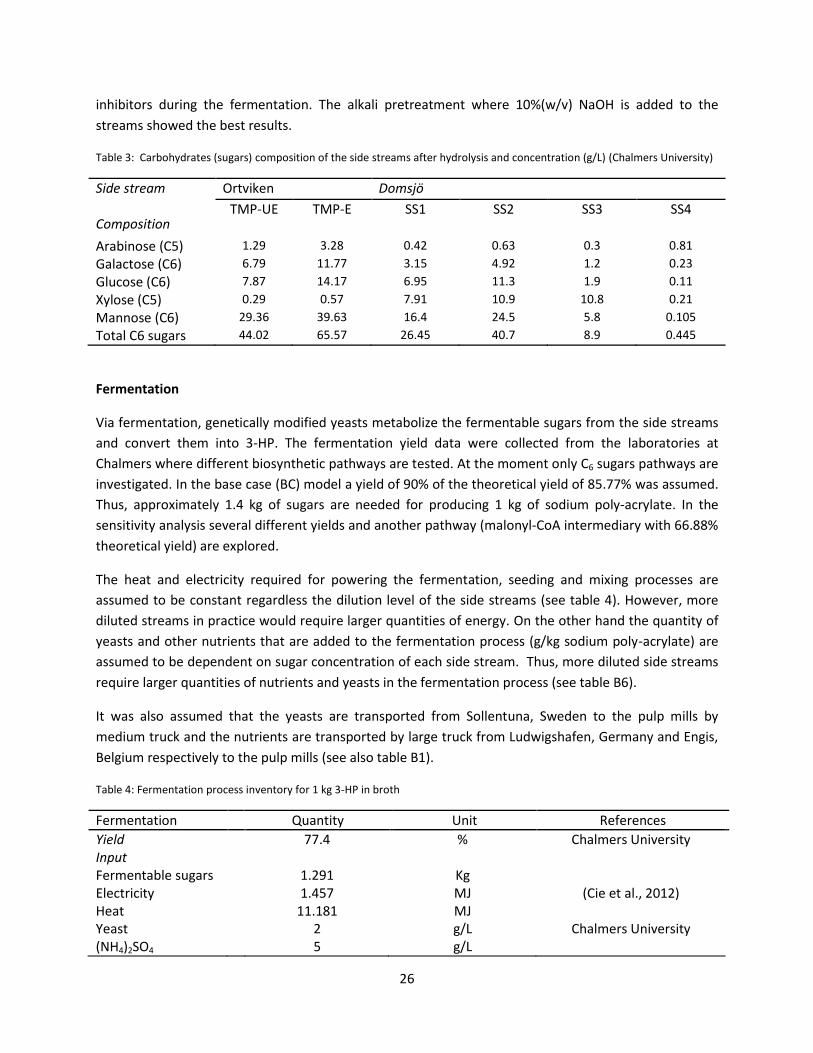
4.1.4. Polymerization process
The highly concentrated acrylic acid is sent to the polymerization process from which the sodium poly-
acrylate results (see figure 11). A solution polymerization process is used here as being the most
common procedure practiced at the moment by the industry(Sanderson and Sadiku, 2003). The acrylic
acid is initially neutralized with sodium hydroxide (NaOH) followed by the polymerization process which
is initiated with a small quantity of ammonium peroxydisulphate ((NH4)2S2O8).As much as 98 % of the
total acrylic acid monomer is polymerized in the polymerization process(Sanderson and Sadiku, 2003).
The transportation of NaOH by barge from Rotterdam to the pulp mill in Sweden was also considered in
the model. 7.830 MJ of electricity per kg of sodium poly-acrylate (see table 7 and C7) was used to power
the heating, cooling and evaporation systems needed in the process (Sanderson and Sadiku, 2003). For
energy mix in Sweden, the ecoinvent database was used in the model.
Table 7: Polymerization process inventory for 1 kg of sodium poly-acrylate
Polymerization Quantity Unit References
Yield Input Electricity Acrylic acid NaOH Initiator [(NH4)2S2O8] Water
98.0
7.830 0.782 0.468 0.005 1.753
%
MJ kg kg kg kg
(Sanderson and Sadiku, 2003) (Sanderson and Sadiku, 2003)
Output Sodium poly-acrylate
1
kg
Figure 11: Polymerization process

29
4.2. Fossil-based sodium poly-acrylate
4.2.1. Conventional acrylic acid production
After the extraction from the ground, the crude oil is processed via refining where several compounds
are obtained. Naphtha is one of the compounds obtained, and is further broken down by the steam
cracking process into ethylene and propylene. Via a two-step oxidation process propylene is oxidized to
produce acrylic acid. Acrolein is a by-product of the first step oxidation process which is further oxidized
in order to increase the yields of acrylic acid production (see figure 12).
As the site specific data for industrial production of fossil-based acrylic acid is hard to find at the
moment, the ecoinvent database is used.
4.2.2. Polymerization process
The polymerization process used for fossil-based sodium poly-acrylate production is assumed to be the
same as the one used for the production of bio-based sodium poly-acrylate. The only difference is the
source of the energy mix used in the production. Because fossil-poly-acrylate is currently manufactured
in The Netherlands (NL) the energy mix for NL is employed from the ecoinvent database.
Figure 12: Fossil-based acrylic acid production
30
5. Results and discussion
The results are presented for the base case (BC) model, where sodium poly-acrylate production is
assumed to be integrated at the pulp mills’ locations. The concentrations of the side streams
investigated in the LCA study are the same as the ones tested in the laboratories at Chalmers. For the
fermentation process a yield of 90% from 85.77% the theoretical yield was assumed. The model is
analyzed for the present year of 2014 with the current electricity mix. Finally, all the extra heat required
for the production of sodium poly-acrylate is assumed to be produced from biomass in a cogeneration
plant. For the presentation of the results for the different side streams the following abbreviations are
used (see table 8).
Table 8: Abbreviations for sodium-poly-acrylate produced from the different side streams.
Abbreviation Description Pulp mill
TMP-E TMP-UE
Sodium poly-acrylate produced from TMP side stream concentrated via evaporation Sodium poly-acrylate produced from TMP side stream concentrated via ultrafiltration
Ortviken
SS1 SS2 SS3 SS4
Sodium poly-acrylate produced from side stream 1 Sodium poly-acrylate produced from side stream 2 Sodium poly-acrylate produced from side stream 3 Sodium poly-acrylate produced from side stream 4
Domsjö
5.1. Global warming potential (GWP)
The global warming potentials (GWP) of three of the bio-based polymers (TMP-UE,SS1, and SS2) are
lower than the GWP of the fossil-based polymer (see Figure 13). Specifically, the bio-based polymer
produced from side stream TMP-UE shows the lowest GWP. The GWP for the biopolymers varies mainly
due to the difference in sugar concentration in the side streams (see table 3). More diluted side streams
require more energy in order to get rid of the water, and require more chemicals for e.g. detoxification
and fermentation. For the Ortviken pulp mill, the side stream is 50 times concentrated prior the
hydrolysis process via evaporation (TMP-E) and ultrafiltration (TMP-UE). For TMP-E, the environmental
hotspot is the concentration process which is energy intensive (in the form of biomass heat) and
contributes 64% to the total GWP. The transportation and the energy input for the biomass production
used for extra heating are the main contributors to the concentration process. The biopolymer
production from the TMP-UE side stream requires four times less energy in the concentration step and
therefore has a significantly lower GWP than the biopolymer produced from the TMP-E side stream. As a
result, for the TMP-UE biopolymer the fermentation process is the hotspot, mainly due to higher (33%)
losses of sugars during the ultrafiltration. This leads to the use of larger quantities of chemicals and
nutrients in the process which implies a larger GWP. Additionally, the polymerization process
contributes to a relatively large extent of total GWP. This is due to the use of sodium hydroxide and the
electricity mix used in the process. Domsjö’s side streams are not concentrated prior the hydrolysis
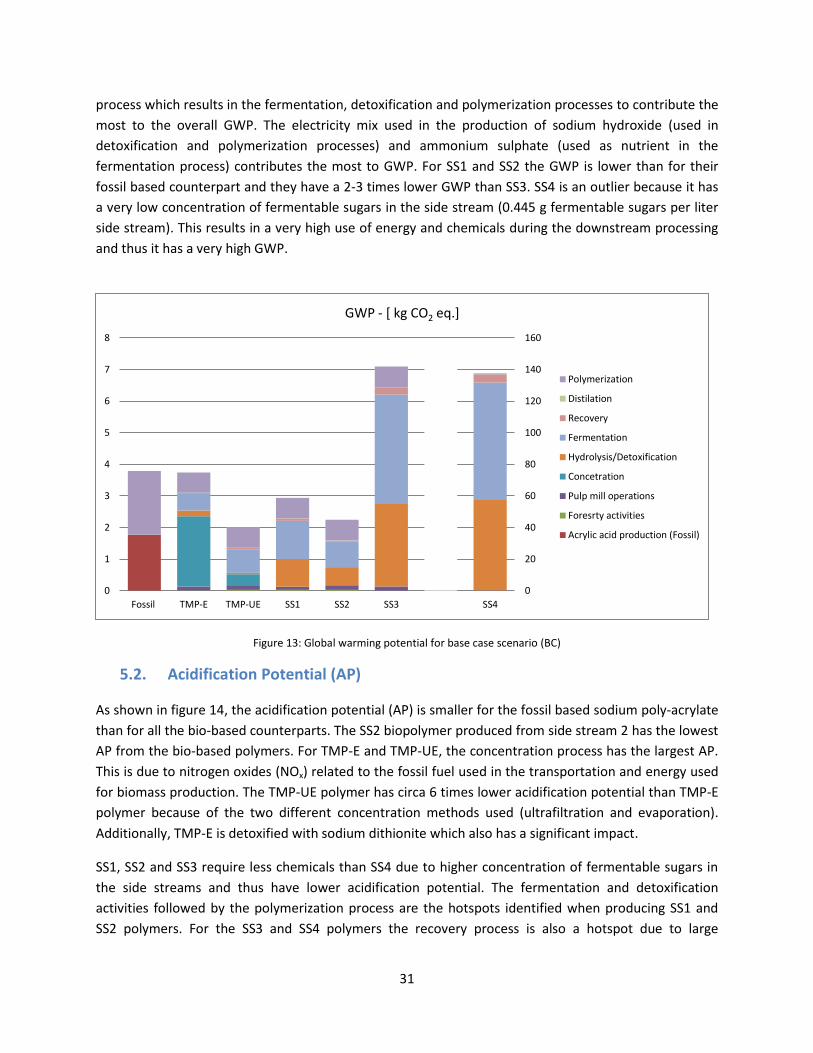
31
process which results in the fermentation, detoxification and polymerization processes to contribute the
most to the overall GWP. The electricity mix used in the production of sodium hydroxide (used in
detoxification and polymerization processes) and ammonium sulphate (used as nutrient in the
fermentation process) contributes the most to GWP. For SS1 and SS2 the GWP is lower than for their
fossil based counterpart and they have a 2-3 times lower GWP than SS3. SS4 is an outlier because it has
a very low concentration of fermentable sugars in the side stream (0.445 g fermentable sugars per liter
side stream). This results in a very high use of energy and chemicals during the downstream processing
and thus it has a very high GWP.
Figure 13: Global warming potential for base case scenario (BC)
5.2. Acidification Potential (AP)
As shown in figure 14, the acidification potential (AP) is smaller for the fossil based sodium poly-acrylate
than for all the bio-based counterparts. The SS2 biopolymer produced from side stream 2 has the lowest
AP from the bio-based polymers. For TMP-E and TMP-UE, the concentration process has the largest AP.
This is due to nitrogen oxides (NOx) related to the fossil fuel used in the transportation and energy used
for biomass production. The TMP-UE polymer has circa 6 times lower acidification potential than TMP-E
polymer because of the two different concentration methods used (ultrafiltration and evaporation).
Additionally, TMP-E is detoxified with sodium dithionite which also has a significant impact.
SS1, SS2 and SS3 require less chemicals than SS4 due to higher concentration of fermentable sugars in
the side streams and thus have lower acidification potential. The fermentation and detoxification
activities followed by the polymerization process are the hotspots identified when producing SS1 and
SS2 polymers. For the SS3 and SS4 polymers the recovery process is also a hotspot due to large
0
20
40
60
80
100
120
140
160
0
1
2
3
4
5
6
7
8
Fossil TMP-E TMP-UE SS1 SS2 SS3 SS4
GWP - [ kg CO2 eq.]
Polymerization
Distilation
Recovery
Fermentation
Hydrolysis/Detoxification
Concetration
Pulp mill operations
Foresrty activities
Acrylic acid production (Fossil)
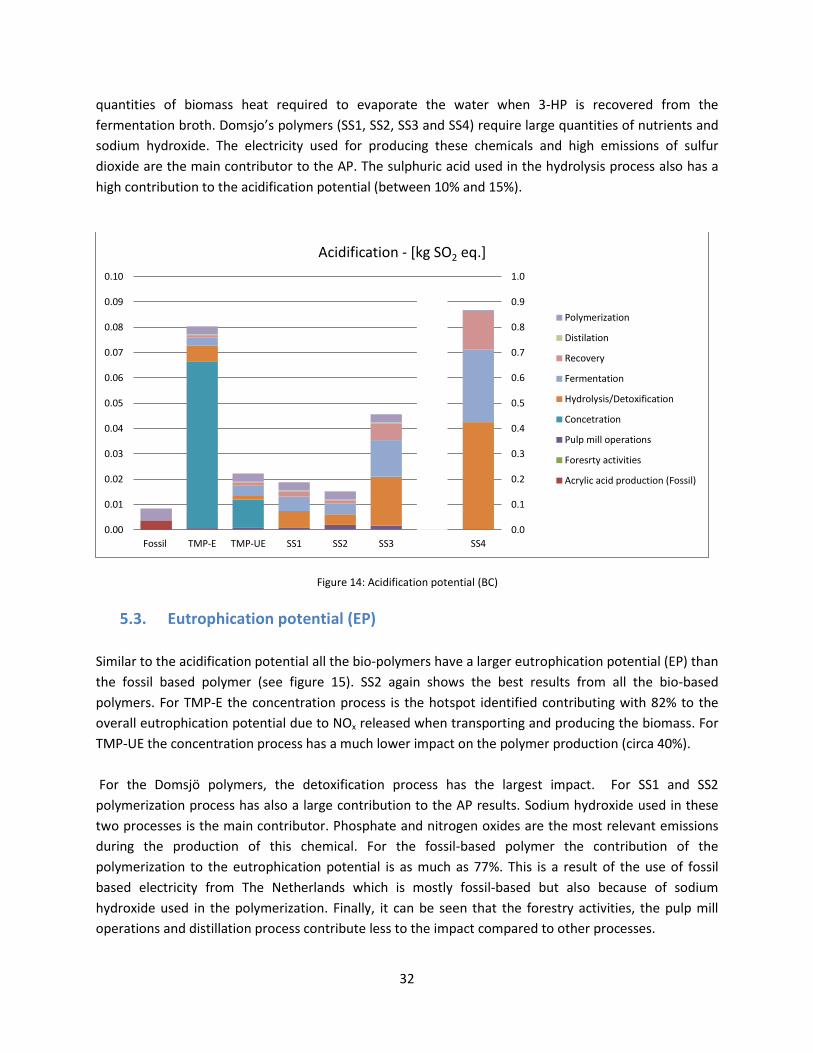
32
quantities of biomass heat required to evaporate the water when 3-HP is recovered from the
fermentation broth. Domsjo’s polymers (SS1, SS2, SS3 and SS4) require large quantities of nutrients and
sodium hydroxide. The electricity used for producing these chemicals and high emissions of sulfur
dioxide are the main contributor to the AP. The sulphuric acid used in the hydrolysis process also has a
high contribution to the acidification potential (between 10% and 15%).
5.3. Eutrophication potential (EP)
Similar to the acidification potential all the bio-polymers have a larger eutrophication potential (EP) than
the fossil based polymer (see figure 15). SS2 again shows the best results from all the bio-based
polymers. For TMP-E the concentration process is the hotspot identified contributing with 82% to the
overall eutrophication potential due to NOx released when transporting and producing the biomass. For
TMP-UE the concentration process has a much lower impact on the polymer production (circa 40%).
For the Domsjö polymers, the detoxification process has the largest impact. For SS1 and SS2
polymerization process has also a large contribution to the AP results. Sodium hydroxide used in these
two processes is the main contributor. Phosphate and nitrogen oxides are the most relevant emissions
during the production of this chemical. For the fossil-based polymer the contribution of the
polymerization to the eutrophication potential is as much as 77%. This is a result of the use of fossil
based electricity from The Netherlands which is mostly fossil-based but also because of sodium
hydroxide used in the polymerization. Finally, it can be seen that the forestry activities, the pulp mill
operations and distillation process contribute less to the impact compared to other processes.
0.0
0.1
0.2
0.3
0.4
0.5
0.6
0.7
0.8
0.9
1.0
0.00
0.01
0.02
0.03
0.04
0.05
0.06
0.07
0.08
0.09
0.10
Fossil TMP-E TMP-UE SS1 SS2 SS3 SS4
Acidification - [kg SO2 eq.]
Polymerization
Distilation
Recovery
Fermentation
Hydrolysis/Detoxification
Concetration
Pulp mill operations
Foresrty activities
Acrylic acid production (Fossil)
Figure 14: Acidification potential (BC)
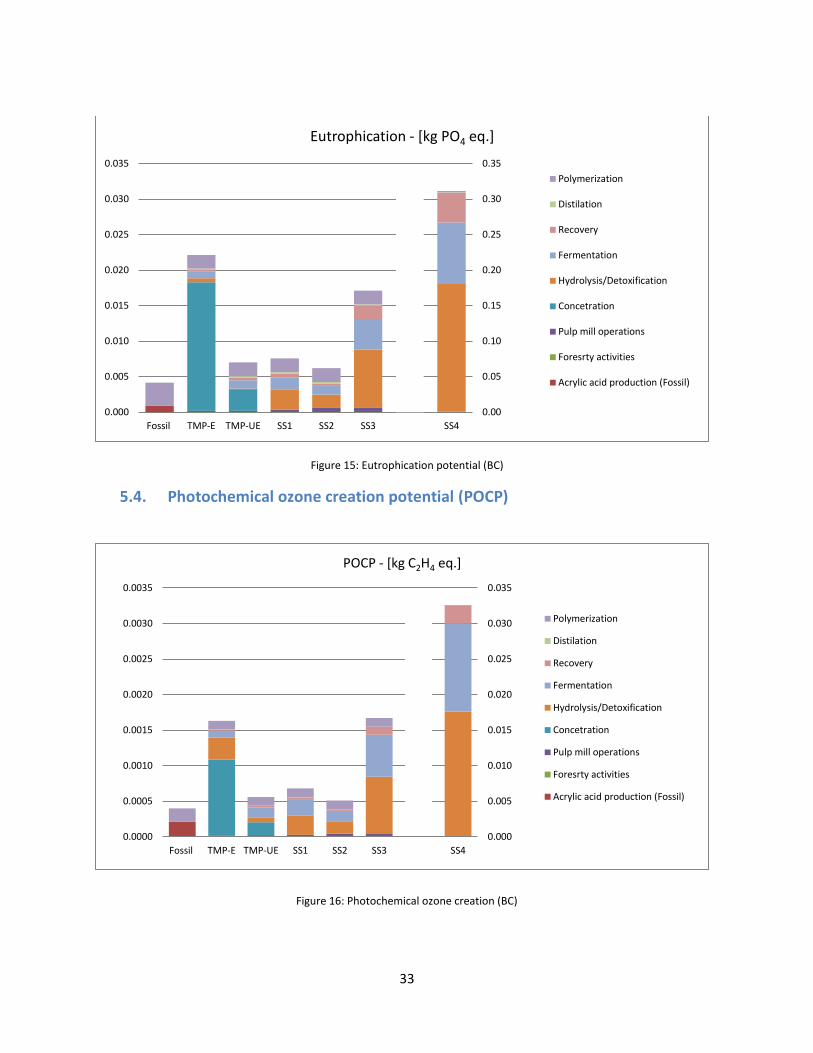
33
Figure 15: Eutrophication potential (BC)
5.4. Photochemical ozone creation potential (POCP)
0.00
0.05
0.10
0.15
0.20
0.25
0.30
0.35
0.000
0.005
0.010
0.015
0.020
0.025
0.030
0.035
Fossil TMP-E TMP-UE SS1 SS2 SS3 SS4
Eutrophication - [kg PO4 eq.]
Polymerization
Distilation
Recovery
Fermentation
Hydrolysis/Detoxification
Concetration
Pulp mill operations
Foresrty activities
Acrylic acid production (Fossil)
0.000
0.005
0.010
0.015
0.020
0.025
0.030
0.035
0.0000
0.0005
0.0010
0.0015
0.0020
0.0025
0.0030
0.0035
Fossil TMP-E TMP-UE SS1 SS2 SS3 SS4
POCP - [kg C2H4 eq.]
Polymerization
Distilation
Recovery
Fermentation
Hydrolysis/Detoxification
Concetration
Pulp mill operations
Foresrty activities
Acrylic acid production (Fossil)
Figure 16: Photochemical ozone creation (BC)
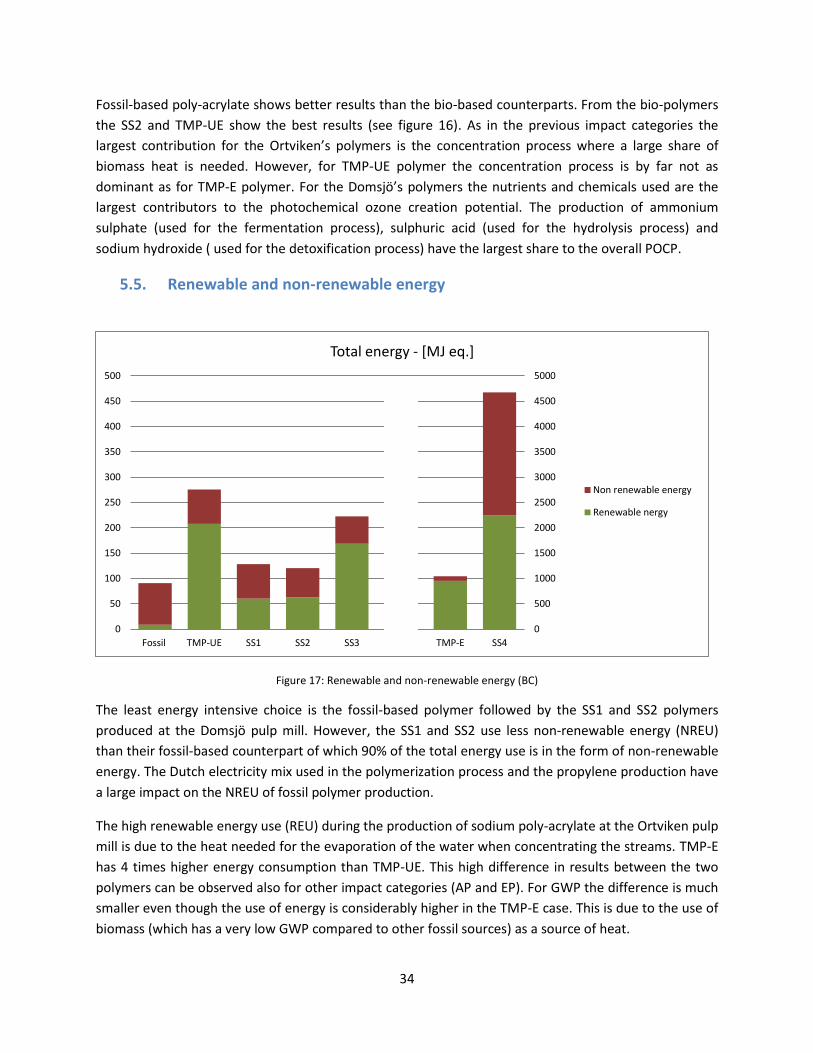
34
Fossil-based poly-acrylate shows better results than the bio-based counterparts. From the bio-polymers
the SS2 and TMP-UE show the best results (see figure 16). As in the previous impact categories the
largest contribution for the Ortviken’s polymers is the concentration process where a large share of
biomass heat is needed. However, for TMP-UE polymer the concentration process is by far not as
dominant as for TMP-E polymer. For the Domsjö’s polymers the nutrients and chemicals used are the
largest contributors to the photochemical ozone creation potential. The production of ammonium
sulphate (used for the fermentation process), sulphuric acid (used for the hydrolysis process) and
sodium hydroxide ( used for the detoxification process) have the largest share to the overall POCP.
5.5. Renewable and non-renewable energy
Figure 17: Renewable and non-renewable energy (BC)
The least energy intensive choice is the fossil-based polymer followed by the SS1 and SS2 polymers
produced at the Domsjö pulp mill. However, the SS1 and SS2 use less non-renewable energy (NREU)
than their fossil-based counterpart of which 90% of the total energy use is in the form of non-renewable
energy. The Dutch electricity mix used in the polymerization process and the propylene production have
a large impact on the NREU of fossil polymer production.
The high renewable energy use (REU) during the production of sodium poly-acrylate at the Ortviken pulp
mill is due to the heat needed for the evaporation of the water when concentrating the streams. TMP-E
has 4 times higher energy consumption than TMP-UE. This high difference in results between the two
polymers can be observed also for other impact categories (AP and EP). For GWP the difference is much
smaller even though the use of energy is considerably higher in the TMP-E case. This is due to the use of
biomass (which has a very low GWP compared to other fossil sources) as a source of heat.
0
500
1000
1500
2000
2500
3000
3500
4000
4500
5000
0
50
100
150
200
250
300
350
400
450
500
Fossil TMP-UE SS1 SS2 SS3 TMP-E SS4
Total energy - [MJ eq.]
Non renewable energy
Renewable nergy
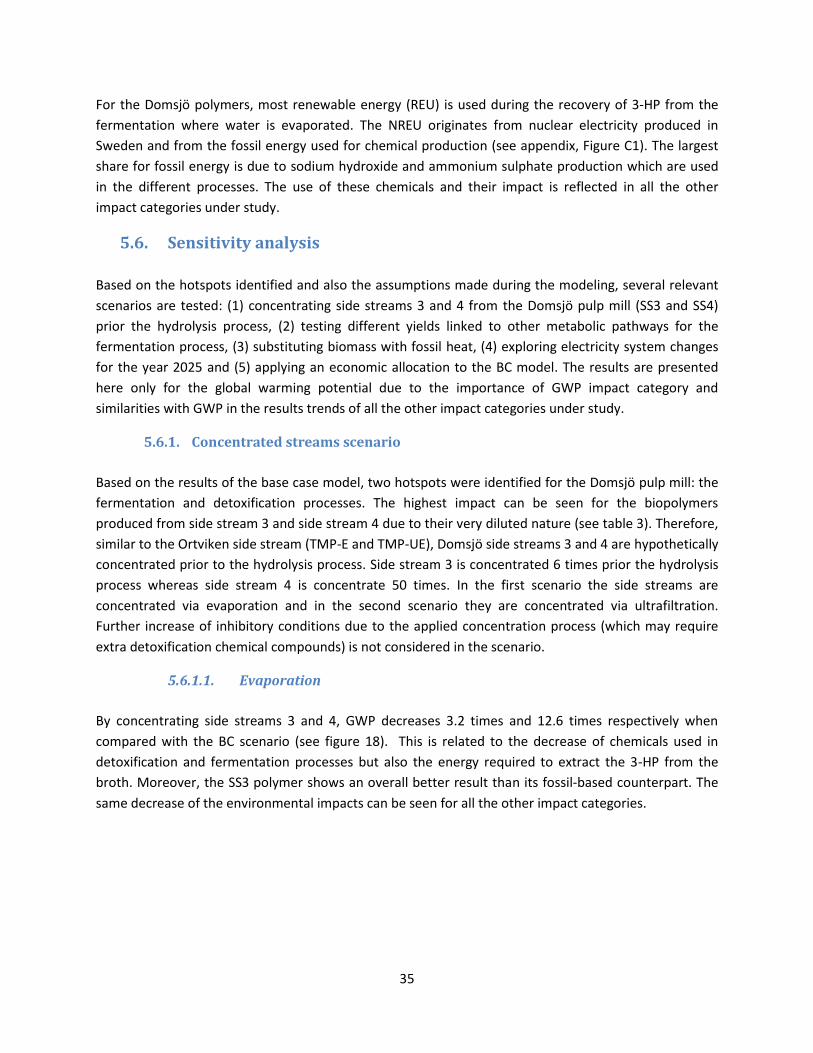
35
For the Domsjö polymers, most renewable energy (REU) is used during the recovery of 3-HP from the
fermentation where water is evaporated. The NREU originates from nuclear electricity produced in
Sweden and from the fossil energy used for chemical production (see appendix, Figure C1). The largest
share for fossil energy is due to sodium hydroxide and ammonium sulphate production which are used
in the different processes. The use of these chemicals and their impact is reflected in all the other
impact categories under study.
5.6. Sensitivity analysis
Based on the hotspots identified and also the assumptions made during the modeling, several relevant
scenarios are tested: (1) concentrating side streams 3 and 4 from the Domsjö pulp mill (SS3 and SS4)
prior the hydrolysis process, (2) testing different yields linked to other metabolic pathways for the
fermentation process, (3) substituting biomass with fossil heat, (4) exploring electricity system changes
for the year 2025 and (5) applying an economic allocation to the BC model. The results are presented
here only for the global warming potential due to the importance of GWP impact category and
similarities with GWP in the results trends of all the other impact categories under study.
5.6.1. Concentrated streams scenario
Based on the results of the base case model, two hotspots were identified for the Domsjö pulp mill: the
fermentation and detoxification processes. The highest impact can be seen for the biopolymers
produced from side stream 3 and side stream 4 due to their very diluted nature (see table 3). Therefore,
similar to the Ortviken side stream (TMP-E and TMP-UE), Domsjö side streams 3 and 4 are hypothetically
concentrated prior to the hydrolysis process. Side stream 3 is concentrated 6 times prior the hydrolysis
process whereas side stream 4 is concentrate 50 times. In the first scenario the side streams are
concentrated via evaporation and in the second scenario they are concentrated via ultrafiltration.
Further increase of inhibitory conditions due to the applied concentration process (which may require
extra detoxification chemical compounds) is not considered in the scenario.
5.6.1.1. Evaporation
By concentrating side streams 3 and 4, GWP decreases 3.2 times and 12.6 times respectively when
compared with the BC scenario (see figure 18). This is related to the decrease of chemicals used in
detoxification and fermentation processes but also the energy required to extract the 3-HP from the
broth. Moreover, the SS3 polymer shows an overall better result than its fossil-based counterpart. The
same decrease of the environmental impacts can be seen for all the other impact categories.
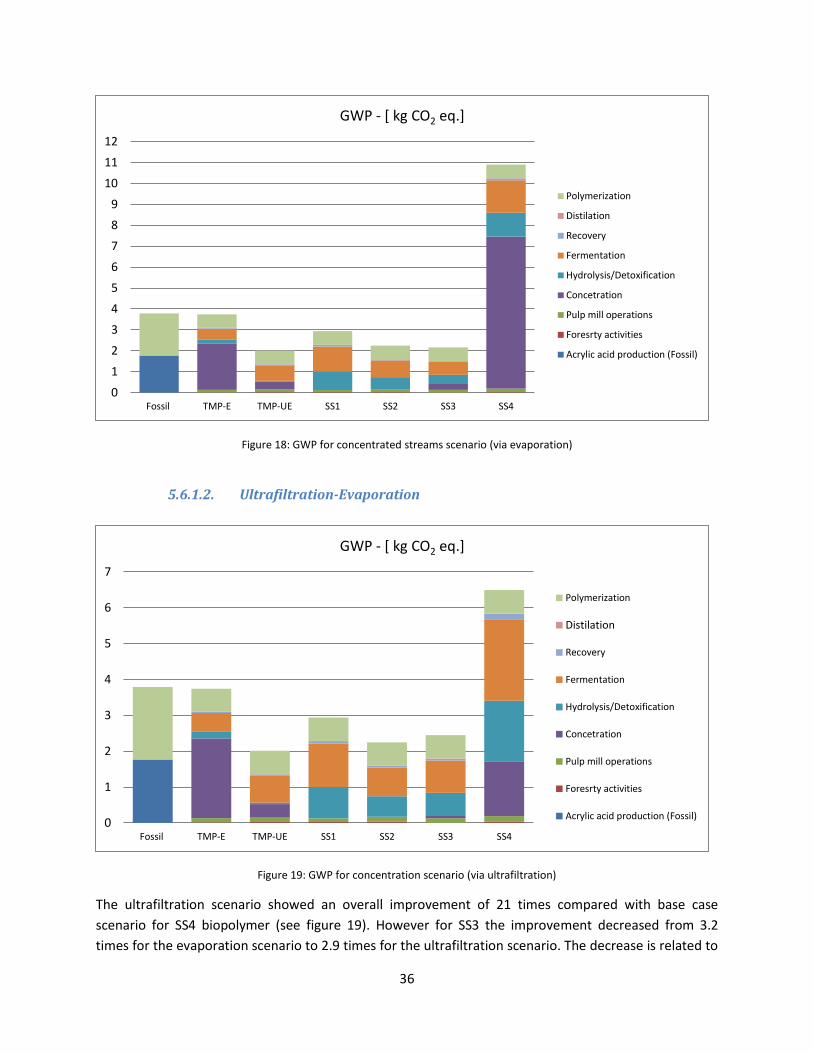
36
Figure 18: GWP for concentrated streams scenario (via evaporation)
5.6.1.2. Ultrafiltration-Evaporation
Figure 19: GWP for concentration scenario (via ultrafiltration)
The ultrafiltration scenario showed an overall improvement of 21 times compared with base case
scenario for SS4 biopolymer (see figure 19). However for SS3 the improvement decreased from 3.2
times for the evaporation scenario to 2.9 times for the ultrafiltration scenario. The decrease is related to
0
1
2
3
4
5
6
7
8
9
10
11
12
Fossil TMP-E TMP-UE SS1 SS2 SS3 SS4
GWP - [ kg CO2 eq.]
Polymerization
Distilation
Recovery
Fermentation
Hydrolysis/Detoxification
Concetration
Pulp mill operations
Foresrty activities
Acrylic acid production (Fossil)
0
1
2
3
4
5
6
7
Fossil TMP-E TMP-UE SS1 SS2 SS3 SS4
GWP - [ kg CO2 eq.]
Polymerization
Distilation
Recovery
Fermentation
Hydrolysis/Detoxification
Concetration
Pulp mill operations
Foresrty activities
Acrylic acid production (Fossil)
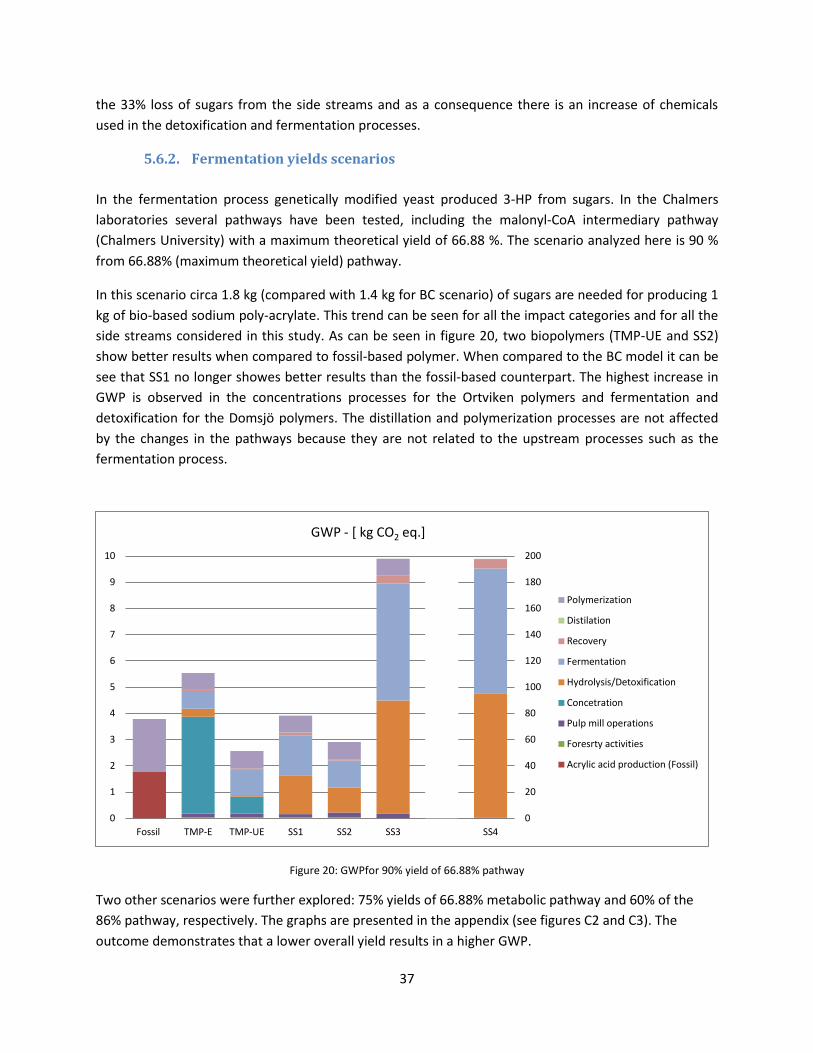
37
the 33% loss of sugars from the side streams and as a consequence there is an increase of chemicals
used in the detoxification and fermentation processes.
5.6.2. Fermentation yields scenarios
In the fermentation process genetically modified yeast produced 3-HP from sugars. In the Chalmers
laboratories several pathways have been tested, including the malonyl-CoA intermediary pathway
(Chalmers University) with a maximum theoretical yield of 66.88 %. The scenario analyzed here is 90 %
from 66.88% (maximum theoretical yield) pathway.
In this scenario circa 1.8 kg (compared with 1.4 kg for BC scenario) of sugars are needed for producing 1
kg of bio-based sodium poly-acrylate. This trend can be seen for all the impact categories and for all the
side streams considered in this study. As can be seen in figure 20, two biopolymers (TMP-UE and SS2)
show better results when compared to fossil-based polymer. When compared to the BC model it can be
see that SS1 no longer showes better results than the fossil-based counterpart. The highest increase in
GWP is observed in the concentrations processes for the Ortviken polymers and fermentation and
detoxification for the Domsjö polymers. The distillation and polymerization processes are not affected
by the changes in the pathways because they are not related to the upstream processes such as the
fermentation process.
Figure 20: GWPfor 90% yield of 66.88% pathway
Two other scenarios were further explored: 75% yields of 66.88% metabolic pathway and 60% of the
86% pathway, respectively. The graphs are presented in the appendix (see figures C2 and C3). The
outcome demonstrates that a lower overall yield results in a higher GWP.
0
20
40
60
80
100
120
140
160
180
200
0
1
2
3
4
5
6
7
8
9
10
Fossil TMP-E TMP-UE SS1 SS2 SS3 SS4
GWP - [ kg CO2 eq.]
Polymerization
Distilation
Recovery
Fermentation
Hydrolysis/Detoxification
Concetration
Pulp mill operations
Foresrty activities
Acrylic acid production (Fossil)
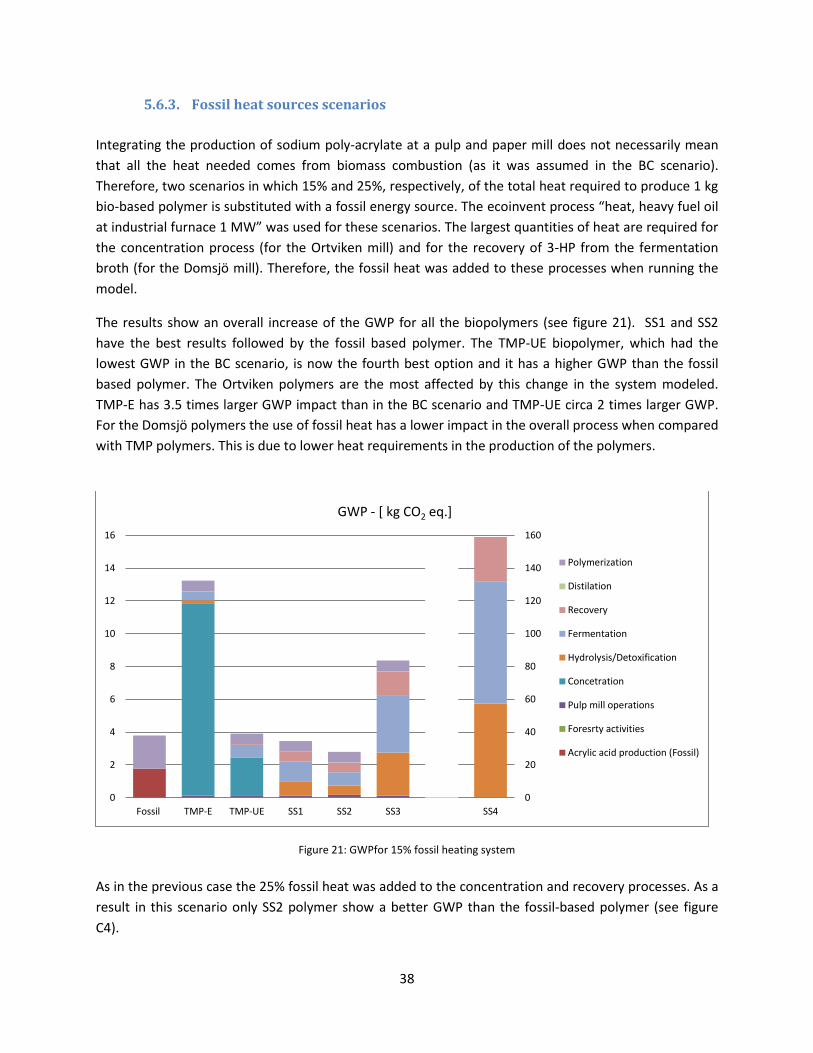
38
5.6.3. Fossil heat sources scenarios
Integrating the production of sodium poly-acrylate at a pulp and paper mill does not necessarily mean
that all the heat needed comes from biomass combustion (as it was assumed in the BC scenario).
Therefore, two scenarios in which 15% and 25%, respectively, of the total heat required to produce 1 kg
bio-based polymer is substituted with a fossil energy source. The ecoinvent process “heat, heavy fuel oil
at industrial furnace 1 MW” was used for these scenarios. The largest quantities of heat are required for
the concentration process (for the Ortviken mill) and for the recovery of 3-HP from the fermentation
broth (for the Domsjö mill). Therefore, the fossil heat was added to these processes when running the
model.
The results show an overall increase of the GWP for all the biopolymers (see figure 21). SS1 and SS2
have the best results followed by the fossil based polymer. The TMP-UE biopolymer, which had the
lowest GWP in the BC scenario, is now the fourth best option and it has a higher GWP than the fossil
based polymer. The Ortviken polymers are the most affected by this change in the system modeled.
TMP-E has 3.5 times larger GWP impact than in the BC scenario and TMP-UE circa 2 times larger GWP.
For the Domsjö polymers the use of fossil heat has a lower impact in the overall process when compared
with TMP polymers. This is due to lower heat requirements in the production of the polymers.
Figure 21: GWPfor 15% fossil heating system
As in the previous case the 25% fossil heat was added to the concentration and recovery processes. As a
result in this scenario only SS2 polymer show a better GWP than the fossil-based polymer (see figure
C4).
0
20
40
60
80
100
120
140
160
0
2
4
6
8
10
12
14
16
Fossil TMP-E TMP-UE SS1 SS2 SS3 SS4
GWP - [ kg CO2 eq.]
Polymerization
Distilation
Recovery
Fermentation
Hydrolysis/Detoxification
Concetration
Pulp mill operations
Foresrty activities
Acrylic acid production (Fossil)

39
5.6.4. 2025 electricity scenario for direct electricity input
As the polymerization process takes up 50 % of the total GWP for fossil-based sodium poly-acrylate,
changes in the future energy system may play a major role when comparing the two alternatives,
especially because the current European electricity system is in transition from non-renewable to
renewable sources. For this reason the electricity changes have been implemented only in the
polymerization processes. Also, for all the biopolymers the 2025 electricity mix is also implemented only
in the polymerization process because it is the most electricity intensive.
Data was collected from future energy scenarios for the year 2025 for Sweden and The Netherlands (the
countries where the polymers are/will be produced). For Sweden the electricity mix production is
projected to become: hydro - 38 %,nuclear - 44 %, wind - 10 %, biomass – 6 %, oil – 1 %, natural gas – 1
% (Gustavsson, 2011). For The Netherlands no concrete future scenario of electricity supply could be
found in the literature. However, 30 % renewable energy should be implemented in the current system
by 2025 in order to meet the European policies. Since most of the studies indicate that biomass and
wind electricity will have the biggest potential for development, in this scenario, it is assumed that 15%
of the future electricity system is biomass and 15% is wind electricity. The rest of the needed electricity
for The Netherlands comes from natural gas (53%), coal (14%) and nuclear (3%) (International Energy
Agency, 2012).
Figure 22: GWP for 2025 electricity scenario
All the investigated polymers showed a decrease in the environmental impacts. A more evident
decrease (of 1.1 times) in the GWP (compared to the BC scenario) can be seen for the fossil-based
0
20
40
60
80
100
120
140
160
0
1
2
3
4
5
6
7
8
Fossil TMP-E TMP-UE SS1 SS2 SS3 SS4
GWP - [ kg CO2 eq.]
Polymerization
Distilation
Recovery
Fermentation
Hydrolysis/Detoxification
Concetration
Pulp mill operations
Foresrty activities
Acrylic acid production (Fossil)
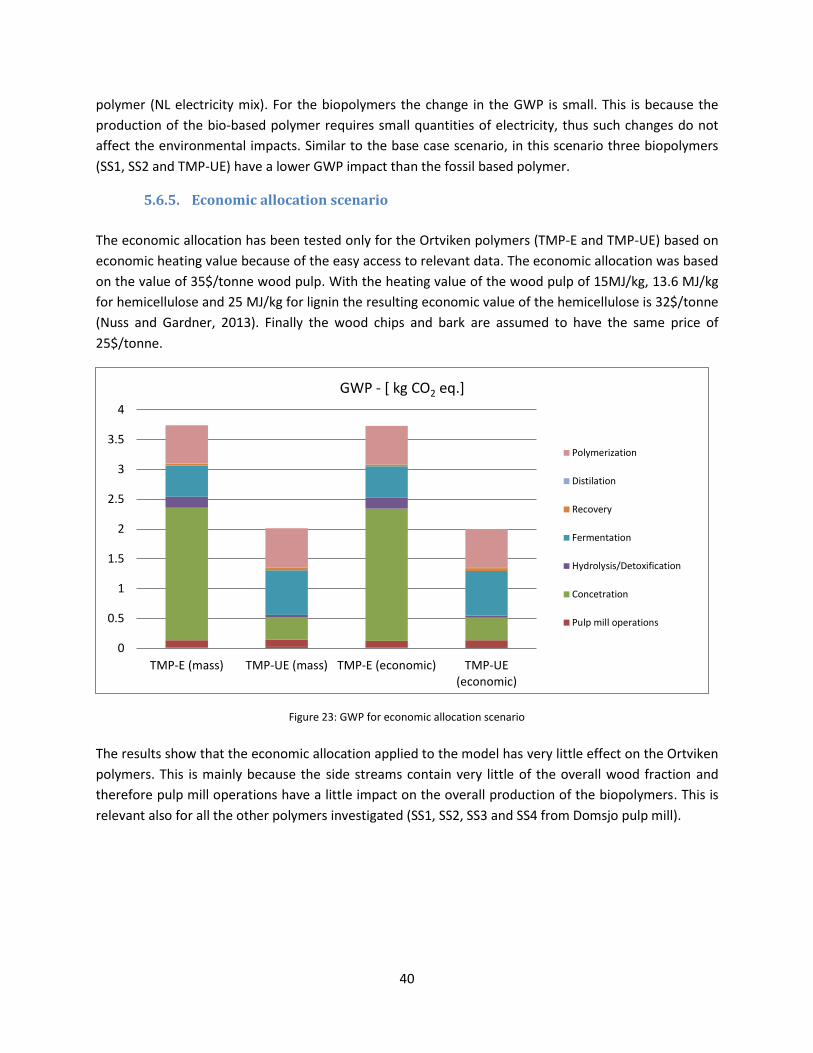
40
polymer (NL electricity mix). For the biopolymers the change in the GWP is small. This is because the
production of the bio-based polymer requires small quantities of electricity, thus such changes do not
affect the environmental impacts. Similar to the base case scenario, in this scenario three biopolymers
(SS1, SS2 and TMP-UE) have a lower GWP impact than the fossil based polymer.
5.6.5. Economic allocation scenario
The economic allocation has been tested only for the Ortviken polymers (TMP-E and TMP-UE) based on
economic heating value because of the easy access to relevant data. The economic allocation was based
on the value of 35$/tonne wood pulp. With the heating value of the wood pulp of 15MJ/kg, 13.6 MJ/kg
for hemicellulose and 25 MJ/kg for lignin the resulting economic value of the hemicellulose is 32$/tonne
(Nuss and Gardner, 2013). Finally the wood chips and bark are assumed to have the same price of
25$/tonne.
Figure 23: GWP for economic allocation scenario
The results show that the economic allocation applied to the model has very little effect on the Ortviken
polymers. This is mainly because the side streams contain very little of the overall wood fraction and
therefore pulp mill operations have a little impact on the overall production of the biopolymers. This is
relevant also for all the other polymers investigated (SS1, SS2, SS3 and SS4 from Domsjo pulp mill).
0
0.5
1
1.5
2
2.5
3
3.5
4
TMP-E (mass) TMP-UE (mass) TMP-E (economic) TMP-UE(economic)
GWP - [ kg CO2 eq.]
Polymerization
Distilation
Recovery
Fermentation
Hydrolysis/Detoxification
Concetration
Pulp mill operations
41
6. Conclusions
The first goal of this LCA study was to compare the six bio-based polymers production with the fossil-
based polymer production. The results of the BC model showed that for the GWP impact category, three
of the biopolymers (SS1, SS2 and TMP-UE) have a lower environmental impact than the fossil-based
counterpart. However, the fossil-based polymer showed better results than the bio-based polymers for
three of the impact categories under study (AP, EP, PCOP). In the end, four of the biopolymers have a
lower NREU than fossil polymer and all the biopolymers show much higher REU than their counterpart.
The second goal of the LCA was to identify the hotspots in the newly developed biopolymers production.
For Ortviken polymers the concentration process is the hotspot identified. However, when compared
the two concentration methods, the ultrafiltration (TMP-UE) show significantly lower environmental
impact than the evaporation (TMP-E). For the Domsjö polymers (SS1, SS2, SS3, and SS4) the hotspots
identified were the detoxification and fermentation processes. In addition, for the SS3 and SS4 polymers
the recovery is a hotspot identified due to the very diluted nature of these side streams. The
polymerization process has a relative large contribution to all the biopolymers, except for SS4 which is
an outlier. Finally forestry activities, pulp mill operations, dehydration and distillation processes have
very small contribution to the environmental impacts.
The overall performance of each biopolymer is dependent on the concentration of the sugars in the side
streams. More diluted side streams require larger quantities of energy and chemicals which lead to
larger environmental impacts. Therefore, to find very low energy intensive ways to concentrate the
sugar content in the side streams is an important step for future development. Furthermore, the
conversion yield of the fermentable sugars into 3-HP is a very sensitive point of the development. Thus,
exploring different metabolic pathways (including pathways for C5 sugars) and achieving high yields
should be the continuous focus of future research. Based on the sensitivity analysis results, TMP-UE and
SS2 show the largest tolerance to lower fermentation yields thus, being the most promising alternatives
from all biopolymers investigated.
The chemicals and nutrients used in the detoxification, hydrolysis, fermentation and polymerization
processes should be reduced prior large scale production of the biopolymers. The reduction of chemicals
is especially relevant when producing the biopolymer from the very diluted side streams. Furthermore,
the model developed showed high sensitivity when fossil energy is used in the production of the
polymer. Thus, the fossil energy should be avoided and the extra heat produced at the pulp mill should
be further allocated to the sodium poly-acrylate production.
Future LCA analysis can potentially investigate: (1) the use of the biopolymers in final products such as
hygiene products (in a cradle to grave perspective); (2) the use of the side streams in other bio products
such as ethanol and to compare the results with the current study; (3) the biopolymer production in a
different model with different methodological choices such as: feedstock’s, countries (different forestry
management), functional unit, et.
42
References
ALVARENGA, R. A. F., DEWULF, J., DE MEESTER, S., WATHELET, A., VILLERS, J., THOMMERET, R. & HRUSKA, Z. 2013. Life cycle assessment of bioethanol‐based PVC. Biofuels, Bioproducts and Biorefining, 7, 396-405.
BAUMANN, H. & TILLMAN, A.-M. 2004. The Hitch Hiker's Guide to LCA. An orientation in life cycle
assessment methodology and application. BERG, S. & LINDHOLM, E.-L. 2005. Energy use and environmental impacts of forest operations in
Sweden. Journal of Cleaner Production, 13, 33-42. BERNTSSON, T., SANDÉN, B. A., OLSSON, L. & ÅSBLAD, A. 2012. What is a biorefinery? CHAABOUNI, E., SARMA, S., GASSARA, F. & BRAR, S. 2014. C3–C4 Platform Chemicals Bioproduction
Using Biomass. In: BRAR, S. K., DHILLON, G. S. & SOCCOL, C. R. (eds.) Biotransformation of Waste Biomass into High Value Biochemicals. Springer New York.
CHERUBINI, F. 2010. The biorefinery concept: Using biomass instead of oil for producing energy and
chemicals. Energy Conversion and Management, 51, 1412-1421. CHERUBINI, F. & JUNGMEIER, G. 2010. LCA of a biorefinery concept producing bioethanol, bioenergy,
and chemicals from switchgrass. The International Journal of Life Cycle Assessment, 15, 53-66. CHERUBINI, F., JUNGMEIER, G., WELLISCH, M., WILLKE, T., SKIADAS, I., VAN REE, R. & DE JONG, E. 2009.
Toward a common classification approach for biorefinery systems. Biofuels, Bioproducts and Biorefining, 3, 534-546.
CHERUBINI, F. & ULGIATI, S. 2009. Crop residues as raw materials for biorefinery systems – A LCA case
study. Applied Energy, 87, 47-57. CIE, A., LANTZ, S., SCHLARP, R. & TZAKAS, M. 2012. Renewable acrylic acid, University of Pennsylvania.
Dept. of Chemical and Biomolecular Engineering. EKMAN, A. & BÖRJESSON, P. 2011. Environmental assessment of propionic acid produced in an
agricultural biomass-based biorefinery system. Journal of Cleaner Production, 19, 1257-1265. EUROPEAN COMMISSION. 2014. 2030 framework for climate and energy policies - European Commission
[Online]. Available: http://ec.europa.eu/clima/policies/2030/index_en.htm. FOSSIL FREE FUELS CENTER. 2014. Biorefineries and LCA-methodology | F3 Centre [Online]. Available:
http://f3centre.se/projects/RD-biorefinery-lca. GONZÁLEZ-GARCÍA, S., MOREIRA, M. T., FEIJOO, G. & MURPHY, R. J. 2012. Comparative life cycle
assessment of ethanol production from fast-growing wood crops (black locust, eucalyptus and poplar). Biomass and Bioenergy, 39, 378-388.
43
GONZÁLEZ‐GARCÍA, S., HOSPIDO, A., AGNEMO, R., SVENSSON, P., SELLING, E., MOREIRA, M. T. & FEIJOO, G. 2011. Environmental Life Cycle Assessment of a Swedish Dissolving Pulp Mill Integrated Biorefinery. Journal of Industrial Ecology, 15, 568-583.
GROOT, W. J. & BORÉN, T. 2010. Life cycle assessment of the manufacture of lactide and PLA
biopolymers from sugarcane in Thailand. The International Journal of Life Cycle Assessment, 15, 970-984.
GUINÉE, J. B. 2002. Handbook of Life Cycle Assessment: Operation Guide to ISO Standards, Dordrecht,
Kluwer Academic Publishers. GUSTAVSSON, M. S., ERIK; STIGSON, PETER; ZETTERBERG, LARS 2011. The IVL Scenario: Energy scenario
for Sweden 2050. based on renewable energy technologies and sources. Sweden: IVL, Swedish environmental research institute.
HAIFA GROUP. 2014. Haifa-Group - A leading supplier of specialty fertilizers - Haifa MKP - Water soluble
fertilizer - Haifa MKP [Online]. Available: http://www.haifa-group.com/products/plant_nutrition/water_soluble_fertilizers/haifa_mkp/ [Accessed June 6 2014].
HAVEREN, J. V., SCOTT, E. L. & SANDERS, J. 2008. Bulk chemicals from biomass. Biofuels, Bioproducts and
Biorefining, 2, 41-57. HUSSAIN, M. M., DINCER, I. & REDDY, B. V. 2011. A comparative life cycle assessment of bio- and
conventional fuels in a Canadian province. International Journal of Energy Research, 35, 795-804.
INDUSTRIAL EFFICIENCY TECHNOLOGY DATABASE. 2009. Heat Recovery in Thermo-mechanical Pulping
[Online]. Available: http://ietd.iipnetwork.org/content/heat-recovery-thermo-mechanical-pulping [Accessed 4 June 2014].
INTERNATIONAL ENERGY AGENCY. 2012. Oil & Gas Security [Online]. Available:
http://www.iea.org/publications/freepublications/publication/Oil&GasSecurityNL2012.pdf [Accessed 3 June 2012].
JÄGER, G. & BÜCHS, J. 2012. Biocatalytic conversion of lignocellulose to platform chemicals.
Biotechnology Journal, 7, 1122-1136. JAKOB, H., LEININGER, S., LEHMANN, T., JACOBI, S. & GUTEWORT, S. 2000. Peroxo Compounds,
Inorganic. Ullmann's Encyclopedia of Industrial Chemistry. Wiley-VCH Verlag GmbH & Co. KGaA. LENG, R., WANG, C., ZHANG, C., DAI, D. & PU, G. 2008. Life cycle inventory and energy analysis of
cassava-based Fuel ethanol in China. Journal of Cleaner Production, 16, 374-384. LIPTOW, C., TILLMAN, A.-M., JANSSEN, M., WALLBERG, O. & TAYLOR, G. A. 2013. Ethylene based on
woody biomass-what are environmental key issues of a possible future Swedish production on industrial scale.
44
LUO, L., VAN DER VOET, E. & HUPPES, G. 2009. An energy analysis of ethanol from cellulosic feedstock–Corn stover. Renewable and Sustainable Energy Reviews, 13, 2003-2011.
MARKET REPORTS ONLINE. 2014. Adult Diapers Market & Super Absorbent Polymer Industry 2018 Trends
an [Online]. @PRWeb. Available: http://www.prweb.com/releases/adult-diapers-market/superabsorbent-polymer/prweb11623177.htm.
MELAMU, R. & VON BLOTTNITZ, H. 2011. 2nd Generation biofuels a sure bet? A life cycle assessment of
how things could go wrong. Journal of Cleaner Production, 19, 138-144. MU, D., SEAGER, T., RAO, P. S. & ZHAO, F. 2010. Comparative Life Cycle Assessment of Lignocellulosic
Ethanol Production: Biochemical Versus Thermochemical Conversion. Environmental Management, 46, 565-578.
NONWOVENS INDUSTRY. 2014. A look at the top superabsorbent polymer makers in the world [Online].
Available: http://www.nonwovens-industry.com/issues/2013-11-01/view_far-east-report/a-look-at-the-top-superabsorbent-polymer-makers-in-the-world/.
NUSS, P. & GARDNER, K. 2013. Attributional life cycle assessment (ALCA) of polyitaconic acid production
from northeast US softwood biomass. The International Journal of Life Cycle Assessment, 18, 603-612.
ROY, P. & DUTTA, A. 2013. Life cycle assessment of ethanol derived from sawdust. Bioresource
technology, 150, 407. SANDERSON, R. D. & SADIKU, E. R. 2003. Theoretical energy consideration of the gas-phase
polymerization of sodium acrylate. Journal of Applied Polymer Science, 88, 928-935. SILALERTRUKSA, T. & GHEEWALA, S. H. 2009. Environmental sustainability assessment of bio-ethanol
production in Thailand. Energy, 34, 1933-1946. SWEDISH WOOD. 2014. Managing the Forests [Online]. Available:
http://www.swedishwood.com/facts_about_wood/forest_management/managing_the_forests. UIHLEIN, A. & SCHEBEK, L. 2009. Environmental impacts of a lignocellulose feedstock biorefinery system:
An assessment. Biomass and Bioenergy, 33, 793-802. VALDEHUESA, K., LIU, H., NISOLA, G., CHUNG, W.-J., LEE, S. & PARK, S. 2013. Recent advances in the
metabolic engineering of microorganisms for the production of 3-hydroxypropionic acid as C3 platform chemical. Applied Microbiology and Biotechnology, 97, 3309-3321.
VAN DUUREN, J. B. J. H., BREHMER, B., MARS, A. E., EGGINK, G., DOS SANTOS, V. A. P. M. & SANDERS, J.
P. M. 2011. A limited LCA of bio-adipic acid: manufacturing the nylon-6,6 precursor adipic acid using the benzoic acid degradation pathway from different feedstocks. Biotechnology and bioengineering, 108, 1298-1306.
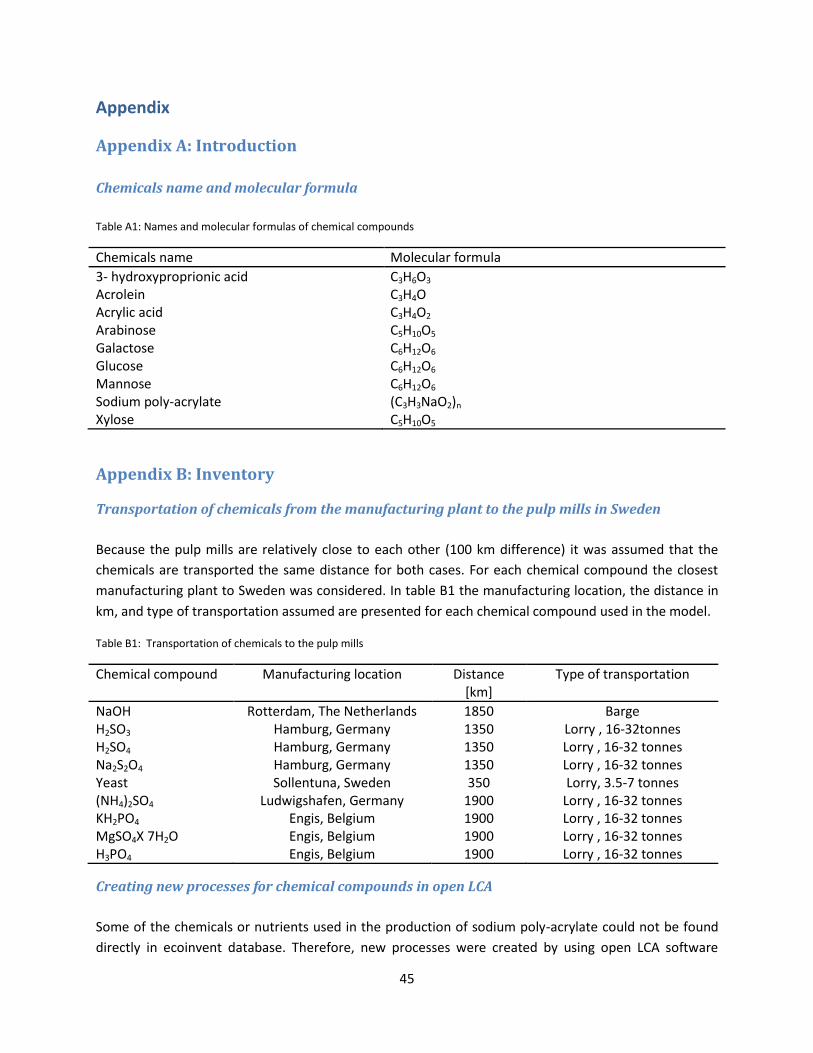
45
Appendix
Appendix A: Introduction
Chemicals name and molecular formula
Table A1: Names and molecular formulas of chemical compounds
Chemicals name Molecular formula
3- hydroxyproprionic acid Acrolein Acrylic acid Arabinose Galactose Glucose Mannose Sodium poly-acrylate Xylose
C3H6O3
C3H4O C3H4O2
C5H10O5
C6H12O6
C6H12O6
C6H12O6
(C3H3NaO2)n
C5H10O5
Appendix B: Inventory
Transportation of chemicals from the manufacturing plant to the pulp mills in Sweden
Because the pulp mills are relatively close to each other (100 km difference) it was assumed that the
chemicals are transported the same distance for both cases. For each chemical compound the closest
manufacturing plant to Sweden was considered. In table B1 the manufacturing location, the distance in
km, and type of transportation assumed are presented for each chemical compound used in the model.
Table B1: Transportation of chemicals to the pulp mills
Chemical compound Manufacturing location Distance [km]
Type of transportation
NaOH H2SO3
H2SO4
Na2S2O4
Yeast (NH4)2SO4
KH2PO4
MgSO4X 7H2O H3PO4
Rotterdam, The Netherlands Hamburg, Germany Hamburg, Germany Hamburg, Germany Sollentuna, Sweden
Ludwigshafen, Germany Engis, Belgium Engis, Belgium Engis, Belgium
1850 1350 1350 1350 350
1900 1900 1900 1900
Barge Lorry , 16-32tonnes Lorry , 16-32 tonnes Lorry , 16-32 tonnes Lorry, 3.5-7 tonnes
Lorry , 16-32 tonnes Lorry , 16-32 tonnes Lorry , 16-32 tonnes Lorry , 16-32 tonnes
Creating new processes for chemical compounds in open LCA
Some of the chemicals or nutrients used in the production of sodium poly-acrylate could not be found
directly in ecoinvent database. Therefore, new processes were created by using open LCA software
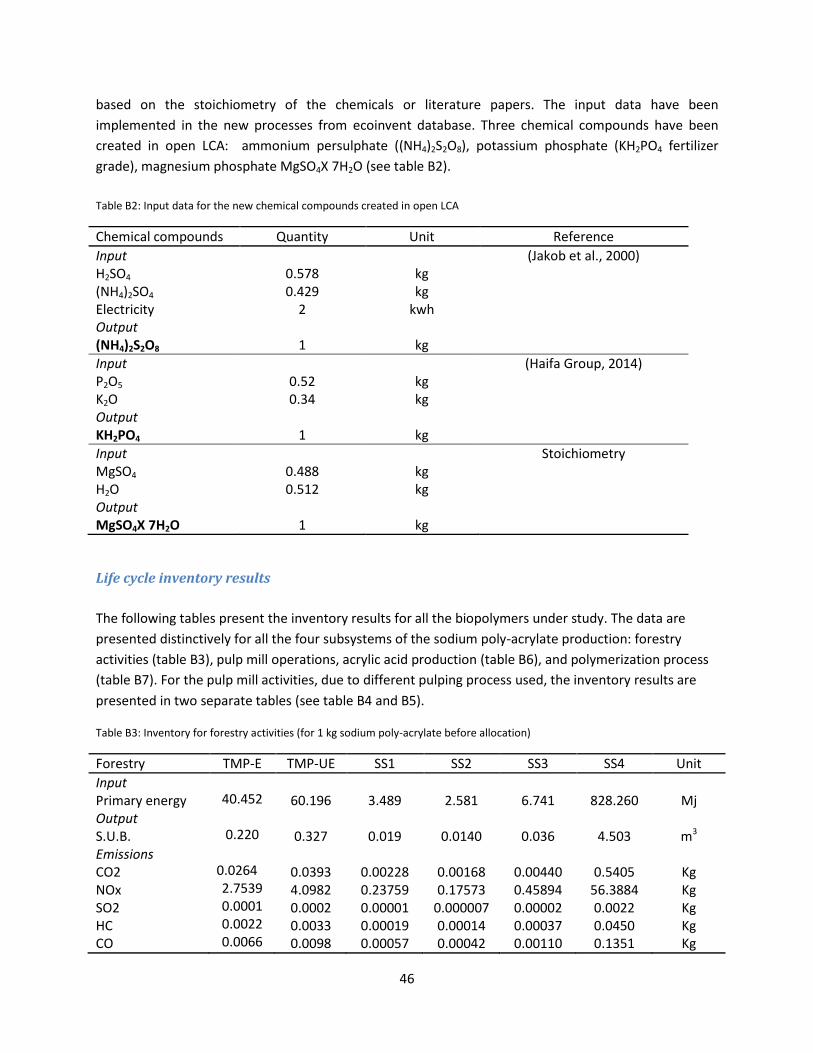
46
based on the stoichiometry of the chemicals or literature papers. The input data have been
implemented in the new processes from ecoinvent database. Three chemical compounds have been
created in open LCA: ammonium persulphate ((NH4)2S2O8), potassium phosphate (KH2PO4 fertilizer
grade), magnesium phosphate MgSO4X 7H2O (see table B2).
Table B2: Input data for the new chemical compounds created in open LCA
Chemical compounds Quantity Unit Reference
Input H2SO4
(NH4)2SO4
Electricity Output (NH4)2S2O8
0.578 0.429
2
1
kg kg
kwh
kg
(Jakob et al., 2000)
Input P2O5
K2O Output KH2PO4
0.52 0.34
1
kg kg
kg
(Haifa Group, 2014)
Input MgSO4
H2O Output MgSO4X 7H2O
0.488 0.512
1
kg kg
kg
Stoichiometry
Life cycle inventory results
The following tables present the inventory results for all the biopolymers under study. The data are
presented distinctively for all the four subsystems of the sodium poly-acrylate production: forestry
activities (table B3), pulp mill operations, acrylic acid production (table B6), and polymerization process
(table B7). For the pulp mill activities, due to different pulping process used, the inventory results are
presented in two separate tables (see table B4 and B5).
Table B3: Inventory for forestry activities (for 1 kg sodium poly-acrylate before allocation)
Forestry TMP-E TMP-UE SS1 SS2 SS3 SS4 Unit
Input Primary energy Output S.U.B. Emissions CO2 NOx SO2 HC CO
40.452
0.220 0.0264 2.7539 0.0001 0.0022 0.0066
60.196
0.327
0.0393 4.0982 0.0002 0.0033 0.0098
3.489
0.019
0.00228 0.23759 0.00001 0.00019 0.00057
2.581
0.0140
0.00168 0.17573
0.000007 0.00014 0.00042
6.741
0.036
0.00440 0.45894 0.00002 0.00037 0.00110
828.260
4.503
0.5405
56.3884 0.0022 0.0450 0.1351
Mj
m3
Kg Kg Kg Kg Kg
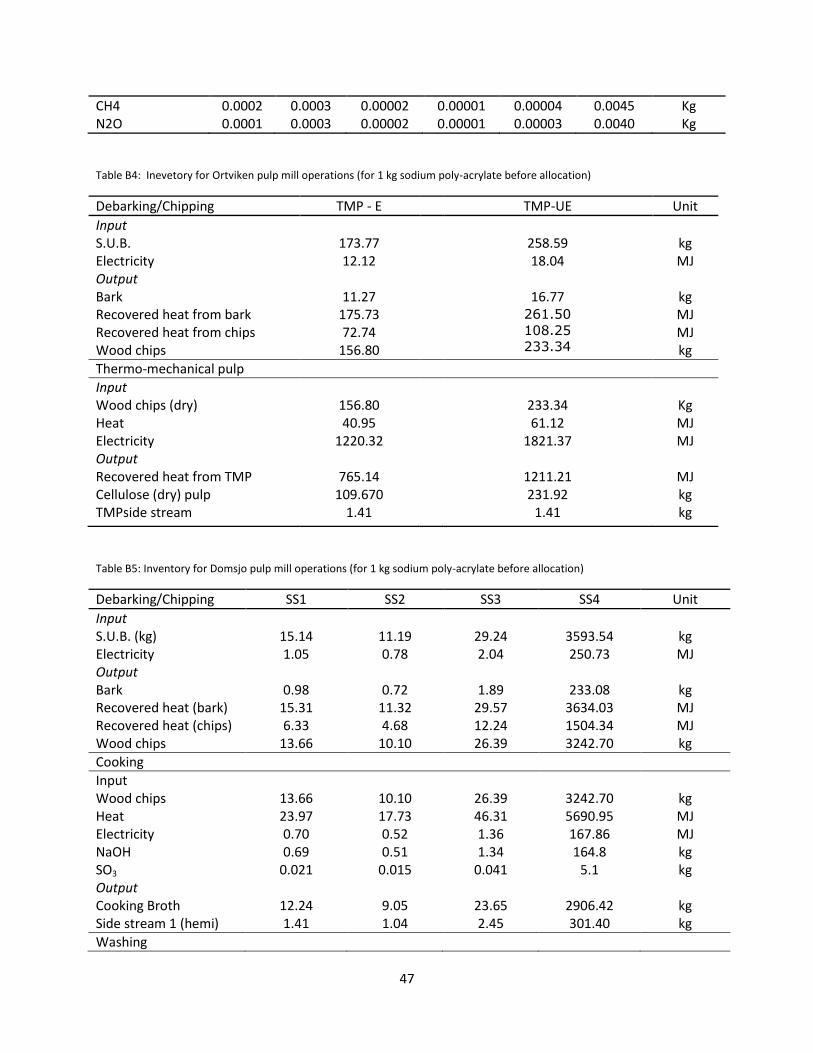
47
CH4 N2O
0.0002 0.0001
0.0003 0.0003
0.00002 0.00002
0.00001 0.00001
0.00004 0.00003
0.0045 0.0040
Kg Kg
Table B4: Inevetory for Ortviken pulp mill operations (for 1 kg sodium poly-acrylate before allocation)
Debarking/Chipping TMP - E TMP-UE Unit
Input S.U.B. Electricity
173.77 12.12
258.59 18.04
kg MJ
Output Bark Recovered heat from bark Recovered heat from chips Wood chips
11.27
175.73 72.74
156.80
16.77
261.50
108.25
233.34
kg MJ MJ kg
Thermo-mechanical pulp
Input Wood chips (dry) Heat Electricity
156.80 40.95
1220.32
233.34 61.12
1821.37
Kg MJ MJ
Output Recovered heat from TMP Cellulose (dry) pulp TMPside stream
765.14
109.670 1.41
1211.21 231.92
1.41
MJ kg kg
Table B5: Inventory for Domsjo pulp mill operations (for 1 kg sodium poly-acrylate before allocation)
Debarking/Chipping SS1 SS2 SS3 SS4 Unit
Input S.U.B. (kg) Electricity
15.14 1.05
11.19 0.78
29.24 2.04
3593.54 250.73
kg MJ
Output Bark Recovered heat (bark) Recovered heat (chips) Wood chips
0.98
15.31 6.33
13.66
0.72
11.32 4.68
10.10
1.89
29.57 12.24 26.39
233.08
3634.03 1504.34 3242.70
kg MJ MJ kg
Cooking
Input Wood chips Heat Electricity NaOH SO3
Output Cooking Broth Side stream 1 (hemi)
13.66 23.97 0.70 0.69
0.021
12.24 1.41
10.10 17.73 0.52 0.51
0.015
9.05 1.04
26.39 46.31 1.36 1.34
0.041
23.65 2.45
3242.70 5690.95 167.86 164.8
5.1
2906.42 301.40
kg MJ MJ kg kg
kg kg
Washing
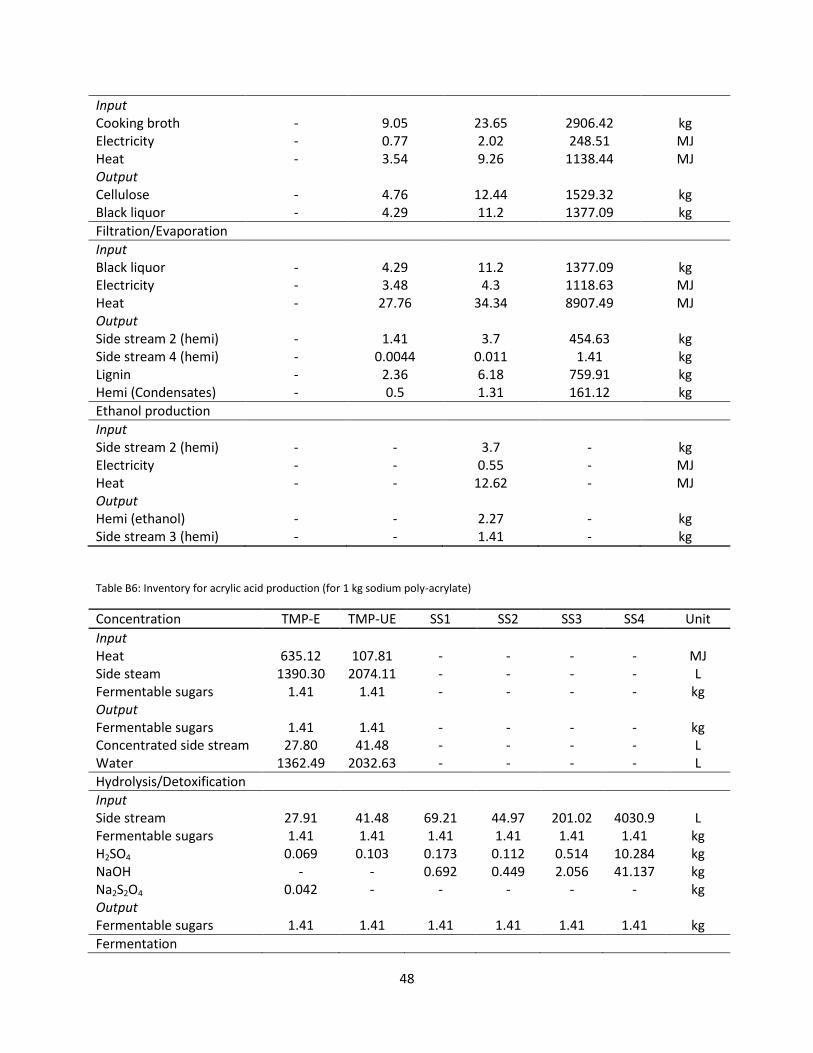
48
Input Cooking broth Electricity Heat
- - -
9.05 0.77 3.54
23.65 2.02 9.26
2906.42 248.51
1138.44
kg MJ MJ
Output Cellulose Black liquor
- -
4.76 4.29
12.44 11.2
1529.32 1377.09
kg kg
Filtration/Evaporation
Input Black liquor Electricity Heat
- - -
4.29 3.48
27.76
11.2 4.3
34.34
1377.09 1118.63 8907.49
kg MJ MJ
Output Side stream 2 (hemi) Side stream 4 (hemi) Lignin Hemi (Condensates)
- - - -
1.41
0.0044 2.36 0.5
3.7
0.011 6.18 1.31
454.63
1.41 759.91 161.12
kg kg kg kg
Ethanol production
Input Side stream 2 (hemi) Electricity Heat
- - -
- - -
3.7
0.55 12.62
- - -
kg MJ MJ
Output Hemi (ethanol) Side stream 3 (hemi)
- -
- -
2.27 1.41
- -
kg kg
Table B6: Inventory for acrylic acid production (for 1 kg sodium poly-acrylate)
Concentration TMP-E TMP-UE SS1 SS2 SS3 SS4 Unit
Input Heat Side steam Fermentable sugars Output Fermentable sugars Concentrated side stream Water
635.12
1390.30 1.41
1.41
27.80 1362.49
107.81
2074.11 1.41
1.41
41.48 2032.63
- - - - - -
- - - - - -
- - - - - -
- - - - - -
MJ L
kg
kg L L
Hydrolysis/Detoxification
Input Side stream Fermentable sugars H2SO4
NaOH Na2S2O4
Output Fermentable sugars
27.91 1.41
0.069 -
0.042
1.41
41.48 1.41
0.103 - -
1.41
69.21 1.41
0.173 0.692
-
1.41
44.97 1.41
0.112 0.449
-
1.41
201.02
1.41 0.514 2.056
-
1.41
4030.9
1.41 10.284 41.137
-
1.41
L
kg kg kg kg
kg
Fermentation
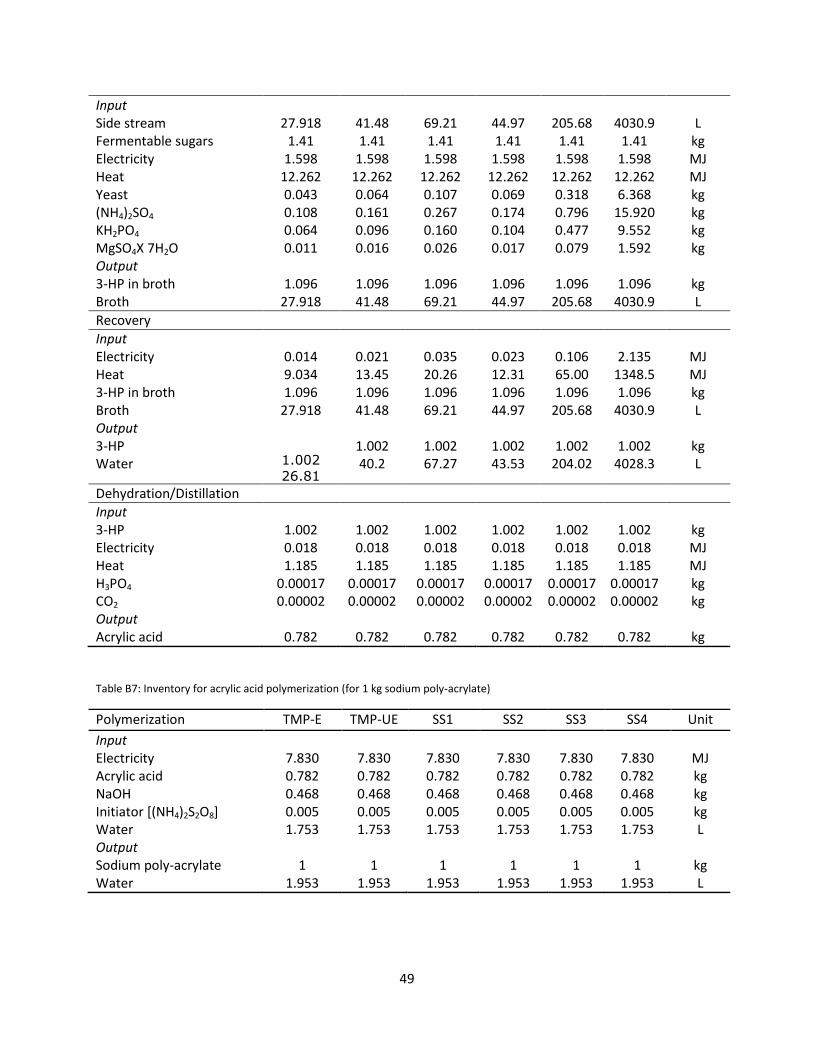
49
Input Side stream Fermentable sugars Electricity Heat Yeast (NH4)2SO4
KH2PO4
MgSO4X 7H2O Output 3-HP in broth Broth
27.918
1.41 1.598
12.262 0.043 0.108 0.064 0.011
1.096
27.918
41.48 1.41
1.598 12.262 0.064 0.161 0.096 0.016
1.096 41.48
69.21 1.41
1.598 12.262 0.107 0.267 0.160 0.026
1.096 69.21
44.97 1.41
1.598 12.262 0.069 0.174 0.104 0.017
1.096 44.97
205.68
1.41 1.598
12.262 0.318 0.796 0.477 0.079
1.096
205.68
4030.9
1.41 1.598
12.262 6.368
15.920 9.552 1.592
1.096
4030.9
L
kg MJ MJ kg kg kg kg
kg L
Recovery
Input Electricity Heat 3-HP in broth Broth Output 3-HP Water
0.014 9.034 1.096
27.918
1.002
26.81
0.021 13.45 1.096 41.48
1.002 40.2
0.035 20.26 1.096 69.21
1.002 67.27
0.023 12.31 1.096 44.97
1.002 43.53
0.106 65.00 1.096
205.68
1.002 204.02
2.135
1348.5 1.096
4030.9
1.002 4028.3
MJ MJ kg L
kg L
Dehydration/Distillation
Input 3-HP Electricity Heat H3PO4
CO2
Output Acrylic acid
1.002 0.018 1.185
0.00017 0.00002
0.782
1.002 0.018 1.185
0.00017 0.00002
0.782
1.002 0.018 1.185
0.00017 0.00002
0.782
1.002 0.018 1.185
0.00017 0.00002
0.782
1.002 0.018 1.185
0.00017 0.00002
0.782
1.002 0.018 1.185
0.00017 0.00002
0.782
kg MJ MJ kg kg
kg
Table B7: Inventory for acrylic acid polymerization (for 1 kg sodium poly-acrylate)
Polymerization TMP-E TMP-UE SS1 SS2 SS3 SS4 Unit
Input Electricity Acrylic acid NaOH Initiator [(NH4)2S2O8] Water Output Sodium poly-acrylate Water
7.830 0.782 0.468 0.005 1.753
1
1.953
7.830 0.782 0.468 0.005 1.753
1
1.953
7.830 0.782 0.468 0.005 1.753
1
1.953
7.830 0.782 0.468 0.005 1.753
1
1.953
7.830 0.782 0.468 0.005 1.753
1
1.953
7.830 0.782 0.468 0.005 1.753
1
1.953
MJ kg kg kg L
kg L
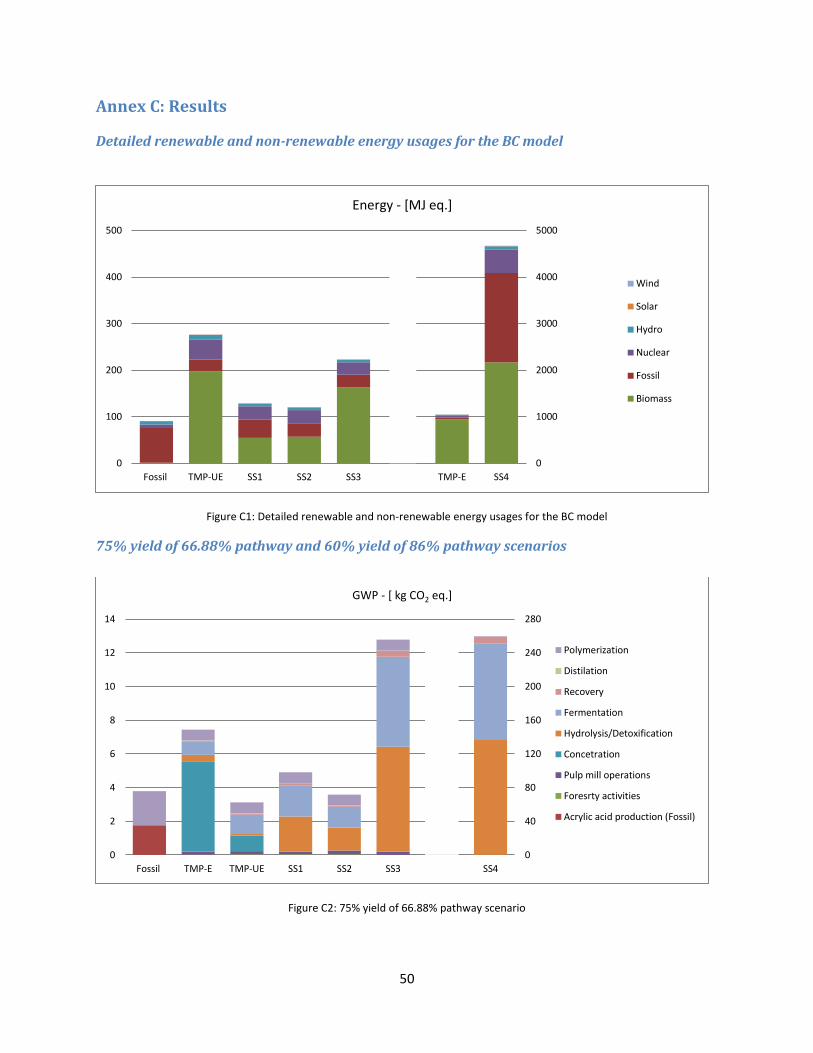
50
Annex C: Results
Detailed renewable and non-renewable energy usages for the BC model
Figure C1: Detailed renewable and non-renewable energy usages for the BC model
75% yield of 66.88% pathway and 60% yield of 86% pathway scenarios
Figure C2: 75% yield of 66.88% pathway scenario
0
1000
2000
3000
4000
5000
0
100
200
300
400
500
Fossil TMP-UE SS1 SS2 SS3 TMP-E SS4
Energy - [MJ eq.]
Wind
Solar
Hydro
Nuclear
Fossil
Biomass
0
40
80
120
160
200
240
280
0
2
4
6
8
10
12
14
Fossil TMP-E TMP-UE SS1 SS2 SS3 SS4
GWP - [ kg CO2 eq.]
Polymerization
Distilation
Recovery
Fermentation
Hydrolysis/Detoxification
Concetration
Pulp mill operations
Foresrty activities
Acrylic acid production (Fossil)
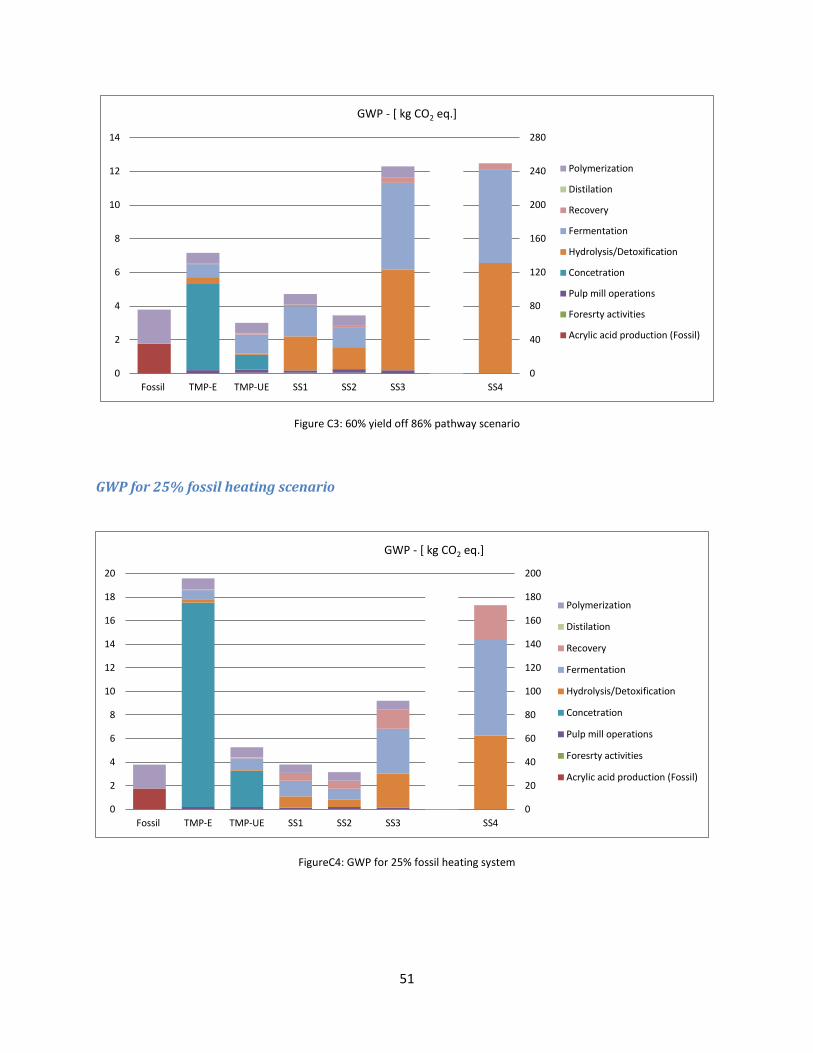
51
Figure C3: 60% yield off 86% pathway scenario
GWP for 25% fossil heating scenario
FigureC4: GWP for 25% fossil heating system
0
40
80
120
160
200
240
280
0
2
4
6
8
10
12
14
Fossil TMP-E TMP-UE SS1 SS2 SS3 SS4
GWP - [ kg CO2 eq.]
Polymerization
Distilation
Recovery
Fermentation
Hydrolysis/Detoxification
Concetration
Pulp mill operations
Foresrty activities
Acrylic acid production (Fossil)
0
20
40
60
80
100
120
140
160
180
200
0
2
4
6
8
10
12
14
16
18
20
Fossil TMP-E TMP-UE SS1 SS2 SS3 SS4
GWP - [ kg CO2 eq.]
Polymerization
Distilation
Recovery
Fermentation
Hydrolysis/Detoxification
Concetration
Pulp mill operations
Foresrty activities
Acrylic acid production (Fossil)