Embed Size (px)
Citation preview

Great Lakes Bioenergy Research Center - www.g l b rc . o rg / edu ca t i on
Life Cycle Assessment of Biofuels 101Overview: When selecting alternative fuels, it is important to consider the relative advantages and disadvantages of each. This activity asks students to begin to consider the life cycle energy and carbon dioxide emission costs of gasoline, corn ethanol and cellulosic ethanol. The various pieces help students trace energy and matter through a complex system and begin to critically analyze graphical comparisons of different fuels.
Levels6 through Undergraduate
SubjectsScience, Environmental Studies
ObjectivesStudents will:
• Trace energy and carbon through a transportation fuel production system.
• Identify ways to process transportation fuels without the use of fossil fuels.
• Describe steps in fuel processing where carbon dioxide is sequestered and released.
• Evaluate the sustainability of gasoline, corn ethanol and cellulosic ethanol.
Materials• Biofuels 101 Package• Supplementary Videos -
Available Online.
Activity TimeTwo or three 50-minute class periods
StandardsNext Generation Science Standards (2013)
• Scientific and Engineering Practices: developing and using models; engaging in argument from evidence; obtaining, evaluating, and communicating information
• Disciplinary Core Ideas: matter and its interactions; ecosystems; earth and human activity; engineering design
• Crosscutting Concepts: energy and matter
• Performance Expectations: See page 3 for details
NGSS Lead States. 2013. Next Generation Science Standards: For States by States. Washington DC: The National Academies Press
Life Cycle Assessment
LCA Videos
DiscussionSmall and
Large Group
Discussion
Discussion Large Group
Life Cycle Assessment
Walkthrough
-Powerpoints-
The Difference Between Corn and Cellulosic Ethanol
-Presentation-
Pre-
Assessment
Option 1
Option 2
Life Cycle Assessment
GraphingActivity
Post Assessment
Small and Large Group
T1

Great Lakes Bioenergy Research Center - www.g l b rc . o rg / edu ca t i on T2
Life Cycle Assessment of Biofuels 101
Overview:
When selecting alternative fuels, it is important to consider the relative advantages and disadvantages of each. This activity asks students to begin to consider the life cycle energy and carbon dioxide emission costs of gasoline, corn ethanol and cellulosic ethanol.
This lesson is designed to run over the course of two or three 50 minute class periods. Given the complexity of the material, allow plenty of time for discussion and questions.
Learning Outcomes: Students will…• Trace energy and carbon through a transportation fuel production
system.• Describe steps in fuel processing where carbon dioxide is sequestered
and released.• Identify ways to process transportation fuels with fewer inputs of fossil
fuels.• Evaluate the sustainability of gasoline, corn ethanol and cellulosic
ethanol production.
This lesson assumes prior knowledge in the carbon cycle, energy transfer, some discussion of global climate change and energy crisis.
For Teachers - Life Cycle Assessment of Biofuels 101

Great Lakes Bioenergy Research Center - www.g l b rc . o rg / edu ca t i on T3
Life Cycle Assessment of Biofuels 101
Standards
Next Generation Science Standards (2013)
Performance Expectations
Middle School:• MS-LS2-3. Develop a model to describe the cycling of matter and flow of
energy among living and nonliving parts of an ecosystem.• MS-ESS3-3. Apply scientific principles to design a method for
monitoring and minimizing a human impact on the environment.• MS-ESS3-4. Construct an argument supported by evidence for how
increases in human population and per-capita consumption of natural resources impact Earth’s systems.
• MS-ETS1-1. Define the criteria and constraints of a design problem with sufficient precision to ensure a successful solution, taking into account relevant scientific principles and potential impacts on people and the natural environment that may limit possible solutions.
High School:• HS-ESS3-2. Evaluate competing design solutions for developing,
managing, and utilizing energy and mineral resources based on cost-benefit ratios.
• HS-ESS3-4. Evaluate or refine a technological solution that reduces impacts of human activities on natural systems.
• HS-ETS1-1. Analyze a major global challenge to specify qualitative and quantitative criteria and constraints for solutions that account for societal needs and wants.
Great Lakes Bioenergy Research Center - www.g l b rc . o rg / edu ca t i on T4
Life Cycle Assessment of Biofuels 101
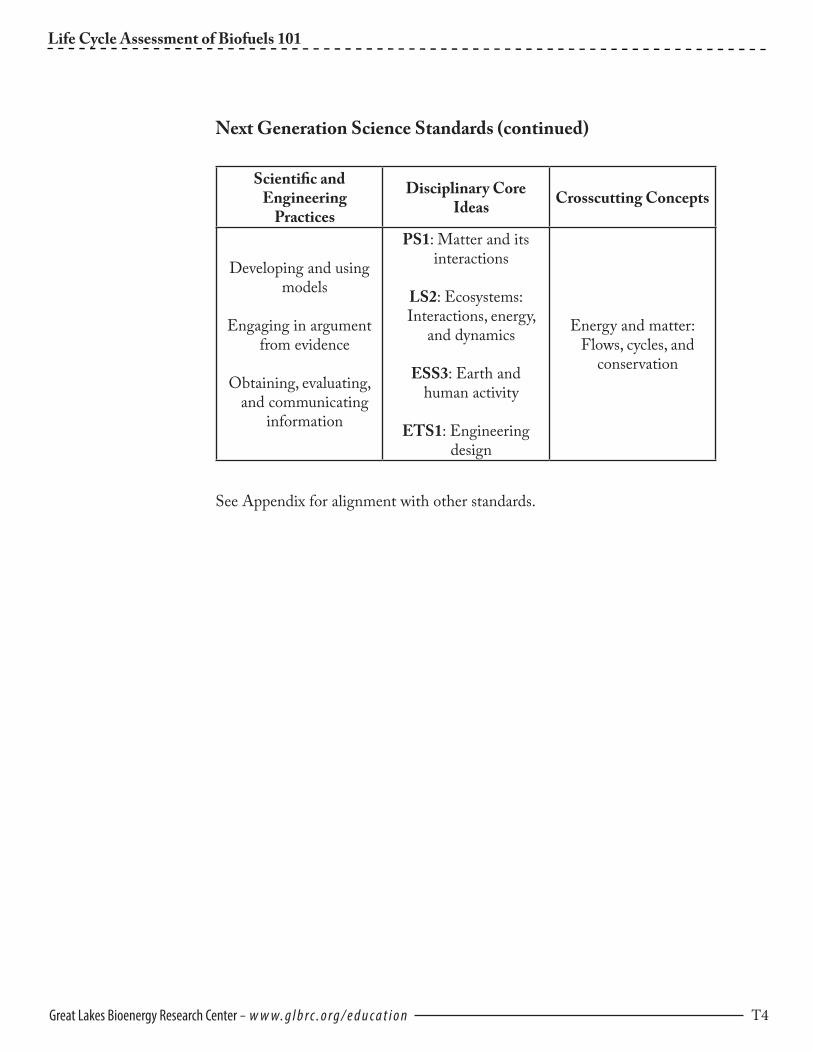
Next Generation Science Standards (continued)
Scientific and Engineering
Practices
Disciplinary Core Ideas Crosscutting Concepts
Developing and using models
Engaging in argument from evidence
Obtaining, evaluating, and communicating
information
PS1: Matter and its interactions
LS2: Ecosystems: Interactions, energy,
and dynamics
ESS3: Earth and human activity
ETS1: Engineering design
Energy and matter: Flows, cycles, and
conservation
See Appendix for alignment with other standards.

Great Lakes Bioenergy Research Center - www.g l b rc . o rg / edu ca t i on T5
Life Cycle Assessment of Biofuels 101
Sequence:
Part 1. Pre-assessment of student knowledge on biofuels and sustainability (pages 1 and 2) (30-40 min)Ask each student to complete page 1 on his or her own. They may need prompting to make the drawing, depending upon their familiarity with drawing the carbon cycle.
Students should complete page 2 in small groups. All students should write answers, but you may want them to designate one individual as the official recorder and another as the official reporter for class discussion later.
Large group discussion on page 2. Ask each group to report on at least one area of agreement and one area of disagreement or question. This is a chance for the teacher to assess student knowledge, misconceptions and questions about biofuels. There is no need to answer their questions at this point, except perhaps that a gallon of ethanol contains 2/3 the energy of a gallon of gasoline and confirmation of the carbon cycle. Most statements could be answered either way depending on facts used.
Part 2. Provide background information (time varies by teacher choice). In order to complete the rest of this exercise, students will need a basic understanding of the difference between corn ethanol and cellulosic ethanol. This could be done as a lecture or reading (see included “cellulosic ethanol” reading or other suggested background material in the appendix). The fundamental difference is corn ethanol is created from corn grain, a starchy material, which is fairly easy to ferment. Amylase and heat can break starch into glucose, which is readily fermentable. Corn ethanol feedstock comes from farms. Cellulosic ethanol is created from leaves, stems, woody materials, which are not easy to ferment. Enzymes to digest cellulose are not readily available industrially, and a great deal of energy and chemicals currently go into isolating the cellulose and preparing it for fermentation. Source material for cellulosic ethanol could come from farm residues, yard waste, prairie grasses and a host of other feedstocks.
Pre-
Assessment
DiscussionSmall and
Large Group
The Difference Between Corn and Cellulosic Ethanol
“Cellulosic Ethanol”

Great Lakes Bioenergy Research Center - www.g l b rc . o rg / edu ca t i on T6
Life Cycle Assessment of Biofuels 101
Part 3. Introduction to Life Cycle Assessment (pages 3-7) (30-40 min)This is a qualitative overview of the process used by scientists, and required by the National Renewable Fuels Standard program, for determining if these new fuels are sustainable. There are two options for this part of the activity--the paper version, described below, or the “Walkthrough.” The Walkthrough LCA of Biofuel Production (p. 3-4, instructions on 6T) is a cooperative, active full-class version of the paper activity where teams solve energy and matter transformations at one station and connect what they learned to the other stations. They “walk” energy and carbon forms through the process of making biofuel using manipulatives and a process tool. The Life Cycle Assessment Process Tool can be used as homework or as a test after completing the walkthrough to assess whether or not the students understand the flow of energy and matter through the cycle.
The paper activity (p. 5-7) leads the students through each part of the assessment separately (energy first, then CO2). It may help to talk students through the energy transformations involved--discussing how the sun provides energy to the plants and then that energy is transformed into chemical energy which is burned at various points in the cycle. Students may wish to draw arrows showing energy entering or escaping the system. Allow students to fill in the carbon dioxide chart on their own or with a partner depending on their comfort with the carbon cycle. The follow-up questions may be best discussed in partners before discussion as a class.
Animated PowerPoints and videos of the energy and carbon flows are available in the supplementary materials folder in the activity package and on the GLBRC website respectively. These are useful reviews of the material, and the videos provide supplementary photographs and interviews.
Option 1
Life Cycle Assessment
Walkthrough
DiscussionLife Cycle
Assessment
Option 2
Life Cycle Assessment
LCA Videos
Life Cycle Assessment
“Walkthrough”
“LCA Carbon and Energy animated presentations and
scripts”
“LCA of Carbon and Energy online videos”

Great Lakes Bioenergy Research Center - www.g l b rc . o rg / edu ca t i on T7
Life Cycle Assessment of Biofuels 101
Teaching Tip: Tracing energy and carbon through systems can be difficult for many students. Students will often try to transform matter into energy and vice versa, or allow carbon to turn into oxygen. Work through the inner loop of plant energy or carbon first. Then discuss external inputs and outputs. Distinguish between quick cycling plant energy and materials, and longer cycling fossils fuels. The PowerPoints and scripts can provide a chance to hear, see and read the answer after students attempt to work through it on their own.
Part 4. Graphs. Comparing energy used to create gasoline, corn ethanol and cellulosic ethanol. (pages 8-11) (30-40 min)Complete pages 8 and 9 individually or in pairs. Students may need prompting to think about why fossil fuels are needed to create fuel.
Discuss answers with students. Please look at teacher answers provided for guidance.
The last question is meant as a self-assessment for you and for the student. What did they learn from the activity and what further questions do they have? This may lead into deeper research into the quantitative studies on biofuel sustainability.
ExtensionFollow up references included in the appendix. Also visit the GLBRC education page for additional activities related to this topic.
Large Group
Post Assessment
GraphingActivity

Great Lakes Bioenergy Research Center - www.g l b rc . o rg / edu ca t i on T8
Life Cycle Assessment of Biofuels 101
Life Cycle Assessment
Walkthrough
(Option 1) - Walkthrough Life Cycle Assessment of Biofuel Production Instructions for Educators
1. Print out one full page version of the six LCA stations (slides 1-7) and post around the classroom.
2. Print out seven copies of the Process Tool on slide 8 and hang one under each station. The refinery station should have two copies, one for fermentation and the other for plant operation.
3. Print out copies of process tool cards (slides 10-13). Number of copies of each is indicated at the bottom of the slide. Cut the slides apart so each process is separate.
4. Assign at least two students to stand at each of the six stations. Other students may watch, help, or complete the activity on paper individually.
5. Show slide 9, with all of the process tool options. For students standing at each station, ask them to think about the process that occurs at their location. They should identify the energy input(s) and energy output(s) as well as the matter input(s) and output(s) and write that on the process tool page. For example, students at the Plants station would pick up the sun as their energy input and chemical energy as the energy output. CO2 and H2O are matter inputs, glucose and O2 are matter outputs. They can then pick up cards to represent each item. Note: the Refining station has two substations: plant operation and fermentation. There may be extra cards left over.
6. After students have chosen their cards, they should explain their choices to the class. The class should walk through the cycle in order, following the arrows first from plants (photosynthesis) to the refinery (fermentation) to the car (combustion), then going through farming practices, feedstock transport, refinery (plant operation) and product transport. Correct any mistakes students make along the way. Cards can be passed from one group to another or taped to the process tool.
7. Be sure students have a chances to see the visual of the complete cycle as it appears in the printed activity (slide 14) so they can see the cycle as well as walking and talking about it. Bring the process tools together on the front board at the end of class if it is useful.
8. Followup questions: In order for ethanol production to be carbon neutral, what would need to happen? Where along the way could you modify the system to reduce the total amount of carbon dioxide released into the atmosphere? Are there other choices that could be made that would make the system less damaging to the environment?
“Walkthrough”
LCA Videos
Life Cycle Assessment
“LCA Carbon and Energy animated presentations and
scripts”
“LCA of Carbon and Energy online videos”

Great Lakes Bioenergy Research Center - www.g l b rc . o rg / edu ca t i on T9
Answer Key Life Cycle Assessment of Biofuels 101
(Opt
ion
1) -
Life
Cyc
le A
sses
smen
t Pro
cess
Too
l (p.
3-4
)
Follo
w-up
que
stion
s:1.
Wha
t is t
he re
latio
nshi
p be
twee
n th
e mat
ter o
utpu
t fro
m #
3 to
the m
atte
r inp
ut in
#1?
They
are t
he sa
me.
CO
2 lea
ving
cars
retu
rns t
o the
at
mos
pher
e whe
re it
coul
d en
ter m
ore p
lant
s thr
ough
phot
osyn
thesi
s. Th
is pa
rt of
the l
oop
alon
e is c
arbo
n ne
utra
l for
that
reas
on.
2. D
oes a
ll en
ergy
put
into
#1
mak
e it t
o th
e ene
rgy
outp
ut st
age o
f #3?
Why
or w
hy n
ot? N
o, m
uch
ener
gy in
the d
iagr
am is
lost
as h
eat o
r th
roug
h or
gani
smal
meta
bolis
m, l
ike y
east,
dur
ing f
erm
enta
tion
(not
mod
eled
here
).
3. If
we a
re co
nduc
ting
a life
cycle
asse
ssm
ent f
or en
ergy
or g
reen
hous
e gas
es, l
ike c
arbo
n di
oxid
e, wh
y ca
n’t w
e sto
p at
stag
es 1
-3?
Why
do
we
need
to in
clude
stag
es 4
-7 as
well
? Beca
use m
ore e
nerg
y is n
eede
d to
farm
and
mov
e pla
nts a
roun
d, to
actu
ally
run
the r
efine
ry, a
nd in
othe
r pla
ces. A
lif
e cyc
le as
sessm
ent l
ooks
broa
dly a
t ene
rgy a
nd m
atter
inpu
ts an
d ou
tput
s nece
ssary
to cr
eate
the f
uel.
Ener
gy In
put
Ener
gy O
utpu
t
Matt
er In
put
Matt
er O
utpu
t
Whe
re:
Fiel
d
Proc
ess:
Ph
otos
ynth
esis
Ener
gy O
utpu
tEn
ergy
Inpu
t
Matt
er O
utpu
tM
atter
Inpu
t
Whe
re:
Car
Proc
ess:
En
ergy
Out
put
Matt
er O
utpu
t
Whe
re: Re
finery
Proc
ess:
Ferm
entatio
n
Matter O
utput
Matter O
utputEnergy
Output
1
32
Matter In
put
Oxygen
sola
r ene
rgy
etha
nol
chem
ical
ene
rgy
gluc
ose/
cellu
lose
/car
bohy
drat
es
oxyg
en
chem
ical
ene
rgy
+ h
eat
CO
2 +
H2O
CO
2 +
H2O
kine
tic e
nerg
y +
he
at
CO
2
heat
Com
bust
ion
Plea
se n
ote
that
thes
e an
swer
s sho
w th
e pr
imar
y en
ergy
inpu
ts a
nd o
utpu
ts a
ssoc
iate
d w
ith fu
el p
rodu
ctio
n. T
here
are
oth
er e
nerg
y lo
sses
in
the
syst
em n
ot sh
own
here
. Te
ache
rs c
ould
dis
cuss
the
effic
ienc
y of
pla
nt g
row
th a
nd p
hoto
synt
hesi
s, en
ergy
con
tent
of C
O2
and
H2O
as
wel
l.

Answer KeyLife Cycle Assessment of Biofuels 101
Great Lakes Bioenergy Research Center - www.g l b rc . o rg / edu ca t i on T10
Follow-up questions:1. Describe how you would determine the net energy gain or loss for ethanol production. Write an equation using only the relevant steps. You can abbreviate EI for Energy Input and EO for Energy Output (eg. EI #1 - EO #7=). There are many ways to answer this question. Students should be reminded the energy in = energy out for the system. Net energy input is EI 1 - EI 4 - EI 5 - EI 6 - EI 7. (solar energy in minus fossil fuel inputs). Alternatively, engineers calculating a life cycle assessment might use EO 2 - EI 4 - EI 5 - EI 6 - EI 7 (energy in ethanol minus fossil fuel inputs to create it). Balancing renewables and non-renewables is a common way to look at the problem.2. How do you think you could best improve the energy efficiency of this process? Reduce the carbon footprint? Energy: reduce losses to heat, shorten transportation distances, lower energy needs for conversion of fuel; Carbon footprint: increase energy efficiency, use of renewable energy for electricity, transportation, etc.
Additional inputs to create biofuel. (p. 4)
Energy Input Energy Output
Matter Input Matter Output
Where: Farm
Process:Chemical Application
HarvestingEquipment Operation
Energy Input Energy Output
Matter Input Matter Output
Energy Input Energy Output
Matter Input Matter Output
Energy Input Energy Output
Matter Input Matter Output
Where: Roadway between field and
refinery
Process:
Where: Refinery
Process: Pretreatment
Hydrolysis Distillation
Lighting
Where: Roadway between refinery-
and fuel pump
Process:
4
5
6
7
methane (CH4), petroleum + O2 CO2 + H2O
CO2 + H2O
CO2 + H2O
CO2 + H2O
Combustion
Combustion
Combustion
chemical energy
chemical energy
chemical energy, electricity
chemical energy
petroleum + O2
petroleum, biomass, methane (CH4), coal + O2
petroleum + O2
kinetic energy + heat
kinetic energy + heat
kinetic energy + heat (+ electricity)
kinetic energy + heat
Note that answers for 4-7 will vary considerably. Fuel sources will vary for transportation use; refineries will often use multiple energy sources to power different parts of the refinery. For example, methane (natural gas) may be used to heat materials during pretreatment, but biomass may be burned to generate electricity or heat a fermenter. Some refineries generate enough electricity at this stage to sell excess to the grid.
Combustion

Great Lakes Bioenergy Research Center - www.g l b rc . o rg / edu ca t i on T11
Answer Key Life Cycle Assessment of Biofuels 101
Life Cycle Assessment
(Option 2) - Life Cycle Assessment (p. 5-7)
1. Try your own life cycle assessment (variations on the steps are acceptable) Steps: Carbon
Sequestered or Released?
Form of carbon(from__ to__)
How or why? (Photosynthesis,
cellular respiration, combustion)
Planting crop Released Gasoline to CO2 Combustion
Grow crop Sequestered C02 to glucose, etc. Photosynthesis
Harvesting crop Released Gasoline to C02 Combustion
Transporting crop Released Gasoline to C02 Combustion
Creating Ethanol Released Coal, gas, biomass to C02
Combustion
Transporting Ethanol
Released Gasoline to C02 Combustion
other...
2. In order for ethanol production to be carbon neutral, what would need to happen? Sum of carbon dioxide sequestered in photosynthesis = sum of carbon dioxide released in other processes in cycle
Because all of the C released during ethanol combustion was sequestered during growing, those 2 processes are a net zero. Therefore, there needs to be an additional C sink from plant matter left behind that becomes permanently trapped in soil to offset the additional C from the other industrial processes and the release of other global warming gases that result from growing crops. Perennial crops where roots and base shoots are left intact can help meet those needs. IN REALITY…biofuels are not C-neutral, but with good management practices they can release LESS greenhouse gases when compared with gasoline. See Appendix for further reading.
Answer KeyLife Cycle Assessment of Biofuels 101
Great Lakes Bioenergy Research Center - www.g l b rc . o rg / edu ca t i on T12
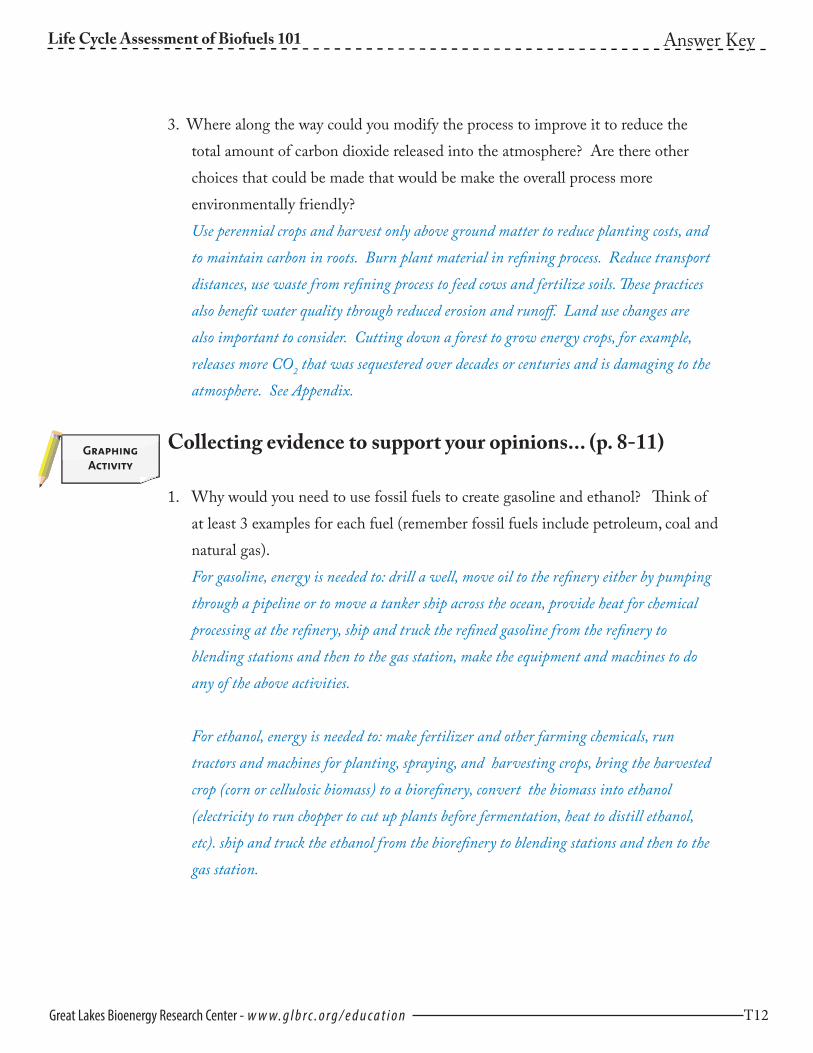
3. Where along the way could you modify the process to improve it to reduce the total amount of carbon dioxide released into the atmosphere? Are there other choices that could be made that would be make the overall process more environmentally friendly?Use perennial crops and harvest only above ground matter to reduce planting costs, and to maintain carbon in roots. Burn plant material in refining process. Reduce transport distances, use waste from refining process to feed cows and fertilize soils. These practices also benefit water quality through reduced erosion and runoff. Land use changes are also important to consider. Cutting down a forest to grow energy crops, for example, releases more CO2 that was sequestered over decades or centuries and is damaging to the atmosphere. See Appendix.
Collecting evidence to support your opinions... (p. 8-11)
1. Why would you need to use fossil fuels to create gasoline and ethanol? Think of at least 3 examples for each fuel (remember fossil fuels include petroleum, coal and natural gas). For gasoline, energy is needed to: drill a well, move oil to the refinery either by pumping through a pipeline or to move a tanker ship across the ocean, provide heat for chemical processing at the refinery, ship and truck the refined gasoline from the refinery to blending stations and then to the gas station, make the equipment and machines to do any of the above activities. For ethanol, energy is needed to: make fertilizer and other farming chemicals, run tractors and machines for planting, spraying, and harvesting crops, bring the harvested crop (corn or cellulosic biomass) to a biorefinery, convert the biomass into ethanol (electricity to run chopper to cut up plants before fermentation, heat to distill ethanol, etc). ship and truck the ethanol from the biorefinery to blending stations and then to the gas station.
GraphingActivity

Great Lakes Bioenergy Research Center - www.g l b rc . o rg / edu ca t i on T13
Answer Key Life Cycle Assessment of Biofuels 101
2. Students complete graph and compare to figure 4.
3. Which fuel do you think will require the greatest amount of energy to manufacture? Why? Answers will vary.
4. Why is the output bar for one fuel source always lower than the input? Inefficiencies of energy conversion. Second law of thermodynamics states that energy systems have a tendency to increase their entropy. Much energy is lost to heat in the conversion processes.
BTU required per BTU of Fuel... (p. 10-11)
1. The dashed line is equivalent to what on figure 3? Energy Output Bars
2. Do the vertical bars represent energy inputs or outputs? Inputs
3. Which fuel currently requires the most BTUs to produce? Cellulosic Ethanol
4. Which fuel requires the least amount of fossil fuels to produce? Cellulosic Ethanol
5. The efficiency on the graphs refers to the amount of energy needed to produce the transportation fuel. Which fuel is most efficient? Gasoline What percent? 81%

Answer KeyLife Cycle Assessment of Biofuels 101
Great Lakes Bioenergy Research Center - www.g l b rc . o rg / edu ca t i on T14
6. If gasoline is most efficient, why would we even consider making ethanol from corn or cellulosic biomass? Because BTUs from combustion of plant material do not contribute to climate change. Biorefineries often burn plant material to create electricity to run the machinery or generate heat to distill the ethanol instead of using coal or natural gas. The CO2 released from combustion of plant material, was recently sequestered from photosynthesis and will be returned to plant material in short time (months or years). BTUs from combustion of fossil fuels cycle over hundreds of millions of years and will remain in the atmosphere.
7. Why is the measurement for corn ethanol almost the same as gasoline? Refer to processes covered in previous section on life cycle assessment. Farming is fossil fuel intensive, as is drilling, refining and transporting petroleum.
8. The bar for corn ethanol includes possible changes in land use to grow additional acres of corn. Is this land use change inevitable? Are there alternatives the United States could consider to prevent land use changes? Many possible answers. Much corn in the US does not directly feed humans, it feeds animals. Ways might found to grow more corn on existing acreage without increasing emissions or erosion. We could reduce demand for transportation fuels dramatically through other lifestyle changes.
Great Lakes Bioenergy Research Center - www.g l b rc . o rg / edu ca t i on T15
Life Cycle Assessment of Biofuels 101
Appendix:
Video Resources:
What is cellulose and how is it used to make ethanol? (Also accessible from the educational materials page on our website.) - A basic, three-minute video that explains the physical properties of cellulose and how it is broken down into smaller molecules of glucose, which can be fermented into ethanol.http://www.vimeo.com/10378252
Converting Biomass to Liquid Fuels - Excellent 5 minute summary of difference between corn and cellulosic ethanol and process currently used to make cellulosic ethanol. Be aware the process discussed here is evolving and may vary from other information sources you read.http://www.nrel.gov/learning/re_biofuels.html
Fields of Energy - From the Minnesota Department of Agriculture, a free DVD with student hosts. Two short segments show how corn ethanol is made and the research into cellulosic ethanol. These two segments are currently available online.http://www.mda.state.mn.us/kids/
Life Cycle of Fuels - An eight-minute video that serves as a primer to some of climate change impacts and sustainability issues associated with producing and using biofuels and fossil fuels. https://vimeo.com/166055834
Text Resources:
Growing Fuel: the Wrong Way, the Right Way. National Geographic. October 2007. 212(4) pg 38-59. - Provides an overview of different ways to make ethanol and provides some life cycle assessment data. Be aware the results of life cycle analyses varies by methodology. The data provided in this article is older than that from the classroom activity, but the fundamentals still apply.http://ngm.nationalgeographic.com/2007/10/biofuels/biofuels-text
Biofuels: An important part of a low-carbon diet. November 2007. P Monahan, Union of Concerned Scientists “Catalyst” publication. Vol 7(2). - Nice overview comparing the carbon contributions of gasoline, ethanol and other possible transportation fuels. Introduces the concept of a life cycle assessment.http://www.ucsusa.org/clean-vehicles/better-biofuels/biofuels-low-carbon-diet#.V1GJZecrKX0
Follow-up resources:
These are all primary source articles by authors who conduct various types of life cycle

Great Lakes Bioenergy Research Center - www.g l b rc . o rg / edu ca t i on T16
Life Cycle Assessment of Biofuels 101
analyses of biofuels. University library permissions may be needed to access full text articles.
Fargione, J., J. Hill, et al. 2008. “Land clearing and the biofuel carbon debt.” Science 319(5867):1235-1238. - Land use for the production of biofuels can have a significant impact on global CO2 emissions and corresponding climate change. The authors of this semi-technical article describe the variation in this effect and detail a global set of biofuel production cases. Of particular interest is a bar graph of nine different biofuel/land use systems and the years needed to repay the corresponding carbon debt for their use. This article is scientifically dense and is likely best for advanced high school or undergraduate students.
Field, C. B., J. E. Campbell, et al. 2008. “Biomass energy: the scale of the potential resource.” Trends in Ecology & Evolution 23(2): 65-72. - For those interested in the food verses fuels debate, this scientific article looks at the global base of abandoned cropland and the corresponding productivity of these areas. This article is scientifically dense and is likely best for advanced high school students.
Hill, J., E. Nelson, et al. 2006. “Environmental, economic, and energetic costs and benefits of biodiesel and ethanol biofuels.” PNAS 103(30): 4. What are the net energy balances, and the energy inputs and outputs for biofuels? - This article details a life-cycle analysis of both corn grain ethanol and soybean biodiesel biofuels. While this article is technical, with some guidance, it should be understandable by high school students.
Hill, J., S. Polasky, et al. 2009. “Climate change and health costs of air emissions from biofuels and gasoline.” PNAS 106(6): 2077-82. - Source of graph in figure 5.
National Renewable Energy Lab. 2006. From Biomass to Biofuels. - Source of graph in figure 4.
Standards:
AAAS PROJECT 2061 (1993):
3C - The Nature of Technology: Issues in Technology4D - The Physical Setting: Structure of Matter4E - The Physical Setting: Energy Transformations5E - The Living Environment: Flow of Matter and Energy8A - The Designed World: Agriculture8C - The Designed World: Energy Sources and Use11A - Common Themes: Systems

Copyright © 2010. All rights reserved. This document may be reproduced for individual classroom use, or the equivalent, only.
All other uses are prohibited without written permission from the Great Lakes Bioenergy Research Center.
www.glbrc.org/[email protected]

Great Lakes Bioenergy Research Center - www.g l b rc . o rg / edu ca t i on 1
Name__________________________________ Date_______________ Hour_______
Thinking About Plants as Transportation Fuel
What have you heard about biofuels, like ethanol, for cars -- are they a good alternative?
Which is a better fuel -- gasoline or ethanol? For each of the criteria below, put a check under what you believe is the best answer.
Gasoline EthanolEnergy per gallon/Miles per gallon
Energy required to produce a gallon
Carbon dioxide (CO2) emissions
For the environment
Amount available
To create ethanol, sugars in plant biomass (the leaves, stems, and other plant parts) are harvested and converted into fuel (C2H5OH).
Based on what you know, check the statement(s) with which you agree. � CO2 is released when ethanol is produced from plant biomass. � Creating ethanol from plant biomass is carbon neutral*. � Creating ethanol from plant biomass contributes to climate change.
Create a drawing or cycle that explains the production of ethanol from plant biomass. Show the movement of carbon or carbon dioxide from location to location as best you can.
* Carbon-neutral implies that the amount of carbon dioxide released into the atmosphere equals the amount taken up by plants during photosynthesis.

Great Lakes Bioenergy Research Center - www.g l b rc . o rg / edu ca t i on
Discuss your answers with others. Were there any questions that were hard to answer? Why? What additional information would you need to decide? Take notes on agreements, disagree-ments and questions that remain after your discussion.
Agreements, Disagreements, and QuestionsEnergy per gallon/Miles per gallon
Energy Required to produce a gallon
Carbon dioxide emissions
For environment
Amount available
Creating ethanol from plant biomass is carbon neutral
Creating ethanol from plant biomass contributes to global warming
CO2 is released to produce ethanol from plants

Great Lakes Bioenergy Research Center - www.g l b rc . o rg / edu ca t i on 3
Life
Cyc
le A
sses
smen
t Pro
cess
Too
l
Follo
w-up
que
stion
s:1.
Wha
t is t
he re
latio
nshi
p be
twee
n th
e mat
ter o
utpu
t fro
m #
3 to
the m
atte
r inp
ut in
#1?
2. D
oes a
ll en
ergy
put
into
#1
mak
e it t
o th
e ene
rgy
outp
ut st
age o
f #3?
Why
or w
hy n
ot?
3. If
we a
re co
nduc
ting
a life
cycle
asse
ssm
ent f
or en
ergy
or g
reen
hous
e gas
es, l
ike c
arbo
n di
oxid
e, wh
y ca
n’t w
e sto
p at
sta
ges 1
-3?
Why
do
we n
eed
to in
clude
stag
es 4
-7 as
well
?
Ener
gy In
put
Ener
gy O
utpu
t
Matt
er In
put
Matt
er O
utpu
t
Whe
re:
Fiel
d
Proc
ess:
Ph
otos
ynth
esis
Ener
gy O
utpu
tEn
ergy
Inpu
t
Matt
er O
utpu
tM
atter
Inpu
t
Whe
re:
Car
Proc
ess:
En
ergy
Out
put
Matt
er O
utpu
t
Whe
re: Re
finery
Proc
ess:
Ferm
entation
Matt
er Outp
ut
Matt
er Outp
ut
Energy O
utput
1
32
Matt
er Input
Oxygen
Prim
ary
steps
to cr
eate
bio
fuel.
Dem
onstr
ate t
he fl
ow o
f ene
rgy
and
mat
ter t
hrou
gh th
is sy
stem
to m
ake e
than
ol.
Ent
er th
e cor
rect
ener
gy in
put a
nd o
utpu
t ab
ove t
he w
avy
lines
and
mat
ter i
nput
and
outp
ut ab
ove t
he st
raig
ht li
nes.
Pay
atte
ntio
n to
stag
es w
ith m
ore a
rrows
than
the
othe
rs.
Det
erm
ine w
hich
inpu
ts an
d ou
tput
s sta
y in
the s
yste
m an
d wh
ich “e
scap
e.” Th
e firs
t pag
e fol
lows
the e
nerg
y fro
m th
e fie
ld to
the r
efine
ry to
your
car.
The s
econ
d pa
ge sh
ows a
dditi
onal
inpu
ts ne
eded
to cr
eate
the f
uel.
Fill
in th
e “pr
oces
s” oc
cur-
ring
at an
y sta
ge w
here
it is
not
fille
d in
for y
ou.
Great Lakes Bioenergy Research Center - www.g l b rc . o rg / edu ca t i on
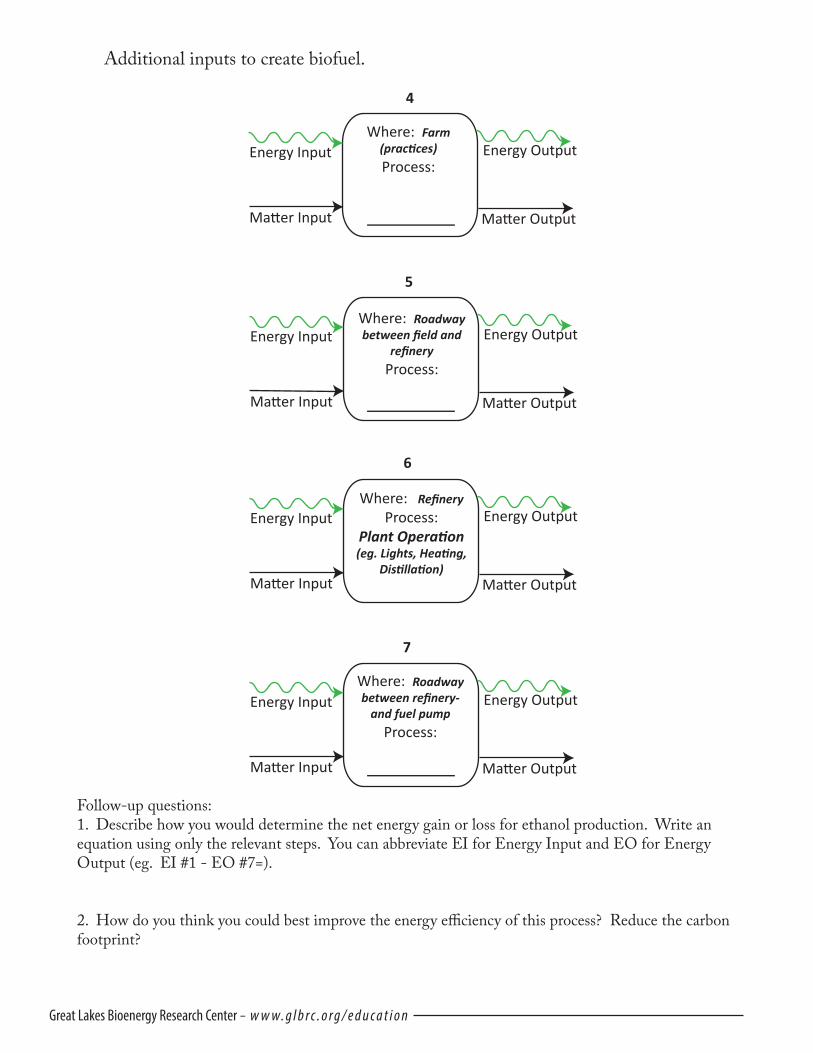
Follow-up questions:1. Describe how you would determine the net energy gain or loss for ethanol production. Write an equation using only the relevant steps. You can abbreviate EI for Energy Input and EO for Energy Output (eg. EI #1 - EO #7=).
2. How do you think you could best improve the energy efficiency of this process? Reduce the carbon footprint?
Additional inputs to create biofuel.
Energy Input Energy Output
Matter Input Matter Output
Where: Farm (practices)
Process:
Energy Input Energy Output
Matter Input Matter Output
Energy Input Energy Output
Matter Input Matter Output
Energy Input Energy Output
Matter Input Matter Output
Where: Roadway between field and
refinery
Process:
Where: Refinery
Process: Plant Operation (eg. Lights, Heating,
Distillation)
Where: Roadway between refinery-
and fuel pump
Process:
4
5
6
7

Great Lakes Bioenergy Research Center - www.g l b rc . o rg / edu ca t i on 5
Life Cycle Assessment In order to compare the environmental consequences from using different fuels, scientists conduct what is called a life cycle assessment (LCA). In a bioenergy LCA they look at all of the steps along the way--from planting a crop, to harvesting, to transporting it, to refining to vehicle use. One measurement in an LCA determines the amount of energy used or produced at each step (Figure 1). They also calculate greenhouse gas emissions through the cycle to see, for example, where carbon dioxide is taken in by plants or emitted from combustion (Figure 2).
Glossary of select terms for Life Cycle Assessment
Feedstock—the plants or waste products (corn grain, corn stover, switchgrass, sugar cane, wood chips, etc) used to create biofuels such as ethanol, or other industrial chemicals.
Refining—the process of transforming the plant material into fuel. This may include physical and chemical changes to the plant material, fermentation and distillation.
Sequester—to remove gases from the atmosphere (in our case carbon dioxide) and transform it via photosynthesis in the plant into carbohydrates, which can be stored.
Transport—moving raw materials or finished products from point to point
Figure 1—Life Cycle Assessment of Energy for Ethanol Production and Consumption.
Where is the energy put into this cycle?
In what form?
How is energy used in the cycle?
Name______________________________ Date________________ Hour__________
Energy In
vs
Energy OutCar
Plants
Product Transport
Refining
Feedstock Transport
Farming Practices

Great Lakes Bioenergy Research Center - www.g l b rc . o rg / edu ca t i on
Figure 2--Life Cycle Assessment of Carbon Dioxide for Ethanol Production and Consumption.
Steps: Carbon Sequestered or Released?
Form of carbon(from__ to__)
How or why? (Photosynthesis,
cellular respiration, combustion)
Planting crop Released Gasoline to CO2 Combustion
1. Try your own life cycle assessment. Calculating these amounts can be very tricky. There are many steps along the way to measure and/or estimate what is happening. For the chart below, consider only carbon dioxide. Work through the qualitative steps of a life cycle assessment, beginning with planting the crop. Decide if CO2 is sequestered or released in each of these steps. Explain how or why for each step (photosynthesis, cel-lular respiration, combustion).
How does CO2 enter this cycle?
Where is CO2 released in the cycle?
Carbon In
vs
Carbon OutCar
Plants
Product Transport
Refining
Feedstock Transport
Farming Practices

Great Lakes Bioenergy Research Center - www.g l b rc . o rg / edu ca t i on 7
2. In order for ethanol production to be carbon neutral, what would need to happen?
3. Where along the way could you modify the system to reduce the total amount of carbon dioxide released into the atmosphere? What other measurements should be made in a bioenergy life cycle assessment? Are there other choices that could be made that would make the system less damaging to the environment?
Great Lakes Bioenergy Research Center - www.g l b rc . o rg / edu ca t i on
Collecting evidence to support your opinions...
It takes energy to convert fuels to a usable form. The Life Cycle Assessment gives you an idea of the full spectrum of energy inputs needed to make ethanol. The same assessments are done for gasoline and other fuels. In this section, you will estimate the quantity of energy needed to produce gasoline, corn ethanol, and cellulosic ethanol and then look at one set of results calculated by engineers who work in this field.
1. Why would you need to use fossil fuels to create gasoline and ethanol? Think of at least 3 examples for each fuel (remember fossil fuels include petroleum, coal and natural gas).
2. Estimating energy inputs. The graph on the next page (figure 3) is incomplete. The solidbars show the energy output (useable fuel) obtained from 1 BTU of gasoline, corn ethanol and cellulosic ethanol. (Btu is a British Thermal Unit = amount of heat energy needed to raise the temperature of one pound of water by one degree F.) To the right of each energy output measurement is an incomplete bar, showing the energy inputs needed to produce that fuel.
Name______________________________ Date________________ Hour__________

Great Lakes Bioenergy Research Center - www.g l b rc . o rg / edu ca t i on 9
Name______________________________ Date________________ Hour__________
Complete the graph.• First, fill in the blank dashed input bars with the raw material needed to create one BTU of each
fuel. • Second, stack additional energy inputs above the raw material to indicate the energy needs to
produce each fuel. Use your list from question 1 for ideas and estimate the amount of energy needed from each source as you add it to the stack. Gasoline is started for you.
Figure 3
3. Which fuel do you think will require the greatest amount of energy to manufacture? Why?
4. Why is the output bar for one fuel source always lower than the input?

Great Lakes Bioenergy Research Center - www.g l b rc . o rg / edu ca t i on
Compare your graph to Figure 4, which was taken from a document from the National Renewable Energy Lab. Take some time to interpret this graph.
Adapted from NREL 2006. Biomass to biofuels.
1. The dashed line is equivalent to what on figure 3? _______________________________
2. Do the vertical bars represent energy inputs or outputs? ___________________________
3. Which fuel currently requires the most BTUs to produce? _________________________
4. Which fuel requires the least amount of fossil fuels to produce? _____________________
5. The efficiency above each bar refers to the amount of energy needed to produce the
transportation fuel. Which fuel is most efficient? ____________ What percent? _______
6. If gasoline is most efficient, why would we even consider making ethanol from corn or
cellulosic biomass?
Figure 4

Great Lakes Bioenergy Research Center - www.g l b rc . o rg / edu ca t i on 11
Now take a look at some results of a life cycle assessment of greenhouse gases. Note that estimates of emis-sions from both corn and cellulosic ethanol are highly variable depending upon where and how the crop is grown, as well as the crop choice for cellulosic ethanol.
7. Why is the measurement for corn ethanol almost the same as gasoline?
8. The bar for corn ethanol includes possible changes in land use to grow additional acres of corn. Is this land use change inevitable? Are there alternatives the United States could consider to prevent land use changes?
9. Revisit your choices on page one. Do you still hold the same opinion? Explain which transportation fuel you think is most sustainable. What have you learned in this activity to either change your mind or support your original position? (Write your answer on the back of this page.)
Figure 5
Adapted from Hill et al. 2009. PNAS. Production estimate per one billion gallons of fuel to meet US demand. Corn ethanol refinery uses natural gas. Boxed area on corn ethanol indicates emissions estimate if previously unfarmed land is plowed to grow more corn. Cellulosic ethanol refinery uses switchgrass. Dollar amounts were calculated from prices from carbon mitigation costs, carbon market, and social costs.