Embed Size (px)
Citation preview

Life cycle assessment of shredder residue management Environmental project No. 1814, 2015

2 Life cycle assessment of shredder residue management
Title:
Life cycle assessment of shredder residue
management
Editing:
Alessio Boldrin, Anders Damgaard, Line Kai-Sørensen Brogaard and
Thomas Fruergaard Astrup
Published by:
The Danish Environmental Protection Agency
Strandgade 29
1401 Copenhagen K
Denmark
www.mst.dk/english
Year:
2015
ISBN no.
978-87-93435-11-7
Disclaimer:
When the occasion arises, the Danish Environmental Protection Agency will publish reports and papers concerning
research and development projects within the environmental sector, financed by study grants provided by the Danish
Environmental Protection Agency. It should be noted that such publications do not necessarily reflect the position or
opinion of the Danish Environmental Protection Agency.
However, publication does indicate that, in the opinion of the Danish Environmental Protection Agency, the content
represents an important contribution to the debate surrounding Danish environmental policy.
Sources must be acknowledged.

Life cycle assessment of shredder residue management 3
Contents
Preface ...................................................................................................................... 5
Summary and conclusion .......................................................................................... 6
Sammenfatning og konklusion ................................................................................ 10
List of abbreviations ................................................................................................ 14
1. Introduction ..................................................................................................... 15 1.1 Background ........................................................................................................................... 15 1.2 Objectives of the project ....................................................................................................... 15 1.3 Existing LCA studies ............................................................................................................. 15
2. Scope and design of the LCA .............................................................................. 17 2.1 General principles ................................................................................................................. 17 2.2 The functional unit ............................................................................................................... 17 2.3 System boundaries ................................................................................................................ 17 2.4 Allocation/system expansion ............................................................................................... 18 2.5 Environmental impact categories, LCIA methods and interpretation of the results ......... 18 2.6 The EASETECH Life Cycle Assessment Tool....................................................................... 19
2.6.1 Uncertainty calculations ....................................................................................... 20 2.7 Data needs ............................................................................................................................ 20
2.7.1 Material composition ............................................................................................ 20 2.7.2 Treatment of shredder residues ........................................................................... 20
2.8 Non-quantitative assessments ............................................................................................ 20 2.9 Limitations ........................................................................................................................... 20 2.10 Requirements for data quality ............................................................................................. 20 2.11 Process regarding critical review .......................................................................................... 21 2.12 Report format ........................................................................................................................ 21 2.13 Timeframe ............................................................................................................................. 21
3. Scenarios and composition of shredder residues .............................................. 22 3.1 Scenarios .............................................................................................................................. 22 3.2 Composition of shredder residues ...................................................................................... 24
4. Life cycle inventories ........................................................................................ 27 4.1 Inventories for treatment processes ................................................................................... 27
4.1.1 LCI of SR sorting ................................................................................................... 27 4.1.2 LCI of SR combustion at a waste incinerator plant ............................................. 28 4.1.3 LCI of pyrolysis of SR ............................................................................................. 31 4.1.4 LCI of disposal of SR in landfill ............................................................................ 32 4.1.5 LCI of co-combustion of SR in a cement kiln ...................................................... 35 4.1.6 LCI of the biological treatment of SR before disposal in a landfill ......................37
4.2 Marginal energy production .................................................................................................37 4.3 Selection of datasets for the primary production and recycling of materials.................... 38 4.4 Quality Indicator Values for processes used in the LCA .................................................... 39
5. Evaluation of potential environmental impacts ................................................. 40 5.1 Total potential environmental impacts ............................................................................... 40

4 Life cycle assessment of shredder residue management
5.1.1 Conclusions regarding total potential environmental impacts ........................... 43 5.2 Potential environmental impacts by process ...................................................................... 44
5.2.1 Scenario 1............................................................................................................... 44 5.2.2 Scenario 2 .............................................................................................................. 45 5.2.3 Scenario 3 .............................................................................................................. 46 5.2.4 Scenario 4 .............................................................................................................. 47 5.2.5 Conclusions regarding potential environmental impacts by process ................. 48
5.3 Potential environmental impacts by material fraction ...................................................... 48 5.4 Sensitivity analysis ............................................................................................................... 49
5.4.1 Sensitivity analysis of total potential environmental impacts ............................ 49
6. Overall conclusions .......................................................................................... 52
References .............................................................................................................. 53 Appendix 1: List of processes from databases used in the LCA ................................ 58 Appendix 2: Chemical composition of newly produced shredder residues .............. 59 Appendix 3: LCI of combustion of SR at a waste incinerator .................................... 65 Appendix 4: LCI of pyrolysis of SR .............................................................................. 71 Appendix 5: LCI of disposal of SR in landfill ............................................................. 82 Appendix 6: LCI of co-combustion of SR in a cement kiln ........................................ 85 Appendix 7: Inventory datasets .................................................................................. 87 Appendix 8: Evaluation of the potential environmental impacts ............................. 90 Appendix 9: Review report from Teknologisk Institut .............................................. 97

Life cycle assessment of shredder residue management 5
Preface
This report provides a life-cycle assessment (LCA) of the treatment of shredder residue (SR) in
Denmark.
The LCA was conducted for the Environmental Protection Agency by DTU Environment in the
period March-July 2014, as part of a service agreement between the Danish Environmental
Protection Agency and the Technical University of Denmark on research-based services in the field
of waste management. The report is part of a larger survey on improved resource recovery of waste,
focusing on the environmental as well as socio-economic consequences of different treatment
scenarios for shredder waste, impregnated wood waste, wood waste for recycling and district
heating pipes. The LCA was conducted using the EASETECH LCA model developed by DTU
Environment for the environmental assessment of waste management systems and environmental
technologies.
The LCA was conducted in accordance with the LCA principles outlined in DS/EN ISO standards
14040 and 14044. A critical review was carried out by external LCA experts from the Danish
Technological Institute. A reference group consisting of Danish stakeholders with interests in SR
management were asked to comment on the report as well. All critical comments from reference
group and LCA reviewer were followed and the report was changed accordingly.
The Danish stakeholders were represented by the Innovation Partnership for Shredder Waste,
whose head of secretariat is Jette Bjerre Hansen, DAKOFA.
The Danish Environmental Protection Agency was represented by Trine Leth Kølby and Thilde
Fruergaard Astrup.
The report was prepared by Alessio Boldrin, Line Kai-Sørensen Brogaard, Anders Damgaard and
Thomas Astrup from DTU Environment.
DTU 2014

6 Life cycle assessment of shredder residue management
Summary and conclusion
Background
Shredder residue (SR) is the “residual fraction from mechanical shredding of metal containing
scrap originating from different sources and processed at recycling stations or metal recovery
businesses” (Hyks et al., 2014). Danish SR is typically a mixture of 20% automotive shredder
residues (ASR) and 80% of other residues originating from different sources (e.g. white goods,
dismantled boats, industrial bulky waste, metal scrap). SR is currently disposed of in hazardous
waste landfills in Denmark; however, legislative and economic issues mandate exploring alternative
solutions for its management.
Introduction
The present report was prepared by DTU Environment and includes a life cycle assessment (LCA) of
the treatment of SR in Denmark. The assessment compares the potential environmental impacts
and depletion of abiotic resources in relation to four alternative scenarios, all including the sorting
of recyclables and the management of residual material through thermal treatment and/or disposal
in controlled landfills after biological stabilisation.
Method
The consequential LCA was carried out according to ISO standards 14040 and 14044, while the
choice of life cycle impact assessment (LCIA) methods and impact categories followed the
recommendations set out in the International Reference Life Cycle Data System ILCD handbook
‘Recommendations for Life Cycle Impact Assessment in the European context’ (JRC, 2011). System
expansion was used to solve process multi-functionality and to credit production avoided through
reuse, recycling and recovery. The LCA was carried out using the EASETECH model developed at
the Technical University of Denmark. Uncertainty calculations were carried out via Monte Carlo
simulation, using 10,000 random variables to calculate the uncertainty distribution of the results.
Scenarios
Four scenarios for the treatment of SR were analysed. All scenarios included the sorting of
recyclables (i.e. glass, plastic and metals) and the landfilling of fine residues <4 mm, which were
assumed not suitable for thermal treatment because of their high content of heavy metals.
Individual scenarios then included alternative treatment of the >4 mm residue remaining after
sorting of recyclable materials: landfilling in Scenario 1 (S1), co-combustion at a waste incineration
plant in Scenario 2 (S2), pyrolysis in Scenario 3 (S3), and co-combustion in a cement kiln in
Scenario 4 (S4).
Inventory data
Inventory datasets regarding SR composition and treatment technologies were developed mostly
based on literature data (i.e. reports and scientific articles) and information received from
stakeholders, while data on background processes (e.g. energy production, raw material
production) were retrieved mainly from commercially available LCA databases (e.g. Ecoinvent and
ELCD). All datasets were associated with (at least some degree of) variations, a point which was
taken into consideration when performing the uncertainty analysis. Other important assumptions
included: sorting efficiency at the sorting plants, the degree of oxidation of metals after thermal
treatment, the quality of recyclables, the quality of substituted materials, emissions from the
thermal processes and marginal energy production. The latter was the focus of the sensitivity

Life cycle assessment of shredder residue management 7
analysis, where alternative marginal electricity production processes were used to test the validity of
the results in possible future energy scenarios.
Results
The handling of SR according to Scenario 1 (landfill) shows overall savings for Global Warming,
Photochemical Oxidant Formation and Terrestrial Eutrophication, mostly because of the benefits
associated with recovering and recycling plastic and aluminium fractions. For all non-toxic impact
categories and within uncertainty, scenarios with increased energy recovery (i.e. S2-incineration
and S4-cement kiln) from SR >4 mm show significantly better environmental performance
compared with the baseline landfill-based scenario (i.e. S1), indicating that increased energy
recovery is a desirable option for the non-toxic categories.
The results for the pyrolysis scenario (i.e. S3) are associated with significant uncertainty, mostly
owing to the fact that the dataset for SR pyrolysis included rather broad ranges of data. This
suggests that a clear conclusion on the environmental sustainability of pyrolysis as a treatment
technology for SR is not possible with currently available data and understanding of the process.
This means that further experimental investigations are needed before it can be concluded whether
pyrolysis is a possible treatment technology for SR.
Figure A - Normalised potential non-toxic impact from treatment of 1 ton SR in the four assessed scenarios (PE = person equivalent), including min-max ranges.
Results for the potential toxic impacts show that the four analysed scenarios have comparable
profiles for the impact categories Human Toxicity Carcinogenic, Particulate Matter and Ionizing
Radiation. The three scenarios including the thermal treatment of >4 mm fractions all show
increasing potential impacts on Human Toxicity non-Carcinogenic and Ecotoxicity compared with
the baseline scenarios, owing to increases in emissions into the air, specifically As and Hg. In
particular, the scenario based on co-combustion of >4mm in cement kiln (i.e. S4) presents potential
impacts on Human Toxicity non-Carcinogenic and Ecotoxicity which are far larger than the other
scenarios, owing particularly to emissions into the air of Cu, Hg and Zn. Compared to other
technologies, these large impacts are connected with greater emissions, owing to less efficient flue
gas cleaning at the cement plant and higher volatility of these metals due to higher temperature in
the kiln. Such findings indicate the need for a pre-treatment step to produce an SR feedstock for the
cement kiln with an RDF-like composition with a significantly lower content of metals.
-0.15
-0.1
-0.05
0
0.05
0.1
0.15
0.2
S1 S2 S3 S4 S1 S2 S3 S4 S1 S2 S3 S4 S1 S2 S3 S4 S1 S2 S3 S4 S1 S2 S3 S4 S1 S2 S3 S4
Global Warming Stratosphericozone depletion
Photochemicaloxidant form.
Terrestrialacidification
Terrestrialeutrophication
Freshwatereutrophication
Marineeutrophication
Imp
ac
t P
ote
nti
als
(P
E/t
on
SR
)
Normalised Environmental Impact Potentials Non-toxic Categories
min max mean

8 Life cycle assessment of shredder residue management
Figure B - Normalised potential toxic impact from treatment of 1 ton SR in the four assessed scenarios (PE = person equivalent), including min-max ranges.
When analysing the results by only looking at unitary input (i.e. 1 ton) of individual material
fractions, normalised potential impacts on Global Warming indicate that recycling of both ferrous
and non-ferrous metals provides the greatest savings, and it should thus be the first priority when
analysing and designing a management scheme for SR. The next material is plastic, which can
provide significant savings, especially if different resins are effectively sorted and the least possible
amount of cross-contamination is achieved.
Figure C - Normalised potential impact on Global Warming in the four assessed scenarios, disaggregated according to individual material fractions and presented as per 1 ton of material (PE = person equivalent).
Sensitivity analysis
-0.5
-0.4
-0.3
-0.2
-0.1
0
0.1
0.2
0.3
0.4
0.5
S1 S2 S3 S4 S1 S2* S3 S4 ** S1 S2 S3 S4 S1 S2 S3 S4 S1 S2 S3* S4 **
HuTox, carcinogenic HuTox, non-carcinogenic
Particulate matter Ionising radiation EcoTox
Imp
ac
t P
ote
nti
als
(P
E/t
on
SR
)Normalised Environmental Impact Potentials
Toxic Categories
min max mean* divided by 10** divided by 100
4.6 2.9* 2.2** 1.2* 2.7**
-0.5
-0.4
-0.3
-0.2
-0.1
0
0.1
0.2
S1 S2 S3 S4 S1 S2 S3 S4 S1 S2 S3 S4 S1 S2 S3 S4 S1 S2 S3 S4 S1 S2 S3 S4
Mixed SR Glass Plastic Nfe metals Fe metals >4 mm
Imp
ac
t P
ote
nti
als
(P
E/t
on
ma
ter
ial)
Normalised Environmental Impact PotentialsGlobal Warming Impact Category
min max mean

Life cycle assessment of shredder residue management 9
Sensitivity analysis was employed to test the influence of Danish marginal electricity production on
the results, including possible future electricity production sources such as natural gas and wind,
instead of coal. The results show that changes to marginal electricity production do not affect the
ranking of scenarios in most impact categories, while absolute values for potential impacts were
diminished, especially regarding savings from recycling processes and energy recovery.
The only exception was found in the Global Warming category, where scenario ranking was actually
affected by marginal electricity technology. In fact, when offsetting natural gas, incineration
provides similar savings to landfilling, while the scenario based on pyrolysis is close to not offering a
net saving at all. When considering wind power as a marginal electricity production source, both
scenarios based on incineration and pyrolysis showed worse performance than the scenario based
on landfilling.
Conclusion
Based on data and current knowledge:
Diverting SR >4 mm from landfill provides benefits from an environmental perspective and
should thus be supported.
Sorting and recycling metals, plastics and glass are beneficial to the environment and should
thus be continued. Special focus should be given to increasing metal recovery, as this provides
the greatest environmental benefits.
Incineration seems currently the best option for the treatment of >4 mm residues.
Pyrolysis seems to have worse energy efficiency but better downstream metal recovery (i.e.
from the residues) than incineration. However, a clear conclusion could not be drawn, because
results for pyrolysis were associated with significant uncertainty, owing to the lack of precise
inventory data describing the process. Thus, any decision regarding the implementation of
pyrolysis for treating >4 mm SR fractions should first be supported by pilot- to full-scale tests
of the process, to deliver a better understanding thereof.
The co-combustion of >4 mm fractions in a cement kiln could potentially provide significant
savings for the Global Warming impact category. However, the current composition of the >4
mm fractions is not suitable, meaning that co-combustion in a cement kiln could only be
implemented with a specially designed fraction. This option, in practice, would need a pre-
treatment step to produce a feedstock with an RDF-like composition. This should especially
include the additional screening and sorting of metals, to reduce the content of heavy metals in
feedstock going into the kiln. Besides technical reasons, this would also result in a significant
decrease in emissions into the air of heavy metals, which are largely responsible (especially Cu
and Zn) for high potential impacts reported for some of the impact categories.
Pre-treatment of the >4 mm SR should be considered, in order to reduce the content of heavy
metals (especially Cu and Zn) in material fed into thermal processes.
The results and recommendations are not significantly affected by the choice of the marginal
technology, meaning they may still be valid within a different future energy system.
10 Life cycle assessment of shredder residue management
Sammenfatning og konklusion
Baggrund
Shredderaffald (Shredder residues - SR) er restfraktionen fra mekanisk sønderdeling af metalskrot
som stammer fra forskellige kilder der indsamles på genbrugsstationer eller direkte hos
metalforarbejdningsvirksomheder. Inden den mekaniske shredding, udsorteres først alle de dele
der kan sendes direkte til genanvendelse og genbrug. Dansk SR er typisk en blanding af 20%
shredded bilskrot (ASR) og 80% der stammer fra forskellige andre kilder (f.eks. hårde hvidevarer,
demonterede både, industrielt storskrald og andet skrot). SR er i øjeblikket kategoriseret som farligt
affald i Danmark og deponeres derfor, men lovgivningsmæssige og økonomiske forhold giver
mulighed for at undersøge alternative løsninger til håndtering af SR.
Indledning
Nærværende rapport er udarbejdet af DTU Miljø og omfatter en livscyklusvurdering (LCA) af
behandling af shredderaffald (SR) i Danmark. Vurderingen sammenligner de potentielle
miljøpåvirkninger og forbug af abiotiske ressourcer i forbindelse med fire alternative scenarier, der
alle inkluderer sortering af genanvendelige materialer og forvaltning af restmaterialer ved termisk
behandling og / eller slutdeponering efter biologisk stabilisering.
Metode
Konsekvens LCA´en blev udført i henhold til ISO-standard 14040 og 14044, mens valget af LCIA
metoder og påvirkningskategorier fulgte anbefalingerne i ILCD Håndbogen " Recommendations for
Life Cycle Impact Assessment in the European context " (JRC, 2011). Systemudvidelse blev brugt til
at vurdere multifunktionelle processer og til at godskrive undgået produktion ved genanvendelse,
genvinding og nyttiggørelse. LCA´en blev udført ved hjælp af modellen EASETECH, som er udviklet
på Danmarks Tekniske Universitet. Usikkerhedsberegningerne blev foretaget vha. Monte Carlo
simulering med 10000 stokastiske variable til at beregne usikkerhedsfordelingen af resultaterne.
Scenarier
Fire scenarier til behandling af SR blev analyseret. Alle scenarier inkluderede sortering af
genanvendelige materialer (dvs. glas, plast og metal) og deponering af fint restaffald (<4 mm), som
er uegnet til termisk behandling på grund af dets høje indhold af tungmetaller. De enkelte scenarier
inkluderede forskellig behandling af restfraktionen >4 mm, som var tilbage efter sortering af
genanvendelige materialer. De 4 behandlingstyper for restfraktionen var: deponering i Scenarie 1
(S1), medforbrænding på et affaldsforbrændingsanlæg i Scenarie 2 (S2), pyrolyse i Scenarie 3 (S3),
og medforbrænding i en cementovn i Scenarie 4 (S4).
Livscyklusopgørelser
Datasæt vedrørende SR sammensætning og behandlingsteknologier blev hovedsageligt sammensat
baseret på data fra litteraturen (dvs. rapporter og videnskabelige artikler), og oplysninger fra
partnerskabet for projektet, mens data om baggrundsprocesser (f.eks. energiproduktion,
råvareproduktion) hovedsageligt blev hentet fra kommercielt tilgængelige LCA-databaser (f.eks.
Ecoinvent og ELCD). Alle datasæt havde en grad af variation, som blev taget i betragtning med de
udførte usikkerhedsanalyser. Andre vigtige antagelser omfattede: sorteringseffektiviteten på
sorteringsanlægget, graden af oxidation af metallerne efter termisk behandling, kvaliteten af
materialer sendt til genanvendelse, kvaliteten af de substituerede materialer, emissioner fra
termiske processer og den marginale energiproduktion. Sidstnævnte var fokus for en

Life cycle assessment of shredder residue management 11
følsomhedsanalyse, hvor alternative marginale el-produktioner blev brugt til at teste validiteten af
resultaterne i mulige fremtidige energi-scenarier.
Resultater
Håndteringen af SR i Scenarie 1 (deponi) viser at der er besparelser i kategorierne Global
Opvarmning, Fotokemisk Ozondannelse og Terrestrisk Eutrofiering, hvilket hovedsagelig skyldes
besparelser forbundet med genindvinding og genbrug af plast- og aluminiums-fraktionerne. For alle
ikke-toksiske påvirkningskategorier og inden for en margin af usikkerhed, findes det at scenarier
med øget energiudnyttelse (dvs. S2-forbrænding og S4-cementovne) for SR >4 mm giver signifikant
bedre miljøresultater sammenlignet med det deponi-baserede basisscenarie (dvs. S1). Dette
indikerer at øget energigenvinding er en oplagt mulighed for de ikke-toksiske kategorier.
Resultaterne for pyrolyse scenariet (dvs. S3) er forbundet med betydelig usikkerhed, mest på grund
af det faktum, at datasættet for SR pyrolyse inkluderer temmelig store intervaller af data. Dette
peger på, at en klar konklusion ang. den miljømæssige bæredygtighed af pyrolyse som en
behandlingsteknologi til SR ikke er mulig, med de tilgængelige data og viden omkring processen.
Dette betyder, at der er behov for yderligere eksperimentelle undersøgelser, før det kan konkluderes
om pyrolyse kan være en mulig behandlingsteknologi for SR.
Figur A - Normaliserede potentielle ikke-toksiske miljøpåvirkninger fra behandling af 1 ton SR i de fire vurderede scenarier (PE = person ækvivalent), min-max intervaller er inkluderet i figuren.
Resultaterne for de potentielle toksiske påvirkninger viser, at de fire analyserede scenarier har
sammenlignelige profiler for påvirkningskategorierne Humantoksicitet (kræftfremkaldende),
Partikler og Ioniserende Stråling. De tre scenarier, herunder termisk behandling af >4 mm
fraktionen viser øgede potentielle påvirkninger for kategorierne Humantoksicitet (ikke-
kræftfremkaldende) og Økotoksicitet sammenlignet med de grundlæggende scenarier, som følge af
stigninger i emissionerne til luften, navnlig As og Hg. Scenariet baseret på medforbrænding af >4
mm SR i cementovn (dvs. S4) bidrager med potentielle påvirkninger til Humantoksicitet (ikke-
kræftfremkaldende) og Økotoksicitet, der er langt større end de øvrige scenarier især på grund
emissioner til luften af Cu, Hg og Zn. De øgede påvirkninger skyldes mindre effektiv røggasrensning
på cementfabrikken. Dette forværres yderligere af at disse stoffer er mere flygtige i cement
processen grundet de højere temperaturer, hvilket gør at der er væsentlige højere udledninger.
-0.15
-0.1
-0.05
0
0.05
0.1
0.15
0.2
S1 S2 S3 S4 S1 S2 S3 S4 S1 S2 S3 S4 S1 S2 S3 S4 S1 S2 S3 S4 S1 S2 S3 S4 S1 S2 S3 S4
GlobalOpvarmning
StratosfæriskOzonnedbrydning
FotokemiskOzondannelse
Forsuring Eutrofiering FerskvandEutrofiering
MarineEutrofiering
På
vir
kn
ing
sp
ote
nti
ale
r (
PE
/to
n S
R)
Normaliserede Miljøpåvirkingspotentialer Ikke-toksiske Kategorier
min max mean

12 Life cycle assessment of shredder residue management
Grundet den høje påvirkning fra metallerne, er der behov for forbehandling af SR for at producere
en råvare til cementovne med en RDF-lignende sammensætning, med et lavere metalindhold.
Figur B - Normaliserede potentielle toksiske miljøpåvirkninger fra behandling af 1 ton SR i de fire vurderede scenarier (PE = person ækvivalent), min-max intervaller er inkluderet i figuren.
Figur C - Normaliserede potentielle påvirkninger for Global Opvarmning for de fire opstillede scenarier, opdelt efter de enkelte materialer og præsenteret per 1 ton materiale (PE = person ækvivalent).
Hvis man i stedet ser på en enkelt fraktion (dvs. 1 ton af de enkelte materialefraktioner), viser de
normaliserede potentielle påvirkninger i forhold til Global Opvarmning, at genanvendelse af
magnetiske og ikke-magnetiske metaller giver de største besparelser, og det bør derfor være første
prioritet at udsortere disse, ved planlægning af håndteringen af SR. Efter metallerne er plast et
materiale som kan give betydelige besparelser, især hvis forskellige plastiktyper effektivt udsorteres
og den mindst mulige mængde af krydskontaminering opnås.
-0.5
-0.4
-0.3
-0.2
-0.1
0
0.1
0.2
0.3
0.4
0.5
S1 S2 S3 S4 S1 S2* S3 S4 ** S1 S2 S3 S4 S1 S2 S3 S4 S1 S2 S3* S4 **
Humantoksicitet,cancer
Humantoksicitet,ikke-cancer
Partikler IoniserendeStråling
Økotoksicitet
På
vir
kn
ing
sp
ote
nti
ale
r (
PE
/to
n S
R)
Normaliserede Miljøpåvirkingspotentialer Toksiske Kategorier
min max mean* divideret med 10** divideret med 100
4.6 2.9* 2.2** 1.2* 2.7**
-0.5
-0.4
-0.3
-0.2
-0.1
0
0.1
0.2
S1 S2 S3 S4 S1 S2 S3 S4 S1 S2 S3 S4 S1 S2 S3 S4 S1 S2 S3 S4 S1 S2 S3 S4
Mixed SR Glas Plast Ikke-jern metaller Jern metaller >4 mm
På
vir
kn
ing
sp
ote
nti
ale
r (
PE
/to
n m
ate
ria
le)
Normaliserede Miljøpåvirkingspotentialer Global Opvarmning
min max mean

Life cycle assessment of shredder residue management 13
Følsomhedsanalyse
Følsomhedsanalyser blev brugt til at teste indflydelsen af den danske marginale elproduktion på
resultaterne, herunder eventuelle fremtidige energikilder til elproduktion, såsom naturgas og vind, i
stedet for kul. Resultaterne viser, at ændringen af den marginale elproduktion ikke påvirker
rangordenen af scenarier i de fleste påvirkningskategorier, mens absolutte værdier for potentielle
påvirkninger blev mindsket, især med hensyn til besparelserne fra genbrugsprocesser og
energiudnyttelse.
Den eneste undtagelse blev fundet til at være påvirkningerne i kategorien Global Opvarmning, hvor
rangordenen af scenarier blev påvirket af den marginale el-teknologi. Når naturgas erstattes giver
forbrænding tilsvarende miljømæssig besparelse i forhold til deponering, mens scenariet baseret på
pyrolyse giver meget lav nettobesparelse. Hvis vindkraft er den marginale elektricitetskilde giver
begge scenarier med forbrænding og pyrolyse dårligere resultater end scenariet med deponering.
Konklusion
Baseret på data og viden fra dette studie:
Ændring af den nuværende behandling af SR >4 mm således at mere genanvendes og mindre
deponeres, giver fordele fra et miljømæssigt synspunkt og bør derfor prioriteres.
Sortering og genanvendelse af metaller, plast og glas er til gavn for miljøet og bør derfor
fortsættes. Der bør være særligt fokus på at genanvende metaller, da dette giver de største
miljømæssige fordele.
Forbrænding er miljømæssigt den bedste mulighed for behandling af SR > 4 mm.
Pyrolyse har dårligere energieffektivitet, men bedre nedstrøms genvinding af metaller (dvs. fra
restprodukter) end forbrænding. Dog kunne en klar konklusion ikke drages, fordi resultaterne
for pyrolyse var forbundet med væsentlig usikkerhed på grund af manglen på præcise data, der
beskriver processen. Således bør enhver beslutning vedrørende gennemførelsen af pyrolyse til
behandling af SR fraktion >4 mm blive understøttet af pilot-til-fuldskala test af processen, for
at levere et bedre datagrundlag for processen.
Medforbrænding af >4 mm fraktionen i cementovne kan potentielt give en betydelig besparelse
for påvirkningskategorien Global Opvarmning. Den nuværende sammensætning af fraktionen
>4mm er dog ikke egnet, da med-forbrænding i cementovne kun kan gennemføres med en
specielt designet fraktion. Denne mulighed betyder inkludering af forbehandling for at
producere et råmateriale med en RDF-lignende sammensætning. Dette vil især omfatte en
yderligere screening og sortering af metaller, for at reducere indholdet af tungmetaller i
råmaterialet som sendes til cementovne. Udover tekniske grunde, vil det også resultere i en
betydelig reduktion af emissioner til luft af tungmetaller især Cu og Zn som i høj grad er grund
til høje potentielle påvirkninger rapporteret for nogle af påvirkningskategorierne.
Forbehandling af >4 mm SR bør overvejes for at reducere indholdet af tungmetaller (især Cu
og Zn) i inputtet til termiske processer.
Resultaterne og anbefalingerne påvirkes ikke væsentligt af valget af den marginale
energiteknologi, hvilket betyder at de stadig kan være gældende for et alternativt fremtidigt
energisystem.

14 Life cycle assessment of shredder residue management
List of abbreviations
AC Acidification
AE Aquatic Ecotoxicity
ARD Abiotic Resource Depletion
ASR Automotive shredder residues
EU Eutrophication
EQ Ecosystem Quality
FEW Freshwater Ecotoxicity
GW Global Warming
ILCD International Reference Life Cycle Data System
HH Human Health
HT Human Toxicity
LCA Life cycle assessment
LCI Life cycle inventory
LCIA Life cycle impact assessment
LU Land Use
MSW Municipal solid waste
OD Ozone Depletion
POF Photochemical Ozone Formation
RES Resource Depletion
SR Shredder residues
TC Transfer coefficients
TE Terrestrial Ecotoxicity

Life cycle assessment of shredder residue management 15
1. Introduction
1.1 Background
Shredder residue (SR) is the “residual fraction from mechanical shredding of metal containing
scrap originating from different sources and processed at recycling stations or metal recovery
businesses” (Hyks et al., 2014). Danish SR is typically a mixture of 20% automotive shredder
residue (ASR) and 80% other residues originating from different sources (e.g. white goods,
dismantled boats, industrial bulky waste, metal scrap). SR is a heterogeneous mixture of different
materials, such as rubbers, plastics, glass, wood, dusts, fibres, metals, minerals and other residues
that are difficult to separate. SR accounts for approximately 20% of the material input into sorting
and recycling facilities, and because of the high content of some metals and different organic
contaminants, it is classified as hazardous waste in Denmark (Hyks et al., 2014).
While the majority of SR in Denmark (and also in Europe) is currently disposed of in hazardous
waste landfills, alternative management solutions are being explored and implemented. This is a
legislative- and market-driven process, owing to amongst other reasons:
Landfilling of hazardous waste in Denmark is subject to increasing taxation rates: the current
tax of 160 DKK per tonne of landfilled SR will be increased to 475 DKK from January 1, 2015
(Skatteministeriet, 2011).
EU Council Directive 2000/53/EC on ELV mandates the increasing reuse and recycling of SR:
the current target of 85% will increase to 95% by 2015, where mechanical processes must
encompass at least 85% of the SR and thermal processes may be used for up to 10% of the total
amount (European Council, 2000). A target of >85% can be achieved by reusing components
or recycling raw materials into new products.
Generally, increasing raw material and energy prices make recovery and recycling economically
more practicable and interesting.
1.2 Objectives of the project
The purpose of this project is to perform a life-cycle assessment (LCA) of the management of
Danish SR. The project deals with newly produced SR. The starting point for the management
system is sorting and recycling, followed by energy recovery and finally the disposal of the
generated residues. As the majority of SR is currently sent to landfill, where it is then stored, the
goal of this LCA is to assess the possible treatment options and the environmental consequences
from treating the residue and recovering materials.
Considering the large variations in data, LCA results are calculated and presented by using ranges
for input data values, thereby providing recommendations that include uncertainty. The assessed
scenarios are developed by taking into consideration their technological feasibility within legislative
constraints regarding the use and disposal of secondary materials as a result of the treatment. The
results of the present LCA should provide a basis for deciding on the future management of SR, in
order to ensure increased resource exploitation thereof.
1.3 Existing LCA studies
Table 1 provides an overview of existing LCA studies addressing the management of SR and ASR.
The reviewed studies mainly cover Europe and focus almost entirely on ASR. Despite their limited

16 Life cycle assessment of shredder residue management
number, the available studies indicate that increasing the recovery of materials and energy provides
significant environmental benefits compared to landfilling SR. However, the preferred technological
solution varies between studies, depending on factors such as residue composition, local energy mix
and technological capability.
Weaknesses and limitations in current existing studies (Table 1) can be summarised as follows:
No studies provide life cycle inventory (LCI) modelling based fully on the material fractions
and physicochemical compositions of SR.
No studies provide a comprehensive and systematic sensitivity/uncertainty analysis testing the
robustness of results while also highlighting the key parameters influencing the results.
Table 1 - Overview of existing LCA studies on the management of SR and ASR.
Geographical area
Type Composition Scenarios included
Impact categories
Uncertainty analysis
Results Source
US ASR Material fraction + partial chemical
- Landfill
- Thermal recycling
- Cement kiln
- Material recycling
AC,EU, FEW,GW,HT,POF, TE
None Scenarios 2,3,4 better than scenario 1
/A/
Italy ASR Material fraction
- Landfill
- Non-Ferrous recovery
- Co-incineration
- Plastic recovery + co-incineration
- Chemical recycling (methanol)
HH,EQ,
RES
Sensitivity + propagation
Scenario 4 and 5 are best
/B/
Belgium ASR Chemical - Landfill
- Recycling + landfill
- Incineration
- Recycling + incineration
LU
GW
HT
None Recycling + energy recovery provides largest benefits
/C/
DK SR Material fraction
- Landfill
- Sieving + pyrolysis
- Pyrolysis
GW,OD, AC,TE,AE,
Waste
Scenario analysis on marginal energy
Scenario 2 best
/D/
Italy ASR Material fraction
- Landfill
- Incineration
- Mechanical recycling
- Chemical recycling (methanol)
HH,EQ,
RES
Monte Carlo Scenario 3-4 best
/E/
Portugal ASR Material fraction
- Landfill
- Incineration
- Additional dismantling + SRF + cement kiln
ARD,GW,POF,AC,EU
Parameter sensitivity
Scenario 3 best
/F/
Midpoint AC: Acidification; AE: Aquatic Ecotoxicity; ARD: Abiotic Resource Depletion; EU: Eutrophication; FEW: Freshwater Ecotoxicity; GW: Global Warming; HT: Human Toxicity; LU: Land Use; OD: Ozone Depletion; POF: Photochemical Ozone Formation; TE: Terrestrial Ecotoxicity.
Endpoint HH: Human Health; EQ: Ecosystem Quality; RES: Resource Depletion
/A/: Boughton et al. (2006); /B/: Ciacci et al. (2010); /C/: Vermeulen et al. (2010); /D/: Høstgaard et al. 2012; /E/: Passarini et al. (2012); /F/: Fonseca et al. (2013).

Life cycle assessment of shredder residue management 17
2. Scope and design of the LCA
2.1 General principles
The life cycle assessment (LCA) in this project is performed as a ‘consequential LCA’, whereby
environmental impacts are calculated in relation to the management of SR. In accordance with the
consequential approach, the assessment makes use of system expansion to credit for any material
production avoided and for energy in the background system.
The LCA is conducted under the principle of ‘best practice’, regarding the choice of LCIA methods
and environmental impact categories and the assessment of data quality. The LCA is performed
according to ISO standards 14040 and 14044. The selection of LCIA methods and environmental
impact categories follows recommendations stipulated in the ILCD Handbook ‘Recommendations
for Life Cycle Impact Assessment in the European Context’ (JRC, 2011).
2.2 The functional unit
The functional unit defines the service provided by the system assessed by the LCA study, thus
ensuring that all the assessed waste management scenarios are comparable, meaning that they
provide an equivalent service. The functional unit of the present LCA is defined as:
Treatment of 1 ton of newly produced shredder residues (SR), including treatment, recycling,
incineration/pyrolysis and final disposal of any residues from the treatment process. Composition
of SR under assessment is specified in Chapter 3.2, while inventory data for individual treatment
processes are presented in Chapter 4.1.
The time horizon for the assessment is assumed to be 100 years, while the geographical scope of the
SR treatment processes is assumed as being in Denmark and the geographical origins of individual
background processes are specified in Appendix 1.
2.3 System boundaries
Figure 1 presents the system boundary of the LCA and the overall material flow. SR enters the
system boundaries burden-free, meaning that upstream processes and impacts related to the
manufacturing of products becoming SR are not included. In all scenarios, SR is sorted to recover
recyclable materials, while the remaining material is sent for energy recovery (incineration,
pyrolysis or co-combustion in a cement kiln) and/or deposition after biological stabilisation.
Substitutions for virgin materials and energy are shown in the dashed boxes in Figure 1.

18 Life cycle assessment of shredder residue management
Figure 1 - System boundaries for an LCA of newly produced shredder residues. The substitutions for materials and energy are shown by the dotted boxes and arrows.
2.4 Allocation/system expansion
According to recommendations for state-of-the-art LCAs (JRC, 2011), system boundary expansion
was applied within the current project, in order to ensure a consistent approach and a holistic
perspective to support decision making. In practice, this has two consequences: 1) cascading effects
(i.e. lost opportunities) on other systems, owing to the decision under assessment, are included
within the system boundaries, and 2) substitution is used instead of allocation whenever a multi-
output process is modelled, meaning that the waste system was credited for avoiding emissions that
would otherwise have occurred in the production of the substituted products. The latter is also
needed to ensure equivalency amongst the assessed scenarios.
2.5 Environmental impact categories, LCIA methods and interpretation
of the results
The present LCA makes use of environmental impact categories and LCIA methods described in the
ILCD Handbook (JRC, 2011). In addition, the impact category Depletion of Abiotic Resources (fossil
and elements) from the CML method is included for both fossil and elemental resources
independently, whereas in the guidelines an aggregated impact is used. Other included categories
are Human Toxicity and Eco Toxicity in the form of USEtox, which was also recommended in the
ILCD Handbook (JRC, 2011). Particulate substances that affect breathing, however, are not
included in the USEtox category for Human Toxicity, so they are therefore modelled according to
the UPFM model (Humbert , 2009). An overview of the selected environmental impact categories is
shown in Table 2.
It should be noted that USEtox is subject to some uncertainty, which should be considered when
interpreting the results (an update to USEtox version 1.1 is in preparation, especially with an
improved modelling of the speciation of the metals).
In this LCA, the potential environmental impacts will be converted for each of the impact categories
into a single entity in the form of a person equivalent (PE), with the actual load divided by the
average annual load produced by one person – referred to as ‘normalisation’. Table 2 also shows the
applied normalisation conversion equivalents for the impact categories used herein, and these
normalisation references are based on Blok et al. (2013).
Table 2 – Environmental impact categories and normalisation references used in the present project.

Life cycle assessment of shredder residue management 19
Impact category Method Abbreviation Normalisation reference
Unit
Global Warming IPCC 2007 GWP100 8100 kg CO2-eq./PE/year
Stratospheric Ozone Depletion
WMO 1999 ODP 4.14*10-2 kg CFC11-eq./PE/year
Human Toxicity, Cancer Effect1
USEtox HT-C 5.42*10-5 CTUh /PE/year
Human Toxicity, non-Cancer Effect1
USEtox HT-NC 1.10*10-3 CTUh/PE/year
Particulate Matter Humbert PM 2.76 kg PM 2.5/PE/year
Ionizing Radiation, Human Health
Dreicer 1.33*103 kBq U-235 air-eq/person
Photochemical Ozone Formation
ReCiPe midpoint 56.7 kg-NMVOCeq/person
Terrestrial Acidification
Accumulated Exceedance AP 49.6 AE/PE/year
Terrestrial Eutrophication
Accumulated Exceedance TEP 115 AE/PE/year
Freshwater Eutrophication
ReCiPe midpoint FEP 0.62 kg P-eq./PE/year
Marine Eutrophication
ReCiPe midpoint FEP 9.38 kg N-eq./PE/year
Freshwater Ecotoxicity2
USEtox ET 6.465*10-5 CTUe/PE/year
Depletion of Abiotic Resources-Fossil
CML ADP-F 6.24*10-4 MJ/PE/year
Depletion of Abiotic Resources-Elements
CML ADP-E 3.43*10-2 kg Sb-eq./PE/year
1 CTUh comparative toxic unit for humans. 2 CTUe - comparative toxic unit for ecosystem.
2.6 The EASETECH Life Cycle Assessment Tool
Life cycle modelling was facilitated with the EASETECH waste LCA model (Clavreul et al., 2014),
developed by the Technical University of Denmark. EASETECH allows for estimating mass flows,
resource consumption and emissions from the waste system under assessment, based on a detailed
physicochemical composition of material fractions in the waste and a number of user-defined
process parameters. EASETECH includes specific modules for modelling source separation,
the collection and transportation of waste, material recycling facilities, incineration, composting,
biogas, combined biogas and composting plants, landfills, the use of stabilised organic waste in
agriculture, the recycling of materials and energy and materials production.
The EASETECH model contains ready-to-use data for a number of selected processes and
technologies, while the inventory modelling of specific plants can be performed and its results
stored in the model. Furthermore, scenarios with plural routing options can be established for any
kind of waste system, starting with waste generation and ending with final disposal in a long-term
repository, the industrial recycling of materials, the spreading on agricultural land of bio-treated
organic waste, use in power plants or material utilisation. Owing to the market effects induced by
material recycling, energy recovery or material utilisation, the waste system can be credited for
resource and environmental savings achieved through the corresponding avoided production of
virgin materials. EASETECH also contains databases for a number of key processes, such as
transport, electricity and heat production, and inventory data can be imported from commercial
databases.

20 Life cycle assessment of shredder residue management
2.6.1 Uncertainty calculations
Uncertainty calculations are carried out via Monte Carlo simulation. In EASETECH, this is done by
specifying distributions for each parameter for which the uncertainty is to be assessed. The model
accepts a mixture of normal, lognormal, triangular and uniform distributions. After having specified
all the parameter distributions for which the Monte Carlo analysis is to be carried out, the user
needs to specify how many random variables need to be used within each distribution. In this report
we used 10,000 variables.
2.7 Data needs
2.7.1 Material composition
Information regarding the material fraction and physicochemical composition of SR was retrieved
from Hansen et al. (2011a) and Høstgaard et al. (2012). As shown in Table 16 and Table 17 of
Appendix 2, a range of other studies providing compositional data were available, but they could
not be utilised in the present context because they dealt with either ASR (which is only 20% of
Danish SR) or SR excavated from landfills (e.g. Hansen et al., 2012; Ahmed et al., 2014). A detailed
overview of the physicochemical composition of SR used in LCA modelling is provided in Chapter
3.2 and Appendix 2.
2.7.2 Treatment of shredder residues
For all SR treatment processes, specific inventory datasets were established, as presented in detail
in Chapter 4.1. For the remaining background processes involved in the LCA, datasets from
recognised LCA databases were used. A comprehensive list of the datasets used in the present study
is provided in Chapter 4.3.
2.8 Non-quantitative assessments
In the present study, potential impact weighting is not performed, as it is not required by the ISO
standard. A qualitative evaluation of the uncertainty related to characterisation factors and methods
is mentioned in Chapter 5, with particular emphasis placed on separately discussing non-toxic and
toxic impact categories during the interpretation of results.
2.9 Limitations
The present LCA study is performed in accordance with ISO standards 14040 and 14044, and it is
generally meant to be used as a basis for decision-making. In this context, it should be emphasised
that the LCA should not be used as the only tool for decision support. The results of the present
project are valid as long as the socio-demographic and technological conditions of the SR
management system (described later) persist.
2.10 Requirements for data quality
To evaluate the quality of external processes included in the LCA, the methodology developed by
Weidema & Wesnæs (1996) was used. This method uses quality indicator values for five indicator
categories to assess the quality of data. The indicator categories include credibility, completeness,
temporal correlation, geographical correlation and technological correlation. For individual
categories, indicator values are assigned by comparing the quality of process data with data quality
goals set according to the goal and the scope of the project. A value is assigned on a scale of 1 to 5,
where 1 indicates full documentation and compliance, and 5 indicates a lack of data/compliance
with the required process. The average of the indicator categories is then calculated. Whenever
possible, this project makes use only of processes which have an average indicator value less than 3.
A definition of the indicators, and an explanation of the individual indicator categories, is available
in the documentation prepared for the Ecoinvent database (Frischknecht et al., 2007), initially
based on Weidema & Wesnæs (1996).

Life cycle assessment of shredder residue management 21
2.11 Process regarding critical review
The report was reviewed externally by LCA experts from the Danish Technological Institute. The
review report is available in Appendix 9. All comments from the reviewers have been implemented
in this version of the report.
2.12 Report format
The format of the report follows the recommendations provided by the ISO 14040 and 14044
standards.
2.13 Timeframe
Data on the composition of newly produced SR refer to the years 2011-2012. The composition of SR
is expected to change over the years; for example, the use of composite plastic materials is
increasing in the automotive industry (Koronis et al., 2013). The validity of SR composition data
will thus have to be checked when developing future scenarios. Inventory data for processing
systems refer to current average technologies; hence, the results of the current study are only valid
as long as there are no substantial changes in the design of technologies and background systems.
The latter applies especially to marginal technology for energy production. As Denmark is in a
transition phase and heading towards a fossil-free energy system, the relevance of energy recovery
from SR may change significantly in the future (e.g. in ten years).

22 Life cycle assessment of shredder residue management
3. Scenarios and composition of shredder residues
3.1 Scenarios
The scenarios included herein are illustrated in Figure 2 to Figure 5. The main difference between
the individual scenarios is the technology (i.e. landfilling, incineration, pyrolysis and co-combustion
in a cement kiln) employed for treating >4 mm residue remaining after sorting recyclable materials.
All scenarios include the sorting of recyclables and the landfilling of fine residues <4 mm, which are
not suitable for thermal treatment because of their high content of heavy metals.
Scenario 1 (S1) represents the baseline current situation for the management of SR (Figure 2). In
this scenario, recyclables (i.e. glass, plastics and metals) are sorted and recovered from SR, while
the remaining residues are landfilled. Recyclables are sent to recycling facilities to produce
secondary glass, plastic and metal materials.
To illustrate the effect of treating the remaining residues biologically before landfilling, this
technology step has been included in all scenarios, despite the fact that this treatment method is
currently not applied in Denmark. More details are found in Møller et al. (2014), where it is shown
that biological treatment has almost no effect on the results of the LCA.
Figure 2 – Scenario 1: landfilling after sorting of recyclables.
Scenario 2 (S2) includes the recovery of recyclables (i.e. glass, plastics and metals) from SR (Figure
3). The remaining residues are then screened to separate particle fractions >4 mm, which are
routed to incineration, and a fraction <4 mm, which is sent for biological treatment and then to
landfill. Recyclables are sent to recycling facilities for the production of secondary glass, plastic and
metal materials. Bottom ashes from the incineration process are treated to enable the further
recovery of metals, and then they are used for road construction as sub-base materials. Fly ashes
from the air-pollution-control (APC) system of the incineration plant are landfilled.
Scenario 3 (S3) includes the recovery of recyclables (i.e. glass, plastics and metals) from SR (Figure
4). The remaining residues are then screened to separate a particle fraction >4 mm, which is routed
to pyrolysis, and a fraction <4 mm, sent for biological treatment and then to landfill. Metals are
recovered from pyrolysis char, which is then used together with pyrolysis oil and gas as a fuel for
energy production in incineration plants. Recyclables are sent to recycling facilities for the

Life cycle assessment of shredder residue management 23
production of secondary glass, plastic and metal materials. Bottom ashes from combustion of
pyrolysis products (Char etc.) presumably are used for road construction as sub-base materials. Fly
ashes from the APC system are landfilled.
Shredderresidues
Sorting
Recycling of glass
Glass waste
Metal waste
Plastic waste
Recycling of plastic
Recycling of metal
Incineration
Production of glass
Production of plastic
Production of metal
Landfilling
Glass
Metal
Plastic
Residues>4 mm
Residues<4 mm
Bottom ashTreatment /
sorting
Metal waste
Residues
Production of energy
Production of sub-road basis
material
Fly ash
Biological treatment
Figure 3 – Scenario 2: incineration of >4 mm residues after sorting of recyclables.
Shredderresidues
Sorting
Recycling of glass
Glass waste
Metal waste
Plastic waste
Recycling of plastic
Recycling of metal
Pyrolysis
Char
Production of glass
Production of plastic
Production of metal
Glass
Metal
Plastic
Treatment / sorting
Residues>4 mm
Residues<4 mm
Gas, oil
Metal waste
CharProduction of
energy
Production of sub-road basis
material
Landfill
Energy utilization
Bottom ash
Fly ash
Biological treatment
Figure 4 – Scenario 3: pyrolysis of >4 mm residues after sorting of recyclables.
Scenario 4 (S4) includes the recovery of recyclables (i.e. glass, plastics and metals) from SR (Figure
5). The remaining residues are then screened to separate a particle fraction >4 mm, which is used as
a co-fuel in cement kilns, and a fraction <4 mm, sent for biological treatment and then to landfill.
While cement kilns can generally run using different fuels (i.e. coal, petcoke, natural gas, oil),
almost all European and Danish plants make use of coal (Daugaard, 2014). When coal is substituted
with an alternative fuel such as waste, 8% additional energy is needed in the process. In fact, as
waste has a high content of chlorine compared with coal, some of the off gas needs to be drained
from the kiln. This results in a loss of energy in the system, which needs to be compensated for
through the additional input of fuel (Daugaard, 2014). For LCA modelling, it was thus assumed that
1 MJ of SR substitutes 0.926 MJ of coal (or 1.08 MJ of SR substitutes 1 MJ of coal). Inert materials
in SR end up in the final cement product, while fly ashes from the APC system are landfilled.

24 Life cycle assessment of shredder residue management
Figure 5 – Scenario 4: cement kiln of >4 mm residues after sorting of recyclables.
The report does not include an analysis of possible transport distances, as there is no knowledge of
where the material will be treated, while, at least for the fractions of recyclable materials,
transportation would be the same in all scenarios. In addition, it is assumed that emissions from
transport will only play a very minor role with regards to environmental impacts (Merrild et al.,
2012).
3.2 Composition of shredder residues
Waste is generally a heterogenic material, but some waste – such as SR – varies significantly over
days and even hours. The composition of SR depends on material received at the shredder
companies and the sorting performed, which in turn depends on the market price of waste materials
and recyclables. Intervals for the content of individual materials were thus used in this assessment,
in order to cover the heterogeneity of SR.
The material fraction composition used in the LCI modelling is presented in Table 3, based on data
from Hansen et al. (2011a) and Høstgaard et al. (2012). These data are in line with recent results
from two sampling/sorting campaigns conducted by Stena Recycling in April 2014 (undisclosed
because of confidentiality reasons). Details about dataset creation and the uncertainty assessment
are presented in Appendix 2.
The physicochemical composition of <4mm and >4mm fractions of SR used in the modelling is
presented in Table 4. These datasets are based on data from Hansen et al. (2011a) and Høstgaard et
al. (2012) and are presented as lognormal distributions (additional details in Appendix 2). Table 3 – Material fraction composition used for LCI modelling SR.
Fraction Average (%) St. Dev.
Ferrous metal 0.93 0.53
Non-ferrous metal 3.22 0.99
Tin can 0.67 0.21
Plastic 11.88 2.86
Rubber 6.89 2.10
Glass 0.03 0.01
>4mm 30.83 3.72
<4mm 45.54 3.15
Total 100
Table 4 – Physicochemical composition of <4mm and >4mm fractions of SR used in the LCI modelling (based on Hansen et al. (2011a) and Høstgaard et al. (2012)). All data are provided as lognormal distributions.

Life cycle assessment of shredder residue management 25
Parameter Unit Fine <4mm > 4mm
median deviation median deviation
TS* % ww 89.4 3.25 89.4 3.25
Ash % TS 80.9 21.6 40.4 21.4
LHV MJ/kgTS 0.33 4.12 17.1 6.33
C % TS 5.09 9.26 35.4 6.89
H % TS 2.60 1.90 4.96 1.61
N % TS 0.49 0.16 0.83 0.23
Si mg/kg TS 103000 66300 50500 38100
Al mg/kg TS 28700 17300 16600 15500
Ca mg/kg TS 50000 41500 33100 14900
Fe mg/kg TS 192000 88200 73700 44500
K mg/kg TS 5340 4610 3000 1040
Mg mg/kg TS 9210 5670 7110 1540
Mn mg/kg TS 2070 1110 1040 506
Na mg/kg TS 11600 6290 6860 3030
P mg/kg TS 1440 2780 1090 767
Ti mg/kg TS 5470 4160 4900 4220
As mg/kg TS 88.4 286 49.2 107
Ba mg/kg TS 3170 1560 2540 2250
Be mg/kg TS 0.644 0.187 0.615
Cd mg/kg TS 25.2 41.0 9.73
Co mg/kg TS 41.1 38.8 35.8
Cr mg/kg TS 979 1950 391 272
Cu mg/kg TS 3790 13200 7370 21700
Hg mg/kg TS 1.51 2.33 2.61
Mo mg/kg TS 99.0 149 39.6
Nb mg/kg TS 4.47 2.00
Ni mg/kg TS 585 490 364 510
Pb mg/kg TS 2970 3360 2600 4790
S mg/kg TS 5160 7570 3940 4890
Sb mg/kg TS 377 923 336 271
Sc mg/kg TS 0.949 0.274 1.20
Sn mg/kg TS 419 488 208 266
Sr mg/kg TS 408 453 205 218
V mg/kg TS 89.1 34.6 39.1
W mg/kg TS 189 94.5 179
Y mg/kg TS 9.47 7.63 4.49
Zn mg/kg TS 37200 49700 24300 14600
Zr mg/kg TS 553 366 244 142
Br mg/kg TS 510 2670 436 1030
26 Life cycle assessment of shredder residue management
Cl mg/kg TS 4420 4890 10200 11900
I mg/kg TS 2.78 2.60 1.88
Li (*) 0.0497 0.305
* Based on data from Nieminen et al. (2006)

Life cycle assessment of shredder residue management 27
4. Life cycle inventories
4.1 Inventories for treatment processes
4.1.1 LCI of SR sorting
SR sorting is modelled based on data for landfilled SR retrieved from Møller et al. (2014), and then
modified to account for the specific characteristics of newly produced SR. In fact, in comparison
with the landfilled SR in Møller et al. (2014), the amounts of metals in the newly produced SR are
considerably lower. Furthermore, the majority of the copper is supposedly contained in cables and
thus cannot be sorted out without prior processing. It is thus assumed that sorting is performed on
the following materials: >4 mm fraction for further processing, ferrous metals, non-ferrous
(aluminium) metals, plastics and glass. The different steps are presented in Figure 6, while the
amount of materials sent to further treatment is shown in Figure 7.
Figure 6 – Overview of the SR sorting process.
Figure 7 – Overview of material flows through the sorting facility.

28 Life cycle assessment of shredder residue management
The screen is assumed to sort 100% of the >4 mm fraction that will go on to the further processing
steps explained in Chapter 3. As additional data on the efficiency of the process for sorting newly
produced SR were not available, the dataset is thus based on information retrieved from Møller et
al. (2014). As newly produced SR has a lower content of metals compared with disposed SR, average
sorting efficiency is assumed to be similar to what was used in the sensitivity analysis in Møller et
al. (2014). These average values are then combined with the higher values and a lower sorting
efficiency of 50% to form a triangular distribution for sorting the different materials, as presented in
Table 5. Data for energy consumption in the individual processing units are based on Møller et al.
(2014) and shown in Table 6. The sorted materials are then sent for remanufacturing, where
additional sorting to remove impurities can take place.
Table 5 – Efficiencies of individual processing units in sorting SR, expressed as a triangular distribution.
Process Unit Min Mean Max
Magnetic separator % input 50 66 94
Eddy current separator % input 50 66 92
Plastic seperation1 % input 16 48 80
Glass seperation2 % input 20 40 60 1 Based on 80% sorting from Hansen et al. (2012), and an assumption of 20-60-100% of a quality to be recycled 2 Based on 40% sorting from Hansen et al. (2012), and an assumption of +/-50% range
Table 6 – Input of energy to individual processing units in sorting SR.
Process Input Unit Amount
4mm Screen Electricity kWh/kg throughput 0.0225
Magnetic separator Electricity kWh/kg throughput 0.0006
Eddy Current separator Electricity kWh/kg throughput 0.005
Plastic and glass separation Electricity kWh/kg throughput 0.005
4.1.2 LCI of SR combustion at a waste incinerator plant
Scenario 2 includes SR combustion at a waste incineration plant. In EASETECH, waste incineration
plants are modelled by mapping emissions into the air of individual compounds and/or their
transfer into other waste products. Individual compounds contained in waste are distributed into
the air and as solid outputs using transfer coefficients (TCs). Air emissions from waste incineration
are further divided into two types: input-specific emissions and process-specific. The former are
proportional to the concentration of individual compounds in the waste and are thus modelled
using TCs. This type of emission includes, for example, heavy metals and CO2. Process-specific
emissions are largely independent of the composition of the waste, and they are solely a function of
the plant’s operational characteristics. Examples of process-specific emissions include NOx, SO2
and dioxin emissions. In addition, the LCI for waste incineration includes internal energy
consumption, and the consumption of auxiliaries is accounted for, together with the substitution
value of the energy produced. In the present study, SR incineration is modelled similarly to how
Møller et al. (2014) modelled excavated SR, and thus it is based on the inventory of a generic
Danish waste incinerator described in Jacobsen et al. (2013).
4.1.2.1 Technology description
The incineration plant is modelled on the basis of Jacobsen et al. (2013), who provided a
comprehensive inventory dataset for a state-of-the-art waste incineration plant in Denmark. This
inventory is based on data collected from state-of-the-art Line 5 of Vestforbrænding I/S for 2011.
Line 5 is equipped with a grate-type furnace, and its flue gas cleaning system includes wet scrubbing
for acid gas removal, an SNCR deNOx system and an activated carbon filter for dioxin and Hg
removal. The dataset is based on both process- and input-specific emissions, depending on whether
the emissions are mostly controlled by the plant operation or are mainly related to the content of
specific compounds in the waste input. Leaching from bottom ash (i.e. slag), used for road

Life cycle assessment of shredder residue management 29
construction, is estimated using results from batch leaching test EN 12457-1, performed at L/S = 2
l/kg. The recipient of bottom ash leachate is supposed to be freshwater.
Energy contained in waste is recovered and used to produce electricity and hot water. The net
energy recovery efficiencies are 22% for electricity generation and 73% for heat production,
according to data reported in ‘Technology Data for Energy Plants’ (Energistyrelsen, 2012). The
generated electricity is delivered to the grid, while hot water is delivered to a district heating
network. Electricity is assumed to substitute for coal-based marginal electricity production, while
heat is assumed to substitute for average Danish district heating, as explained in Chapter 4.2.
Bottom ash is treated to recover aluminium and iron. The total recovery depends on the efficiency
of the sorting process and the degree of oxidation of the separated metal, where the latter is
determined by the material thickness, as oxidation decreases with increasing thickness (Malmgren-
Hansen et al., 2002). Because of the lack of specific data for SR, data for metal recovery from
bottom ash generated during the combustion of general waste in a Danish incinerator were used.
The recovery of iron was thus assumed to have an efficiency of 85% (Allegrini et al., 2014). The
oxidation grade for >4 mm residues was assumed at 7.5%, as reported by Møller et al. (2014), and
the recovery of non-oxidised aluminium was assumed to have an efficiency of 49%, calculated on
the total input of Al into the combustion process, as reported in Biganzoli & Grosso (2013) and
explained in Møller et al. (2014).
4.1.2.2 Inventory dataset
The inventory dataset for the combustion of SR at a waste incinerator in Denmark is presented in
Table 7. As mentioned above, basic inventory data were taken from Jakobsen et al. (2013). This
assumption is considered valid upon the condition that ASR is co-combusted with regular
municipal solid waste up to a share of 12-14% and is made based on the following considerations:
Astrup et al. (2011a) tested co-combustion by blending 14% ASR into municipal solid waste and
reported that despite the content of individual compounds significantly increasing with the
introduction of ASR into the feedstock blend (compared with municipal residual waste),
emissions from the stack were not affected. In some cases, TCs into the air seemed eventually
to decrease with the addition of ASR, possibly because a significant share of the metals is likely
to be embedded in a non-combustible matrix and is thus not volatilised in the flue gas phase.
This may suggest that TCs for ASR are somehow lower than for residual waste, and it can hence
be conservatively assumed that TCs for ASR are equal to regular waste. While results are only
available for As, Cd, Cr, Pb and SB, similar behaviour for other compounds is also assumed.
Redin et al. (2001), Astrup et al. (2011a), Nedenskov (2011) and Vermeulen et al. (2012)
reported regular functioning of the flue gas cleaning system and rather constant emissions
during the co-combustion of ASR with municipal solid waste. Redin et al. (2001) tested 20%
ASR, Astrup et al. (2011a) performed a co-combustion test with 14% ASR on a mass basis, while
Nedenskov (2011) tested a mix with 12.4% ASR and Vermeulen et al. (2012) a mix with 25%
and 39% ASR.
The Danish EPA gave to I/S Reno-Nord environmental approval for the co-combustion of ASR
with municipal solid waste up to 12.5% of mass (Seerup, 2012). In the approval, the Danish
EPA assessed that the flue gas cleaning system at I/S Reno-Nord would ensure that the
emission of heavy metals into the air would not rise, or at least not rise significantly, as a
consequence of ASR co-combustion.

30 Life cycle assessment of shredder residue management
Table 7 – Inventory dataset for the combustion of 1 ton of SR at a waste incinerator.
Type Parameter Unit Jakobsen et al. (2013)
Deviation
Input material SR Ton ww 1
NaOH kg/ton ww 0.024
Activated carbon kg/ton ww 1.04
CaCO3 kg/ton ww 5.67
NH3 kg/ton ww 1.53
Water kg/ton ww 397
Ca(OH)2 kg/ton ww 0.34
Polymer kg/ton ww 0.0006
HCl kg/ton ww 0.0056
TMT kg/ton ww 0.395
Output Electricity % LHV, net 22
Heat % LHV, net 73
Process-specific air emission HCl kg/ton ww 0.0053
CO kg/ton ww 0.033
NOx kg/ton ww 0.849
HF kg/ton ww 0.00039
Dioxin kg/ton ww 1.8*10-11
PM kg/ton ww 0.003
SO2 kg/ton ww 0.00291
Input-specific air emissions
(% of content in waste input)
Cl % input 0.1073 0.3036
S % input 0.099 0.2801
As % input 0.0121 0.0366
Cd % input 0.0064 0.0174
Cr % input 0.0394 0.1336
Cu % input 0.00261 0.0092
Hg % input 0.7476 2.0014
Ni % input 0.0329 0.1007
Pb % input 0.00081 0.0023
Sb % input 0.0119 0.0337
Zn* % input 0.0717 0.0994
Bottom ash composition
(% of content in waste input)
Cl % input 5.3 2.81
S % input 23.99 12.70
As % input 40.62 21.50
Cd % input 11.83 6.26
Cr % input 83.15 44.01
Cu % input 92.63 49.03
Fe % input 96.92 51.30
Hg % input 2.38 1.26
Mo % input 96.61 51.14
Ni % input 87.32 46.22
Pb % input 48.47 25.65
Sb % input 38.91 20.59
Se % input 22.38 11.85
Zn % input 51.76 27.40
Fly ash composition
(% of content in waste input)
Cl % input 32.13 13.69
S % input 60.91 25.95
As % input 58.92 25.10
Cd % input 88.13 37.55
Cr % input 16.77 7.15
Cu % input 7.35 3.13
Fe % input 3.06 1.30
Hg % input 96.25 41.01
Mo % input 2.54 1.08
Ni % input 12.56 5.35
Pb % input 51.29 21.85
Sb % input 59.84 25.50
Life cycle assessment of shredder residue management 31
Se % input 76.73 32.69
Zn % input 48.18 20.53
* Calculated based on Vermeulen et al. (2012)
Vermeulen et al. (2012) investigated the incineration of 100% ASR in a rotary kiln plant,
reporting process-specific emissions very similar to Jakobsen et al. (2013). With regards to
input-specific emissions, Vermeulen et al. (2012) reported slightly higher TCs for some of the
assessed compounds. The small differences (e.g. Cd and Cr) may be associated with the fact
that while Jakobsen et al. (2013) covered a grate furnace incineration plant, Vermeulen et al.
(2012) performed a test on a rotary kiln process used for incinerating hazardous waste, and
thus running on higher temperature.
Nedenskov (2013) and Hyks & Astrup (2009) reported that the quality of solid residues
originating from the co-combustion of SR with municipal solid waste (MSW) did not
significantly differ when compared with bottom ash from incinerating 100% residual municipal
solid waste.
To complement the data taken from Jakobsen et al. (2013), uncertainty associated with individual parameters was estimated (see Table 7, details in Appendix 3):
For air emissions, using data from Vermeulen et al. (2012);
For the composition of solid residues, using data from Mancini et al. (2014) and
For leaching from bottom ash, using data from Nedenskov (2013).
4.1.3 LCI of pyrolysis of SR
Pyrolysis is an endothermic process during which the feedstock is heated under anaerobic
conditions so that carbonaceous compounds therein are converted into energy-rich pyrolysis
products such as oil, gas (mainly CO and H2) and coke. As pyrolysis occurs in an oxygen-free
environment and at a lower temperature than combustion (from 400°C to 900°C), metals
eventually present in the feedstock are not oxidised. A detailed description of SR pyrolysis is
provided by Høstgaard et al. (2012) based on small-scale laboratory tests.
Since the pyrolysis process is endothermic, its operation requires the input of energy. This energy is
typically obtained by using the pyrolysis gas for heating the reactor, while oil and coke can be
employed for energy production to be exported. Pyrolysis gas, oil and coke can – in principle – be
used as fuels in a number of technologies, while in reality their application is limited because they
carry undesirable levels of e.g. heavy metals (Høstgaard et al., 2012). The present study thus
assumes that the pyrolysis products are utilised in a waste incineration plant, as its feasibility is
reported in Høstgaard et al. (2012). The inventory for the incineration of pyrolysis products is
modelled according to the dataset presented in Chapter 4.1.2.
4.1.3.1 Technology description
An average pyrolysis process for treating SR was obtained based on physicochemical compositions
of SR input and pyrolysis products (i.e. char, oil and gas) retrieved from a number of literature
studies. Data were reconciled to balance mass, energy and substance flows simultaneously while
estimating the uncertainty of the system. The mass and energy balances of an average pyrolysis
process for the treatment of SR are shown in Figure 8 and Figure 9, while additional charts for
individual compounds can be found in Appendix 4, together with a detailed description of the
reconciliation process. The recovery of metals from char is possible because the organic part of the
char is typically porous and can be screened out rather easily (Møller et al., 2014). While forcing
data reconciliation based on materials compositions (i.e. SR input, char, oil and gas), in the mass
balance calculation, sorting efficiency was assumed at between 80% and 100%.
Figure 8 and Figure 9 indicate that mass and energy recoveries have rather different patterns, with
char being the main material output, while oil carries the largest energy flow. In addition, it is
evident that all flows are associated with significant uncertainty, possibly because the displayed

32 Life cycle assessment of shredder residue management
average process was built on a rather large set of data, originating from different test conditions.
This is indeed a consequence of limited data availability and lack of full-scale experiments on
representative Danish SR.
Figure 8 – Mass balance for the pyrolysis of 1 ton of SR.
Figure 9 – Reconciled distribution of energy during the pyrolysis of 1 ton of SR.
4.1.3.2 Inventory dataset
Mass, energy and substance reconciliation allowed for calculating process TCs for individual
outputs. An overview of the inventory datasets used in the LCA modelling is presented in Table 8,
together with the uncertainty associated with individual parameters. A detailed description of the
inventory is provided in Appendix 4.
4.1.4 LCI of disposal of SR in landfill
The inventory for landfilling SR was developed similarly to how it was applied by Møller et al.
(2014). Gas emissions from the depositing of SR into landfill sites were estimated based on
experimental results reported in Scheutz et al. (2010a, 2010b, and 2011). Emissions related to
leachate production were estimated based on the modelling of experimental results reported in
Hansen et al. (2011b) and the estimation of uncertainty was based on data from Hansen et al.
(2011a). An overview of the inventory dataset is provided in Table 9, while additional details about
the inventory creation are provided in Appendix 5. In addition, electricity consumption of 97
kWh/tonSR was considered for leachate treatment at a wastewater treatment plant (Møller et al.,
2014).

Life cycle assessment of shredder residue management 33
Table 8 – Inventory dataset for the pyrolysis of SR.
Type Parameter Unit Mean St. Dev.
Input SR ton 1
Electricity MJ/ton ww 248
Pyrolysis oil GJ/ton ww 0.29
Pyrolysis gas GJ/ton ww 0.21
Output Char % LHV, net 25.0 30.1
Oil % LHV, net 38.9 18.3
Gas % LHV, net 22.7 20.1
Ferrous metals kg/ton ww
(% input)
25.9
(37.0)
9.31
(12.7)
Non-Ferrous metals kg/ton ww
(% input)
25.7
(8.24)
11.3
(6.18)
Unsorted metals kg/ton ww
(% input)
12.9
(6.73)
9.56
(7.70)
Transfer to char
(% of content in waste input)
Al % input 17.9 10.1
C % input 29.2 10.5
Ca % input 66.1 16.8
Cd % input 90.3 109
Cl % input 71.1 81.4
Cr % input 26.0 30.4
Cu % input 23.9 16.2
Fe % input 47.4 14.2
Hg % input 0.75 0.71
Mn % input 61.3 19.1
N % input 39.8 17.6
Ni % input 32.0 47.2
Pb % input 34.2 38.4
S % input 72.4 11.5
V % input 21.0 12.8
Zn % input 14.8 7.30
Transfer to oil
(% of content in waste input)
Al % input 0.008 0.005
C % input 59.0 9.51
Ca % input 0.181 0.313
Cd % input 0.048 0.032
Cl % input 2.74 1.61
Cr % input 0.164 0.089
Cu % input 0.002 0.002
Fe % input 0.091 0.158
Hg % input 3.88 0.749
Mn % input 0.008 0.002
N % input 58.0 18.3
Ni % input 0.180 0.202
Pb % input 0.053 0.073
S % input 20.8 12.0
V % input 0.027 0.031
Zn % input 0.032 0.024
Transfer to gas
(% of content in waste input)
Al % input 0.994 1.00
C % input 9.34 2.34
Ca % input 0.564 0.321
Cd % input 0.100 0.100
Cl % input 1.000 1.00
Cr % input 0.100 0.100
Cu % input 0.100 0.100
Fe % input 0.100 0.100
Hg % input 94.6 1.41
Mn % input 0.100 0.100
N % input 0.000 0.000
Ni % input 5.00 20.0

34 Life cycle assessment of shredder residue management
Pb % input 0.100 0.100
S % input 0.000 0.000
V % input 0.100 0.100
Zn % input 0.100 0.100
Table 9 – Inventory dataset for the disposal of SR in a landfill (after Møller et al., 2014).
Type Substance Production Release* Uncertainty (%)
Gas kg/kgSR kg/kgSR
CH4 1.2*10-2 8.4*10-3
CFC-11 1.3*10-7 1.3*10-8
HCFC-21 1.8*10-6 8.8*10-7
HCFC-31 1.3*10-6 9.1*10-7
HFC-41 6.5*10-8 6.5*10-8
CFC-12 6.5*10-8 4.6*10-8
HCFC-22 1.3*10-7 1.0*10-7
HFC-32 0.0 0.0
HFC-134a 6.5*10-7 6.5*10-7
HCFC-141b 1.3*10-7 1.0*10-7
Leachate kg/kgSR % of leachate content
Total-N 4.5*10-4 9.80%
Total-P 5.5*10-6 9.00%
𝐶𝑙− 9.8*10-4 100.00% 60
𝐹− 4.0*10-6 14% 38
𝑆𝑂42− 2.2*10-5 14% 39
𝐻𝐶𝑂3− 7.3*10-3 14%
NVOC (DOC) 1.2*10-3 14%
𝑆 − 𝑆2− 6.6*10-7 14%
Al 1.1*10-7 0.30% 48
As 1.0*10-7 87.00% 16
Ba 1.8*10-6 13.90% 29
Ca 5.3*10-4 92.10% 39
Cd 7.1*10-11 13.90% 74
Co 2.0*10-9 17.00% 37
Cr (VI) 2.3*10-9 11.20%
Cr (tot) 2.0*10-8 11.20% 68
Cu 7.0*10-9 2.00% 23
Fe 4.1*10-5 1.70% 93
Hg 1.7*10-10 10.30% 131
K 4.5*10-4 94.30% 19
Mg 7.0*10-4 95.10% 26
Mn 1.3*10-6 47.10% 34
Mo 9.6*10-9 95.00% 31
Na 8.5*10-4 89.20% 44
Ni 1.2*10-7 47.10% 47
Pb 7.1*10-10 2.70% 71
Sb 6.7*10-9 45.80% 34
Se 2.3*10-9 14% 2
Si 4.3*10-5 14% 45
V 3.1*10-8 16.90% 68
Zn 9.6*10-8 7.30% 61
Benzene (sum) -3*10-7 30%
PAH -6.0*10-11 29%
PAH -6.0*10-11 29%
* For gas: release after oxidation; for leachate: release after wastewater treatment.

Life cycle assessment of shredder residue management 35
4.1.5 LCI of co-combustion of SR in a cement kiln
As data regarding the co-combustion of SR in a cement kiln are not available for Denmark, a generic
process was assumed for LCI modelling. Data on SR composition and emissions released into the
air were retrieved from Vermeulen et al. (2012) and used to estimate TCs emitted into the air for a
range of compounds. This project was chosen because it was the only available published study
providing both the composition of SR input into a cement kiln as well as emissions into the air of a
number of compounds, thereby allowing us to determine air emissions as input-specific. With
regards to solid residues, it was considered that the inert part of SR (i.e. ash and metals) would end
up in the clinker, and thus no further modelling was included. The inventory dataset for the co-
combustion of SR in a cement kiln is presented in Table 10. Table 10 – TCs (%) into the air for the co-combustion of SR in a cement kiln.
TCs (%) into air
Compound Median Deviation
C 100
S 0.0397 0.1071
As 0.0001 0.0003
Cd 0.0172 0.0478
Cr 0.0005 0.0013
Cu 0.0273 0.0790
Hg 0.0367 0.1038
Ni 0.0022 0.0089
Pb 0.0571 0.2195
Zn 0.3730 1.2975
4.1.5.1 Feasibility of the co-combustion of SR in a cement kiln
Cement kilns typically have restrictions on the quality of the fuel used for producing clinker. Co-
combustion of SR may thus be questionable, if at all possible or allowed. The technical feasibility of
the scenario was therefore assessed with some desktop-based considerations. The estimated
composition of SR used for co-combustion in Scenario 4 was compared with acceptance values for
RDF used in cement production at Aalborg Portland. The results of the comparison are showed in
Table 11, where it is evident that for a large number of parameters quality acceptance criteria would
not be met by SR with a composition as modelled in this study. This means that, in practice, the co-
combustion of SR in a cement kiln would only be feasible for a ‘designed’ composition of SR, where,
for example, metals are sorted out to a larger extent than is currently done. This conclusion,
however, should be supported by additional tests.

36 Life cycle assessment of shredder residue management
Table 11 – Comparison between quality acceptance criteria for the co-combustion of RDF in a cement kiln (Aalborg Portland) and the compositing of SR going to a cement kiln as estimated for Scenario 4. Values marked in grey exceed the quality criteria.
Name of Fuel RDF – Refuse Derived Fuel
Origin A solid recovered fuel (SRF/RDF), made from combustible non-hazardous waste (municipal solid waste, specific waste, industrial waste and commercial waste), mainly consisting of organic components such as Cl-free plastics and biodegradable waste.
Physical appearance Fine, fluffy product.
Physical cleanliness Shall be free from foreign materials such as metals, glass, PVC, oils etc., and shall not be more contaminated by salts, soils, heavy metals and liquids, as is normal for this type of material.
Parameter Unit Typical value Lower Upper Standards LCI Modelling
LHV kcal/kg (DB) 5,000 4,000
CEN/TS 15400
LHV MJ/kg (DB) 21 17
CEN/TS 15400 18.3
LHV MJ/kg (AR) 17 16
CEN/TS 15400
Moisture % (AR) 10
15 CEN/TS 15414 9.57
Ash % (AR) <10
15 CEN/TS 14775 32.7
S % (DB)
1 CEN/TS 15408 0.42
Cl % (DB) 0.5
0.8 CEN/TS 15408 1.09
F % (DB)
0.5 CEN/TS 15408
Br % (DB)
0.25 CEN/TS 15408 0.05
I % (DB)
0.25 CEN/TS 15408
Biomass Content %-w (DB) 50
Size, Length/Width mm 25
40 CEN/TS 15415
Size, Thickness mm < 3
5 CEN/TS 15415
Metals
Mercury (Hg) mg/kg (DB) <1
1 CEN/TS 15411 2.79
Cadmium (Cd) mg/kg (DB) <9
9 CEN/TS 15411 10.4
Thallium (Tl) mg/kg (DB) <1
1 CEN/TS 15411
Total Group II Metals mg/kg (DB) <10
10
Antimony (An) mg/kg (DB) <150
150 CEN/TS 15411 359
Arsenic (As) mg/kg (DB) <20
20 CEN/TS 15411 52.6
Chromium (Cr) mg/kg (DB) <150
150 CEN/TS 15411 418
Cobalt (Co) mg/kg (DB) <20
20 CEN/TS 15411
Copper (Cu) mg/kg (DB) <500
500 CEN/TS 15411 7887
Lead (Pb) mg/kg (DB) <200
200 CEN/TS 15411 2787
Manganese (Mn) mg/kg (DB) <150
150 CEN/TS 15411 1115
Nickel (Ni) mg/kg (DB) <70
70 CEN/TS 15411 390
Tin mg/kg (DB) <15
15 CEN/TS 15411 222
Vanadium (V) mg/kg (DB) <10
10 CEN/TS 15411 41.8
Total Group III Metals mg/kg (DB) <800
800
Organics Must not contain dioxins, furans, PCBs or other hazardous components.
Waste Code 191210 according to the European Waste Catalogue (EWC).
Quality Control The supplier must have a quality control system and provide a declared analysis of LHV, Moisture, Ash, S/Cl/F/Br/I & Heavy Metals.
DB = Dry Basis; AR = As received

Life cycle assessment of shredder residue management 37
4.1.6 LCI of the biological treatment of SR before disposal in a landfill
As described in Chapter 3, all the assessed scenarios include the landfilling of a significant amount
of unsorted residues (i.e. residues <4 mm in Scenarios 2, 3 and 4, and both <4 mm and >4 mm
residues in Scenario 1). To prevent both landfill gas formation and emissions of other potentially
harmful substances into the environment, aerobic biological treatment is employed to reduce the
organic content and thus stabilise the fine residues. This treatment will also ensure compliance with
quality criteria for waste landfilling (Møller et al., 2014), as specified in EU Council Decision
2003/33/EC (European Council, 2003).
A comprehensive description of the process involved in the biological treatment of SR fractions to
be landfilled is reported in Møller et al. (2014). Inventory data are provided by BIOSA Denmark
Aps, based on information originating from an SR-treating plant located in Germersheim,
Germany.
4.1.6.1 Technology description
The biological process for stabilising SR fractions to be landfilled consists of an ad hoc modified
composting process. SR is mixed with water and a bacterial suspension and then laid in up to 100 m
long composting windrows. The composting process lasts for 8-10 weeks at temperatures in the
range 55-75˚C. The composting windrows are turned periodically using windrow turners. As a
result of the composting process, mass is significantly reduced, while the stabilised SR is darker and
presents a finer grain size compared with the SR input into the process. According to chemical
analyses performed in Germersheim, the treated SR material complies with the limits for waste to
be landfilled.
As mentioned previously, the process makes use of inoculum, consisting of a bacterial suspension,
which is meant at enhancing the SR degradation process. However, as the effects of inoculum
addition cannot be quantified, the biological treatment of SR is hereby modelled as a conventional
windrow composting process (i.e. without the addition of microorganisms). This exclusion is
expected not to have a significant impact on the results, for two reasons. Firstly, the use of bacterial
suspension is rather minimal (see Table 12), while other studies (e.g. Boldrin et al., 2013) including
even larger amounts of enzyme-based inoculum have concluded that enzyme production is not a
main contributor to total impact. Secondly, a main effect of inoculum utilisation would be a
shortening of the retention time during the composting process and a subsequent reduction in
electricity and fuel consumption for process operations. However, as shown in Table 12, the
consumption of diesel and electricity is rather minor, and results on potential impacts, presented in
Chapter 5, will show that these make a rather non-significant contribution.
4.1.6.2 Inventory
As there is currently no operating plant for the biological treatment of SR in Denmark, the
inventory dataset is built on data provided by BIOSA Denmark Aps, based on information
originating from a plant treating SR and located in Germersheim, Germany. The information
includes mass balance and data describing the biodegradation and emissions occurring during the
treatment process, as well as emissions from the process. Data on energy consumptions were
estimated by Møller et al. (2014) based on literature data. An overview of the inventory dataset used
for modelling the biological treatment of SR is provided in Table 12.
4.2 Marginal energy production
The treatment of increasing amounts of SR will result in increasing demand for energy (in
particular electricity) to operate the treatment processes. On the other hand, when SR is thermally
treated and energy is recovered, the production of electricity and district heating also has an effect
on the energy market, because the increasing production of electricity and heat from incineration
displaces energy production somewhere else in the system. The substituted marginal electricity was
presumed to by coal, as reported in Astrup et al. (2011b). To cover the future potential development

38 Life cycle assessment of shredder residue management
of the Danish electricity system, gas-based and wind-based marginal electricity scenarios were also
modelled. Marginal heat is much dependent on the settings of the local district heating system. As
described in Jacobsen et al. (2013), it was assumed that the heat from SR incineration substitutes
for average Danish district heating. Inventories for marginal energy productions are provided in
Appendix 7.
4.3 Selection of datasets for the primary production and recycling of
materials
Inventory datasets for the primary production and recycling of materials were selected according to
the recommendations made by Møller et al. (2014). An overview of the datasets used herein is
provided in Table 13, where it is evident that data were retrieved from two sources, namely the
EASETECH and the Ecoinvent databases. As explained in Møller et al. (2014), these data were
selected by prioritising recently developed datasets as well as data having a geographical scope in
accordance with the scope of the present study. A detailed description of the dataset for plastic
recycling is provided in Appendix 7, while a description of the other datasets found in Table 13 is
provided in Møller et al. (2014). Table 12 – Inventory dataset for the biological treatment of SR (adapted from Møller et al., 2014).
Type Parameter Unit Quantity
Input SR ton 1
Bacterial suspension l/ton 3
Electricity kWh/ton 0.2
Diesel l/ton 3
Process C degradation % of biogenic C 17.5
N degradation % of organic N 2.5
Emissions CH4 % of degraded biogenic C 2.7
N2O % of degraded organic N 22
NH3 % of degraded organic N 78
TOC g/ton 17-19
Table 13 – Overview of inventory datasets for the primary production and recycling of materials used in the LCI modelling of SR treatment, as selected by Møller et al. (2014).
Material Process name Type Database Year Reference
Aluminium
Aluminium, Al (Primary), World average, 2005 Primary EASETECH 2005 Clavreul et al., 2014
Aluminium scrap to new alu. sheets (re-melting), Sweden, 2007
Recycling EASETECH 2007 Clavreul et al., 2014
Iron
Steel sheets (97.75% primary), Sweden, 2008 Primary EASETECH 2008 Clavreul et al., 2014
Shredding and reprocessing of steel scrap, Sweden, 2007
Recycling EASETECH 2007 Clavreul et al., 2014
Copper
Copper, primary, at refinery/RER U Primary Ecoinvent 1994 Classen et al., 2009
Copper, secondary, at refinery/RER U Recycling Ecoinvent 1994 Classen et al., 2009
Plastic
Polyethylene, HDPE, granulate, at plant/RER S Primary Ecoinvent 1999 Hischier, 2007
Postconsumer recycled HDPE pellet, US, 2011 Recycling EASETECH 2011 Franklin Associates, 2011
Glass
Glass – bottle (primary), EDIP, 1990 Primary EASETECH 1990 Miljøstyrelsen, 1998
Glass cullet to new products (re-melting), EDIP, 1990
Recycling EASETECH 1998 Miljøstyrelsen, 1998

Life cycle assessment of shredder residue management 39
4.4 Quality Indicator Values for processes used in the LCA
To obtain a more quantitative expression of process quality, all processes used in the study were
assigned a quality indicator value, for the external processes of primary production and recycling, as
well as processes specifically designed for this LCA. The values were assigned to five indicator
categories, as seen in Table 14, based on Weidema & Wesnæs (1996) and as described in Chapter
2.10. They cover the following categories: ‘credibility’, ‘completeness’ and ‘temporal, geographical
and technological correlation’. Assigned indicator values are computed by comparing the processes
with the processes as they should be, in order to fit fully into the environmental assessment
scenarios. Table 14 - Scoring of processes for use in the environmental assessment. All processes are scored with a value 1-5 (‘1’ is the best) for each of the quality indicators.
Material Type Process
Cr
ed
ibil
ity
Co
mp
lete
ne
ss
Te
mp
or
al
Co
rr
ela
tio
n
Ge
og
ra
ph
ica
l C
orr
ela
tio
n
Te
ch
no
log
ica
l C
orr
ela
tio
n
Av
er
ag
e
Processes designed specifically for this project
SR Unsorted Sorting 3.6 3 1 1 3 2
>4 mm Incineration 1 3 2 1 3 2
>4 mm Pyrolysis 3 3 2 2 4 2.8
>4 mm Cement Kiln 4 4 2 4 4 3.6
<4 and >4 mm
Biological Treatment 3 4 1 3 4 3
<4 and >4 mm
Landfill 2 4 2 1 3 2.4
Process name in database
Aluminium Secondary Aluminium scrap to new alu. sheets (re-melting), Sweden, 2007
1 4 3 3 2 2.6
Primary Aluminium, Al (Primary), World average, 2010 1 3 3 2 1 2.0
Iron Secondary Shredding and reprocessing of steel scrap, Sweden, 2007
1 4 3 3 2 2.6
Primary Steel sheets (97.75% primary), Sweden, 2008 1 3 3 3 2 2.4
Copper Secondary Copper, secondary, at refinery/RER U 2 2 3 2 2 2.2
Primary Copper, primary, at refinery/RER U 2 2 3 2 2 2.2
Plastic Secondary Plastic to HDPE granulate, Franklin Associate, USA, 2011
1 3 2 3 2 2.2
Primary Polyethylene, HDPE, granulate, at plant/RER S 1 1 4 1 2 1.8
Glass Secondary Glass cullet to new bottles (re-melting), Denmark, 1998 1 3 4 1 2 2.2
Primary Glass bottle, primary, EDIP, Denmark, 1990 3 3 4 1 1 2.8

40 Life cycle assessment of shredder residue management
5. Evaluation of potential environmental impacts
In this chapter, normalised results regarding potential environmental impacts from the treatment
of SR in Denmark are presented:
as a total impact for individual scenarios;
disaggregated for individual processes within scenarios and
disaggregated for individual material fractions.
Numerically-negative values represent avoided environmental impacts – i.e. environmental savings
related to avoiding the production of material and energy – while numerically-positive values
represent net impacts (i.e. burdens) on the environment. Characterised potential impacts are
provided in Appendix 8.
5.1 Total potential environmental impacts
Potential impacts on non-toxic categories for the analysed scenarios are presented comparatively in
Figure 10. The handling of SR according to Scenario 1 shows overall savings for Global Warming,
Photochemical Oxidant Formation and Terrestrial Eutrophication, mostly because of the benefits
associated with recovering and recycling plastic and aluminium fractions. For all impact categories,
and within the uncertainty estimated in Figure 11, scenarios with increased energy recovery (i.e. S2-
incineration and S4-cement kiln) from SR >4 mm show significantly better environmental
performance compared with the baseline landfill-based scenario (i.e. S1). The increased savings are
related to the avoided production of marginal energy (for S2) and coal (for S4), indicating that
increased energy recovery is a desirable option for the non-toxic categories.
Figure 10 - Normalised potential non-toxic impacts from the treatment of 1 ton of SR in the four analysed scenarios (PE = person equivalent).
-0.08
-0.06
-0.04
-0.02
0
0.02
0.04
0.06
0.08
Global Warming StratosphericOzone Dep.
PhotochemicalOxidant Form.
TerrestrialAcidification
TerrestrialEutrophication
FreshwaterEutrophication
MarineEutrophication
Imp
ac
t P
ote
nti
als
(P
E/t
on
SR
)
Normalised Environmental Impact Potentials Non-toxic Categories
Scenario 1 - Landfill Scenario 2 - Incineration Scenario 3 - Pyrolysis Scenario 4 - Cement kiln

Life cycle assessment of shredder residue management 41
The use of pyrolysis as a thermal treatment option for the >4 mm fraction (i.e. S3) provides benefits
for the Global Warming impact category, while resulting in significant environmental burdens in
the remaining impact categories (in particular Photochemical Oxidant Formation, Terrestrial
Acidification, Terrestrial Eutrophication and Marine Eutrophication), owing in particular to
increased emissions of NOx from the combustion of pyrolysis oil. However, when including the
uncertainty (i.e. Figure 11), it is noticeable that results for S3 are associated with significant
uncertainty, mostly owing to the fact that the dataset for SR pyrolysis included rather broad ranges
of data (see Chapter 4.1.3). This suggests that a clear conclusion on the environmental sustainability
of pyrolysis as a treatment technology for SR is not possible with currently available data and
understanding of the process. This means that further experimental investigations are needed
before it can be concluded on whether pyrolysis is a possible treatment technology for SR.
Figure 11 - Normalised potential non-toxic impacts from the treatment of 1 ton of SR in the four analysed scenarios (PE = person equivalent), including min-max range.
Results for the potential toxic impacts are shown in Figure 12, where it is evident that the four
analysed scenarios have comparable profiles for the impact categories Human Toxicity
Carcinogenic, Particulate Matter and Ionizing Radiation. The three scenarios including the thermal
treatment of >4 mm fractions all show increasing potential impacts on Human Toxicity non-
Carcinogenic and Ecotoxicity compared with the baseline scenarios, owing to increases in emissions
into the air, specifically As and Hg. In particular, Scenario 4 presents potential impacts on Human
Toxicity non-Carcinogenic and Ecotoxicity, which are far larger than the other scenarios, owing
particularly to emissions into the air of Cu, Hg and Zn. Compared to other technologies, these large
impacts are connected with greater emissions, owing to less efficient flue gas cleaning at the cement
plant and higher volatility of these metals due to higher temperature in the kiln. Such findings
confirmed the need for a pre-treatment step to produce an SR feedstock for the cement kiln with an
RDF-like composition. This should especially include the additional screening and sorting of
metals, to reduce the content of heavy metals in the feedstock and thereby significantly decrease
emissions of compounds such as Cu, Hg and Zn into the air.
-0.15
-0.1
-0.05
0
0.05
0.1
0.15
0.2
S1 S2 S3 S4 S1 S2 S3 S4 S1 S2 S3 S4 S1 S2 S3 S4 S1 S2 S3 S4 S1 S2 S3 S4 S1 S2 S3 S4
Global Warming Stratosphericozone depletion
Photochemicaloxidant form.
Terrestrialacidification
Terrestrialeutrophication
Freshwatereutrophication
Marineeutrophication
Imp
ac
t P
ote
nti
als
(P
E/t
on
SR
)
Normalised Environmental Impact Potentials Non-toxic Categories
min max mean

42 Life cycle assessment of shredder residue management
Figure 12 - Normalised potential toxic impacts from the treatment of 1 ton of SR in the four analysed scenarios (PE = person equivalent).
Uncertainty related to the potential impacts on toxic categories is visualised in Figure 13, where it is
noticeable that the results for Human Toxicity non-Carcinogenic (S2 and S4) and Ecotoxicity (S3
and S4) are associated with very significant uncertainty. This is specifically due to large variabilities
relating to some of the air emissions occurring during the different thermal treatment technologies
(i.e. incineration for S2, pyrolysis for S3 and cement kiln for S4), as seen in Chapter 4.1.
Figure 13 - Normalised potential toxic impacts from the treatment of 1 ton of SR in the four analysed scenarios (PE = person equivalent), including min-max range.
Figure 14 and Figure 15 show results from potential Resource Depletion. It is seen that, within the
estimated uncertainty, scenarios including the thermal treament of the SR fraction >4 mm provide
-0.05
0
0.05
0.1
0.15
HuTox,Carcinogenic
HuTox, non-Carcinogenic
ParticulateMatter
IonisingRadiation
EcoToxicity
Imp
ac
t P
ote
nti
als
(P
E/t
on
SR
)Normalised Environmental Impact Potentials
Toxic Categories
Scenario 1 - Landfill Scenario 2 - Incineration Scenario 3 - Pyrolysis Scenario 4 - Cement kiln
0.35 2.64 0.75
-0.5
-0.4
-0.3
-0.2
-0.1
0
0.1
0.2
0.3
0.4
0.5
S1 S2 S3 S4 S1 S2* S3 S4 ** S1 S2 S3 S4 S1 S2 S3 S4 S1 S2 S3* S4 **
HuTox, carcinogenic HuTox, non-carcinogenic
Particulate matter Ionising radiation EcoTox
Imp
ac
t P
ote
nti
als
(P
E/t
on
SR
)
Normalised Environmental Impact Potentials Toxic Categories
min max mean* divided by 10** divided by 100
4.6 2.9* 2.2** 1.2* 2.7**

Life cycle assessment of shredder residue management 43
increased savings in fossil-based Resource Depletion, as a consequence of increased energy recovery
and the subsequent replacement of marginal energy production. With regards to mineral Resource
Depletion, S3 is the only scenario showing significant savings, mostly owing to the recovery of
copper from the SR char produced by pyrolysis.
Figure 14 - Normalised potential Resource Depletion from the treatment of 1 ton of SR in the four analysed scenarios (PE = person equivalent).
Figure 15 - Normalised potential Resource Depletion from the treatment of 1 ton of SR in the four analysed scenarios (PE = person equivalent), including min-max range.
5.1.1 Conclusions regarding total potential environmental impacts
When comparing the four analysed scenarios, the results indicate that introducing the thermal
treatment of SR >4 mm results in significant improvements in the non-toxic impact categories.
-0.25
-0.2
-0.15
-0.1
-0.05
0
0.05
Resources,Fossil
Resources,Mineral
Imp
ac
t P
ote
nti
als
(P
E/t
on
SR
)
Normalised Environmental Impact Potentials Resource Depletion Categories
Scenario 1 - Landfill Scenario 2 - Incineration Scenario 3 - Pyrolysis Scenario 4 - Cement kiln
-0.5
-0.4
-0.3
-0.2
-0.1
0
0.1
S1 S2 S3 S4 S1 S2 S3 S4
Resources, fossil Resources, Mineral
Imp
ac
t P
ote
nti
als
(P
E/t
on
SR
)
Normalised Environmental Impact Potentials Resource Depletion Categories
min max mean

44 Life cycle assessment of shredder residue management
Clear conclusions cannot be drawn with regards to the implementation of S3, as data available for
SR pyrolysis are rather uncertain. Addition experimental investigation is hence needed, preferably
at full-scale testing facilities.
The co-combustion of >4 mm fractions in a cement kiln could result in significant potential impacts
on some of the toxic categories, owing in particular to some of the air emissions. These impacts
could possibly be limited if SR were treated in a way that the content of some critical heavy metals
(i.e. Cu, Hg and Zn) was reduced prior to feeding into the cement kiln.
5.2 Potential environmental impacts by process
In this chapter, potential environmental impacts are disaggregated according to individual
processes, in order to identify and highlight the most sensitive ones.
5.2.1 Scenario 1
Disaggregated results for Scenario 1 are shown in Figure 16. In general, it is evident that the most
significant contributions are associated with the material recycling of plastic and aluminium.
Landfilling of <4 and >4 mm residues contributes potential impacts to Global Warming, Marine
Eutrophication and Ecotoxicity, while bio-treatment prior to landfill contributes almost uniquely to
fossil Resource Depletion, in connection with the use of energy expended to operate the process.
Estimated benefits are associated with avoiding emissions connected with the replacement of
primary productions of plastic and aluminium, namely NMVOC, NOx and SOx (for Photochemical
Oxidant formation), SOx and some NOx (for Acidification), NOx and ammonia (for Terrestrial
Eutrophication) and NOx (for Marine Eutrophication). Regarding human toxicity categories,
savings are due to avoiding emissions of CrVI during plastic production (for Human Toxicity,
Carcinogenic) and Hg from aluminium production (for Human Toxicity, non-Carcinogenic).
Emissions of CrVI and Hg are mainly related to the production and use of energy in the products,
and not directly from the production itself. Savings in Ecotoxicity and Particulate Matter are mainly
caused by recycling plastic and aluminium, and specifically in relation to reduced emissions of V
and CrVI (Ecotoxicity) and PM and SOx (Particulate Matter). The cause is here again contributed to
by the use of energy in the production of materials.
With regards to burdens (i.e. positive impacts), significant contributions are seen in Global
Warming, Terrestrial Eutrophication (i.e. NOx), Marine Eutrophication (i.e. NOx and N), Ecotoxicity
(i.e. As and Ni) and Depletion of Fossil Resources.

Life cycle assessment of shredder residue management 45
Figure 16 - Normalised potential impacts from the treatment of 1 ton of SR in Scenario 1, disaggregated according to individual treatment processes (PE = person equivalent).
5.2.2 Scenario 2
Disaggregated results for Scenario 2 are shown in Figure 17. In general, we see that the most
significant contributions are associated with material recycling – plastic and aluminium – and the
co-combustion of SR at a waste incinerator.
Estimated benefits are associated with avoiding emissions connected with the replacement of
primary productions of materials and energy, namely NOx (for Photochemical Oxidant formation),
SOx and some NOx (for Acidification), NOx (for Terrestrial Eutrophication) and NOx (for Marine
Eutrophication). Regarding human toxicity categories, savings are made from avoiding emissions of
CrVI during plastic production (for Human Toxicity, Carcinogenic) and Hg from Al production (for
Human Toxicity, non-Carcinogenic). Savings in Ecotoxicity and Particulate Matter are mainly
related to the recycling of plastic and aluminium as well as SR co-incineration, and specifically to
reduced emissions of V and CrVI (Ecotoxicity) and PM and SOx (Particulate Matter).
With regards to burdens (i.e. positive impacts), significant contributions are seen in Human
Toxicity non-Carcinogenic (i.e. Zn and some Hg) and Ecotoxicity (i.e. Zn), due to releases from the
co-incineration process.
-0.08
-0.06
-0.04
-0.02
0
0.02
0.04
Glo
ba
l W
arm
ing
Str
ato
sph
eric
Ozo
ne
De
p.
Ph
oto
che
mic
al
Ox
ida
nt
Fo
rm.
Ter
rest
ria
lA
cid
ific
ati
on
Ter
rest
ria
lE
utr
op
hic
ati
on
Fre
shw
ate
rE
utr
op
hic
ati
on
Ma
rin
eE
utr
op
hic
ati
on
Hu
To
x,
Ca
rcin
og
en
ic
Hu
To
x,
no
n-
Ca
rcin
og
en
ic
Pa
rtic
ula
teM
att
er
Ion
isin
gR
ad
iati
on
Eco
To
xic
ity
Re
sou
rces
,F
oss
il
Re
sou
rces
,M
iner
al
Imp
ac
t P
ote
nti
als
(P
E/t
on
SR
)Normalised Environmental Impact Potentials
Scenario 1
Plastic recycling Aluminum recycling Glass Recycling Ferrous Recycling
Landfilling Biotreatment Sorting Plant

46 Life cycle assessment of shredder residue management
Figure 17 - Normalised potential toxic impacts from the treatment of 1 ton of SR in Scenario 2, disaggregated according to individual treatment processes (PE = person equivalent).
5.2.3 Scenario 3
Disaggregated results for Scenario 3 are shown in Figure 18. In general, we note that the most
significant contributions are associated with the material recycling of plastic, aluminium and copper
and with the pyrolysis of SR.
Estimated benefits are associated with avoiding emissions connected with the replacement of
primary productions of materials and energy, namely NMVOC and NOx (for Photochemical Oxidant
formation), SOx and some NOx (for Acidification), NOx (for Terrestrial Eutrophication), and NOx
(for Marine Eutrophication). Regarding human toxicity categories, savings are caused by avoiding
emissions of CrVI during plastic production (for Human Toxicity, Carcinogenic) and Hg from
aluminium production (for Human Toxicity, non-Carcinogenic). Savings in Ecotoxicity and
Particulate Matter are mainly due to the recycling of plastic and aluminium, and specifically to
reduced emissions of Cu and CrVI (Ecotoxicity) and PM (Particulate Matter).
With regards to burdens (i.e. positive impacts), significant contributions originate especially from
the pyrolysis of >4 mm SR. The most significant emissions are NOx (for Photochemical Oxidant
formation), NOx and SOx (for Acidification), NOx (for Terrestrial Eutrophication), P (for Freshwater
Eutrophication), NOx (for Marine Eutrophication), Zn (for Human Toxicity, non-Carcinogenic) and
Cu and V (for Ecotoxicity).
-0.2
-0.15
-0.1
-0.05
0
0.05
0.1
0.15
Glo
ba
l W
arm
ing
Str
ato
sph
eric
Ozo
ne
De
p.
Ph
oto
che
mic
al
Ox
ida
nt
Fo
rm.
Ter
rest
ria
lA
cid
ific
ati
on
Ter
rest
ria
lE
utr
op
hic
ati
on
Fre
shw
ate
rE
utr
op
hic
ati
on
Ma
rin
eE
utr
op
hic
ati
on
Hu
To
x,
Ca
rcin
og
en
ic
Hu
To
x,
no
n-
Ca
rcin
og
en
ic
Pa
rtic
ula
teM
att
er
Ion
isin
gR
ad
iati
on
Eco
To
xic
ity
Re
sou
rces
,F
oss
il
Re
sou
rces
,M
iner
al
Imp
ac
t P
ote
nti
als
(P
E/t
on
SR
)Normalised Environmental Impact Potentials
Scenario 2
Plastic recycling Aluminum recycling Glass RecyclingFerrous Recycling WTE Ash TreatmentLandfilling Biotreatment Sorting Plant
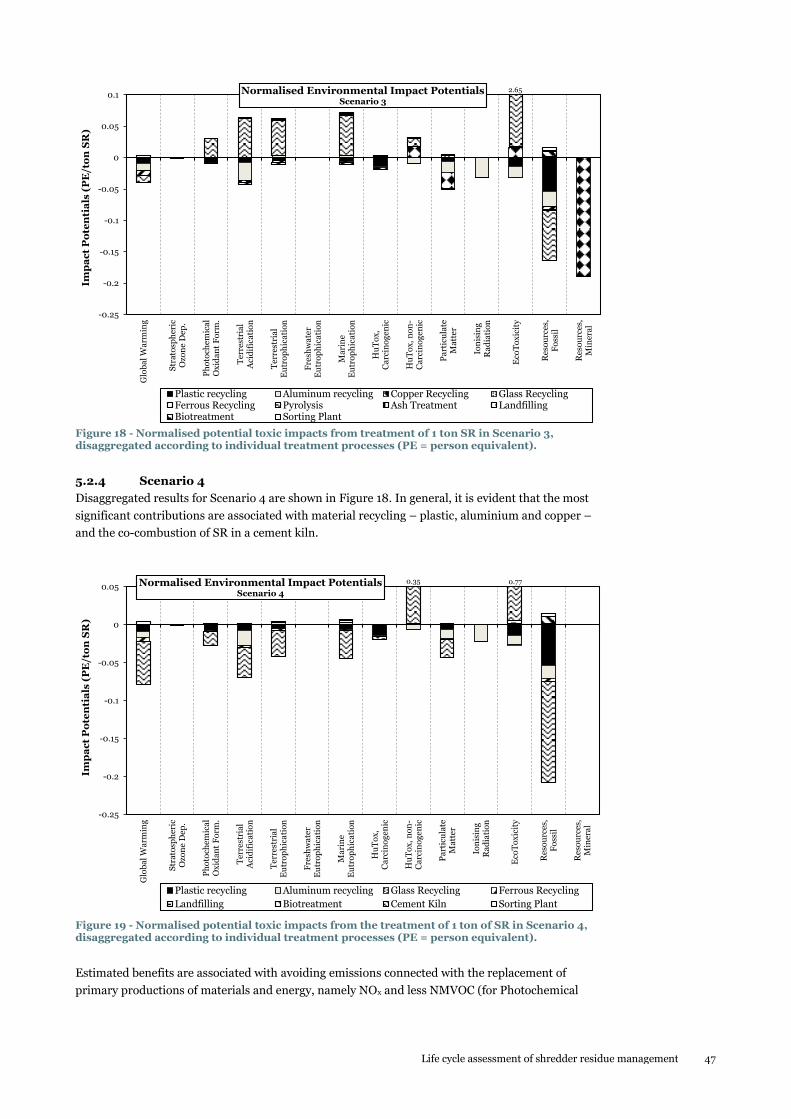
Life cycle assessment of shredder residue management 47
Figure 18 - Normalised potential toxic impacts from treatment of 1 ton SR in Scenario 3, disaggregated according to individual treatment processes (PE = person equivalent).
5.2.4 Scenario 4
Disaggregated results for Scenario 4 are shown in Figure 18. In general, it is evident that the most
significant contributions are associated with material recycling – plastic, aluminium and copper –
and the co-combustion of SR in a cement kiln.
Figure 19 - Normalised potential toxic impacts from the treatment of 1 ton of SR in Scenario 4, disaggregated according to individual treatment processes (PE = person equivalent).
Estimated benefits are associated with avoiding emissions connected with the replacement of
primary productions of materials and energy, namely NOx and less NMVOC (for Photochemical
-0.25
-0.2
-0.15
-0.1
-0.05
0
0.05
0.1
Glo
ba
l W
arm
ing
Str
ato
sph
eric
Ozo
ne
De
p.
Ph
oto
che
mic
al
Ox
ida
nt
Fo
rm.
Ter
rest
ria
lA
cid
ific
ati
on
Ter
rest
ria
lE
utr
op
hic
ati
on
Fre
shw
ate
rE
utr
op
hic
ati
on
Ma
rin
eE
utr
op
hic
ati
on
Hu
To
x,
Ca
rcin
og
en
ic
Hu
To
x,
no
n-
Ca
rcin
og
en
ic
Pa
rtic
ula
teM
att
er
Ion
isin
gR
ad
iati
on
Eco
To
xic
ity
Re
sou
rces
,F
oss
il
Re
sou
rces
,M
iner
al
Imp
ac
t P
ote
nti
als
(P
E/t
on
SR
)Normalised Environmental Impact Potentials
Scenario 3
Plastic recycling Aluminum recycling Copper Recycling Glass RecyclingFerrous Recycling Pyrolysis Ash Treatment LandfillingBiotreatment Sorting Plant
2.65
-0.25
-0.2
-0.15
-0.1
-0.05
0
0.05
Glo
ba
l W
arm
ing
Str
ato
sph
eric
Ozo
ne
De
p.
Ph
oto
che
mic
al
Ox
ida
nt
Fo
rm.
Ter
rest
ria
lA
cid
ific
ati
on
Ter
rest
ria
lE
utr
op
hic
ati
on
Fre
shw
ate
rE
utr
op
hic
ati
on
Ma
rin
eE
utr
op
hic
ati
on
Hu
To
x,
Ca
rcin
og
en
ic
Hu
To
x,
no
n-
Ca
rcin
og
en
ic
Pa
rtic
ula
teM
att
er
Ion
isin
gR
ad
iati
on
Eco
To
xic
ity
Re
sou
rces
,F
oss
il
Re
sou
rces
,M
iner
al
Imp
ac
t P
ote
nti
als
(P
E/t
on
SR
)
Normalised Environmental Impact Potentials Scenario 4
Plastic recycling Aluminum recycling Glass Recycling Ferrous Recycling
Landfilling Biotreatment Cement Kiln Sorting Plant
0.770.35

48 Life cycle assessment of shredder residue management
Oxidant formation), SOx and NOx (for Acidification), NOx (for Terrestrial Eutrophication) and NOx,
and to a lesser contribution from ammonia (for Marine Eutrophication). Regarding human toxicity
categories, savings are caused by avoiding emissions of CrVI and Hg during plastic production (for
Human Toxicity, Carcinogenic) and Hg and As from aluminium production (for Human Toxicity,
non-Carcinogenic). Savings in Ecotoxicity and Particulate Matter are related mainly to the recycling
of plastic and aluminium, and specifically to reduced emissions of V and CrVI (Ecotoxicity) and PM
and SOx (Particulate Matter).
5.2.5 Conclusions regarding potential environmental impacts by process
The results are mostly influenced by the recycling of individual materials and thermal treatment,
while SR landfilling generates limited potential impacts. The latter is related to the specific nature
of SR, meaning that both the generation of gas and the release of metals into leachate are limited.
Results show that the recovery and recycling of plastic and metal fractions provide significant
benefits and should thus be continued and possibly further improved. While for many impact
categories emissions of SOx and NOx (either in foreground or background processes) may be the
main contributors, significant improvements in scenarios 2, 3 and 4 could be achieved by limiting
emissions into the air of Cu and Zn during thermal treatment and the related impacts on especially
some of the toxic categories. This possibly could be achieved by properly pre-treating >4 mm
residues, in order to reduce the content of metals in the material fed into such processes.
5.3 Potential environmental impacts by material fraction
In Figure 20 (and Figure 25 in Appendix 8), normalised potential impacts on Global Warming are
presented as per unitary input (i.e. 1 ton) of individual material fractions. In general, it is
noteworthy that the recycling of both ferrous and non-ferrous metals provides the greatest savings,
and it should thus be the first priority when analysing and designing a management scheme for SR.
The next material is plastic, which can provide significant savings, especially if different resins are
effectively sorted and the least possible amount of cross-contamination is achieved.
With regards to the >4 mm residues fraction, the benefits potentially achievable are, to some extent,
less significant than for the other fractions. The thermal treatment of >4 mm fractions induces
significant improvements in the results for the impact on Global Warming, especially when looking
at incineration and cement kilns. Results for pyrolysis of >4 mm residues are associated with very
significant uncertainty, spanning from major savings in the case of optimal pyrolysis performance
to positive burdens in the case of a bad configuration. As mentioned above, better data for pyrolysis
are needed, in order to obtain more precise results, which can then be used as a basis for
recommendations.

Life cycle assessment of shredder residue management 49
Figure 20 - Normalised potential Global Warming impacts in the four analysed scenarios, disaggregated according to individual material fractions and presented as per 1 ton of material (PE = person equivalent).
5.4 Sensitivity analysis
Sensitivity analysis is typically employed for identifying parameters, processes and datasets which
make a significant contribution to the overall impacts of the analysed system and can thus be
critical for results. As both contribution analysis and uncertainty quantification were performed in
the previous sessions, the focus of the present sensitivity analysis is on the choice of background
(i.e. marginal) electricity technology, which is often one of the most important decisions in an LCA,
as both the usage and offsetting of electricity play a crucial role in overall savings. If the choice of
marginal electricity was made as a part of the Monte Carlo simulation, it would be rather difficult to
interpret whether the uncertainty was due to parameter variation or whether it was due to the
scenario choice for the assumed electricity. It was therefore decided to perform a sensitivity analysis
to assess what the impact would be if marginal electricity was not based on coal, as in the rest of the
analysis, but instead on natural gas or wind power, which are possible future electricity sources in
Denmark.
Datasets for electricity production relate to natural gas and coal. For this we used processes from
the NEEDS (2008) project, which forecasted emissions associated with future energy generation.
For electricity based on natural gas, a process for a 500MWe combined cycle plant was used. For
wind power, a process for an offshore wind farm of 752 MW was used.
5.4.1 Sensitivity analysis of total potential environmental impacts
Potential impacts on non-toxic categories for the analysed scenarios in the sensitivity analysis are
presented comparatively in Figure 21. The figure shows that for most impact categories the change
in marginal electricity does not result in significant differences. Scenarios 1 (landfilling) and 4
(utilisation in a cement kiln) show increased savings, owing to the lower impacts resulting from the
sorting and upgrading of materials, while no electricity is being offset. In this context, it should be
mentioned that coal is still the energy source substituted in the cement kiln, as cement kilns will be
operated on fossil fuels for several more decades to come. In the case of scenarios 2 (incineration)
and 3 (pyrolysis), most impact categories show reduced overall savings, owing to the fact that the
offset electricity has a lower impact.
-0.5
-0.4
-0.3
-0.2
-0.1
0
0.1
0.2
S1 S2 S3 S4 S1 S2 S3 S4 S1 S2 S3 S4 S1 S2 S3 S4 S1 S2 S3 S4 S1 S2 S3 S4
Mixed SR Glass Plastic Nfe metals Fe metals >4 mm
Imp
ac
t P
ote
nti
als
(P
E/t
on
ma
ter
ial)
Normalised Environmental Impact PotentialsGlobal Warming Impact Category
min max mean

50 Life cycle assessment of shredder residue management
In general, the ranking of scenarios according to their net impact is not affected by the change in
marginal electricity. The only exception is the Global Warming category, demonstrating that when
offsetting natural gas, incineration provides similar savings compared with landfilling, while the
scenario based on pyrolysis is close to not offering a net saving. When considering wind power as
the marginal electricity source, both scenarios based on incineration and pyrolysis have worse
performance than the scenario based on landfilling. For all non-toxic impact categories, the
scenario based on a cement kiln still seems the best option, as it is assumed that, even in the future,
coal will still be used in kilns.
Potential impacts on toxic categories for the analysed scenarios in the sensitivity analysis are
presented comparatively in Figure 22. The figure shows that for most impact categories, the results
are not associated with significant changes, the reason being that most impacts on toxic categories
are due to direct emissions or the offsetting of materials being recycled.
Potential impacts on Resource Depletion for the analysed scenarios in the sensitivity analysis are
presented comparatively in Figure 23, which shows the same finding for fossil resources as for
Global Warming potential, although in this case the ranking does not change. The reason for this is
that even though there are very few resources offset from energy generation, fossil resources are still
avoided through material recycling. For the depletion of mineral resources there is no change in
impact when modifying marginal electricity.
The sensitivity analysis highlights that with the cleaner energies being offset, the more important it
becomes to recycle plastic in SR, or sort it out in an RDF fraction for the cement kiln.
Figure 21 - Normalised potential non-toxic impacts from the treatment of 1 ton of SR in the four analysed scenarios modelled using alternative marginal electricity production (i.e. coal, natural gas and wind). (PE = person equivalent).
-0.1
-0.08
-0.06
-0.04
-0.02
0
0.02
0.04
0.06
0.08
Global Warming StratosphericOzone Dep.
PhotochemicalOxidant Form.
TerrestrialAcidification
TerrestrialEutrophication
FreshwaterEutrophication
MarineEutrophication
Imp
ac
t P
ote
nti
als
(P
E/t
on
SR
)
Normalised Environmental Impact Potentials Non-toxic Categories
Scenario 1 - Landfill Scenario 2 - Incineration Scenario 3 - Pyrolysis Scenario 4 - Cement kiln
Scenario 1 (natural gas) Scenario 2 (natural gas) Scenario 3 (natural gas) Scenario 4 (natural gas)
Scenario 1 (wind) Scenario 2 (wind) Scenario 3 (wind) Scenario 4 (wind)

Life cycle assessment of shredder residue management 51
Figure 22 - Normalised potential toxic impacts from the treatment of 1 ton of SR in the four analysed scenarios modelled using alternative marginal electricity production (i.e. coal, natural gas and wind). (PE = person equivalent). Note that the following impacts were divided by 1,000: Ecotoxicity for Scenario 3 and 4; Human Toxicity non-Carcinogenic for Scenario 4.
Figure 23 - Normalised potential Resource Depletion from the treatment of 1 ton of SR in the four analysed scenarios modelled using alternative marginal electricity production (i.e. coal, natural gas and wind). (PE = person equivalent).
-0.05
-0.03
-0.01
0.01
0.03
0.05
0.07
0.09
0.11
0.13
HuTox, Carcinogenic HuTox, non-Carcinogenic
Particulate Matter Ionising Radiation EcoToxicity
Imp
ac
t P
ote
nti
als
(P
E/t
on
SR
)Normalised Environmental Impact Potentials
Toxic Categories
Scenario 1 - Landfill Scenario 2 - Incineration Scenario 3 - Pyrolysis Scenario 4 - Cement kiln
Scenario 1 (natural gas) Scenario 2 (natural gas) Scenario 3 (natural gas) Scenario 4 (natural gas)
Scenario 1 (wind) Scenario 2 (wind) Scenario 3 (wind) Scenario 4 (wind)
** *
* * *
* divided by 10
-0.25
-0.2
-0.15
-0.1
-0.05
0
0.05
Resources, Fossil Resources, Mineral
Imp
ac
t P
ote
nti
als
(P
E/t
on
SR
)
Normalised Environmental Impact Potentials Resource Depletion categories
Scenario 1 - Landfill Scenario 2 - Incineration Scenario 3 - Pyrolysis Scenario 4 - Cement kiln
Scenario 1 (natural gas) Scenario 2 (natural gas) Scenario 3 (natural gas) Scenario 4 (natural gas)
Scenario 1 (wind) Scenario 2 (wind) Scenario 3 (wind) Scenario 4 (wind)
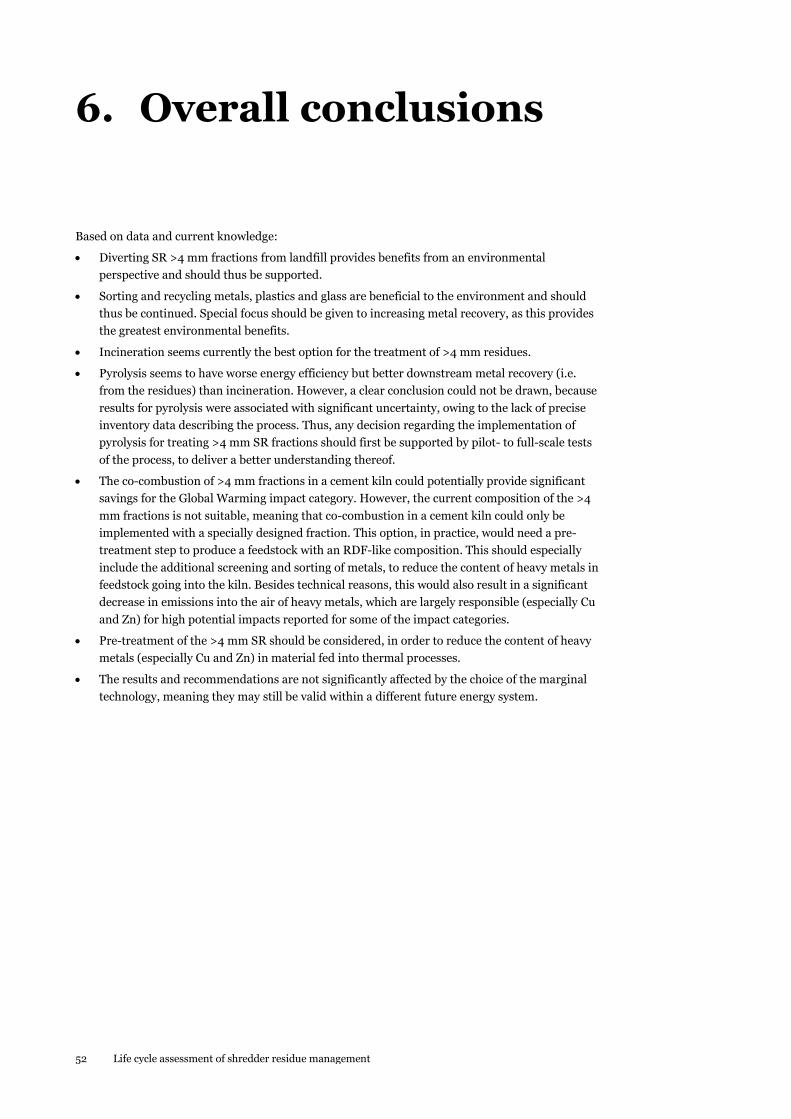
52 Life cycle assessment of shredder residue management
6. Overall conclusions
Based on data and current knowledge:
Diverting SR >4 mm fractions from landfill provides benefits from an environmental
perspective and should thus be supported.
Sorting and recycling metals, plastics and glass are beneficial to the environment and should
thus be continued. Special focus should be given to increasing metal recovery, as this provides
the greatest environmental benefits.
Incineration seems currently the best option for the treatment of >4 mm residues.
Pyrolysis seems to have worse energy efficiency but better downstream metal recovery (i.e.
from the residues) than incineration. However, a clear conclusion could not be drawn, because
results for pyrolysis were associated with significant uncertainty, owing to the lack of precise
inventory data describing the process. Thus, any decision regarding the implementation of
pyrolysis for treating >4 mm SR fractions should first be supported by pilot- to full-scale tests
of the process, to deliver a better understanding thereof.
The co-combustion of >4 mm fractions in a cement kiln could potentially provide significant
savings for the Global Warming impact category. However, the current composition of the >4
mm fractions is not suitable, meaning that co-combustion in a cement kiln could only be
implemented with a specially designed fraction. This option, in practice, would need a pre-
treatment step to produce a feedstock with an RDF-like composition. This should especially
include the additional screening and sorting of metals, to reduce the content of heavy metals in
feedstock going into the kiln. Besides technical reasons, this would also result in a significant
decrease in emissions into the air of heavy metals, which are largely responsible (especially Cu
and Zn) for high potential impacts reported for some of the impact categories.
Pre-treatment of the >4 mm SR should be considered, in order to reduce the content of heavy
metals (especially Cu and Zn) in material fed into thermal processes.
The results and recommendations are not significantly affected by the choice of the marginal
technology, meaning they may still be valid within a different future energy system.

Life cycle assessment of shredder residue management 53
References
Ahmed, N., Wenzel, H., & Hansen, J. B. (2014). Characterization of Shredder Residues generated
and deposited in Denmark. Waste Management, 34(7): 1279-88. doi:
10.1016/j.wasman.2014.03.017
Allegrini, E., Maresca, A., Emil, M., Sommer, M., Boldrin, A., & Astrup, T. F. (2014). Quantification
of the Resource Recovery Potential of Municipal Solid Waste Incineration Bottom Ashes. Waste
Management. doi: 10.1016/j.wasman.2014.05.003.
Astrup, T., Riber, C., & Pedersen, A. J. (2011a). Incinerator performance: effects of changes in waste
input and furnace operation on air emissions and residues. Waste Management & Research,
29(10 Suppl), 57–68. doi:10.1177/0734242X11419893
Astrup, T., Dall, O., & Wenzel, H. (2011b). Fastlæggelse af energidata til brug i CO2-opgørelser. Part
of the report: CO2 opgørelser i den danske affaldsbranche – en vejledning, affald danmark og
Dakofa, København, oktober 2011.
Biganzoli, L., & Grosso, M. (2013). Aluminium recovery from waste incineration bottom ash, and its
oxidation level. Waste Management & Research, 31(9), 954–9. doi:10.1177/0734242X13493956
Blok, K., Huijbregts, M., Roes, L., van Haaster, B., Patel, M., Hertwich, E., Wood, R., Hauschild,
M.Z., Sellke, P., Antunes, P., Hellweg, S., Ciroth, A., Harmelink, M. (2013). Development and
application of a standardized methodology for the PROspective SUstaInability assessment of
TEchnologies (PROSUITE). Report prepared within the EC 7th Framework Project, n°: 227078.
Boldrin, A., Balzan, A., Astrup, T. (2013) Energy and environmental analysis of a rapeseed
biorefinery conversion process. Biomass Conversion and Biorefinery, 3, 127–141. doi:
10.1007/s13399-013-0071-9
Boughton, B., & Horvath, A. (2006). Environmental assessment of shredder residue management.
Resources, Conservation and Recycling, 47(1), 1–25. doi:10.1016/j.resconrec.2005.09.002
Cencic, O., & Rechberger, H. (2008). Material flow analysis with software STAN. Journal of
Environmental Engineering & Management, 18(1), 3–7.
Christensen, T. H., Gentil, E., Boldrin, A., Larsen, A. W., Weidema, B. P., & Hauschild, M. (2009). C
balance, carbon dioxide emissions and global warming potentials in LCA-modelling of waste
management systems. Waste Management & Research, 27(8), 707–15.
doi:10.1177/0734242X08096304
Ciacci, L., Morselli, L., Passarini, F., Santini, A., & Vassura, I. (2010). A comparison among different
automotive shredder residue treatment processes. The International Journal of Life Cycle
Assessment, 15(9), 896–906. doi:10.1007/s11367-010-0222-1
Classen, M., Althaus, H., & Blaser, S. (2007). Life cycle inventories of metals. Data v2.1. Final
Report Ecoinvent Data. Ecoinvent v2.1 report No. 10, Ecoinvent Centre, Dübendorf, March
2009.
Clavreul, J., Baumeister, H., Christensen, T. H., and Damgaard, A. (2014). An environmental
assessment system for environmental technologies. Environmental Modelling and Software,
60, 18-30. doi: 10.1016/j.envsoft.2014.06.007
Cramer, J., Malmgren-Hansen, B., Overgaard, J., & Larsen, O. H. (2006). Metoder til behandling af
tungmetalholdigt affald - Fase 3. Miljøprojekt Nr. 1055, Miljøstyrelsen, Copenhagen, Denmark.

54 Life cycle assessment of shredder residue management
Daugaard, Anja Egede (2014). Personal communication with Anja Egede Daugaard, Senior Process
Manager, FLSmidth A/S, Valby, Denmark.
De Marco, I., Caballero, B. M., Cabrero, M. a., Laresgoiti, M. F., Torres, a., & Chomón, M. J. (2007).
Recycling of automobile shredder residues by means of pyrolysis. Journal of Analytical and
Applied Pyrolysis, 79(1-2), 403–408. doi:10.1016/j.jaap.2006.12.002
Energistyrelsen. (2012). Technology Data for Energy Plants. Generation of electricity and district
heating, energy storage and energy carrier generation and conversion. Energistyrelsen.
European Council (2000). Directive 2000/53/EC of the European Parliament and of the Council of
18 September 2000 on end-of life vehicles - Commission Statements. Official Journal L 269,
0034–0043, Brussels, 2000.
European Council (2003). December 2002 establishing criteria and procedures for the acceptance
of waste at landfills pursuant to Article 16 of and Annex II to Directive 1999/31/EC. Official
Journal of the European Communities. Brussels, 2002.
Fiore, S., Ruffino, B., & Zanetti, M. C. (2012). Automobile Shredder Residues in Italy:
characterization and valorization opportunities. Waste Management, 32(8), 1548–59.
doi:10.1016/j.wasman.2012.03.026
Fonseca, A. S., Nunes, M. I., Matos, M. A., & Gomes, A. P. (2013). Environmental impacts of end-of-
life vehicles’ management: recovery versus elimination. The International Journal of Life Cycle
Assessment, 18(7), 1374–1385. doi:10.1007/s11367-013-0585-1
Forton, O. T., McGrady, L., Singh, M. M., Taylor, E. R. M., Moles, N. R., & Harder, M. K. (2007).
Characterisation of rotary kiln residues from the pyrolysis of shredder residues: Issues with
lead. Journal of Analytical and Applied Pyrolysis, 79(1-2), 395–402.
doi:10.1016/j.jaap.2007.01.016
Franklin Associates. (2011). Life Cycle Inventory of 100% postconsumer HDPE and PET recycled
resin from postconsumer containers and packaging. Prepared for the Plastics Division of The
American Chemistry Council, Inc., the Association Of Postconsumer Plastic Recyclers (APR),
the National Association For Pet Container Resources (NAPCOR), and the Pet Resin
Association (PETRA).
Frischknecht, R., Jungbluth, N., Althaus, H., Doka, G., Dones, R., Heck, T., Hellweg, S., Hischier,
R., Nemecek, T., Rebitzer, G., Spielmann, M., Wernet, G. (2007). Overview and methodology.
Ecoinvent Rep. Ecoinvent v2.0 report No. 1, Ecoinvent Centre, Dübendorf, December 2007.
Galvagno, S., Fortuna, F., Cornacchia, G., Casu, S., Coppola, T., & Sharma, V. (2001). Pyrolysis
process for treatment of automobile shredder residue: preliminary experimental results. Energy
Conversion and Management, 42(5), 573–586. doi:10.1016/S0196-8904(00)00089-3
Hansen, J. B., Hjelmar, O., & Hyks, J. (2011a). Karakterisering af shredderaffald. Reno Djurs I/S,
Rapport, February 2011.
Hansen, J. B., Hyks, J., & Hjelmar, O. (2011b). Deponering af shredderaffald Undersøgelse af
driftsforhold til nedbringelse af efterbehandlingstiden. Reno Djurs I/S, Statusrapport 2010,
Juli 2011.
Hansen, J. B., Hyks, J., Ahmed, N., Wenzel, H., Wellendorph, P., Nedenskov, J., Andersen, F.,
Thrane, J., Therkildsen, M. (2012). Lavteknologisk genanvendelse af ressource i deponeret
shredderaffald via størrelsesfraktionering. Miljøprojekt Nr. 1440, Miljøstyrelsen, Copenhagen,
Denmark.
Hischier, R. (2007). Life Cycle Inventories of Packagings & Graphical Papers. Data v2.0. Ecoinvent
v2.0 report No. 11, Ecoinvent Centre, Dübendorf, December 2007.
Hyks, J., & Astrup, T. (2009). Influence of operational conditions, waste input and ageing on
contaminant leaching from waste incinerator bottom ash: a full-scale study. Chemosphere,
76(9), 1178–84. doi:10.1016/j.chemosphere.2009.06.040

Life cycle assessment of shredder residue management 55
Hyks, J., Oberender, A., Hjelmar, O., Cimpan, C., Wenzel, H., Hu, G., & Cramer, J. (2014). Shredder
residues: Problematic sub-stances in relation to resource recovery. Miljøprojekt Nr. 1568,
Miljøstyrelsen, Copenhagen, Denmark.
Høstgaard, J., Andersen, K. R., Franck, N., Knudsen, N. O., Ahmed, N. S., Wenzel, H., Dall, O.,
Malmgren-Hansen, B., Nielsen, E.M., Olsen, R., Overgaard, J. (2012). Forbedret
ressourceudnyttelse af shredderaffald. Miljøprojekt Nr. 1441, Miljøstyrelsen, Copenhagen,
Denmark.
Jakobsen, J. B., Møller, J., Kromann, M., Neidel, T. L., & Jensen, M. B. (2013). Miljø-og
samfundsøkonomisk vurdering af muligheder for øget genanvendelse af papir, pap, plast, metal
og organisk affald fra dagrenovation. Miljøprojekt Nr. 1458, Miljøstyrelsen, Copenhagen,
Denmark.
Joint Research Centre (JRC) (2011). European Commission Joint Research Centre - Institute for
Environment and Sustainability: International Reference Life Cycle Data System (ILCD)
Handbook- Recommendations for Life Cycle Impact Assessment in the European context. First
edition November 2011. EUR 24571 EN. Luxemburg. Publications Office of the European
Union; 2011
Malmgren-Hansen, B., Tønning, K., Cramer, J., Wismann, T., Overgaard, J., & Ottosen, L. M.
(2002). Genanvendelseseffektivitet af hvidblik- og stålemballager. Miljøstyrelsen, Copenhagen,
Denmark.
Mancini, G., Tamma, R., & Viotti, P. (2010). Thermal process of fluff: preliminary tests on a full-
scale treatment plant. Waste Management, 30(8-9), 1670–82.
doi:10.1016/j.wasman.2010.01.037
Mancini, G., Viotti, P., Luciano, A., & Fino, D. (2014). On the ASR and ASR thermal residues
characterization of full scale treatment plant. Waste Management, 34(2):448-57. doi:
10.1016/j.wasman.2013.11.002.
Marco, I. De, Caballero, B., Torres, A., Laresgoiti, M. F., Chomón, M. J., & Cabrero, M. A. (2002).
Recycling polymeric wastes by means of pyrolysis. Journal of Chemical Technology &
Biotechnology, 77(7), 817–824. doi:10.1002/jctb.636
Mirabile, D., Pistelli, M. I., Marchesini, M., Falciani, R., & Chiappelli, L. (2002). Thermal
valorisation of automobile shredder residue: injection in blast furnace. Waste Management,
22(8), 841–51.
Miljøstyrelsen (1998). Process from the EDIP database. Life Cycle Assessment of Packaging
Systems for Beer and Soft Drinks, Environmental Project No 401, København, Denmark.
Morselli, L., Santini, A., Passarini, F., & Vassura, I. (2010). Automotive shredder residue (ASR)
characterization for a valuable management. Waste Management, 30(11), 2228–34.
doi:10.1016/j.wasman.2010.05.017
Møller, J., Damgaard, A., Brogaard, L. K.-S., & Astrup, T. F. (2014). Livscyklusvurdering af
behandling af deponeret shredderaffald. Miljøprojekt Nr. [In press], Miljøstyrelsen,
Copenhagen, Denmark.
Nedenskov, J. (2013). Forsøg med forbrænding af shredderaffald. Amagerforbrænding,
Copenhagen, Denmark.
Nielsen, E. M., Hansen, H. J., Hundebøl, I., Hansen, K. W., Johansen, M. S., Nørholm, N. D., &
Overgaard, J. (2006). Undersøgelse af mulighederne for termisk oparbejdning af mekanisk
separeret shredderaffald. Miljøprojekt Nr. 1133, Miljøstyrelsen, Copenhagen, Denmark.
Nieminen, M., Suomalainen, M., & Mäkinen, T. (2006). Gasification of Shredder Residue. Research
Notes 2344, VTT Tiedotteita, Espoo, Finland.
Nourreddine, M. (2007). Recycling of auto shredder residue. Journal of Hazardous Materials,
139(3), 481–90. doi:10.1016/j.jhazmat.2006.02.054
56 Life cycle assessment of shredder residue management
Osada, M., Tanigaki, N., Takahashi, S., & Sakai, S. (2008). Brominated flame retardants and heavy
metals in automobile shredder residue (ASR) and their behavior in the melting process. Journal
of Material Cycles and Waste Management, 10(2), 93–101. doi:10.1007/s10163-007-0204-y
Pasel, C., & Wanzl, W. (2003). Experimental investigations on reactor scale-up and optimisation of
product quality in pyrolysis of shredder waste. Fuel Processing Technology, 80(1), 47–67.
doi:10.1016/S0378-3820(02)00187-X
Passarini, F., Ciacci, L., Santini, A., Vassura, I., & Morselli, L. (2012). Auto shredder residue LCA:
implications of ASR composition evolution. Journal of Cleaner Production, 23(1), 28–36.
doi:10.1016/j.jclepro.2011.10.028
Poulsen, P. B., Westborg, S., & Cramer, J. (2011). Forprojekt til analyse af shredderaffald ifht.
farlighed. Miljøprojekt Nr. 1374, Miljøstyrelsen, Copenhagen, Denmark.
Redin, L. a., Hjelt, M., & Marklund, S. (2001). Co-combustion of shredder residues and municipal
solid waste in a Swedish municipal solid waste incinerator. Waste Management & Research,
19(6), 518–525. doi:10.1177/0734242X0101900607
Roy, C., & Chaala, a. (2001). Vacuum pyrolysis of automobile shredder residues. Resources,
Conservation and Recycling, 32(1), 1–27. doi:10.1016/S0921-3449(00)00088-4
Ruffino, B., Fiore, S., & Zanetti, M. C. (2014). Strategies for the enhancement of automobile
shredder residues (ASRs) recycling: results and cost assessment. Waste Management, 34(1),
148–55. doi:10.1016/j.wasman.2013.09.025
Santini, A., Morselli, L., Passarini, F., Vassura, I., Di Carlo, S., & Bonino, F. (2011). End-of-Life
Vehicles management: Italian material and energy recovery efficiency. Waste Management,
31(3), 489–94. doi:10.1016/j.wasman.2010.09.015
Saxena, S., Rao, N., Rehmat, A., & Mensinger, M. (1995). Combustion and co-combustion of auto
fluff. Energy, 20(9), 877–887. doi: 10.1016/0360-5442(95)00038-I
Scheutz, C., Fredenslund, A. M., Nedenskov, J., & Kjeldsen, P. (2010a). Release and fate of
fluorocarbons in a shredder residue landfill cell: 1. Laboratory experiments. Waste
Management, 30(11), 2153–62. doi:10.1016/j.wasman.2010.03.035
Scheutz, C., Fredenslund, A. M., Nedenskov, J., & Kjeldsen, P. (2010b). Release and fate of
fluorocarbons in a shredder residue landfill cell: 2. Field investigations. Waste Management,
30(11), 2163–9. doi:10.1016/j.wasman.2010.03.033
Scheutz, C., Fredenslund, A. M., Nedenskov, J., Samuelsson, J., & Kjeldsen, P. (2011). Gas
production, composition and emission at a modern disposal site receiving waste with a low-
organic content. Waste Management, 31(5), 946–55. doi:10.1016/j.wasman.2010.10.021
Seerup, U. (2012). Tillæg til miljøgodkendelse. For: I/S Reno-Nord. Godkendelsen omfatter:
Forbrænding af shredderaffald. Miljøstyrelsen, J.nr. MST-1270-00687, Århus, Denmark.
Shen, Z., Day, M., Cooney, J. D., Lu, G., Briens, C. L., & Bergougnou, M. a. (1995). Ultrapyrolysis of
automobile shredder residue. The Canadian Journal of Chemical Engineering, 73(3), 357–366.
doi:10.1002/cjce.5450730313
Skatteministeriet (2011). Lovbekendtgørelse nr. 311 af 1. april 2011 om afgift af affald og råstoffer
(Consolidation Act on fee on waste and raw materials). Skatteministeriet, Copenhagen,
Denmak.
Vermeulen, I., Block, C., Van Caneghem, J., Dewulf, W., Sikdar, S. K., & Vandecasteele, C. (2012).
Sustainability assessment of industrial waste treatment processes: The case of automotive
shredder residue. Resources, Conservation and Recycling, 69, 17–28.
doi:10.1016/j.resconrec.2012.08.010
Weidema, B., & Wesnæs, M. (1996). Data quality management for life cycle inventories—an
example of using data quality indicators. Journal of Cleaner Production, 4(3), 167–174. doi:
10.1016/S0959-6526(96)00043-1

Life cycle assessment of shredder residue management 57
Zolezzi, M., Nicolella, C., Ferrara, S., Iacobucci, C., & Rovatti, M. (2004). Conventional and fast
pyrolysis of automobile shredder residues (ASR). Waste Management, 24(7), 691–9.
doi:10.1016/j.wasman.2003.12.005

58 Life cycle assessment of shredder residue management
Appendix 1: List of processes from databases used in the LCA
Table 15 shows the datasets retrieved from LCA databases and used in EASETECH to model the
treatment of SR. Table 15 – Overview of datasets used for LCA modelling of SR treatment.
Database Process
EASETECH Road, Long haul truck, Euro3, 25t, Generic, 2006
EASETECH Marginal Electricity Consumption incl. Fuel Production, Coal, Energy Quality, DK, kWh, 2006
EASETECH Electricity, natural gas, at power plant, NORDEL
EASETECH District Heating, marginal average, (DK), kWh, 2012
EASETECH Natural Gas in Industry Burner (prod + comb), >100 kW, 1996
EASETECH Extraction of sub-base material - gravel (L/S 10)
EASETECH Aluminium, Al (Primary), World average, 2005
EASETECH LPG (prod + comb), kg, TERMINATED, 1990
EASETECH LIMITED - Glass - bottle (primary), EDIP, 1990
EASETECH Natural gas, EU-27, ELCD, 2002 - corrected
EASETECH Water from Waterworks, Sweden, 2008
EASETECH Collection Vehicle, 10t Euro3, urban traffic, 1 liter diesel, 2006
EASETECH Hard Coal in Power Plant (prod + comb), EU-15, 2003
EASETECH Oxygen, EU-27, ELCD, 2005 - corrected
EASETECH Steel Sheets (97.75% primary), Sweden, 2008
EASETECH District Heating, Scania county, kWh, SE, 2008
EASETECH Polyethylene high density granulate (PE-HD), RER, ELCD, 1999 - corrected
EASETECH brass, at plant, CH
EASETECH Process water, RER, ELCD, 2005 - corrected
EASETECH LIMITED - Hydrated Lime, CaOH2, EU-27, ELCD, 2007
EASETECH lead, primary, at plant, GLO
Ecoinvent 2.2 Light fuel oil, burned in industrial furnace 1 M, non-modulating, RER, modified
EASETECH (EDIP, IPU-NF-E2752)
Production and Combustion of Diesel Oil in Truck, EU2, 1998
EASETECH (UUID) Sodium chloride (NaCl), RER, ELCD, 1996 - corrected
EASETECH (UUID) Sodium hydroxide (NaOH), RER, ELCD, 1996 - corrected
Ecoinvent 2.2 Polyethylene, HDPE, granulate, at plant, RER
Ecoinvent 2.2 Copper, primary, at refinery, RER
Ecoinvent 2.2 Copper, secondary, at refinery, RER
Ecoinvent 2.2 Lead, secondary, at plant, RER
Ecoinvent 2.2 Zinc, primary, at regional storage, RER
Ecoinvent 2.2 Heat, natural gas, at boiler atmospheric low-NOx non-modulating <100kW, RER
ELCD LIMITED - Limestone, CaCO3, EU-27, ELCD, 2006
LIPASTO
ILCD Wheel loader, combustion 1L of diesel, 2003/20
LIPASTO
ILCD Earth moving lorry, Gross vehicle mass 32t, pay load capacity 19t,Highway driving,EURO4 LIPASTO
LIPASTO
ILCD Bulldozer, combustion 1L of diesel, 2003/2011

Life cycle assessment of shredder residue management 59
Appendix 2: Chemical composition of newly produced shredder residues
An overview of literature studies providing composition data for SR is provided in Table 16, where
data are divided according to geographical origin. Table 16 shows that there are considerable
differences in the type of shredder residues included in the studies. While in other countries most
data represent ASR, the majority of data for Denmark focus on SR as a mixture of ASR and waste
from other sources, indicating that data may not be directly comparable. Table 16 – Literature overview of composition data on shredder residues.
Geographical area Reference Dataset description
Denmark Cramer et al. (2006)
SR-1996
SR-2002
SR-2002
Nielsen et al. (2006) ASR (100%)
SR (80 SR-20% ASR)
Nieminen et al. (2006) ASR (100%)
SR
SR-2005
Hansen et al. (2011a) SR
Nedenskov (2013)
SR- Prøve 1
SR-Prøve 2
Poulsen et al. (2011) SR-Del 1
SR-Del 2
SR-Del 3
Høstgaard (2012) SR-1 (with <4mm)
SR-2 (without <4mm)
Italy Galvagno et al. (2001) ASR-min
ASR-max
Mirabile et al. (2002) ASR
Zolezzi et al. (2004) ASR
Mancini et al. (2010) ASR
Fluff 1
Fluff 2
Fluff 3
Morselli et al. (2010) ASR
Santini et al. (2011) ASR-min
ASR-max
Ruffino et al. (2014) ASR
Fiore (2012) SR
ASR1
ASR2
LF
LF < 4 mm
LF > 4 mm,
Mancini et al. (2014) ASR-2007
ASR-2008
Japan Osada et al. (2008) ASR
Korea Roh (2013) ASR
Spain de Marco (2007) Light ASR
Heavy ASR
Sweden Nourredine (2007) ASR
United States Saxena et al. (1995) ASR

60 Life cycle assessment of shredder residue management
Table 17 presents physicochemical characteristics of typical Danish SR and ASR. For individual
parameters, a ratio (based on average values) between SR and ASR is calculated to enable an overall
comparison of the two types of materials. The results indicate that compared with ASR, SR present
a higher content of metals (e.g. Al, Fe, Mn) and a lower content of combustibles (e.g. C, LHV). SR is
also enriched with some of the critical heavy metals (e.g. Cr, Cu, Mo, Ni, Pb, Zn), possibly because of
the industrial origin of a large share of these residues. Table 17 – Physicochemical characteristics of Danish SR based on literature data (SR= shredder residues; ASR= automotive shredder residues).
SR, DK (20% ASR, 80% SR) ASR, DK (100% ASR) SR/ASR
Unit Min Max Aver. Min Max Aver.
Dry matter % 87.1 91.7 89.4 96.9 96.9 96.9 0.92
Ash % TS 33.4 69.7 46.6 43.1 47.5 45.3 1.03
C % TS 16.12 50.2 31.1 42.2 42.4 42.3 0.74
N % TS 0.3 1.3 0.8 1.4 1.8 1.6 0.50
LHV MJ/kg 9.4 21.3 14.5 14.9 14.9 14.9 0.98
Si mg/kg TS 400 91000 47213.6 7200 7200 7200 6.56
Al mg/kg TS 126 26000 16779.4 12000 12000 12000 1.40
Ca mg/kg TS 305 35000 19058.6 5000 5000 5000 3.81
Fe mg/kg TS 830 132000 61400.8 6500 6500 6500 9.45
K mg/kg TS 27 3700 1921.0 280 280 280 6.86
Mg mg/kg TS 60 6500 3920.0 6300 6300 6300 0.62
Mn mg/kg TS 0 1200 548.6 90 90 90 6.10
Na mg/kg TS 61 9600 5352.9 12000 12000 12000 0.45
P mg/kg TS 11 820 392.4 80 80 80 4.91
S mg/kg TS 60 2800 1829.0 2700 3700 3200 0.57
Ti mg/kg TS 43 3500 2050.6 490 490 490 4.18
As mg/kg TS 1 36 18.9 0 0
Ag mg/kg TS 0 0 0 0
Ba mg/kg TS 29 2800 1259.9 1590 1590 1590 0.79
Be mg/kg TS 0.53 0.53 0.5 0 0
Cd mg/kg TS 15 40 27.1 0 0
Co mg/kg TS 28 51 38.0 0 0
Cr mg/kg TS 4 890 306.8 70 70 70 4.38
Cu mg/kg TS 19 25000 14019.1 660 660 660 21.24
Hg mg/kg TS 0.82 1.6 1.2 0.8 0.8 0.8 1.51
Mo mg/kg TS 10 53 23.6 2 2 2 11.79
Nb mg/kg TS - - - 0 0
Ni mg/kg TS 2 480 245.8 20 20 20 12.29
Pb mg/kg TS 14 13000 3668.0 140 140 140 26.20
Si mg/kg TS 2300 2300 2300.0 0 0
Sb mg/kg TS 3 300 159.0 0 0
Sc mg/kg TS - - - 0 0
Se mg/kg TS 1.4 1.4 1.4 0 0
Sn mg/kg TS 2 180 73.4 10 10 10 7.34
Sr mg/kg TS 2 370 160.6 30 30 30 5.35
V mg/kg TS 39 61 53.8 0 0
W mg/kg TS 130 130 130.0 0 0
Y mg/kg TS 7 7 7.0 0 0
Zn mg/kg TS 243 20000 12503.8 1000 1000 1000 12.50
Zr mg/kg TS 2 270 76.5 20 20 20 3.83
Br mg/kg TS 10 2100 532.5 0 0
Cl mg/kg TS 84 26000 15153.3 17000 24000 20500 0.74
F mg/kg TS 220 350 303.3 100 270 185 1.64
I mg/kg TS 4.9 4.9 4.9 0 0 0.92
Cramer et al. (2006); Nielsen et al. (2006); Nieminen et al. (2006); Hansen et al. (2011a); Nedenskov (2013); Poulsen et al. (2011); Høstgaard et al. (2012)
Nielsen et al. (2006); Nieminen et al. (2006)

Life cycle assessment of shredder residue management 61
As international literature data could not be used and data on ASR seemed not fully appropriate
(Table 17), it was decided to use data provided by the few available Danish studies dealing with SR.
While Table 16 and Table 17 reports composition of mixed SR, physicochemical composition of sub-
fractions of SR was also needed to assess management alternatives of individual fractions (see
scenario description in Chapter 3). Only Hansen et al. (2011a) and Høstgaard et al. (2012) reported
both grain size distribution, material fraction and chemical compositions of Danish SR. The results
from these two studies are summarized in Table 18, Table 19 and Table 20. Table 18 - Grain size distribution of Danish SR.
Grain size average (%) st.dev.
Hansen et al. (2011a) > 10 mm 37.11 9.69
10 - 4 mm 17.35 1.18
4 - 1 mm 14.31 2.92
< 1 mm 31.23 7.21
Total 100
Høstgaard et al. (2012) > 6 mm 64.5 16.1
3-6 mm 6.4 0.5
< 3 mm 29.0 16.6
Total 100
Table 19 – Material fraction composition of Danish SR with particle size >10 mm (based on Hansen et al., 2011a).
> 10 mm
average (%) st.dev.
Metals 14.5 2.6
Plastic 35.6 2.0
Rubber 20.6 4.4
Wood 7.1 0.3
Foam/Fluff 6.3 0.3
Textile 0.8 0.1
Paper/Cardboard 0.3 0.3
Wires 3.1 0.1
Electronics 0.4 0.0
Glass/Ceramics 0.1 0.0
Stones 5.1 0.0
Misc /Mix 6.1 0.2
Total 100
Table 20 – Material fraction composition of Danish SR with particle sizes 3-6 mm and >6 mm (based on Høstgaard et al., 2012).
Material fraction >6 mm 3-6 mm
average (%) st.dev average (%) st.dev
Ferrous metal 1.25 0.67 9.21 0.05
Non-Ferrous metal 4.32 0.22 4.27 0.13
Tin can 0.90 0.10 0.30 0.12
Plastic 29.13 1.52 8.82 0.90
Rubber 9.89 0.07 1.68 0.36
Wood 9.62 0.17 8.14 1.24
Foam 4.06 0.85 1.39 0.64
Electronic 2.97 1.45 1.48 0.24
Dirt/inert 6.34 1.80 6.88 0.48
Other 31.52 0.21 57.84 0.59
Total 100 100
For this project, it was considered that recovery of recyclables (i.e. glass, plastic and metals, see
scenario description in Chapter 3) was performed on the >10 mm fraction, and thus the material
fraction composition reported in Table 19 was used for the LCI modelling. This choice was also
based on the fact that the composition reported in Table 20 includes a large amount of undefined
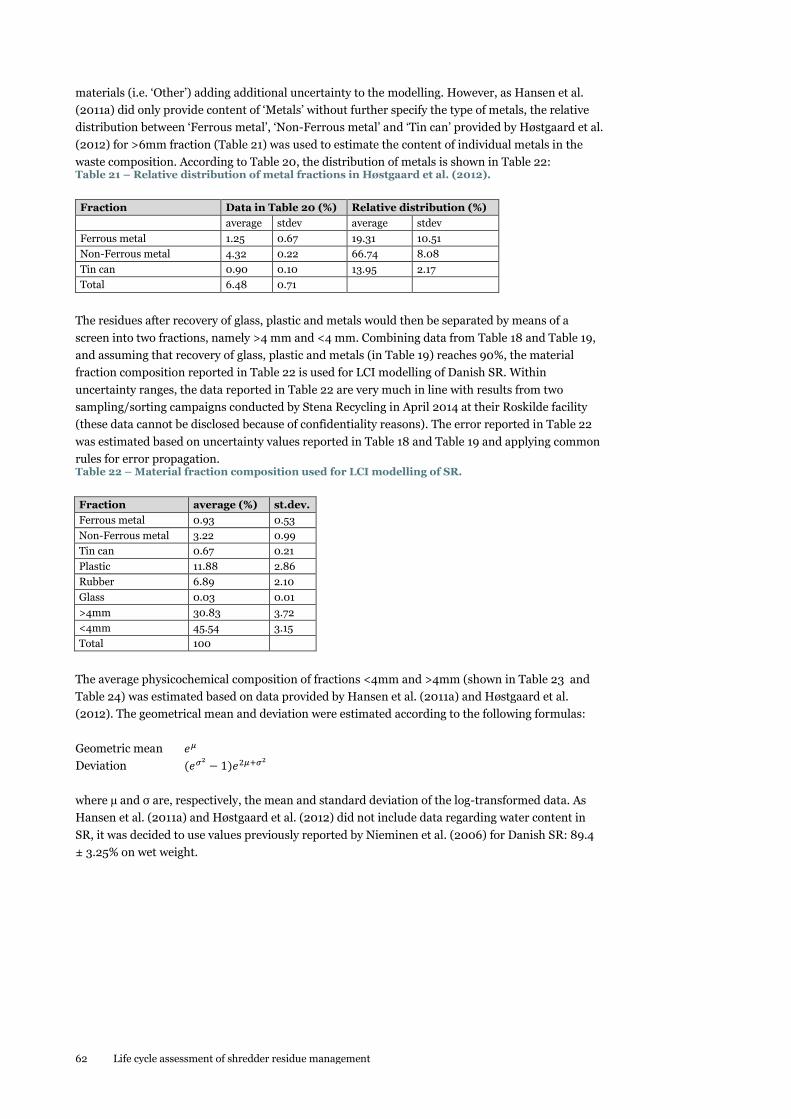
62 Life cycle assessment of shredder residue management
materials (i.e. ‘Other’) adding additional uncertainty to the modelling. However, as Hansen et al.
(2011a) did only provide content of ‘Metals’ without further specify the type of metals, the relative
distribution between ‘Ferrous metal’, ‘Non-Ferrous metal’ and ‘Tin can’ provided by Høstgaard et al.
(2012) for >6mm fraction (Table 21) was used to estimate the content of individual metals in the
waste composition. According to Table 20, the distribution of metals is shown in Table 22: Table 21 – Relative distribution of metal fractions in Høstgaard et al. (2012).
Fraction Data in Table 20 (%) Relative distribution (%)
average stdev average stdev
Ferrous metal 1.25 0.67 19.31 10.51
Non-Ferrous metal 4.32 0.22 66.74 8.08
Tin can 0.90 0.10 13.95 2.17
Total 6.48 0.71
The residues after recovery of glass, plastic and metals would then be separated by means of a
screen into two fractions, namely >4 mm and <4 mm. Combining data from Table 18 and Table 19,
and assuming that recovery of glass, plastic and metals (in Table 19) reaches 90%, the material
fraction composition reported in Table 22 is used for LCI modelling of Danish SR. Within
uncertainty ranges, the data reported in Table 22 are very much in line with results from two
sampling/sorting campaigns conducted by Stena Recycling in April 2014 at their Roskilde facility
(these data cannot be disclosed because of confidentiality reasons). The error reported in Table 22
was estimated based on uncertainty values reported in Table 18 and Table 19 and applying common
rules for error propagation. Table 22 – Material fraction composition used for LCI modelling of SR.
Fraction average (%) st.dev.
Ferrous metal 0.93 0.53
Non-Ferrous metal 3.22 0.99
Tin can 0.67 0.21
Plastic 11.88 2.86
Rubber 6.89 2.10
Glass 0.03 0.01
>4mm 30.83 3.72
<4mm 45.54 3.15
Total 100
The average physicochemical composition of fractions <4mm and >4mm (shown in Table 23 and
Table 24) was estimated based on data provided by Hansen et al. (2011a) and Høstgaard et al.
(2012). The geometrical mean and deviation were estimated according to the following formulas:
Geometric mean 𝑒𝜇
Deviation (𝑒𝜎2− 1)𝑒2𝜇+𝜎2
where µ and σ are, respectively, the mean and standard deviation of the log-transformed data. As
Hansen et al. (2011a) and Høstgaard et al. (2012) did not include data regarding water content in
SR, it was decided to use values previously reported by Nieminen et al. (2006) for Danish SR: 89.4
± 3.25% on wet weight.

Life cycle assessment of shredder residue management 63
Table 23 - Physicochemical composition of <4mm fractions of SR used in the LCI modelling.
Hansen et al. (2011a) Høstgaard et al. (2012)
4-1 mm <1 mm Prøv 1 Prøv 2 Prøv 3 geom mean deviation
Ash % TS 72.20 82.10 83.69 83.69 83.69 80.9 21.6
LHV MJ/kgTS 8.05 3.60 0.05 0.05 0.05 0.33 4.12
C % TS 17.20 9.60 2.75 2.75 2.75 5.09 9.26
H % TS 2.26 1.56 3.24 3.24 3.24 2.60 1.90
N % TS 0.54 0.42 0.50 0.50 0.50 0.49 0.16
Si mg/kg TS 93500 146000 115276 69740 107325 103328 66307
Al mg/kg TS 39706 33708 21127 24854 27552 28668 17252
Ca mg/kg TS 35467 34210 48749 84918 62339 50020 41523
Fe mg/kg TS 188000 188409 151399 237249 207149 192386 88205
K mg/kg TS 4104 6001 5610 9528 3301 5341 4609
Mg mg/kg TS 6828 7202 10213 11016 12020 9216 5670
Mn mg/kg TS 1914 1884 1601 2707 2406 2066 1107
Na mg/kg TS 13244 12403 13327 8010 12119 11627 6289
P mg/kg TS 836 1282 2204 5317 496 1442 2778
Ti mg/kg TS 3573 5091 8112 4488 7408 5472 4163
As mg/kg TS 52 33 401 88.4 286.1
Ba mg/kg TS 3648 2991 2396 3805 3207 3168 1559
Be mg/kg TS 1 1 0.64 0.19
Cd mg/kg TS 14 44 25.2 41.0
Co mg/kg TS 30 57 41.1 38.8
Cr mg/kg TS 4110 1010 801 902 300 979 1947
Cu mg/kg TS 44500 1950 1900 2800 1700 3793 13183
Hg mg/kg TS 1 3 1.51 2.33
Mo mg/kg TS 167 59 99.0 149.2
Nb mg/kg TS 4 5 4.47 2.00
Ni mg/kg TS 722 658 300 601 802 585 490
Pb mg/kg TS 7000 2810 1499 2700 2907 2971 3356
S mg/kg TS 2070 2740 7602 9719 8718 5159 7568
Sb mg/kg TS 259 134 2207 500 200.0 377 923
Sc mg/kg TS 1 1 0.95 0.27
Sn mg/kg TS 951 338 200 501 401 419 488
Sr mg/kg TS 765 616 200 300 401 408 453
V mg/kg TS 97 82 89.1 34.6
W mg/kg TS 166 216 189 95
Y mg/kg TS 7 12 9.47 7.63
Zn mg/kg TS 17400 25200 29696 71376 76336 37170 49679
Zr mg/kg TS 377 472 601 601 802 553 366
Br mg/kg TS 360 60 7927 500 401 510 2672
Cl mg/kg TS 7240 2450 2565 7288 5101 4422 4887
I mg/kg TS 2 4 2.78 2.60
Li (*) 0.190 0.013 0.05 0.31

64 Life cycle assessment of shredder residue management
Table 24 - Physicochemical composition of >4mm fractions of SR used in the LCI modelling.
Hansen et al. (2011a) Høstgaard et al. (2012)
> 4 mm Prøv 1 Prøv 2 Prøv 3 geom mean deviation
Ash % TS 55.00 36.40 36.40 36.40 40.4 21.4
LHV MJ/kgTS 14.36 18.09 18.09 18.09 17.1 6.3
C % TS 33.50 36.00 36.00 36.00 35.4 6.9
H % TS 4.32 5.19 5.19 5.19 4.96 1.61
N % TS 0.92 0.80 0.80 0.80 0.83 0.23
Si mg/kg TS 79000 46300 34800 51000 50477 38061
Al mg/kg TS 31500 14500 11300 14600 16568 15484
Ca mg/kg TS 39100 36400 30400 27700 33087 14866
Fe mg/kg TS 55500 101700 74900 69800 73703 44498
K mg/kg TS 3260 3200 2600 3000 3003 1039
Mg mg/kg TS 7570 6900 7100 6900 7112 1536
Mn mg/kg TS 1120 1300 900 900 1042 506
Na mg/kg TS 8070 6700 5600 7300 6857 3033
P mg/kg TS 700 1300 1100 1400 1088 767
Ti mg/kg TS 2840 5100 7500 5300 4898 4219
As mg/kg TS 24 100 49.2 106.8
Ba mg/kg TS 3460 3300 2600 1400 2539 2246
Be mg/kg TS 1 0.62
Cd mg/kg TS 10 9.73
Co mg/kg TS 36 35.8
Cr mg/kg TS 517 500 300 300 391 272
Cu mg/kg TS 42100 2600 7700 3500 7370 21697
Hg mg/kg TS 3 2.61
Mo mg/kg TS 40 39.6
Nb mg/kg TS
Ni mg/kg TS 979 300 300 200 364 510
Pb mg/kg TS 8610 1800 2700 1100 2605 4788
S mg/kg TS 1680 7000 4900 4200 3944 4889
Sb mg/kg TS 212 400 500 300 336 271
Sc mg/kg TS 1 1.20
Sn mg/kg TS 464 200 200 100 208 266
Sr mg/kg TS 296 200 300 100 205 218
V mg/kg TS 39 39.1
W mg/kg TS 179 179
Y mg/kg TS 4 4.49
Zn mg/kg TS 24000 30600 27400 17300 24290 14551
Zr mg/kg TS 198 300 300 200 244 142
Br mg/kg TS 558 1300 500 100 436 1033
Cl mg/kg TS 19300 11300 10300 4800 10190 11939
I mg/kg TS 2 1.88
Li (*)

Life cycle assessment of shredder residue management 65
Appendix 3: LCI of combustion of SR at a waste incinerator
Jakobsen et al. (2013) provided a comprehensive inventory dataset for a state-of-the-art waste
incineration plant in Denmark (Table 26). This inventory is based on data collected from state-of-
the-art Line 5 of Vestforbrænding I/S in 2012. The flue gas cleaning system includes wet scrubbing
for acid gases removal, SNCR deNOx system and activated carbon filter for dioxin and Hg removal.
The dataset is based on both process and input specific emissions, depending on whether the
emissions are mostly controlled by the plant operation or are mainly related to the content of
specific compounds in the waste input.
The inventory from Jakobsen et al. (2013) is hereby used to model the combustion of SR at a waste
incinerator in Denmark. The choice is explained in details in the following sections, where
definition of uncertainty related to individual parameters is also estimated based on data from
Vermeulen et al. (2012), Nedenskov (2013) and Mancini et al. (2014).
Flue gas
Process-specific and input-specific emissions reported in Jakobsen et al. (2013) are considered valid
and thus used upon the condition that ASR is co-combusted with regular municipal solid waste up
to a share of 12-14% and based on the following considerations:
Astrup et al. (2011a) tested co-combustion by blending 14% ASR into municipal solid waste.
Table 25 presents composition of waste used in the test, the stack emission of specific
compounds and the respective TCs. It is seen that despite the content of individual compounds
significantly increased with the introduction of ASR in the feedstock blend (compared with
municipal residual waste), emissions from the stack were not affected. In some cases, TCs to air
seemed eventually to decrease with the addition of ASR, possibly because a significant share of
the metals is likely to be embedded in a non-combustible matrix and are thus not volatilized to
the flue gas phase. This may suggest that TCs for ASR are somehow lower than for residual
waste and it is hence conservatively assumed that TCs for ASR equal to regular waste. While
results are only available for As, Cd, Cr, Pb, and SB, a similar behaviour for other compounds is
also assumed.
Table 25 – TCs to air for 100% municipal residual waste and 14% blend of ASR, according to Astrup et al. (2011a).
100% normal waste (NW) NW (86%) + ASR (14%)
Stack (g) Waste (g) TC (%) Stack (g) Waste (g) TC (%)
As 0.0029 10 0.029 0.0008 12.3 0.0065
Cd 0.0066 6 0.11 0.0025 8.5 0.0294
Cr 0.0035 105 0.0033 0.0053 182 0.0029
Pb 0.125 290 0.0431 0.081 945 0.0085
Sb 0.022 34 0.0647 0.01 83 0.012
Both Redin et al. (2001), Astrup et al. (2011a), Nedenskov (2011) and Vermeulen et al. (2012)
reported regular functioning of the flue gas cleaning system and rather constant emissions
during co-combustion of ASR with municipal solid waste. Redin et al. (2001) tested 20% ASR,
Astrup et al. (2011a) performed a co-combustion test with 14% ASR on a mass basis, while
Nedenskov (2011) tested a mix with 12.4% ASR and Vermeulen et al. (2012) a mix with 25 and
39% ASR.
The Danish EPA deliberated to I/S Reno-Nord an environmental approval for co-combustion
of ASR with municipal solid waste up to 12.5% on mass basis (Seerup, 2012). In the approval,
the Danish EPA assessed that the flue gas cleaning system at I / S Reno-Nord will ensure that
the emission of heavy metals to air emissions do not rise, or at least not rise significantly, as a
consequence of ASR co-combustion.
Table 26 – Inventory dataset for combustion of SR at a waste incinerator.
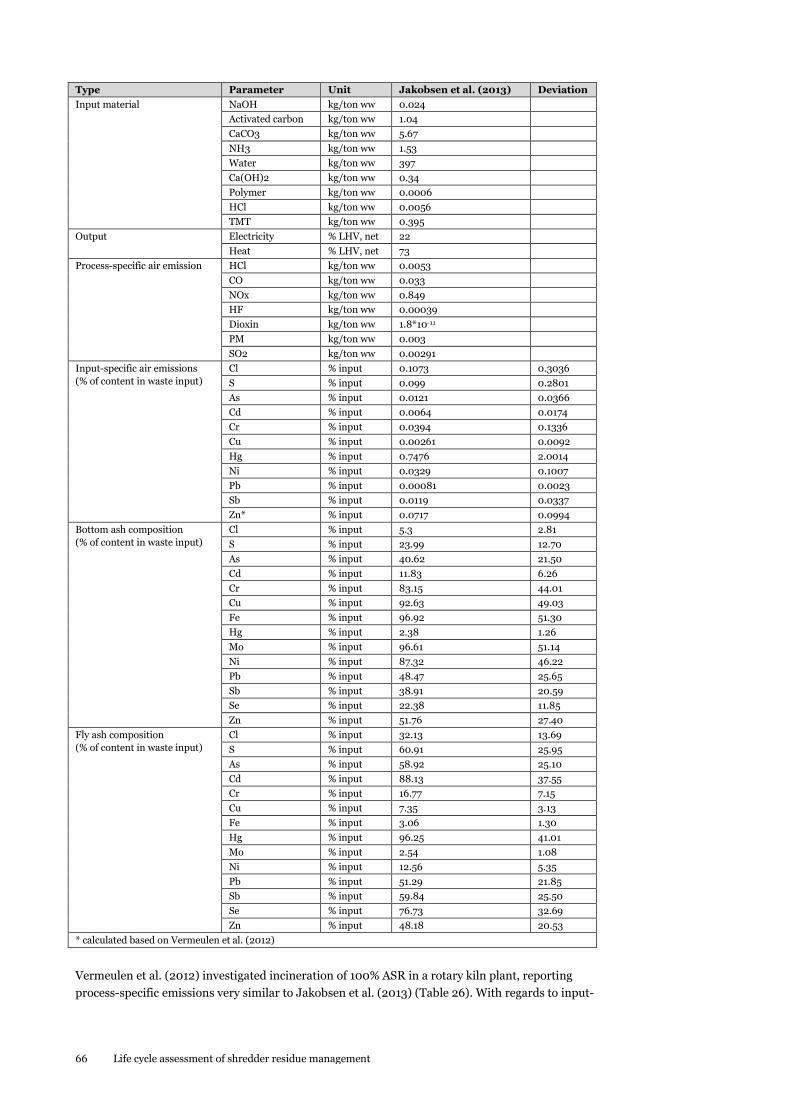
66 Life cycle assessment of shredder residue management
Type Parameter Unit Jakobsen et al. (2013) Deviation
Input material NaOH kg/ton ww 0.024
Activated carbon kg/ton ww 1.04
CaCO3 kg/ton ww 5.67
NH3 kg/ton ww 1.53
Water kg/ton ww 397
Ca(OH)2 kg/ton ww 0.34
Polymer kg/ton ww 0.0006
HCl kg/ton ww 0.0056
TMT kg/ton ww 0.395
Output Electricity % LHV, net 22
Heat % LHV, net 73
Process-specific air emission HCl kg/ton ww 0.0053
CO kg/ton ww 0.033
NOx kg/ton ww 0.849
HF kg/ton ww 0.00039
Dioxin kg/ton ww 1.8*10-11
PM kg/ton ww 0.003
SO2 kg/ton ww 0.00291
Input-specific air emissions
(% of content in waste input)
Cl % input 0.1073 0.3036
S % input 0.099 0.2801
As % input 0.0121 0.0366
Cd % input 0.0064 0.0174
Cr % input 0.0394 0.1336
Cu % input 0.00261 0.0092
Hg % input 0.7476 2.0014
Ni % input 0.0329 0.1007
Pb % input 0.00081 0.0023
Sb % input 0.0119 0.0337
Zn* % input 0.0717 0.0994
Bottom ash composition
(% of content in waste input)
Cl % input 5.3 2.81
S % input 23.99 12.70
As % input 40.62 21.50
Cd % input 11.83 6.26
Cr % input 83.15 44.01
Cu % input 92.63 49.03
Fe % input 96.92 51.30
Hg % input 2.38 1.26
Mo % input 96.61 51.14
Ni % input 87.32 46.22
Pb % input 48.47 25.65
Sb % input 38.91 20.59
Se % input 22.38 11.85
Zn % input 51.76 27.40
Fly ash composition
(% of content in waste input)
Cl % input 32.13 13.69
S % input 60.91 25.95
As % input 58.92 25.10
Cd % input 88.13 37.55
Cr % input 16.77 7.15
Cu % input 7.35 3.13
Fe % input 3.06 1.30
Hg % input 96.25 41.01
Mo % input 2.54 1.08
Ni % input 12.56 5.35
Pb % input 51.29 21.85
Sb % input 59.84 25.50
Se % input 76.73 32.69
Zn % input 48.18 20.53
* calculated based on Vermeulen et al. (2012)
Vermeulen et al. (2012) investigated incineration of 100% ASR in a rotary kiln plant, reporting
process-specific emissions very similar to Jakobsen et al. (2013) (Table 26). With regards to input-

Life cycle assessment of shredder residue management 67
specific emissions, Vermeulen et al. (2012) reported slightly higher TCs for some of the assessed
compounds (Table 28). The small differences (e.g. Cd and Cr) may be associated to the fact that,
while Jakobsen et al. (2013) covered a grate furnace incineration plant, Vermeulen et al. (2012)
performed a test on a rotary kiln process used for incineration of hazardous waste, thus running on
higher temperature.
Based on the abovementioned, data from Vermeulen et al. (2012) were used to estimate relative uncertainty in flue gas emissions, as reported in Table 26. Vermeulen et al. (2012) provided data (reported in Table 27) for both the waste composition used in the test and the amount of individual compounds emitted with the flue gas. In addition, data from Vermeulen et al. (2012) were also used to estimate TC to air for Zn, as it was missing in Jakobsen et al. (2013).
The TCs to air (TCair) were calculated according as:
𝑇𝐶𝑎𝑖𝑟 =𝑂𝑢𝑡𝑝𝑢𝑡𝑎𝑖𝑟
𝐼𝑛𝑝𝑢𝑡𝑤𝑎𝑠𝑡𝑒
where Inputwaste is the content of a specific compound in the waste and Outputair is the emission of
such compound to the atmosphere. Using a uniform distribution for Outputair (minimum and
maximum showed in Table 27) and a lognormal distribution for Inputwaste (assuming average as the
geometrical mean and mix/max as the 2.5/97.5% range Table 27), the TCair where computed 15ooo
times. The obtained results were characterized by a log-normal distribution, for which median and
variance were calculated, as shown in Table 28. For individual compounds, a coefficient of variation
(CV) was calculated (see Table 28) and applied to TCs reported by Jakobsen et al. (2013) to derive
the data variance reported in Table 26. The CVs were calculated as follows:
CV (%) =variance
median
The number of simulations was decided based on the following formula:
𝜀 =3𝜎
√𝑁→ 𝑁 = (
3 × 𝜎
𝜀)
2
= (3 × 𝑠𝑡𝑑𝑒𝑣𝑝(𝑚𝑖𝑛, 𝑚𝑎𝑥, 𝑎𝑣𝑒𝑟𝑎𝑔𝑒(𝑚𝑖𝑛, 𝑚𝑎𝑥))
50)
2
where ε is the error of the estimation (here assumed maximum 2%), σ is the deviation of the data and N the number of simulations. The value N was estimated for all individual compounds using data in Table 27, and a rounding of the maximum value (i.e. 14999) being then selected for running the simulation. Table 27 – Data regarding emissions to air and waste composition, as provided by Vermeulen et al. (2012).
Compound Unit Air emission Waste composition
min max min max average
C kg/tonSR 1.503 279 626 410
N kg/tonSR 8.8 45 19
S kg/tonSR 0.0044 0.0148 1.9 5.6 3.7
As g/tonSR 3.03E-07 1.90E-02 1.2 70 30
Cd g/tonSR 3.08E-03 3.07E-01 2 86 34
Cr g/tonSR 7.09E-08 5.74E-03 17 7000 1120
Cu g/tonSR 3.93E-06 3.44E+00 27 16,600 4910
Hg g/tonSR 9.08E-03 1.66E-01 0.2 14 4.1
Ni g/tonSR 1.91E-06 5.87E-01 54 4000 734
Pb g/tonSR 1.04E-01 8.64E+00 94 7000 2610
Zn g/tonSR 5.29E+00 5.78E+00 1430 14,100 8260
Table 28 – TCair for combustion of SR incineration plant calculated based on data from Vermeulen et al. (2012).
Compound Median Variance CV (%)

68 Life cycle assessment of shredder residue management
As 0.026 0.079 302
Cd 0.354 0.961 272
Cr 0.000 0.000 339
Cu 0.021 0.073 351
Hg 1.233 3.301 268
Ni 0.014 0.044 306
Pb 0.124 0.357 287
Zn 0.072 0.099 139
S 0.255 0.241 94.8
Solid residues
Table 29 presents that ratio between the amount of individual compounds ending in bottom ash
(BA) and fly ash (FA). This can also be interpreted as a ratio between the TCs to BA and FA. It can
be seen that the distribution of different substances to solid outputs varies significantly among
individual incineration plants. It is thus not possible to combine the data to univocally define an
average dataset to be used for estimating to uncertainty in solid distribution.
It was thus decided to estimate the uncertainty of TCs using data from Mancini et al. (2014), who
present repeated measurement on the same test system. Composition data on input waste and solid
outputs were used to reconcile the mass and material balance of the system using STAN (Cencic and
Rechberger, 2008). Data reconciliation allowed calculating the TCs - to bottom ash, fly ash and flue
gas – and their respective uncertainty, as shown in Table 30. For individual compounds, CVs were
calculated as follows:
CV (%) =variance
median
Using individual CVs, an average CV for TC to BA (i.e. 53%) and FA (i.e. 43%) were estimated
(Table 30). These two CVs were then used to derive uncertainty (i.e. deviation) for TCs to BA and
FA reported in Table 26 by multiplying individual TCs with the CVs.
Table 29 – Ratio BA:FA according to Jakobsen et al. (2013), Astrup et al. (2011a) and Mancini et al. (2014). The ration is calculated for individual compounds by dividing the amount ending in bottom ash (BA) and fly ash (FA). For Mancini et al. (2014), FA includes both boiler ash and APC residues.
Ratio BA:FA
Jakobsen et al. (2013) Astrup et al. (2011a) Mancini et al. (2014)
As 0.69 2.33 0.71
Cd 0.13 0.19 0.02
Cl 0.16 0.25
Cr 4.96 8.09 2.70
Cu 12.60 24.00 3.40
Fe 31.67
Hg 0.02 0.02 3.37
Mo 38.04 3.55
Ni 6.95 32.33 2.57
Pb 0.95 3.55 0.48
S 0.39 0.45
Sb 0.65 1.44
Se 0.29 0.49
Zn 1.07 1.63 0.18
Table 30 – TCs to fly ash and bottom ash, and respective CVs for incineration of ASR according to Mancini et al. (2014).
Fly ash Bottom ash
TC (%) st.dev. CV(%) TC (%) st.dev. CV(%)
As 0.392 0.111 28.42 0.280 0.169 60.34

Life cycle assessment of shredder residue management 69
Ash 0.158 0.057 35.79 0.410 0.178 43.41
Cd 0.955 0.544 56.94 0.018 0.023 131.32
Cr 0.069 0.034 49.56 0.185 0.072 39.01
Cu 0.194 0.136 69.96 0.661 0.689 104.29
TS 0.063 0.011 17.89 0.169 0.010 5.89
Hg 0.024 0.007 26.75 0.082 0.032 38.55
Ni 0.120 0.056 46.72 0.309 0.102 33.14
Pb 0.471 0.202 42.80 0.225 0.107 47.48
Se 1.439 0.407 28.30 0.700 0.347 49.60
VS 0.010 0.003 32.57 0.037 0.010 25.98
Zn 1.362 1.030 75.61 0.240 0.135 56.15
Average 42.61 52.93
Leaching from solid residues
Solid residues from combustion of SR in incineration plant are assumed to be used as sub-road
basis material during road construction (
Figure 3 and
Figure 4). Owing to water infiltration, leaching of different compounds from the solid residues may
occur with subsequent potential adverse impacts on the environment.
A univocal estimation of leaching coefficients from SR solid residues is however not feasible because
SR would usually be incinerated in co-combustion with other waste materials (Seerup, 2012),
typically a mixture of municipal and industrial solid waste. The effects of co-combustion on the
chemistry of solid residues is rather complicated, meaning that estimating leaching factors specific
for SR allocated according to the share of the co-fuels is not possible.
Table 31 provides a comparison of leaching factors with increasing share of SR in the feedstock to
the incineration process. It is seen that individual compounds show different behaviours, meaning
that general conclusions cannot be drawn. This is in line with Hyks et al. (2014), that reported no
clear correlation between the leaching of metals from residues and the increasing total content of
metals in the residues when increasing the share of (A)SR in the feedstock. The release of some
compounds (e.g. Ba, Cl, S) from solid residues seems to increase with increasing amount of SR in
the feedstock, while for others (i.e. Cr, Cu, Mn, Ni, Zn) it seems to decrease, finally a number of
compounds (i.e. As, Cd, Hg, Mo, Pb, Sb, Se, F, Na) do not show a specific behaviour.
Results in Table 31 show that a consistent pattern across all compounds could not be determined
and that using leaching factors measured for 100% ASR material (e.g. from Mancini et al., 2014)
may not be correct. It was hence decided to use in the LCI modelling the leaching data originated
from a feedstock with 12.4% SR (from Nedenskov, 2013), as this was considered the most realistic
process condition. The interval ranges from Nedenskov (2013) reported in Table 31 were entered in
the LCI modelling as uniform distributions.

70 Life cycle assessment of shredder residue management
Table 31 – Comparison of leaching from solid residues originating from incineration of SR, MSW and co-combustion.
100% MSW
Nedenskov (2013)
12.4% SR
Nedenskov (2013)
100% ASR
Mancini et al. (2014)
Tendency
As µg/l 1.4-7.4 4.9-6.1 0.25-0.37 ↔
Ba µg/l 0.35-110 133-145 700-1133 ↑
Cd µg/l 0.04-0.2 0.133-0.150 0.06-0.1 ↔
Cr µg/l 8.1-380 15.0-19.0 0.62-1.43 ↓
Cu µg/l 195-1.900 315-550 <0.01 ↓
Hg µg/l 0.05-0.32 <0.2 0.08-1 ↔
Mn µg/l 150-1.000 <0.2-0.370 ↓
Mo µg/l 26.15-46.6 ↔
Ni µg/l 1-13 4.9-5.0 0.02-0.04 ↓
Pb µg/l 0.5-32 0.4-3.0 5.57-10.4 ↔
Sb µg/l 58.2-88.01 ↔
Se µg/l 2.9-3.7 1.41-2.05 ↔
Zn µg/l 5-90 8.7-13.0 <0.01 ↓
Cl mg/l 0.830-2.0 1.2-1.3 118.8-143.4 ↑
F mg/l 0.81-0.96 ↔
S mg/l 0.15-2.8 0.9-0.9 8.21-9.51 ↑
Na mg/l 0.10-1.50 0.8-0.963 ↔
DOC mg/l <5 ↔
↑: increasing with increasing ASR share; ↓: decreasing with increasing ASR share; ↔: no clear tendency

Life cycle assessment of shredder residue management 71
Appendix 4: LCI of pyrolysis of SR
The LCI of pyrolysis of SR was created as an average dataset based on available literature. Data
regarding mass (Table 32) and energy (Table 33) distribution as well as chemical composition of
char (Table 34 and Table 35) and oil (Table 36) products from the pyrolysis process were used to
calculate average value and their uncertainty. These mean values (and their uncertainty) were then
used to reconcile the mass, energy and substance balances of the SR pyrolysis system using STAN
(Cencic and Rechberger, 2008), as shown in Figure 24, Figure 25, Figure 26, Figure 27, Figure 28,
Figure 29. Data reconciliation allowed calculating the TCs to individual outputs - to char, oil, gas –
and their respective uncertainty. An overview of the LCI dataset of pyrolysis of SR is finally shown
in Table 37.
Figure 24 – Reconciled mass balance for pyrolysis of 1 ton of SR.
Figure 25 – Reconciled distribution of energy during pyrolysis of 1 ton of SR.

72 Life cycle assessment of shredder residue management
Table 32 - Literature overview of mass transfer during pyrolysis of ASR.
Input Output
Source Test Waste Char Oil Gas Loss Metals Slag Fly ash
ton % input % input % input % input kg/tonASR kg/tonASR kg/tonASR
/A/ 700 °C
1 68 4 14 14
750 °C
1 64 7 17 12
/B/
680 °C
1 43.57 20.07 13 23.36
600 °C
1 44.55 32.62 9.04 13.79
550 °C
1 59.28 19.52 4.23 16.97
/C/ 1 35 40 20 5
/D/ 500 °C
1 55 25.7 5.8 13.5
600 °C
1 52.3 30 11.5 6.2
700 °C
1 39 24.2 24.1 12.7
800 °C
1 37 21.8 34 7.2
500 °C
1 47.5 35 7.7 9.8
600 °C
1 37.5 43 5.8 13.7
700 °C
1 33 55 8.5 3.5
800 °C
1 25 58 12.2 4.8
/E/ 400 °C
1 69.4 7.1 23.5
500 °C
1 63.6 10.3 26.1
700 °C
1 58.8 8.8 32.4
400 °C
1 54.1 25.5 20.4
500 °C
1 39.4 29 31.6
700 °C
1 38.3 20.2 41.5
/F/ 400 °C
1 38.7 12.3 49
500 °C
1 42.2 13.6 44.2
600 °C
1 45.8 18.2 36
700 °C
1 47.4 13.4 39.2
800 °C
1 44.6 14.4 41
/G/
F1 1 75.49 16.01 3.8 4.7
F2 1 69.09 22.35 3.73 4.83
/H/ 1 65 17 9 9
/I/ 1 58 170 39
/J/ 1 53
mean 1 49.7 23.0 21.0 10.3 55.5 170 39
st.dev. 0 13.2 13.6 14.2 5.39 3.54
/A/: Shen et al. (1995); /B/: Galvagno et al. (2001); /C/: Pasel and Wanzl (2003) /D/: Zolezzi et al. (2004); /E/: de Marco et al. (2007); /F/: Joung et al. (2007); /G/: Høstgaard et al. (2012); /H/: Santini et al. (2012); /I/: Roh et al. (2013); /J/: Møller et al. (2014)

Life cycle assessment of shredder residue management 73
Table 33 – Literature overview of energy transfer during pyrolysis of ASR.
Input Output
Source Test Waste Electricity Pyrolysis gas
Pyrolysis oil
Char Oil Gas Loss
GJ MJ GJ GJ % input % input % input % input
/A/ 680 17.4 22.1 34.7 15.9 27.3
600 17.4 22.6 56.3 8.25 12.8
550 17.4 30.1 33.7 3.28 32.9
/B/ 500 21 23.9 42.0 1.70 32.5
600 21 20.4 49.0 8.42 22.2
700 21 8.13 39.5 16.4 36.0
800 21 8.42 35.6 28.4 27.6
500 21 41.1 60.5 0.14 -1.74
600 21 25.6 72.5 0.47 1.47
700 21 22.2 78.0 2.36 -2.64
800 21 16.5 79.6 4.33 -0.37
/C/ 400 43.7 22.8 27.2 6.38
500 26.0 33.0 37.8 3.14
700 26.1 26.9 45.7 1.27
400 42.3 36.6 11.5 9.66
500 22.8 40.9 24.6 11.7
700 22.6 28.1 29.6 19.7
/D/ 400 27.8 23.4 48.8
500 21.5 26.0 52.5
600 17.1 33.9 49.0
700 16.1 24.8 59.1
800 17.1 26.5 56.4
/E/ F1 10.8 61.0 33.2 2.40 3.49
F2 15.0 53.9 33.8 1.65 10.6
/F/ 17.6 248.4 0.29 0.21 65.3 1.65 33.0
mean 18.8 248.4 0.29 0.21 28.2 38.9 22.7 13.4
st.dev. 3.11 14.9 18.3 20.1 12.9
/A/: Galvagno et al. (2001); /B/: Zolezzi et al. (2004); /C/: de Marco et al. (2007); /D/: Joung et al. (2007); /E/: Høstgaard et al. (2012); /F/: Møller et al. (2014)

74 Life cycle assessment of shredder residue management
Table 34 – Typical physicochemical composition of char products from pyrolysis of ASR and SR (Part 1).
Char Ash VS H C N O S Cl P K Al Na Mg Si Ba
% ww % ww % ww % ww % ww % ww % ww % ww mg/kg mg/kg mg/kg mg/kg mg/kg mg/kg mg/kg
/A/ 680 0.94 21.5 0.55 1.46 0.88
600 1.37 19.9 0.54 1.38 0.54
550 3.86 41.5 1.09 1.11 0.96
/B/ 68.0 32.0 0.60 28.6 0.69 2.30 14100
/C/ 500 1.30 28.0 0.00 13.5 0.51
600 0.70 27.0 0.00 12.1 0.84
700 0.30 16.9 1.00 10.3 0.00
800 0.39 15.6 0.00 6.73 0.73
500 4.00 43.7 0.10 14.5 0.36
600 1.70 39.5 0.00 10.0 1.00
700 0.86 40.0 0.00 5.00 0.68
800 0.69 40.0 0.00 5.70 1.26
/D/ 400 73.7 1.60 20.8 0.90 0.60
500 82.0 0.80 16.2 0.80 0.70
700 87.4 0.30 16.8 0.70 0.70
400 33.2 4.00 60.2 0.90 0.70
500 44.7 1.50 50.4 1.10 0.90
700 46.0 0.80 53.4 1.00 0.90
/E/ SR
ASR
/F/ 400 4291
500 6127
600 8304
700 9509
800 12636
/G/ Dp 13 2.99 30.8 0.81 0.95 5.30 1200 4300 14700 3900 10500 66000 6300
mean 62.1 32.0 1.51 32.1 0.54 9.73 0.82 2.00 1200 4300 9952 3900 10500 66000 6300
st.dev. 20.8 1.25 13.8 0.44 3.60 0.36 1.97 4011
/A/: Galvagno et al. (2001); /B/: Roy and Chaala (2001); /C/: Zolezzi et al. (2004); /D/: de Marco et al. (2007); /E/: Forton et al. (2007) /F/: Joung et al. (2007); /G/: Høstgaard et al. (2012)

Life cycle assessment of shredder residue management 75
Table 35 – Typical physicochemical composition of char products from pyrolysis of ASR and SR (Part 2).
Char Mn Ca Cd Co Cr Cu Fe Hg Ni Pb Sb V Zn Ti
mg/kg mg/kg mg/kg mg/kg mg/kg mg/kg mg/kg mg/kg mg/kg mg/kg mg/kg mg/kg mg/kg mg/kg
/A/ 680
600
550
/B/ 1471 50200 73.0 118 223 15000 121000 1179 4300 43.0 14100
/C/ 500
600
700
800
500
600
700
800
/D/ 400
500
700
400
500
700
/E/ SR 34624 44393 6220 14108
ASR 18809 42856 2446 8930
/F/ 400 10.2 135 15450 71604 0.08 129 2028 12.7 7336
500 13.1 195 22198 39214 0.03 162 3069 14.1 6222
600 19.7 143 14339 47824 0.02 217 2250 15.6 8561
700 8.50 123 8203 65025 0.02 206 2110 16.5 7622
800 4.80 90.3 8983 89432 0.08 205 1533 19.0 5235
/G/ Dp 13
1700 80000 900 1700 123000 3500 700 35000 9600
mean 1586 65100 21.6 118 258 15479 71594 0.0 350 3051 700 20.2 11901 9600
st.dev. 162 21072 286 9416 32833 0.0 408 1460 11.4 9213
/A/: Galvagno et al. (2001); /B/: Roy and Chaala (2001); /C/: Zolezzi et al. (2004); /D/: de Marco et al. (2007); /E/: Forton et al. (2007) /F/: Joung et al. (2007); /G/: Høstgaard et al. (2012)

76 Life cycle assessment of shredder residue management
Table 36 – Typical physicochemical composition of oil products from pyrolysis of ASR and SR.
Oil H C N O S Cl Al Cd Co Cr Cu Fe Hg Mn Ni Pb V Zn
% ww
% ww
% ww
% ww
% ww
% ww
mg/ kg
mg/ kg
mg/ kg
mg/ kg
mg/ kg
mg/ kg
mg/ kg
mg/ kg
mg/ kg
mg/ kg
mg/ kg
mg/ kg
/A/ 1 10.9 87.3 0.98 0.48 0.34 5.39 2.70 4.65 1.67 413 2.70 2.70 10.7
2 10.4 78.8 2.46 8.07 0.27 8.74 10.5 2.23 3.53 1202 4.37 22.7 52.5
3 11.4 81.3 2.63 4.42 0.25 6.42 11.5 1.58 3.07 290 3.26 10.3 22.5
4 10.8 84.3 1.5 2.8 0.5 0.1 14.0 7.44 0.372 9.3 67.0
5 10.7 84.2 0.69 3.56 0.72 0.13 0.53 0.22 0.26 51.6 0.31 0.12 9.11
/B/ Heavy ASR
9.6 86.2 1 0.3
Light ASR
9.6 81.1 1.5 0.4
/C/ 600 8 74.3 0 15.2 0
500 11 66 0.92 12.5 0.15
600 11.2 64.4 0 15.6 0.3
700 8.9 59.3 1.7 19 0.27
800 8.5 58 1.5 19 0.7
/D/ 500 9.6 81.1 1.5 0.4
700 8.9 82.9 1.6 0.2
400 10.4 85.2 1.1 0.3
500 9.4 86.1 1 0.4
700 8.8 86.8 1.9 0.4
/E/ 400 5.16 0.004 2.67 0.26 27.2 2.88 1.97 0.005 20.5
500 7.20 0.014 1.71 1.021 61.3 6.67 5.25 0.10 22.7
600 0.02 1.09 8.62 0.64 6.42 0.013
700 7.48 0.38 6.92 0.98 0.032 32.1
800 0.03 0.23 2.795 7.22 2.5
mean 9.89 78.1 1.29 10.06 0.35 0.12 5.85 0.02 7.78 2.44 1.80 230 0.37 0.31 2.95 6.90 0.04 29.6
stdev 1.04 9.92 0.71 7.03 0.18 0.02 2.65 0.01 5.97 2.30 1.35 393 2.21 6.77 0.04 20.3
/A/: Roy and Chaala (2001); /B/: de Marco et al. (2002); /C/: Zolezzi et al. (2004); /D/: de Marco et al. (2007); /E/: Joung et al. (2007)

Life cycle assessment of shredder residue management 77
Figure 26 – Al, Cd, Ca, C substance flow analysis for pyrolysis of 1 ton of SR.

78 Life cycle assessment of shredder residue management
Figure 27 – Cl, Cr, Cu, Fe substance flow analysis for pyrolysis of 1 ton of SR.

Life cycle assessment of shredder residue management 79
Figure 28 – Mn, Hg, Ni, N substance flow analysis for pyrolysis of 1 ton of SR.

80 Life cycle assessment of shredder residue management
Figure 29 – Pb, S, V, Zn substance flow analysis for pyrolysis of 1 ton of SR.

Life cycle assessment of shredder residue management 81
Table 37 – LCI dataset of pyrolysis of SR.
Type Parameter Unit mean st.dev
Input SR ton 1
Electricity MJ/ton ww 248.4
Pyrolysis oil GJ/ton ww 0.29
Pyrolysis gas GJ/ton ww 0.21
Output Char % LHV, net 25.0 30.1
Oil % LHV, net 38.9 18.3
Gas % LHV, net 22.7 20.1
Ferrous metals kg/ton ww
(% input)
25.9
(37.0)
9.31
(12.7)
Non-Ferrous metals kg/ton ww
(% input)
25.7
(8.24)
11.3
(6.18)
Unsorted metals kg/ton ww
(% input)
12.9
(6.73)
9.56
(7.70)
Transfer to char
(% of content in waste input)
Al % input 17.88 10.09
C % input 29.17 10.50
Ca % input 66.05 16.79
Cd % input 90.29 109.42
Cl % input 71.06 81.38
Cr % input 25.96 30.39
Cu % input 23.93 16.17
Fe % input 47.42 14.21
Hg % input 0.75 0.71
Mn % input 61.30 19.08
N % input 39.81 17.56
Ni % input 32.01 47.18
Pb % input 34.23 38.39
S % input 72.41 11.50
V % input 21.01 12.80
Zn % input 14.76 7.30
Transfer to oil
(% of content in waste input)
Al % input 0.008 0.005
C % input 58.999 9.510
Ca % input 0.181 0.313
Cd % input 0.048 0.032
Cl % input 2.738 1.609
Cr % input 0.164 0.089
Cu % input 0.002 0.002
Fe % input 0.091 0.158
Hg % input 3.877 0.749
Mn % input 0.008 0.002
N % input 58.009 18.281
Ni % input 0.180 0.202
Pb % input 0.053 0.073
S % input 20.80 12.02
V % input 0.027 0.031
Zn % input 0.032 0.024
Transfer to gas
(% of content in waste input)
Al % input 0.994 1.000
C % input 9.338 2.336
Ca % input 0.564 0.321
Cd % input 0.100 0.100
Cl % input 1.000 1.000
Cr % input 0.100 0.100
Cu % input 0.100 0.100
Fe % input 0.100 0.100
Hg % input 94.627 1.410
Mn % input 0.100 0.100
N % input 0.000 0.000
Ni % input 5.000 20.000
Pb % input 0.100 0.100
S % input 0.000 0.000
V % input 0.100 0.100
Zn % input 0.100 0.100

82 Life cycle assessment of shredder residue management
Appendix 5: LCI of disposal of SR in landfill
Gas emissions from landfill
Data regarding landfill gas production are taken from Møller et al. (2014) that, based on data
regarding landfill gas production for landfilled SR provided by Scheutz et al. (2011), estimated an
emission of CH4 (including oxidation effect) in the order of 0.166 kg per kg of biogenic C over 100
years (i.e. the time horizon of the LCA). The amount of biogenic carbon still in the landfill after a
100 year period - calculated as the C input minus the amount of carbon lost as methane – is
accounted as a CO2 savings (Christensen et al., 2009).
Emission and production of other gases were also retrieved from Møller et al. (2014), based on data
from Scheutz et al. (2010a) and Scheutz et al. (2010b), as shown in Table 38. The release of
individual gases is the estimated considering that part of the produced gases are oxidised during
their migration through the upper layer of the landfill. Table 38 – Composition, production and release of gas from disposal of SR in landfill (from Møller et al, 2014).
Composition Oxidation Production Release after oxidation
%v/v % kg/kgSR kg/kgSR
CH4 27±0.8 29 1.2*10-2 8.4*10-3
CFC-11 2±1.2 90 1.3*10-7 1.3*10-8
HCFC-21 27±9.7 50 1.8*10-6 8.8*10-7
HCFC-31 20±7.8 30 1.3*10-6 9.1*10-7
HFC-41 1±0.3 0 6.5*10-8 6.5*10-8
CFC-12 1±0.5 30 6.5*10-8 4.6*10-8
HCFC-22 2±0.4 20 1.3*10-7 1.0*10-7
HFC-32 0±0.1 10 0.0 0.0
HFC-134a 10±5.1 0 6.5*10-7 6.5*10-7
HCFC-141b 2±0.5 20 1.3*10-7 1.0*10-7
Leachate production and composition
As described in Møller et al. (2014), data for modelling the production and composition of leachate
produced from disposal of SR in a landfill is based on Hansen et al. (2011b), who performed
leaching tests up to L/S of 9 l/kg. The amount of leachate produced in a 100 year period from
disposal of SR in Danish landfill was estimated being 1.58 l/kgSR (Møller et al., 2014). The release of
individual compounds to the leachate phase was then extrapolated based by interpolating release
data as a function of the L/S ratio (Møller et al. 2014).
As leachate generated in Danish landfills is typically treated before final discharge to surface (or
marine) water bodies, the final release to the environment was then corrected to account for
removal of individual compounds occurring during leachate treatment in wastewater treatment
plant. An overview of inventory data on leaching during deposition of SR in Danish landfill and
subsequent treatment of leachate at wastewater treatment plant is provided in Table 39. The
uncertainty related to the composition of leachate is provided in Table 40, as estimated by Hansen
et al. (2011b).

Life cycle assessment of shredder residue management 83
Table 39 – Leaching of individual substances during deposition of SR in Danish landfill and removal during leachate treatment in wastewater treatment plant (from Møller et al., 2014).
kg/kgSR % of leachate content
Total-N 0,000452 9,80%
Total-P 5,48*10-6 9,00%
𝐶𝑙− 0,000985 100,00%
𝐹− 4,02*10-6 14%
𝑆𝑂42− 2,18*10-5 14%
𝐻𝐶𝑂3− 0,007252 14%
NVOC (DOC) 0,00116 14%
𝑆 − 𝑆2− 6,64*10-7 14%
Al 1,08*10-7 0,30%
As 1,03*10-7 87,00%
Ba 1,76*10-6 13,90%
Ca 0,000527 92,10%
Cd 7,14*10-11 13,90%
Co 2,70*10-9 17,00%
Cr (VI) 2,33*10-9 11,20%
Cr (tot) 2,02*10-8 11,20%
Cu 6,98*10-9 2,00%
Fe 4,14*10-5 1,70%
Hg 1,73*10-10 10,30%
K 0,000451 94,30%
Mg 0,000704 95,10%
Mn 1,34*10-6 47,10%
Mo 9,58*10-9 95,00%
Na 0,000854 89,20%
Ni 1,16*10-7 47,10%
Pb 7,14*10-10 2,70%
Sb 6,66*10-9 45,80%
Se 2,33*10-9 14%
Si 4,28*10-5 14%
V 3,14*10-8 16,90%
Zn 9,60*10-8 7,30%
Benzene (sum) -3*10-7 30%
PAH -6,00*10-11 29%
PAH -6,00*10-11 29%

84 Life cycle assessment of shredder residue management
Table 40 – Estimated uncertainty of characteristic of leachate from SR disposed in landfill (taken from Hansen et al., 2011a).
Parameter Data variation (%) 𝐶𝑙− 60 𝐹− 38 𝑆𝑂4
2− 39 Al 48 As 16 Ba 29 Ca 39 Cd 74 Co 37 Cr (total) 68 Cu 23 Fe 93 Hg 131 K 19 Mg 26 Mn 34 Mo 31 Na 44 Ni 47 Pb 71 Sb 34 Se 2 Si 45 V 68 Zn 61 DOC/NVOC 37

Life cycle assessment of shredder residue management 85
Appendix 6: LCI of co-combustion of SR in a cement kiln
Data regarding co-combustion of SR in a cement kiln are not available in Denmark, as this option is
currently non-existing. The inventory dataset has thus been developed based on literature
information. In particular, Vermeulen et al. (2012) reviewed existing studies and provided for
individual compounds ranges of emissions to air occurring from co-combustion of SR in a cement
kiln. With regards to solid residues, it was considered that the inert part of SR (i.e. ash and metals)
would end up in the clinker and thus no further modelling was included.
Data on SR composition and emissions to air provided by Vermeulen et al. (2012) are reported in
Table 41, together with the waste composition used. The TCs to air (TCair) were calculated
according as:
𝑇𝐶𝑎𝑖𝑟 =𝑂𝑢𝑡𝑝𝑢𝑡𝑎𝑖𝑟
𝐼𝑛𝑝𝑢𝑡𝑤𝑎𝑠𝑡𝑒
where Inputwaste is the content of a specific compound in the waste and Outputair is the emission of
such compound to the atmosphere. Using a uniform distribution for Outputair (minimum and
maximum showed in Table 41) and a lognormal distribution for Inputwaste (assuming average as the
geometrical mean and mix/max as the 2.5/97.5% range Table 41), the TCair where computed 15ooo.
The obtained results were characterized by a log-normal distribution, for which median and
variance were calculated, as shown in Tabel 42. The fact that the TC for C is very close to 100% in
Table 42 indicates that the calculation approach is correct, as all organic C contained in SR should
be converted to CO2 during a complete combustion of the feedstock. However, as a TC >100% does
not make sense from a physical point of view, it was decided to adopt a TC to air for C equal to 100%
for the inventory modelling. The number of simulations was decided based on the following
formula:
𝜀 =3𝜎
√𝑁→ 𝑁 = (
3 × 𝜎
𝜀)
2
= (3 × 𝑠𝑡𝑑𝑒𝑣𝑝(𝑚𝑖𝑛, 𝑚𝑎𝑥, 𝑎𝑣𝑒𝑟𝑎𝑔𝑒(𝑚𝑖𝑛, 𝑚𝑎𝑥))
50)
2
where ε is the error of the estimation (here assumed maximum 2%), σ is the deviation of the data
and N the number of simulations. The value N was estimated for all individual compounds using
data in Table 41, and a rounding of the maximum value (i.e. 14902) being then selected for running
the simulation. Table 41 – Data regarding emissions to air and waste composition, as provided by Vermeulen et al. (2012).
Compound Unit Air emission Waste composition
min max min max average
C kg/tonSR 1.504 279 626 410
N kg/tonSR 8.8 45 19
S kg/tonSR 0.0990 0.2295 1.9 5.6 3.7
As g/tonSR 2.97E-03 6.83E-03 1.2 70 30
Cd g/tonSR 3.42E-03 1.45E+00 2 86 34
Cr g/tonSR 1.40E-02 2.81E-02 17 7000 1120
Cu g/tonSR 4.57E-01 1.97E+00 27 16,600 4910
Hg g/tonSR 1.03E+00 2.02E+00 0.2 14 4.1
Ni g/tonSR 7.34E-03 2.20E-01 54 4000 734
Pb g/tonSR 3.92E-01 5.48E+00 94 7000 2610
Zn g/tonSR 6.61E-01 3.61E+01 1430 14,100 8260

86 Life cycle assessment of shredder residue management
Table 42 – TCs (%) to air for co-combustion of SR in a cement kiln.
TCs (%) to air
Compound median deviation
C 102.0 257.8
S 0.0397 0.1071
As 0.0001 0.0003
Cd 0.0172 0.0478
Cr 0.0005 0.0013
Cu 0.0273 0.0790
Hg 0.0367 0.1038
Ni 0.0022 0.0089
Pb 0.0571 0.2195
Zn 0.3730 1.2975

Life cycle assessment of shredder residue management 87
Appendix 7: Inventory datasets
Inventory dataset for plastic recycling
Inventory data for recycling of plastic are provided in Table 43 and Table 44, together with the
related datasets used in the LCI modelling. The dataset is based on information retrieved from
Franklin Associates (2011). Table 43 – Inventory of input of material and energy to the plastic recycling process.
Type Process Unit Amount
Water Water from Waterworks, Sweden, 2008 kg/kgww 0.02
Diesel Production and Combustion of Diesel Oil in Truck, EU2, 1998 kg/kgww 1.8e-4
Virgin HDPE* Polyethylene, HDPE, granulate, at plant, RER kg/kgww -0.93
Electricity Marginal Electricity Consumption incl. Fuel Production, Coal, Energy Quality, DK, kWh, 2006
kWh/kgww 0.49
Natural gas Natural Gas (prod + comb), <1 MW, kg, Denmark, 1990 kg/kgww 7.7e-3
NaOH Sodium hydroxide (NaOH), RER, ELCD, 1996 - corrected kg/kgww 0.025
* Avoided production
Table 44 – Inventory of emissions from plastic recycling process.
Name Compartment Sub compartment Unit Amount
BOD5 water surface water kg/kgww 1.9/1000
Cd+ water surface water kg/kgww 6.1e-10
CO2, fossil air unspecified kg/kgww 0.0036
COD water surface water kg/kgww 0.021
N water surface water kg/kgww 3e-6
P water surface water kg/kgww 1e-6
SO2 air unspecified kg/kgww 1.1e-6
TOC water surface water kg/kgww 0.0064
Inventory dataset for electricity and heat production
Electricity
Life Cycle Inventory and documentation for 1 kWh marginal Danish electricity “Marginal Electricity
Consumption incl. Fuel Production, Coal, Energy Quality, DK, kWh, 2006” from EASETECH
database.
Technology
The production of 1 kWh of electricity is calculated as an average of seven Danish power stations
(six cogeneration plants and one plant that produces only electricity). These plants were identified
as those plants that can regulate the electricity production according to market demand, i.e. they are
the "marginal" power stations.
Input
Coal (primary fuel) and oil.
Output
1 kWh of electricity supplied to consumers. The LCI includes a loss of 2% in distribution.
Process
Coal and oil are used for energy production. Air emissions are included as well as solid waste
fractions from the combustion process. Mining, processing and transportation of coal and oil are
included in the LCI.
Table 45 – Inventory dataset “electricity "Marginal Electricity Consumption incl. Fuel Production, Coal, Energy Quality, DK, kWh, 2006”.

88 Life cycle assessment of shredder residue management
Parameter Compartment Sub-compartment
Unit Amount
As Air Unspecified kg 4.6e-09
Cd Air Unspecified kg 3.5e-10
CO2, fossil Air Unspecified kg 0.92
CO, fossil Air Unspecified kg 9.9e-05
Cr Air Unspecified kg 6.6e-09
Cu Air Unspecified kg 4.4e-09
Pb Air Unspecified kg 6.7e-09
Hg Air Unspecified kg 9.2e-09
Ni Air Unspecified kg 9,5e-09
NOx Air Unspecified kg 0,000661
N2O Air Unspecified kg 8.1e-06
NMVOC Air Unspecified kg 1.3e-05
Se Air Unspecified kg 6.3e-08
SO2 Air Unspecified kg 2.2e-04
Zn Air Unspecified kg 1.4e-08
CH4, fossil Air Unspecified kg 1.3e-05
PM, < 2.5 um Air Unspecified kg 3.5e-05
Input
Heavy fuel oil, EU-15, ELCD, 2003- corrected kg 0.00493
Hard coal, EU-27, ELCD, 2002 - corrected kg 0.394
Location
Denmark
Year
2006
Data Sources
The data originate from a survey conducted by Energinet.dk and Dansk Standard, aiming at
producing environmental declaration of the Danish electricity which is influenced by market
demand, thus not for an average kWh. Data has since been updated from 2005 to 2007.
Emissions of heavy metals are averages from three Danish CHP plants (Green Account 2006 for
Esbjerg [2] , Asnæs (line 2 +5) [3] and Stigsnæs ( line 1 +2) [4]).
Data Quality (dqi = good)
Data were collected as an average of seven Danish installations but adjusted so that coal was the
dominant fuel. This is because coal is the fuel that will be affected when the plant responds to
market demand [1]. Heavy metal emissions are based on three power plants and are considered to
be relatively well documented.
Note
Electricity is produced at six of the seven plants together with heat. Therefore, resource
consumption, emissions, etc. are allocated between the two products. This is done in [1] based on
energy quality, which is a method that allocates a relatively large proportion of resource
consumption and emissions for electricity production. Emissions of heavy metals were allocated in
a similar way.
Referencer
1. Behnke, K. (2006): Notat om deklaration af fremtidigt elforbrug, Energinet.dk, Denmark.
2. DONG Energy (2007): Esbjergværket. Grønt regnskab 2006.
3. DONG Energy (2007): Asnæsværket. Grønt regnskab 2006.
4. DONG Energy (2007): Stigsnæsværket. Grønt regnskab 2006
Heat

Life cycle assessment of shredder residue management 89
Life Cycle Inventory and documentation for 1 kWh marginal Danish heat “District Heating,
marginal average, (DK), kWh, 2012” from EASETECH database. Table 46 - Inventory dataset “District Heating, marginal average, (DK), kWh, 2012”
Emission Compartment Sub-compartment Unit Amount
.CH4, fossil Air Unspecified kg 0,000175
CO2, fossil Air Unspecified kg 0,15
N2O Air Unspecified kg 5,76E-06
PM Air Unspecified kg 0,000283
NOx Air Unspecified kg 0,000407
The LCI was prepared by Energistyrelsen (2011): ”Forudsætninger for samfundsøkonomiske
analyser i energisektoren”, as described in Jakobsen et al. (2013), page 79-80. Fuel composition was
22% wood, 21% natural gas, 20% waste, 16% coal, 8% straw, 7% oil and 5% biogas.

90 Life cycle assessment of shredder residue management
Appendix 8: Evaluation of the potential environmental impacts
Characterized potential environmental impacts
Figure 30 - Characterised potential non-toxic impacts from the treatment of 1 ton of SR in the four analysed scenarios (PE = person equivalent).
Figure 31 - Characterised potential toxic impacts from the treatment of 1 ton of SR in the four analysed scenarios (PE = person equivalent).
-8
-6
-4
-2
0
2
4
6
8
Global Warming*(kg CO2-eq)
StratosphericOzone Dep.
(kg CFC-11-eq)
PhotochemicalOxidant Form.(kg NMVOC)
TerrestrialAcidification
(AE)
TerrestrialEutrophication
(AE)
FreshwaterEutrophication
(kg P-eq)
MarineEutrophication
(kg N-eq)
Imp
ac
t P
ote
nti
als
(u
nit
/to
n S
R)
Characterised Environmental Impact Potentials Non-toxic Categories
Scenario 1 - Landfill Scenario 2 - Incineration Scenario 3 - Pyrolysis Scenario 4 - Cement kiln* divided by 10** divided by 100
-50
-30
-10
10
30
50
HuTox,Carcinogenic
(CTU)
HuTox, non-Carcinogenic
(CTU)
ParticulateMatter
(kg PM2.5-eq)
IonisingRadiation
(kg U235-eq)
EcoToxicity*(CTU)
Imp
ac
t P
ote
nti
als
(u
nit
/to
n S
R)
Characterised Environmental Impact Potentials Toxic Categories
Scenario 1 - Landfill Scenario 2 - Incineration Scenario 3 - Pyrolysis Scenario 4 - Cement kiln
176
* divided by 10** divided by 100

Life cycle assessment of shredder residue management 91
Figure 32 - Characterised potential Resource Depletion from the treatment of 1 ton of SR in the four analysed scenarios (PE = person equivalent).
Figure 33 – Characterised potential non-toxic impacts from the treatment of 1 ton of SR in the four analysed scenarios (PE = person equivalent), including min-max range.
-14000
-12000
-10000
-8000
-6000
-4000
-2000
0
Resources,Fossil(MJ)
Resources,Mineral
(mg Sb-eq)
Imp
ac
t P
ote
nti
als
(u
nit
/to
n S
R)
Characterised Environmental Impact Potentials Resource Depletion Categories
Scenario 1 - Landfill Scenario 2 - Incineration Scenario 3 - Pyrolysis Scenario 4 - Cement kiln
-15
-10
-5
0
5
10
15
20
S1 S2 S3 S4 S1 S2 S3 S4 S1 S2 S3 S4 S1 S2 S3 S4 S1 S2 S3 S4 S1 S2 S3 S4 S1 S2 S3 S4
Global Warming*(kg CO2-eq)
StratosphericOzone Dep.
(kg CFC-11-eq)
PhotochemicalOxidant Form.(kg NMVOC)
TerrestrialAcidification
(AE)
TerrestrialEutrophication
(AE)
FreshwaterEutrophication
(kg P-eq)
MarineEutrophication
(kg N-eq)
Imp
ac
t P
ote
nti
als
(u
nit
/to
n S
R)
Characterised Environmental Impact Potentials Non-toxic Categories
min max mean * divided by 10

92 Life cycle assessment of shredder residue management
Figure 34 - Characterised potential toxic impacts from the treatment of 1 ton of SR in the four analysed scenarios (PE = person equivalent), including min-max range.
Figure 35 - Characterised potential Resource Depletion from the treatment of 1 ton of SR in the four analysed scenarios (PE = person equivalent), including min-max range.
-100
-50
0
50
100
150
200
S1 S2 S3 S4 S1 S2 S3 S4 S1 S2 S3 S4 S1 S2 S3 S4 S1 S2* S3* S4 **
HuTox,Carcinogenic
(CTU)
HuTox, non-Carcinogenic
(CTU)
ParticulateMatter
(kg PM2.5-eq)
IonisingRadiation
(kg U235-eq)
EcoToxicity(CTU)
Imp
ac
t P
ote
nti
als
(u
nit
/to
n S
R)
Characterised Environmental Impact Potentials Toxic Categories
min max mean* divided by 100** divided by 1000
-25000
-20000
-15000
-10000
-5000
0
5000
S1 S2 S3 S4 S1 S2 S3 S4
Resources,Fossil(MJ)
Resources,Mineral
(mg Sb-eq)
Imp
ac
t P
ote
nti
als
(u
nit
/to
n S
R)
Characterised Environmental Impact Potentials Resource Depletion Categories
min max mean

Life cycle assessment of shredder residue management 93
Figure 36 - Characterised potential impacts from the treatment of 1 ton of SR in Scenario 1, disaggregated according to individual treatment processes (PE = person equivalent).
Figure 37 - Characterised potential toxic impacts from the treatment of 1 ton of SR in Scenario 2, disaggregated according to individual treatment processes (PE = person equivalent).
-50
-40
-30
-20
-10
0
10
20
Glo
ba
l W
arm
ing
*(k
g C
O2
-eq
)
Str
ato
sph
eri
cO
zon
e D
ep.
(kg
CF
C-1
1-e
q)
Ph
oto
che
mic
al
Ox
ida
nt
Fo
rm.
(kg
NM
VO
C)
Ter
rest
ria
lA
cid
ific
ati
on
(AE
)
Ter
rest
ria
lE
utr
op
hic
ati
on
(AE
)
Fre
shw
ate
rE
utr
op
hic
ati
on
(kg
P-e
q)
Ma
rin
eE
utr
op
hic
ati
on
(kg
N-e
q)
Hu
To
x,
Ca
rcin
og
enic
(CT
U)
Hu
To
x,
no
n-
Ca
rcin
og
enic
(CT
U)
Pa
rtic
ula
teM
att
er(k
g P
M2
.5-e
q)
Ion
isin
gR
ad
iati
on
(kg
U2
35
-eq
)
Eco
To
xic
ity
(CT
U)
Re
sou
rces
,F
oss
il**
(MJ
)
Re
sou
rces
,M
iner
al
(kg
Sb
-Eq
)
Imp
ac
t P
ote
nti
als
(u
nit
/to
n S
R)
Characterised Environmental Impact Potentials Scenario 1
Plastic recycling Aluminum recycling Glass Recycling Ferrous Recycling
Landfilling Biotreatment Sorting Plant* divided by 10** divided by 100
-150
-100
-50
0
50
100
150
Glo
ba
l W
arm
ing
*(k
g C
O2
-eq
)
Str
ato
sph
eri
cO
zon
e D
ep.
(kg
CF
C-1
1-e
q)
Ph
oto
che
mic
al
Ox
ida
nt
Fo
rm.
(kg
NM
VO
C)
Ter
rest
ria
lA
cid
ific
ati
on
(AE
)
Ter
rest
ria
lE
utr
op
hic
ati
on
(AE
)
Fre
shw
ate
rE
utr
op
hic
ati
on
(kg
P-e
q)
Ma
rin
eE
utr
op
hic
ati
on
(kg
N-e
q)
Hu
To
x,
Ca
rcin
og
enic
(CT
U)
Hu
To
x,
no
n-
Ca
rcin
og
enic
(CT
U)
Pa
rtic
ula
teM
att
er(k
g P
M2
.5-e
q)
Ion
isin
gR
ad
iati
on
(kg
U2
35
-eq
)
Eco
To
xic
ity
(CT
U)
Re
sou
rces
,F
oss
il**
(MJ
)
Re
sou
rces
,M
iner
al
(kg
Sb
-Eq
)
Imp
ac
t P
ote
nti
als
(u
nit
/to
n S
R)
Characterised Environmental Impact Potentials Scenario 2
Plastic recycling Aluminum recycling Glass RecyclingFerrous Recycling WTE Ash TreatmentLandfilling Biotreatment Sorting Plant
* divided by 10** divided by 100

94 Life cycle assessment of shredder residue management
Figure 38 - Characterised potential toxic impacts from treatment of 1 ton SR in Scenario 3, disaggregated according to individual treatment processes (PE = person equivalent).
Figure 39 - Characterised potential toxic impacts from the treatment of 1 ton of SR in Scenario 4, disaggregated according to individual treatment processes (PE = person equivalent).
-150
-100
-50
0
50
100
150
200
Glo
ba
l W
arm
ing
*(k
g C
O2
-eq
)
Str
ato
sph
eri
cO
zon
e D
ep.
(kg
CF
C-1
1-e
q)
Ph
oto
che
mic
al
Ox
ida
nt
Fo
rm.
(kg
NM
VO
C)
Ter
rest
ria
lA
cid
ific
ati
on
(AE
)
Ter
rest
ria
lE
utr
op
hic
ati
on
(AE
)
Fre
shw
ate
rE
utr
op
hic
ati
on
(kg
P-e
q)
Ma
rin
eE
utr
op
hic
ati
on
(kg
N-e
q)
Hu
To
x,
Ca
rcin
og
enic
(CT
U)
Hu
To
x,
no
n-
Ca
rcin
og
enic
(CT
U)
Pa
rtic
ula
teM
att
er(k
g P
M2
.5-e
q)
Ion
isin
gR
ad
iati
on
(kg
U2
35
-eq
)
Eco
To
xic
ity
*(C
TU
)
Re
sou
rces
,F
oss
il**
(MJ
)
Re
sou
rces
,M
iner
al
(kg
Sb
-Eq
)
Imp
ac
t P
ote
nti
als
(u
nit
/to
n S
R)
Characterised Environmental Impact Potentials Scenario 3
Plastic recycling Aluminum recycling Copper Recycling Glass RecyclingFerrous Recycling Pyrolysis Ash Treatment LandfillingBiotreatment Sorting Plant
* divided by 10** divided by 100
-150
-100
-50
0
50
100
Glo
ba
l W
arm
ing
*(k
g C
O2
-eq
)
Str
ato
sph
eri
cO
zon
e D
ep.
(kg
CF
C-1
1-e
q)
Ph
oto
che
mic
al
Ox
ida
nt
Fo
rm.
(kg
NM
VO
C)
Ter
rest
ria
lA
cid
ific
ati
on
(AE
)
Ter
rest
ria
lE
utr
op
hic
ati
on
(AE
)
Fre
shw
ate
rE
utr
op
hic
ati
on
(kg
P-e
q)
Ma
rin
eE
utr
op
hic
ati
on
(kg
N-e
q)
Hu
To
x,
Ca
rcin
og
enic
(CT
U)
Hu
To
x,
no
n-
Ca
rcin
og
enic
(CT
U)
Pa
rtic
ula
teM
att
er(k
g P
M2
.5-e
q)
Ion
isin
gR
ad
iati
on
(kg
U2
35
-eq
)
Eco
To
xic
ity
*(C
TU
)
Re
sou
rces
,F
oss
il**
(MJ
)
Re
sou
rces
,M
iner
al
(kg
Sb
-Eq
)
Imp
ac
t P
ote
nti
als
(u
nit
/to
n S
R)
Characterised Environmental Impact Potentials Scenario 4
Plastic recycling Aluminum recycling Glass Recycling Ferrous Recycling
Landfilling Biotreatment Cement Kiln Sorting Plant* divided by 10** divided by 100

Life cycle assessment of shredder residue management 95
Figure 40 - Characterised potential non-toxic impacts from the treatment of 1 ton of SR in the four analysed scenarios modelled using alternative marginal electricity production (i.e. coal, natural gas and wind). (PE = person equivalent).
Figure 41 - Characterised potential toxic impacts from the treatment of 1 ton of SR in the four analysed scenarios modelled using alternative marginal electricity production (i.e. coal, natural gas and wind). (PE = person equivalent).
-10
-8
-6
-4
-2
0
2
4
6
8
GlobalWarming**(kg CO2-eq)
StratosphericOzone Dep.
(kg CFC-11-eq)
PhotochemicalOxidant Form.(kg NMVOC)
TerrestrialAcidification
(AE)
TerrestrialEutrophication
(AE)
FreshwaterEutrophication
(kg P-eq)
MarineEutrophication
(kg N-eq)
Imp
ac
t P
ote
nti
als
(u
nit
/to
n S
R)
Characterised Environmental Impact Potentials Non-toxic Categories
Scenario 1 - Landfill Scenario 2 - Incineration Scenario 3 - Pyrolysis Scenario 4 - Cement kiln
Scenario 1 (natural gas) Scenario 2 (natural gas) Scenario 3 (natural gas) Scenario 4 (natural gas)
Scenario 1 (wind) Scenario 2 (wind) Scenario 3 (wind) Scenario 4 (wind) * divided by 100
-1
0
1
2
3
4
5
6
HuTox,Carcinogenic
(CTU)
HuTox, non-Carcinogenic
(CTU)
ParticulateMatter
(kg PM2.5-eq)
IonisingRadiation**
(kg U235-eq)
EcoToxicity***(CTU)
Imp
ac
t P
ote
nti
als
(u
nit
/to
n S
R)
Characterised Environmental Impact Potentials Toxic Categories
Scenario 1 - Landfill Scenario 2 - Incineration Scenario 3 - Pyrolysis Scenario 4 - Cement kiln
Scenario 1 (natural gas) Scenario 2 (natural gas) Scenario 3 (natural gas) Scenario 4 (natural gas)
Scenario 1 (wind) Scenario 2 (wind) Scenario 3 (wind) Scenario 4 (wind)
* *
* divided by 10000** divided by 100*** divided by 1000

96 Life cycle assessment of shredder residue management
Figure 42 – Characterised potential Resource Depletion from the treatment of 1 ton of SR in the four analysed scenarios modelled using alternative marginal electricity production (i.e. coal, natural gas and wind). (PE = person equivalent).
Potential environmental impacts by material fraction
Figure 43 - Characterised potential Global Warming impacts from treatment of 1 ton SR in the four analysed scenarios, disaggregated according to individual material fractions (PE = person equivalent).
-16000
-14000
-12000
-10000
-8000
-6000
-4000
-2000
0
2000
Resources,Fossil(MJ)
Resources,Mineral
(mg Sb-eq)
Imp
ac
t P
ote
nti
als
(u
nit
/to
n S
R)
Characterised Environmental Impact Potentials Resource Depletion categories
Scenario 1 - Landfill Scenario 2 - Incineration Scenario 3 - Pyrolysis Scenario 4 - Cement kiln
Scenario 1 (natural gas) Scenario 2 (natural gas) Scenario 3 (natural gas) Scenario 4 (natural gas)
Scenario 1 (wind) Scenario 2 (wind) Scenario 3 (wind) Scenario 4 (wind)
-3000
-2500
-2000
-1500
-1000
-500
0
500
1000
Mix
ed S
R
Gla
ss
Pla
stic
Nfe
met
als
Fe
me
tals
>4
mm
Mix
ed S
R
Gla
ss
Pla
stic
Nfe
met
als
Fe
me
tals
>4
mm
Mix
ed S
R
Gla
ss
Pla
stic
Nfe
met
als
Fe
me
tals
>4
mm
Mix
ed S
R
Gla
ss
Pla
stic
Nfe
met
als
Fe
me
tals
>4
mm
Scenario 1 Scenario 2 Scenario 3 Scenario 4
Imp
ac
t P
ote
nti
als
(k
g C
O2-e
q./
ton
ma
ter
ial)
Characterised Environmental Impact Potentials Global Warming Impact Category
min max mean

Life cycle assessment of shredder residue management 97
Appendix 9: Review report from Teknologisk Institut

98 Life cycle assessment of shredder residue management

Life cycle assessment of shredder residue management 99

100 Life cycle assessment of shredder residue management


Strandgade 29
1401 Copenhagen K, Denmark
Tel.: (+45) 72 54 40 00
www.mst.dk
Life cycle assessment of shredder residue management
The present report includes a life cycle assessment (LCA) of the treatment of shredder residues in
Denmark. The assessment compares the potential environmental impacts and depletion of abiotic
resources in relation to four alternative scenarios, all including the sorting of recyclables and the
management of residual material through thermal treatment and/or disposal in controlled landfills after
biological stabilisation.
The following can be concluded:
- Diverting SR >4 mm from landfill provides benefits from an environmental perspective and
should thus be supported.
- Sorting and recycling metals, plastics and glass are beneficial to the environment and should
thus be continued. Special focus should be given to increasing metal recovery, as this provides the
greatest environmental benefits.
- Incineration seems currently the best option for the treatment of >4 mm residues.
- Pyrolysis seems to have worse energy efficiency but better downstream metal recovery (i.e. from
the residues) than incineration. However, a clear conclusion could not be drawn, because results for
pyrolysis were associated with significant uncertainty, owing to the lack of precise inventory data
describing the process. Thus, any decision regarding the implementation of pyrolysis for treating >4 mm
SR fractions should first be supported by pilot- to full-scale tests of the process, to deliver a better
understanding thereof.