Embed Size (px)
Citation preview
Life Cycle Assessment of Wall Systems
by
Sriranjani Ramachandran
A Thesis Presented in Partial Fulfillmentof the Requirements for the Degree
Master of Science
Approved July 2013 by theGraduate Supervisor Committee:
Harvey Bryan, ChairPhilip White
T. Agami Reddy
ARIZONA STATE UNIVERSITY
August 2013

i
ABSTRACT
Natural resource depletion and environmental degradation are the stark realities of
the times we live in. As awareness about these issues increases globally, industries and
businesses are becoming interested in understanding and minimizing the ecological
footprints of their activities. Evaluating the environmental impacts of products and
processes has become a key issue, and the first step towards addressing and eventually
curbing climate change. Additionally, companies are finding it beneficial and are interested
in going beyond compliance using pollution prevention strategies and environmental
management systems to improve their environmental performance. Life-cycle Assessment
(LCA) is an evaluative method to assess the environmental impacts associated with a
products’ life-cycle from cradle-to-grave (i.e. from raw material extraction through to
material processing, manufacturing, distribution, use, repair and maintenance, and finally,
disposal or recycling).
This study focuses on evaluating building envelopes on the basis of their life-cycle
analysis. In order to facilitate this analysis, a small-scale office building, the University
Services Building (USB), with a built-up area of 148,101 ft2 situated on ASU campus in
Tempe, Arizona was studied. The building’s exterior envelope is the highlight of this study.
The current exterior envelope is made of tilt-up concrete construction, a type of
construction in which the concrete elements are constructed horizontally and tilted up, after
they are cured, using cranes and are braced until other structural elements are secured. This
building envelope is compared to five other building envelope systems (i.e. concrete block,
insulated concrete form, cast-in-place concrete, steel studs and curtain wall constructions)
evaluating them on the basis of least environmental impact. The research methodology

ii
involved developing energy models, simulating them and generating changes in energy
consumption due to the above mentioned envelope types. Energy consumption data, along
with various other details, such as building floor area, areas of walls, columns, beams etc.
and their material types were imported into Life-Cycle Assessment software called
ATHENA impact estimator for buildings. Using this four-stepped LCA methodology, the
results showed that the Steel Stud envelope performed the best and less environmental
impact compared to other envelope types. This research methodology can be applied to
other building typologies.

iii
To my family…. who have been with me
all the time

iv
ACKNOWLEDGEMENTS
I would like to thank my thesis chair Professor Harvey Bryan for his continued
interest in my education and support in my research; Professor Philip White for his
guidance in making me understand various potentials behind my thesis research; and
Professor T Agami Reddy for his support and also for being a part of my committee. I
would also like to thank Architect Edmundo Soltero and his team at the University Services
Building (USB) who helped with the data regarding the building.
I thank my loving parents for trusting in me, supporting me and made me achieve
my dreams of being in the US to do my Masters. A special thanks to my wonderful loving
friends who have given me a home away from home and being there for me.

v
TABLE OF CONTENTSPAGE
LIST OF TABLES.............................................................................................................. x
LIST OF FIGURES .......................................................................................................... xii
DEFINITION OF TERMS .............................................................................................. xiv
BACKGROUND ................................................................................................................ 1
Global Issues and their impacts ...............................................................................1
Practice of the Building Industry .............................................................................2
The Building Industry in Phoenix............................................................................6
Buildings on ASU campus.......................................................................................6
LIFE CYCLE ASSESSMENT ........................................................................................... 9
What is LCA? ..........................................................................................................9
Who does LCA and Why?.....................................................................................10
Origin of LCA........................................................................................................11
Scope and Limitations of LCA study ....................................................................13
LCA in the building industry .................................................................................13
Material Level........................................................................................................14
Product Level.........................................................................................................15
Building Level .......................................................................................................16
Industry Level ........................................................................................................16

vi
PAGE
Standards in LCA ..................................................................................................17
LCA and Green Globes™ ............................................................................. 19
LCA and ICC 700.......................................................................................... 19
LCA and the IGCC........................................................................................ 19
LCA and ASHRAE 189.1 ............................................................................. 20
Cal green........................................................................................................ 20
BUILDING ENVELOPE.................................................................................................. 21
What is a Building Envelope? ...............................................................................21
Energy Performance of Building Envelopes .........................................................22
Objective ............................................................................................................23
LITERATURE REVIEW ................................................................................................. 25
Generic Elements of LCA .....................................................................................25
Functional unit............................................................................................... 25
System boundary ...................................................................................................25
Inputs and outputs..................................................................................................26
Impact assessment .................................................................................................26
‘Bottom-up’ process analysis ................................................................................27
Types of LCA used in practice ..............................................................................28

vii
PAGE
Process LCA.................................................................................................. 28
Cradle-to-Grave............................................................................................. 28
Cradle-to-Gate ............................................................................................... 28
Cradle-to-Cradle............................................................................................ 29
Gate-to-Gate .................................................................................................. 29
Streamlined LCA .................................................................................................. 29
Input–output and hybrid input–output ...................................................................31
Studies in LCA ......................................................................................................32
LCA Methodology.................................................................................................35
Goal and Scope Definition ............................................................................ 35
Inventory analysis ..................................................................................................36
Life Cycle Impact Categories ................................................................................37
Global Warming Potential (GWP)......................................................... 38
Acidification Potential (AP) .................................................................. 38
Eutrophication Potential (EP) ................................................................ 38
Fossil Fuel Depletion (FFD) .................................................................. 39
Smog Formation Potential (SFP) ........................................................... 39
Ozone Depletion Potential (ODP) ......................................................... 40

viii
PAGE
Ecological Toxicity (ET) ....................................................................... 40
Water Use (WU) .................................................................................... 40
Life Cycle Impact assessment ...............................................................................40
Interpretation of Results ........................................................................................42
Materials used in Building Envelope.....................................................................43
Tilt Up Concrete Wall Construction......................................................................44
Cast in Place Concrete Wall Construction.............................................................47
Concrete Blocks.....................................................................................................49
Curtain Wall System..............................................................................................52
Insulated Concrete Forms ......................................................................................55
Steel Stud wall Construction .................................................................................58
Life Cycle Assessment Tools ................................................................................62
RESEARCH METHODOLOGY...................................................................................... 64
Description of the Case Study ...............................................................................64
Procedure ............................................................................................................69
Results ............................................................................................................72
Comparison based on the Assembly groups ..........................................................79
Sensitivity Analysis ...............................................................................................80

ix
PAGE
Conclusions............................................................................................................83
Limitations ............................................................................................................84
Future Work...........................................................................................................85
REFERENCES ................................................................................................................. 87
APPENDIX....................................................................................................................... 90

x
LIST OF TABLES
Table Page
Table shows the Inventory Data for Tilt-Up concrete Wall construction (Source:
Simapro)............................................................................................................................ 46
Table shows the Inventory Data for Cast in Place concrete Construction (Source:
Simapro)............................................................................................................................ 48
Table shows the Inventory Data for Concrete Block Construction (Source: Simapro).... 51
Table shows the Inventory Data for Curtain Wall Construction (Source: Simapro) ........ 54
Table showing the inventory data of Insulated Concrete Form Wall Construction ......... 57
Table showing Inventory Data for Steel Stud Wall Construction (Source: Simapro) ...... 62
Table shows the area and construction details of the case study building selected .......... 65
Tables showing the Columns and Footing sizes and area................................................. 65
Table showing the materials used in each of the envelope systems (Source: eQUEST).. 70
Table showing kWh values of the Total Energy Consumption associated with different
wall systems (Source: eQUEST) ...................................................................................... 71
Table showing the values of each summary measures of each of the envelope based on
the Manufacturing Life Cycle Stage (Source: ATHENA Impact Estimator) ................... 73
Table showing total values of the manufacturing impacts based on the Summary
measures............................................................................................................................ 73
Table showing total values of the manufacturing impacts based on the summary measures
after normalization ............................................................................................................ 74
Table showing the rankings for manufacturing stage of each of the wall systems based on
the summary measures ...................................................................................................... 75

xi
Table showing the ranking for Construction Stage each of the wall system based on the
summary measures............................................................................................................ 75
Table showing the ranking for Maintainence Stage each of the wall system based on the
summary measures............................................................................................................ 76
Table showing the ranking End-of-Life Stage each of the wall system based on the
summary measures............................................................................................................ 76
Table showing the ranking for Operating Energy Stage each of the wall system based on
the summary measures ...................................................................................................... 77
Table showing the total rankings of all the Life Cycle Stages of the Wall systems......... 77
Table showing the ranking of the different wall systems based on the summary measures
........................................................................................................................................... 79
Table showing comparisons in rankings of various wall systems based on their Life Cycle
Stages for Los Angeles and Phoenix ................................................................................ 80
Table showing the comparison in rankings of various wall systems based on their
summary measures for Los Angeles and Phoenix ............................................................ 82

xii
LIST OF FIGURES
Figure Page
Figure 1: The relationship between the Economic and Natural System (Source: UNEP
Resource Panel) .................................................................................................................. 1
Figure 2: U.S. Energy Consumption by Sector (Source: Architecture 2030)..................... 3
Figure 3:U.S. Impacts of Buildings on Resources .............................................................. 4
Figure 4: Rate of Growth of Construction Activity (Source: Construction Industry Market
Report 2012) ....................................................................................................................... 5
Figure 5: ASU Tempe Campus Development over the years (University, 1928) .............. 7
Figure 6: Life Cycle Stages (Source: Fraunhofer Institute of Physics) .............................. 9
Figure 7: Figure shows the hybrid LCA of ready mix concrete ....................................... 32
Figure 8: Schindler-Chase house (Rudolf Schindler) is an early example of Tilt-Up
concrete construction ........................................................................................................ 44
Figure 9: A Tilt-Up concrete construction at site. (Source: Wikipedia)........................... 45
Figure 10: Framework for Precast concrete wall (Source: Baruzzini Construction)........ 47
Figure 11: Hollow Concrete Blocks (Source: Building Materials BlogSpot) .................. 49
Figure 12: Metal Facade Panel Location: Bratislava Slovakia (Slovak Republic) (Source:
Hunter Douglas Facade systems)...................................................................................... 52
Figure 13: Insulated Concrete Forms (Source: NUDURA Integrated building
Technology) ...................................................................................................................... 56
Figure 14: Different Types of ICF systems ...................................................................... 57
Figure 15: Steel Stud Wall of an Industrial Building (Source: Dreamstime) ................... 59
Figure 16: C-Studs ............................................................................................................ 60

xiii
Figure 17: Knockouts and Tracks ..................................................................................... 60
Figure 18: Images of the Case Study Building- University Services Building (Tempe,
Arizona) ............................................................................................................................ 67
Figure 19: Snapshot from ATHENA software showing the details of some information of
the building ....................................................................................................................... 67
Figure 20: Snapshot from ATHENA software showing the details of ............................. 68
Figure 21: Snapshot from ATHENA software showing the details of Exterior Walls and
Concrete Footing............................................................................................................... 68
Figure 22: Flowchart showing the steps involved in the Procedure of the research......... 69
Figure 23: Figure shows the eQUEST model of the case study building to find the energy
consumption for different envelope systems .................................................................... 70
Figure 24: Graph comparing the total R-values between each of the Wall System ......... 71
Figure 25: Graph showing the comparison of the Total Energy Consumption (kWh) of
the different wall systems (Source: eQUEST).................................................................. 72
Figure 26: Graph showing all assembly groups with their total impact values ................ 79
Figure 27: Graph showing the comparison in total ranking of the different wall systems
for both climate types........................................................................................................ 81
Figure 28: Graph showing comparison of rankings of different wall systems based on the
Summary measures ........................................................................................................... 82
Figure 29: Graph showing comparison of summary measures of different types of Wall
systems.............................................................................................................................. 84

xiv
DEFINITION OF TERMS
ACI American Concrete Institute
ACP Acidification Potential
AEC Architecture Engineer and Construction
ASHRAE American Society of Heating, Refrigerating and Air-Conditioning
ASTM American Society for Testing and Materials
ATHENA Institute which developed and Environmental Impact Estimator Tool
BEES Building for Environmental and Economic Sustainability
BREEAM Building Research Establishment Environmental Assessment Method
C Construction Life Cycle Phase
C2ES Center for Climate and Energy Solutions
Cal green California Green Building Standards Code
CB Concrete Block
CEN European Committee for Standardization
CFC Chlorofluorocarbon
CIP Cast in Place Concrete
CW Curtain Wall
EDIP Environmental Development of Industrial Products
EIA Environmental Information Administration
EIA Energy Information Administration
EIO Economic Input Output
ENVEST Environmental Estimator
EOL End-of-Life Life Cycle Phase

xv
EP Eutrophication Potential
EPA Environmental Protection Agency
EPD Environmental Protection Declaration
ET Ecological Toxicity
FDM Facilities Development & Management
FFD Fossil Fuel Depletion
GaBi Product Sustainability Performance Tool developed by PE International
HH Human Health Criteria
ICF Insulated Concrete Form
IMPACT 2002Life Cycle Impact Assessment Method
ISO International Organization for Standardization
ISO 14044 International Organization of Standardization - Environmental
LCA Life Cycle Assessment
LCC Life Cycle Costing
LCI Life Cycle Inventory
LCIA Life Cycle Impact Assessment
LEED Leadership in Energy and Environmental Design
M Manufacturing Life Cycle Phase
Ma Maintenance Life Cycle Phase
ODP Ozone Depletion Potential
OE Operating Energy Life Cycle Phase
PCA Portland cement Association
REPA Resource and Environmental Profile Analysis

xvi
SETAC Society of Environmental Toxicology and Chemistry
SFP Smog Formation Potential
SS Steel Stud
TRACI Tools for the Reduction and Assessment of Chemical and other
UNEP United National Environmental Programme
US LCI United States Life cycle Inventory Database
WU Water Use

1
BACKGROUND
Global Issues and their impacts
Planet earth has showed patterns of change in climate and in physical formations
from Pangaea to Mount St. Helens. The planet is currently changing, but the rate at which
it is changing is an interesting thing. Climate disturbs all inhabitants of the earth, and a
rapid change should be of concern to us. Humans, as beings of cognition and reason, have
the opportunity and the responsibility to understand what is happening and why. If human
actions are having a negative effect on other human beings and species, then we should
be aware of it and know what we can do about it. (Millerd J. A., 2008)
Figure 1: The relationship between the Economic and Natural System (Source: UNEPResource Panel)
All economic activities needs resources such as energy, materials, and land,
invariably generates material residuals, which enters the environment as waste or
polluting emissions. The Earth, is a finite planet and has a restricted capability to supply
resources and to absorb pollution (Knesse, 1969).

2
The Millennium Ecosystem Assessment (MA) of 2005 is the most authoritative
analysis with regard to the status of global ecosystems contributed by 1300 scientists
from all parts of the world. It identified factors that threaten ecosystems and contributions
of ecosystems to human well-being. In the past 50 years, humans have changed
ecosystems more rapidly and extensively than in any equivalent time period in human
history, to meet the rapidly growing demand for food, fresh water, timber, fibre and fuel.
This has resulted in a substantial and largely irreversible loss in the diversity of life on
Earth. It has also examined that the supply of ecosystem services to humans: the
provision of food, fibres, genetic resources, biochemicals and fresh water; the regulation
of air quality, climate, water, natural hazards, pollination, pests and disease; the support
derived from primary production, nutrient cycling, soil formation and water cycling; and
cultural services such as spiritual and aesthetic values, and recreation. (Mark Huijbregts,
2010)
Practice of the Building Industry
The construction and engineering industry is debatably the world’s largest. It is
fast-paced, often governed by strict deadlines, where completing a project successfully
requires cooperation and teamwork among owners, architects, engineers, contractors,
subcontractors, and many others. The resource consumption and energy use are not only
the major factors in the changing state of the planet and atmosphere, but also that the
earth is unable to support the current consumption patterns for the population that is
expected. If we want our planet to be infinite, and want to experience all the joys and

3
luxuries that the nature provides, then we must find areas in the economy where using the
resources could reduce throughout. (K&L Gates, 2013)
Figure 2: U.S. Energy Consumption by Sector (Source: Architecture 2030)
In the United States, buildings consume 48.7 percent of the country’s energy
production, compared to the other industries and transportation, and demands 76 percent
of the energy produced by the coal plants (United States Green Building Council, 2013).
Also buildings produce 30 percent of the country’s greenhouse gas emissions including
carbon dioxide, carbon monoxide, nitrous oxide and CFC’s among many others. The
energy requirements of a building’s HVAC and lighting could be reduced by improved
building design and appliance choice.
The U.S. Energy Information Administration (EIA) now reports that, in coming
years, the energy consumption of the building Sector is expected to grow faster than that
of industry and transportation. Between 2010 and 2030, the total Building Sector energy

4
consumption will increase by 5.85 Quadrillion Btu (QBtu), Industry will grow by 4.01
QBtu and Transportation by 3.15 QBtu. These projections implies that 1 QBtu is equal to
the delivered energy of thirty-seven 1000-MW nuclear power plants, or 235 coal-fired
power plants at 200-MW each. (Mazria, 2011)
Figure 3:U.S. Impacts of Buildings on Resources
Added to this buildings consume a huge amount of materials; as they account for
40 percent of raw materials used globally and produce 30 percent of total waste output.
The Environmental Protection Agency (EPA) estimates that 136 million tons of building-
related construction and demolition debris was generated in the U.S. in a single year,
compared to 209.7 million tons of municipal waste that same year. At the same time, the
U.S. was stripping the land, harvesting non-renewable resources and overharvesting
renewable resources.

5
Figure 4: Rate of Growth of Construction Activity (Source: Construction Industry MarketReport 2012)
Current building practices are very inefficient in both energy use and material
consumption. A building when constructed in a right manner can reduce stress, uses 35
percent less energy, 85 percent less water outside, 20 percent less water inside, and
makes 50 percent less contribution to landfills (United States Green Building Council,
2013). The building industry represents an excellent opportunity for the management of
the impact that human activity is having on the environment. Within the U.S. and
globally, the debt crises, political transitions and regional conflicts have created a level of
uncertainty not seen for several years. This has led to creating an environment where
there is little prospect of stable growth in the demand for construction. In most parts of
the country the construction activity seems to pick up, with the majority of states showing
some growth over the past years. In most cases however, the rate of growth is hovering
very close to zero, with construction activity close to negligible. (Morris, 2012)

6
The Building Industry in Phoenix
According to the US Census Bureau, over the last years, three of the top ten
fastest growing cities in the United States, are located in the Phoenix metropolitan area.
The growth of places like Gilbert, Chandler and Peoria has helped to make the Phoenix
Valley the fastest growing metropolitan area in the United States with a 34.3% population
growth between years 1999-2000. This enormous growth which undoubtedly demands
construction responses, resulted in building materials being used in staggering quantities,
which are used once most often and then discarded to landfill. Phoenix's sprawl is not
conducive to high-rise buildings, but this is changing as more businesses desire a central
location. Over the years, the construction industry has seen progress, with lot of
construction activity in the first quarter of 2013. (CoStar, 2013)
Buildings on ASU campus
Originally named the Tempe Normal School, was founded on March 12, 1885. It
was instituted on February 8, 1886 under the supervision of Principal Hiram Bradford
Farmer. Initially, the Normal School enrolled high school students with no other
secondary education facilities. Of the 18 buildings constructed while Matthews was
president, six are still currently in use. Arizona State University began to expand over
the years its academic curriculum by establishing several new colleges and beginning to
award Doctor of Philosophy and other doctoral degrees. Then grew through the creation
of the Polytechnic campus and extended education sites under the leadership of Dr. Lattie
F. Coor, from 1990 to June 2002. (Wikipedia, Arizona State University, 2013)

7
Figure 5: ASU Tempe Campus Development over the years (University, 1928)
Further, Michael Crow (Present President) initiated the idea of transforming ASU
into "One University in Many Places" by merging ASU's several campuses into a single
institution, sharing students, faculty, staff and accreditation. The Tempe campus is
located in downtown Tempe, Arizona, about eight miles (13 km) east of downtown
Phoenix. The campus is urban, and is approximately 642 acres (2.6 km2) in size. Along
with the research facilities, the university faculty was expanded, ASU at the Tempe
campus has embarked on a dramatic research infrastructure expansion to create more than
one million square feet of new research space, moving the university closer to its goal of

8
tripling research capacity during the next five years. In addition, ASU's Downtown
Phoenix campus was vastly expanded with several of the University's colleges and
schools relocated to the downtown campus. Since fiscal year 2002 ASU's research
expenditures have tripled and more than 1.5 million sq. ft. of new research space has been
added to the university's research facilities.
The economic downturn that began in 2008 took a particularly hard toll on
Arizona, resulting in large cuts to ASU's budget. From then on, ASU underwent several
rounds of reorganizations, combining of academic departments, consolidation of colleges
and schools, and reducing university staff and administrators. However, with an
economic recovery underway in 2011, ASU continued its campaign to expand the West
and Polytechnic Campuses, and establishing a set of low-cost, teaching-focused extension
campuses in Lake Havasu City and Payson, Arizona. (Wikipedia, Arizona State
University, 2013)

9
LIFE CYCLE ASSESSMENT
What is LCA?
Figure 6: Life Cycle Stages (Source: Fraunhofer Institute of Physics)
Although many definitions exist, LCA essentially comprises a systematic
evaluation of environmental impacts arising from the provision of a product or service.
The original International Organization for Standardization (ISO) ISO 14040 defines
LCA as:
“… a technique for assessing the environmental aspects and potential impacts
associated with a product, by
compiling an inventory of relevant inputs and outputs of a product system;
evaluating the potential environmental impacts associated with those
inputs and outputs;

10
Interpreting the results of the inventory analysis and impact assessment
phases in relation to the objectives of the study.
It is also known as the ‘Cradle to gate’ analysis which begins with the gathering of
raw materials from the earth to create a product and ends at the point when all materials
are returned to the earth. LCA evaluates all stages of a product’s life from the perspective
that they are interdependent, meaning that one operation leads to the next and enables the
estimation of the cumulative environmental impacts resulting from all stages in the
product life cycle, often including impacts not considered in more traditional analyses
(e.g., raw material extraction, material transportation, ultimate product disposal, etc.). By
including the impacts throughout the product life cycle, LCA provides a comprehensive
view of the environmental aspects of the product or process and a more accurate picture
of the true environmental trade-offs in product and process selection. ISO-compliant life
cycle assessment is the most reliable method to verify environmental impacts and support
claims providing designers, regulators and engineers with valuable information for
exploring decisions in each life stage of materials, buildings, services and infrastructure.
(Henrikke Baumann, 2004)
Who does LCA and Why?
Life Cycle Assessment (LCA) is the most reliable method of verifying the
environmental impacts. In the recent years, it has extended its roots into the building
construction sector. The environmental hot spots in products and materials are
highlighted in an LCA study and establishes the benchmark against which improvements
can be measured. Companies uses this method to demonstrate the transparency and

11
corporate credibility to stakeholders and customers, facilitating in new product research
and development, where environmental footprint is important to the future marketing or
cost structure of a product. (ATHENA, 2013)
The strength of LCA is that it studies the whole product system. This enables us to
avoid the sub-optimization that may be the result only if a few processes are focused on.
The results are related to the function of the product, which allows comparisons between
alternatives. It is an engineering tool in the sense that technical systems and potential
changes in them are studied. At the same time, it is a multi-disciplinary tool in the sense
that impacts on the natural environment and even people`s relations to such impacts are
modelled. The benefit of doing an LCA study is simple reliable, transparent data for both
manufacturers and consumers, enabling better decisions. (Henrikke Baumann, 2004)
Origin of LCA
1960’s - LCA has its roots in the 1960s, when scientists were apprehensive about
the rapid depletion of the fossil fuels and resulting climatological changes sparked
interest on industrial processes. They developed it as an approach of understanding the
impacts of energy consumption. A few years later, global-modeling studies predicted that
the effects of the world’s changing population on the demand for finite raw materials and
energy resource supplies. In 1969, the Midwest Research Institute (and later, Franklin
Associates) initiated a study of the Coca-Cola Company to determine which type of
beverage container had the lowest impact on the environment and made the fewest
demands for raw materials and energy.

12
1970’s - The U.S. Environmental Protection Agency (EPA) refined the above
methodology, creating an approach known as Resource and Environmental Profile
Analysis (REPA). Approximately 15 REPAs were performed between 1970 and 1975,
driven by the oil crisis of 1973. (Svoboda, 2005)
Early 1980’s- Environmental concern shifted to issues of hazardous waste
management which resulted in incorporating life cycle logic into the emerging method of
risk assessment, used with increasing frequency in the public policy community to
develop environmental protection standards.
1990’s- LCA was used for external purposes, such as marketing. Its application in
the present decade then broadened into building materials, construction, chemicals,
automobiles, and electronics. This was primarily because of the formalization of LCA
standards in the ISO 14000 series (1997 through 2002) and launch of the Life Cycle
Initiative, a combined effort by United Nations Environment Programme (UNEP) and the
Society of Environmental Toxicology and Chemistry (SETAC), in 2002.
2000 and beyond- In addition to the ISO 14040 standards, there have been some
developments specifically targeting the construction sector. In 2003, SETAC published a
state-of the-art report on Life-Cycle Assessment in Building and Construction, an
outcome of the Life Cycle Initiative. This study highlighted the differences between the
general approach of LCA and LCAs of buildings. Such standardization continued, with
two leading organizations the International Organization for Standardization (ISO) and
the European Committee for Standardization (CEN). The ISO Technical committee (TC)
59 ‘Building Construction’ and its subcommittee (SC) 17 ‘Sustainability in Building
construction’, described a framework for investigating sustainability of buildings,
13
implementation of the Environmental Product Declaration (EPD) and published four
standards. The CEN Technical Committee (TC) 350 ‘Sustainability of construction
works’ developed standards for assessing all of the three aspects of sustainability
(economical, ecological, social) for both new and existing construction works and also
for the environmental product declaration of construction products. (Svoboda, 2005)
Scope and Limitations of LCA study
It takes a lot of effort to do an LCA study, exploring large industrial systems,
collecting and analyzing a lot of environmental information. In practice, this can seem an
overwhelming task. As the whole life cycle is studied, it is not site specific. Thus,
environmental impact cannot be modelled at a very detailed level. An LCA study doesn’t
include economic, social aspects other than when used as a basis of weighting, and risk
management. The accuracy of an LCA study depends on the quality and the availability
of the relevant data, and if the data is not accurate enough, the accuracy of the study is
limited. These facts affect the precision of the final results. (Henrikke Baumann, 2004)
LCA in the building industry
Building construction and operation have extensive direct and indirect impacts on
the environment. Building owners, designers, contractors face a unique challenge to meet
the demands for new and renovated facilities that will be accessible, secure, healthy, and
productive while minimizing their impact on the environment. Elective green-building
scorecards and branding schemes such as Energy-Star and Leadership in Energy and

14
Environmental Design (LEED) are being followed by a large segment of the decision
makers procuring new buildings.
Life cycle assessment (LCA) is the latest addition to the life cycle toolbox for
buildings which looks at the upstream and downstream burdens throughout the entire
building life cycle with a focus on embodied environmental impacts. Embodied impacts
become more critical when operating consumption, such as energy and water, is reduced
through the optimization of design and building management. Retrofitting an existing
building can be more cost effective than building a new facility and designing major
renovations and retrofits for existing buildings to include sustainability initiatives reduces
operation costs and environmental impacts, and can increase building resiliency.
There are three basic options for bringing LCA into building design decisions: at
the product level, the assembly level, or the whole building level (Architects, 2010).
Material Level
Process-based LCA is defined at the material level. In the United States, the LCI
(Life cycle impacts) database managed by the National Renewable Energy Laboratory
(NREL) is the primary source for information about the environmental impact of
materials is. Participants in the US LCI Database Project are actively involved in
analyzing widely used building materials and formatting their analysis for inclusion in the
LCI database. Prior to the development of this database, LCA software for the United
States used LCA data from foreign data sources. The early versions of Building for
Environmental and Economic Sustainability (BEES) used US data for energy production
and European data for materials, along with proprietary material-supplier data for the

15
manufacturing life cycle. The current version of BEES uses these proprietary data, the
US LCI database, and supplemental analysis from Simapro with the Eco Invent database.
Both cement and concrete are building materials, but cement is a constituent of
concrete. Due to the extraction of precursor minerals from the earth and the energy
necessary to create the Portland cement clinker the environmental footprint of Portland
cement is significant. An LCA of a given concrete will depend on the percentage of
cement that is included in the concrete and whether fly-ash is used as a substitute for
cement. In addition, the location of cement production relative to the building site will
have a significant impact on the LCA outcomes. For example, in the BEES LCA tool, it
allows for the user to select a concrete with 100 percent Portland cement, and also other
concretes with fly-ash, limestone, and slag as substitutes for a portion of the cement. This
information is calculated by process chemists, chemical engineers, and associated
specialists and submitted for inclusion in various LCI databases. There is some direct use
of material-level LCI data by building professionals. But to calculate the positive impacts
of using fly-ash as a substitute for part of the Portland cement in concrete, this calculation
could be made easy by directly accessing the data from the LCI database.
Product Level
At the product level, an LCA is calculated as a collection of materials, which are
assembled into a final (or intermediate) product. A quantity takeoff of the product is
completed, and the emissions from each component of the products are summed. For
instance, the product LCA of a heat pump would include the production of the pre-cursor
materials—steel, copper, aluminum, plastics, refrigerants— and emissions from

16
galvanizing processes, painting, metal fabrication, welding, etc. Completion of the heat
pump LCA might be made easier if the LCA of a particular component, say an electric
motor, is already available. In order to complete a product LCA, thorough knowledge of
the source and quantities of materials and the manufacturing processes of the finished
product is required. General-purpose LCA software, such as Gabi, Boustead, or SimaPro,
is usually employed to complete a product LCA. A large quantity of product-level LCA
data is emerging that is useful to architects. This is helpful especially in the areas where
products can clearly be compared on a one-to-one basis or as per the LCA terminology,
wherein the functional unit for a product can be clearly described. Office furniture and
carpets manufacturers are adopting the LCA method widely and providing the results of
these LCAs to architects to demonstrate the “green-ness” of their products.
Building Level
Building LCA, or whole-building LCA, can be thought of as a product LCA
where the product is the building. The architect being LCA expert in this case,
understands how the building is constructed, how building materials and products flow to
the jobsite, and how the building is going to be operated over time.
Industry Level
At the building industry level, the best tool for completing an LCA would be the
Economic Input-Output (EIO) based LCA method. For example, to characterize the
environmental impact of the residential housing industry, surveys of homebuilders,
housing start data, income of wood-products suppliers, property tax rolls, and
17
construction employment data could be collected and analyzed each year to predict the
amount of green-field land, non-renewable materials, and energy are directed into
residential construction on a national or regional basis. In this way, an LCA of an entire
segment of the Architecture Engineer and Construction (AEC) industry could be created,
but with little of the specificity found in process-based LCAs. The EIO LCA method
quantifies the impacts of cement and steel production, suburban sprawl and urban
densification, and changes in land use, etc. But it is also clear that LCA at this industry-
wide scale is not actionable for a practicing architect. Instead, it is at a very small scale as
material, product, and building that the LCA becomes useful to the architect.
Standards in LCA
The leading standards for Life Cycle Assessment (LCA) are “International
Standard Organization” ISO 14040 and ISO 14044. These international standards focus
mainly on the process of performing an LCA. Requirements and guidelines are given for:
Defining the goal and scope of the LCA
Life cycle inventory analysis (LCI) phase
Life cycle impact assessment (LCIA) phase
Interpretation phase
Reporting and critical review of the LCA
There are many practical guidelines available on how to conduct an LCA study
such as the SETAC Code of Practice and guidelines for environmental LCA from the
Netherlands, the Nordic countries, Denmark and the US. These guidelines made
important contributions to the development of the standard as were written before the

18
standards were issued. The Dutch guidelines have been updated to an operational guide to
the ISO standards, with more detailed recommendations than the standards and mostly
includes data for impact assessment. But some of them explicitly support LCA for a
specific purpose. For example, the Danish EDIP method was designed for product
development purposes whereas the Nordic Guidelines are guidelines on how to perform
LCA`s with “key issues’’ identification. (Henrikke Baumann, 2004)
The Leadership in Energy and Environmental Design (LEED) rating system has
experimented with LCA in a past pilot credit. Currently, there are two LCA-based pilot
credits which are in place and two new MR LCA-based credits that are proposed for
LEED v.4. (United States Green Building Council, 2013).
LEED Pilot Credit 63: MR (Materials and Resources) -Whole Building
Life Cycle Assessment, earned by using LCA to show a reduction in environmental
impacts for a final design compared to a reference building.
MRc1: Building life-cycle impact reduction, a 3-point option for whole-
building LCA very similar to pilot credit 63 (LEED v.4).
LEED Pilot Credit 61: Material Disclosure and Assessment, earned by
including enough products with LCA-based information either an LCA report or an
environmental product declaration (EPD). This paperwork is got from product suppliers,
who will develop it after completing LCA studies for their products.
MRc2: Building product disclosure and optimization – environmental product
declarations, gives 2 points and is similar to pilot credit 61. For products with LCA-based
information: either an LCA report or an environmental product declaration (EPD), one

19
point is earned. Another point could be earned if enough products are certified by a
USGBC-approved program as having LCA performance better than industry average.
LCA and Green Globes™
Green Globes, the first national building rating system in North America to
integrate LCA as a credit. Green Globes awards points for educational experience of
using LCA and does not credit any particular performance level. In 2010, ANSI/GBI 01-
2010: Green Building Protocol for Commercial Buildings was officially approved; which
is derived from Green Globes and LCA is included in this standard as an alternative
compliance path to prescriptive material requirements.
LCA and ICC 700
The International Code Council (ICC) 700 National Green Building Standard, a
residential green standard was initiated by the National Association of Home Builders.
The current version of the standard gives points for reducing environmental footprint on
the basis of life cycle assessment.
LCA and the IGCC
The 2012 International Green Construction Code from the International Code
Council, belonging to section 303, offers whole-building LCA as an alternative
compliance path to the prescriptive material requirements in section 505. Final design
must show improvement over a reference building.

20
LCA and ASHRAE 189.1
The ANSI/ASHRAE/USGBC/IES Standard 189.1-2011, a whole-building LCA is
available as an alternative performance compliance path to prescriptive material
requirements. Final design must show improvement over a reference building.
Cal green
The 2010 California Green Building Standards Code offers LCA under non-
residential voluntary measures, at either the whole-building level or for building
assemblies. To avoid prescriptive material requirements, whole-building LCA can be
used (ATHENA, 2013).

21
BUILDING ENVELOPE
What is a Building Envelope?
The building envelope or wall is defined as an interface between the interior of
the building and the outdoor environment, including the walls, the roof, and the
foundation serving as a thermal barrier and plays a very vital role in determining the
amount of energy necessary to maintain a comfortable indoor environment in relation to
the outside environment. This fundamental need for shelter was a concept that is as old as
the recorded history of mankind. However, as our needs have changed and our
technologies advancing , the demand to both understand, and integrate, a wide range of
increasingly complex materials, components, and systems into the building enclosure has
grown in equal proportion and this task is placed on the designers. The envelope, or
"enclosure” or wall of a building or structure serves a variety of basic functions. It can
also be used to carry or distribute some services within the building. The enclosure will
also have several aesthetic attributes, which can be summarized as finishes. (Guide, n.d.)
Burnett and Straube have defined four general building enclosure function
categories. They are:
Support
Control
Finish (aesthetics)
Distribution of Services (where required)
Support
The envelope or the exterior wall must be capable of withstanding all internal and
external forces applied to them. The majority of these forces are structural loading. They

22
include both static and dynamic loading, but not limited to, dead load, live loads, wind
loads, earthquake loads and possible blast loads. These loads have to be properly
supported, resisted, and transferred.
Control
The envelope must be able to control mass, energy, and particulate flows both
within and across the system which include, but are not limited to, heat, air, moisture,
smoke, odor, fire, blast, birds, and insects.
Finish
The finish function includes both the exterior and interior aesthetics of the
finished surface, the visual, textural, and other aspects the designer wishes to convey with
the visible elements of the system.
Distribution
This function relates to the distribution of services through a building, both
within a single element, and also through multiple elements.
Energy Performance of Building Envelopes
Residential and commercial buildings account for nearly 39 percent of total U.S.
energy consumption and 38 percent of U.S. carbon dioxide (CO2) emissions. Parameters
like space heating, cooling, and ventilation account for the largest amount of end-use
energy consumption in both commercial and residential buildings. The commercial sector
are responsible for 34 percent for energy used on site and 31 percent of primary energy
use, whereas in the residential sector, space heating and cooling are responsible for 52
percent of energy used on site, and 39 percent of primary energy use. The exterior wall or

23
the envelope acts as a thermal barrier, and plays an important role in regulating interior
temperatures and helps determine the amount of energy required to maintain thermal
comfort. It minimizes the heat transfer through the building envelope which is crucial for
reducing the need for space heating and cooling. In the case of cold climates, the building
envelope can reduce the amount of energy required for heating; and in hot climates, the
building envelope can reduce the amount of energy required for cooling. (Center for
Climate and Energy Solutions, Working together for Environment andd the Economy,
n.d.)
A climate-responsive wall system or building envelope uses a combination of
shading, high performance windows, and the thoughtful placement of windows which in
turn enhances the comfort and energy performance of the building. Additional design
features such as selecting "cool" white roof materials and insulation options greatly
impact the energy demand and occupant comfort of the building. The ultimate
performance and comfort of the building will identify the interaction of the envelope
choices with other building systems.
There are some key elements of modern building envelopes like integration of
design and window strategies to bring daylight into a building's interior without heat and
glare. Other key elements are the ones that affect the thermal performance includes
shading elements, air tightness, wall and roof insulation and roof reflectance, etc.
Objective
A building envelope or an exterior wall in a building is very important as it forms the
technical and aesthetic aspect of the building. The energy associated with a building

24
envelope is something which can be easily measured and even addressed the most. As
there is growing environmental awareness of protecting the environment and saving on
the natural resources, architects, designers, industry and various businesses are curious to
find out how the building will perform over a period of time.
This study focuses on evaluating different envelope systems for a case study building
and analyzing what impacts did the envelope have on the environment. The reasons for
performing the study on an existing building was due to the issues related with the
building`s exterior wall system. The exterior wall system is made of Tilt up concrete
construction which creates some occupancy and thermal comfort problems. The aim was
to evaluate the life cycle performance of the existing wall system and also they are
compared with five other types of wall systems to find out which of the wall systems has
less impact on the environment. The results from this study will facilitate choosing the
right materials and systems for the construction of future buildings.

25
LITERATURE REVIEW
Generic Elements of LCA
For a standard LCA practice, there are some key elements required to be
considered. Some of them are - (Architects, 2010):
Functional unit
The basis for an LCA study is the calculation of environmental impacts for the
delivery of specific functions or utilities. In an LCA study, defining of an appropriate
functional unit is always a challenge primarily because there is a need to balance the
options that may have secondary functions. Conceptually, it is defined so that results
from the LCA can be used to promote a substitution of the options. For example, if
different materials were manufactured using different vehicle options, most people would
not consider this as a barrier to purchase. However, if the vehicle options differed in their
durability, efficiency, carrying capacity, speed, range, cost or style, the prospective for
product substitution would be limited and the uptake would require some sacrifice or
trade-off between different options and the environment. There are many instances in
which people are willing to those such trade-offs and where all options needed to be
resolved by the decision-maker have positive and negative features.
System boundary
If there is a system being analyzed, then there must be boundaries within which
that system could be analyzed. Generally, the system boundary is framed conceptually in
terms of the life cycle stages included in the study. For example, a study could include all

26
material inputs involved in the process but exclude capital equipment, infrastructure and
services. Alternatively, within the boundaries the system may be described literally
through a description of all the processes. However, as LCA can include thousands of
unit processes, this is often not meant to be practical. Boundaries could be as tight as the
limits of a single unit process, such as the burning of gas extracted from nature, or as
broad as the consumption of goods and services by whole populations.
Inputs and outputs
LCAs are constructed through the calculation of inputs and outputs required, or
arising as a consequence of, the delivery of the functional unit. The inputs and outputs
might be technical processes such as materials, services and processes, elementary flows
to and from the environment such as coal, minerals and land use, and/or inputs and
outputs to air, water and soil such as carbon dioxide, nitrogen and heavy metals. In
absence of these elementary flows in LCAs, there are otherwise no impacts. The number
and aggregation of the technical flows vary proportionally with the type of LCA and the
system being investigated.
Impact assessment
The analysis of impacts could not be possible if the type and number of indicators
used in LCAs vary, hence all the LCAs should have some indicators. Studies claim to
consider only a life cycle inventory and do not include impact assessment, however this
indicates that energy and greenhouse gases are the focus of the study, or only a very

27
narrow group of emissions or priority pollutants are taken into consideration (e.g. nitrous
oxides, sulphur oxides, hydrocarbons and carbon dioxide).
‘Bottom-up’ process analysis
Bottom-up process analysis refers to process-based modelling that begins at the
bottom of the supply chain and puts together the individual unit processes that comprises
a product’s system. In modern economies, the first stage includes extraction of minerals,
production of energy and the system transportation are required. The data that is collected
for each of these processes by measurement and modelling of each process at either local,
regional or national levels are unique to bottom-up process analysis, although the process
model will represent a single process or group of processes analogous to a factory or
operation. On the contrary, the unit processes in economic input-output analysis are
economic sectors. The unit processes in LCA are connected by virtue of energy and
material flows between them.
Therefore, electricity uses coal; timber milling uses electricity and; timber is used
to make buildings, etc. The circular nature of the economy is represented by the fact that
buildings are used in the extraction of coal. One characteristic feature of bottom-up
analysis is its emphasis on major materials and energy flows and the minor and service-
oriented inputs are excluded. Based on their mass energy or environmental significance,
small material flows may be omitted, as suggested in the ISO standards. For example,
where coal-mining operations requires timber framing, it may be excluded from coal
production as the impact of timber production and the mass of timber used could be less
than 1% of the mass of coal extracted. In this case, timber will be irrelevant in

28
environmental terms compared to energy inputs to coal mining and transport of coal. The
relevance of timber used in coal mining as an input to electricity will become even less
significant, if the LCA study is expanded so that electricity generation is considered more
generally. Process analysis is rich in this type of detail.
Types of LCA used in practice
Process LCA
In a process-based LCA, one specifies the inputs (materials and energy resources) and the
outputs (emissions and wastes to the environment) for each step needed to produce a
product. The LCA methods implemented in the building construction industry are
primarily based on process-based LCA. The different types of process-based LCA
methods are:
Cradle-to-Grave
Cradle-to-grave is the full Life Cycle Assessment from manufacture or “cradle” to
use phase and disposal phase, “grave.”
Cradle-to-Gate
This includes the assessment of a partial product life cycle from manufacture,
“cradle,” to the factory gate, i.e., before it is transported to the consumer. Cradle-to-gate
assessments are sometimes the basis for Environmental Product Declarations (EPDs).
When used for buildings, this would only include the manufacturing and, depending on
how the LCA was carried out, the construction stage. Building LCA tools based on

29
assemblies has a starting point for the assessment that might be a collection of cradle-to-
gate LCAs completed on major building systems, for example, curtain wall, roof systems,
load bearing frames, etc., which are then assembled into a complete cradle-to-grave
assessment of the entire building.
Cradle-to-Cradle
This is a specific kind of cradle-to-grave assessment where the end-of-life
disposal step for the product is a recycling process. New, Identical or different products
are originated from the recycling process. The term cradle-to-cradle often implies that the
product under analysis is substantially recycled, thus reducing the impact of using the
product in the first place, a work of William McDonough.
Gate-to-Gate
Gate-to-Gate is a partial LCA that examines only one value-added process in the
entire production chain, say evaluating the environmental impact due to the construction
stage of a building, for example. (Architects, 2010)
Streamlined LCA
Streamlined LCA incorporates a group of approaches designed to simplify and
reduce the time, cost and effort involved in conducting an LCA, while it still facilitates
accurate and effective decisions. LCA practitioners noted in a North American survey,
that a streamlined LCA:
is simplified, pragmatic, feasible, practical, flexible, fast and easy to use
represents the most important environmental burdens

30
focuses on key impact areas
limits consideration of effects to first-order impacts
leaves out some life cycle stages or impact categories
uses available information to simplify the process
is less comprehensive
is more ‘do-able’
Practitioners describe various approaches to streamline LCA, usually involving:
narrowing the boundaries of the study, to target specific issues and using readily available
data, including the qualitative data.
The principal question that need to be addressed before embarking upon any
streamlined LCA comprises of the appropriate level of trade-off of accuracy or depth in
results that is acceptable in exchange for the reduced effort in undertaking the evaluation.
Quick and dirty LCAs perpetually limit the time spent on data collection by using data
that are existing in public databases often already integrated into LCA software. This
includes the use of other regional data, proxy processes for data that is not available, and
the exclusion of transformation of materials, intermediate transport and so on. The other
approach is to reduce the impact indicators and thus reduce the scope of the study and the
resources required to undertake it. While reducing the indicators could reduce the data
collection, particularly the one on elementary flows, there are two additional tasks that
needs to be undertaken. Firstly, careful consideration is required to identify those
indicators of primary interest to study where indicators are to be reduced, so that the
shortened list of indicators covers the key contestable issues. While the goal and scope

31
can be used to exclude any indicators, the value of the study would be very limited if it
does not address basic questions posed by stakeholders. Secondly, the practitioner should
comment on and contextualize the results against indicators at the conclusion of the
streamlined study. (Architects, 2010)
Input–output and hybrid input–output
Input–output analysis is a top-down economic technique, which uses monetary
transactions between the economic sectors rather than physical flows to represent the
interrelationships between processes leading to the production of goods and services. In
this analysis, direct emissions and resource use arising from within each sector are
identified and accumulated as the necessary inputs from each sector. Then in any given
sector, these are then calculated to supply final demand. By resolving the infinite and
circular nature of the transactions between sectors, input–output analysis effectively
traces the supply chain comprehensively. For example, it considers the inputs from
transport to make electricity, and the inputs of electricity to make trucks, and the inputs
from trucks to make transport, and so on. The limitation of this analysis is the coarse
categorization of economic sectors.
In terms of all the different types of goods and services produced in the world,
USA’s equivalent input–output table includes about 500 sectors which still represents a
problem of gross aggregation. Two solutions to this problem would be to disaggregate the
input–output data where more resolution is needed, using more detailed economic data,
or to use hybrid techniques where physical flows from process analysis are combined
with the hybrid input–output data. (Architects, 2010)

32
Figure 7: Figure shows the hybrid LCA of ready mix concrete
Studies in LCA
Assessing the environmental impacts of construction and buildings involves more
than the simple aggregation of material assessments and individual product.
Simultaneously, there are several studies which have attempted to assess complete
buildings, building systems, and construction processes. These efforts have often
identified that life-cycle phases with the most environmental impacts, have provided a
basis for overall building system assessment. Some of these studies include:
(G Keoleian, 2000) evaluated the life-cycle energy use, greenhouse gas emissions,
and the costs of a standard residential home in Ann Arbor, Michigan, covering pre-use
(materials production and construction) phase, use (including maintenance and
improvement) phase, and demolition phases. They established that the use phase
accounted for 91% of the total life-cycle energy consumption over a 50-year home life.

33
They also came up with a model which was functionally equivalent energy efficient
house that incorporated 11 energy-efficiency strategies and found that these strategies led
to a dramatic reduction in the total life-cycle energy use.
(S Citherlet, 2007) presented a process-based lifecycle assessment of three home
designs in Switzerland. In this study, they classified life-cycle environmental impacts into
direct and indirect categories; where the direct impacts included all use-related energy
consumption impacts; and the indirect impacts included other upstream and downstream
impacts from material extraction, production, construction, demolition, etc. The results of
the study inferred that direct environmental impacts can be significantly reduced by better
insulation and by the use of renewable energy sources.
(Hovarath, 2003) studied the environmental impacts of a concrete-framed office
building located in Finland. The authors mentioned that, while previous environmental
studies related to buildings have focused either on limited environmental indicators, or on
a limited set of life-cycle phases, their study attempted to comprehensively evaluate life-
cycle environmental impacts in relation to climate change, acidification, eutrophication,
and dispersal of harmful substances. It was also found that electricity and heat use during
building operation (use phase) and building material production caused the most
significant environmental impact, consistent with the other previous studies. The study
also suggested that U.S. buildings might have even higher use-phase impacts because of
higher tenant turnover rates and more fossil fuel-based energy generation, and it was
recommended to examine case studies from the perspective of various decision makers.

34
(Gheewala, 2008) conducted an LCA for an office building in Thailand and found
that steel and concrete accounted for greatest of the material-related environmental
impacts, where the use-phase energy consumption accounted for 52% of total life-cycle
impacts.
While the above discussed studies analyzed whole buildings, some studies have
focused only on the building subsystems. (Ries, 2004) used a process-based LCA
framework to evaluate the environmental impacts of construction and operations of a
cogeneration facility to meet the energy requirements of a commercial building. They
performed energy simulations to determine the building’s energy needs throughout the
year. Later the results of the study found that certain cogeneration facilities might have
been environmentally preferable over conventional energy production facilities.
(Hutzler, 2005) conducted parallel LCAs and LCCAs to determine the
environmental and economic efficiency of various water supply systems for
multioccupant buildings from the energy and resource use perspective over a period of
25-year life cycle. They applied the Building for Environmental and Economic
Sustainability (BEES) software to measure the environmental impacts and off-the-shelf
cost databases for economic analysis. It was found that the use of efficient plumbing
fixtures and natural gas for water heating was economically and environmentally
preferable.
(Glick, 2007) analyzed two heating system solutions a gas forced-air system
(GFA) and a solar radiant system (SRS) for a home in Colorado. The analysis included
both environmental LCA and LCCA. The study considered the environmental

35
performance indicators as energy use and global warming potential (GWP) and assessed
these for manufacturing, construction, use and maintenance, and disposal phases. Life-
cycle cost analysis was also performed for the manufacturing and use and maintenance
phases. The results of the study suggested that the gas forced-air system is both
environmentally and economically preferable to solar radiant system, but a hybrid
solution incorporating a gas-fired boiler in the solar radiant system is an overall optimal
choice.
LCA Methodology
The LCA methodology is divided into 4 different stages. They are-
o Goal and Scope definition
o Inventory Analysis
o Impact assessment
o Interpretation of Results.
Goal and Scope Definition
This section defines on which product the LCA study is carried on and also the
purpose of carrying out the LCA study on that product. According to International
Standard Organization (ISO 14040 1997) the goal definition incudes stating the intended
application of the study, the reason for carrying it out and to whom the results are
intended to be communicated. When an LCA study is originated, the purpose of the
study is often expressed very vaguely and generally. A problem formulation is specified
more clearly before the LCA study is performed.

36
The functions of Goal and scope is that the context of the study is defined – whom
does the study cater to and how are the results to be communicated. There are also some
choices made during this phase. During this phase, the choices of what to study are made
and governed by the system boundaries of the flow model constructed in subsequent
inventory analysis. The types of environmental impacts are considered. There are more or
less default list of impacts which are always considered in most of the LCA`s. For
example resource use, global warming, acidification and eutrophication, but sometimes
LCA`s are limited to covering only certain impacts. The chosen impacts determine the
parameters for which data will be collected during the inventory analysis. The next step
would be the level of detail in the study and thus the requirements on the data- whether to
use the site specific data or the data describes an average over a number of production
sites.
Inventory analysis
This phase in LCA methodology means to build a systems model according to the
requirements of the goal and scope definition, which is a flow model of a technical
system with certain types of system boundaries. The result got is an incomplete mass and
energy balance for the system, in the sense that only the environmentally relevant flows
are considered, which more or less includes the use of scarce resources and emissions of
substances considered harmful. Environmentally indifferent flows such as water vapor
emissions from combustion and industrial surplus heat are disregarded. The activities
involved in Life cycle inventory analysis are-

37
1. Construction of flow model according to the system boundary decided on
in the goal and scope definition. The flow model is usually represented as a flowchart that
shows the activities included in the analyzed system (production, processes, transports
and waste management) and the flows between these activities.
2. Data collection for all activities (processes and transports) in the product
system. The collected data include inputs and outputs of all activities such as
Raw materials, including energy carriers
Products and
Solid waste and emissions to air and water.
3. Calculation of the amount of resource use and pollutant emission of the
system in relation to the functional unit. (Henrikke Baumann, 2004)
Inventory results are often explained as bar charts and other types of graphic
representation. The inventory analysis seems very straightforward but usually it is a
complicated process by the fact that many technical processes produce more than one
product. The environmental load of such processes might be allocated, i.e. portioned
between its different products. Allocation complicates life cycle inventories considerably.
Life Cycle Impact Categories
LCA methodologies have Life Cycle Impact categories that vary from system to
system. These categories are mappings from quantities of emissions to the environmental
impacts that these emissions cause. They can be thought of as a class of environmental
issues of concern to which Life Cycle Inventory (LCI) results may be assigned. They
have also been established from nationally recognized standards established by the

38
agencies such as the Environmental Protection Agency, Occupational Safety and Health
Administration, and National Institutes of Health. The impact is usually specified as a
ratio of the quantity of the impact per functional unit of the product produced. Each
category is an indicator of the contribution of a product to a specific environmental
problem. A set of impact categories common to many LCA methods are explained
below-
Global Warming Potential (GWP)
Global Warming Potential has been developed to characterize the change in the
greenhouse effect due to emissions and absorptions attributable to humans. The unit for
measurement is grams equivalent of CO2 per functional unit of product (note that other
greenhouse gases, such as methane, are included in this category, thus the term “CO2
equivalent” is an impact and not an emission).
Acidification Potential (AP)
Acidifying compounds emitted in a gaseous state either dissolve in atmospheric
water or fixed on solid particles which reach the ecosystems through dissolution in rain.
The two compounds principally involved in acidification are sulfur and nitrogen
compounds. The unit of measurement is grams of hydrogen ions per functional unit of
product.
Eutrophication Potential (EP)
Eutrophication Potential is the addition of mineral nutrients to the soil or water. In
both media, the addition of large quantities of mineral nutrients such as nitrogen and

39
phosphorous results in generally undesirable shifts in the number of species in
ecosystems and a reduction in ecological diversity. Excess nutrient in water leads to
increased biological oxygen demand (BOD) from the dramatic increase in flora that feed
on these nutrients, a subsequent reduction in dissolved oxygen levels, and the collapse of
fish and other aquatic species. The unit of measurement is grams of nitrogen per
functional unit of product.
Fossil Fuel Depletion (FFD)
This impact addresses only the depletion aspect of fossil fuel extraction, not the
fact that the extraction itself may generate impacts. The unit for measurement is mega
joules (MJ) of fossil-based energy per functional unit of the product. This category helps
to demonstrate positive environmental goals, such as reducing the energy needed to
produce a product, or producing a product with renewable, non-fossil-based energy.
Smog Formation Potential (SFP)
Under certain climatic conditions, air emissions from industry and fossil-fueled
transportation could be trapped at ground level, where they react with sunlight to produce
photochemical smog. The contribution of a product or system to smog formation is
quantified by this category. The unit of measurement is grams of nitrogen oxide per
functional unit of product. This highlights an area where a regional approach to LCA may
be appropriate, as certain regions of the world are climatically more susceptible to smog.
40
Ozone Depletion Potential (ODP)
Emissions from some processes may result in the thinning of the ozone layer,
which protects the earth from certain parts of the solar radiation spectrum. Ozone
depletion potential measures the extent of this impact for a product or system. The unit of
measurement is CFC-11 per functional unit of the product.
Ecological Toxicity (ET)
The ecological toxicity impact measures the potential of a chemical released into
the environment to harm terrestrial and aquatic ecosystems. The unit of measurement is
grams of 2, 4-dichlorophenoxy-acetic acid per functional unit of product.
Water Use (WU)
Water resource depletion has not been routinely assessed in the recent LCAs, but
researchers are beginning to address this issue to account for areas where water is scarce,
such as the western United States. The unit of measurement is liters per functional unit.
It should be noted that the impact categories described above is in accordance
with TRACI LCIA method used in the Building for Environmental and Economic
Stability (BEES®) tool. Other impact categories included but not described here are
Habitat Alteration, Criteria Air Pollutants and Human Health, etc.
Life Cycle Impact assessment
Life Cycle Impact Assessment aims to describe, indicate, the impacts of the
environmental loads quantified in the inventory analysis. Thus one purpose of the LCIA

41
is to turn the inventory results into more environmentally relevant information, which
means the information on impacts on the environment rather than just information on
emissions and resource use.
The first step is classification- which means that sorting the inventory parameters
according to the type of environmental impact they contribute to. The next step would be
Characterization- calculations of the relative contributions of the emissions and resource
consumptions to each type of environmental impact. For example, all emissions of
greenhouse gases may be aggregated into one indicator for acidification. Such
calculations are based on scientific models of cause-effect chains in the natural systems.
However, these cause-effect models used in LCIA are sometimes simplified. Instead of
uncertainties and other limitations of characterization, the numerous result parameters of
an LCA may be aggregated into a limited number of impact categories. This could be
done in several ways- both formalized and quantitative weighing procedures or through
expert panels or with qualitative, verbal argumentation. This cannot be done one based
solely on natural science but values must be introduced. Such a weighting method is
described as a ‘yardstick’ with which all environmental problems are measured and they
are based on values and preferences concerning environmental goals that may be used to
create a weighting system.
Life Cycle Impact Assessment is thus a stepwise aggregation of the information
given by the inventory results. Classification and Characterization are compulsory in
LCA according to the standard (ISO 14042 2000) whereas weighting could be optional. If
no impact assessment is performed, but only an inventory analysis is done, the study is
referred to as Life Cycle Inventory analysis (LCIA).

42
Several methods are used to convert the LCI analysis results (quantities of
materials and energy used and resulting emissions) into environmental impacts. Some of
the commonly used methods are Eco-indicator 99, EDIP 1997 and IMPACT 2002+. The
Tool for the Reduction and Assessment of Chemical and other environmental Impacts
(TRACI) is an impact assessment tool developed by Environmental Protection Agency
(EPA), and it allows the examination of the potential for impacts associated with the raw
material usage and chemical releases resulting from the processes involved in producing
a product, examine the potential for impacts for a single life cycle stage or the whole life
cycle and to compare the results between products or processes (Architects, 2010).
Interpretation of Results
Enhancement of raw results into useful, presentable and final results requires a
process that may involve screening of the raw results, identification of critical data and
assessments of the importance of missing data. The process of assessing the results in
order to draw conclusions in LCA methodology is called interpretation. The term Life
Cycle Interpretation is defined in the ISO 14040 standard as the…..
“…. Phase of life cycle assessment in which the findings of the inventory analysis or the
impact assessment, or both, are combined consistent with the defined goal and scope in
order to reach conclusions and recommendations.” (ISO 14040 1997).
Evaluations of the robustness of conclusions drawn in an LCA study are also part
of the interpretation phase which typically entail sensitivity analysis, uncertainty analysis,
and data quality assessments. LCA studies often produce surprising, unexpected results,
and therefore beyond the intended goal and scope. These unexpected results usually offer

43
great potential for learning, and the ability to make use of surprising results is an
important element in LCA application. Since LCA is an iterative process, the existence of
unexpected results poses a problem, it is always possible to reformulate the goal and
scope.
Materials used in Building Envelope
Building Envelope/Wall system/ Façade makes an overall contribution to the
technical and aesthetic aspect of a building. The most commonly used building materials
for the façade is Concrete, Stone, Glass, Wood and Metal. The following paragraph will
explain some of the façade construction technologies. As mentioned above, the study
involves description of six different wall systems. They are -
1. Tilt Up Concrete Construction
2. Cast-in-place Concrete Construction
3. Concrete Blocks
4. Steel Stud Construction
5. Curtain Wall Envelope System
6. Insulated Concrete Form Construction

44
Tilt Up Concrete Wall Construction
Figure 8: Schindler-Chase house (Rudolf Schindler) is an early example of Tilt-Up concreteconstruction
Tilt-Up concrete construction is not new; it has been in use since the turn of the
century. Over 15% of all industrial buildings are Tilt-Up, ranging in size from 5,000 to
over 1.5 million square feet nationwide. They are characterized by their attractiveness,
efficiency and longevity. It is one of the rapidly growing industries in the United States
with at least 10,000 buildings enclosing more than 650 million square feet are constructed
annually. Tilt-up, tilt-slab or tilt-wall is a type of building and a construction technique
using concrete which is a cost-effective technique with a shorter completion time, poor
performance in earthquakes has mandated significant seismic retrofit requirements in
older buildings (Wikipedia, Tilt up , 2013). These concrete elements are formed
horizontally on a concrete slab, usually the building floor or sometimes a temporary
concrete casting surface near the building footprint. Once the concrete has been cured,
the concrete elements are “tilted” to vertical position with a crane and braced into the
position until the other building components are secured.

45
Figure 9: A Tilt-Up concrete construction at site. (Source: Wikipedia)
Construction of this envelope system requires significant organization and
collaboration on the building site. Site Evaluation, engineering, forming tilt-up panels,
steel placement, embeds and inserts, concrete placement, panel erection and panel
finishing. Once the casting surface has been cured, forms are built on top. A high quality
plywood or fiber board that has at least one smooth face is typically used, although
aluminum and steel forms are used. Door, window openings, and other architectural
features of any desired shape can be molded into the concrete. Studs, gussets and
attachment plates are located within the form for embedding in the concrete. A rebar grid
is constructed inside the forms, its size and spacing is generally specified by the engineer.
A chemically reactive bond-breaker is sprayed on the form’s surfaces to prevent the cast
concrete from bonding with the slab. This allows the cast element to separate from the
casting surface once it has cured. Improper chemical selection or application will prevent
the lifting of the panels, and will entail costly demolition and rework. Concrete is poured
with desired thickness and surrounded by steel inserts, embedded features and rebar.
Later, these forms are cured, rigging is attached and a crane tilts the panel or lifts the

46
element into place. Cranes are used to tilt the concrete elements from the casting slab to a
vertical position. Tilt up walls are very heavy, as much as 300,000 pounds (140 t) or
more, engineered to work with the roof structure and/or floor structures to resist all forces
that is to function as load-bearing walls.
Table 1: Table shows the Inventory Data for Tilt-Up concrete Wall construction (Source:Simapro)
These wall panels are either solid concrete, or they may be sandwich-type
construction. Insulation could be incorporated into tilt-up to provide energy efficient
construction with hard exterior wall surfaces. Walls can range from R-values of about 2
for uninsulated panels up to about 32 for walls containing thicker layers of insulation. As
building codes require greater energy efficiency, the thickness of insulation increases.
Energy performance is an important part of tilt-up’s environmental friendliness that apply to any
type of concrete, which offers high thermal mass, and airtight construction. The
panelization also means fewer joints and reduced air infiltration. There is potential for
recycled content in tilt-up concrete. The wall panels can be demolished and the concrete
recycled at the end of its life as it is locally produced. It is durable and low maintenance.
(Portland Cement Association, 2013)

47
Cast in Place Concrete Wall Construction
Figure 10: Framework for Precast concrete wall (Source: Baruzzini Construction)
Cast-in-Place (CIP) concrete walls are all made with ready mix concrete placed
into different wall forms erected on the site. This type of technology was invented by
Thomas Edison, generally defined by the buildings structural systems, which has the
vertical (gravity) load resistant systems and the lateral (wind and seismic) resistant
system. The vertical load resistant systems includes the floor and wall system, whereas
the lateral resistant system includes shear walls, braced frames or a combination of all
these systems. In the United States, any concrete structure built follows the provisions of
the ACI Building Code. The codes not only provides safety requirements but also
prescribes serviceability and durability requirements.
The construction of a cast-in-place wall is relatively simple which includes
placement of temporary forms and then later placing the reinforcement bars and pouring

48
the ready mix concrete on site. Builders usually place formwork starting from the corner
and then fill in between the corners. The reinforcement bars are then erected. With the
help of truck chute, bucket or pump concrete is poured into the forms, which are filled at
an appropriate rate based on formwork manufacturer recommendations. Door and
window openings are made with fasteners around them. The thickness of these walls
range from anywhere between 4 to 24 inches. Uninsulated walls are typically 6 to 8
inches thick and walls with insulation are generally thicker when they contain an internal
layer of insulation, either the inner or outer wall layer will serve a structural purpose.
(Guide, n.d.).
Table 2: Table shows the Inventory Data for Cast in Place concrete Construction (Source:Simapro)
Energy performance of these wall types are good as they consume less energy to
heat or cool the space than walls with wood or steel frames. A wall type with thermal
mass has the capacity to store warmth and cold which in turn moderates internal
temperature fluctuations, slowly transfer the heat through the building and also reduced
the loads on the HVAC systems. But energy savings due to thermal performance
completely depends on the climate. CIP walls have 10 to 30% better air tightness
compared to framed walls as the concrete envelope contains few joints. They also provide

49
consistent interior temperatures for occupants, and increases their comfort. These wall
types are also suited to the use of recycled materials- concrete could be made by the use
of materials like fly ash or slag to replace the portion of cement.; aggregates could be
recycled to reduce the need of virgin aggregate and the steel used for reinforcement can
be recycled. (Guide, n.d.)
Concrete Blocks
As the word says, “Concrete Blocks” (CB) are made of concrete. They are large
rectangular bricks used in construction, made from cement and aggregate, usually made
of sand and fine gravel especially for high sensitivity blocks. The first hollow concrete
block was designed in 1890 by Harmon S Palmer in the United States, after 10 years of
experimenting and then later he patented the design in 1900. The blocks he designed
were of the dimensions 8 inches (20.3 cm) by 10 inches (25.4 cm) by 30 inches (76.2 cm)
and were so heavy that a small crane was needed to lift them. (Portland Cement
Association, 2013).
Figure 11: Hollow Concrete Blocks (Source: Building Materials BlogSpot)
The concrete normally used to make concrete blocks is a mixture of
powdered Portland cement, water, sand and gravel. This kind of mixture produces a light

50
gray block with a fine surface texture with a high compressive strength. A typical
concrete block weighs between 38 -43lb (17.2 – 19.5kg). The mixture comprises of
higher percentage of sand and a lower percentage of gravel and water than the concrete
mixtures used for general purposes which produces a very dry, stiff mixture that holds its
shape when it is removed from the block mold. There are light weight concrete blocks
that made by replacing sand and gravel with expanded clay, shale or slate, produced by
crushing the raw materials and heating them to about 2000 F (1093 C). (Cavette, 2007)
The shape and sizes of most of the concrete blocks have been standardized to
ensure uniform building construction with sizes – 8 X 8 X 16 inches (20.3 X 20.3 X 40.6
cm). This measurement includes room for bead of mortar, and the block itself actually
measures 7.63 X 7.63 X 15.63 inches (19.4 X 19.4 X 38.8 cm). The manufacture of these
blocks requires constant monitoring to produce blocks with the required properties.
(Portland Cement Association, 2013). The raw materials are then weighed electronically
before they are placed in the mixer. Ultrasonic sensors are used to measure the trapped
water content in the sand and gravel, and the amount of water to be added is
automatically compensated. The water may pass through a chiller or heater before it is
used where the climate is extreme. When the blocks come out of the machine, their
heights are checked with the help of laser beam sensors. The temperatures, pressures, and
cycle times are all controlled and recorded automatically to ensure that the blocks are
cured properly in the curing kiln.
As these wall systems are exposed to sun and exterior temperatures, they can be
heated or cooled, absorb the heat and will radiate the heat to the surrounding components
of the wall system. Their thermal performance is purely based on the insulation capacity

51
in the wall cavity or within the backup wall. Even light weight concrete blocks provide
considerate amount of thermal mass compared to wall systems such wood frame or steel
stud. Light weight blocks stores less heat, compared to heavy weight blocks of the same
thickness, at the same time release the heat more slowly, which improves the overall
thermal performance. In the southern regions of the United States, concrete blocks have
been most popular where buildings are subjected to significantly warm and humid
climates. It provides a strong and durable structure, withstanding both routine natural
wear as well as extraordinary impacts of natural and human disasters.
Table 3: Table shows the Inventory Data for Concrete Block Construction (Source: Simapro)
These blocks are often manufactured with recycled content. Fly ash, slag cement,
or silica fume can substitute for cement, whereas recycled aggregates can replace newly
mined gravel. There are even mortar less units available which are “dry-stacked” and are
generally held together by a coat of bonding plaster inside and out. Portland cement
plaster, or stucco is made from the same material and is sometime considered to be a
masonry product.

52
Curtain Wall System
It can be defined as a thin, any non-load bearing that hangs like a curtain
regardless of construction or cladding material, usually made of aluminum frame
containing glazing patterns, metal panels or thin stone. The framing which is attached to
the building structure does not carry the floor or roof loads of the building. As far as the
wind and gravity loads are concerned, they are transferred to the building structure
typically to the floor line. These wall systems dates back to the 1930’s when aluminum
became available for non-military use. Curtain wall systems are either to manufacturer’s
standards or even specialized. (Nik Vigener, PE and Mark A. Brown, 2012)
Figure 12: Metal Facade Panel Location: Bratislava Slovakia (Slovak Republic) (Source:Hunter Douglas Facade systems)
Curtain walls can be classified on basis of their fabrication and installation.
(Window and Wall systems, n.d.) They are:
Storefront- non-load bearing glazed systems that occur on the ground floor, which
includes commercial aluminum entrances, installed between floor slabs and the roof

53
above. The performance requirements for storefront are usually less-stringent, and
materials may require frequent maintenance.
Stick wall- These systems are shipped in pieces for field-fabrication, furnished by the
manufacturer as “stock lengths: to be cut machines, assembled and sealed in the field.
When the frames are assembled, either “shear blocks” are used to connect the vertical and
horizontal framing elements, or “screw-spline” construction, and assembly fasteners feed
through holes in interlocking vertical stacking mullions into extruded races in horizontals.
I-Beam walls- In this type of Wall system, “I” or “H” shaped structural, vertical back
members are set into window openings in the field, with horizontal members and later
clipped to verticals. The extruded aluminum`s interior trim is cut and snapped into place
at vision areas, once glazing is done. The unexposed spandrel area is left and doesn’t
require any finish.
Pressure Walls- When the extruded aluminum plates are screw-applied to compress
glass between interior and exterior bedding gaskets, they are called “pressure walls”. To
conceal the pressure plate fasteners, a Snap-On cover or “beauty cap” is used. Field
assembles or field-glazed curtain wall performs only as good as field workmanship
allows, limited by variables such as weather, access, and job site dirt and dust. Seals are
necessary for these systems which are designed to drain or “weep” rain penetration from
the system back to the exterior.
Unitized Walls- These are “factory-assembled and glazed” units which are shipped to the
job site. These kind of wall systems are installed in sequential manner around each floor
level, moving from the bottom to the top of the building. Sealing fixtures are very limited
in Unitized walls, having a translucent silicone sheet or patch, which are field-sealed.

54
One anchor per mullion is attached to the face of the floor slab. Due to its unique
configuration, the horizontal gutter weather-seal is sometimes called “chicken head”.
Interlocking unitized curtain wall frame members are weather-stripped to seal to one
another both horizontally and vertically. This takes care of the thermal expansion and
contraction, inter-story differential movement, and/or seismic movement.
Window Wall- These systems span from the top of one floor slab to the underside of the
slab above. It employs large, side-stacking window units, contained in head and sill
receptors known as “starters” which facilitates movement and drainage, with field-
applied perimeter sealants. Window wall systems are easily acceptable operable
windows, and can be installed non-sequentially.
Table 4: Table shows the Inventory Data for Curtain Wall Construction (Source: Simapro)
The performance of these systems depends on the type of material used. For
example, aluminum is a good conductor of heat so it will have a high heat transfer co-
efficient. This shows that there is high heat loss through aluminum curtain wall mullions.
To compensate these heat losses- are thermal breaks, barriers between the exterior metal
55
and interior metal, usually made of polyvinyl chloride (PVC). Also, thermal
conductivity, use of low-e and spectrally selective glass coatings, can significantly play a
role in reducing the HVAC loads in the building. Good design practices ensures
durability of the curtain wall systems and they must also be designed for accessibility for
maintenance. For low-rise buildings, it is accessed from the ground using equipment with
articulated arms, whereas for high-rise buildings, swing stage access for window
cleaning, general maintenance and repair work, like glass replacement. Thus, it is always
better to use systems that have a good thermal break and high R-value.
Aluminum and Steel systems are typically recycled during their end of life
phase. But recycling would become difficult if aluminum is contaminated with sealants,
fractured glazing, etc.
Insulated Concrete Forms
Insulated concrete forms are system of formwork for reinforced concrete that
stays in a place as a permanent interior and exterior substrate for walls, floors and roofs.
These forms are interlocking modular units which are dry-stacked and filled with
concrete in between. They form structural walls and floors of building by locking
together and commonly called as “Lego” bricks. For both low-rise commercial and high
performance residence construction, ICF construction has become common, due to the
adoption of more stringent energy efficiency and natural disaster resistant building codes.
(Portland Cement Association, 2013) This technique was first developed in Europe
following the Second World War as an inexpensive and durable way to rebuild damage

56
structures. In the 1960s the first polystyrene ICF forms were developed, after which these
forms have steadily increased.
Figure 13: Insulated Concrete Forms (Source: NUDURA Integrated buildingTechnology)
Insulated concrete forms are manufactured from either Polystyrene foam,
polyurethane foam, cement-bonded wood fiber, cement-bonded polystyrene beads, or
cellular concrete. There are ties that interconnect the two layers of insulated forming
material made of either plastic, metal or additional projections of the insulation. Latest
trends include hinges into the ties that allows preassembled forms to fold flat or easy,
contributing to cost-effective shipping. The method of construction of these forms are
pretty simple. First concrete is pumped into the cavity to form the structural elements of
the walls. The reinforced steel is added before the concrete is poured for flexural strength.
After the concrete has been cured, the forms are left in place permanently, to provide a
variety of benefits like thermal performance, acoustic insulation, improved indoor air
quality according to the materials used.

57
Figure 14: Different Types of ICF systems
ICF systems vary in their design. “Flat” systems yield a continuous thickness of
concrete like a conventionally poured wall. “Grid” systems have a waffle pattern where
the concrete is thicker at some points than others. “Post and Beam” systems have
discrete horizontal beams and columns that are completely condensed in foam insulation.
All major ICF wall systems are engineered- designed, code driven and field-proven.
Table 5: Table showing the inventory data of Insulated Concrete Form Wall Construction

58
ICF are structural wall members that is up to 10 times stronger than wood framed
structures. Materials used in making these wall systems like the polystyrene foam or
even the poured concrete don’t rot when they get wet. Block sizes are typically in the
order of 16 inches high by 48 inches long. The cavities in between these blocks are
anywhere between 6 inches to 8 inches depending on what is needed. The thickness of
the foam faces also varies between 1-7/8 in to 2-3/4 in. After all finishes are applied, the
final wall thickness is greater than 1ft. This results in deeper window sills as the depth of
window and door surrounds have to wider than the usual frame wall construction.
(Portland Cement Association, 2013)
Greater insulation, tighter construction and temperature-moderating mass of the
walls conserve heating and cooling energy much better than conventional wood-frame
walls. This reflects the monthly fuel bills. Building ICF walls, saves a lot of trees being
destroyed. The concrete used for the construction could be made of out of materials like
fly-ash, or slag replacing the cement. Virgin aggregate material can be reduced and
replace by crushed concrete. Steel and polystyrene are also recycled.
Steel Stud wall Construction
Steel stud wall systems are used in both residential and commercial
construction. A wall stud is defined as a vertical member in the light- frame construction
techniques called balloon framing and platforms framing of a buildings wall. Their
construction consists of Extruded polystyrene insulation with the joints sealed combined
with batt insulation providing a thermal moisture and air barrier wall system. The energy

59
code requirements complies with providing continuous insulation thereby reducing the
effect of thermal bridging.
Figure 15: Steel Stud Wall of an Industrial Building (Source: Dreamstime)
Typical components of these systems are C-studs with knockouts and U-shaped tracks.
The high strength-to-weight ratio of light gauge steel maximizes building design
flexibility, while providing rigid structural integrity. Metal Studs comes in changing
lengths ranging from 8 ft. to 24 ft. with tracks having lengths of 10 ft. (Clark Dietrich
Building Systems, 2009)

60
Figure 16: C-Studs
C-Studs
C-studs are also used for in-fill, bypass (balloon), and spandrel framing and are
available in a wide range of sizes, flanges, gauges, and yield strengths. Structural steel C-
studs are available with web sizes ranging from 2-1/2" to 14". Web depths greater than
14" are typically not available. The flange of the C-stud provides a bearing surface for
cladding materials and is a key contributor to the load-bearing capacity of the member.
Flanges are available in sizes from 1-3/8" to 3".
Figure 17: Knockouts and Tracks

61
Knockouts
C-studs are pre-punched with knockouts at regular intervals to allow rapid
installation of electrical conduit, mechanical, and piping. Bridging products are also
connected through these knockouts for stud depths 6" or less. Standard knockouts sizes
are 1-1/2" x 4" and are punched 12" (East and Central) and 24" (West) from the leading
edge and every 24" after that.
Tracks
Tracks are U-shaped steel framing components normally used as top and
bottom runners to secure wall studs or as head and sill plates at openings. Tracks can also
be used to provide end support closures for joists at exterior/ foundation walls or for solid
blocking. Standard leg lengths are 1-1/4", however other leg lengths (e.g. 2", 3") are
available.
There are three general types of light gauge steel load-bearing wall headers
that are commonly used, including:
Box Beam Headers
Back-to-Back Headers
U-Shaped Headers
The first two types of headers are made using C-studs, while the last type is made from
preformed U-shaped members.

62
Table 6: Table showing Inventory Data for Steel Stud Wall Construction (Source: Simapro)
Thermal performance of exterior steel stud framed walls has always lagged
behind that of wood. The critical difference often overshadows steel’s many benefits such
as its dimensional consistency, high recycled content, high recyclability, strength, and
mold, rot and termite resistance. (Dixon, 2013)
Life Cycle Assessment Tools
LCA tool is defined as an environmental modeling software that develops,
presents life cycle inventory (LCI) and life cycle impact assessment (LCIA) results
through a laborious analytical process that adheres closely to relevant ISO standards and
other accepted LCA guidelines (Life Cycle Assessment, 2001). The most basic tool takes
inputs in the form of material take-offs and converts it into mass. Then this mass value is
attached to the LCI data available from an LCI database and other sources. This step
gives the quantities of inputs and outputs of a product system. The use of resources and
releases to air, water, and land associated with the system may be included in the inputs-
outputs. LCA tools are classified based on Building Products, Building Assemblies,

63
Whole-Building LCA and user skills- linking user defined or pre-defined unit processes,
based on Life Cycle Phases included, and based on region.
Some of the tools which are used for LCA analysis are – Building energy and
Environmental Sustainability (BEES), ATHENA impact estimator for buildings,
Simapro, GaBi, ATHENA eco-calculator, and some international tools which include
Eco-Quantum, Envest, Pharos Framework, Green Foot step, etc. Table showing different
types of LCA tools are attached with the Appendix at the end of the report.

64
RESEARCH METHODOLOGY
Description of the Case Study
The building selected for the case study is a large scale office building
located very close to the ASU campus. The ‘University Services Building’, located on
South Rural Road in Tempe, houses various departments like Facilities Development
and Management (FDM) responsible for University facilities, infrastructure and grounds,
and manages planning, design, construction, renovation, maintenance and repair at each
Arizona State University campus. Departments within FDM include the Office of the
University Architect, Capital Programs Management Group, Facilities Management,
Administrative Services and Business Operations. The total area of the building was
148,101 sq. ft. spread into two floors. The office space has open-office space planning for
a total number of 200 employees. This type of planning makes it easy to re-arrange the
spaces in any manner as needed.
The main aim of this study is to evaluate the life cycle environmental impacts
associated with the building envelope. The exterior wall or envelope of the building is
made of ‘Tilt-up Concrete’ construction, a method wherein the wall panels are
constructed and ‘tilt-up’ to fit in position. The other details regarding the walls, floors,
columns, footings and foundations, doors, windows, etc. are given in Table 7. The
mechanical system used in the building are Roof top units. The building also has
evaporative coolers in some areas.

65
Table 7: Table shows the area and construction details of the case study building selected
Table 8: Tables showing the Columns and Footing sizes and area
Total Area 148,101 Sq.ft.No: of Floors: 2Total Height 35 ft
Building Area Details
Total Wall Length 1464 ft Total Door Area 830.925 Sq. ft.Construction Type Tilt-up Concrete Construction Type Hollow Metal DoorMaterials Used Concrete Tempered Glass Al FrameConcrete Strength 6000 psi Vertical Lift DoorOverall Thickness 8 in No: Of Doors 20Vertical Rebars # 5 at 12 in Size No:sHorizontal Rebars # 4 at 12 in 3.33 ft 10Panel Perimeter Bars # 5 2 no.s 4.50 ft 1Opening Perimeter Bars # 5 2 no.s 6.33 ft 3
9 ft 6Total Window Area 5427.56 Sq. ft. Glass Type Tempered GlassConstruction Type Aluminium Window System RoofNo: Of windows 123 Total Roof Area 143813.6 Sq. ft.
Size No:s Construction Type Built up Asphalt3.75 ft 2 Floor4.5 ft 45 Total Floor Area 143813.6 Sq. ft.5.67 ft 4 Construction Type Concrete Slab9 ft 41 Concrete Strength 3000 psi14.5 ft 122 ft 30
Glass TypeAnnealed Float Glass ASTM C 1036Heat-treated Float Glass ASTM C 1048Insulated Glass ASTEM E 774
DoorsConstruction Types and Materials
Wall
Windows
C1 18 36017.67 10 10 3/8 "C2 14 29904 12 12 1/2"C3 2 3600 12 12 3/8 "C4 4 3360 18 97C5 4 600 6 4 1/2"
Description Area (SF)No:s Column Sizes

66

67
Figure 18: Images of the Case Study Building- University Services Building (Tempe,Arizona)
Some of the snapshots from the ATHENA software are attached below.
Figure 19: Snapshot from ATHENA software showing the details of some information ofthe building
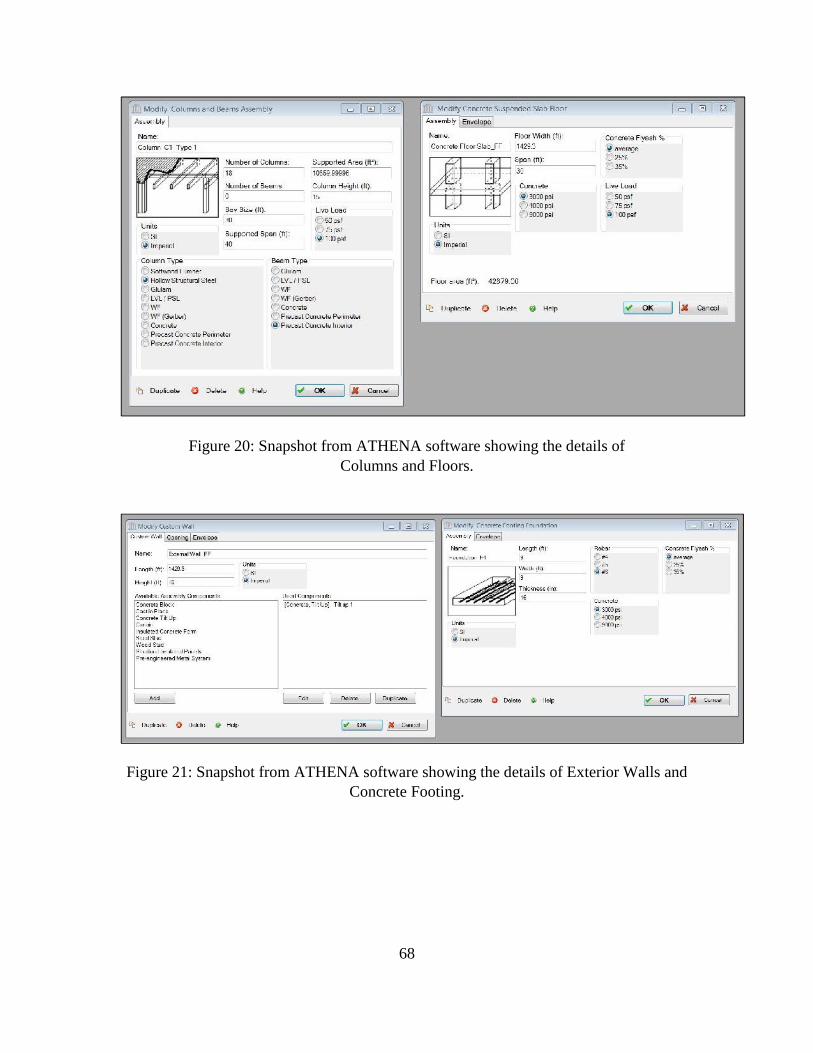
68
Figure 20: Snapshot from ATHENA software showing the details ofColumns and Floors.
Figure 21: Snapshot from ATHENA software showing the details of Exterior Walls andConcrete Footing.

69
Procedure
Figure 22: Flowchart showing the steps involved in the Procedure of the research
The flow chart above explains the procedure behind this research study.
The architectural drawings were studied to determine construction assembly type and
amount for the following categories: Columns and Beams, Intermediate Floors, Exterior
Walls, Windows, Interior Walls, and Roof. The software used for the analysis was the life
cycle assessment software called the ATHENA Impact estimator for buildings. The
software uses Process based LCA and follows database developed by the ATHENA
Sustainable Materials Institute, and also the US LCI database. The Life Cycle Impact
assessment method used is EPA TRACI.
In order to perform the analysis, in the ‘ATHENA’ software, typical details like
the type of building, location, area of the building, building height, etc. were needed to be
known. Options to building location are limited to eight cities in Canada and five in the
US (Pittsburgh, Minneapolis, Atlanta, Orlando, and New York). The tool tries to identify

70
a region to determine aspects like electrical grid, source of building products, and
transportation modes and distances through the location information (ATHENA, 2013).
Different tabs are created for each building component, wherein the details like their area,
material used and some structural details like columns, footing and foundations sizes are
entered. The building`s existing wall system is being compared with five other wall
system types – Cast in Place concrete (CIP), Concrete Block (CB), Curtain Wall (CW),
Insulated Concrete Form (ICF), and Steel Stud (SS).
Figure 23: Figure shows the eQUEST model of the case study building to find the energyconsumption for different envelope systems
Energy models were developed using the energy modeling software called the
eQUEST and the cast study building was simulated for the different types of wall systems
chosen. The annual energy consumption was calculated.
Table 9: Table showing the materials used in each of the envelope systems (Source: eQUEST)
EnvelopeType
Units CIP CB TUC
Category - Concrete
ConcreteBlock
MediumWeight
Steel Siding Fill Insulation Gypsum Brick PolystreneConcrete 30
lbsPolystren
eBrick
BattInsulation
Air Layer GypsumConcrete
140 lb
Material -
Concrete,Heavy
Weight,Concrete
Filled
8 inBlock
ConcreteFilled
AluminumSiding
Cellulose, Fill,3-1/2" (R-13)
Gypusm orPlaster Board,
1/2"
Brick, Face, 3Inch
Expanded, 3"Light Weightconcrete, 4"
Expanded, 3"
Brick
MineralWool/Fiber, Batt, R-
11
Air Layer,3/4" or
lessVertical
Walls
Gypusm orPlaster
Board, 5/8"
ConcreteHeavy
Weight,Dried
Thickness ft 0.667 0.667 0.005 0.292 0.042 0.25 0.25 0.333 0.25 0.25 0.33 0.9 0.052 0.667Conductivity Btu/h-ft-F 0.7575 0.4957 26 0.0225 0.0926 0.7576 0.02 0.0751 0.02 0.7576 0.025 0.0926 0.7576
Density lb/ft3 140 123 480 3 50 130 1.8 30 1.8 130 0.6 50 140Specific
Heat Cap.Btu/lb-F 0.2 0.2 0.1 0.33 0.2 0.22 0.29 0.2 0.29 0.22 0.2 0.2 0.2
Total R Value h-ft2- F/ Btu 0.88 1.345 0.8813.415
ICF
29.768 14.993
SSCW

71
Figure 24: Graph comparing the total R-values between each of the Wall System
Table 9 shows the materials used in each of the wall systems considered, whereas the
graph (Figure 20) shows the comparison of the Total R value of each of the wall systems.
From the graph, we can see that the Insulated Concrete Forms, Steel Stud and the Curtain
Wall systems having R-values as 29.77, 15 and 13.42 h-ft2-̊ F/Btu. The more the R-value,
the better the thermal resistance, which means that a wall system with a higher R-value
will transfer comparatively less heat to the interiors compared to a wall system with
lesser R-value.
Table 10: Table showing kWh values of the Total Energy Consumption associated with differentwall systems (Source: eQUEST)
CIP CB CW ICF SS TUC
Total Annual EnergyConsumption (kWh) 1545200 1560200 1536200 1530600 1533900 1568900

72
Figure 25: Graph showing the comparison of the Total Energy Consumption (kWh) of thedifferent wall systems (Source: eQUEST)
The wall systems using concrete seem to show more energy consumed compared
to the other three systems. Next step the wall systems are compared according to their life
cycle stages and within each of the wall systems based on the summary measures. The
results were calculated and analyzed.
Results
The Life Cycle stages includes Manufacturing, Construction, Maintenance (Use
Phase), End of Life and Operating Energy. The manufacturing phase includes details like
resource extraction, resource transportation and manufacturing of specific materials,
products or building components; Construction phase includes product/component
transportation from the point of manufacture to the building site and on-site construction
activities; Maintenance or Use phase Includes life cycle maintenance and replacement
activities associated with the structure and envelope components based on building type,
location and a user defined life for the building and the ‘End-of-Life’ phase includes
Simulates demolition energy and final disposition of the materials incorporated in a

73
building at the end of building’s life. (ATHENA, 2013). There are seven impacts
categories or Summary measures considered in the software selected from the TRACI
impact characterization method created by the US EPA. They are: Fossil Fuel Depletion,
Global Warming Potential, Acidification Potential, Human Health Criteria,
Eutrophication Potential, Ozone Layer depletion and Smog Potential. (EPA, 2012)
Table 11: Table showing the values of each summary measures of each of the envelope based onthe Manufacturing Life Cycle Stage (Source: ATHENA Impact Estimator)
The above table with values shows the manufacturing stage of each of the
envelope types considered for the analysis. The results got from the ATHENA software
displays the summary measures values based on the material and transport associated
with each life cycle stage.
Table 12: Table showing total values of the manufacturing impacts based on the Summarymeasures
CIP- Cast In Place; CB- Concrete Block; CW- Curtain Wall; ICF- Insulated Concrete Form; SS-Steel Stud; TUC- Tilt-up Concrete
Manufacturing CIP CB CW ICF SS TUCSummary Measures Total Total Total Total Total Total
1.89E+07 1.71E+07 1.96E+07 1.84E+07 1.57E+07 1.79E+072.14E+06 1.86E+06 2.15E+06 2.00E+06 1.70E+06 1.99E+065.97E+05 5.25E+05 8.04E+05 5.63E+05 5.29E+05 5.60E+05
HH Criteria 8.60E+03 7.45E+03 1.59E+04 7.95E+03 7.05E+03 8.02E+034.98E+02 4.76E+02 5.25E+02 4.70E+02 4.95E+02 4.88E+021.87E-02 1.53E-02 1.57E-02 1.68E-02 1.41E-02 1.72E-021.15E+05 9.91E+04 1.31E+05 1.09E+05 1.18E+05 1.07E+05

74
The above table (Table 8) displays summary measure values of each of the wall
system based on the Manufacturing stage as Material and Transport. In order to simplify
the number of values, Table 9 was created which had the total impacts of each of the
summary measures. But it is found that each of the summary measures has different units,
which makes the comparison difficult. So in order to ease that, the wall system which
shows least values of summary measures is taken and the other wall systems are
compared with it. This process of comparing is called Internal Normalization. So, from
Table 9 it is seen that Steel Stud seems to have lesser values compared to the other wall
systems. The total value for each of the Summary measure of the other wall system types
are divided by the value of Steel Stud wall system.
Table 13: Table showing total values of the manufacturing impacts based on the summarymeasures after normalization
CIP- Cast In Place; CB- Concrete Block; CW- Curtain Wall; ICF- Insulated Concrete Form; SS-Steel Stud; TUC- Tilt-up Concrete
Each of the value for the summary measures calculated using the software has
values represented using a scientific notation. To make the results simpler, a ranking is
done among the total summary measure values for each of the life cycle stage to find out
which wall systems performs the best and worst keeping Steel Stud as a basis to compare.
1.21E+00 1.26E+00 1.13E+00 1.22E+00 1.01E+00 1.33E+00 9.77E-011.09E+00 1.10E+00 9.92E-01 1.06E+00 9.62E-01 1.09E+00 8.41E-011.25E+00 1.27E+00 1.52E+00 2.26E+00 1.06E+00 1.11E+00 1.11E+001.18E+00 1.18E+00 1.06E+00 1.13E+00 9.50E-01 1.20E+00 9.27E-011.00E+00 1.00E+00 1.00E+00 1.00E+00 1.00E+00 1.00E+00 1.00E+001.14E+00 1.17E+00 1.06E+00 1.14E+00 9.86E-01 1.22E+00 9.06E-01
CIP
HHCriteria
TUC
ManufacturingFossil Fuel
ConsumptionGlobal
WarmingPotential
AcidificationPotential
EutrophicationPotential
CWICFSS
CB
OzoneDepletionPotential
SmogPotential

75
Table 14: Table showing the rankings for manufacturing stage of each of the wall systems basedon the summary measures
CIP- Cast In Place; CB- Concrete Block; CW- Curtain Wall; ICF- Insulated Concrete Form; SS-Steel Stud; TUC- Tilt-up Concrete
The number 1 represent lesser value, so better performing wall system, whereas
number 6 represents higher value, a worst performing wall system. Therefore, for
manufacturing stage keeping Steel Stud wall system as a basis, the next best performing
system was the Concrete Block, and had a total ranking value of 12 which was lesser than
15. Though the values are lesser than the Steel Stud, only two of the summary measures
has lower values. On the other hand for Steel Stud, more than 3 summary measures had
lower values making the best performing wall system. The worst performing wall system
was the Curtain Wall system with a total of 39.
Table 15: Table showing the ranking for Construction Stage each of the wall system based on thesummary measures
CIP- Cast In Place; CB- Concrete Block; CW- Curtain Wall; ICF- Insulated Concrete Form; SS-Steel Stud; TUC- Tilt-up Concrete
5 5 5 5 5 6 4 352 2 1 2 2 2 1 126 6 6 6 6 3 6 394 4 4 3 1 4 3 231 1 2 1 4 1 5 153 3 3 4 3 5 2 23TUC
Total
ICF
SmogPotential
SS
HHCriteria
Eutrophication
Potential
OzoneDepletionPotential
CIPCBCW
Acidification
PotentialManufacturing
FossilFuel
Consumpt
GlobalWarmingPotential
6 6 5 5 5 6 5 384 3 4 3 4 3 4 252 2 2 1 2 2 2 133 4 3 4 3 5 3 251 1 1 2 1 1 1 85 5 6 6 6 4 6 38
ICFSS
TUC
Total
Eutrophication
Potential
OzoneDepletionPotential
SmogPotential
CIPCBCW
ConstructionFossilFuel
Consumpt
GlobalWarmingPotential
Acidification
Potential
HHCriteria

76
In the construction stage, Curtain wall system had the next best ranking compared
to the Steel Stud with a total of 13. Close to the Curtain wall system was the Insulated
concrete form and concrete block having 25 as the total. But looking at the overall
construction stage of all the wall systems, the rankings are intermediate. Most of the
summary measures have average ranking values ranging from 2-6.
Table 16: Table showing the ranking for Maintainence Stage each of the wall system based on thesummary measures
CIP- Cast In Place; CB- Concrete Block; CW- Curtain Wall; ICF- Insulated Concrete Form; SS-Steel Stud; TUC- Tilt-up Concrete
In the maintenance stage, it is seen that all the ranking seem to same values for all
the wall systems, the worst being for the Curtain Wall system.
Table 17: Table showing the ranking End-of-Life Stage each of the wall system based on thesummary measures
CIP- Cast In Place; CB- Concrete Block; CW- Curtain Wall; ICF- Insulated Concrete Form; SS-Steel Stud; TUC- Tilt-up Concrete
The End-of-Life stage shows Curtain Wall to have the next best ranking in the
list, whereas Cast in Place has the worst ranking with a total of 42. Infact, it has 4 out of 7
6 6 6 6 6 6 6 423 3 3 3 3 3 3 211 1 2 1 2 1 2 105 5 5 5 5 5 5 352 2 1 2 1 2 1 114 4 4 4 4 4 4 28TUC
HHCriteria
Eutrophication
OzoneDepletion
SmogPotential Total
CIP
End-Of-Life FossilFuel
GlobalWarming
Acidification
CBCWICFSS

77
summary measures with least values, compared to Steel Stud which has just 3 out of 7
summary measures.
Table 18: Table showing the ranking for Operating Energy Stage each of the wall system basedon the summary measures
CIP- Cast In Place; CB- Concrete Block; CW- Curtain Wall; ICF- Insulated Concrete Form; SS-Steel Stud; TUC- Tilt-up Concrete
As far the life cycle operating energy is concerned, the Insulated concrete form
had the best ranking, and the next best ranking was the Steel Stud with a total of 7 and
14. The Tilt Up concrete had the worst ranking with a total of 42.
Table 19: Table showing the total rankings of all the Life Cycle Stages of the Wall systems
M-Manufacturing C-Construction Ma-Maintenance EOL-End-Of-Life OE- Operating Energy
CIP- Cast In Place; CB- Concrete Block; CW- Curtain Wall; ICF- Insulated Concrete Form; SS-Steel Stud; TUC- Tilt-up Concrete
To sum up, on the basis of the Steel stud wall system, the concrete block and the
Insulated Concrete Form are the next best performing wall systems according to the Life
Cycle Stages. This might be due to several reasons. In all the life cycle stages, each of
4 4 4 4 4 4 4 285 5 5 5 5 5 5 353 3 3 3 3 3 3 211 1 1 1 1 1 1 72 2 2 2 2 2 2 146 6 6 6 6 6 6 42
FossilFuel
GlobalWarming
Acidification
HHCriteria
Eutrophication
ICFSS
TUC
OzoneDepletion
SmogPotential Total
CIPCBCW
Operating Energy

78
the wall system had different material and transport data associated with it. Due to the
unavailability of the data through the ATHENA software, it was difficult to understand
what exactly happens in this area. The effects of each of the summary measures can vary
among the different wall systems according to the way it was constructed, maintained and
recycled/demolished. For example, manufacturing of Insulated Concrete Forms (ICF)
consumes lot of energy so it has high impacts, whereas it has the best operating energy
next to Steel Stud due to amount of heat transfer through the wall into the building.
When all the Life Cycle Stages are compared, it is found that the maintenance
Phase or Use phase has the best ranking. By definition, Maintenance or Use phase
includes life cycle maintenance and replacement activities associated with the structure
and envelope components based on building type, location and a user defined life for the
building (ATHENA, 2013). But the software doesn’t define what processes are
considered in this phase. By theory we know that each of the wall systems has its own
way of maintenance. From table 15 we can infer that Curtain Wall had the next best
performance, but it might not be true that Curtain wall could be maintained with less
impacts. Whereas the other wall systems like Insulated Concrete Forms, Steel Stud and
Concrete Block have some average rankings inferring that the effects due to maintenance
is tolerable, but very uncertain due to the unavailability of some data. So each of the wall
system has its own advantages and disadvantages.

79
Comparison based on the Assembly groups
Figure 26: Graph showing all assembly groups with their total impact values
When comparing the total impacts of the summary measures, the columns, roofs
and Foundations seem to have lesser impact due to the summary measure. But the main
aim of the research study is to just study the different wall systems, so the same building
was evaluated for the wall systems and other parameters remained the same. So, we are
not considering the other assembly group, but comparing the wall systems on basis of the
summary measures. The same procedure – Internal Normalization is followed to find out
the results.
Table 20: Table showing the ranking of the different wall systems based on the summarymeasures
SummaryMeasures
Fossil FuelConsumpti
on
GlobalWarming
Potential
Acidification
PotentialHH
Criteria
Eutrophication
Potential
OzoneDepletion
SmogPotential Total
CIP 5 5 5 5 5 6 5 36CB 2 2 1 2 2 2 1 12CW 6 6 6 6 6 3 6 39ICF 4 3 3 3 1 4 2 20SS 1 1 2 1 3 1 4 13
TUC 3 4 4 4 4 5 3 27
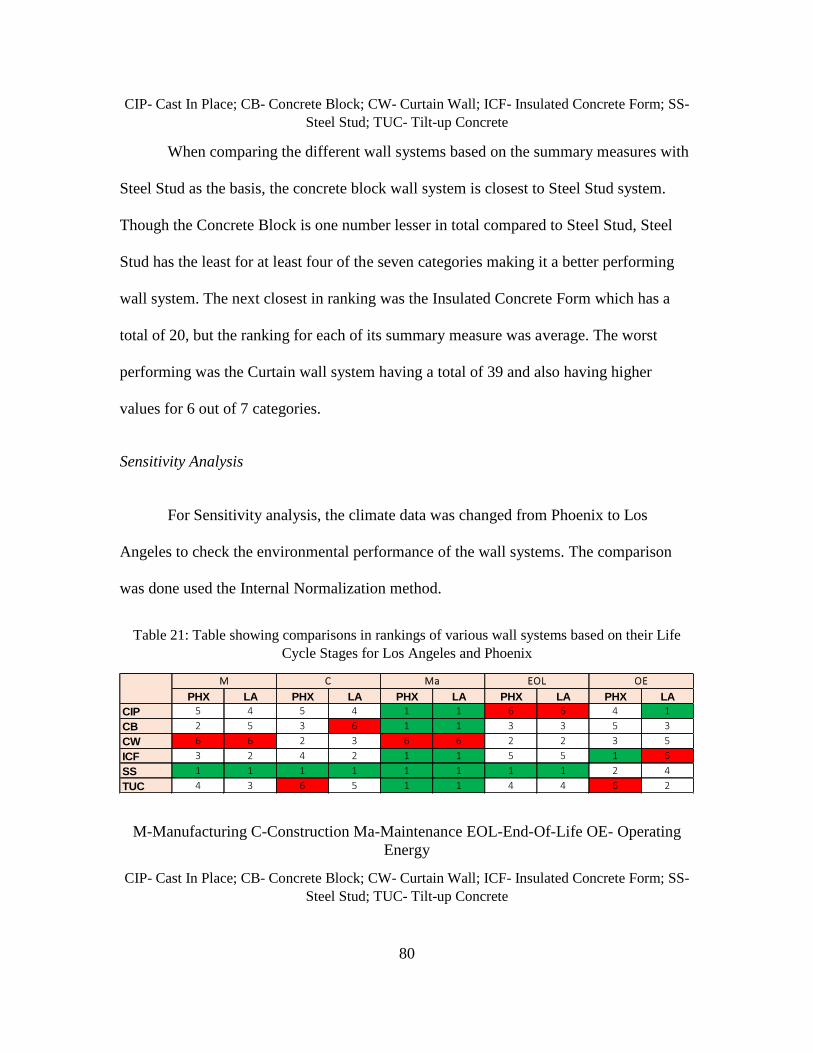
80
CIP- Cast In Place; CB- Concrete Block; CW- Curtain Wall; ICF- Insulated Concrete Form; SS-Steel Stud; TUC- Tilt-up Concrete
When comparing the different wall systems based on the summary measures with
Steel Stud as the basis, the concrete block wall system is closest to Steel Stud system.
Though the Concrete Block is one number lesser in total compared to Steel Stud, Steel
Stud has the least for at least four of the seven categories making it a better performing
wall system. The next closest in ranking was the Insulated Concrete Form which has a
total of 20, but the ranking for each of its summary measure was average. The worst
performing was the Curtain wall system having a total of 39 and also having higher
values for 6 out of 7 categories.
Sensitivity Analysis
For Sensitivity analysis, the climate data was changed from Phoenix to Los
Angeles to check the environmental performance of the wall systems. The comparison
was done used the Internal Normalization method.
Table 21: Table showing comparisons in rankings of various wall systems based on their LifeCycle Stages for Los Angeles and Phoenix
M-Manufacturing C-Construction Ma-Maintenance EOL-End-Of-Life OE- OperatingEnergy
CIP- Cast In Place; CB- Concrete Block; CW- Curtain Wall; ICF- Insulated Concrete Form; SS-Steel Stud; TUC- Tilt-up Concrete
PHX LA PHX LA PHX LA PHX LA PHX LACIP 5 4 5 4 1 1 6 6 4 1CB 2 5 3 6 1 1 3 3 5 3CW 6 6 2 3 6 6 2 2 3 5ICF 3 2 4 2 1 1 5 5 1 6SS 1 1 1 1 1 1 1 1 2 4TUC 4 3 6 5 1 1 4 4 6 2
M C Ma EOL OE

81
Figure 27: Graph showing the comparison in total ranking of the different wall systems for bothclimate types
When compared on the basis of Life Cycle Stages, it was seen that Steel Stud has the
least value for the impacts. This result was the same as got for a climate type like
phoenix, but value was more than Phoenix. This might be due to the difference in the
climate types. Phoenix, being hot and dry will require some amount of insulation in the
building to filter the excess amount of heat entering into the building, whereas Los
Angeles comparatively has a cooler climate where little or no insulation is needed. The
wall systems using concrete like Cast in Place, Insulated Concrete Form Tilt Up concrete
and Concrete Block ranks almost the same. But in Phoenix, concrete related wall systems
had average ranking and had higher values than one found in Los Angeles (Figure 28).
This depends on the property of the material to react to the weather. In cold climate,
concrete might take time to set and also for heat to enter the wall system making the
interiors warm enough to stay. But in hot climates like Phoenix, concrete sets in quickly,
heat transfer is very fast making the interiors hot. However, adding insulation layers
might increase the thermal resistance making the wall system to perform well.

82
Table 22: Table showing the comparison in rankings of various wall systems based on theirsummary measures for Los Angeles and Phoenix
M-Manufacturing C-Construction Ma-Maintenance EOL-End-Of-Life OE- OperatingEnergy
CIP- Cast In Place; CB- Concrete Block; CW- Curtain Wall; ICF- Insulated Concrete Form; SS-Steel Stud; TUC- Tilt-up Concrete
Figure 28: Graph showing comparison of rankings of different wall systems based on theSummary measures
As per the summary measures, the insulated concrete form is best ranking wall system
next to the Steel Stud system, having all summary measures with above average rankings.
The ranking totals for other wall systems are higher than phoenix`s values. However,
Curtain wall has been ranked the worst performing wall system in both the climate types.
PHX LA PHX LA PHX LA PHX LA PHX LA PHX LA PHX LACIP 5 4 5 4 5 4 5 5 5 4 6 6 5 5CB 2 6 2 5 1 5 2 4 2 6 2 4 1 4CW 6 5 6 6 6 6 6 6 6 5 3 2 6 6ICF 4 3 3 2 3 2 3 2 1 1 4 3 2 2SS 1 1 1 1 2 1 1 1 3 2 1 1 4 1TUC 5 2 4 3 4 3 4 3 4 3 5 5 3 3
Ozone DepletionFossil Fuel Global Warming AcidificationHH Criteria
Eutrophication

83
Conclusions
From the analysis, we can infer that every wall system has its own advantages and
disadvantages in each of their life cycle stages. If one has very good manufacturing
performance, its end of life is poor. If other performs well with maintenance, their
operational energy is high, etc. An envelope which has closely satisfied almost all the life
cycle stages was the Steel Stud envelope, irrespective of the climate. The next best
performing wall system which had less impacts on the environment was Insulated
Concrete Form and the Concrete Block. As far as the existing construction in the building
which was Tilt-Up concrete Construction was concerned, it was ranked the last with
having below average rankings for each of the life cycle stages. So it is recommended to
use any type of wall system with little or more insulation along with or without concrete
to perform better as well as having less impact on the environment.
Comparison as per the summary measures, yielded almost the same results. But
as far as summary measures affecting a building are concerned, Fossil Fuel Consumption,
Global Warming Potential and Ozone Depletion Potential contribute the most. The graph
below shows a comparison in the rankings for the different wall systems based on three
of the summary measures. The rankings for each of the summary measures were almost
the same. There are lot of gases involved in the three of these summary measures.
Analyzing and comparing each of them would be tedious task. But in overall ranking of
each of the summary measures we can infer that Steel Stud and Concrete Block have less
impact as they rank 1 and 2 respectively. This also shows that the different types of gases

84
used and their quantities for the two wall systems are comparatively lesser than the
others.
Figure 29: Graph showing comparison of summary measures of different types of Wall systems
CIP- Cast In Place; CB- Concrete Block; CW- Curtain Wall; ICF- Insulated Concrete Form; SS-Steel Stud; TUC- Tilt-up Concrete
The Sensitivity analysis which was performed for another climate type like Los
Angeles shows almost the same hierarchy as Phoenix, expect that total rankings are
different. This might be due to the differences in the climate typologies and also the
physical properties of the materials to adjust to weather conditions.
Limitations
Any research study cannot be done perfect, unless the quality of data is available.
The same goes with a Life Cycle Assessment, which is a time consuming task, cannot be
made perfect unless each and every data is available to perform the LCA study. This
0
1
2
3
4
5
6
7
CIP CB CW ICF SS TUC
Rank
ing
Num
bers
Different types of Wall systems
Comparison of Summary Measures
Fossil Fuel Consumption Global Warming Potential Ozone

85
research study had some data regarding the material and transport of each of the life cycle
stage was not accessible in the software. Probably availability of the same, the results
could have been even more different and justified. The climate and electricity grid data
associated with the software has data for very limited locations in the US, which makes it
difficult for the analysis. Phoenix was not listed location in the software, instead a general
data named ‘USA’ was selected, which had averaged out the electricity grid and climate
data. Lastly, another weakness of this tool is that at present it has limited options for
designing a wall assembly. Most of the conventional wall assemblies can be created
within the tool, but options to create a high-performance wall are not available yet.
However, it would be very useful a tool wherein architects can customize an infinite
variety of wall assemblies and have an impact number generated by a more dynamic
version of the tool.
Future Work
Future work may include Life Cycle Costing comparison for each of the Wall
systems. The research could also be extended to other high performance building wall
systems like innovative glazing systems, green walls, Phase change materials, etc. During
the course of this analysis, a tedious job involved in working with different software’s in
order to collect data and import it on to the ATHENA software. Instead considering a
software which might at least incorporate some of the features together and lessen the use
of variety of software’s would be more helpful. This particular analysis was done for only
one of the building, the sane could be tried on different sizes of office buildings with

86
different assembly materials. By doing this, it could make it more interesting and also
help ASU with some do-able solutions to improvise on the new buildings in the future.

87
REFERENCES
Andre Stephan, R. H. (2012). Towards a comprehensive life cycle energy analysisframework for residential buildings, Energy and Buildings,. Retrieved fromhttp://www.sciencedirect.com/science/article/pii/S0378778812004562
Architects, A. I. (2010). AIA Guide to Building Life Cycle Assesment and practice. 40-60.
ATHENA. (2013). Impact Estimator For Buildings. Retrieved from ATHENA:http://www.athenasmi.org/
Better bricks and powerful enrgy ideas. (n.d.). Retrieved fromhttp://www.betterbricks.com/design-construction/building-envelope
Cavette, C. (2007). How are Products made? Retrieved from Volume 3 :http://www.madehow.com/Volume-3/Concrete-Block.html
Center for Climate and Energy Solutions, Working together for Environment andd theEconomy. (n.d.). Retrieved fromhttp://www.c2es.org/technology/factsheet/BuildingEnvelope
Clark Dietrich Building Systems. (2009). Ron Blank and Associates. Retrieved fromDesign Engineering and Exterior Light-Gauge Steel Framing Basics:http://www.ronblank.com/courses/die05h/die05h.pdf
CoStar. (2013, May). Commercial Real Estate Information Company. Retrieved fromhttp://www.costar.com/News/Article/Market-Trend-Phoenixs-Industrial-Deliveries-Construction-and-Inventory/148636
Dixon, C. (2013, July 25). High Beam Research . Retrieved from Thermal Performanceof Steel Stud framing: better than wood: http://www.highbeam.com/doc/1G1-256171733.html
EPA. (2012). TRACI. Retrieved from EPA: http://www.epa.gov/nrmrl/std/traci/traci.html
Expanded Shale, C. a. (n.d.). Retrieved fromhttp://www.escsi.org/ContentPage.aspx?id=530
G Keoleian, S. B. (2000). “Life-cycle energy, costs, and strategies for improving a singlefamily house. Journal of Industrial Ecology, 135-156.
Gheewala, O. K. (2008). Environmental Life Cycle Assessment of an Office building inThailand . International Journal of Life Cycle Assessment , 498-511.
Glick, S. (2007). Life Cycle Assessment and Life Cycle Costs. Phd Dissertation,Colorado State University.

88
Google . (2012). Retrieved from Google: www.google.com
Guide, W. B. (n.d.). A program of the National Institute of Building Sciences. Retrievedfrom http://ieq.nibs.org/design/env_wall.php#emerg
Henrikke Baumann, A. M. (2004). The Hitch Hiker`s Guide to LCA, An orientation inLife Cycle Assessment methodology and application.
Holger Konig, N. K. (n.d.). ,A Life Cycle Approach to Buildings- Principles, Calculation,Design Tools.
Hovarath, S. J. (2003). Life Cycle Environmental effects of an Office Building. Journalof Infrastructure systems, 157-166.
Hunkler, D. &. (2005). The future of Life-Cycle Assessment. International Journal ofLCA, 10 (5). 305-308.
Hutzler, A. A. (2005). Operational Life Cycle assessment and Life Cycle Cost analysisfor water use in nultioccupant buildings. Journal of Architectural Engineeering ,99-109.
John F. Straube, E. F. (2012). Building Science for Building Enclosures, Building SciencePress.
K&L Gates. (2013). Infrastructure. Retrieved from K&L Gates:http://www.klgates.com/infrastructure-practices/
Knesse, R. U. (1969). Production, Consumption, and Externalities. American EconomicReview 59, 282-297.
Life Cycle Assessment. (2001, May). Retrieved from An Opertaional guide to ISOstandards: http://media.leidenuniv.nl/legacy/new-dutch-lca-guide-part-1.pdf
M Bilec, R. R. (2006). Example of a Hybrid Life-Cycle assessment of constructionprocessess. Infrstructure systems, 207-215.
Mark Huijbregts, P. K. (2010). UNEP, International Panel for Sustainable ResourceManagement. Retrieved from Assessing the Environmental Impacts ofConsumption and Production:http://www.unep.org/resourcepanel/Portals/24102/PDFs/PriorityProductsAndMaterials_Report.pdf
Mazria, E. (2011). US Energy Information Administration. Retrieved from Achitecture2030: http://architecture2030.org/
Morris, P. (2012). Constructin Industry Market Report Fourth Quater Outlook 2012.Davis Langdon.

89
Nik Vigener, PE and Mark A. Brown. (2012, June 25). Whole Building Design Guide.Retrieved from Chairs of the Building Enclosure Councils:http://www.wbdg.org/design/env_fenestration_cw.php
Portland Cement Association. (2013). Concrete Masonary Units. Retrieved fromhttp://www.cement.org/masonry/block.asp
Portland Cement Association. (2013). Insulated Concrete Forms. Retrieved fromhttp://www.cement.org/homes/ch_bs_icf.asp
Portland Cement Association. (2013). Tilt up Concrete. Retrieved from Portland CementAssociation: http://www.cement.org/homes/ch_bs_tiltup.asp#energy
Portland Cement Association. (n.d.). Concrete thinking for Sutainable World. Retrievedfrom http://www.concretethinker.com/solutions/Energy-Performance.aspx
Ries, A. O. (2004). Life Cycle Impact analysis of energy systems for Buildings. Journalof Infrastructure Systems, 87-97.
S Citherlet, T. D. (2007). Energy and Environmental comparison of three variants of asingle family house during its whole life span. Build Environment, 591-598.
Svoboda, S. (2005, March). University of Michigan Corporate EnvironmentalManagement Program. Retrieved from Pollution Prevention in CorporateStrategy:http://www.umich.edu/~nppcpub/resources/compendia/CORPpdfs/CORPlca.pdf
The Future of Life cycle Assessment in Codes. (n.d.). Retrieved fromhttp://www.icces.org/Education/Feb2011_BSJ_Future_of_LCA_in_Codes.pdf
United States Green Building Council. (2013). Retrieved from http://www.usgbc.org/
University, A. S. (1928). ASU Libraries. Retrieved from Landmarks:http://www.asu.edu/lib/archives/asustory/pages/13land.htm
US Environmental Protection Agency (EPA). (2006, may). Life Cycle AssessmentPrinciples and Practice. Retrieved fromhttp://www.epa.gov/nrmrl/std/lca/lca.html
Wikipedia. (2013, July 25). Arizona State University. Retrieved fromhttp://en.wikipedia.org/wiki/ASU_Cares#Extracurricular_programs
Wikipedia. (2013, May). Tilt up . Retrieved from Wikipedia:http://en.wikipedia.org/wiki/Tilt_up
Window and Wall systems. (n.d.). Retrieved fromhttp://www.wausauwindow.com/education/curtainwall/curtainwall.pdf

90
APPENDIX
TYPES OF LCA TOOLS
(Architects, 2010)
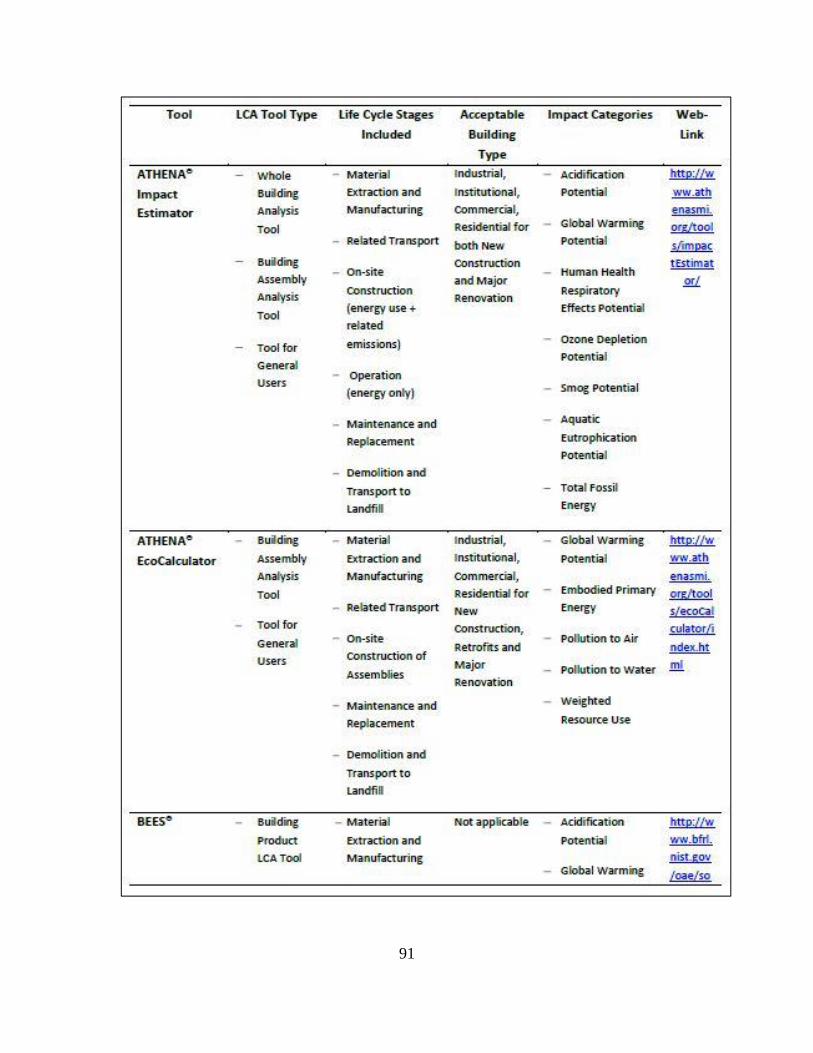
91

92

93

94

95

96

97

98

99
CALCULATIONS OF WALL SYSTEMS FOR PHOENIX CLIMATE FROMATHENA SOFTWARE

100
Based on life cycle stages
Fossil Fuel Consumption 1.21E+00 1.09E+00 1.25E+00 1.18E+00 1.00E+00 1.14E+00Global Warming Potential 1.26E+00 1.10E+00 1.27E+00 1.18E+00 1.00E+00 1.17E+00Acidification Potential 1.13E+00 9.92E-01 1.52E+00 1.06E+00 1.00E+00 1.06E+00HH Criteria 1.22E+00 1.06E+00 2.26E+00 1.13E+00 1.00E+00 1.14E+00Eutrophication Potential 1.01E+00 9.62E-01 1.06E+00 9.50E-01 1.00E+00 9.86E-01Ozone Depletion Potential 1.33E+00 1.09E+00 1.11E+00 1.20E+00 1.00E+00 1.22E+00Smog Potential 9.77E-01 8.41E-01 1.11E+00 9.27E-01 1.00E+00 9.06E-01
Fossil Fuel Consumption 1.32E+00 1.08E+00 1.03E+00 1.08E+00 1.00E+00 1.32E+00Global Warming Potential 1.31E+00 1.07E+00 1.03E+00 1.07E+00 1.00E+00 1.30E+00Acidification Potential 1.37E+00 1.07E+00 1.02E+00 1.06E+00 1.00E+00 1.44E+00HH Criteria 1.24E+00 1.02E+00 9.85E-01 1.04E+00 1.00E+00 1.27E+00Eutrophication Potential 1.39E+00 1.09E+00 1.04E+00 1.07E+00 1.00E+00 1.46E+00Ozone Depletion Potential 1.22E+00 1.09E+00 1.08E+00 1.15E+00 1.00E+00 1.15E+00Smog Potential 1.40E+00 1.09E+00 1.04E+00 1.07E+00 1.00E+00 1.49E+00
Fossil Fuel Consumption 1.00E+00 1.00E+00 1.58E+00 1.00E+00 1.00E+00 1.00E+00Global Warming Potential 1.00E+00 1.00E+00 1.91E+00 1.00E+00 1.00E+00 1.00E+00Acidification Potential 1.00E+00 1.00E+00 1.57E+00 1.00E+00 1.00E+00 1.00E+00HH Criteria 1.00E+00 1.00E+00 2.44E+00 1.00E+00 1.00E+00 1.00E+00Eutrophication Potential 1.00E+00 1.00E+00 2.05E+00 1.00E+00 1.00E+00 1.00E+00Ozone Depletion Potential 1.00E+00 1.00E+00 1.17E+00 1.00E+00 1.00E+00 1.00E+00Smog Potential 1.00E+00 1.00E+00 2.10E+00 1.00E+00 1.00E+00 1.00E+00
Fossil Fuel Consumption 1.27E+00 1.02E+00 9.97E-01 1.19E+00 1.00E+00 1.18E+00Global Warming Potential 1.27E+00 1.03E+00 9.98E-01 1.19E+00 1.00E+00 1.18E+00Acidification Potential 1.27E+00 1.07E+00 1.02E+00 1.18E+00 1.00E+00 1.18E+00HH Criteria 1.28E+00 1.02E+00 9.94E-01 1.19E+00 1.00E+00 1.18E+00Eutrophication Potential 1.27E+00 1.07E+00 1.02E+00 1.18E+00 1.00E+00 1.18E+00Ozone Depletion Potential 1.27E+00 1.03E+00 9.98E-01 1.19E+00 1.00E+00 1.18E+00Smog Potential 1.27E+00 1.10E+00 1.03E+00 1.18E+00 1.00E+00 1.18E+00
Fossil Fuel Consumption 1.01E+00 1.02E+00 1.00E+00 9.98E-01 1.00E+00 1.02E+00Global Warming Potential 1.01E+00 1.02E+00 1.00E+00 9.98E-01 1.00E+00 1.02E+00Acidification Potential 1.01E+00 1.02E+00 1.00E+00 9.98E-01 1.00E+00 1.02E+00HH Criteria 1.01E+00 1.02E+00 1.00E+00 9.98E-01 1.00E+00 1.02E+00Eutrophication Potential 1.01E+00 1.02E+00 1.00E+00 9.98E-01 1.00E+00 1.02E+00Ozone Depletion Potential 1.01E+00 1.02E+00 1.00E+00 9.98E-01 1.00E+00 1.02E+00Smog Potential 1.01E+00 1.02E+00 1.00E+00 9.98E-01 1.00E+00 1.02E+00
Operating Energy CIP CB CW ICF SS TUC
TUC
End-Of-Life CIP CB CW ICF SS TUC
Maintainence CIP CB CW ICF SS
Construction CIP CB CW ICF SS TUC
Manufacturing CIP CB CW ICF SS TUC

101
1.21E+00 1.26E+00 1.13E+00 1.22E+00 1.01E+00 1.33E+00 9.77E-011.09E+00 1.10E+00 9.92E-01 1.06E+00 9.62E-01 1.09E+00 8.41E-011.25E+00 1.27E+00 1.52E+00 2.26E+00 1.06E+00 1.11E+00 1.11E+001.18E+00 1.18E+00 1.06E+00 1.13E+00 9.50E-01 1.20E+00 9.27E-011.00E+00 1.00E+00 1.00E+00 1.00E+00 1.00E+00 1.00E+00 1.00E+001.14E+00 1.17E+00 1.06E+00 1.14E+00 9.86E-01 1.22E+00 9.06E-01
1.32E+00 1.31E+00 1.37E+00 1.24E+00 1.39E+00 1.22E+00 1.40E+001.08E+00 1.07E+00 1.07E+00 1.02E+00 1.09E+00 1.09E+00 1.09E+001.03E+00 1.03E+00 1.02E+00 9.85E-01 1.04E+00 1.08E+00 1.04E+001.08E+00 1.07E+00 1.06E+00 1.04E+00 1.07E+00 1.15E+00 1.07E+001.00E+00 1.00E+00 1.00E+00 1.00E+00 1.00E+00 1.00E+00 1.00E+001.32E+00 1.30E+00 1.44E+00 1.27E+00 1.46E+00 1.15E+00 1.49E+00
1.00E+00 1.00E+00 1.00E+00 1.00E+00 1.00E+00 1.00E+00 1.00E+001.00E+00 1.00E+00 1.00E+00 1.00E+00 1.00E+00 1.00E+00 1.00E+001.58E+00 1.91E+00 1.57E+00 2.44E+00 2.05E+00 1.17E+00 2.10E+001.00E+00 1.00E+00 1.00E+00 1.00E+00 1.00E+00 1.00E+00 1.00E+001.00E+00 1.00E+00 1.00E+00 1.00E+00 1.00E+00 1.00E+00 1.00E+001.00E+00 1.00E+00 1.00E+00 1.00E+00 1.00E+00 1.00E+00 1.00E+00
1.27E+00 1.27E+00 1.27E+00 1.28E+00 1.27E+00 1.27E+00 1.27E+001.02E+00 1.03E+00 1.07E+00 1.02E+00 1.07E+00 1.03E+00 1.10E+009.97E-01 9.98E-01 1.02E+00 9.94E-01 1.02E+00 9.98E-01 1.03E+001.19E+00 1.19E+00 1.18E+00 1.19E+00 1.18E+00 1.19E+00 1.18E+001.00E+00 1.00E+00 1.00E+00 1.00E+00 1.00E+00 1.00E+00 1.00E+001.18E+00 1.18E+00 1.18E+00 1.18E+00 1.18E+00 1.18E+00 1.18E+00
1.01E+00 1.01E+00 1.01E+00 1.01E+00 1.01E+00 1.01E+00 1.01E+001.02E+00 1.02E+00 1.02E+00 1.02E+00 1.02E+00 1.02E+00 1.02E+001.00E+00 1.00E+00 1.00E+00 1.00E+00 1.00E+00 1.00E+00 1.00E+009.98E-01 9.98E-01 9.98E-01 9.98E-01 9.98E-01 9.98E-01 9.98E-011.00E+00 1.00E+00 1.00E+00 1.00E+00 1.00E+00 1.00E+00 1.00E+001.02E+00 1.02E+00 1.02E+00 1.02E+00 1.02E+00 1.02E+00 1.02E+00
CIP
Acidification Potential
HHCriteria
Eutrophication Potential
OzoneDepletion
CBCWICFSS
TUC
GlobalWarming
Fossil FuelConsumption
SmogPotential
Operating Energy
SSTUC
OzoneDepletion
SmogPotential
CIPCBCWICF
End-Of-Life Fossil FuelConsumption
GlobalWarming
Acidification Potential
HHCriteria
Eutrophication Potential
SSTUC
CBCWICF
CIP
OzoneDepletion
SmogPotential
Maintainence Fossil FuelConsumption
GlobalWarming
Acidification Potential
HHCriteria
Eutrophication Potential
TUC
Fossil FuelConsumption
GlobalWarmingPotential
Acidification Potential
HHCriteria
Eutrophication Potential
CIPCBCWICFSS
ConstructionOzone
DepletionPotential
SmogPotential
OzoneDepletionPotential
SmogPotential
TUC
Manufacturing Fossil FuelConsumption
GlobalWarmingPotential
Acidification Potential
Eutrophication Potential
CWICFSS
CB
HHCriteria
CIP

102
Based on Summary Measures
SummaryMeasures
CIP CB CW ICF SS TUC
Fossil Fuel 8.30E+06 5.89E+06 9.73E+06 7.40E+06 4.27E+06 7.16E+06Global Warming 8.98E+05 5.74E+05 1.07E+06 7.25E+05 3.98E+05 7.40E+05Acidification 3.77E+05 2.91E+05 6.68E+05 3.30E+05 2.92E+05 3.42E+05HH Criteria 6.99E+03 5.83E+03 2.00E+04 6.34E+03 5.43E+03 6.41E+03Eutrophication 1.62E+02 1.27E+02 2.24E+02 1.21E+02 1.41E+02 1.54E+02Ozone Depletion 6.10E-03 2.68E-03 3.19E-03 4.17E-03 1.42E-03 4.54E-03
6.31E+04 4.00E+04 9.20E+04 5.00E+04 5.65E+04 5.60E+04
SummaryMeasures
Fossil FuelGlobal
WarmingAcidificati
onHH
Criteria
Eutrophication
OzoneDepletion
Smog
CIP 8.30E+06 8.98E+05 3.77E+05 6.99E+03 1.62E+02 6.10E-03 6.31E+04CB 5.89E+06 5.74E+05 2.91E+05 5.83E+03 1.27E+02 2.68E-03 4.00E+04CW 9.73E+06 1.07E+06 6.68E+05 2.00E+04 2.24E+02 3.19E-03 9.20E+04ICF 7.40E+06 7.25E+05 3.30E+05 6.34E+03 1.21E+02 4.17E-03 5.00E+04SS 4.27E+06 3.98E+05 2.92E+05 5.43E+03 1.41E+02 1.42E-03 5.65E+04
TUC 7.16E+06 7.40E+05 3.42E+05 6.41E+03 1.54E+02 4.54E-03 5.60E+04

103
CALCULATIONS OF THE WALL SYSTEMS FOR LOS ANGELES FROM THEATHENA SOFTWARE

104
Bases on Life Cycle Stages
Fossil Fuel Consumption 1.20E+00 1.39E+00 1.29E+00 1.16E+00 1.00E+00 1.14E+00Global Warming Potential 1.25E+00 1.30E+00 1.30E+00 1.17E+00 1.00E+00 1.17E+00Acidification Potential 1.16E+00 1.23E+00 1.62E+00 1.09E+00 1.00E+00 1.09E+00HH Criteria 1.23E+00 1.21E+00 2.34E+00 1.13E+00 1.00E+00 1.15E+00Eutrophication Potential 1.07E+00 1.57E+00 1.10E+00 9.77E-01 1.00E+00 1.04E+00Ozone Depletion Potential 1.33E+00 1.20E+00 1.11E+00 1.20E+00 1.00E+00 1.22E+00Smog Potential 1.08E+00 1.07E+00 1.23E+00 1.02E+00 1.00E+00 1.00E+00
Fossil Fuel Consumption 1.18E+00 1.27E+00 1.10E+00 1.05E+00 1.00E+00 1.17E+00Global Warming Potential 1.18E+00 1.27E+00 1.11E+00 1.05E+00 1.00E+00 1.17E+00Acidification Potential 1.22E+00 1.25E+00 1.10E+00 1.04E+00 1.00E+00 1.25E+00HH Criteria 1.15E+00 1.27E+00 1.10E+00 1.04E+00 1.00E+00 1.15E+00Eutrophication Potential 1.22E+00 1.27E+00 1.11E+00 1.05E+00 1.00E+00 1.25E+00Ozone Depletion Potential 1.11E+00 1.33E+00 1.15E+00 1.07E+00 1.00E+00 1.06E+00Smog Potential 1.23E+00 1.26E+00 1.10E+00 1.04E+00 1.00E+00 1.27E+00
Fossil Fuel Consumption 1.00E+00 1.00E+00 1.55E+00 1.00E+00 1.00E+00 1.00E+00Global Warming Potential 1.00E+00 1.00E+00 1.84E+00 1.00E+00 1.00E+00 1.00E+00Acidification Potential 1.00E+00 1.00E+00 1.56E+00 1.00E+00 1.00E+00 1.00E+00HH Criteria 1.00E+00 1.00E+00 2.57E+00 1.00E+00 1.00E+00 1.00E+00Eutrophication Potential 1.00E+00 1.00E+00 2.19E+00 1.00E+00 1.00E+00 1.00E+00Ozone Depletion Potential 1.00E+00 1.00E+00 1.18E+00 1.00E+00 1.00E+00 1.00E+00Smog Potential 1.00E+00 1.00E+00 2.25E+00 1.00E+00 1.00E+00 1.00E+00
Fossil Fuel Consumption 1.27E+00 1.11E+00 9.95E-01 1.18E+00 1.00E+00 1.18E+00Global Warming Potential 1.27E+00 1.11E+00 9.97E-01 1.18E+00 1.00E+00 1.18E+00Acidification Potential 1.27E+00 1.17E+00 1.02E+00 1.18E+00 1.00E+00 1.18E+00HH Criteria 1.27E+00 1.10E+00 9.92E-01 1.18E+00 1.00E+00 1.18E+00Eutrophication Potential 1.27E+00 1.17E+00 1.02E+00 1.18E+00 1.00E+00 1.18E+00Ozone Depletion Potential 1.27E+00 1.11E+00 9.96E-01 1.18E+00 1.00E+00 1.18E+00Smog Potential 1.27E+00 1.20E+00 1.03E+00 1.18E+00 1.00E+00 1.18E+00
5.65E+08 5.68E+08 5.84E+08 5.85E+08 5.83E+08 5.66E+083.48E+07 3.50E+07 3.59E+07 3.60E+07 3.58E+07 3.48E+071.38E+07 1.39E+07 1.43E+07 1.43E+07 1.42E+07 1.38E+07
HH Criteria 5.39E+04 5.42E+04 5.57E+04 5.58E+04 5.56E+04 5.40E+042.19E+03 2.21E+03 2.27E+03 2.27E+03 2.26E+03 2.20E+038.84E-05 8.90E-05 9.14E-05 9.17E-05 9.13E-05 8.86E-055.35E+05 5.38E+05 5.53E+05 5.55E+05 5.52E+05 5.36E+05
Opertaing Energy CIP CB CW ICF SS TUC
SS TUC
Manufacturing CIP CB CW ICF SS
CB CW ICF SS
TUC
Construction CIP CB CW ICF
TUC
End of Life CIP CB CW ICF SS TUC
Maintainence CIP

105
FossilFuel
Consumpt
GlobalWarmingPotential
Acidification
Potential
HHCriteria
Eutrophication
Potential
OzoneDepletionPotential
SmogPotential
1.20E+00 1.25E+00 1.16E+00 1.23E+00 1.07E+00 1.33E+00 1.08E+001.39E+00 1.30E+00 1.23E+00 1.21E+00 1.57E+00 1.20E+00 1.07E+001.29E+00 1.30E+00 1.62E+00 2.34E+00 1.10E+00 1.11E+00 1.23E+001.16E+00 1.17E+00 1.09E+00 1.13E+00 9.77E-01 1.20E+00 1.02E+001.00E+00 1.00E+00 1.00E+00 1.00E+00 1.00E+00 1.00E+00 1.00E+001.14E+00 1.17E+00 1.09E+00 1.15E+00 1.04E+00 1.22E+00 1.00E+00
FossilFuel
Consumpt
GlobalWarmingPotential
Acidification
Potential
HHCriteria
Eutrophication
Potential
OzoneDepletionPotential
SmogPotential
1.18E+00 1.18E+00 1.22E+00 1.15E+00 1.22E+00 1.11E+00 1.23E+001.27E+00 1.27E+00 1.25E+00 1.27E+00 1.27E+00 1.33E+00 1.26E+001.10E+00 1.11E+00 1.10E+00 1.10E+00 1.11E+00 1.15E+00 1.10E+001.05E+00 1.05E+00 1.04E+00 1.04E+00 1.05E+00 1.07E+00 1.04E+001.00E+00 1.00E+00 1.00E+00 1.00E+00 1.00E+00 1.00E+00 1.00E+001.17E+00 1.17E+00 1.25E+00 1.15E+00 1.25E+00 1.06E+00 1.27E+00
FossilFuel
Consumpt
GlobalWarmingPotential
Acidification
Potential
HHCriteria
Eutrophication
Potential
OzoneDepletionPotential
SmogPotential
1.00E+00 1.00E+00 1.00E+00 1.00E+00 1.00E+00 1.00E+00 1.00E+001.00E+00 1.00E+00 1.00E+00 1.00E+00 1.00E+00 1.00E+00 1.00E+001.55E+00 1.84E+00 1.56E+00 2.57E+00 2.19E+00 1.18E+00 2.25E+001.00E+00 1.00E+00 1.00E+00 1.00E+00 1.00E+00 1.00E+00 1.00E+001.00E+00 1.00E+00 1.00E+00 1.00E+00 1.00E+00 1.00E+00 1.00E+001.00E+00 1.00E+00 1.00E+00 1.00E+00 1.00E+00 1.00E+00 1.00E+00
FossilFuel
Consumpt
GlobalWarmingPotential
Acidification
Potential
HHCriteria
Eutrophication
Potential
OzoneDepletionPotential
SmogPotential
1.27E+00 1.27E+00 1.27E+00 1.27E+00 1.27E+00 1.27E+00 1.27E+001.11E+00 1.11E+00 1.17E+00 1.10E+00 1.17E+00 1.11E+00 1.20E+009.95E-01 9.97E-01 1.02E+00 9.92E-01 1.02E+00 9.96E-01 1.03E+001.18E+00 1.18E+00 1.18E+00 1.18E+00 1.18E+00 1.18E+00 1.18E+001.00E+00 1.00E+00 1.00E+00 1.00E+00 1.00E+00 1.00E+00 1.00E+001.18E+00 1.18E+00 1.18E+00 1.18E+00 1.18E+00 1.18E+00 1.18E+00
FossilFuel
Consumpt
GlobalWarmingPotential
Acidification
Potential
HHCriteria
Eutrophication
Potential
OzoneDepletionPotential
SmogPotential
5.65E+08 3.48E+07 1.38E+07 5.39E+04 2.19E+03 8.84E-05 5.35E+055.68E+08 3.50E+07 1.39E+07 5.42E+04 2.21E+03 8.90E-05 5.38E+055.84E+08 3.59E+07 1.43E+07 5.57E+04 2.27E+03 9.14E-05 5.53E+055.85E+08 3.60E+07 1.43E+07 5.58E+04 2.27E+03 9.17E-05 5.55E+055.83E+08 3.58E+07 1.42E+07 5.56E+04 2.26E+03 9.13E-05 5.52E+055.66E+08 3.48E+07 1.38E+07 5.40E+04 2.20E+03 8.86E-05 5.36E+05TUC
Operating Energy
CIPCBCWICFSS
Manufacturing
CIPCBCWICFSS
TUC
CBCWICFSS
ICF
Construction
CIP
CBCW
CBCW
TUC
Maintainence
CIP
SSTUC
End of Life
CIP
ICFSS
TUC

106
Based on Summary Measures
Summary Measures CIP CB CW ICF SS TUC
Fossil Fuel Consumption 1.71E+00 2.24E+00 2.15E+00 1.52E+00 1.00E+00 1.50E+00Global Warming Potential 1.98E+00 2.14E+00 2.52E+00 1.62E+00 1.00E+00 1.66E+00Acidification Potential 1.33E+00 1.44E+00 2.39E+00 1.17E+00 1.00E+00 1.21E+00HH Criteria 1.32E+00 1.29E+00 3.96E+00 1.19E+00 1.00E+00 1.20E+00Eutrophication Potential 1.36E+00 3.11E+00 1.81E+00 9.61E-01 1.00E+00 1.27E+00Ozone Depletion Potential 4.34E+00 3.03E+00 2.27E+00 2.96E+00 1.00E+00 3.22E+00Smog Potential 1.35E+00 1.34E+00 2.02E+00 1.09E+00 1.00E+00 1.20E+00
Summary
Measures
FossilFuel
Consum
GlobalWarming
Acidification
Potential
HHCriteria
Eutrophication
Potential
OzoneDepletion
SmogPotential
CIP 1.71E+00 1.98E+00 1.33E+00 1.32E+00 1.36E+00 4.34E+00 1.35E+00CB 2.24E+00 2.14E+00 1.44E+00 1.29E+00 3.11E+00 3.03E+00 1.34E+00CW 2.15E+00 2.52E+00 2.39E+00 3.96E+00 1.81E+00 2.27E+00 2.02E+00ICF 1.52E+00 1.62E+00 1.17E+00 1.19E+00 9.61E-01 2.96E+00 1.09E+00SS 1.00E+00 1.00E+00 1.00E+00 1.00E+00 1.00E+00 1.00E+00 1.00E+00TUC 1.50E+00 1.66E+00 1.21E+00 1.20E+00 1.27E+00 3.22E+00 1.20E+00

107
ARCHITECTURAL DRAWINGS FOR THE UNIVERSITY SERVICES BUILDING

108
Foundation Plan

109
Floor Plan

110
Exterior Elevations

111
Sections