Embed Size (px)
Citation preview
Life Cycle AssessmentProf. Brajesh Kumar Dubey
Department of Civil EngineeringIndian Institute of Technology, Kharagpur
Lecture - 27Key Points of a Good LCA and Example LCA
Just a quick recap: these few slides you can use as a resource when you are trying to do
some LCA activity. So, that was one of the reason to put these slides over there which
you can refer whenever you are doing an LCA activity. Let us look at one by one.
(Refer Slide Time: 01:09)
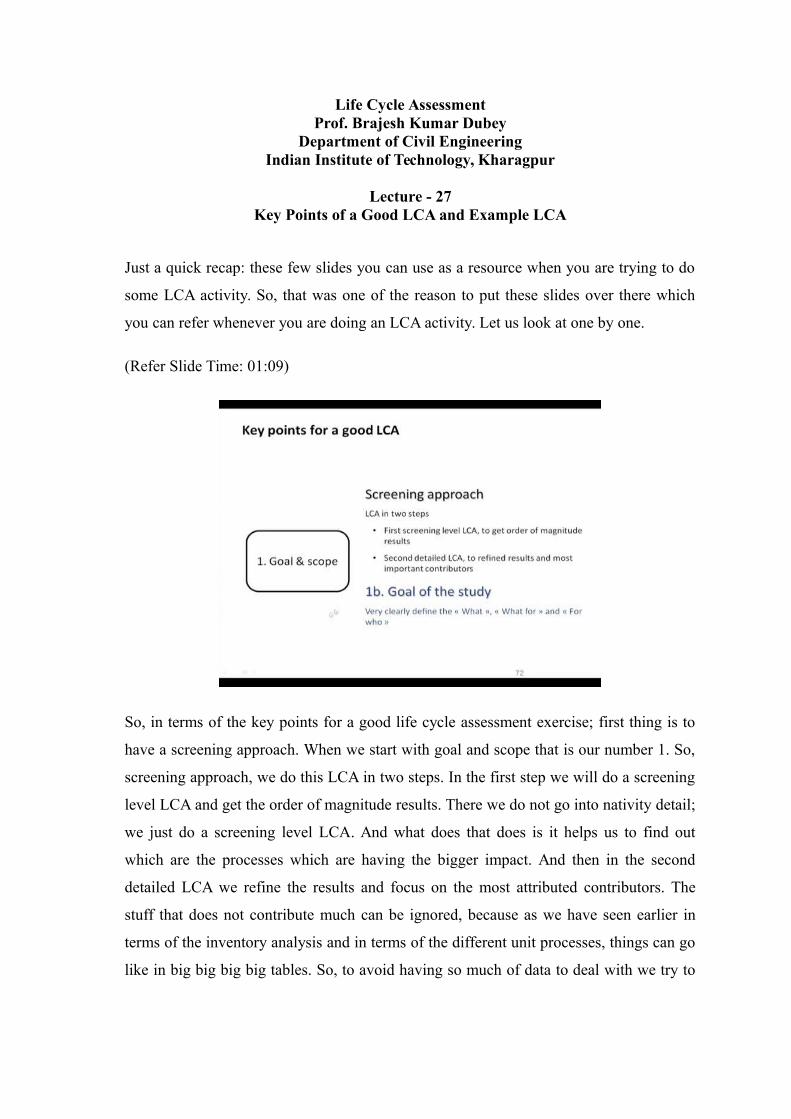
So, in terms of the key points for a good life cycle assessment exercise; first thing is to
have a screening approach. When we start with goal and scope that is our number 1. So,
screening approach, we do this LCA in two steps. In the first step we will do a screening
level LCA and get the order of magnitude results. There we do not go into nativity detail;
we just do a screening level LCA. And what does that does is it helps us to find out
which are the processes which are having the bigger impact. And then in the second
detailed LCA we refine the results and focus on the most attributed contributors. The
stuff that does not contribute much can be ignored, because as we have seen earlier in
terms of the inventory analysis and in terms of the different unit processes, things can go
like in big big big big tables. So, to avoid having so much of data to deal with we try to
pick the data. And then what happens when we are looking at too much data, sometimes
the important data gets ignored.
So, we are trying to focus on the important data for which we can get the results. So, that
is a screening approach then you go for the goals of the study. The goal is very clearly
defined for what and for whom.
(Refer Slide Time: 02:29)
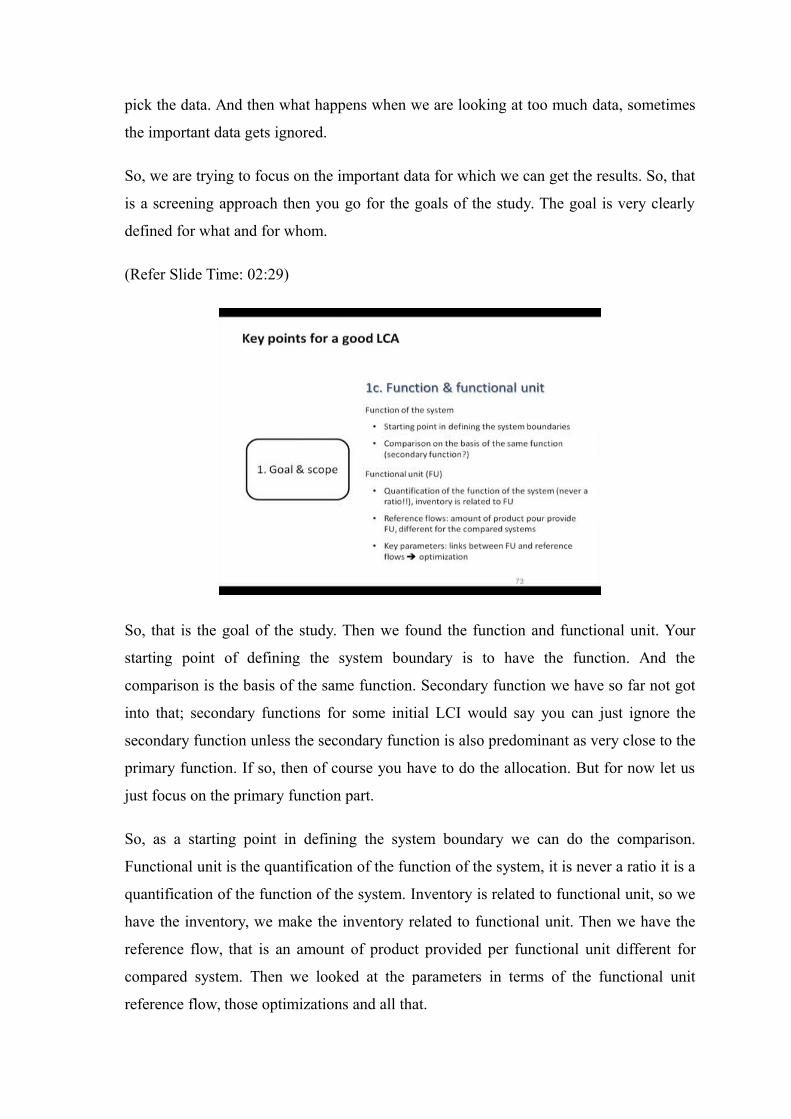
So, that is the goal of the study. Then we found the function and functional unit. Your
starting point of defining the system boundary is to have the function. And the
comparison is the basis of the same function. Secondary function we have so far not got
into that; secondary functions for some initial LCI would say you can just ignore the
secondary function unless the secondary function is also predominant as very close to the
primary function. If so, then of course you have to do the allocation. But for now let us
just focus on the primary function part.
So, as a starting point in defining the system boundary we can do the comparison.
Functional unit is the quantification of the function of the system, it is never a ratio it is a
quantification of the function of the system. Inventory is related to functional unit, so we
have the inventory, we make the inventory related to functional unit. Then we have the
reference flow, that is an amount of product provided per functional unit different for
compared system. Then we looked at the parameters in terms of the functional unit
reference flow, those optimizations and all that.

(Refer Slide Time: 03:39)
System boundary all process needs to provide the function. So, rule one is you compared
system must provide the same function. So, when we look at the compared systems they
should have the same function. And then you include the processes or those which
contribute more than a fixed percentage; we talked about that 0.07 percent or something
like that in one of the initial slides we had that. So, if it is more than a fixed percentage in
terms of the mass energy or environmental release cut off criteria then we included it
otherwise we do not included it, otherwise it gets too long.
And there are identical stages processes between the compared systems we can exclude it
only if it does not affect the functional equivalence. We talked about that remember that
herbicide example; that herbicide a versus herbicide b. And we talked about this
particular case in much much detail. If you do not remember go back and look at that
particular module that would be I think week 5 one of the first few module; first or
second module I do not remember right now, but it was there in herbicide a versus
herbicide b when we did that comparison. We can take an identical stage of processes of
only if it does not affect the functional equivalence.
(Refer Slide Time: 04:55)
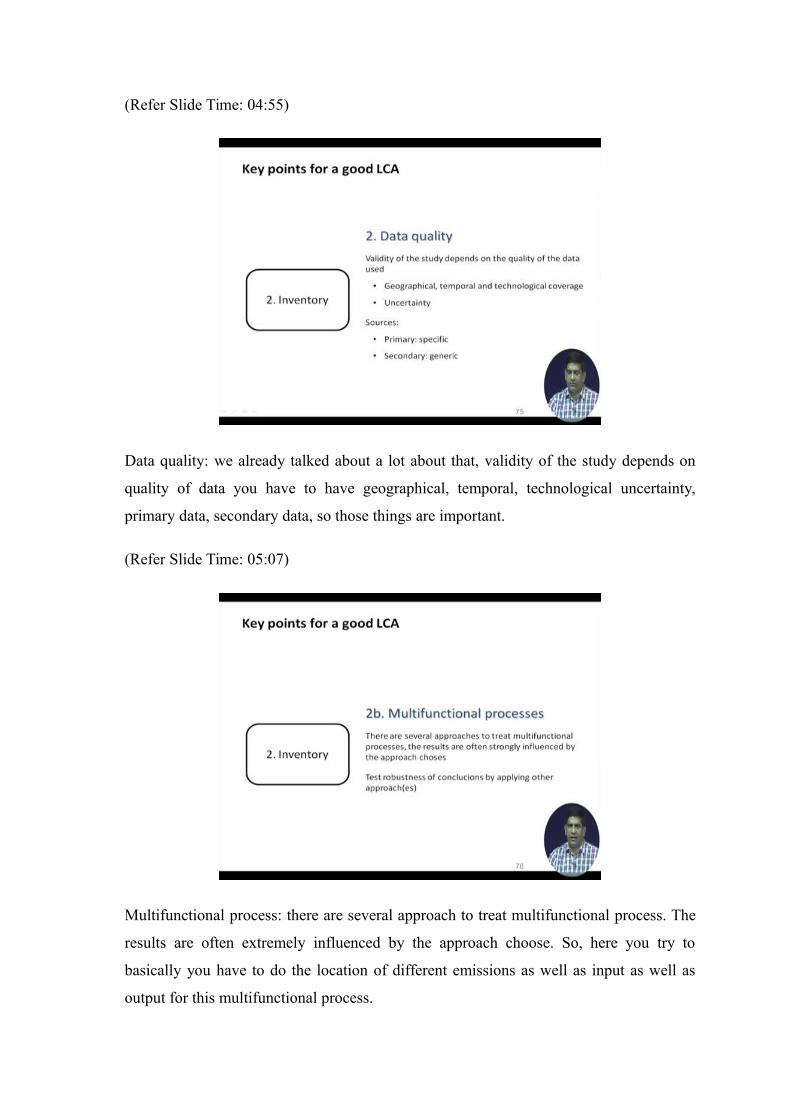
Data quality: we already talked about a lot about that, validity of the study depends on
quality of data you have to have geographical, temporal, technological uncertainty,
primary data, secondary data, so those things are important.
(Refer Slide Time: 05:07)
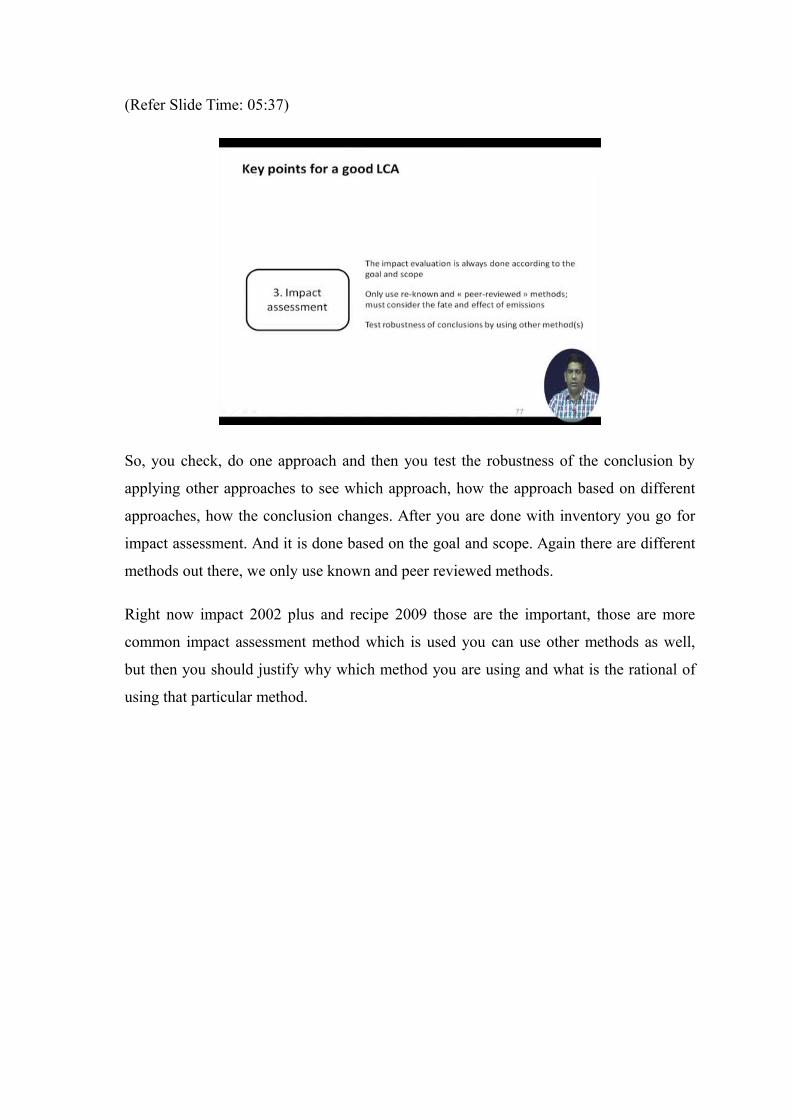
Multifunctional process: there are several approach to treat multifunctional process. The
results are often extremely influenced by the approach choose. So, here you try to
basically you have to do the location of different emissions as well as input as well as
output for this multifunctional process.
(Refer Slide Time: 05:37)
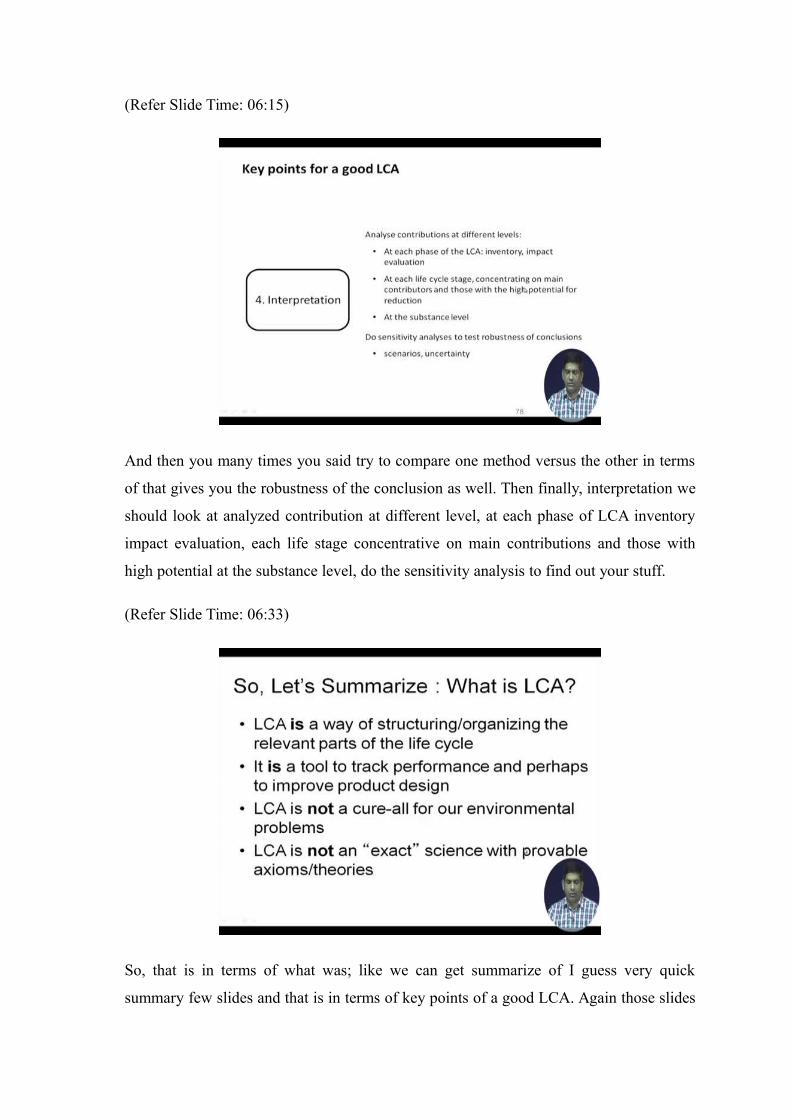
So, you check, do one approach and then you test the robustness of the conclusion by
applying other approaches to see which approach, how the approach based on different
approaches, how the conclusion changes. After you are done with inventory you go for
impact assessment. And it is done based on the goal and scope. Again there are different
methods out there, we only use known and peer reviewed methods.
Right now impact 2002 plus and recipe 2009 those are the important, those are more
common impact assessment method which is used you can use other methods as well,
but then you should justify why which method you are using and what is the rational of
using that particular method.
(Refer Slide Time: 06:15)
And then you many times you said try to compare one method versus the other in terms
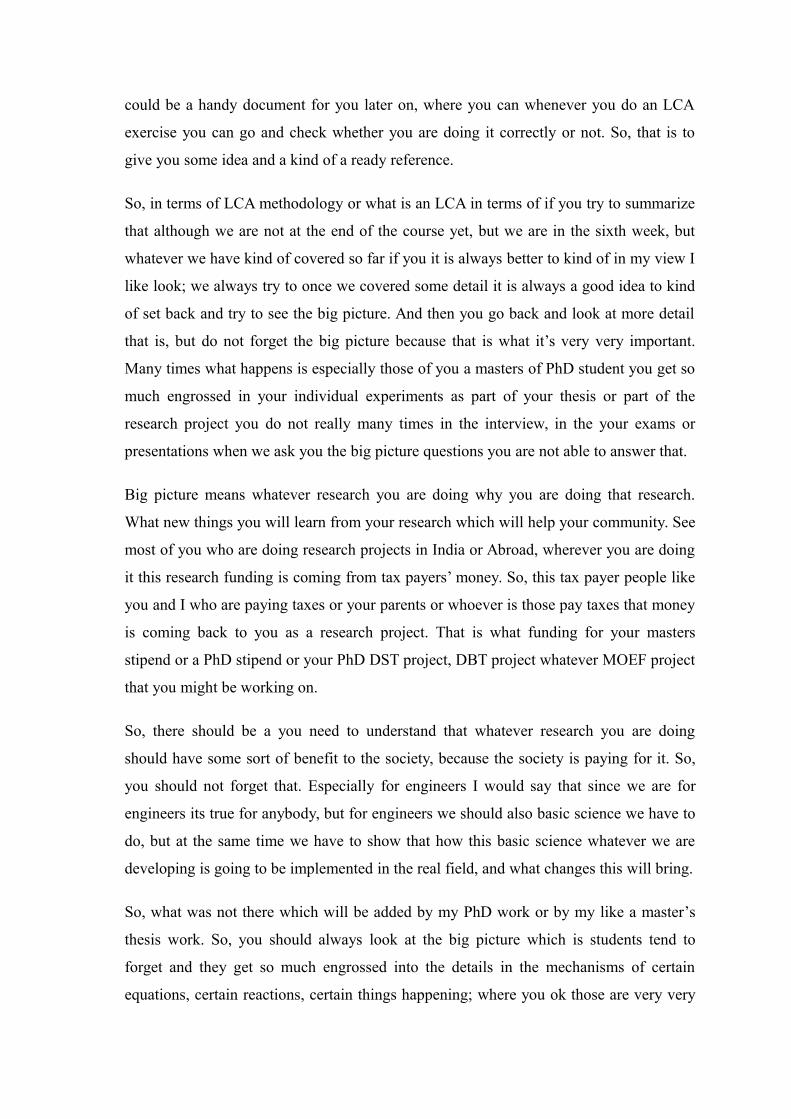
of that gives you the robustness of the conclusion as well. Then finally, interpretation we
should look at analyzed contribution at different level, at each phase of LCA inventory
impact evaluation, each life stage concentrative on main contributions and those with
high potential at the substance level, do the sensitivity analysis to find out your stuff.
(Refer Slide Time: 06:33)
So, that is in terms of what was; like we can get summarize of I guess very quick
summary few slides and that is in terms of key points of a good LCA. Again those slides
could be a handy document for you later on, where you can whenever you do an LCA
exercise you can go and check whether you are doing it correctly or not. So, that is to
give you some idea and a kind of a ready reference.
So, in terms of LCA methodology or what is an LCA in terms of if you try to summarize
that although we are not at the end of the course yet, but we are in the sixth week, but
whatever we have kind of covered so far if you it is always better to kind of in my view I
like look; we always try to once we covered some detail it is always a good idea to kind
of set back and try to see the big picture. And then you go back and look at more detail
that is, but do not forget the big picture because that is what it’s very very important.
Many times what happens is especially those of you a masters of PhD student you get so
much engrossed in your individual experiments as part of your thesis or part of the
research project you do not really many times in the interview, in the your exams or
presentations when we ask you the big picture questions you are not able to answer that.
Big picture means whatever research you are doing why you are doing that research.
What new things you will learn from your research which will help your community. See
most of you who are doing research projects in India or Abroad, wherever you are doing
it this research funding is coming from tax payers’ money. So, this tax payer people like
you and I who are paying taxes or your parents or whoever is those pay taxes that money
is coming back to you as a research project. That is what funding for your masters
stipend or a PhD stipend or your PhD DST project, DBT project whatever MOEF project
that you might be working on.
So, there should be a you need to understand that whatever research you are doing
should have some sort of benefit to the society, because the society is paying for it. So,
you should not forget that. Especially for engineers I would say that since we are for
engineers its true for anybody, but for engineers we should also basic science we have to
do, but at the same time we have to show that how this basic science whatever we are
developing is going to be implemented in the real field, and what changes this will bring.
So, what was not there which will be added by my PhD work or by my like a master’s
thesis work. So, you should always look at the big picture which is students tend to
forget and they get so much engrossed into the details in the mechanisms of certain
equations, certain reactions, certain things happening; where you ok those are very very
important I am not saying those are not important those are important, because
understanding of those is very very important. But at the same time why we are doing it,
what we are going to get out of this and what benefit it will bring to the society which is
not there, what new things we learn from this particular research project. Those things
you need to really think about. And those are important questions that you will have to
answer in any whether in your PhD exam, master’s exam, or even during your job
interviews they will ask you those kinds of question.
So, in terms of looking at the big picture which I said is important to look at, so let us
summarize what we have learnt in terms of the LCA so far. So, what is an LCA? It is a
way of structuring and organizing the relevant parts of the life cycle. So, it is a life cycle
cradle to grave, cradle to gate, gate to grave and gate to gate. So, there are different types
of life cycle we can look at. So, it is a way of structuring and organizing the relevant
parts. So, when we say structuring and organizing with different unit processes that goes
into that particular exercise. And it is a tool, again it is a tool; it is a tool to track
performance and perhaps to improve product design.
So, we can use this tool to track the performance; performance in terms of environmental
footprint, in terms of the environmental performance we can track. And also help in
improving the product design to make it more environmental friendly. LCA is not a cure
all for all our environmental problems. So, again it is a tool which we can use to
understand things better, to understand things from a system perspective, but that does
not mean that if you do LCA and that is if you do not do the follow up study associated;
follow up task associated with this whatever we learnt, whatever is the recommendation
as part of the life cycle interpretation. And if that thing is not followed up things does not
change that is not going to do any benefit.
So, it is not a cure all for all our environmental problems. So, that is we need to be really
careful. Many times what happens anything new comes everybody will do LCA say if
LCA come is getting popular in India now you will see that even outside globally. Many
studies they are doing LCA they are doing sometimes I hear that oh these days
publishing papers in LCA is much easier. I do not agree with that working in this area for
few years now, it is not easy we have to really do a good LCA exercise to get it published
in a good journal. Of course, there are lot of I would say journals are out there these days
publishing any paper is not a problem, you can there are some journals which will charge
you certain money and pay publish that paper. But to publish in good quality paper does
not matter whether you are doing LCA whether you are doing some other research good
quality research is important.
Again, it is not a cure all just do the LCA exercise you publish this paper and then that is
it that is put it in our c b, but that is not getting implemented anywhere. And it is not an
exact science with provable axioms or theory, it is not an exact science, it is a essentially
is an accounting exercise we are trying to look at all the emissions input and output, we
are trying to look at the big picture environmental footprint of any product or any process
that is what LCA helps us do it.
So, that is kind of summarize of all this. And then we will look at some of more detail as
we make progress, as we like make further progress in this particular course. And
towards the end of course we will again try to summarize and then you some of these
things will come up for discussion too. So, if you as just now we finished looking at an
LCA methodology, so let us look at an example of how LCA. This is a real example this
was a product project done by master student working with me couple of years back.
So, this particular product it is an EnerPax and I will explain you what this product is
there. We are trying to do a LCA of EnerPax from cradle to gate. So, this is an example
let us walk through this example so that you see how this goal and scope function and
functional unit and other things were used over here.
(Refer Slide Time: 13:35)
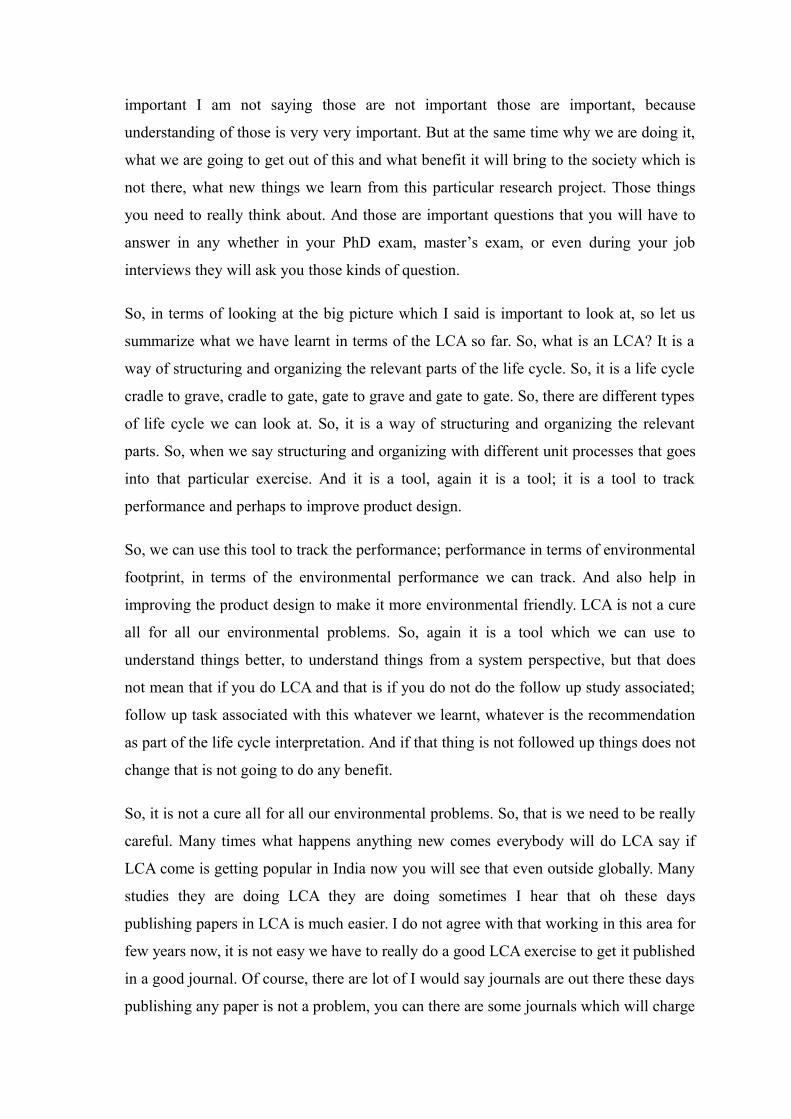
What is LCA you already know it, so we will kind of just skip that. There are multiple
approaches to LCA you can do cradle to grave, cradle to gate, cradle to cradle; that is
your whole life cycle, gate to gate well to wheel and we will talk about that later. So, it is
a tool where you can look at the environmental, social, economical, but mostly we will
focus on environmental aspect. And you already know about this life cycle assessment
framework goal scope inventory impact and interpretation.
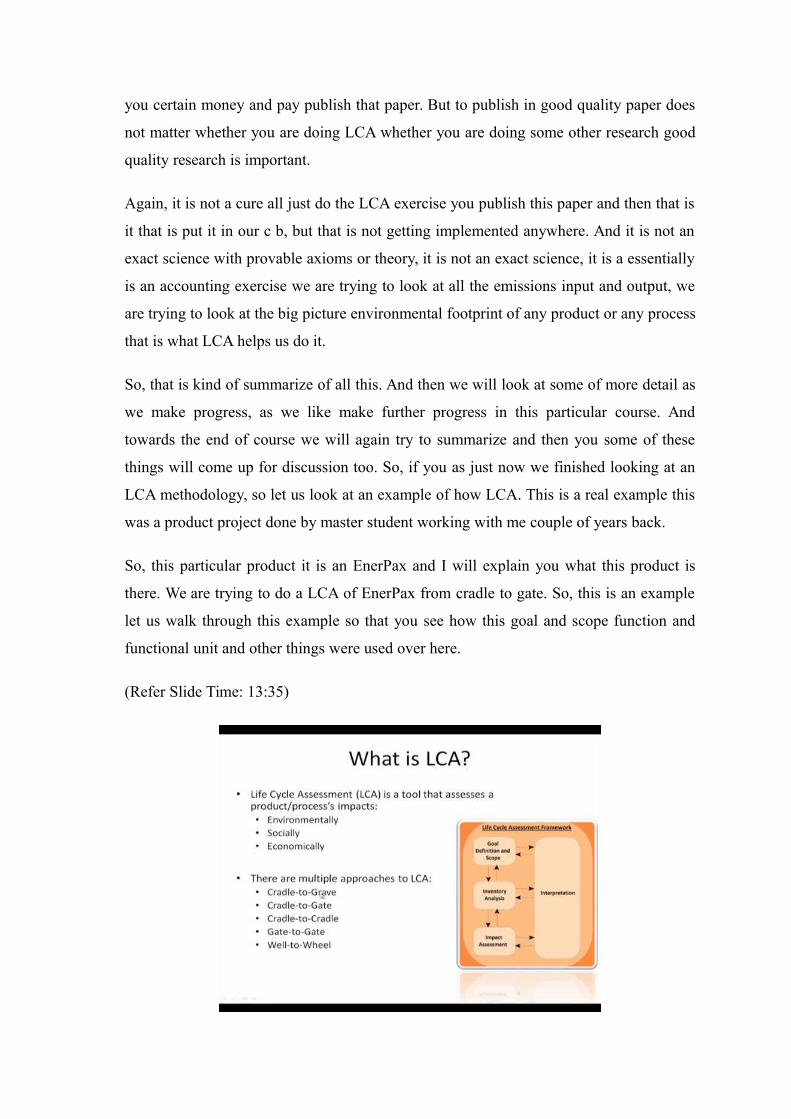
(Refer Slide Time: 14:02)
So, LCA is a technique to assess the environmental aspect, we already we compile
inventory and relevant energy and material import. We will look at the potential
environmental impact associated with inputs as well as release and interpret the data.
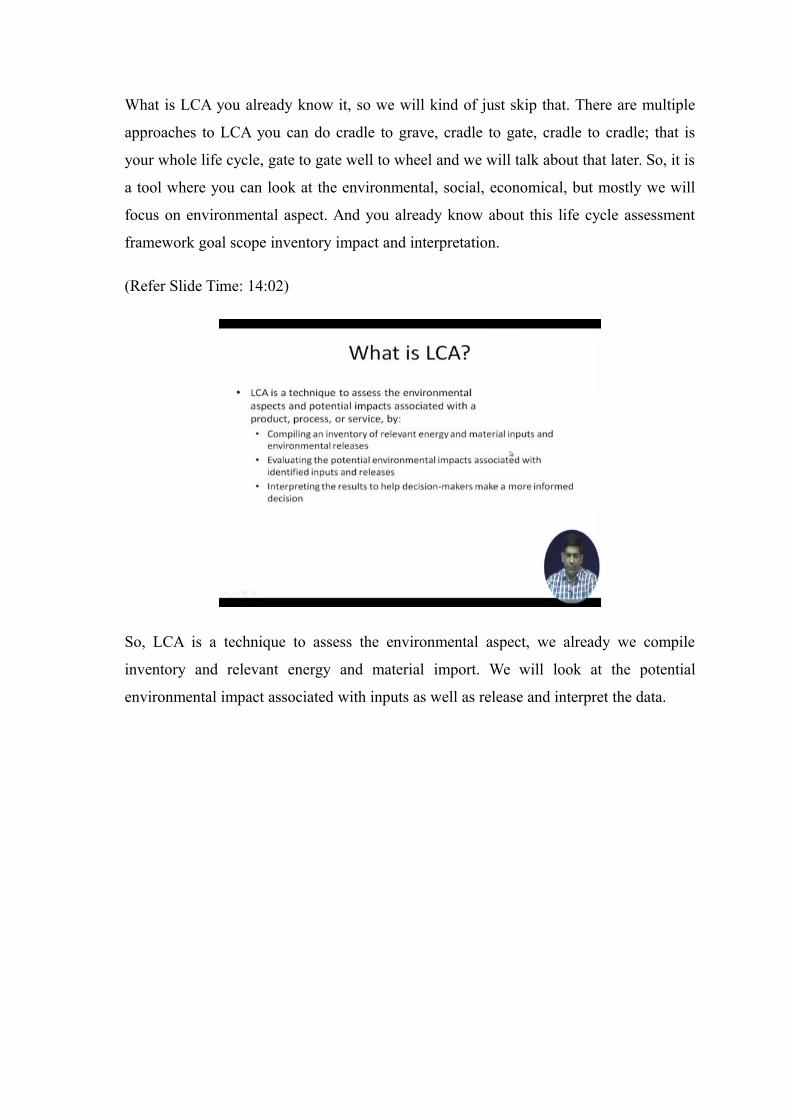
(Refer Slide Time: 14:15)
So, we this project was done for a plant it is called a Dongara plant, that is a name of the
company, it is just outskirts of like main Toronto area it is in Greater Toronto Area and it
is in located in Vaughan which is in GTA Greater Toronto Area. And it processes
municipal solid waste from Greater Toronto Area and the regions of York, Durham and
Peel.
So, when you say municipal solid waste in this particular area these are all areas of
Ontario and South-West Ontario dominantly in that. So, they had most of this cities that
have been listed over here they have three way collection system. When we say three
way collection systems they have we are talking about municipal solid waste collection.
So, they have recyclable collector separately wet waste going for a composting or
anaerobic digestion wet waste in food waste and other organic that is collected
separately. And the third category is non-recyclables, non-compostables like non-
biodegradable and I should not say bi because even third category may have some
biodegradable waste, but non compostable are going to anaerobic digestion non-
recyclable that material is what this particular plant is processing.
And it is processing residential MSW as a Fitch talk to manufacture palletized fuel
product. So, they are making some palletized fuel product and we did in LCA exercise,
when I say we like my student actually did it under my supervision and we get those part
of his masters work. And that is we made a full palletized fuel product to that came out
of that.
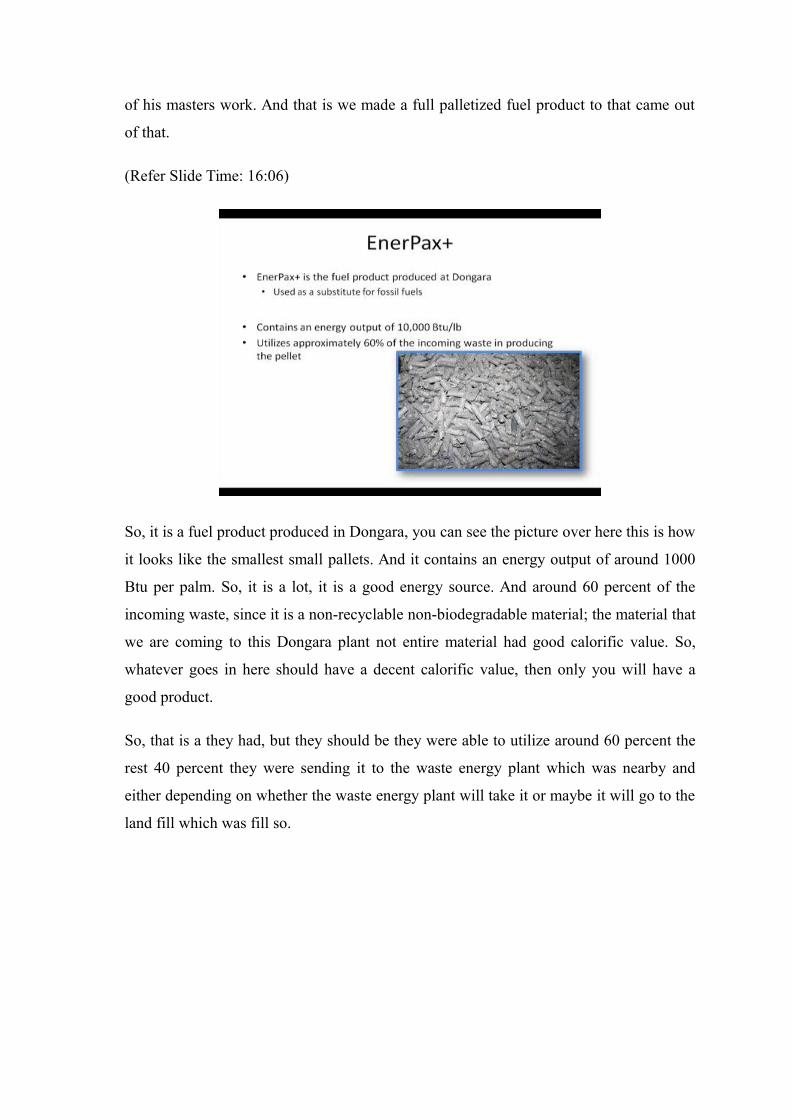
(Refer Slide Time: 16:06)
So, it is a fuel product produced in Dongara, you can see the picture over here this is how
it looks like the smallest small pallets. And it contains an energy output of around 1000
Btu per palm. So, it is a lot, it is a good energy source. And around 60 percent of the
incoming waste, since it is a non-recyclable non-biodegradable material; the material that
we are coming to this Dongara plant not entire material had good calorific value. So,
whatever goes in here should have a decent calorific value, then only you will have a
good product.
So, that is a they had, but they should be they were able to utilize around 60 percent the
rest 40 percent they were sending it to the waste energy plant which was nearby and
either depending on whether the waste energy plant will take it or maybe it will go to the
land fill which was fill so.

(Refer Slide Time: 16:59)
So what was the goal? Again the steps, so goal definition and scope: so the goal of this
study was to see the environmental impact of this EnerPax in comparison of medium
grade coal. Now here you need to understand the background behind this particular
project. So, this was a project funded by this particular company and because this
company wanted they were trying to apply to ministry of environment in Ontario to let
their waste this particular product be used by coal based thermal power plant. So, these
coal based thermal power plants were using this medium grade coal. So, that is why they
wanted to compare with medium grade coal, because the medium grade coal is already
used.
The reason this product is coming from waste, many countries around the world even the
products making out of the waste material is considered almost as good as the waste
material. So, unfortunately that is to certain extent is unfortunate, but that is how it is. So,
there are the regulations in place right now. So For example, if some when this particular
project was done few years back and based on the regulation that was prevalent on that
particular time in the province of Ontario in Canada what was there that if you have this
product; if you are going to use these EnerPax pallets you are as good as a waste
incinerator. So, you and for waste incineration plant they have a stricter environmental
control into stricter air pollution control system requirement as opposed to what is
needed for like a coal based thermal power plant.
So, here we compare the medium grade coal, since EnerPax had similar energy content
as well and that was being used in those coal based thermal power plant. The analysis
will perform from cradle to gate. So, cradle was when this municipal solid waste coming
that was to the plant. And to the gate once the EnerPax is going out in terms of plant as a
product. So, the combustion property information of EnerPax were unable to perform
cradle to grave analysis, so that is why we use cradle to gate. The chosen function for
analysis is providing energy, is not it that is what both the cases we are providing energy
through combustion.
Therefore, we choose a functional unit of 992 Giga Btu selected, and because that is get
total input of around 75 tons of MSW. So, out of 75 tons of MSW we will get around 992
Giga Btu. So, that is what was chosen to compare both EnerPax as well as the medium
grade coal.
(Refer Slide Time: 19:43)
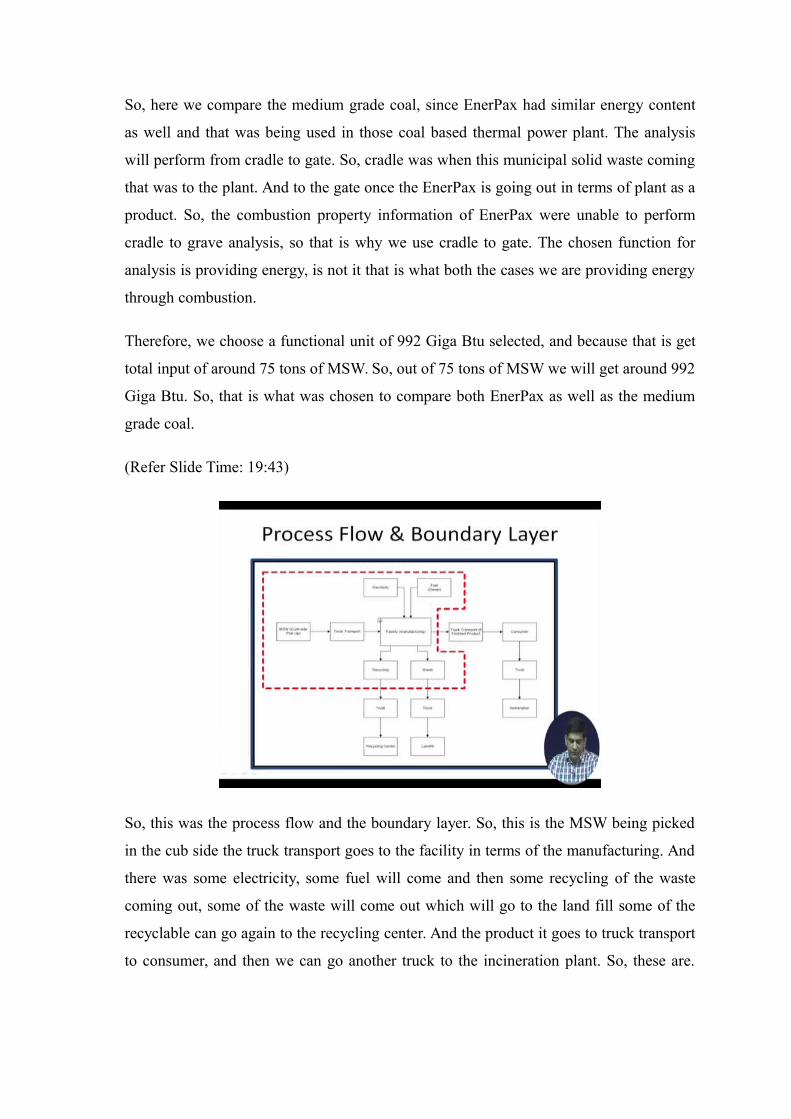
So, this was the process flow and the boundary layer. So, this is the MSW being picked
in the cub side the truck transport goes to the facility in terms of the manufacturing. And
there was some electricity, some fuel will come and then some recycling of the waste
coming out, some of the waste will come out which will go to the land fill some of the
recyclable can go again to the recycling center. And the product it goes to truck transport
to consumer, and then we can go another truck to the incineration plant. So, these are.
So, the red dotted line is what we have chosen for this process flow or the boundary layer
for this particular hour stream.
(Refer Slide Time: 20:22)
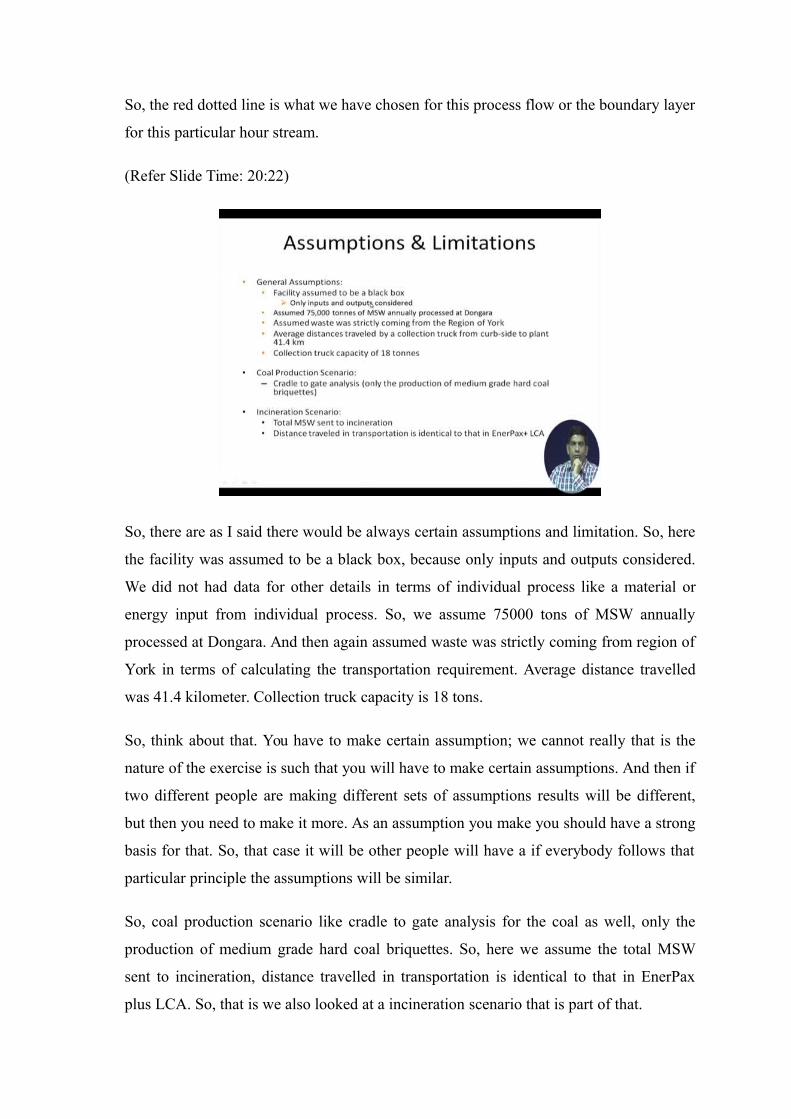
So, there are as I said there would be always certain assumptions and limitation. So, here
the facility was assumed to be a black box, because only inputs and outputs considered.
We did not had data for other details in terms of individual process like a material or
energy input from individual process. So, we assume 75000 tons of MSW annually
processed at Dongara. And then again assumed waste was strictly coming from region of
York in terms of calculating the transportation requirement. Average distance travelled
was 41.4 kilometer. Collection truck capacity is 18 tons.
So, think about that. You have to make certain assumption; we cannot really that is the
nature of the exercise is such that you will have to make certain assumptions. And then if
two different people are making different sets of assumptions results will be different,
but then you need to make it more. As an assumption you make you should have a strong
basis for that. So, that case it will be other people will have a if everybody follows that
particular principle the assumptions will be similar.
So, coal production scenario like cradle to gate analysis for the coal as well, only the
production of medium grade hard coal briquettes. So, here we assume the total MSW
sent to incineration, distance travelled in transportation is identical to that in EnerPax
plus LCA. So, that is we also looked at a incineration scenario that is part of that.
(Refer Slide Time: 21:49)
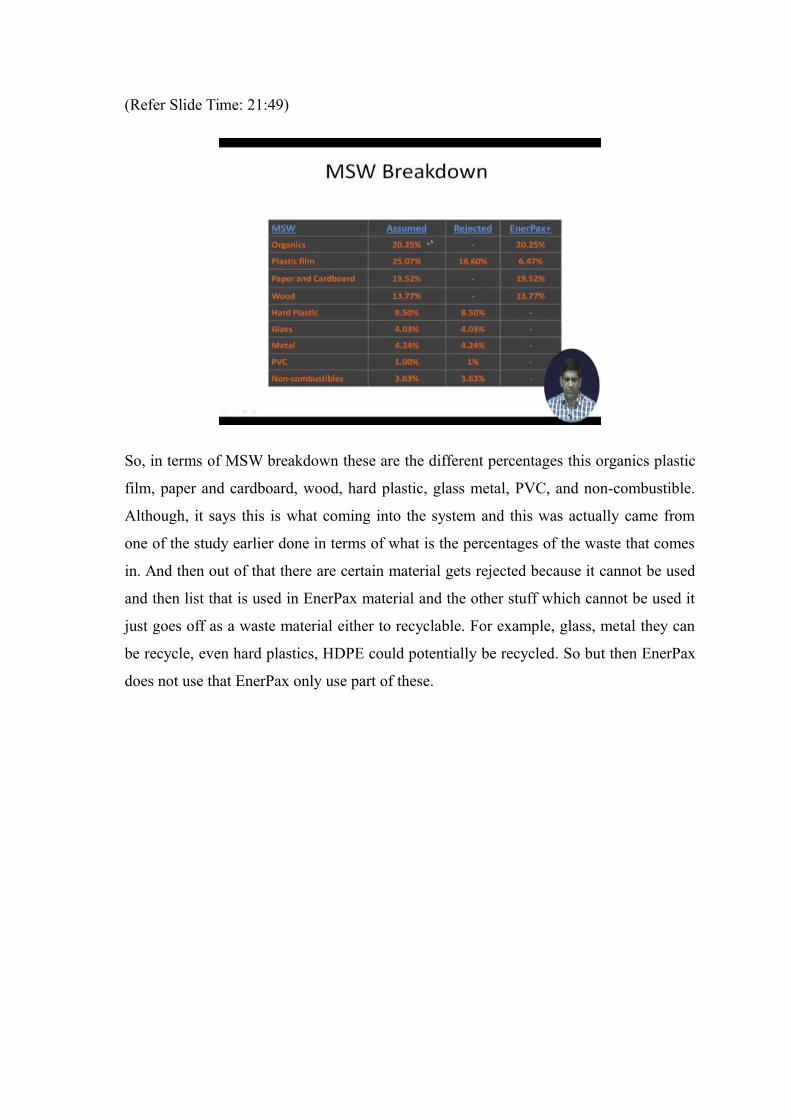
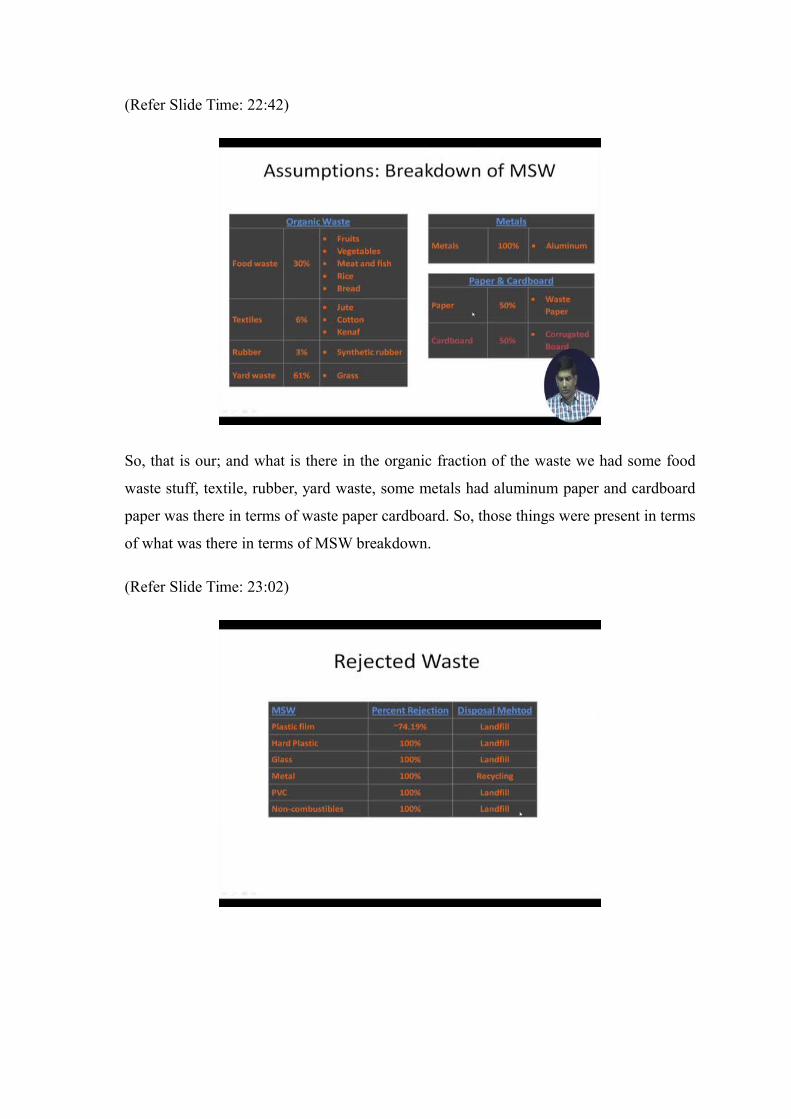
So, in terms of MSW breakdown these are the different percentages this organics plastic
film, paper and cardboard, wood, hard plastic, glass metal, PVC, and non-combustible.
Although, it says this is what coming into the system and this was actually came from
one of the study earlier done in terms of what is the percentages of the waste that comes
in. And then out of that there are certain material gets rejected because it cannot be used
and then list that is used in EnerPax material and the other stuff which cannot be used it
just goes off as a waste material either to recyclable. For example, glass, metal they can
be recycle, even hard plastics, HDPE could potentially be recycled. So but then EnerPax
does not use that EnerPax only use part of these.
(Refer Slide Time: 22:42)
So, that is our; and what is there in the organic fraction of the waste we had some food
waste stuff, textile, rubber, yard waste, some metals had aluminum paper and cardboard
paper was there in terms of waste paper cardboard. So, those things were present in terms
of what was there in terms of MSW breakdown.
(Refer Slide Time: 23:02)
(Refer Slide Time: 23:08)
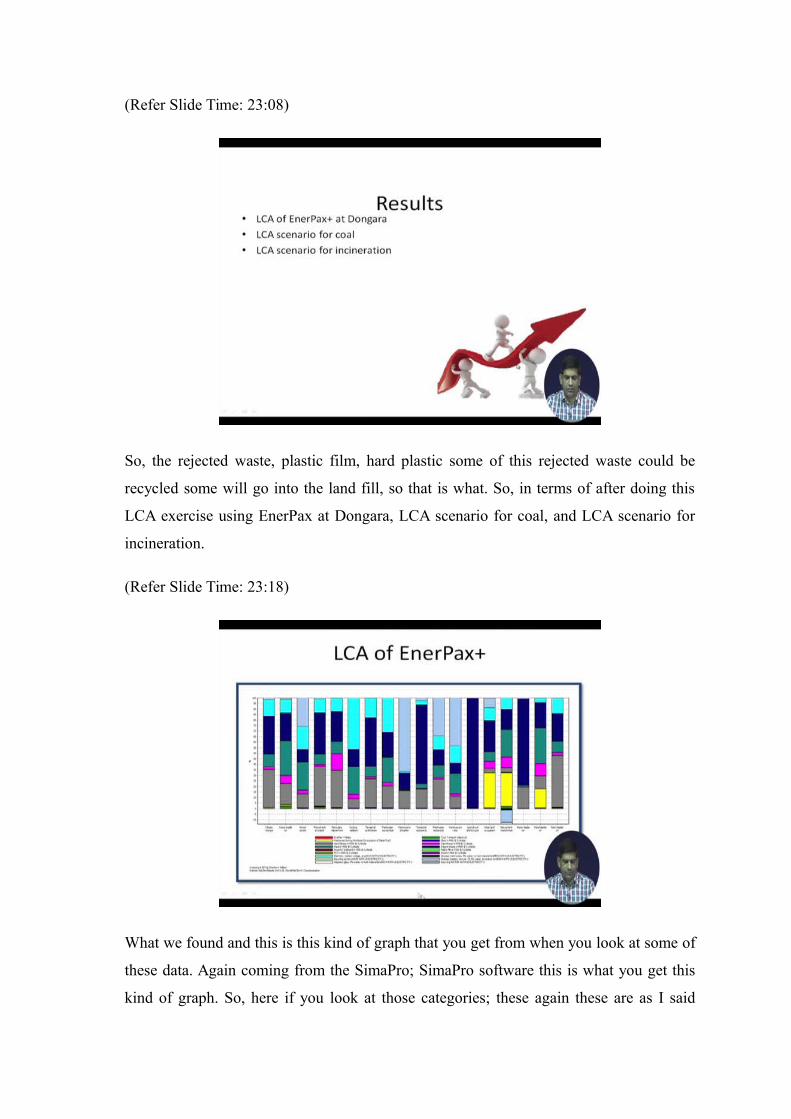
So, the rejected waste, plastic film, hard plastic some of this rejected waste could be
recycled some will go into the land fill, so that is what. So, in terms of after doing this
LCA exercise using EnerPax at Dongara, LCA scenario for coal, and LCA scenario for
incineration.
(Refer Slide Time: 23:18)
What we found and this is this kind of graph that you get from when you look at some of
these data. Again coming from the SimaPro; SimaPro software this is what you get this
kind of graph. So, here if you look at those categories; these again these are as I said
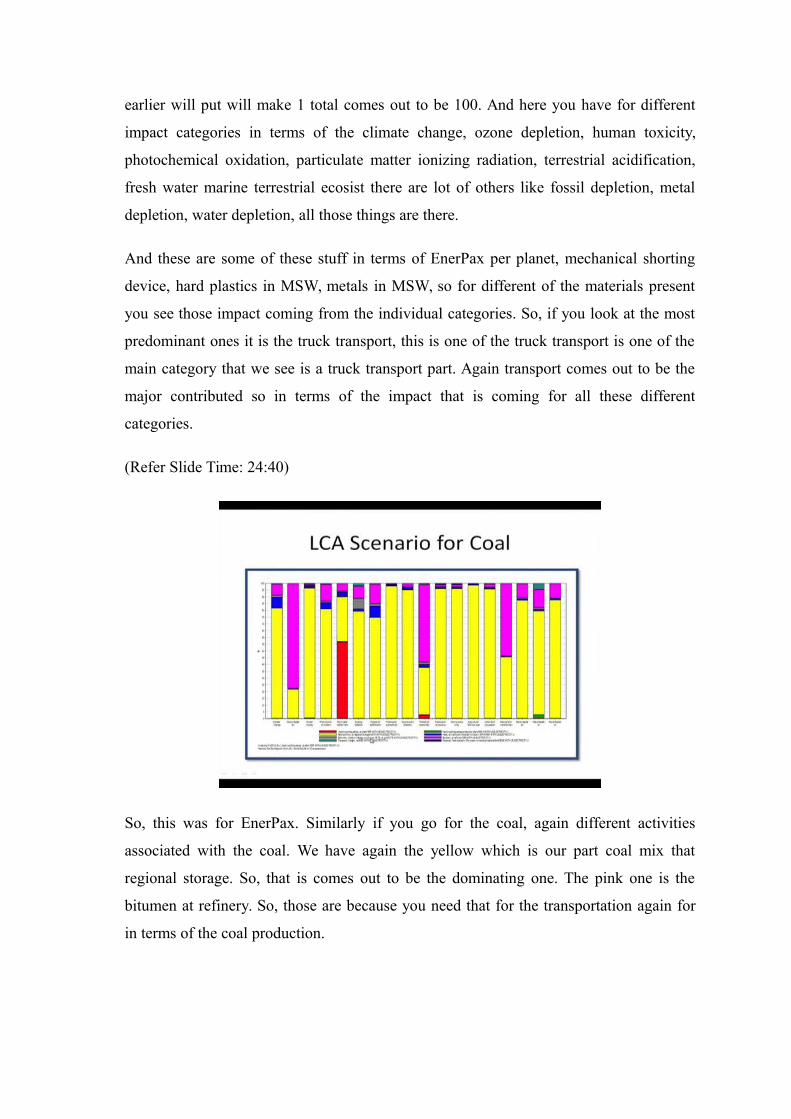
earlier will put will make 1 total comes out to be 100. And here you have for different
impact categories in terms of the climate change, ozone depletion, human toxicity,
photochemical oxidation, particulate matter ionizing radiation, terrestrial acidification,
fresh water marine terrestrial ecosist there are lot of others like fossil depletion, metal
depletion, water depletion, all those things are there.
And these are some of these stuff in terms of EnerPax per planet, mechanical shorting
device, hard plastics in MSW, metals in MSW, so for different of the materials present
you see those impact coming from the individual categories. So, if you look at the most
predominant ones it is the truck transport, this is one of the truck transport is one of the
main category that we see is a truck transport part. Again transport comes out to be the
major contributed so in terms of the impact that is coming for all these different
categories.
(Refer Slide Time: 24:40)
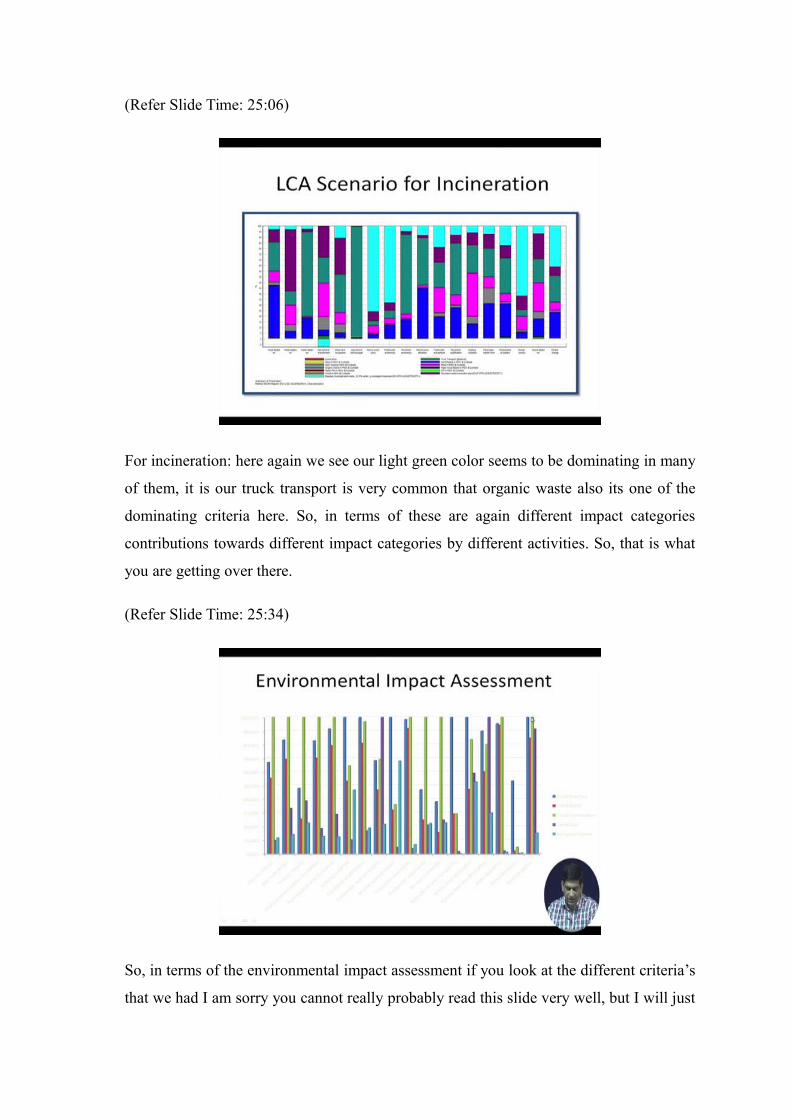
So, this was for EnerPax. Similarly if you go for the coal, again different activities
associated with the coal. We have again the yellow which is our part coal mix that
regional storage. So, that is comes out to be the dominating one. The pink one is the
bitumen at refinery. So, those are because you need that for the transportation again for
in terms of the coal production.
(Refer Slide Time: 25:06)
For incineration: here again we see our light green color seems to be dominating in many
of them, it is our truck transport is very common that organic waste also its one of the
dominating criteria here. So, in terms of these are again different impact categories
contributions towards different impact categories by different activities. So, that is what
you are getting over there.
(Refer Slide Time: 25:34)
So, in terms of the environmental impact assessment if you look at the different criteria’s
that we had I am sorry you cannot really probably read this slide very well, but I will just
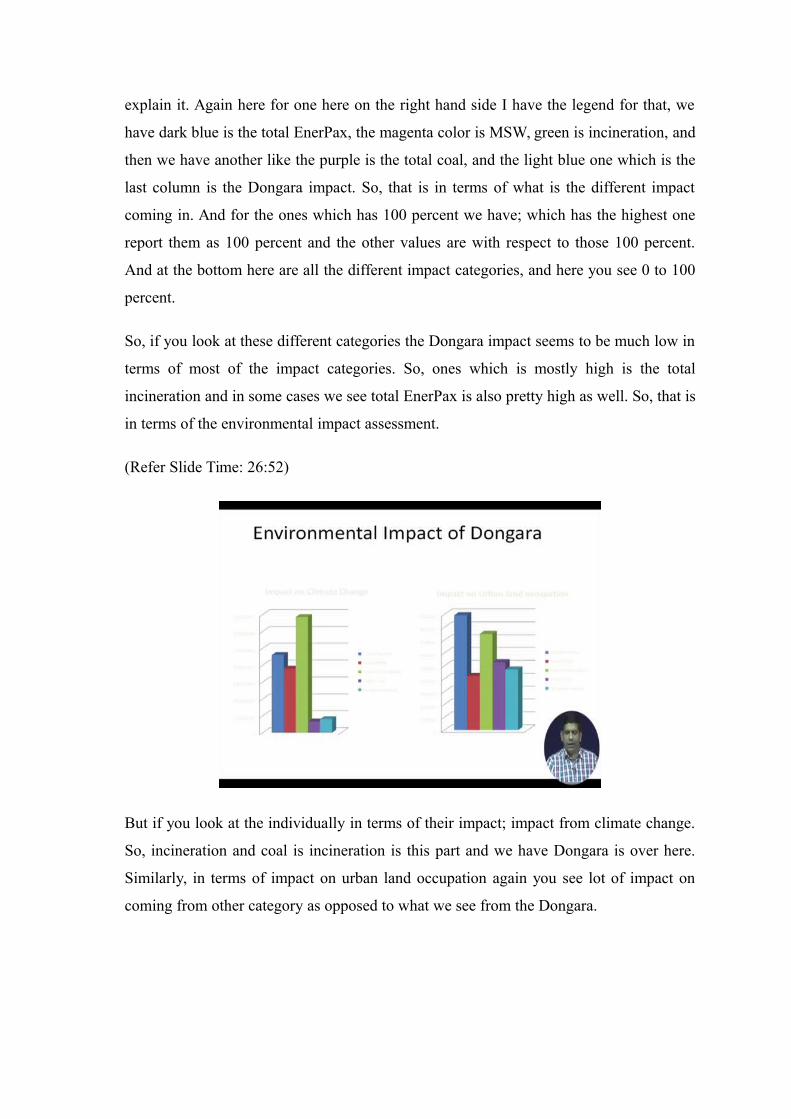
explain it. Again here for one here on the right hand side I have the legend for that, we
have dark blue is the total EnerPax, the magenta color is MSW, green is incineration, and
then we have another like the purple is the total coal, and the light blue one which is the
last column is the Dongara impact. So, that is in terms of what is the different impact
coming in. And for the ones which has 100 percent we have; which has the highest one
report them as 100 percent and the other values are with respect to those 100 percent.
And at the bottom here are all the different impact categories, and here you see 0 to 100
percent.
So, if you look at these different categories the Dongara impact seems to be much low in
terms of most of the impact categories. So, ones which is mostly high is the total
incineration and in some cases we see total EnerPax is also pretty high as well. So, that is
in terms of the environmental impact assessment.
(Refer Slide Time: 26:52)
But if you look at the individually in terms of their impact; impact from climate change.
So, incineration and coal is incineration is this part and we have Dongara is over here.
Similarly, in terms of impact on urban land occupation again you see lot of impact on
coming from other category as opposed to what we see from the Dongara.
(Refer Slide Time: 27:15)
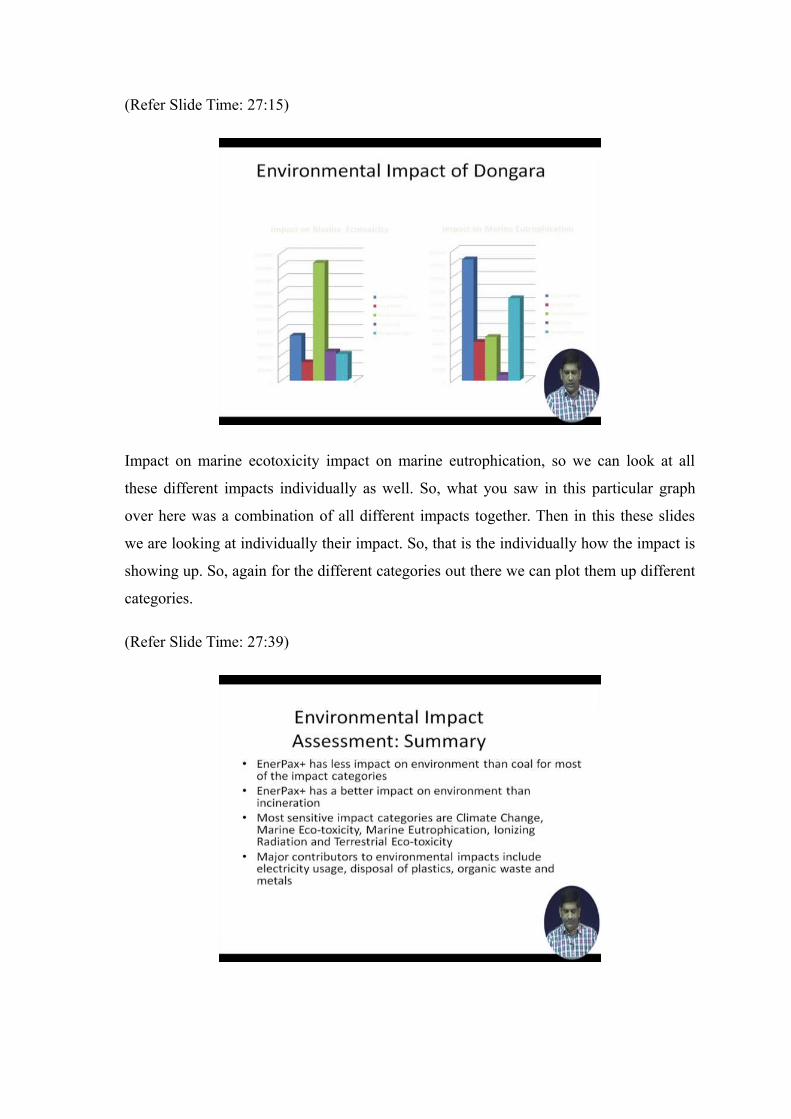
Impact on marine ecotoxicity impact on marine eutrophication, so we can look at all
these different impacts individually as well. So, what you saw in this particular graph
over here was a combination of all different impacts together. Then in this these slides
we are looking at individually their impact. So, that is the individually how the impact is
showing up. So, again for the different categories out there we can plot them up different
categories.
(Refer Slide Time: 27:39)
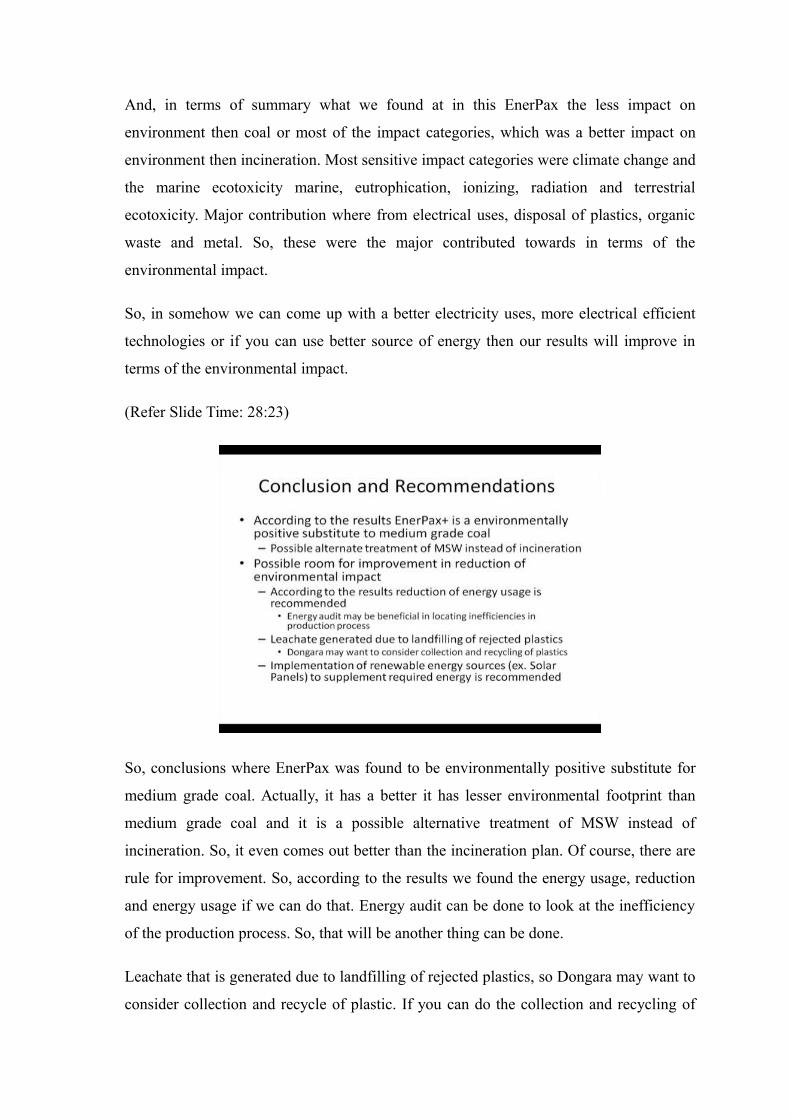
And, in terms of summary what we found at in this EnerPax the less impact on
environment then coal or most of the impact categories, which was a better impact on
environment then incineration. Most sensitive impact categories were climate change and
the marine ecotoxicity marine, eutrophication, ionizing, radiation and terrestrial
ecotoxicity. Major contribution where from electrical uses, disposal of plastics, organic
waste and metal. So, these were the major contributed towards in terms of the
environmental impact.
So, in somehow we can come up with a better electricity uses, more electrical efficient
technologies or if you can use better source of energy then our results will improve in
terms of the environmental impact.
(Refer Slide Time: 28:23)
So, conclusions where EnerPax was found to be environmentally positive substitute for
medium grade coal. Actually, it has a better it has lesser environmental footprint than
medium grade coal and it is a possible alternative treatment of MSW instead of
incineration. So, it even comes out better than the incineration plan. Of course, there are
rule for improvement. So, according to the results we found the energy usage, reduction
and energy usage if we can do that. Energy audit can be done to look at the inefficiency
of the production process. So, that will be another thing can be done.
Leachate that is generated due to landfilling of rejected plastics, so Dongara may want to
consider collection and recycle of plastic. If you can do the collection and recycling of
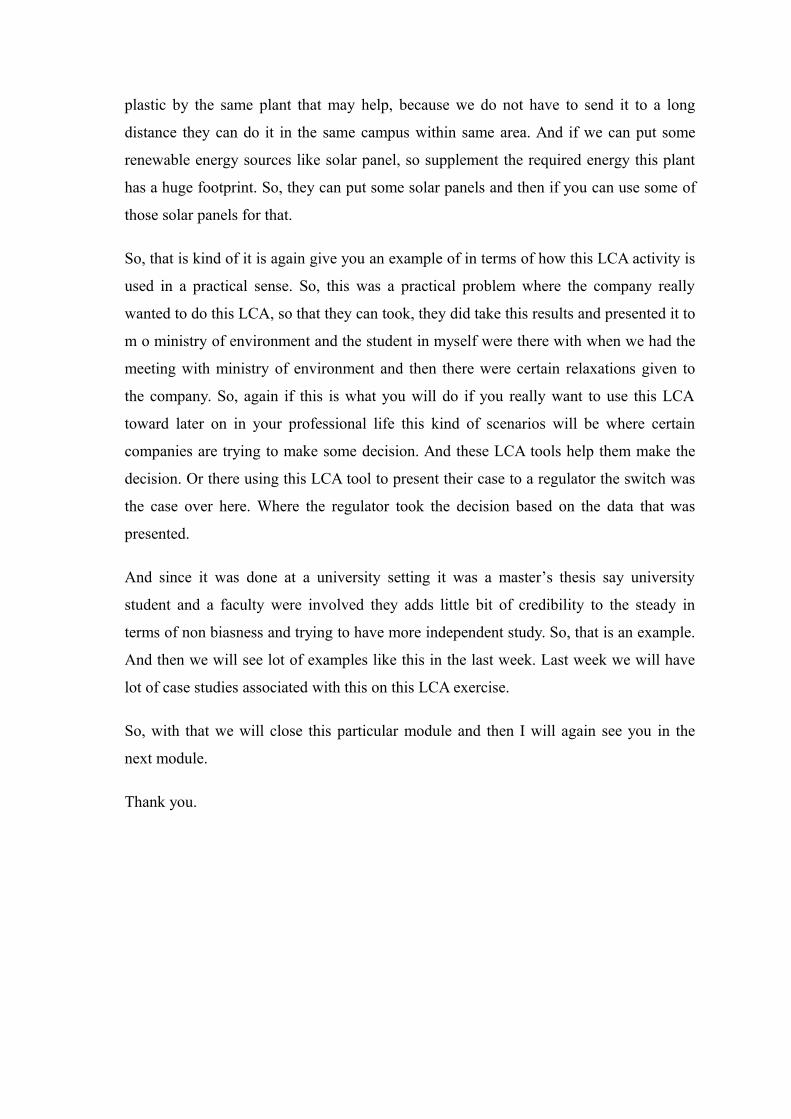
plastic by the same plant that may help, because we do not have to send it to a long
distance they can do it in the same campus within same area. And if we can put some
renewable energy sources like solar panel, so supplement the required energy this plant
has a huge footprint. So, they can put some solar panels and then if you can use some of
those solar panels for that.
So, that is kind of it is again give you an example of in terms of how this LCA activity is
used in a practical sense. So, this was a practical problem where the company really
wanted to do this LCA, so that they can took, they did take this results and presented it to
m o ministry of environment and the student in myself were there with when we had the
meeting with ministry of environment and then there were certain relaxations given to
the company. So, again if this is what you will do if you really want to use this LCA
toward later on in your professional life this kind of scenarios will be where certain
companies are trying to make some decision. And these LCA tools help them make the
decision. Or there using this LCA tool to present their case to a regulator the switch was
the case over here. Where the regulator took the decision based on the data that was
presented.
And since it was done at a university setting it was a master’s thesis say university
student and a faculty were involved they adds little bit of credibility to the steady in
terms of non biasness and trying to have more independent study. So, that is an example.
And then we will see lot of examples like this in the last week. Last week we will have
lot of case studies associated with this on this LCA exercise.
So, with that we will close this particular module and then I will again see you in the
next module.
Thank you.
![lec27-wrapupeecs151/sp21/files/lec27... · 2021. 4. 29. · *In 2012, IBM produced a sub-10 nm carbon nanotube transistor that outperformed silicon on speed and power. [15] "The](https://img.pdfslide.net/doc/110x75/614860bf2918e2056c22a621/lec27-wrapup-eecs151sp21fileslec27-2021-4-29-in-2012-ibm-produced.jpg)