Embed Size (px)
Citation preview
CIBSE Technical Symposium, Edinburgh, UK 14-15 April 2016
Page 1 of 13
Life Cycle Cost of Mechanical and Electrical Services HANIYEH MOHAMMADPOURKARBASI BSC,MSC,PHD Beverley Clifton Morris and Liverpool John Moores University [email protected] DIANNE MARSH BSC,MSC Liverpool John Moores University [email protected] ALEX PITMAN BSC Beverley Clifton Morris [email protected]
Abstract This paper details results from Life Cycle Cost (LCC) assessment of Mechanical and Electrical (M&E) services of a new build school project in Manchester. Building Information Modelling (BIM), Dynamic Simulation Modelling (DSM) and Building Cost Information Service (BCIS) running cost tools were employed to estimate the incurred costs over the life of the school and the LCC of different design specification options for lighting. Results indicate that the operational cost of M&E services is twice that of the capital expenditure and operational costs (energy, maintenance and replacement costs) contribute approximately 67% of the whole life value of the project. It also demonstrates how Construction 2025’s 33% cost reduction target is achievable by spending only 6% more on M&E capital expenditure.
Keywords Life Cycle Cost, Mechanical and Electrical Services, Building
Information Modelling, Operational costs, Whole Life Value
1.0 Introduction
1.1 Construction 2025 Preceding Construction 2025, Latham (1994), Egan (1998), and Wolstenholme (2009) identified problems within the construction industry (1; 2; 3). The Government Construction Strategy 2011 first identified BIM as a potential solution to the industries problems and encouraged the industry to embrace the new technology and processes to help reduce cost and waste, create greater links between the design and construction phases, and more importantly explore the full potential of using BIM in asset management (4). Whilst some improvements in the industry have been observed the Government are of the opinion that the change has not been radical enough.
In July 2013 the Government released the Construction 2025 Strategy shaped by government and industry in partnership, providing a long term global vision of the industry, complete with new industry targets.
33% reduction in the initial cost of construction and the whole-life costs of built assets.
50% reduction in the overall time, from inception to completion, for newbuild and refurbished assets.

CIBSE Technical Symposium, Edinburgh, UK 14-15 April 2016
Page 2 of 13
50% reduction in greenhouse gas emissions in the built environment.
50% reduction in the trade gap between total exports and total imports for construction products and materials.
The vision was for construction to be at “the heart of our future low carbon, resource efficient, modern and globally competitive economy” and was dependant on having a skilled, motivated and diverse workforce. With the global construction industry expected to grow by over 70% by 2025, the UK Government hopes to use new opportunities to help boost the economic recovery (5). The three strategic priorities identified to underpin this vison are:
Smart construction and digital design,
Low carbon and sustainable construction,
Improved trade performance.
1.2 Life Cycle Costing These targets and strategies cause many industry participants to direct their attention to LCC with the possibility of reducing costs through the life of the building, as opposed to construction costs, with an emphasis on Operational Expenditure (OPEX) not Capital Expenditure (CAPEX).
Whole Life Cycle Costing (WLCC) is a powerful tool for calculating the lowest cost options for the entire commercial life of a building. It encourages the use of best value building designs and reduces the costs and disruption of unplanned repairs and maintenance.
Knowledge of a building's costs over its full life span is important in achieving best value from both the capital costs of constructing the building, and the related ongoing costs of operating it. WLCC helps you to make well informed design decisions, and to select the most suitable building materials, components and systems.
1.3 M&E contribution to LCC There is much debate about the typical value of building services installation in comparison to the overall cost of a construction project. But what costs are to be considered is it initial costs or whole life costs, as the results could vary considerably? The range and complexity of services installations have increased in recent years as demand has grown for intelligently operated environments, driving innovation to reduce carbon emissions, improve occupier comfort and extend building performance.
High levels of investment in public sector facilities such as those for Building Schools for the Future (BSF), which emphasise low running costs and occupier productivity and comfort, have supported the achievement of Construction 2025 targets. Stringent Building Regulations require holistic solutions which in turn require greater integration between the design and installation of the building envelope and the building services. There is therefore the opportunity to reduce energy demand and carbon emissions by smart design and installation and hence to reduce the whole life costs of a project by considering lifecycle costs of its building services.
2.0 Case study building Managing down back office and running costs such as energy or premises in public buildings through improved procurement practices and a greater focus on value for money has become one of the core government issues to tackle sustainability

CIBSE Technical Symposium, Edinburgh, UK 14-15 April 2016
Page 3 of 13
challenges. Accordingly, in June 2013, the Department for Education commissioned a review report of efficiency in the schools in England to support schools in securing value for money in public spending (6). In addition, based on research carried out by BCIS Building Running Costs Online (BRCOL), on average the operational expenditure of typical schools is 2.5 times higher than the capital costs (7).
Life Cycle Cost (LCC) assessment of a project is therefore essential to the sustainability equation, to create efficiencies throughout the building life and to change the approach of public bodies to procuring construction projects. Consequently, the LCC of M&E services of a two storey new build school in Manchester at Design Stage 2 (formerly RIBA Stage C) has been presented in this paper (See Figure 1).
Figure 1- The case study school as modelled in Revit
The case study school has 5133 m2 net internal area (NIA) and houses 767 pupils. The design meet the Building Regulations requirements and has been certified the EPC rating of A. Further details of the building as modelled are given in Table 1 and Table 2.
Building Characteristic New Built School
Location NorthWest
NIA m2 5133
EPC rating A25
CO2 Reduction over Part L 23%
Airtightness 5 m3/hr@50pa
Ventilation Air conditioning
Heating Gas boiler to radiators and heat
recovery system
Hot water From boiler
Lighting Fluorescent lighting
Table 1- Details of the modelled case study school (source: BCM)
CIBSE Technical Symposium, Edinburgh, UK 14-15 April 2016
Page 4 of 13
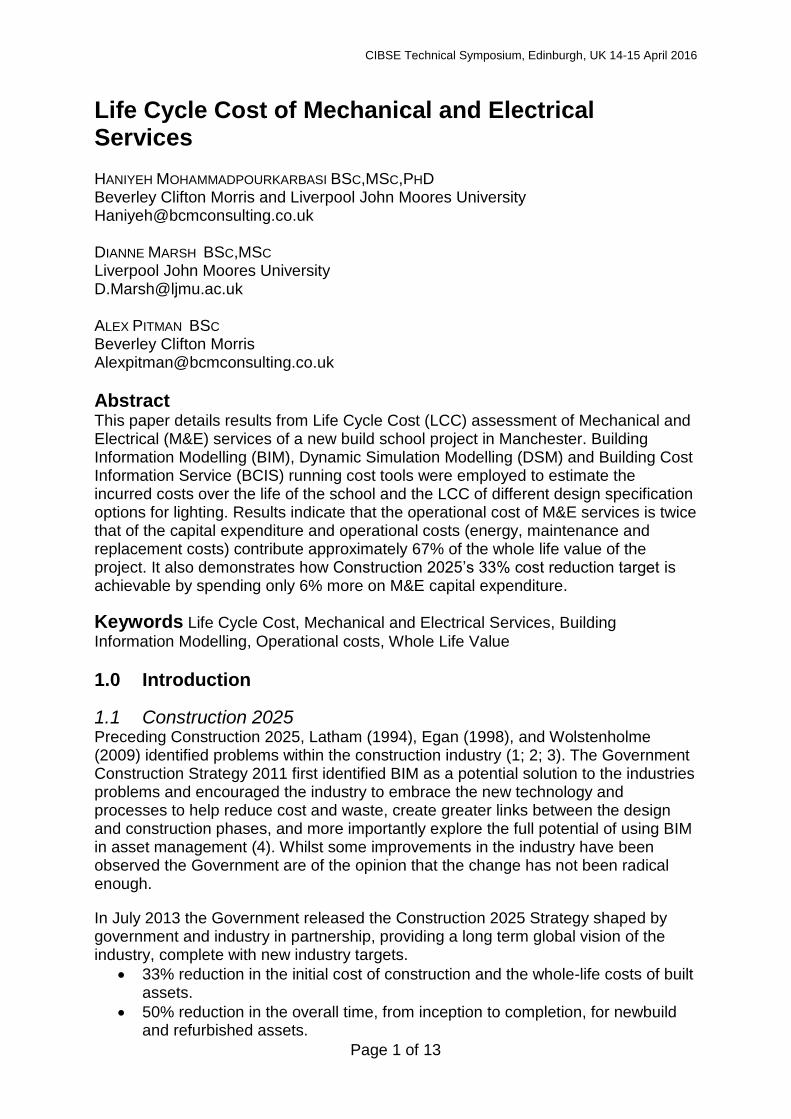
Thermal Elements and Openings U-Value (W/m2K)
Roof 0.16
Walls 0.19
Floors 0.25
Windows 1.82
Doors 1.58
Table 2 - Modelled construction U-values (source: BCM)
3.0 Methods, Definitions and Scope of Analysis
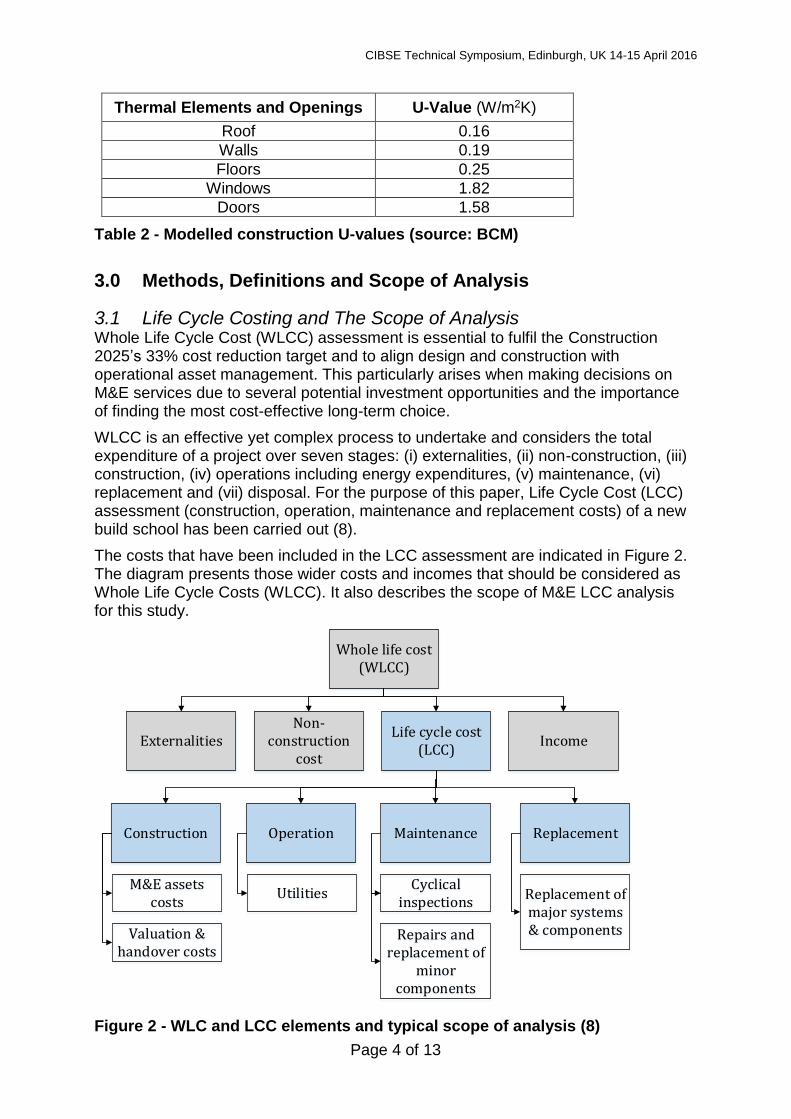
3.1 Life Cycle Costing and The Scope of Analysis Whole Life Cycle Cost (WLCC) assessment is essential to fulfil the Construction 2025’s 33% cost reduction target and to align design and construction with operational asset management. This particularly arises when making decisions on M&E services due to several potential investment opportunities and the importance of finding the most cost-effective long-term choice.
WLCC is an effective yet complex process to undertake and considers the total expenditure of a project over seven stages: (i) externalities, (ii) non-construction, (iii) construction, (iv) operations including energy expenditures, (v) maintenance, (vi) replacement and (vii) disposal. For the purpose of this paper, Life Cycle Cost (LCC) assessment (construction, operation, maintenance and replacement costs) of a new build school has been carried out (8).
The costs that have been included in the LCC assessment are indicated in Figure 2. The diagram presents those wider costs and incomes that should be considered as Whole Life Cycle Costs (WLCC). It also describes the scope of M&E LCC analysis for this study.
Whole life cost (WLCC)
ExternalitiesNon-
construction cost
Life cycle cost (LCC)
Income
Construction Operation Maintenance Replacement
M&E assets costs
Utilities
Valuation & handover costs
Cyclical inspections
Repairs and replacement of
minor components
Replacement of major systems & components
Figure 2 - WLC and LCC elements and typical scope of analysis (8)

CIBSE Technical Symposium, Edinburgh, UK 14-15 April 2016
Page 5 of 13
Equation 1 shows that the Life Cycle Cost is defined as (9)
Equation 1 - Life Cycle Cost
𝐿𝐶𝐶 = 𝐼𝐶 + ∑𝑂𝐶𝑡
(1 + 𝑟)𝑡
𝑁
𝑡=1
where:
LCC = Life Cycle Cost (£),
IC = Total Initial Cost (£),
∑= Sum over the lifetime, from year 1 to year N, where N = lifetime of appliance (years),
OCt = Operating Cost (£): Utility costs + Maintenance costs + Replacement costs,
r = Discount rate,
t = Year for which operating cost is being determined.
3.2 Total Initial Costs (IC) of M&E services M&E expenditure contributes to approximately 40-60% of total construction costs in non-residential buildings and therefore detailed M&E cost estimation is an integral part of budgeting and tendering in any construction project (10).
On the other hand, Quantity Surveyors (QS) have acknowledged two major challenges in estimating capital expenditure (CAPEX) of M&E services. Firstly, QS insufficient skill in M&E technology – due to the complexity of building services in modern buildings – does not allow them to carry out a detailed breakdown of costs (Yusuf, et al., 2013). Secondly, QS argue that as much as 80% of the time needed to create a cost estimate is spent just on quantification (11). To tackle the aforementioned challenges, BIM models which offer visualisation to aid the understanding and estimation of M&E design and BIMMeasure – a quantity take off tool – have been applied to generate the take-offs, counts and measurements directly from the underlying model.
In addition, a wide range of cost information can be gathered for an M&E component from different databases and therefore benchmarking the estimated costs is indispensable to validate the costs. For this research the lighting costs are obtained from the manufacturer but other costs have been drawn from Spon’s Mechanical and Electrical price book (12). The costs are then benchmarked using cost data available in BCIS Building Running Costs Online (BRCOL) (7). The construction costs (material and labour) for building services including (i) Space heating and Hot water, (ii) Air conditioning and Ventilation, (iii) Electrical installation, Fire and security system and (iv) Lighting – in this school totalled £370/m2. The cost breakdown of M&E services can be seen in Table 3.

CIBSE Technical Symposium, Edinburgh, UK 14-15 April 2016
Page 6 of 13
Item Estimated Material and Labour
Costs (Source: BCM’s Revit Model) £/m2
Space Heating and Hot Water 66
Air Conditioning and Ventilation 59
Electrical Installation, Fire and Security System
139
Lighting 106
Total 370
Table 3 - The cost breakdown of M&E services in the case study school
3.3 Operational Costs (OCt) of M&E services The processes adopted during the in-use life phase (Energy use, Maintenance and Replacement) are important factors, since a significant proportion of the impact of the building occurs after the construction and installation of systems. These operational costs are sensitive to various factors, mainly the inflation rate and the assumed discount rates.
3.3.1 Energy Modelling and Utility Costs The design of building services has a key role to play in reducing energy costs of the building in use. The calculation of energy costs is based on the annual utility usage, the cost of which is sensitive to various factors (mainly fuel prices). Computer-based modelling and simulation is commonly held to be best practice not only for estimating the operational energy performance of buildings at the design stage, but also for predicting its future performance. However, there are significant contradictions between simulated results and real outcomes in most cases. Therefore, selecting a reliable tool for this analysis is key to reducing this discrepancy.
To address this significant “performance gap” TAS – Dynamic Thermal Simulation Modelling (DSM) software – was selected for modelling and evaluating the future performance of the case study school. Schedule and occupancy definition options in the software allow users to, (i) produce more accurate models (ii) model and simulate advanced building systems, (iii) define components in great detail, (iv) present flexible results due to its ability to switch between zones, (v) account for seasonal conditions, and (vi) produce annual and sub-hourly results (13). The simulation was run using the current CIBSE Test Reference Year (TRY) weather file for Manchester and Table 4 shows predicted energy demand and energy costs for the first year of running the building.

CIBSE Technical Symposium, Edinburgh, UK 14-15 April 2016
Page 7 of 13
Item/Unit kWh kWh/m2 Type of
Fuel
Energy Costs Year
1 (£)
Ventilation 28705 5.6 Electricity 3731.77
Fluorescent Lighting 75010 14.6 Electricity 9751.32
Heating and Hot Water 59029.5 11.5 Gas 2361.18
Electrical Services 122970 23.9 Electricity 15986.12
Table 4 – Energy demands and energy costs on the first year of running the building (Source: BCM TAS model)
3.3.2 Energy Prices and Energy Costs Over 60 Years Undoubtedly, it is inherently difficult to predict life time energy costs due to unpredictable future fuel prices. In reality, energy prices will not remain constant over time. However, historic data can be used to adjust this uncertainty and predict a range of probable future fuel prices (14; 15) . To predict future fuel prices, 30 years (1984-2014) of gas and electricity price indices (The percentage for escalation) datasets have been drawn from BCIS historic data (7). Figure 3 presents the predicted Heating and Hot Water energy costs for 20 years. Please note that the presented costs in Figure 3 are not discounted. However, discounted costs are used for LCC assessment.
Figure 3 - Predicted Heating and Hot Water energy costs over 20 years
3.3.3 Maintenance Costs When preparing order of cost estimates and elemental LCC, measuring cyclical inspections, minor repairs and annual maintenance of building components are crucial. New Rules of Measurements 3 (NRM3) published by Royal Institution of Chartered Surveyors (RICS) deals with preparation of maintenance as well as replacement costs (16). In addition, CIBSE Guide M, which provides detailed maintenance requirements along with the frequency of the required statutory and operational inspection has been used for estimating the maintenance costs of M&E services for this case study school (17).
£k
£1k
£1k
£2k
£2k
£3k
£3k
£4k
£4k
0 1 2 3 4 5 6 7 8 9 10 11 12 13 14 15 16 17 18 19 20
£
Years

CIBSE Technical Symposium, Edinburgh, UK 14-15 April 2016
Page 8 of 13
Table 5 demonstrates the required statutory inspections and frequency of them during 60 years of a building’s life. As these inspections will be done in the future, a discount rate has been considered when adding them to the operational cost of the school (see section 3.3.5 for more details on discount rate). The prevailing market rate of £250 per day has been used for these basic inspection costs.
Maintenance Action Required Frequency Inspection By
Type of Inspection
Fire detection and alarm systems-Inspect and Test
12 monthly Accredited company/ competent
person
Statutory
Sprinkler protection systems, Wet system, Dry system, pre-engaged fire
pumps
12 monthly Accredited company/ competent
person
Statutory
Thorough inspection and test and electrical installation condition report
60 monthly Competent person
Statutory
Provision of written scheme of examination
26 monthly Competent person
Statutory
The continued operation of emergency lighting is imperative and testing is required to ensure it remains in a
serviceable condition. Logbook record required
12 monthly
Competent person
Statutory
AC system inspection and certification greater than 12 kW cooling load
60 monthly
Accredited person
Statutory
Table 5 - Required statutory inspections and their required frequency
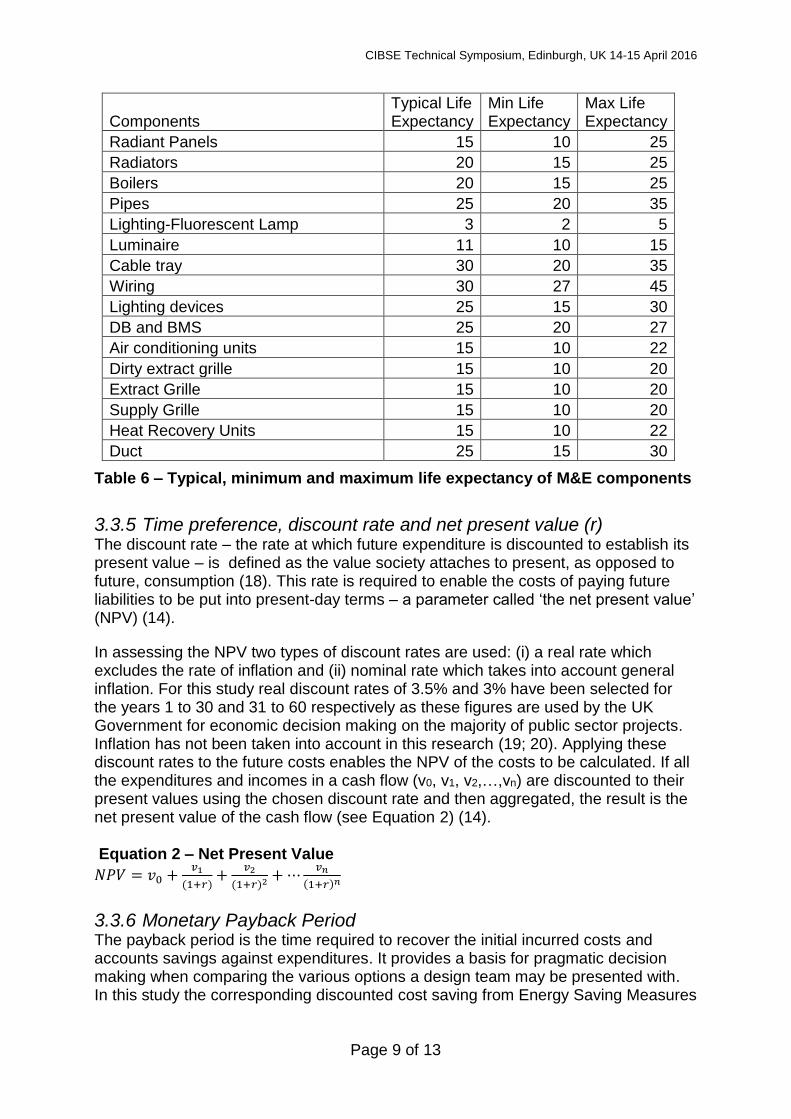
3.3.4 Replacement costs For economic evaluation over the life cycle of a building, incorporating the building components’ life expectancy is necessary. Due attention to this factor is even more crucial for building services as M&E services have a much shorter life expectancy when compared to other building components. BCIS has carried out a survey based on the experience of building surveyors. Surveyors were asked for the typical range of life expectancies for the components, and the findings of the survey were published in The Life Expectancy of Building Components, which is available in the Component Life module of the BCIS Building Running Costs Online (BRCOL) (7).
Minimum, maximum and typical life expectancy of some of the selected building services elements are presented in Table 6. Typical life expectancy has been considered for this analysis. Please note that the typical life expectancy of boilers is based on historically installed cast iron and steel boilers. This will not hold true where value engineering and weak specifications allow contractors to install low water content boilers with aluminium heat exchangers whose shorted life expectancy will affect the life cycle costings.
CIBSE Technical Symposium, Edinburgh, UK 14-15 April 2016
Page 9 of 13
Components Typical Life Expectancy
Min Life Expectancy
Max Life Expectancy
Radiant Panels 15 10 25
Radiators 20 15 25
Boilers 20 15 25
Pipes 25 20 35
Lighting-Fluorescent Lamp 3 2 5
Luminaire 11 10 15
Cable tray 30 20 35
Wiring 30 27 45
Lighting devices 25 15 30
DB and BMS 25 20 27
Air conditioning units 15 10 22
Dirty extract grille 15 10 20
Extract Grille 15 10 20
Supply Grille 15 10 20
Heat Recovery Units 15 10 22
Duct 25 15 30
Table 6 – Typical, minimum and maximum life expectancy of M&E components
3.3.5 Time preference, discount rate and net present value (r) The discount rate – the rate at which future expenditure is discounted to establish its present value – is defined as the value society attaches to present, as opposed to future, consumption (18). This rate is required to enable the costs of paying future liabilities to be put into present-day terms – a parameter called ‘the net present value’ (NPV) (14).
In assessing the NPV two types of discount rates are used: (i) a real rate which excludes the rate of inflation and (ii) nominal rate which takes into account general inflation. For this study real discount rates of 3.5% and 3% have been selected for the years 1 to 30 and 31 to 60 respectively as these figures are used by the UK Government for economic decision making on the majority of public sector projects. Inflation has not been taken into account in this research (19; 20). Applying these discount rates to the future costs enables the NPV of the costs to be calculated. If all the expenditures and incomes in a cash flow (v0, v1, v2,…,vn) are discounted to their present values using the chosen discount rate and then aggregated, the result is the net present value of the cash flow (see Equation 2) (14). Equation 2 – Net Present Value
𝑁𝑃𝑉 = 𝑣0 +𝑣1
(1+𝑟)+
𝑣2
(1+𝑟)2 + ⋯𝑣𝑛
(1+𝑟)𝑛
3.3.6 Monetary Payback Period The payback period is the time required to recover the initial incurred costs and accounts savings against expenditures. It provides a basis for pragmatic decision making when comparing the various options a design team may be presented with. In this study the corresponding discounted cost saving from Energy Saving Measures
CIBSE Technical Symposium, Edinburgh, UK 14-15 April 2016
Page 10 of 13
(ESM) was added to the initial annual costs and the cumulative cash flow for the different options was compared to a typical Part L building.
4.0 Results
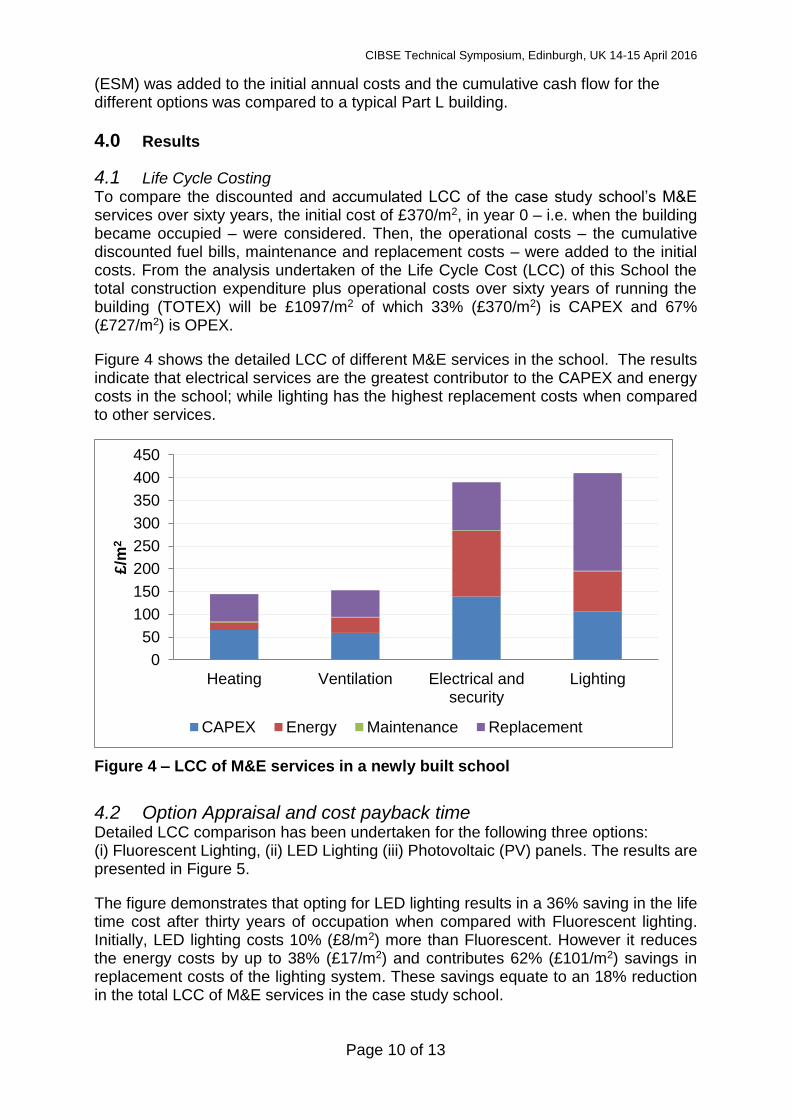
4.1 Life Cycle Costing To compare the discounted and accumulated LCC of the case study school’s M&E services over sixty years, the initial cost of £370/m2, in year 0 – i.e. when the building became occupied – were considered. Then, the operational costs – the cumulative discounted fuel bills, maintenance and replacement costs – were added to the initial costs. From the analysis undertaken of the Life Cycle Cost (LCC) of this School the total construction expenditure plus operational costs over sixty years of running the building (TOTEX) will be £1097/m2 of which 33% (£370/m2) is CAPEX and 67% (£727/m2) is OPEX.
Figure 4 shows the detailed LCC of different M&E services in the school. The results indicate that electrical services are the greatest contributor to the CAPEX and energy costs in the school; while lighting has the highest replacement costs when compared to other services.
Figure 4 – LCC of M&E services in a newly built school
4.2 Option Appraisal and cost payback time Detailed LCC comparison has been undertaken for the following three options: (i) Fluorescent Lighting, (ii) LED Lighting (iii) Photovoltaic (PV) panels. The results are presented in Figure 5.
The figure demonstrates that opting for LED lighting results in a 36% saving in the life time cost after thirty years of occupation when compared with Fluorescent lighting. Initially, LED lighting costs 10% (£8/m2) more than Fluorescent. However it reduces the energy costs by up to 38% (£17/m2) and contributes 62% (£101/m2) savings in replacement costs of the lighting system. These savings equate to an 18% reduction in the total LCC of M&E services in the case study school.
0
50
100
150
200
250
300
350
400
450
Heating Ventilation Electrical andsecurity
Lighting
£/m
2
CAPEX Energy Maintenance Replacement

CIBSE Technical Symposium, Edinburgh, UK 14-15 April 2016
Page 11 of 13
Comparison of cost savings from PV panels over twenty five years of running the building (when the panels need to be replaced) shows that PV panels can deliver a 22% (£40/m2) cost saving over 25 years. Replacement costs of PV inverters are also included in this analysis.
Figure 5 – Option appraisal for LED Lighting and PV
Figure 6 illustrates the time needed to recover the additional initial costs spent on energy efficient options. The cumulative cash flow of the LED lighting option scenario shows that an initial extra cost of £42,700 will result in a payback time of less than four years. Installation of 230 m2 PV panels on the south roof of the school will initially cost around £50K – from which energy generated from the panels and savings from Feed in Tariff (FiT) will reduce the electricity costs dramatically, resulting in a payback time of less than seven years.
Figure 6 – cost payback time of energy saving options
-£100
-£50
£0
£50
£100
£150
£200
£250
£300
Fluorescent LED PV+FiT
CAPEX OPEX 30 Yrs
-£100k
-£50k
£k
£50k
£100k
£150k
£200k
£250k
£300k
£350k
£400k
1 2 3 4 5 6 7 8 9 10 11 12 13 14 15 16 17 18 19 20
LED PV-Saving and Earning

CIBSE Technical Symposium, Edinburgh, UK 14-15 April 2016
Page 12 of 13
5.0 Conclusion
The Government’s construction strategy – ‘Construction 2025’ - set a target of 33% reduction in construction and whole life costs. In order to achieve this target, creating efficiencies throughout the building life and the construction stage, Life Cycle Cost (LCC) assessment of a project is essential. Mechanical and Electrical (M&E) services contribute significantly to the whole building’s capital expenditure, and the majority of operational, maintenance and replacement costs. This means they play a vital role in determining a building’s sustainability and reducing running costs.
This paper provided an analysis of the detailed results from LCC assessment of M&E services (Lighting, Electricity, Heating and Ventilation) of a new-build school project in Manchester. BIM, DSM and BCIS running cost tools were employed to estimate the incurred costs over the life of the case study school.
Results indicate that the operational cost of M&E services is twice that of the capital expenditure. The total life cycle expenditure of a school is £1097/m2 of which 33% is capital and 25% energy costs. Maintenance and replacement costs contribute approximately 42% of the whole life value of the project.
In addition, a comparison LCC and payback analysis was undertaken for LED lighting and PV panels. The outcome suggested that opting for more efficient lighting system and installing renewables can significantly improve the LCC of the building. A 36% reduction in Lighting LCC can be achieved by replacing Fluorescent lighting with LED lighting - equivalent to an 18% cost reduction in total M&E services costs.
In addition, a 22% cost reduction obtained by installing PV panels is equivalent to 15% cost reduction in total M&E services costs. As a result, Construction 2025’s 33% cost reduction target was achieved by spending 6% more on M&E CAPEX.
LCC payback time analysis in this research revealed that LCC can provide a business case for energy efficient investment and will help investors, particularly owner-operators and public sector clients, to achieve best long-term value from their projects with a payback time of less than ten years.
However, to deliver long-term efficiency and benefits to whole-life costs there is a need for collaboration and early engagement with all the design team, including the Facilities Management (FM) team and manufacturers of mechanical and electrical equipment. This new convergence of technology presents the UK construction industry with significant challenges to change the way buildings are procured, yet a plethora of opportunities for efficiency, sustainability and economic growth from the savings realised.
References (1) Egan, J. Rethinking construction: the report of the construction task force (The Egan
Report). London : Department of the Environment, Transport and the Regions, 1998.
(2) Latham, M. Constructing the Team, Final Report of the Joint Government/Industry.
London : s.n., 1994. (3) Wolstenhome , A. Never Waste a Good Crisis A Review of Progress since Rethinking
Construction and Thoughts for Our Future Constructing Excellence. London : Constructing
Excellence, October 2009 .
(4) Cabinet Office. Government Construction Strategy. s.l. : Cabinet office, 2011.

CIBSE Technical Symposium, Edinburgh, UK 14-15 April 2016
Page 13 of 13
(5) HM Government. Construction 2025. s.l. : HM Government, 2013.
(6) Department for Education. Review of efficiency in the school systems. s.l. : Department
for Education, 2013.
(7) RICS. BCIS Building Running Costs Online. Online tool : RICS, 2015.
(8) BSI. Guide for life cycle costing of maintenance during the in use phases of buildings.
s.l. : BSI Standards Limited 2013, 2013.
(9) Task Group 4. Life Cycle Costs in Construction; In LCC as a contribution to sustainable
construction – Final. s.l. : Davis Langdon Management Consulting, 2003. p. 4. ISO 15686.
(10) Factors Inhibiting the Adoption of a Uniform Pricing Mechanism for Building Services.
Yusuf, Ganiyu Amuda, Mohamed, Sarajul Fikri and Remeli, Suhaila Binti. 3, 2013,
International Journal of Engineering Business Management, Vol. 5.
(11) Rundell, Rick. 1-2-3 Revit: BIM and Cost Estimating, Part 1. [Online] 7 August 2006.
[Cited: 04 December 2015.] http://www.cadalyst.com/cad/building-design/1-2-3-revit-bim-
and-cost-estimating-part-1-3350.
(12) Davis Langdon . SPON'S Mechanical and Electrical Services Price Book. 45. Oxon :
Taylor and Francis, 2014.
(13) EDSL TAS. EDSL TAS. [Online] 2015. [Cited: 04 December 2015.]
http://www.edsl.net/main/Software.aspx.
(14) Ellingham and Fawcett. The option to refurbish. in new generation of whole life
costing: property and construction decission making under uncertainty. London : Talor and
Francis, 2006, pp. 140-141.
(15) Mohammadpurkarbasi, Haniyeh. The eco-refurbishment of a 19th century terraced
house : energy, carbon and cost performance for current and future UK climates. Liverpool :
University of Liverpool, 2015.
(16) RICS. RICS new rules of measurement. 1. London : Royal Institute of Charted Surveyors
(RICS), 2014.
(17) CIBSE. CIBSE Guide M. London : The Chartered Institution of Building (CIBSE), 2008.
(18) Hanton, A. [Online] December 2010. [Cited: 1 Jun 2014.]
http://www.storage.co.uk/downloads/a-small-number.pdf.
(19) HM Treasury. Green book. [Online] 2011. www.hm-
treasury.gov.uk/d/green_book_complete.pdf.
(20) Davis Langdon. Life Cycle Costing (LCC) as a contribution to sustainable construction:
a common methodology. s.l. : Davis Langdon, 2007.
Acknowledgements This research is funded by Innovate UK and the writers gratefully acknowledge the opportunity provided to them. We thank our colleagues from Liverpool John Moores University (LJMU) and Beverley Clifton Morris (BCM) who provided insight and expertise that greatly assisted the research, although they may not agree with all of the interpretations and conclusions of this paper.
We would also like to show our gratitude to Anupa Manewa, Senior Lecturer in Quantity Surveying in the School of Built Environment, Liverpool John Moores University for sharing her expertise on Whole Life Cycle Costing with us during the course of this research.
Finally, thanks to Lorrain Cohen and Jackson Woods for their assistance with improving the manuscript.


![20140506034709PM_Maharashtra Engineering [Electrical- Mechanical] Services, Gr-B-Paper-2 [Electrical and Mechanical Engineering] (1)](https://img.pdfslide.net/doc/110x75/577cc0791a28aba71190397f/20140506034709pmmaharashtra-engineering-electrical-mechanical-services.jpg)