Embed Size (px)
Citation preview
Special Eurobarometer
Europeans and the Common Agricultural Policy
Fieldwork November - December 2004
Publication February 2005
Spe
cial
Eur
obar
omet
er 2
21 /
Wav
e 62
.2 -
TNS
Opi
nion
& S
ocia
l
This survey was requested by Directorate General Agriculture and coordinated by Directorate General Press and Communication
This document does not represent the point of view of the European Commission. The interpretations and opinions contained in it are solely those of the authors.
European Commission


Special EUROBAROMETER 221 “Europeans and the Common Agricultural Policy”
Table of contents
PRESENTATION ...............................................................................................2
1. Advantages of the Common Agricultural Policy for consumers and farmers ....................................................................................................4
1.1. Main benefits concerning food.................................................................4 1.2. Who benefits the most from the CAP?.......................................................9
2. Main priorities of the European Union in terms of agricultural policy......11
3. How Europeans rate the way the Common Agricultural Policy is fulfilling its role ...................................................................................................17
4. Development of the Common Agricultural Policy ....................................41
CONCLUSION.................................................................................................46
ANNEXES Tables Technical Note Questionnaires
- 1 -
Special EUROBAROMETER 221 “Europeans and the Common Agricultural Policy”
PRESENTATION In the past decade the EU’s common agricultural policy (CAP) has gone through major changes. Passing from a subsidy policy that supported over-production, and absorbing two-thirds of the total EU budget, it has now become a more efficient, simplified and cost effective mechanism based on a more market-oriented system, which benefits both farmers and consumers by guaranteeing quality as well as environmental- and food safety. The recent enlargement of the European Union to 25 Member States in May 2004 also represents challenges and opportunities for the development of the common agricultural policy. With the expansion of the internal market from 380 to 454 million consumers, and the increase in competition among farmers, the enlargement means further change for the EU’s agriculture. How do European citizens in the enlarged Union perceive the issues concerning the EU’s common agricultural policy as well as the impacts of the enlargement on agriculture in Europe? This special Eurobarometer survey is the continuation of a wave of surveys which have been conducted in the last few years both in the “old” EU15 countries and the candidate countries in order to analyse the European public’s opinion on the common agricultural policy. For the first time, the same survey has been conducted in all of the 25 Member States of the enlarged European Union. In this context, the Directorate General “Agriculture” of the European Commission wished to measure the European public opinion in the enlarged European Union on issues dealing with the Common Agricultural Policy and to determine whether the enlargement has had any impact on the opinion of citizens as to these issues. The following points will be analysed in this report: - Advantages of the Common Agricultural Policy both for consumers and farmers - Main priorities of the European Union in terms of agricultural policy - How Europeans rate the way the Common Agricultural Policy is fulfilling its role - Development of the Common Agricultural Policy
The survey was conducted among 25.000 European citizens in the 25 EU Member States between November 22nd and December 19th 2004. Interviews were conducted among citizens aged 15 years and above face-to-face in people’s homes in their national language. The methodology used is that of the Standard Eurobarometer polls managed by the Directorate-General Press and Communication (unit “Opinion polls, press reviews, Europe Direct”). In the annex, a technical note details the interview techniques used by the institutes of the TNS Opinion & Social network as well as levels of confidence.
- 2 -

Special EUROBAROMETER 221 “Europeans and the Common Agricultural Policy”
The key findings will be presented in detail in the following pages. For each theme addressed, our analysis looks at the following results:
• Results for the average of the 25 EU Member States (EU 25); • Results of the 25 individual countries where the survey was carried out; • Results by socio-demographic characteristics of the respondents;
Where possible, comparisons with the results of earlier surveys, namely 2003 results for the “old” EU15 Member States and 2002 results for the 10 “old” accession countries have been made in order to analyse any evolutions in the opinions of EU citizens on issues concerning the Common Agricultural Policy.
- 3 -
Special EUROBAROMETER 221 “Europeans and the Common Agricultural Policy”
1. Advantages of the Common Agricultural Policy for consumers and farmers Source questionnaire: QB1 1.1. Main benefits concerning food
- Ensuring the safety and quality of food is the most agreed upon advantage
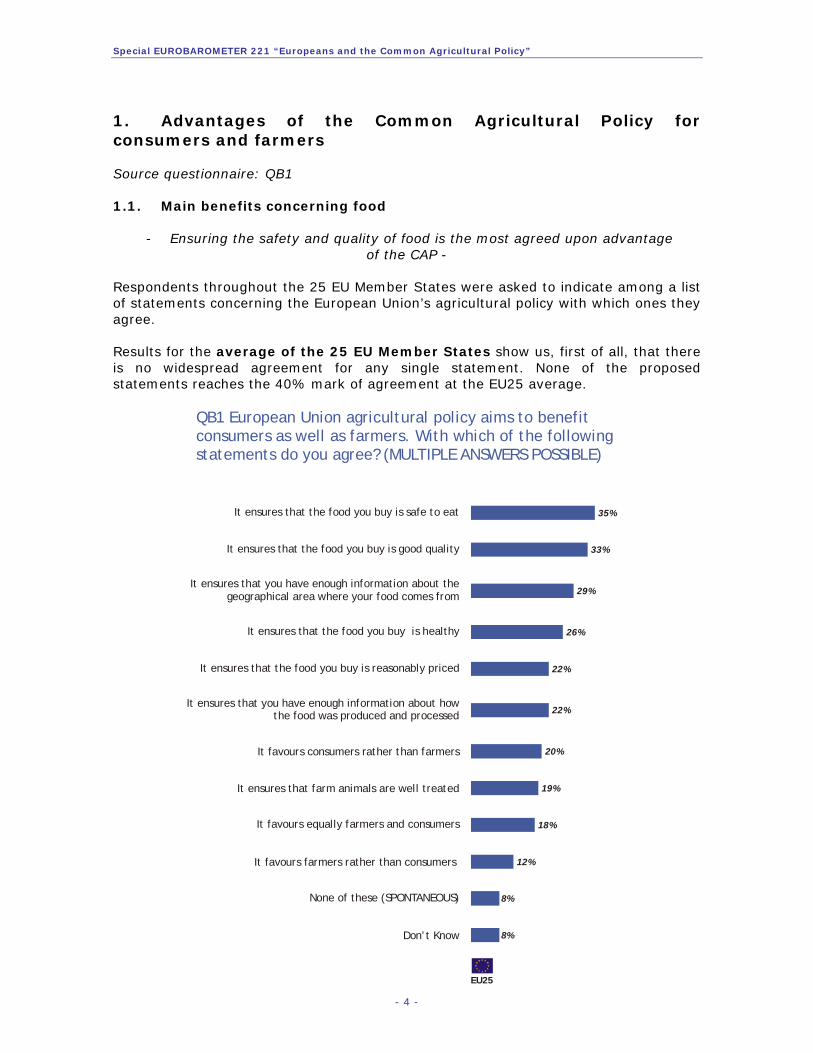
of the CAP - Respondents throughout the 25 EU Member States were asked to indicate among a list of statements concerning the European Union’s agricultural policy with which ones they agree. Results for the average of the 25 EU Member States show us, first of all, that there is no widespread agreement for any single statement. None of the proposed statements reaches the 40% mark of agreement at the EU25 average.
It ensures that the food you buy is safe to eat 35%
It ensures that the food you buy is good quality 33%
It ensures that the food you buy is healthy 26%
It ensures that the food you buy is reasonably priced 22%
It ensures that you have enough information about thegeographical area where your food comes from 29%
It ensures that you have enough information about howthe food was produced and processed 22%
It ensures that farm animals are well treated 19%
It favours consumers rather than farmers 20%
It favours farmers rather than consumers 12%
It favours equally farmers and consumers 18%
None of these (SPONTANEOUS) 8%
Don’t Know 8%
QB1 European Union agricultural policy aims to benefitconsumers as well as farmers. With which of the followingstatements do you agree? (MULTIPLE ANSWERS POSSIBLE)
EU25
- 4 -
Special EUROBAROMETER 221 “Europeans and the Common Agricultural Policy”
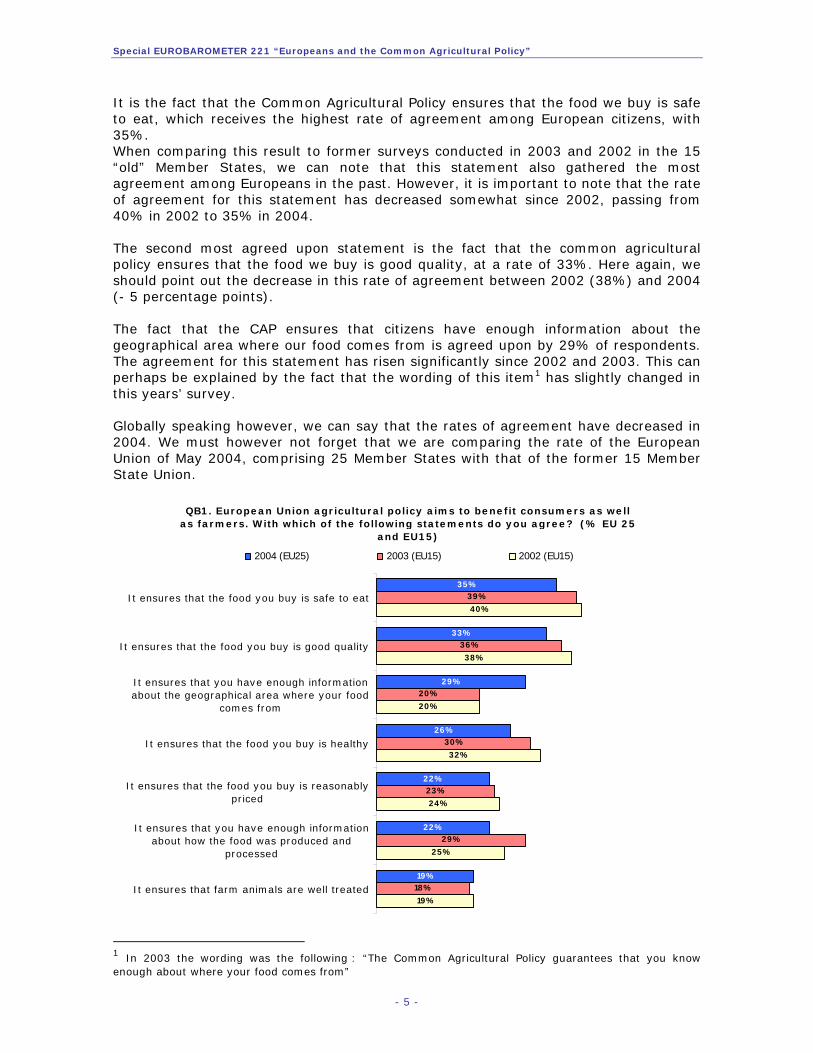
It is the fact that the Common Agricultural Policy ensures that the food we buy is safe to eat, which receives the highest rate of agreement among European citizens, with 35%. When comparing this result to former surveys conducted in 2003 and 2002 in the 15 “old” Member States, we can note that this statement also gathered the most agreement among Europeans in the past. However, it is important to note that the rate of agreement for this statement has decreased somewhat since 2002, passing from 40% in 2002 to 35% in 2004. The second most agreed upon statement is the fact that the common agricultural policy ensures that the food we buy is good quality, at a rate of 33%. Here again, we should point out the decrease in this rate of agreement between 2002 (38%) and 2004 (- 5 percentage points). The fact that the CAP ensures that citizens have enough information about the geographical area where our food comes from is agreed upon by 29% of respondents. The agreement for this statement has risen significantly since 2002 and 2003. This can perhaps be explained by the fact that the wording of this item1 has slightly changed in this years’ survey. Globally speaking however, we can say that the rates of agreement have decreased in 2004. We must however not forget that we are comparing the rate of the European Union of May 2004, comprising 25 Member States with that of the former 15 Member State Union.
QB1. European Union agricultural policy aims to benefit consumers as well as farmers. With which of the following statements do you agree? (% EU 25
and EU15)
33%
26%
22%
22%
19%
39%
36%
20%
30%
23%
29%
18%
40%
38%
20%
32%
24%
25%
19%
29%
35%
It ensures that the food you buy is safe to eat
It ensures that the food you buy is good quality
It ensures that you have enough informationabout the geographical area where your food
comes from
It ensures that the food you buy is healthy
It ensures that the food you buy is reasonablypriced
It ensures that you have enough informationabout how the food was produced and
processed
It ensures that farm animals are well treated
2004 (EU25) 2003 (EU15) 2002 (EU15)
1 In 2003 the wording was the following : “The Common Agricultural Policy guarantees that you know enough about where your food comes from”
- 5 -
Special EUROBAROMETER 221 “Europeans and the Common Agricultural Policy”
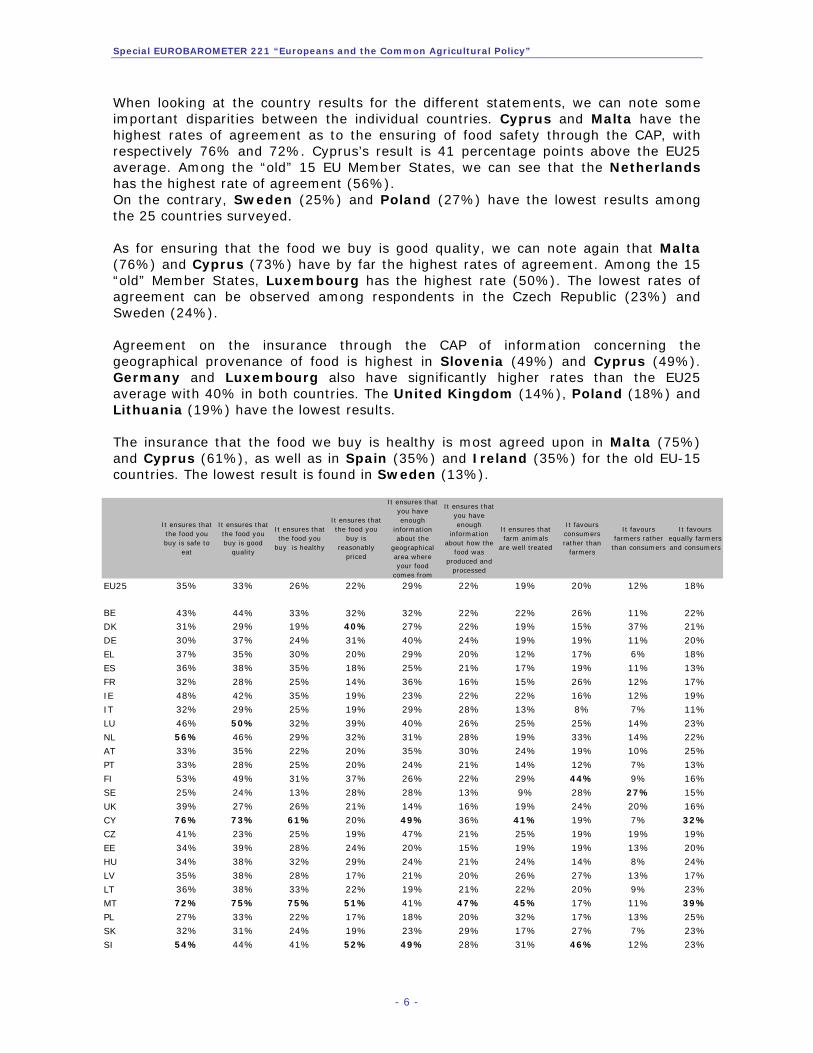
When looking at the country results for the different statements, we can note some important disparities between the individual countries. Cyprus and Malta have the highest rates of agreement as to the ensuring of food safety through the CAP, with respectively 76% and 72%. Cyprus’s result is 41 percentage points above the EU25 average. Among the “old” 15 EU Member States, we can see that the Netherlands has the highest rate of agreement (56%). On the contrary, Sweden (25%) and Poland (27%) have the lowest results among the 25 countries surveyed. As for ensuring that the food we buy is good quality, we can note again that Malta (76%) and Cyprus (73%) have by far the highest rates of agreement. Among the 15 “old” Member States, Luxembourg has the highest rate (50%). The lowest rates of agreement can be observed among respondents in the Czech Republic (23%) and Sweden (24%). Agreement on the insurance through the CAP of information concerning the geographical provenance of food is highest in Slovenia (49%) and Cyprus (49%). Germany and Luxembourg also have significantly higher rates than the EU25 average with 40% in both countries. The United Kingdom (14%), Poland (18%) and Lithuania (19%) have the lowest results. The insurance that the food we buy is healthy is most agreed upon in Malta (75%) and Cyprus (61%), as well as in Spain (35%) and Ireland (35%) for the old EU-15 countries. The lowest result is found in Sweden (13%).
It ensures that the food you buy is safe to
eat
It ensures that the food you buy is good
quality
It ensures that the food you
buy is healthy
It ensures that the food you
buy is reasonably
priced
It ensures that you have enough
information about the
geographical area where your food
comes from
It ensures that you have enough
information about how the
food was produced and
processed
It ensures that farm animals
are well treated
It favours consumers rather than
farmers
It favours farmers rather
than consumers
It favours equally farmersand consumers
EU25 35% 33% 26% 22% 29% 22% 19% 20% 12% 18%
BE 43% 44% 33% 32% 32% 22% 22% 26% 11% 22%DK 31% 29% 19% 40% 27% 22% 19% 15% 37% 21%
DE 30% 37% 24% 31% 40% 24% 19% 19% 11% 20%
EL 37% 35% 30% 20% 29% 20% 12% 17% 6% 18%
ES 36% 38% 35% 18% 25% 21% 17% 19% 11% 13%
FR 32% 28% 25% 14% 36% 16% 15% 26% 12% 17%
IE 48% 42% 35% 19% 23% 22% 22% 16% 12% 19%
IT 32% 29% 25% 19% 29% 28% 13% 8% 7% 11%
LU 46% 50% 32% 39% 40% 26% 25% 25% 14% 23%
NL 56% 46% 29% 32% 31% 28% 19% 33% 14% 22%
AT 33% 35% 22% 20% 35% 30% 24% 19% 10% 25%
PT 33% 28% 25% 20% 24% 21% 14% 12% 7% 13%
FI 53% 49% 31% 37% 26% 22% 29% 44% 9% 16%
SE 25% 24% 13% 28% 28% 13% 9% 28% 27% 15%
UK 39% 27% 26% 21% 14% 16% 19% 24% 20% 16%
CY 76% 73% 61% 20% 49% 36% 41% 19% 7% 32%
CZ 41% 23% 25% 19% 47% 21% 25% 19% 19% 19%
EE 34% 39% 28% 24% 20% 15% 19% 19% 13% 20%
HU 34% 38% 32% 29% 24% 21% 24% 14% 8% 24%
LV 35% 38% 28% 17% 21% 20% 26% 27% 13% 17%
LT 36% 38% 33% 22% 19% 21% 22% 20% 9% 23%
MT 72% 75% 75% 51% 41% 47% 45% 17% 11% 39%
PL 27% 33% 22% 17% 18% 20% 32% 17% 13% 25%
SK 32% 31% 24% 19% 23% 29% 17% 27% 7% 23%
SI 54% 44% 41% 52% 49% 28% 31% 46% 12% 23%
- 6 -

Special EUROBAROMETER 221 “Europeans and the Common Agricultural Policy”
Further notable differences between country results are seen for the statement concerning the fact that the CAP ensures that the food we buy is reasonably priced. Slovenia (52%), Malta (51%) and Denmark (40%) have the highest rates of agreement. On the opposite, France (14%), Latvia (17%) and Poland (17%) have the lowest rates. When comparing results with those of 2003 for the 15 “old” EU Member States, we can note several important evolutions in the opinion of the public. “Ensuring that the food you buy is safe to eat” has seen the highest increase in the rate of agreement in Belgium, up 12 percentage points. On the contrary, we can see that this rate has dropped by 12 points in the United Kingdom. The agreement rate that “It ensures that the food you buy is good quality” has risen by 10 points in Luxembourg and dropped by 9 points in the United Kingdom. The rate of agreement for the fact that the CAP “ensures that you have enough information about the geographical area where your food comes from” has strongly risen since 2003, gaining 9 points at the overall average for the EU 25 countries. We can see that the highest increase is in Luxembourg, up 20 percentage points. The rates in Portugal (+15 points) and Sweden (+15 points) follow. Again, we see that the rate for the United Kingdom has dropped somewhat since 2003 (-7 points). As remarked earlier, it is important to note here that the wording of this statement has slightly changed2 since 2003, which may have an influence on the results.
DE LU SEATNLFRES IE UKPTIT FIELDKBEEU
Comparison with 20032004 ResultsEU25(2004)
EU15(2003)
QB1 European Union agricultural policy aims to benefit consumers as well as farmers. With which of the following statements do you agree?(MULTIPLE ANSWERS POSSIBLE)
It ensures that the food you buy is safe to eat
It ensures that the food you buy is good quality
It ensures that the food you buy is healthy
It ensures that the food you buy is reasonably priced
It ensures that you have enough information about thegeographical area where your food comes from
It ensures that you have enough information about howthe food was produced and processed
It ensures that farm animals are well treated
It favours consumers rather than farmers
It favours farmers rather than consumers
It favours equally farmers and consumers
35%
33%
26%
22%
29%
22%
19%
20%
12%
18%
43%
44%
33%
32%
32%
22%
22%
26%
11%
22%
31%
29%
19%
40%
27%
22%
19%
15%
37%
21%
30%
37%
24%
31%
40%
24%
19%
19%
11%
20%
37%
35%
30%
20%
29%
20%
12%
17%
6%
18%
36%
38%
35%
18%
25%
21%
17%
19%
11%
13%
32%
28%
25%
14%
36%
16%
15%
26%
12%
17%
48%
42%
35%
19%
23%
22%
22%
16%
12%
19%
32%
29%
25%
19%
29%
28%
13%
8%
7%
11%
46%
50%
32%
39%
40%
26%
25%
25%
14%
23%
56%
46%
29%
32%
31%
28%
19%
33%
14%
22%
33%
35%
22%
20%
35%
30%
24%
19%
10%
25%
33%
28%
25%
20%
24%
21%
14%
12%
7%
13%
53%
49%
31%
37%
26%
22%
29%
44%
9%
16%
25%
24%
13%
28%
28%
13%
9%
28%
27%
15%
39%
27%
26%
21%
14%
16%
19%
24%
20%
16%
-4
-3
-4
-1
+9
-7
+1
+6
0
+1
+12
+7
+4
+1
+7
+7
+9
+8
+1
+7
-2
-3
-2
+7
+1
0
-3
+2
+6
0
-4
-1
-2
+5
+10
+6
-1
+6
+1
+2
+7
0
-4
-1
+4
+2
-5
+4
+2
-5
-5
0
+2
+3
+5
+9
+5
+6
+6
+1
-7
-5
-6
-2
+5
-4
0
0
0
0
-3
+3
-2
0
-5
+3
-2
0
-3
-2
-2
-6
-12
-2
+1
-15
-6
+7
+3
-1
0
+3
-1
-10
+14
0
+9
-1
0
+12
+7
+7
+7
+11
+15
+8
+4
+2
-2
+3
+2
+6
+1
0
0
-15
-1
+10
-3
-1
0
-2
-3
-5
+15
-15
-5
+8
-3
+2
-9
-12
-5
-6
-7
-11
-5
+10
+3
+1
+3
+10
-2
+4
+20
-7
+1
+3
+3
+4
-7
-2
-7
-2
-5
+1
-4
-1
-3
-5
Figures for 2003 are taken from Special Eurobarometer 190 - Wave 59.2- Report - Table 1 p.22
2 In 2003 the wording was the following : “The Common Agricultural Policy guarantees that you know enough about where your food comes from”
- 7 -
Special EUROBAROMETER 221 “Europeans and the Common Agricultural Policy”
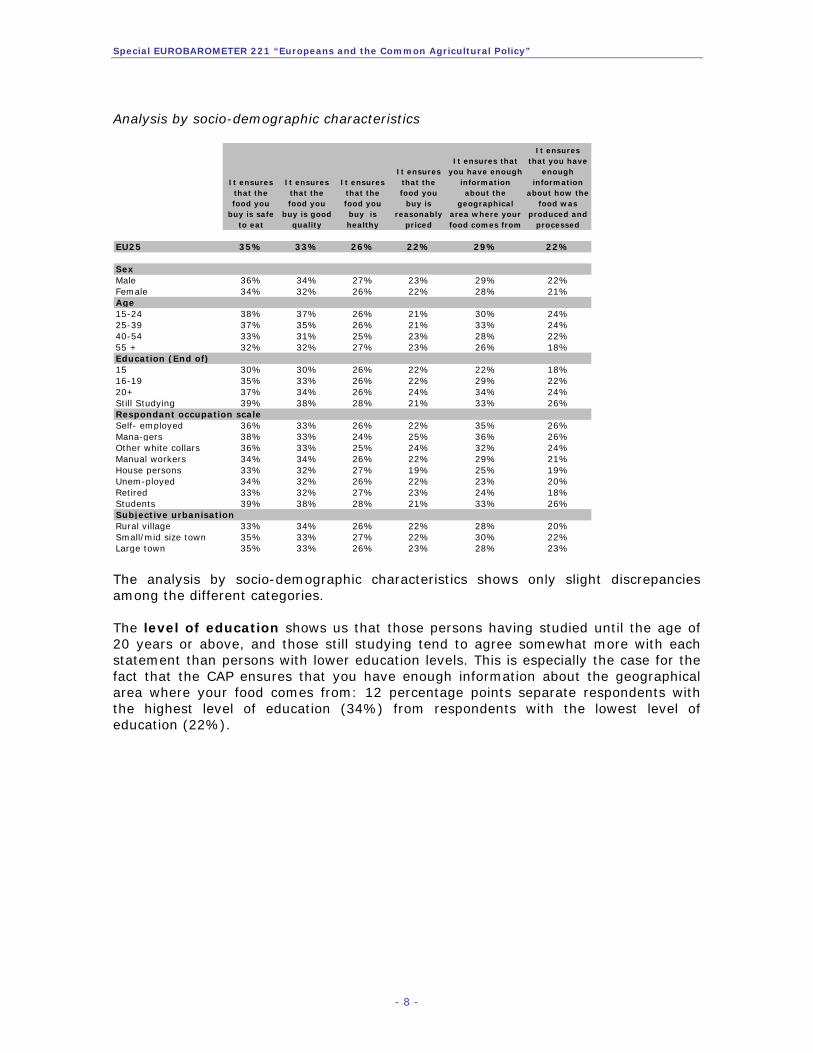
Analysis by socio-demographic characteristics
It ensures that the food you
buy is safe to eat
It ensures that the food you
buy is good quality
It ensures that the food you buy is healthy
It ensures that the food you
buy is reasonably
priced
It ensures that you have enough
information about the
geographical area where your food comes from
It ensures that you have
enough information
about how the food was
produced and processed
EU25 35% 33% 26% 22% 29% 22%
SexMale 36% 34% 27% 23% 29% 22%Female 34% 32% 26% 22% 28% 21%Age15-24 38% 37% 26% 21% 30% 24%25-39 37% 35% 26% 21% 33% 24%40-54 33% 31% 25% 23% 28% 22%55 + 32% 32% 27% 23% 26% 18%Education (End of)15 30% 30% 26% 22% 22% 18%16-19 35% 33% 26% 22% 29% 22%20+ 37% 34% 26% 24% 34% 24%Still Studying 39% 38% 28% 21% 33% 26%Respondant occupation scaleSelf- employed 36% 33% 26% 22% 35% 26%Mana-gers 38% 33% 24% 25% 36% 26%Other white collars 36% 33% 25% 24% 32% 24%Manual workers 34% 34% 26% 22% 29% 21%House persons 33% 32% 27% 19% 25% 19%Unem-ployed 34% 32% 26% 22% 23% 20%Retired 33% 32% 27% 23% 24% 18%Students 39% 38% 28% 21% 33% 26%Subjective urbanisationRural village 33% 34% 26% 22% 28% 20%Small/mid size town 35% 33% 27% 22% 30% 22%Large town 35% 33% 26% 23% 28% 23% The analysis by socio-demographic characteristics shows only slight discrepancies among the different categories. The level of education shows us that those persons having studied until the age of 20 years or above, and those still studying tend to agree somewhat more with each statement than persons with lower education levels. This is especially the case for the fact that the CAP ensures that you have enough information about the geographical area where your food comes from: 12 percentage points separate respondents with the highest level of education (34%) from respondents with the lowest level of education (22%).
- 8 -

Special EUROBAROMETER 221 “Europeans and the Common Agricultural Policy”
1.2. Who benefits the most from the CAP? Respondents were also asked in this same question to indicate whether they agreed with several statements pointing at whom among consumers or farmers benefits the most from the Common Agricultural Policy.
- More Europeans believe the CAP favours consumers rather than farmers -
QB1. European Union agricultural policy aims to benefit consumers as well as farmers. With which of the following
statements do you agree? (% EU 25 and EU15)
12%
14%
12%
17%
13%
11%
19%
18%
20%It favoursconsumers rather
than farmers
It favours farmersrather thanconsumers
It favours equallyfarmers andconsumers
2004 (EU25) 2003 (EU15) 2002 (EU15)
When asked whether the CAP is of greater benefit to consumers or to farmers, or that it is of equal benefit to both of them, we can note a significant difference for responses to the statement that the CAP favours consumers rather than farmers since the last two surveys. Indeed, we can note a rise of 6 percentage points in the agreement rate, passing from 14% in 2003 to 20% in 2004. The rates for the other two statements remain almost identical. We can therefore conclude that today, a higher number of Europeans believe that the CAP favours the consumers more than farmers (20%), than those who believe in the contrary that the farmers are the ones who are the most favoured (12%). It is important to remind once again that we are comparing the averages of the 25 EU Member States with those of the 15 “old” EU Member States. Country results for this statement (CAP favours consumers rather than farmers) show that respondents in Slovenia and in Finland have the highest rates of agreement, with respectively 46% and 44%. This rate of agreement was already highest in the latter country in the previous surveys and continues to rise with an increase of 10 percentage points since 2003.
- 9 -
Special EUROBAROMETER 221 “Europeans and the Common Agricultural Policy”
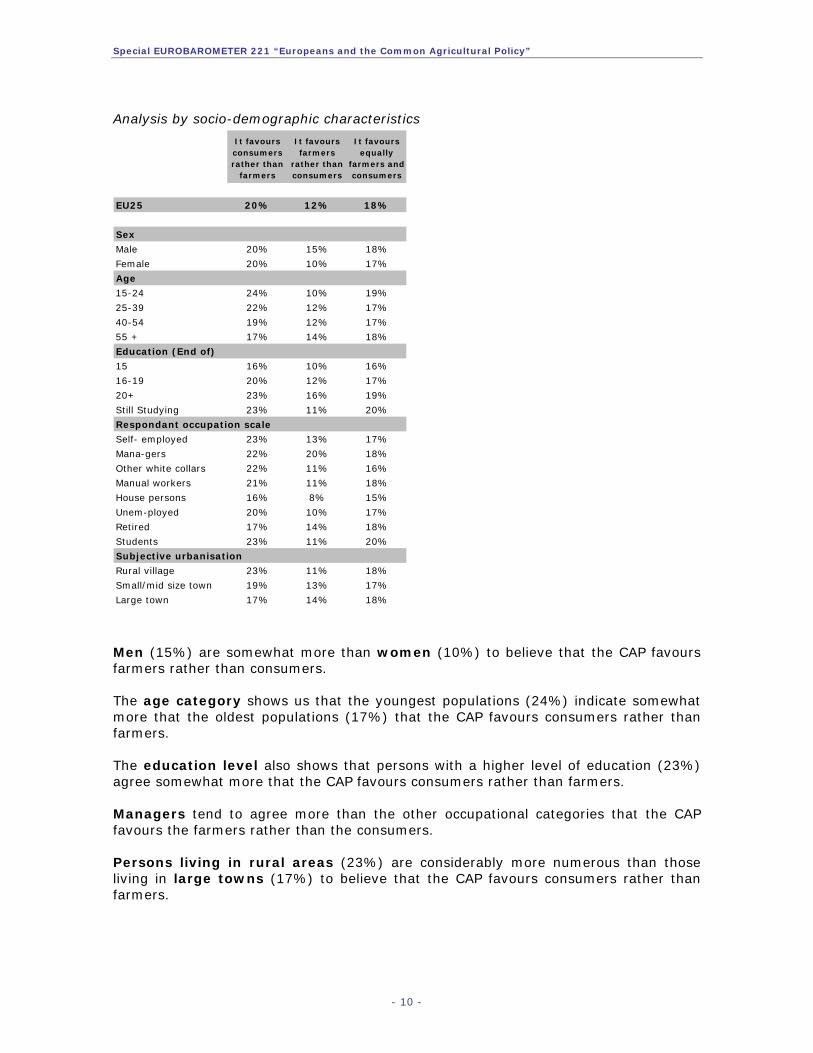
Analysis by socio-demographic characteristics
It favours consumers rather than
farmers
It favours farmers
rather than consumers
It favours equally
farmers andconsumers
EU25 20% 12% 18%
Sex
Male 20% 15% 18%
Female 20% 10% 17%
Age
15-24 24% 10% 19%
25-39 22% 12% 17%
40-54 19% 12% 17%
55 + 17% 14% 18%
Education (End of)
15 16% 10% 16%
16-19 20% 12% 17%
20+ 23% 16% 19%
Still Studying 23% 11% 20%
Respondant occupation scale
Self- employed 23% 13% 17%
Mana-gers 22% 20% 18%
Other white collars 22% 11% 16%
Manual workers 21% 11% 18%
House persons 16% 8% 15%
Unem-ployed 20% 10% 17%
Retired 17% 14% 18%
Students 23% 11% 20%
Subjective urbanisation
Rural village 23% 11% 18%
Small/mid size town 19% 13% 17%
Large town 17% 14% 18%
Men (15%) are somewhat more than women (10%) to believe that the CAP favours farmers rather than consumers. The age category shows us that the youngest populations (24%) indicate somewhat more that the oldest populations (17%) that the CAP favours consumers rather than farmers. The education level also shows that persons with a higher level of education (23%) agree somewhat more that the CAP favours consumers rather than farmers. Managers tend to agree more than the other occupational categories that the CAP favours the farmers rather than the consumers. Persons living in rural areas (23%) are considerably more numerous than those living in large towns (17%) to believe that the CAP favours consumers rather than farmers.
- 10 -

Special EUROBAROMETER 221 “Europeans and the Common Agricultural Policy”
2. Main priorities of the European Union in terms of agricultural
policy Source questionnaire: QB2 In this second part we will look more closely at what Europeans believe should be the main priorities of the Common Agricultural Policy.
- The main priority is to ensure stable and adequate incomes for farmers - Citizens in the 25 EU Member States were asked to indicate among a list of statements which are in their opinion the three main priorities of the European Union in terms of agricultural policy.
QB2. In your opinion, which of the following should be the three main priorities of the European Union in terms of agriculture policy?
(% EU 25)
30%
26%
25%
23%
22%
20%
2%
7%
16%
11%
16%
28%
36%Ensure stable and adequate incomes for farmers
Ensure that agricultural products are healthy and safe
Promote the respect o f environment
Favour and improve life in the countryside
M ake European agriculture more competitive on world markets
Protect small or medium sized farms
Help farmers to adapt their production to consumer’s expectations
Favour methods of organic production
Reduce development gaps between regions
Protect the welfare of farm animals
Encourage the diversification of agricultural products and activities
Protect the specificity and taste of European agricultural products
None of these (SPONTANEOUS)
Results for this question show that there is no specific priority which stands out and on which Europeans agree on strongly. Indeed, the responses are spread out among the different statements. Nevertheless, the priority of the CAP, which is mentioned by most Europeans is to ensure stable and adequate incomes for farmers, at a rate of 36%. The fact of ensuring that agricultural products are healthy and safe is the second most designated priority, with 30% of EU citizens mentioning this. In third place, it is interesting to note that Europeans would like the Common Agricultural Policy to prioritize the promotion of the respect of the environment (28%).
- 11 -

Special EUROBAROMETER 221 “Europeans and the Common Agricultural Policy”
When studying the country results for the main priority indicated by the Europeans, we can note that there are some important discrepancies among the different countries.
- Ensure stable and adequate incomes for farmers -
QB2 In your opinion, which of the following should be the three main priorities of theEuropean Union in terms of agriculture policy? (MAX. 3 ANSWERS)
Answers: Ensure stable and adequate incomes for farmers
EU25 36%
Belgium 37%
Denmark 18%
Germany 34%
Greece 61%
Spain 40%
France 38%
Ireland 31%
Italy 26%
Luxembourg 30%
The Netherlands 38%
Austria 36%
Portugal 40%
Finland 46%
Sweden 19%
United Kingdom 29%
Cyprus 47%
Czech Republic 25%
Estonia 41%
Hungary 46%
Latvia 34%
Lithuania 45%
Malta 34%
Poland 49%
Slovakia 37%
Slovenia 40%
41% - 50%
31% - 40%
21% - 30%
0% - 20%
Legend51% - 100%
Country Results
The Greeks have by far the highest rate of respondents indicating that the EU’s main priority in its agriculture policy should be to ensure stable and adequate incomes for farmers. Indeed, with a rate of 61%, the Greek result is 25 percentage points above the EU25 average. The rate in Poland follows with 49%. On the opposite side of the table, we can see that respondents in Denmark and (18%) and Sweden (19%) give the lowest response rates to this priority.
- 12 -

Special EUROBAROMETER 221 “Europeans and the Common Agricultural Policy”
- Ensure that agricultural products are healthy and safe -
The priority to ensure that agricultural products are healthy and safe is mentioned by every second respondent in Malta (50%) and by 42% of respondents in Sweden.
EU25 30%
Belgium 38%
Denmark 37%
Germany 31%
Greece 24%
Spain 18%
France 33%
Ireland 34%
Italy 28%
Luxembourg 29%
The Netherlands 37%
Austria 24%
Portugal 26%
Finland 32%
Sweden 42%
United Kingdom 36%
Cyprus 37%
Czech Republic 33%
Estonia 16%
Hungary 30%
Latvia 24%
Lithuania 20%
Malta 50%
Poland 24%
Slovakia 16%
Slovenia 32%
41% - 100%
31% - 40%
21% - 30%
0% - 20%
Legend
Country Results
QB2 In your opinion, which of the following should be the three main priorities of theEuropean Union in terms of agriculture policy? (MAX. 3 ANSWERS)
Answers: Ensure that agricultural products are healthy and safe
However, citizens in Slovakia (16%), Estonia (16%) and Spain (18%) perceive this area of intervention far less as a priority. Slovakia’s and Estonia’s rates are 14 percentage points below the EU25 average.
- 13 -
Special EUROBAROMETER 221 “Europeans and the Common Agricultural Policy”
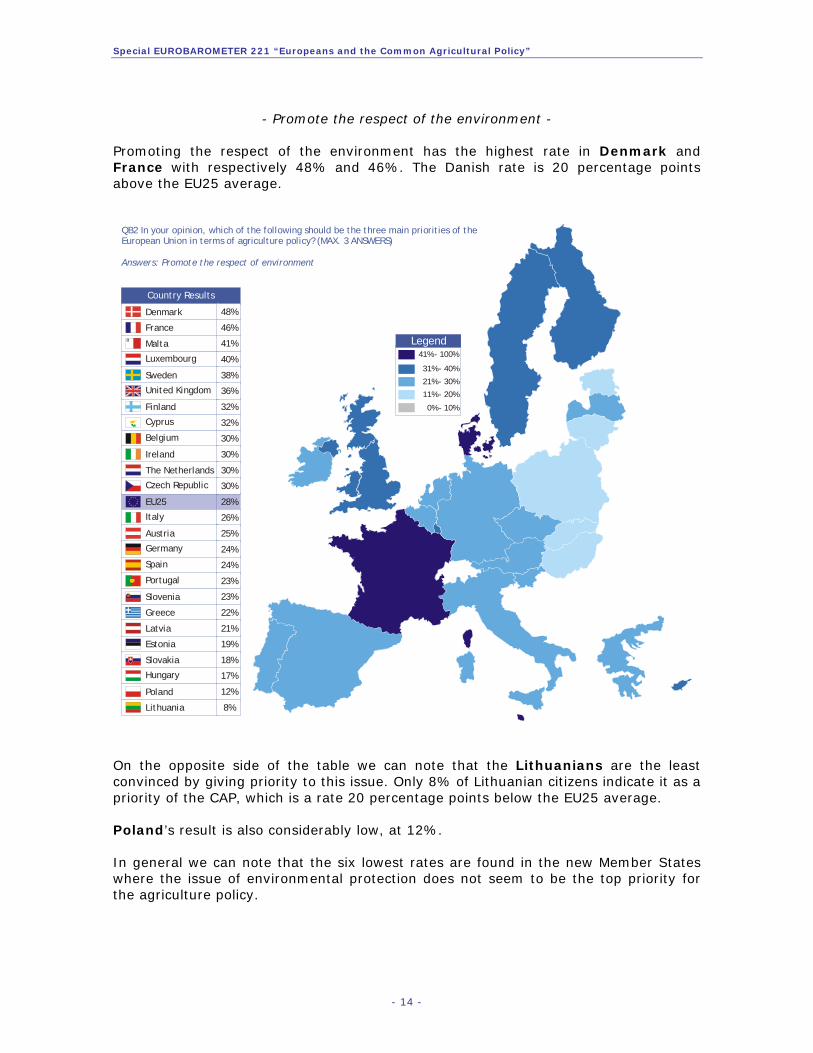
- Promote the respect of the environment -
Promoting the respect of the environment has the highest rate in Denmark and France with respectively 48% and 46%. The Danish rate is 20 percentage points above the EU25 average.
EU25 28%
Belgium 30%
Denmark 48%
Greece 22%
Spain 24%
France 46%
Ireland 30%
Italy 26%
Luxembourg 40%
The Netherlands 30%
Austria 25%
Portugal 23%
Finland 32%
Sweden 38%
United Kingdom 36%
Cyprus 32%
Czech Republic 30%
Estonia 19%
Hungary 17%
Latvia 21%
Lithuania 8%
Malta 41%
Poland 12%
Slovakia 18%
Slovenia 23%
31% - 40%
21% - 30%
11% - 20%
0% - 10%
Legend41% - 100%
Country Results
QB2 In your opinion, which of the following should be the three main priorities of theEuropean Union in terms of agriculture policy? (MAX. 3 ANSWERS)
Answers: Promote the respect of environment
Germany 24%
On the opposite side of the table we can note that the Lithuanians are the least convinced by giving priority to this issue. Only 8% of Lithuanian citizens indicate it as a priority of the CAP, which is a rate 20 percentage points below the EU25 average. Poland’s result is also considerably low, at 12%. In general we can note that the six lowest rates are found in the new Member States where the issue of environmental protection does not seem to be the top priority for the agriculture policy.
- 14 -
Special EUROBAROMETER 221 “Europeans and the Common Agricultural Policy”
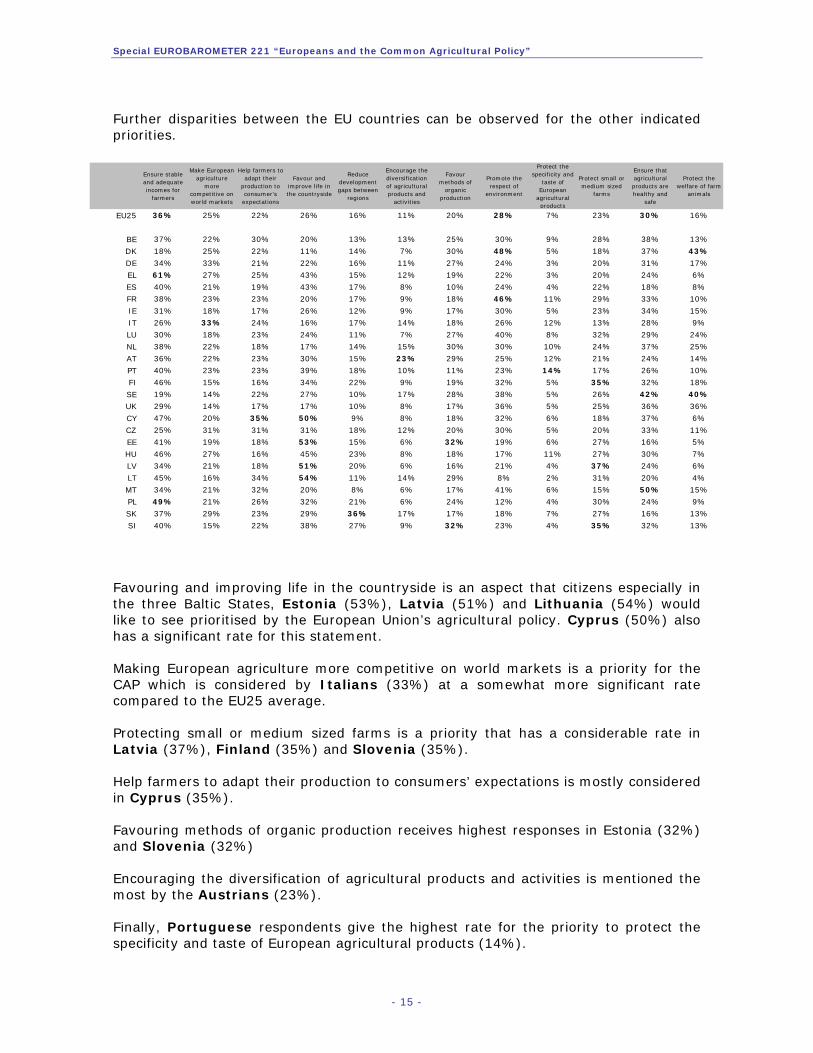
Further disparities between the EU countries can be observed for the other indicated priorities.
Ensure stable and adequate incomes for
farmers
Make European agriculture
more competitive on world markets
Help farmers toadapt their
production to consumer’s expectations
Favour and improve life in the countryside
Reduce development gaps between
regions
Encourage the diversification of agricultural products and
activities
Favour methods of
organic production
Promote the respect of
environment
Protect the specificity and
taste of European
agricultural products
Protect small ormedium sized
farms
Ensure that agricultural products are healthy and
safe
Protect the welfare of farm
animals
EU25 36% 25% 22% 26% 16% 11% 20% 28% 7% 23% 30% 16%
BE 37% 22% 30% 20% 13% 13% 25% 30% 9% 28% 38% 13%
DK 18% 25% 22% 11% 14% 7% 30% 48% 5% 18% 37% 43%
DE 34% 33% 21% 22% 16% 11% 27% 24% 3% 20% 31% 17%
EL 61% 27% 25% 43% 15% 12% 19% 22% 3% 20% 24% 6%
ES 40% 21% 19% 43% 17% 8% 10% 24% 4% 22% 18% 8%
FR 38% 23% 23% 20% 17% 9% 18% 46% 11% 29% 33% 10%
IE 31% 18% 17% 26% 12% 9% 17% 30% 5% 23% 34% 15%
IT 26% 33% 24% 16% 17% 14% 18% 26% 12% 13% 28% 9%
LU 30% 18% 23% 24% 11% 7% 27% 40% 8% 32% 29% 24%
NL 38% 22% 18% 17% 14% 15% 30% 30% 10% 24% 37% 25%
AT 36% 22% 23% 30% 15% 23% 29% 25% 12% 21% 24% 14%
PT 40% 23% 23% 39% 18% 10% 11% 23% 14% 17% 26% 10%
FI 46% 15% 16% 34% 22% 9% 19% 32% 5% 35% 32% 18%
SE 19% 14% 22% 27% 10% 17% 28% 38% 5% 26% 42% 40%
UK 29% 14% 17% 17% 10% 8% 17% 36% 5% 25% 36% 36%
CY 47% 20% 35% 50% 9% 8% 18% 32% 6% 18% 37% 6%
CZ 25% 31% 31% 31% 18% 12% 20% 30% 5% 20% 33% 11%
EE 41% 19% 18% 53% 15% 6% 32% 19% 6% 27% 16% 5%
HU 46% 27% 16% 45% 23% 8% 18% 17% 11% 27% 30% 7%
LV 34% 21% 18% 51% 20% 6% 16% 21% 4% 37% 24% 6%
LT 45% 16% 34% 54% 11% 14% 29% 8% 2% 31% 20% 4%
MT 34% 21% 32% 20% 8% 6% 17% 41% 6% 15% 50% 15%
PL 49% 21% 26% 32% 21% 6% 24% 12% 4% 30% 24% 9%
SK 37% 29% 23% 29% 36% 17% 17% 18% 7% 27% 16% 13%
SI 40% 15% 22% 38% 27% 9% 32% 23% 4% 35% 32% 13%
Favouring and improving life in the countryside is an aspect that citizens especially in the three Baltic States, Estonia (53%), Latvia (51%) and Lithuania (54%) would like to see prioritised by the European Union’s agricultural policy. Cyprus (50%) also has a significant rate for this statement. Making European agriculture more competitive on world markets is a priority for the CAP which is considered by Italians (33%) at a somewhat more significant rate compared to the EU25 average. Protecting small or medium sized farms is a priority that has a considerable rate in Latvia (37%), Finland (35%) and Slovenia (35%). Help farmers to adapt their production to consumers’ expectations is mostly considered in Cyprus (35%). Favouring methods of organic production receives highest responses in Estonia (32%) and Slovenia (32%) Encouraging the diversification of agricultural products and activities is mentioned the most by the Austrians (23%). Finally, Portuguese respondents give the highest rate for the priority to protect the specificity and taste of European agricultural products (14%).
- 15 -

Special EUROBAROMETER 221 “Europeans and the Common Agricultural Policy”
Analysis by socio-demographic characteristics
The analysis by socio-demographic categories shows us that there are certain specific disparities between categories. Men (27%) believe somewhat more than women (22%) that making European agriculture more competitive on world markets should be a priority of the CAP. The age category shows that those aged 25 to 39 are somewhat more numerous to agree (32%) than the oldest populations (25%) that a priority of the CAP should be to promote the respect of the environment. The youngest aged 15 to 24 (20%) are also more numerous than the older populations (15%) to believe that protecting the welfare of farm animals should be the priority of the CAP. The education levels show the most differences among all categories. Those with the lowest level of education (31%) have a stronger belief than those with the highest level of education (21%) that the CAP’s priority should be to favour and improve the life in the countryside. On the contrary, the highest educated are more numerous than the lowest educated to believe that the priority of the CAP should be to reduce development gaps between regions. The same remark can be made for the priority of favouring methods of organic production and promoting the respect of environment. For this last field of action, 13 percentage points separate those having studied until the age of 20 or above (35%) from those having left school at the age of 15 years or less (22%). The urbanisation category shows us that persons living in rural villages are far more numerous (41%) than people living in large towns (32%) and midsize towns (31%) to believe that the priority of the CAP should be to ensure stable and adequate incomes for farmers.
- 16 -

Special EUROBAROMETER 221 “Europeans and the Common Agricultural Policy”
3. How Europeans rate the way the Common Agricultural Policy is fulfilling its role Source questionnaire: QB3 In this third part of the analysis we will look at how European citizens perceive the role played by the European Union’s agricultural policy in certain areas of intervention seen earlier. - A relative majority of Europeans believes the EU is playing its role fairly well for most
of the tested areas -
QB3. And do you think that the European Union’s agricultural policy currently plays its role fairly well or fairly badly to…? (% EU25)
57%
55%
4 8 %
4 7%
4 7%
4 5%
4 5%
4 3 %
4 0 %
3 7%
3 7%
3 0 %
2 8 %
3 0 %
3 1%
2 9 %
3 4 %
4 0 %
4 3 %
3 7%
4 9 %
2 3 %
2 6 %
3 2 %
3 0 %
2 6 % 16 %
2 5%
2 1%
16 %
2 3 %
2 1%
2 6 %
2 0 %
2 1%
2 3 %
0% 100%
ensure that agricultural products are healthy and safe
promote the respect of environment
make European agriculture more competitive onworld markets
favour methods of organic production
protect the welfare of farm animals
encourage the diversification of agricultural productsand activities
protect the specificity and taste of Europeanagricultural products
help farmers to adapt their production to consumer’sexpectations
favour and improve life in the countryside
ensure stable and adequate incomes for farmers
reduce development gaps between regions
protect small or medium sized farms
Fairly well Fairly badly DK
When looking at the results for the average of the 25 EU Member States in each of the areas tested for this question, we can note that in most of the cases a majority or a relative majority of citizens indicates that the EU’s agricultural policy plays its role fairly well. With a rate of 57%, it is the most positively perceived belief that the common agricultural policy is doing a good job in ensuring that agricultural products are healthy and safe. The promotion of the respect of the environment is also considered by a majority of citizens (55%) as a role fairly well played by the CAP. On the opposite side of the graph we can note that only a minority of Europeans believes the CAP is playing its role fairly well in protecting small or medium sized farms, with a rate of just 30%. This is also the case for the role of the CAP in ensuring stable and adequate incomes for farmers (37%) and in reducing development gaps between regions (37%). It is also important to note the significant rates of non-responses for certain items.
- 17 -

Special EUROBAROMETER 221 “Europeans and the Common Agricultural Policy”
- Ensure that agricultural products are healthy and safe -
QB3.11 And do you think that the European Union’s agricultural policy currently plays its role fairly well or fairly badly to…?
Ensure that agricultural products are healthy and safe (% EU25)
80%80%
73%71%
66%65%65%65%
63%61%
58%
57%
56%53%53%53%
50%50%
49%47%
46%45%
41%39%
38%37%
5%18%23%
30%
27%19%24%
15%
26%
14%27%
31%24%
25%35%37%
44%25%29%
34%51%
39%47%
8%
27%
15%
22%
21%
6%
8%
16%
24%
23%
25%
13%
14%
14%
16%
20%
29%
16%
15%
6%11%
5%
18%
31%
14%
26%
10%
9%
24%
0% 100%
CYMTNLBEDEFIPLSIUKLULT
EU25
IEITATEEESFRHUELSKCZPTDKLVSE
Fairly well Fairly badly DK
Country results for this area of intervention of the CAP shows us that respondents in Cyprus and Malta have the highest rates indicating that the CAP’s role is played fairly well in this domain, with a rate of 80% in each country. The Netherlands and Belgium follow with respectively 73% and 71%. On the bottom of the table we can note that the Swedes have the lowest rate indicating a positive answer (37%). Sweden’s rate is 20 percentage points below the EU25 average. Latvia (38%) and Denmark (39%) follow. These are the only three countries where we find a minority of respondents answering positively.
- 18 -

Special EUROBAROMETER 221 “Europeans and the Common Agricultural Policy”
When we compare this year’s results with those of 2003 among the “old” EU15 Member States3, we can observe several important developments in the opinion of European citizens for this question. The map below shows the evolution of results between 2003 and 2004. Countries in blue have seen their rates increase since 2003, countries in yellow have not witnessed any change at all, and countries in red have seen their results decrease since 2003.
QB3.11 And do you think that the European Union’s agricultural policy currently playsits role fairly well or fairly badly to…?
Option: Ensure that agricultural products are healthy and safe
Answers: Fairly well
neutral
negative
Color Keypositive
Belgium
Denmark
Germany
Greece
Spain
France
Ireland
Italy
Luxembourg
The Netherlands
Austria
Portugal
Finland
Sweden
United Kingdom
+19
8
13
5
0
8
-12
14
14
9
4
7
8
12
28
+
+
+
+
+
+
+
+
+
+
+
+
71%
39%
66%
47%
50%
50%
56%
53%
61%
73%
53%
41%
65%
37%
63%
Comparison 2004/2003
The strongest progression of positive opinions can be observed in the United Kingdom where this opinion has increased by 28 percentage points since last year. Belgium also has an important increase favourable to the role of the CAP (+19 points). Spain’s rate remains unchanged since last year while that of Ireland has dropped by 12 percentage points, passing from 68% of positive opinions to 56%. All other countries have seen their results increase in this year’s survey.
3 In 2003 “And how well do you think the European Union’s agricultural policy is currently playing its role?”
- 19 -

Special EUROBAROMETER 221 “Europeans and the Common Agricultural Policy”
- Promote the respect of the environment -
QB3.8 And do you think that the European Union’s agricultural policy currently plays its role fairly well or fairly badly to…?
Promote the respect of environment (% EU25)
85%82%
77%69%
68%67%
66%64%
62%59%59%
58%57%
55%
53%52%52%
51%48%
46%46%
45%43%
42%41%
34%
7%11%
25%
25%
16%25%
11%18%
34%32%
28%
18%27%
30%30%
42%40%
31%38%
34%33%
35%58%
20%
23%
19%
20%
22%
4%
14%
30%
23%
25%
17%
11%
12%
30%
11%
23%
8%
12%
6%12%
8%
13%
8%
16%
9%
17%
25%
12%
20%
0% 100%
MTCYPLBEHUSIDEEELULTSKFINL
EU25
IEITATUKELFRCZSELVESPTDK
Fairly well Fairly badly DK
Again we can see that respondents in Cyprus (85%) and Malta (82%) have the highest rates indicating that the European Union’s agricultural policy is playing its role fairly well to promote the respect of the environment. Poland follows with a rate of 77%. On the opposite, Denmark has the lowest rate with only 34% of its respondents believing the CAP is playing its role fairly well in this field. Indeed, Denmark is the only country where a clear majority of respondents (58%) believes that the CAP is doing a bad job in promoting the respect of the environment.
- 20 -

Special EUROBAROMETER 221 “Europeans and the Common Agricultural Policy”
The result comparison with 2003 for the “old” EU 15 countries shows us that there has been an overall positive development among the European public opinion. The strongest progressions can be noted in the United Kingdom and Belgium (respectively up 22 and 20 points). The only exception to this trend can be noted in Ireland where the rate of positive opinions, meaning those who consider the CAP’s role to be played fairly well for the promotion of the respect of the environment, has decreased by 8 points (down from 61% in 2003 to 53% in 2004).
QB3.8 And do you think that the European Union’s agricultural policy currently plays
its role fairly well or fairly badly to…?
Option: Promote the respect of environment
Answers: Fairly well
neutral
negative
Color Keypositive
Belgium
Denmark
Germany
Greece
Spain
France
Ireland
Italy
Luxembourg
The Netherlands
Austria
Portugal
Finland
Sweden
United Kingdom
+20
5
13
7
2
5
-8
12
11
2
1
1
10
14
22
+
+
+
+
+
+
+
+
+
+
+
+
+
69%
34%
66%
48%
42%
46%
53%
52%
62%
57%
52%
41%
58%
45%
51%
Comparison 2004/2003
- 21 -

Special EUROBAROMETER 221 “Europeans and the Common Agricultural Policy”
- Make European agriculture more competitive on world markets -
QB3.2 And do you think that the European Union’s agricultural policy currently plays its role fairly well or fairly badly to…? Make
European agriculture more competitive on world markets (% EU25)
64%60%
58%56%
53%51%
50%49%
48%
48%48%48%48%47%
46%46%
45%44%44%43%
40%37%37%37%36%
28%
12%17%
32%
28%
16%
30%
31%16%
30%37%39%
23%31%
29%30%
41%28%
35%38%
30%38%
38%41%
35%
25%
24%
33%
23%
29%
31%
32%
26%
27%
12%
18%
23%
36%
14%
24%
31%
28%
12%23%22%
21%
22%15%
15%
25%
25%
25%
24%
0% 100%
DEM TCYBEPLATHULT
EU25
DKIE
LUSI
ELEESKESITFI
UKNLFRSECZPTLV
Fairly well Fairly badly DK
Germans are the most numerous to believe that the CAP is playing its role fairly well in making European agriculture more competitive on world markets, this at a rate of 64%. This rate is 16 percentage points above the EU25 average.. Malta follows with 60% indicating a positive response. On the lower side of the graph, we can see that Latvia has the least number of respondents answering positively, since only 28% think this way (20 points below the EU25 average). It is interesting to note the high levels of “Don’t know” responses for this statement, which reaches 36% in Ireland and 35% in Lithuania.
- 22 -

Special EUROBAROMETER 221 “Europeans and the Common Agricultural Policy”
The 2004/2003 comparison shows us that once again, the United Kingdom has the strongest increase (+23 points) in its positive opinion about the role of the CAP, this time for making European agriculture more competitive on world markets. Belgium (+18), Germany (+17) and Italy (+15) also have important increases. On the other hand, we can see that in two countries the opinions in favour of the CAP have weakened somewhat. The most significant decrease is Ireland, where this rate has dropped by 6 percentage points since 2003. France’s rate has dropped by one point. The rate in the Netherlands remains unchanged at 40% responding “fairly well”.
QB3.2 And do you think that the European Union’s agricultural policy currently playsits role fairly well or fairly badly to…?
Option: Make European agriculture more competitive on world markets
Answers: Fairly well
neutral
negative
Color Keypositive
Belgium
Denmark
Germany
Greece
Spain
France
Ireland
Italy
Luxembourg
The Netherlands
Austria
Portugal
Finland
Sweden
United Kingdom
56%
48%
64%
47%
45%
37%
48%
44%
48%
40%
51%
36%
44%
37%
43%
Comparison 2004/2003
+18
+12
+17
+11
+4
-1
-6
+15
+3
0
+3
+6
+7
+8
+23
- 23 -

Special EUROBAROMETER 221 “Europeans and the Common Agricultural Policy”
- Favour methods of organic production -
QB3.7 And do you think that the European Union’s agricultural policy currently plays its role fairly well or fairly badly to…?
Favour methods of organic production (% EU25)
68%
66%61%
60%59%
57%
56%55%
54%53%
53%
50%48%
47%
47%41%
40%
40%38%
38%36%
35%
33%33%
32%27%
11%26%
13%
32%
28%
9%25%
20%
33%31%
31%
26%48%
41%
29%41%
33%28%
43%
30%38%
34%58%
17%
27%
31%
32%
33%
16%
30%
27%
36%
34%
19%
16%
11%
23%
21%
36%
15%
23%
27%9%
11%
38%
18%
23%
22%
23%
30%
13%
11%
0% 100%
PLCYDELTSIELBELUMTEESKATHU
EU25
ITFINLCZSEUKIEFRESLVPTDK
Fairly well Fairly badly DK
Polish citizens are the ones in the EU 25 countries who judge the most positively the CAP’s role in favouring methods of organic production, at a rate of 68%. The results in Cyprus (66%), Germany (61%) and Lithuania (60%) are also above the 60 % mark. On the opposite side of the graph we can see that Denmark has the lowest rate, being the only country to have a clear majority of respondents having an opposite opinion (58%). Again, we should point out to the high non-response rates which reach 38% in Malta and 36% in Spain and Ireland.
- 24 -

Special EUROBAROMETER 221 “Europeans and the Common Agricultural Policy”
The map below shows us that a majority of countries in the “old” European Union of 15 Member States has seen an increase in their rates in favour of the CAP for this issue. The strongest increase can be found in Belgium (+15) and Greece (+14). On the other hand, rates have decreased in three countries, namely Ireland (- 21), Finland (-2) and the Netherlands (-5). Ireland’s rate of positive answers has considerably dropped by 21 percentage points.
QB3.7 And do you think that the European Union’s agricultural policy currently playsits role fairly well or fairly badly to…?
Option: Favour methods of organic production
Answers: Fairly well
neutral
negative
Color Keypositive
Belgium
Denmark
Germany
Greece
Spain
France
Ireland
Italy
Luxembourg
The Netherlands
Austria
Portugal
Finland
Sweden
United Kingdom
+15
0
+10
+14
+3
0
-21
+12
+8
-5
+4
+2
-2
+7
+11
56%
27%
61%
57%
33%
35%
36%
47%
55%
40%
50%
32%
41%
38%
38%
Comparison 2004/2003
- 25 -

Special EUROBAROMETER 221 “Europeans and the Common Agricultural Policy”
- Protect the welfare of farm animals -
QB3.12 And do you think that the European Union’s agricultural policy currently plays its role fairly well or fairly badly to…?
Protect the welfare of farm animals (% EU25)
72%65%
61%59%
56%54%54%54%
51%51%
49%48%48%
47%
47%44%
43%42%
40%39%39%38%
35%35%
23%17%
12%8%
28%
39%
31%32%
13%21%
33%23%
32%
29%16%
37%44%
29%34%
33%47%
38%35%
65%76%
14%
29%
14%
33%
27%
12%
27%
24%
27%
12%
20%
15%
19%
36%
29%
29%
7%
23%
13%11%
7%
17%
19%
21%
31%
15%
30%
30%
40%
0% 100%
PLCYMTDEBEFI
HUSILULTEEATSK
EU25
ITIE
UKNLESCZLVELFRPTSEDK
Fairly well Fairly badly DK
Concerning the protection of the welfare of farm animals, Polish citizens (72%) have again the highest rate of answers estimating that the Common Agricultural Policy is doing its job fairly well in this field. Poland’s rate is 25 percentage points above the EU25 average. The lowest rates are found in Denmark and Sweden with respectively 17% and 23%. Denmark’s rate is 30 percentage points below the EU25 average. Up to 76% of respondents in Denmark are of the opposite opinion. As this item was not asked in 2003 we have no comparison data for this specific issue on farm animal welfare protection.
- 26 -

Special EUROBAROMETER 221 “Europeans and the Common Agricultural Policy”
- Encourage the diversification of agricultural products and activities –
QB3.6 And do you think that the European Union’s agricultural policy currently plays its role fairly well or fairly badly to…?
Encourage the diversification of agricultural products and activities(% EU25)
60%
56%
55%
55%
54%
54%
54%
53%
52%
51%
49%
47%
46%
45%
45%
43%
40%
39%
38%
38%
38%
35%
33%
32%
31%
29%
29%
24%
19%
7%
16%
15%
31%
24%
35%
43%
29%
25%
27%
28%
36%
33%
28%
29%
17%
38%
38%
46%
37%
31%
27%
26%
36%
32%
30%
34%
30%
29%
23%
32%
10%
13%
18%
11%
32%
33%
15%
26%
10%
39%
32%
18%
26%
28%
48%
30%
21%
30%
0% 100%
BEDE
LUPLEL
MTSICYLT
ATSKHU
FI
EU25
EEITES
FRNLUKCZ
IEPTSE
DKLV
Fairly well Fairly badly DK
Belgians are the respondents who believe the most that the CAP is playing its role fairly well in encouraging the diversification of agricultural products and activities, this at a rate of 60%. The result in Germany follows with 56%. Among the new Member States, Poland (55%), Malta (54%) and Slovenia (54%) have the highest rates. On the opposite side of the graph we can note that the Latvians have the lowest score with only 29% answering positively to this statement. Denmark and Sweden follow with respectively 31% and 32%. The non-response rates are considerably high in certain countries, notably in Ireland (48%) and Malta (39%).
- 27 -
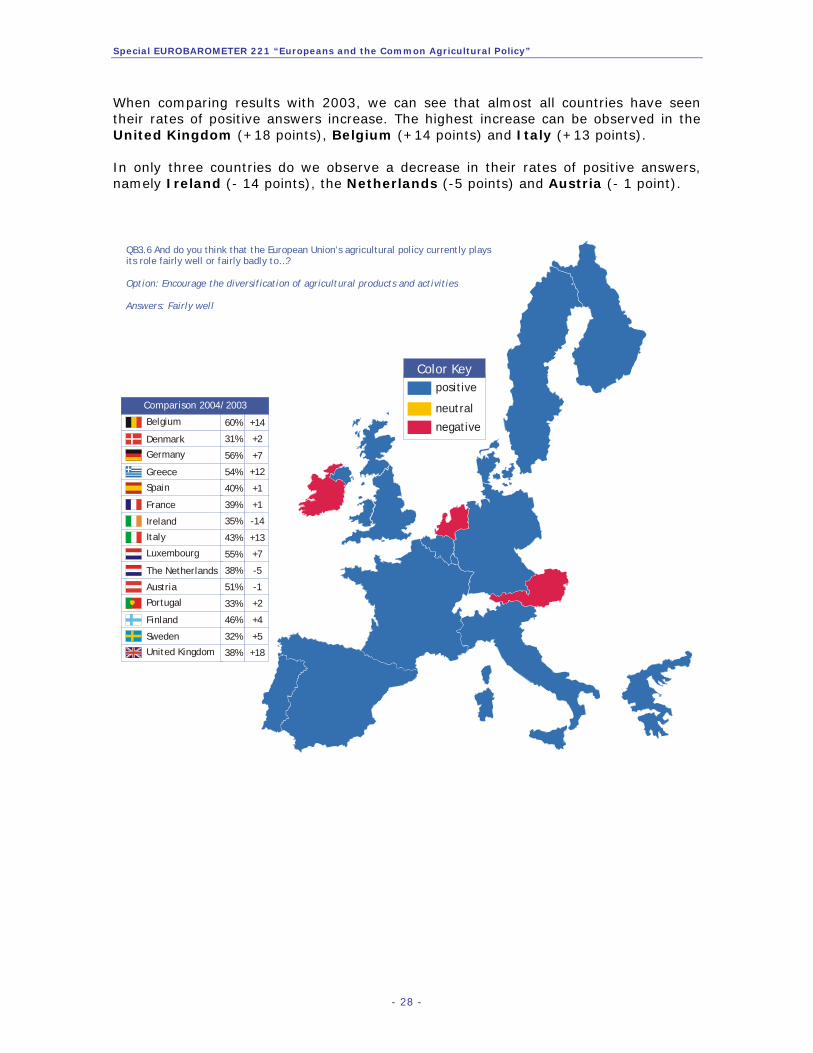
Special EUROBAROMETER 221 “Europeans and the Common Agricultural Policy”
When comparing results with 2003, we can see that almost all countries have seen their rates of positive answers increase. The highest increase can be observed in the United Kingdom (+18 points), Belgium (+14 points) and Italy (+13 points). In only three countries do we observe a decrease in their rates of positive answers, namely Ireland (- 14 points), the Netherlands (-5 points) and Austria (- 1 point).
QB3.6 And do you think that the European Union’s agricultural policy currently playsits role fairly well or fairly badly to…?
Option: Encourage the diversification of agricultural products and activities
Answers: Fairly well
neutral
negative
Color Keypositive
Belgium
Denmark
Germany
Greece
Spain
France
Ireland
Italy
Luxembourg
The Netherlands
Austria
Portugal
Finland
Sweden
United Kingdom
+14
+2
+7
+12
+1
+1
-14
+13
+7
-5
-1
+2
+4
+5
+18
60%
31%
56%
54%
40%
39%
35%
43%
55%
38%
51%
33%
46%
32%
38%
Comparison 2004/2003
- 28 -
Special EUROBAROMETER 221 “Europeans and the Common Agricultural Policy”
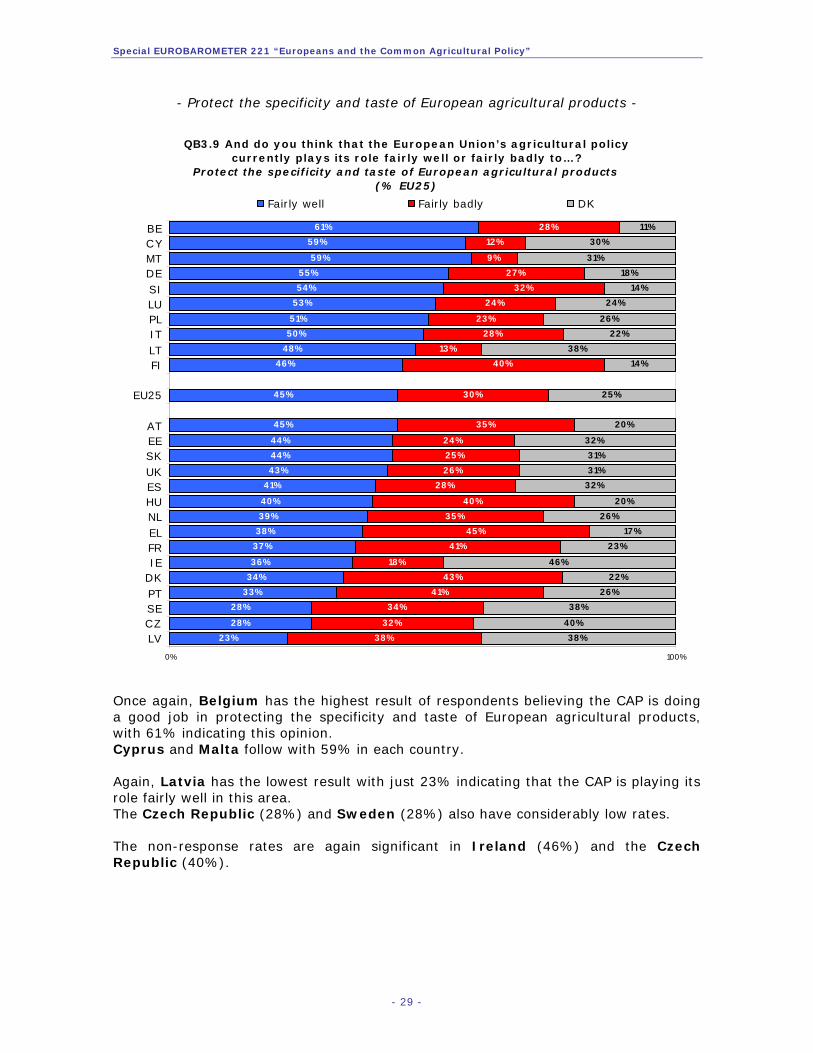
- Protect the specificity and taste of European agricultural products -
QB3.9 And do you think that the European Union’s agricultural policy currently plays its role fairly well or fairly badly to…?
Protect the specificity and taste of European agricultural products (% EU25)
61%59%
59%55%54%
53%
51%50%
48%46%
45%
45%
44%44%43%
41%
40%39%
38%37%
36%34%
33%28%
28%23%
12%
9%27%
24%
28%13%
40%
30%
35%
24%25%26%
28%
40%35%
45%41%
18%43%
41%34%
32%38%
22%
26%
32%
23%
28%
23%
31%
26%
40%
20%
11%
26%
14%
31%
46%
38%
30%
18%14%
24%
38%
25%
20%
32%
17%
22%
38%
31%
32%
0% 100%
BECYMTDESILUPLITLTFI
EU25
ATEESKUKESHUNLELFRIE
DKPTSECZLV
Fairly well Fairly badly DK
Once again, Belgium has the highest result of respondents believing the CAP is doing a good job in protecting the specificity and taste of European agricultural products, with 61% indicating this opinion. Cyprus and Malta follow with 59% in each country. Again, Latvia has the lowest result with just 23% indicating that the CAP is playing its role fairly well in this area. The Czech Republic (28%) and Sweden (28%) also have considerably low rates. The non-response rates are again significant in Ireland (46%) and the Czech Republic (40%).
- 29 -

Special EUROBAROMETER 221 “Europeans and the Common Agricultural Policy”
The comparison of results between 2004 and 2003 shows us that countries of the “old” EU 15 Member States are not following the same trend and seem split up: certain countries seeing an increase and others on the contrary a decrease. The highest increases are again observed in the United Kingdom (+21 points), Belgium (+19 points) and Italy (+16 points). The most important decreases can be seen in Ireland (-17 points) and the Netherlands (-6 points).
QB3.9 And do you think that the European Union’s agricultural policy currently playsits role fairly well or fairly badly to…?
Option: Protect the specificity and taste of European agricultural products
Answers: Fairly well
neutral
negative
Color Keypositive
Belgium
Denmark
Germany
Greece
Spain
France
Ireland
Italy
Luxembourg
The Netherlands
Austria
Portugal
Finland
Sweden
United Kingdom
+19
6
13
2
-1
-4
-17
16
6
-6
-4
0
8
2
21
+
+
+
+
+
+
+
+
61%
34%
55%
38%
41%
37%
36%
50%
53%
39%
45%
33%
46%
28%
43%
Comparison 2004/2003
- 30 -

Special EUROBAROMETER 221 “Europeans and the Common Agricultural Policy”
- Help farmers to adapt their production to consumer’s expectations –
QB3.3 And do you think that the European Union’s agricultural policy currently plays its role fairly well or fairly badly to…? Help
farmers to adapt their production to consumer’s expectations(% EU25)
62%62%
58%57%
54%52%51%
49%48%
45%
43%
43%43%43%
42%40%40%
38%38%
36%33%33%
31%30%30%
22%
13%24%
32%
30%
38%31%
44%
34%
20%27%
30%41%
32%33%
52%34%
39%44%
41%50%
43%42%
53%
12%
11%
29%
16%
18%
24%
18%
19%
28%
27%
19%
32%
11%
27%
23%
25%
25%
10%16%
17%
21%
23%
37%30%
28%
26%
27%
19%
27%
0% 100%
CYMTPLBEDELULTSIATEL
EU
IEEESKHUESITFI
UKNLFRSEDKPTLVCZ
Fairly well Fairly badly DK
Respondents in Cyprus (62%) and Malta (62%) have the highest rates indicating that the CAP plays a fairly good role in helping farmers to adapt their production to consumer’s expectations. Poland (58%) and Belgium (57%) follow. On the contrary, respondents in the Czech Republic are only 22% to indicate the same opinion, a rate that is 21 percentage points below the EU25 average.
- 31 -

Special EUROBAROMETER 221 “Europeans and the Common Agricultural Policy”
The highest increase in positive responses can be observed in Belgium (+17 points) and the United Kingdom (+17 points). Greece (+13 points), Italy (+11 points) and Luxembourg (+10 points) follow. On the other hand, this rate has decreased considerably in Ireland, dropping by 13 percentage points. The Netherlands has also seen a considerable decrease (- 6 points).
QB3.3 And do you think that the European Union’s agricultural policy currently playsits role fairly well or fairly badly to…?
Option: Help farmers to adapt their production to consumer’s expectations
Answers: Fairly well
neutral
negative
Color Keypositive
Belgium
Denmark
Germany
Greece
Spain
France
Ireland
Italy
Luxembourg
The Netherlands
Austria
Portugal
Finland
Sweden
United Kingdom
57%
31%
54%
45%
40%
33%
43%
40%
52%
36%
48%
30%
38%
33%
38%
Comparison 2004/2003
+17
0
9
13
7
-2
-13
11
10
-6
-1
1
1
4
17
+
+
+
+
+
+
+
+
+
- 32 -

Special EUROBAROMETER 221 “Europeans and the Common Agricultural Policy”
- Favour and improve life in the countryside -
QB3.4 And do you think that the European Union’s agricultural policy currently plays its role fairly well or fairly badly to…? Favour and improve life in the countryside(% EU25)
71%
59%55%
52%48%
47%47%
43%43%
43%42%
40%
40%
39%38%
37%36%
36%32%
31%29%
26%25%
23%22%
22%
22%29%
34%
42%
23%39%
48%34%
40%
36%
54%34%
47%39%
42%49%
46%51%
55%54%
63%73%
58%
34%
24%
22%
27%
36%
8%
23%
29%
21%
5%
25%
21%
16%
9%
20%
8%
20%
20%
19%
14%26%
11%
18%
24%
19%
19%
14%
15%
15%
0% 100%
MTCYPLDELTBELUIEATSIUK
EU25
SKELIT
HUESEESECZPTFRNLDKFILV
Fairly well Fairly badly DK
Maltese respondents have by far the highest response rates indicating that the Common Agricultural Policy is playing its role fairly well in favouring and improving life in the countryside. Indeed 71% of citizens in Malta are of this opinion, which is a rate 31 percentage points above the EU25 average. Cyprus (59%) Poland (55%) and Germany (52%) follow with rates above the 50% mark. On the bottom of the graph we can see that Latvia and Finland have the lowest rates indicating this opinion, with only 22% in both countries. Denmark (23%), the Netherlands (25%) and France (26%) also have very low rates. Finland has the most negative opinion concerning the role played by the CAP in this field: 73% of Finns believe the CAP is playing its role fairly badly in this field.
- 33 -
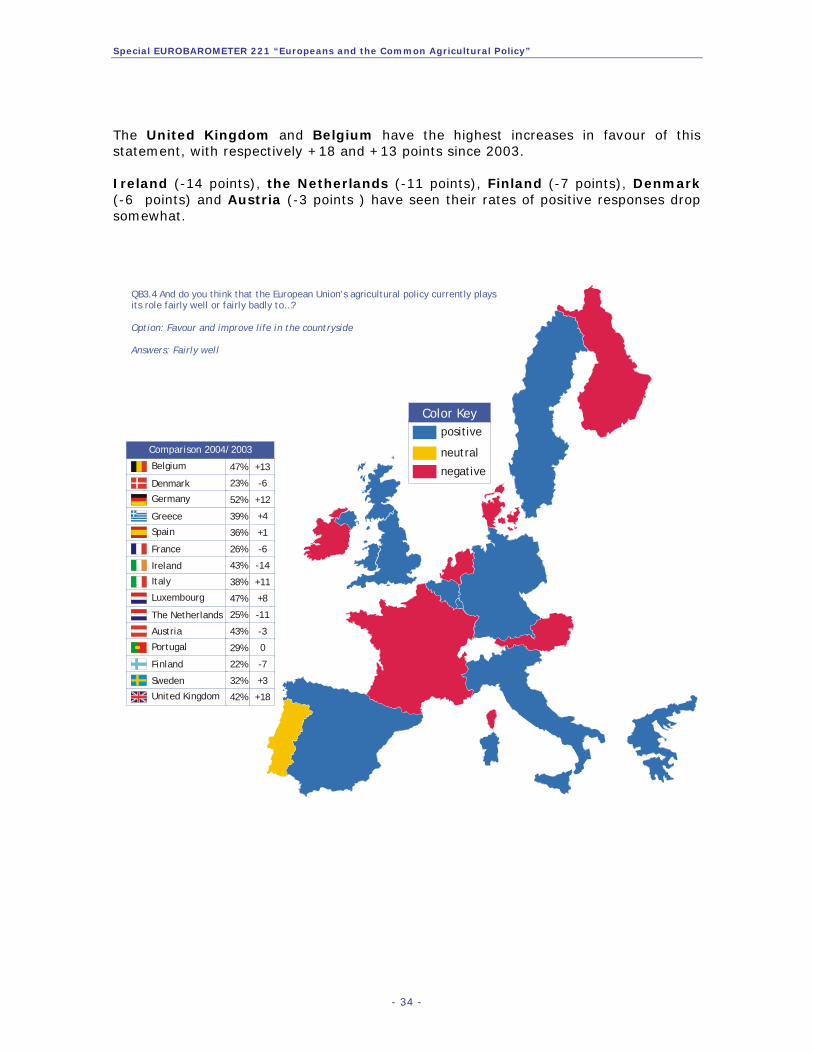
Special EUROBAROMETER 221 “Europeans and the Common Agricultural Policy”
The United Kingdom and Belgium have the highest increases in favour of this statement, with respectively +18 and +13 points since 2003. Ireland (-14 points), the Netherlands (-11 points), Finland (-7 points), Denmark (-6 points) and Austria (-3 points ) have seen their rates of positive responses drop somewhat.
QB3.4 And do you think that the European Union’s agricultural policy currently playsits role fairly well or fairly badly to…?
Option: Favour and improve life in the countryside
Answers: Fairly well
neutral
negative
Color Keypositive
Belgium
Denmark
Germany
Greece
Spain
France
Ireland
Italy
Luxembourg
The Netherlands
Austria
Portugal
Finland
Sweden
United Kingdom
+13
-6
12
4
1
-6
-14
11
8
-11
-3
0
-7
3
18
+
+
+
+
+
+
+
47%
23%
52%
39%
36%
26%
43%
38%
47%
25%
43%
29%
22%
32%
42%
Comparison 2004/2003
- 34 -

Special EUROBAROMETER 221 “Europeans and the Common Agricultural Policy”
- Ensure stable and adequate incomes for farmers -
QB3.1 And do you think that the European Union’s agricultural
policy currently plays its role fairly well or fairly badly to…? Ensure stable and adequate incomes for farmers (% EU25)
54%52%
50%
47%47%
46%43%43%
41%
41%
37%
35%
34%34%33%33%
32%31%
30%30%
29%27%
23%23%
18%13%
34%33%
21%
44%
23%40%
35%
43%
51%
34%42%
56%46%
42%63%
42%52%
47%51%59%60%
58%62%
34%
6%
23%
35%
34%
18%
11%
18%
24%
27%
12%
23%
24%
25%
24%
26%
14%
32%30%
10%
19%
21%
13%
32%
28%
22%
17%
16%
21%
0% 100%
DEDKPLIELTBELUMTATCY
EU25
SIIT
UKELSEEEFI
ESNLSKPTFRHULVCZ
Fairly well Fairly badly DK
Only in three countries out of the 25 does a majority of respondents believe that the Common Agricultural Policy is playing its role fairly well in ensuring stable and adequate incomes for farmers. These are Germany (54%), Denmark (52%) and Poland (50%). The lowest rates are found in the Czech Republic (13%) and Latvia (18%). Finland is the country where we see the most negative opinion towards the CAP in this area, since 63% of its respondents declare that the CAP is playing its role rather badly here.
- 35 -

Special EUROBAROMETER 221 “Europeans and the Common Agricultural Policy”
The map below shows us that Germany has seen the sharpest increase in its rate of positive responses since 2003 (+18 points). The United Kingdom (+16 points), Belgium (+15 points), Italy (+14 points) and Denmark (+13 points) also have significant increases. In the Netherlands, the rate has dropped by 7 points, making this the most important decrease among the 15 surveyed countries.
Comparison 2004/2003
QB3.1 And do you think that the European Union’s agricultural policy currently playsits role fairly well or fairly badly to…?
Option: Ensure stable and adequate incomes for farmers
Answers: Fairly well
neutral
negative
Color Keypositive
Belgium
Denmark
Germany
Greece
Spain
France
Ireland
Italy
Luxembourg
The Netherlands
Austria
Portugal
Finland
Sweden
United Kingdom
46%
52%
54%
33%
30%
23%
47%
34%
43%
30%
41%
27%
31%
33%
34%
+15
+13
+18
+6
0
-4
-5
+14
+5
-6
-1
+2
-2
+7
+16
- 36 -

Special EUROBAROMETER 221 “Europeans and the Common Agricultural Policy”
- Reduce development gaps between regions -
QB3.5 And do you think that the European Union’s agricultural policy currently plays its role fairly well or fairly badly to…? Reduce development gaps between regions(% EU25)
52%48%
45%45%
42%41%41%
39%38%
37%
36%35%35%
34%34%34%34%33%
31%31%
29%28%
27%26%
22%17%
41%29%30%
33%
20%51%
37%
52%38%
37%43%
39%36%
46%44%
23%39%
31%61%
48%47%
50%53%
41%
26%
22%
23%
13%
32%
30%
27%
26%
28%
21%
16%
46%
12%
23%
40%
30%
12%
25%34%
26%
10%
26%28%
47%
11%
27%
26%
30%
0% 100%
DEBELUPLCYATMTLTSI
EU25
ELNLSEDKESIT
HUSKIEEEUKFIPTFRCZLV
Fairly well Fairly badly DK
Only in Germany does a majority of citizens (52%) believe that the Common Agricultural Policy is currently playing its role fairly well in reducing development gaps between regions. This can perhaps be explained by the fact that that Germany is a major contributor to the EU budget and has also seen Eastern Germany benefit from this help brought by the CAP. Again, Latvia has the lowest result in favour of the CAP, with only 17% of its citizens believing that the CAP is doing its job fairly well. The non-response rates are significantly high in Ireland (47%), Malta (46%), Lithuania (41%) and the United Kingdom (40%). Once again, we can note that Finland has the strongest rate of negative opinions towards the CAP concerning this issue, at 61%.
- 37 -

Special EUROBAROMETER 221 “Europeans and the Common Agricultural Policy”
Belgium (+16 points) and Germany (+16 points) have seen their rates of positive responses increase the most since 2003. Ireland has the most significant decrease with a drop of 12 percentage points.
QB3.5 And do you think that the European Union’s agricultural policy currently playsits role fairly well or fairly badly to…?
Option: Reduce development gaps between regions
Answers: Fairly well
neutral
negative
Color Keypositive
Belgium
Denmark
Germany
Greece
Spain
France
Ireland
Italy
Luxembourg
The Netherlands
Austria
Portugal
Finland
Sweden
United Kingdom
+16
+13
+16
+7
-1
-1
-12
+9
+3
-6
-5
+2
+1
+6
+13
48%
34%
52%
36%
34%
26%
31%
34%
45%
35%
41%
27%
28%
35%
29%
Comparison 2004/2003
- 38 -

Special EUROBAROMETER 221 “Europeans and the Common Agricultural Policy”
- Protect small or medium sized farms -
QB3.10 And do you think that the European Union’s agricultural policy currently plays its role fairly well or fairly badly to…?
Protect small or medium sized farms (% EU25)
47%
45%
43%
40%
37%
37%
36%
35%
33%
32%
31%
30%
30%
29%
28%
28%
27%
25%
24%
22%
22%
20%
17%
17%
15%
11%
18%
44%
32%
48%
46%
39%
43%
52%
49%
41%
61%
60%
35%
47%
50%
52%
66%
60%
64%
56%
62%
67%
85%
20%
17%
24%
54%
37%
36%
12%
12%
27%
18%
26%
18%
27%
25%
21%
10%
18%
4%
37%
28%
9%
15%
28%
29%
24%
16%
22%
14%
37%
0% 100%
LUMT
DELTBE
ATITPLCY
SKHU
EU25
ESSI
ELIE
UK
PTEEDKSE
NLCZLV
FRFI
Fairly well Fairly badly DK
The area for which the CAP received the lowest rates of positive answers is for its role in protecting small or medium sized farms. Indeed, we can note that in none of the 25 surveyed countries do we see rates above the 50% mark. The highest positive response rates are found in Luxembourg (47%) and Malta (45%). The lowest rate is observed in Finland where only 11% of Finnish citizens believe that the CAP is playing its role fairly well in protecting these farmers. Indeed, the rate of respondents indicating “fairly badly” rises to 85%, which is 36 percentage points above the EU25 average. As seen earlier, the Finns show certain discontent with the current role played by the CAP for certain specific areas, which certainly influence directly the agriculture in this country.
- 39 -

Special EUROBAROMETER 221 “Europeans and the Common Agricultural Policy”
The map below shows that Italy has seen its rate increase the most since 2003, up 12 percentage points. Germany (+10 points), Belgium (+9 points) and Luxembourg (+9 points) also have considerable increases in their rates of positive answers. On the other hand, Ireland (-16 points) and the Netherlands (-13 points) have seen their rates drop significantly since 2003.
QB3.10 And do you think that the European Union’s agricultural policy currently playsits role fairly well or fairly badly to…?
Option: Protect small or medium sized farms
Answers: Fairly well
neutral
negative
Color Keypositive
Belgium
Denmark
Germany
Greece
Spain
France
Ireland
Italy
Luxembourg
The Netherlands
Austria
Portugal
Finland
Sweden
United Kingdom
+9
+4
+10
+1
0
-9
-16
+12
+9
-13
-6
+4
-7
-1
+7
37%
22%
43%
28%
30%
15%
28%
36%
47%
20%
37%
25%
11%
22%
27%
Comparison 2004/2003
As we have seen throughout this part of the analysis, the Irish result compared with last year’s has tendency to drop significantly in almost all fields tested. The reform of the CAP’s functioning has left many Irish farmers significantly discontent with this reformed system, as some of their interests have been put into question. This discontent has no doubt reflected on the public opinion in Ireland, which can perhaps explain the decrease of positive opinions as to the perception of the role played by the CAP.
- 40 -

Special EUROBAROMETER 221 “Europeans and the Common Agricultural Policy”
4. Development of the Common Agricultural Policy In this final part we will look at how Europeans judge the development made to the Common Agricultural Policy. Indeed, respondents were explained that on the one hand the European Union is subsidising less and less its agricultural products, and on the other, it is granting more funds for the protection and development of the overall rural economy and for direct support to farmers. Source questionnaire: QB4
- A clear majority of Europeans sees the development of the CAP as a good thing-
QB4 The EU is subsidising agricultural products less and less. However, it is granting more funds for the protection and development of the overall rural
economy and for direct support to farmers. Do you think that this development is…? (% EU25)
N either go o d no r bad thing
(SP ON T A N EOUS)9%
D K8%
a go o d thing66%
a bad thing 17%
When asked what they thought about the development of the Common Agricultural Policy as explained above, a majority of European citizens within the 25 EU Member States indicates that they believe it is a good thing, with a rate of 66%, among which 13% believes it is a very good thing and 53% that it is a fairly good thing. On the contrary, a total of 17% of respondents in the 25 EU Member States believes that this development is a bad thing, among which 13% indicate it is a fairly bad thing and only 4% that it is a very bad thing. 9% of respondents mention that this development is neither a good thing nor a bad thing, and 8% answer that they don’t know. We can conclude that European citizens are satisfied with the reforms taken to develop and modify the CAP from a subsidising system in to a more cost effective and market-oriented system benefiting both consumers and farmers.
- 41 -

Special EUROBAROMETER 221 “Europeans and the Common Agricultural Policy”
When observing the country results, we can see that Poland has the highest rate of respondents indicating that this development of the EU’s agricultural policy is a good thing. With a total of 77%, the Polish result is 11 percentage points above the EU25 average. Luxembourg follows with a rate of 76%. Countries with the lowest rates in favour of this development are Portugal (52%), Italy (54%), Greece (54%), Austria (55%), Denmark (55%) and Spain (56%) with rates below the 60% mark. Nevertheless, all of these countries have a majority in favour of this development.
EU25 66%
Belgium 71%
Denmark 55%
Germany 71%
Spain 56%
France 68%
Ireland 63%
Italy 54%
Luxembourg 76%
The Netherlands 71%
Austria 55%
Portugal 52%
Finland 67%
Sweden 62%
United Kingdom 73%
Cyprus 68%
Czech Republic 62%
Estonia 71%
Hungary 70%
Latvia 68%
Lithuania 71%
Malta 67%
Poland 77%
Slovakia 65%
Slovenia 71%
71% - 100%
61% - 70%
0% - 60%
Legend
Country Results
QB4 The European Union is subsidising agricultural products less and less. However, itis granting more funds for the protection and development of the overall rural economyand for direct support to farmers. Do you think that this development is…?
Answers: A good thing
Greece 54%
- 42 -

Special EUROBAROMETER 221 “Europeans and the Common Agricultural Policy”
The table below shows the comparison of the results of this years’ survey with those of the surveys conducted in 2003 and 2002 for both the EU15 average and the Candidate country average. Please note that the results for 2003 only enclose the 15 “old” EU Member States as this survey was not conducted in the Candidate Countries that same year. We can say that although there is a slight rise in the rate of positive answers in 2004 (66%) compared to 2003 (59%) and 2002 (62%) (with the exception of the Candidate country rate in 2002 – 67%), we can also observe that the negative response rate has also slightly risen (up 2 points from 2003). This is due to the fact that the rate of non-responses has decreased and because somewhat fewer respondents tend to answer neutrally, namely “neither good nor bad”. If we look at the Candidate country average in 2002, we can say that the rate of positive answers was slightly higher than it is in 2004 for the EU25 average. The rate of non-responses was also considerably higher, at 24% compared to 8% in 2004.
QB4 The European Union is subsidising agricultural products less and less. However, it is granting more funds for the protection and development of the overall rural economy and for direct support to
farmers. Do you think that this development is…?
66%
59%
62%
67%
15%
14%
10%
8%
15%
13%
24%
17%
11%
12%
9%
0% 100%
2004 (EU25)
2003 (EU15)
2002 (EU15)
2002 (CC13)
A good thing A bad thing Neither good nor bad thing (SPONTANEOUS) DK
- 43 -

Special EUROBAROMETER 221 “Europeans and the Common Agricultural Policy”
The map below shows the comparison of country results between 2004 and 2003 for the “old” EU15 countries and results between 2004 and 2002 for the “old” Candidate countries, which have become the new Member States in May 2004. We can see that in the majority of countries throughout the 25 EU Member States, there has been an increase in respondents believing the development of the CAP is a good thing. The most significant increases can be seen in the new Member States where 9 out of 10 countries have seen an increase since 2002. Lithuania has the highest increase with +23 percentage points. Slovenia and Estonia follow with respectively +14 and +13 points compared to 2002. Among the “old” EU15 countries we can see that the highest increase since 2003 results is found in France (+9 points). Sweden and Luxembourg follow with both +8 points compared to the 2003 survey. While in Ireland, Denmark and Greece the rates have remained unchanged, we can note a decrease of positive results in only 3 countries namely Hungary (-5 points) since 2002, and Portugal (-4 points) as well as Austria (-1 point) since 2003.
QB4 The European Union is subsidising agricultural products less and less. However, itis granting more funds for the protection and development of the overall rural economyand for direct support to farmers. Do you think that this development is…?
Answers: A good thing
neutral
negative
Color Keypositive
Belgium
Denmark
Germany
Greece
Spain
France
Ireland
Italy
Luxembourg
The Netherlands
Austria
Portugal
Finland
Sweden
United Kingdom
71%
55%
71%
54%
56%
68%
63%
54%
76%
71%
55%
52%
67%
62%
73%
Comparison 2004/2003
+5
0
+7
0
+2
+9
0
+3
+8
+1
-1
-4
+4
+8
+6
Czech Republic
Estonia
Hungary
Latvia
Lithuania
Malta
Poland
Slovakia
Slovenia
Cyprus 68%
62%
71%
70%
68%
71%
67%
77%
65%
71%
+8
+12
+13
-5
+6
+23
+3
+8
+6
+14
Comparison 2004/2002
- 44 -

Special EUROBAROMETER 221 “Europeans and the Common Agricultural Policy”
Analysis by socio-demographic characteristics A good
thingA bad thing
EU25 66% 17%
Sex
Male 67% 18%
Female 65% 16%
Age
15-24 68% 15%
25-39 68% 17%
40-54 66% 18%
55 + 63% 17%
Education (End of)
15 59% 19%
16-19 67% 17%
20+ 70% 17%
Still Studying 71% 13%
Respondant occupation scale
Self- employed 62% 22%
Mana-gers 74% 16%
Other white collars 66% 18%
Manual workers 65% 17%
House persons 61% 16%
Unem-ployed 65% 18%
Retired 64% 17%
Students 71% 13%
Subjective urbanisation
Rural village 64% 18%
Small/mid size town 66% 18%
Large town 68% 15%
Results by socio-demographic characteristics show us that there are only few discrepancies among the different categories. The level of education shows us that persons having studied until the age of 20 years or above (70%) as well as persons currently studying (71%) are more numerous than those with the lowest level of education (59%) to believe that the development of the CAP is a good thing. The occupational scale shows us that managers (74%) are far more numerous than the other occupational categories to believe that the development of the CAP is a good thing.
- 45 -
Special EUROBAROMETER 221 “Europeans and the Common Agricultural Policy”
CONCLUSION The analysis has shown that the European citizens of the enlarged European Union continue to praise the advantages of the Common Agricultural Policy and the role it is playing in the European agriculture. Furthermore, Europeans continue to express the benefits of transforming the Common Agricultural Policy in the way it supports farmers. The advantages of the CAP are widespread and Europeans seem to agree, although to a somewhat lesser extent than in the previous surveys, with the various areas where the CAP’s intervention can be an advantage. The main advantages as seen in earlier reports continue to remain the fact that the CAP ensures the safety and the quality of the food that is purchased by Europeans. Somewhat more than in 2003 and 2002, Europeans also recognise the importance of the information on the geographical origin of the food, which has become a benefit consumers now see in the CAP. Respondents in Cyprus and Malta seem to agree the most with the advantages presented by the CAP while citizens in Sweden and Denmark are somewhat less convinced by these advantages. Contrarily to what was perceived in 2003 and 2002, we have also observed a rise in the belief among Europeans that the CAP favours the consumers rather than farmers while in 2003 and 2002 it was mostly thought that it favours both equally. Concerning the main priorities of the European Union in terms of agricultural policy, we have seen in this report that the main priority is ensuring stable and adequate incomes for farmers. The second most important priority is to ensure that agricultural products are healthy and safe, and the third most important priority is to promote the respect of the environment. The latter priority is however clearly less indicated in the New Member States than in the former 15 EU Member States. The socio-demographic results have also shown us that the perception of the CAP also varies with age, the level of education as well as the locality type of respondents. When asked to rate the way the CAP is currently playing its role in different areas, results show that Europeans have a quite positive opinion. Indeed, in the majority of areas tested, most Europeans judge that the CAP is playing its role fairly well. The most positive opinions come from Cyprus and Malta, while countries such as Denmark, Latvia, Sweden and to some extent Finland show dissatisfaction in certain specific areas. When comparing results with 2003 for the former 15 EU Member States, we can also note that in general there is an increase in the positive opinions of Europeans towards the role played by the CAP. This is especially the case in countries such as the United Kingdom or Belgium. On the contrary, we have seen that respondents in Ireland are rather dissatisfied with the current role of the CAP, and that their opinion has considerably dropped since last years survey, most probably due to the strong discontent of Irish farmers with the reform of the CAP. Finally, a clear majority of European citizens in the 25 EU Member States would like to see a continuation of the CAP’s development in the way it supports the EU farmers. Indeed, 66% of EU citizens see the adjustment of the CAP from a subsidising system to a system which funds the protection and development of the overall rural economy as well as direct support to farmers as a good thing.
- 46 -

TABLES

- 1 -
TOTAL
It ensures that the food you buy is safe to
eat
It ensures that the food you buy is good
quality
It ensures that the food you buy is healthy
It ensures that the food you buy is
reasonably priced
It ensures that you
have enough
information about
the geographical area where
your foodcomes from
It ensures that you
have enough
information about how the food was produced
and processe
d
It ensures
that farmanimals are well treated
It favoursconsumers rather
than farmers
It favoursfarmers rather than
consumers
It favoursequally farmers
and consumer
s
None of these
(SPONTANEOUS)
DK
EU25 24999 35% 33% 26% 22% 29% 22% 19% 20% 12% 18% 8% 8%
BE 1011 43% 44% 33% 32% 32% 22% 22% 26% 11% 22% 8% 2%DK 1011 31% 29% 19% 40% 27% 22% 19% 15% 37% 21% 5% 2%D-W 1001 30% 39% 23% 32% 41% 25% 19% 21% 11% 20% 7% 4%DE 1533 30% 37% 24% 31% 40% 24% 19% 19% 11% 20% 8% 4%D-E 532 30% 31% 25% 24% 36% 22% 18% 14% 9% 21% 13% 4%EL 1000 37% 35% 30% 20% 29% 20% 12% 17% 6% 18% 19% 4%ES 1045 36% 38% 35% 18% 25% 21% 17% 19% 11% 13% 9% 13%FR 1004 32% 28% 25% 14% 36% 16% 15% 26% 12% 17% 10% 6%IE 1000 48% 42% 35% 19% 23% 22% 22% 16% 12% 19% 4% 15%IT 1005 32% 29% 25% 19% 29% 28% 13% 8% 7% 11% 9% 10%LU 510 46% 50% 32% 39% 40% 26% 25% 25% 14% 23% 9% 4%NL 1016 56% 46% 29% 32% 31% 28% 19% 33% 14% 22% 3% 4%AT 1030 33% 35% 22% 20% 35% 30% 24% 19% 10% 25% 13% 7%PT 1000 33% 28% 25% 20% 24% 21% 14% 12% 7% 13% 11% 17%FI 1028 53% 49% 31% 37% 26% 22% 29% 44% 9% 16% 3% 1%SE 1009 25% 24% 13% 28% 28% 13% 9% 28% 27% 15% 10% 2%UK 1366 39% 27% 26% 21% 14% 16% 19% 24% 20% 16% 5% 13%CY 500 76% 73% 61% 20% 49% 36% 41% 19% 7% 32% 3% 3%CZ 1120 41% 23% 25% 19% 47% 21% 25% 19% 19% 19% 7% 6%EE 1000 34% 39% 28% 24% 20% 15% 19% 19% 13% 20% 6% 10%HU 1000 34% 38% 32% 29% 24% 21% 24% 14% 8% 24% 16% 6%LV 1000 35% 38% 28% 17% 21% 20% 26% 27% 13% 17% 5% 13%LT 1004 36% 38% 33% 22% 19% 21% 22% 20% 9% 23% 7% 11%MT 500 72% 75% 75% 51% 41% 47% 45% 17% 11% 39% 1% 3%PL 1000 27% 33% 22% 17% 18% 20% 32% 17% 13% 25% 5% 7%SK 1307 32% 31% 24% 19% 23% 29% 17% 27% 7% 23% 9% 5%SI 1000 54% 44% 41% 52% 49% 28% 31% 46% 12% 23% 3% 3%
QB1 European Union agricultural policy aims to benefit consumers as well as farmers. With which of the following statements do you agree? (MULTIPLE ANSWERS POSSIBLE)

- 2 -
TOTAL
It ensures that the food you buy is safe to
eat
It ensures that the food you buy is good
quality
It ensures that the food you buy is healthy
It ensures that the food you buy is
reasonably priced
It ensures that you
have enough
information about
the geographical area where
your foodcomes from
It ensures that you
have enough
information about how the food was produced
and processe
d
It ensures
that farmanimals are well treated
It favoursconsumers rather
than farmers
It favoursfarmers rather than
consumers
It favoursequally farmers
and consumer
s
None of these
(SPONTANEOUS)
DK
EU25 24999 35% 33% 26% 22% 29% 22% 19% 20% 12% 18% 8% 8%SexMale 12056 36% 34% 27% 23% 29% 22% 19% 20% 15% 18% 8% 6%Female 12943 34% 32% 26% 22% 28% 21% 18% 20% 10% 17% 9% 9%Age15-24 3817 38% 37% 26% 21% 30% 24% 18% 24% 10% 19% 5% 10%25-39 6631 37% 35% 26% 21% 33% 24% 18% 22% 12% 17% 7% 6%40-54 6381 33% 31% 25% 23% 28% 22% 20% 19% 12% 17% 9% 6%55 + 8163 32% 32% 27% 23% 26% 18% 19% 17% 14% 18% 10% 9%Education (End of)15 6321 30% 30% 26% 22% 22% 18% 18% 16% 10% 16% 11% 12%16-19 9862 35% 33% 26% 22% 29% 22% 20% 20% 12% 17% 8% 7%20+ 5876 37% 34% 26% 24% 34% 24% 18% 23% 16% 19% 6% 4%Still Study 2469 39% 38% 28% 21% 33% 26% 18% 23% 11% 20% 4% 8%Household composition1 4244 33% 32% 27% 22% 23% 19% 19% 18% 14% 18% 9% 10%2 7388 33% 33% 26% 24% 28% 20% 18% 18% 13% 19% 10% 7%3 4956 35% 32% 25% 21% 30% 21% 19% 21% 11% 15% 9% 8%4+ 8410 36% 35% 27% 22% 31% 24% 20% 22% 11% 19% 6% 7%Place of birthSurveyed 23483 35% 33% 26% 22% 29% 22% 19% 20% 12% 17% 8% 8%EU 674 32% 27% 26% 23% 23% 16% 15% 17% 11% 23% 9% 8%Europe ou 303 25% 35% 15% 28% 23% 18% 20% 14% 8% 21% 12% 8%Outside E 512 42% 38% 29% 28% 20% 18% 20% 20% 12% 18% 4% 6%Parents' birth2 born cou 22128 35% 33% 26% 22% 29% 22% 19% 20% 12% 17% 8% 8%1 country 834 33% 31% 23% 25% 34% 20% 17% 19% 16% 18% 10% 5%2EU 810 32% 32% 22% 24% 28% 18% 16% 20% 10% 21% 10% 8%At least 1 1137 40% 35% 28% 28% 24% 18% 25% 22% 13% 20% 6% 7%Left-Right scale(1-4) Left 6482 35% 33% 26% 25% 34% 24% 18% 21% 15% 17% 7% 5%(5-6) Cen 8436 37% 35% 27% 23% 29% 21% 21% 22% 12% 19% 7% 6%(7-10) Rig 4073 38% 37% 28% 24% 31% 25% 21% 22% 14% 20% 8% 4%Respondant occupation scaleSelf- emp 1954 36% 33% 26% 22% 35% 26% 20% 23% 13% 17% 9% 5%Mana-gers 2346 38% 33% 24% 25% 36% 26% 18% 22% 20% 18% 5% 3%Other whi 2713 36% 33% 25% 24% 32% 24% 16% 22% 11% 16% 6% 7%Manual wo 5223 34% 34% 26% 22% 29% 21% 19% 21% 11% 18% 8% 8%House per 2468 33% 32% 27% 19% 25% 19% 17% 16% 8% 15% 11% 12%Unem-plo 1726 34% 32% 26% 22% 23% 20% 21% 20% 10% 17% 8% 9%Retired 6099 33% 32% 27% 23% 24% 18% 20% 17% 14% 18% 11% 9%Students 2469 39% 38% 28% 21% 33% 26% 18% 23% 11% 20% 4% 8%Subjective urbanisationRural villa 8583 33% 34% 26% 22% 28% 20% 21% 23% 11% 18% 8% 8%Small/�m 10127 35% 33% 27% 22% 30% 22% 18% 19% 13% 17% 8% 7%Large tow 6214 35% 33% 26% 23% 28% 23% 18% 17% 14% 18% 8% 9%
QB1 European Union agricultural policy aims to benefit consumers as well as farmers. With which of the following statements do you agree? (MULTIPLE ANSWERS POSSIBLE)

- 3 -
TOTAL
Ensure stable and
adequate incomes
for farmers
Make Europeanagriculture more
competitive on world
markets
Help farmers to adapt
their productio
n to consumer
’s expectati
ons
Favour and
improve life in thecountrysi
de
Reduce development gaps between regions
Encourage the
diversification of
agricultural
products and
activities
Favour methods
of organic
production
Promote the
respect of
environment
Protect the
specificity and
taste of Europeanagricultur
al products
Protect small or medium
sized farms
Ensure that
agricultural
products are
healthy and safe
Protect the
welfare of farm animals
None of these
(SPONTANEOUS)
DK
EU25 24999 36% 25% 22% 26% 16% 11% 20% 28% 7% 23% 30% 16% 2% 5%
BE 1011 37% 22% 30% 20% 13% 13% 25% 30% 9% 28% 38% 13% 1% 1%DK 1011 18% 25% 22% 11% 14% 7% 30% 48% 5% 18% 37% 43% 1% 1%D-W 1001 34% 31% 20% 21% 16% 11% 26% 24% 4% 20% 31% 18% 2% 4%DE 1533 34% 33% 21% 22% 16% 11% 27% 24% 3% 20% 31% 17% 2% 4%D-E 532 32% 43% 22% 24% 17% 11% 27% 24% 2% 19% 31% 15% 2% 2%EL 1000 61% 27% 25% 43% 15% 12% 19% 22% 3% 20% 24% 6% 1% 2%ES 1045 40% 21% 19% 43% 17% 8% 10% 24% 4% 22% 18% 8% 2% 9%FR 1004 38% 23% 23% 20% 17% 9% 18% 46% 11% 29% 33% 10% 0% 3%IE 1000 31% 18% 17% 26% 12% 9% 17% 30% 5% 23% 34% 15% 1% 14%IT 1005 26% 33% 24% 16% 17% 14% 18% 26% 12% 13% 28% 9% 3% 5%LU 510 30% 18% 23% 24% 11% 7% 27% 40% 8% 32% 29% 24% 2% 2%NL 1016 38% 22% 18% 17% 14% 15% 30% 30% 10% 24% 37% 25% 1% 2%AT 1030 36% 22% 23% 30% 15% 23% 29% 25% 12% 21% 24% 14% 2% 2%PT 1000 40% 23% 23% 39% 18% 10% 11% 23% 14% 17% 26% 10% 1% 8%FI 1028 46% 15% 16% 34% 22% 9% 19% 32% 5% 35% 32% 18% 0% 0%SE 1009 19% 14% 22% 27% 10% 17% 28% 38% 5% 26% 42% 40% 1% 1%UK 1366 29% 14% 17% 17% 10% 8% 17% 36% 5% 25% 36% 36% 2% 8%CY 500 47% 20% 35% 50% 9% 8% 18% 32% 6% 18% 37% 6% - 3%CZ 1120 25% 31% 31% 31% 18% 12% 20% 30% 5% 20% 33% 11% 1% 5%EE 1000 41% 19% 18% 53% 15% 6% 32% 19% 6% 27% 16% 5% 0% 7%HU 1000 46% 27% 16% 45% 23% 8% 18% 17% 11% 27% 30% 7% 2% 3%LV 1000 34% 21% 18% 51% 20% 6% 16% 21% 4% 37% 24% 6% 6% 1%LT 1004 45% 16% 34% 54% 11% 14% 29% 8% 2% 31% 20% 4% 2% 8%MT 500 34% 21% 32% 20% 8% 6% 17% 41% 6% 15% 50% 15% 0% 6%PL 1000 49% 21% 26% 32% 21% 6% 24% 12% 4% 30% 24% 9% 1% 4%SK 1307 37% 29% 23% 29% 36% 17% 17% 18% 7% 27% 16% 13% 1% 4%SI 1000 40% 15% 22% 38% 27% 9% 32% 23% 4% 35% 32% 13% 0% 2%
QB2 In your opinion, which of the following should be the three main priorities of the European Union in terms of agriculture policy? (MAX. 3 ANSWERS)
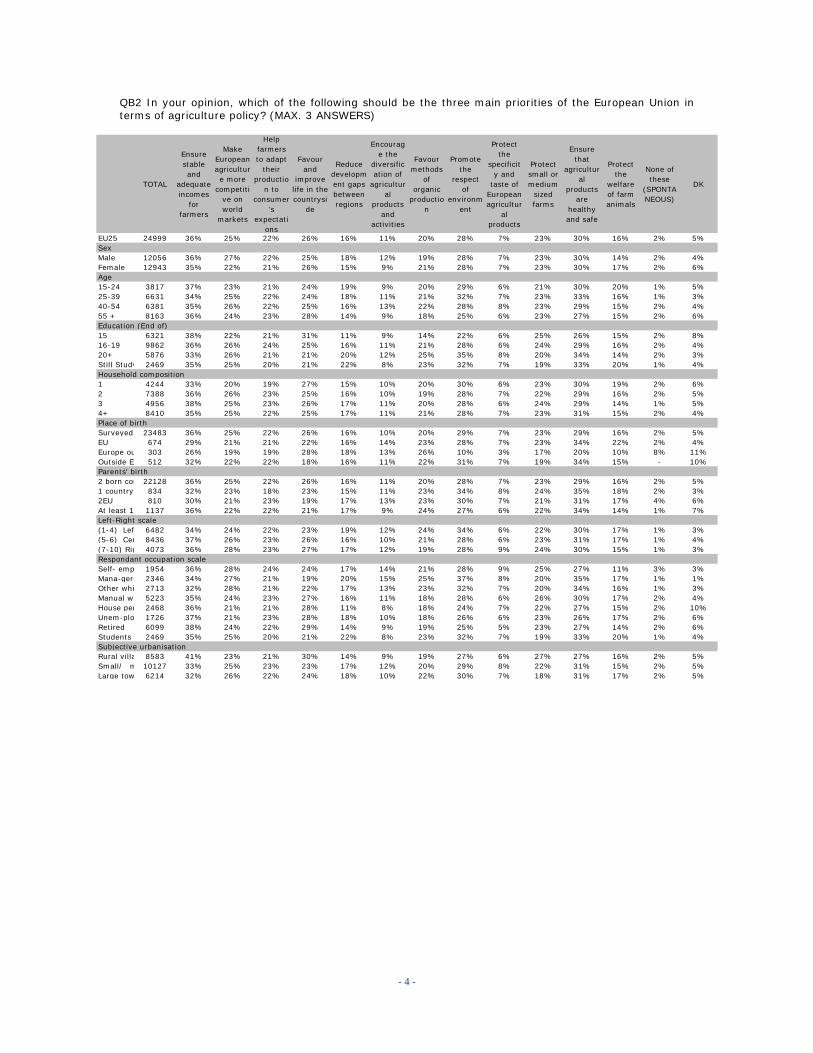
- 4 -
TOTAL
Ensure stable and
adequateincomes
for farmers
Make Europeanagriculture more
competitive on world
markets
Help farmers to adapt
their productio
n to consumer
’s expectati
ons
Favour and
improve life in thecountrysi
de
Reduce development gaps between regions
Encourage the
diversification of
agricultural
products and
activities
Favour methods
of organic
production
Promote the
respect of
environment
Protect the
specificity and
taste of Europeanagricultur
al products
Protect small or medium
sized farms
Ensure that
agricultural
products are
healthy and safe
Protect the
welfare of farm animals
None of these
(SPONTANEOUS)
DK
EU25 24999 36% 25% 22% 26% 16% 11% 20% 28% 7% 23% 30% 16% 2% 5%SexMale 12056 36% 27% 22% 25% 18% 12% 19% 28% 7% 23% 30% 14% 2% 4%Female 12943 35% 22% 21% 26% 15% 9% 21% 28% 7% 23% 30% 17% 2% 6%Age15-24 3817 37% 23% 21% 24% 19% 9% 20% 29% 6% 21% 30% 20% 1% 5%25-39 6631 34% 25% 22% 24% 18% 11% 21% 32% 7% 23% 33% 16% 1% 3%40-54 6381 35% 26% 22% 25% 16% 13% 22% 28% 8% 23% 29% 15% 2% 4%55 + 8163 36% 24% 23% 28% 14% 9% 18% 25% 6% 23% 27% 15% 2% 6%Education (End of)15 6321 38% 22% 21% 31% 11% 9% 14% 22% 6% 25% 26% 15% 2% 8%16-19 9862 36% 26% 24% 25% 16% 11% 21% 28% 6% 24% 29% 16% 2% 4%20+ 5876 33% 26% 21% 21% 20% 12% 25% 35% 8% 20% 34% 14% 2% 3%Still Study 2469 35% 25% 20% 21% 22% 8% 23% 32% 7% 19% 33% 20% 1% 4%Household composition1 4244 33% 20% 19% 27% 15% 10% 20% 30% 6% 23% 30% 19% 2% 6%2 7388 36% 26% 23% 25% 16% 10% 19% 28% 7% 22% 29% 16% 2% 5%3 4956 38% 25% 23% 26% 17% 11% 20% 28% 6% 24% 29% 14% 1% 5%4+ 8410 35% 25% 22% 25% 17% 11% 21% 28% 7% 23% 31% 15% 2% 4%Place of birthSurveyed 23483 36% 25% 22% 26% 16% 10% 20% 29% 7% 23% 29% 16% 2% 5%EU 674 29% 21% 21% 22% 16% 14% 23% 28% 7% 23% 34% 22% 2% 4%Europe ou 303 26% 19% 19% 28% 18% 13% 26% 10% 3% 17% 20% 10% 8% 11%Outside Eu 512 32% 22% 22% 18% 16% 11% 22% 31% 7% 19% 34% 15% - 10%Parents' birth2 born cou 22128 36% 25% 22% 26% 16% 11% 20% 28% 7% 23% 29% 16% 2% 5%1 country 834 32% 23% 18% 23% 15% 11% 23% 34% 8% 24% 35% 18% 2% 3%2EU 810 30% 21% 23% 19% 17% 13% 23% 30% 7% 21% 31% 17% 4% 6%At least 1 1137 36% 22% 22% 21% 17% 9% 24% 27% 6% 22% 34% 14% 1% 7%Left-Right scale(1-4) Left 6482 34% 24% 22% 23% 19% 12% 24% 34% 6% 22% 30% 17% 1% 3%(5-6) Cen 8436 37% 26% 23% 26% 16% 10% 21% 28% 6% 23% 31% 17% 1% 4%(7-10) Rig 4073 36% 28% 23% 27% 17% 12% 19% 28% 9% 24% 30% 15% 1% 3%Respondant occupation scaleSelf- emp 1954 36% 28% 24% 24% 17% 14% 21% 28% 9% 25% 27% 11% 3% 3%Mana-gers 2346 34% 27% 21% 19% 20% 15% 25% 37% 8% 20% 35% 17% 1% 1%Other whi 2713 32% 28% 21% 22% 17% 13% 23% 32% 7% 20% 34% 16% 1% 3%Manual wo 5223 35% 24% 23% 27% 16% 11% 18% 28% 6% 26% 30% 17% 2% 4%House per 2468 36% 21% 21% 28% 11% 8% 18% 24% 7% 22% 27% 15% 2% 10%Unem-plo 1726 37% 21% 23% 28% 18% 10% 18% 26% 6% 23% 26% 17% 2% 6%Retired 6099 38% 24% 22% 29% 14% 9% 19% 25% 5% 23% 27% 14% 2% 6%Students 2469 35% 25% 20% 21% 22% 8% 23% 32% 7% 19% 33% 20% 1% 4%Subjective urbanisationRural villa 8583 41% 23% 21% 30% 14% 9% 19% 27% 6% 27% 27% 16% 2% 5%Small/�m 10127 33% 25% 23% 23% 17% 12% 20% 29% 8% 22% 31% 15% 2% 5%Large tow 6214 32% 26% 22% 24% 18% 10% 22% 30% 7% 18% 31% 17% 2% 5%
QB2 In your opinion, which of the following should be the three main priorities of the European Union in terms of agriculture policy? (MAX. 3 ANSWERS)

- 5 -
TOTALFairly well
Fairly badly
DK
EU25 24999 37% 43% 21%
BE 1011 46% 44% 10%DK 1011 52% 34% 14%D-W 1001 55% 33% 12%DE 1533 54% 34% 12%D-E 532 48% 39% 13%EL 1000 33% 56% 11%ES 1045 30% 42% 28%FR 1004 23% 59% 18%IE 1000 47% 21% 32%IT 1005 34% 34% 32%LU 510 43% 35% 23%NL 1016 30% 52% 18%AT 1030 41% 40% 19%PT 1000 27% 51% 22%FI 1028 31% 63% 6%SE 1009 33% 46% 21%UK 1366 34% 42% 25%CY 500 41% 35% 24%CZ 1120 13% 62% 26%EE 1000 32% 42% 27%HU 1000 23% 60% 17%LV 1000 18% 58% 24%LT 1004 47% 23% 30%MT 500 43% 23% 34%PL 1000 50% 33% 16%SK 1307 29% 47% 24%SI 1000 35% 51% 13%
QB3.1 And do you think that the European Union’s agricultural policy currently plays its role fairly well or fairly badly to…? Ensure stable and adequate incomes for farmers

- 6 -
TOTALFairly well
Fairly badly
DK
EU25 24999 37% 43% 21%SexMale 12056 40% 43% 17%Female 12943 34% 42% 24%Age15-24 3817 38% 40% 22%25-39 6631 35% 45% 20%40-54 6381 37% 43% 21%55 + 8163 38% 42% 20%Education (End of)15 6321 35% 41% 23%16-19 9862 36% 45% 19%20+ 5876 39% 43% 18%Still Study 2469 41% 37% 22%Household composition1 4244 36% 40% 24%2 7388 38% 43% 19%3 4956 36% 43% 20%4+ 8410 37% 43% 21%Place of birthSurveyed 23483 36% 43% 21%EU 674 47% 38% 14%Europe ou 303 53% 32% 15%Outside E 512 45% 32% 23%Parents' birth2 born cou 22128 36% 43% 21%1 country 834 39% 44% 17%2EU 810 40% 42% 18%At least 1 1137 43% 34% 23%Left-Right scale(1-4) Left 6482 39% 42% 18%(5-6) Cen 8436 38% 44% 18%(7-10) Rig 4073 41% 45% 15%Respondant occupation scaleSelf- emp 1954 35% 45% 20%Mana-gers 2346 43% 40% 18%Other whi 2713 35% 43% 22%Manual wo 5223 35% 46% 19%House per 2468 32% 41% 27%Unem-plo 1726 38% 43% 19%Retired 6099 38% 43% 19%Students 2469 41% 37% 22%Subjective urbanisationRural villa 8583 33% 47% 20%Small/�m 10127 37% 43% 20%Large tow 6214 42% 36% 22%
QB3.1 And do you think that the European Union’s agricultural policy currently plays its role fairly well or fairly badly to…? Ensure stable and adequate incomes for farmers

- 7 -
TOTALFairly well
Fairly badly
DK
EU25 24999 48% 30% 23%
BE 1011 56% 32% 12%DK 1011 48% 31% 21%D-W 1001 64% 24% 12%DE 1533 64% 23% 12%D-E 532 67% 22% 12%EL 1000 47% 39% 14%ES 1045 45% 29% 27%FR 1004 37% 38% 25%IE 1000 48% 16% 36%IT 1005 44% 30% 25%LU 510 48% 30% 22%NL 1016 40% 35% 24%AT 1030 51% 28% 22%PT 1000 36% 38% 26%FI 1028 44% 41% 15%SE 1009 37% 30% 32%UK 1366 43% 28% 29%CY 500 58% 17% 25%CZ 1120 37% 38% 25%EE 1000 46% 23% 31%HU 1000 50% 33% 18%LV 1000 28% 41% 31%LT 1004 49% 16% 35%MT 500 60% 12% 28%PL 1000 53% 24% 23%SK 1307 46% 31% 24%SI 1000 48% 37% 15%
QB3.2 And do you think that the European Union’s agricultural policy currently plays its role fairly well or fairly badly to…? Make European agriculture more competitive on world markets

- 8 -
TOTALFairly well
Fairly badly
DK
EU25 24999 48% 30% 23%SexMale 12056 50% 32% 19%Female 12943 46% 28% 26%Age15-24 3817 54% 23% 24%25-39 6631 48% 30% 21%40-54 6381 46% 32% 22%55 + 8163 45% 31% 24%Education (End of)15 6321 43% 31% 26%16-19 9862 48% 31% 22%20+ 5876 50% 30% 19%Still Study 2469 53% 23% 24%Household composition1 4244 45% 29% 26%2 7388 48% 30% 22%3 4956 49% 29% 22%4+ 8410 48% 30% 22%Place of birthSurveyed 23483 47% 30% 23%EU 674 58% 27% 15%Europe ou 303 59% 22% 19%Outside E 512 55% 24% 21%Parents' birth2 born cou 22128 47% 30% 23%1 country 834 47% 31% 22%2EU 810 49% 30% 21%At least 1 1137 55% 24% 21%Left-Right scale(1-4) Left 6482 51% 30% 19%(5-6) Cen 8436 49% 30% 20%(7-10) Rig 4073 51% 31% 17%Respondant occupation scaleSelf- emp 1954 46% 36% 18%Mana-gers 2346 52% 31% 17%Other whi 2713 46% 32% 22%Manual wo 5223 48% 30% 21%House per 2468 43% 28% 29%Unem-plo 1726 49% 29% 22%Retired 6099 46% 29% 25%Students 2469 53% 23% 24%Subjective urbanisationRural villa 8583 45% 32% 23%Small/�m 10127 47% 30% 23%Large tow 6214 52% 26% 23%
QB3.2 And do you think that the European Union’s agricultural policy currently plays its role fairly well or fairly badly to…? Make European agriculture more competitive on world markets

- 9 -
TOTALFairly well
Fairly badly
DK
EU25 24999 43% 34% 23%
BE 1011 57% 32% 10%DK 1011 31% 50% 19%D-W 1001 54% 30% 16%DE 1533 54% 29% 16%D-E 532 56% 28% 16%EL 1000 45% 44% 11%ES 1045 40% 32% 27%FR 1004 33% 44% 23%IE 1000 43% 20% 37%IT 1005 40% 33% 27%LU 510 52% 30% 17%NL 1016 36% 39% 24%AT 1030 48% 31% 21%PT 1000 30% 43% 27%FI 1028 38% 52% 11%SE 1009 33% 41% 26%UK 1366 38% 34% 28%CY 500 62% 18% 19%CZ 1120 22% 53% 25%EE 1000 43% 27% 30%HU 1000 42% 41% 18%LV 1000 30% 42% 28%LT 1004 51% 16% 32%MT 500 62% 13% 25%PL 1000 58% 24% 19%SK 1307 43% 30% 27%SI 1000 49% 38% 12%
QB3.3 And do you think that the European Union’s agricultural policy currently plays its role fairly well or fairly badly to…? Help farmers to adapt their production to consumer’s expectations

- 10 -
TOTALFairly well
Fairly badly
DK
EU25 24999 43% 34% 23%SexMale 12056 44% 35% 20%Female 12943 41% 34% 25%Age15-24 3817 50% 27% 23%25-39 6631 41% 36% 22%40-54 6381 40% 38% 22%55 + 8163 43% 34% 23%Education (End of)15 6321 41% 34% 25%16-19 9862 44% 35% 21%20+ 5876 42% 37% 21%Still Study 2469 49% 27% 24%Household composition1 4244 42% 32% 26%2 7388 43% 36% 21%3 4956 43% 34% 23%4+ 8410 43% 35% 22%Place of birthSurveyed 23483 42% 35% 23%EU 674 51% 28% 21%Europe ou 303 55% 27% 18%Outside E 512 47% 31% 21%Parents' birth2 born cou 22128 42% 35% 23%1 country 834 43% 37% 19%2EU 810 44% 33% 23%At least 1 1137 48% 30% 22%Left-Right scale(1-4) Left 6482 44% 35% 20%(5-6) Cen 8436 45% 36% 20%(7-10) Rig 4073 47% 36% 17%Respondant occupation scaleSelf- emp 1954 38% 41% 21%Mana-gers 2346 42% 39% 19%Other whi 2713 40% 37% 22%Manual wo 5223 43% 36% 21%House per 2468 41% 31% 28%Unem-plo 1726 46% 33% 21%Retired 6099 43% 33% 24%Students 2469 49% 27% 24%Subjective urbanisationRural villa 8583 41% 36% 23%Small/�m 10127 44% 35% 22%Large tow 6214 45% 32% 24%
QB3.3 And do you think that the European Union’s agricultural policy currently plays its role fairly well or fairly badly to…? Help farmers to adapt their production to consumer’s expectations

- 11 -
TOTALFairly well
Fairly badly
DK
EU25 24999 40% 40% 20%
BE 1011 47% 42% 11%DK 1011 23% 63% 14%D-W 1001 53% 34% 13%DE 1533 52% 34% 14%D-E 532 51% 34% 15%EL 1000 39% 54% 8%ES 1045 36% 39% 25%FR 1004 26% 55% 19%IE 1000 43% 23% 34%IT 1005 38% 34% 29%LU 510 47% 36% 16%NL 1016 25% 54% 21%AT 1030 43% 39% 18%PT 1000 29% 51% 20%FI 1028 22% 73% 5%SE 1009 32% 49% 19%UK 1366 42% 34% 24%CY 500 59% 22% 19%CZ 1120 31% 46% 23%EE 1000 36% 42% 22%HU 1000 37% 47% 15%LV 1000 22% 58% 20%LT 1004 48% 27% 26%MT 500 71% 8% 21%PL 1000 55% 29% 15%SK 1307 40% 36% 24%SI 1000 43% 48% 9%
QB3.4 And do you think that the European Union’s agricultural policy currently plays its role fairly well or fairly badly to…? Favour and improve life in the countryside

- 12 -
TOTALFairly well
Fairly badly
DK
EU25 24999 40% 40% 20%SexMale 12056 42% 40% 18%Female 12943 38% 40% 22%Age15-24 3817 43% 36% 22%25-39 6631 37% 43% 20%40-54 6381 39% 41% 19%55 + 8163 41% 39% 20%Education (End of)15 6321 39% 39% 22%16-19 9862 41% 40% 19%20+ 5876 37% 44% 19%Still Study 2469 43% 36% 21%Household composition1 4244 40% 37% 23%2 7388 41% 41% 18%3 4956 39% 41% 20%4+ 8410 39% 41% 20%Place of birthSurveyed 23483 39% 41% 20%EU 674 49% 33% 18%Europe ou 303 61% 26% 13%Outside E 512 46% 34% 20%Parents' birth2 born cou 22128 39% 41% 20%1 country 834 43% 38% 20%2EU 810 45% 36% 19%At least 1 1137 45% 37% 18%Left-Right scale(1-4) Left 6482 40% 42% 18%(5-6) Cen 8436 42% 41% 18%(7-10) Rig 4073 41% 42% 17%Respondant occupation scaleSelf- emp 1954 38% 42% 20%Mana-gers 2346 37% 44% 18%Other whi 2713 38% 43% 19%Manual wo 5223 39% 41% 20%House per 2468 37% 36% 26%Unem-plo 1726 39% 42% 19%Retired 6099 43% 39% 18%Students 2469 43% 36% 21%Subjective urbanisationRural villa 8583 36% 45% 19%Small/�m 10127 40% 39% 20%Large tow 6214 45% 35% 20%
QB3.4 And do you think that the European Union’s agricultural policy currently plays its role fairly well or fairly badly to…? Favour and improve life in the countryside
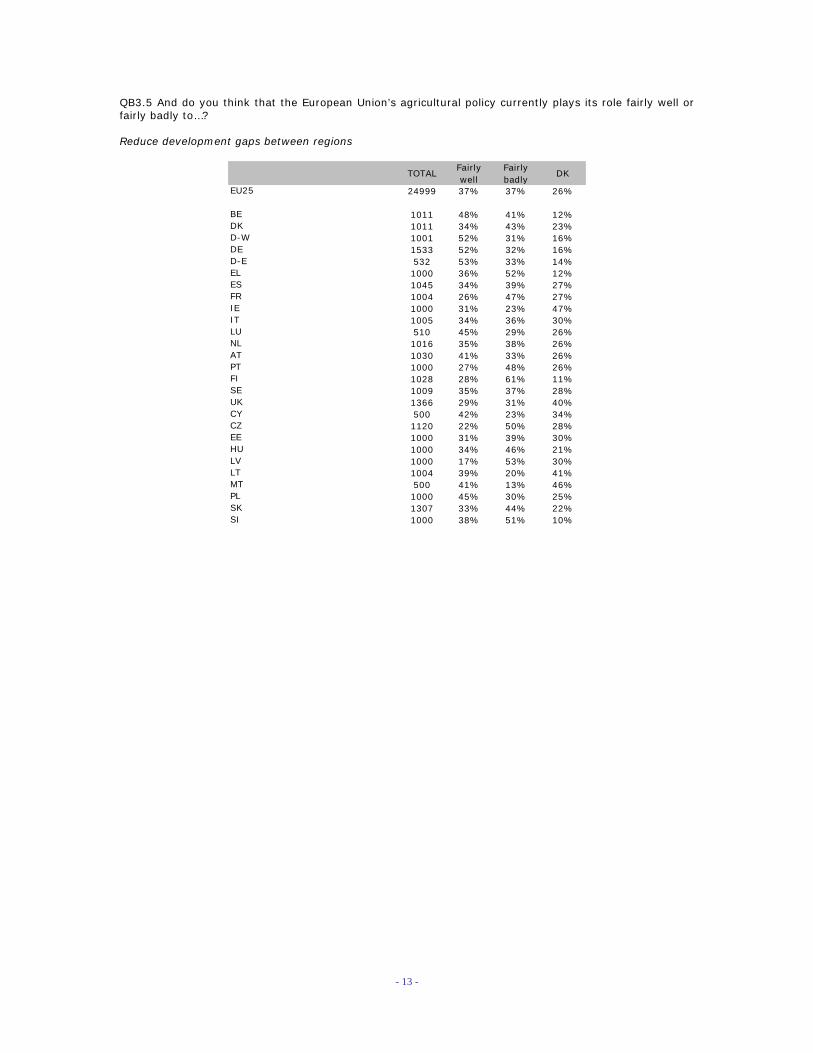
- 13 -
TOTALFairly well
Fairly badly
DK
EU25 24999 37% 37% 26%
BE 1011 48% 41% 12%DK 1011 34% 43% 23%D-W 1001 52% 31% 16%DE 1533 52% 32% 16%D-E 532 53% 33% 14%EL 1000 36% 52% 12%ES 1045 34% 39% 27%FR 1004 26% 47% 27%IE 1000 31% 23% 47%IT 1005 34% 36% 30%LU 510 45% 29% 26%NL 1016 35% 38% 26%AT 1030 41% 33% 26%PT 1000 27% 48% 26%FI 1028 28% 61% 11%SE 1009 35% 37% 28%UK 1366 29% 31% 40%CY 500 42% 23% 34%CZ 1120 22% 50% 28%EE 1000 31% 39% 30%HU 1000 34% 46% 21%LV 1000 17% 53% 30%LT 1004 39% 20% 41%MT 500 41% 13% 46%PL 1000 45% 30% 25%SK 1307 33% 44% 22%SI 1000 38% 51% 10%
QB3.5 And do you think that the European Union’s agricultural policy currently plays its role fairly well or fairly badly to…? Reduce development gaps between regions

- 14 -
TOTALFairly well
Fairly badly
DK
EU25 24999 37% 37% 26%SexMale 12056 40% 38% 22%Female 12943 33% 37% 30%Age15-24 3817 40% 32% 27%25-39 6631 35% 39% 26%40-54 6381 37% 38% 24%55 + 8163 35% 37% 27%Education (End of)15 6321 33% 37% 30%16-19 9862 36% 38% 25%20+ 5876 40% 39% 22%Still Study 2469 42% 32% 26%Household composition1 4244 35% 35% 30%2 7388 37% 38% 25%3 4956 36% 39% 25%4+ 8410 38% 37% 25%Place of birthSurveyed 23483 36% 38% 26%EU 674 44% 32% 24%Europe ou 303 52% 31% 17%Outside E 512 40% 32% 28%Parents' birth2 born cou 22128 36% 38% 26%1 country 834 38% 37% 26%2EU 810 40% 33% 26%At least 1 1137 41% 33% 26%Left-Right scale(1-4) Left 6482 39% 39% 22%(5-6) Cen 8436 38% 38% 24%(7-10) Rig 4073 39% 40% 21%Respondant occupation scaleSelf- emp 1954 39% 41% 20%Mana-gers 2346 42% 38% 21%Other whi 2713 34% 42% 24%Manual wo 5223 36% 38% 26%House per 2468 33% 34% 33%Unem-plo 1726 37% 37% 26%Retired 6099 35% 37% 28%Students 2469 42% 32% 26%Subjective urbanisationRural villa 8583 34% 40% 26%Small/�m 10127 36% 38% 26%Large tow 6214 42% 33% 26%
QB3.5 And do you think that the European Union’s agricultural policy currently plays its role fairly well or fairly badly to…? Reduce development gaps between regions

- 15 -
TOTALFairly well
Fairly badly
DK
EU25 24999 45% 29% 26%
BE 1011 60% 30% 10%DK 1011 31% 46% 23%D-W 1001 55% 29% 15%DE 1533 56% 29% 15%D-E 532 60% 26% 14%EL 1000 54% 36% 10%ES 1045 40% 28% 32%FR 1004 39% 36% 26%IE 1000 35% 17% 48%IT 1005 43% 27% 30%LU 510 55% 24% 21%NL 1016 38% 33% 28%AT 1030 51% 31% 18%PT 1000 33% 38% 29%FI 1028 46% 43% 11%SE 1009 32% 38% 30%UK 1366 38% 28% 34%CY 500 53% 16% 31%CZ 1120 38% 29% 32%EE 1000 45% 25% 30%HU 1000 47% 35% 18%LV 1000 29% 37% 33%LT 1004 52% 15% 32%MT 500 54% 7% 39%PL 1000 55% 19% 26%SK 1307 49% 24% 27%SI 1000 54% 32% 13%
QB3.6 And do you think that the European Union’s agricultural policy currently plays its role fairly well or fairly badly to…? Encourage the diversification of agricultural products and activities

- 16 -
TOTALFairly well
Fairly badly
DK
EU25 24999 45% 29% 26%SexMale 12056 47% 31% 22%Female 12943 43% 28% 29%Age15-24 3817 50% 23% 27%25-39 6631 45% 31% 24%40-54 6381 45% 32% 24%55 + 8163 43% 30% 27%Education (End of)15 6321 41% 30% 29%16-19 9862 47% 29% 24%20+ 5876 45% 32% 23%Still Study 2469 49% 24% 27%Household composition1 4244 42% 28% 29%2 7388 44% 30% 25%3 4956 46% 30% 25%4+ 8410 47% 29% 25%Place of birthSurveyed 23483 45% 30% 26%EU 674 50% 29% 21%Europe ou 303 55% 20% 25%Outside E 512 52% 23% 26%Parents' birth2 born cou 22128 45% 30% 26%1 country 834 48% 31% 22%2EU 810 45% 32% 24%At least 1 1137 50% 25% 25%Left-Right scale(1-4) Left 6482 46% 32% 22%(5-6) Cen 8436 48% 29% 23%(7-10) Rig 4073 49% 30% 21%Respondant occupation scaleSelf- emp 1954 47% 33% 19%Mana-gers 2346 43% 35% 22%Other whi 2713 45% 30% 24%Manual wo 5223 45% 29% 26%House per 2468 42% 27% 31%Unem-plo 1726 46% 29% 26%Retired 6099 44% 29% 27%Students 2469 49% 24% 27%Subjective urbanisationRural villa 8583 45% 30% 25%Small/�m 10127 45% 29% 26%Large tow 6214 46% 28% 26%
QB3.6 And do you think that the European Union’s agricultural policy currently plays its role fairly well or fairly badly to…? Encourage the diversification of agricultural products and activities

- 17 -
TOTALFairly well
Fairly badly
DK
EU25 24999 47% 31% 23%
BE 1011 56% 33% 11%DK 1011 27% 58% 15%D-W 1001 59% 28% 13%DE 1533 61% 26% 13%D-E 532 71% 18% 11%EL 1000 57% 32% 11%ES 1045 33% 30% 36%FR 1004 35% 43% 23%IE 1000 36% 28% 36%IT 1005 47% 26% 27%LU 510 55% 28% 17%NL 1016 40% 41% 19%AT 1030 50% 33% 18%PT 1000 32% 34% 34%FI 1028 41% 48% 11%SE 1009 38% 41% 22%UK 1366 38% 33% 30%CY 500 66% 11% 23%CZ 1120 40% 29% 31%EE 1000 53% 25% 23%HU 1000 48% 31% 21%LV 1000 33% 38% 30%LT 1004 60% 13% 27%MT 500 54% 9% 38%PL 1000 68% 16% 16%SK 1307 53% 20% 27%SI 1000 59% 32% 9%
QB3.7 And do you think that the European Union’s agricultural policy currently plays its role fairly well or fairly badly to…? Favour methods of organic production

- 18 -
TOTALFairly well
Fairly badly
DK
EU25 24999 47% 31% 23%SexMale 12056 46% 33% 21%Female 12943 47% 29% 24%Age15-24 3817 54% 24% 21%25-39 6631 48% 31% 22%40-54 6381 46% 33% 20%55 + 8163 43% 31% 26%Education (End of)15 6321 40% 30% 30%16-19 9862 50% 30% 21%20+ 5876 47% 35% 19%Still Study 2469 53% 26% 20%Household composition1 4244 43% 30% 28%2 7388 46% 32% 22%3 4956 48% 30% 22%4+ 8410 49% 31% 21%Place of birthSurveyed 23483 47% 31% 23%EU 674 48% 34% 18%Europe ou 303 55% 27% 18%Outside E 512 45% 27% 28%Parents' birth2 born cou 22128 47% 30% 23%1 country 834 43% 40% 17%2EU 810 40% 39% 21%At least 1 1137 51% 27% 22%Left-Right scale(1-4) Left 6482 47% 34% 20%(5-6) Cen 8436 49% 32% 20%(7-10) Rig 4073 49% 33% 19%Respondant occupation scaleSelf- emp 1954 48% 33% 19%Mana-gers 2346 45% 37% 18%Other whi 2713 47% 31% 22%Manual wo 5223 47% 31% 22%House per 2468 45% 26% 29%Unem-plo 1726 49% 29% 21%Retired 6099 44% 31% 25%Students 2469 53% 26% 20%Subjective urbanisationRural villa 8583 45% 32% 23%Small/�m 10127 47% 30% 23%Large tow 6214 49% 29% 22%
QB3.7 And do you think that the European Union’s agricultural policy currently plays its role fairly well or fairly badly to…? Favour methods of organic production
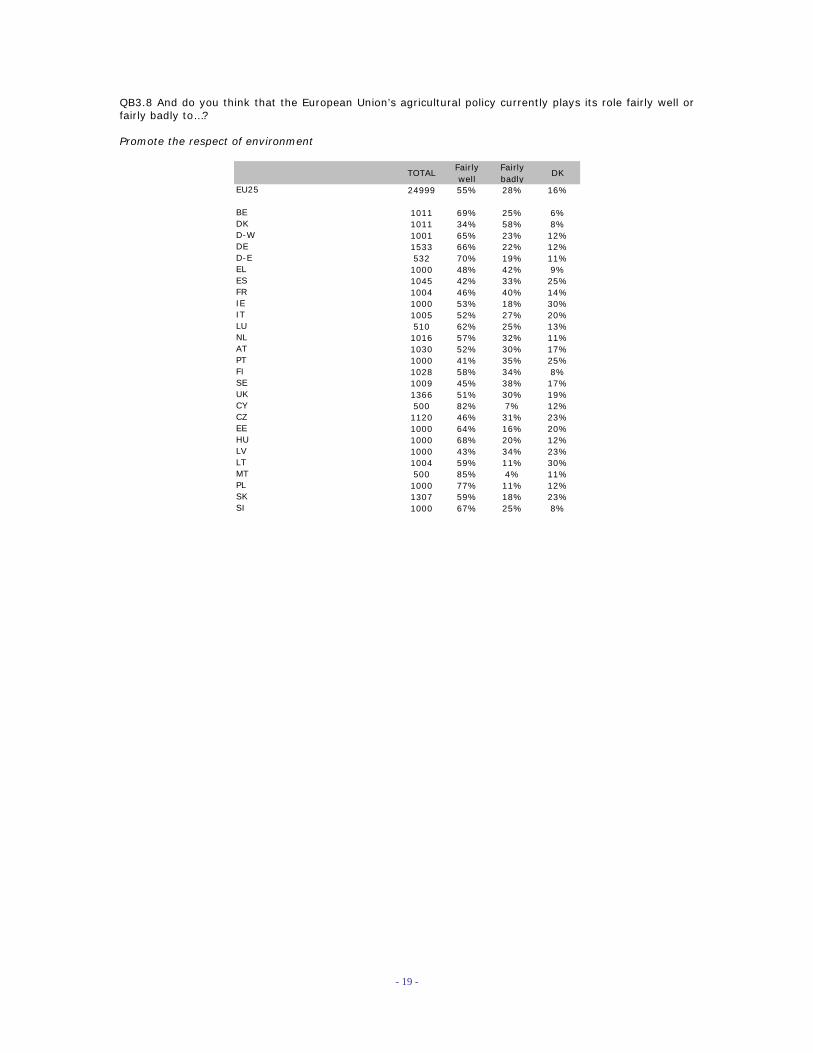
- 19 -
TOTALFairly well
Fairly badly
DK
EU25 24999 55% 28% 16%
BE 1011 69% 25% 6%DK 1011 34% 58% 8%D-W 1001 65% 23% 12%DE 1533 66% 22% 12%D-E 532 70% 19% 11%EL 1000 48% 42% 9%ES 1045 42% 33% 25%FR 1004 46% 40% 14%IE 1000 53% 18% 30%IT 1005 52% 27% 20%LU 510 62% 25% 13%NL 1016 57% 32% 11%AT 1030 52% 30% 17%PT 1000 41% 35% 25%FI 1028 58% 34% 8%SE 1009 45% 38% 17%UK 1366 51% 30% 19%CY 500 82% 7% 12%CZ 1120 46% 31% 23%EE 1000 64% 16% 20%HU 1000 68% 20% 12%LV 1000 43% 34% 23%LT 1004 59% 11% 30%MT 500 85% 4% 11%PL 1000 77% 11% 12%SK 1307 59% 18% 23%SI 1000 67% 25% 8%
QB3.8 And do you think that the European Union’s agricultural policy currently plays its role fairly well or fairly badly to…? Promote the respect of environment

- 20 -
TOTALFairly well
Fairly badly
DK
EU25 24999 55% 28% 16%SexMale 12056 57% 29% 14%Female 12943 54% 28% 19%Age15-24 3817 60% 24% 16%25-39 6631 54% 31% 15%40-54 6381 54% 30% 15%55 + 8163 55% 27% 18%Education (End of)15 6321 49% 29% 22%16-19 9862 58% 28% 15%20+ 5876 56% 31% 13%Still Study 2469 59% 25% 16%Household composition1 4244 53% 27% 19%2 7388 55% 29% 16%3 4956 54% 29% 16%4+ 8410 57% 28% 15%Place of birthSurveyed 23483 55% 28% 17%EU 674 55% 32% 13%Europe ou 303 69% 16% 14%Outside E 512 58% 27% 16%Parents' birth2 born cou 22128 55% 28% 17%1 country 834 53% 35% 12%2EU 810 52% 31% 17%At least 1 1137 60% 27% 12%Left-Right scale(1-4) Left 6482 53% 33% 13%(5-6) Cen 8436 59% 27% 14%(7-10) Rig 4073 60% 28% 12%Respondant occupation scaleSelf- emp 1954 54% 31% 15%Mana-gers 2346 56% 33% 11%Other whi 2713 54% 31% 16%Manual wo 5223 55% 30% 16%House per 2468 49% 27% 23%Unem-plo 1726 57% 28% 14%Retired 6099 56% 26% 18%Students 2469 59% 25% 16%Subjective urbanisationRural villa 8583 55% 28% 17%Small/�m 10127 56% 29% 16%Large tow 6214 55% 28% 17%
QB3.8 And do you think that the European Union’s agricultural policy currently plays its role fairly well or fairly badly to…? Promote the respect of environment

- 21 -
TOTALFairly well
Fairly badly
DK
EU25 24999 45% 30% 25%
BE 1011 61% 28% 11%DK 1011 34% 43% 22%D-W 1001 54% 27% 18%DE 1533 55% 27% 18%D-E 532 56% 25% 19%EL 1000 38% 45% 17%ES 1045 41% 28% 32%FR 1004 37% 41% 23%IE 1000 36% 18% 46%IT 1005 50% 28% 22%LU 510 53% 24% 24%NL 1016 39% 35% 26%AT 1030 45% 35% 20%PT 1000 33% 41% 26%FI 1028 46% 40% 14%SE 1009 28% 34% 38%UK 1366 43% 26% 31%CY 500 59% 12% 30%CZ 1120 28% 32% 40%EE 1000 44% 24% 32%HU 1000 40% 40% 20%LV 1000 23% 38% 38%LT 1004 48% 13% 38%MT 500 59% 9% 31%PL 1000 51% 23% 26%SK 1307 44% 25% 31%SI 1000 54% 32% 14%
QB3.9 And do you think that the European Union’s agricultural policy currently plays its role fairly well or fairly badly to…? Protect the specificity and taste of European agricultural products

- 22 -
TOTALFairly well
Fairly badly
DK
EU25 24999 45% 30% 25%SexMale 12056 46% 32% 22%Female 12943 43% 29% 28%Age15-24 3817 49% 26% 26%25-39 6631 46% 31% 23%40-54 6381 44% 32% 23%55 + 8163 43% 30% 27%Education (End of)15 6321 41% 31% 28%16-19 9862 47% 29% 24%20+ 5876 45% 34% 22%Still Study 2469 48% 26% 26%Household composition1 4244 42% 29% 29%2 7388 44% 31% 25%3 4956 45% 31% 24%4+ 8410 47% 30% 23%Place of birthSurveyed 23483 45% 30% 25%EU 674 51% 31% 18%Europe ou 303 50% 25% 25%Outside E 512 52% 23% 26%Parents' birth2 born cou 22128 45% 30% 25%1 country 834 43% 34% 23%2EU 810 42% 35% 23%At least 1 1137 53% 23% 24%Left-Right scale(1-4) Left 6482 46% 32% 22%(5-6) Cen 8436 48% 29% 22%(7-10) Rig 4073 45% 34% 21%Respondant occupation scaleSelf- emp 1954 43% 37% 20%Mana-gers 2346 47% 35% 18%Other whi 2713 45% 31% 25%Manual wo 5223 46% 31% 23%House per 2468 43% 26% 31%Unem-plo 1726 46% 28% 25%Retired 6099 43% 30% 27%Students 2469 48% 26% 26%Subjective urbanisationRural villa 8583 43% 32% 25%Small/�m 10127 46% 30% 24%Large tow 6214 47% 28% 26%
QB3.9 And do you think that the European Union’s agricultural policy currently plays its role fairly well or fairly badly to…? Protect the specificity and taste of European agricultural products

- 23 -
TOTALFairly well
Fairly badly
DK
EU25 24999 30% 49% 21%
BE 1011 37% 54% 9%DK 1011 22% 66% 12%D-W 1001 42% 43% 14%DE 1533 43% 44% 14%D-E 532 43% 44% 13%EL 1000 28% 60% 12%ES 1045 30% 41% 29%FR 1004 15% 67% 18%IE 1000 28% 35% 37%IT 1005 36% 37% 27%LU 510 47% 36% 18%NL 1016 20% 64% 16%AT 1030 37% 48% 15%PT 1000 25% 50% 24%FI 1028 11% 85% 4%SE 1009 22% 60% 18%UK 1366 27% 47% 26%CY 500 33% 39% 28%CZ 1120 17% 56% 27%EE 1000 24% 52% 24%HU 1000 31% 52% 17%LV 1000 17% 62% 22%LT 1004 40% 32% 28%MT 500 45% 18% 37%PL 1000 35% 46% 20%SK 1307 32% 43% 25%SI 1000 29% 61% 10%
QB3.10 And do you think that the European Union’s agricultural policy currently plays its role fairly well or fairly badly to…? Protect small or medium sized farms
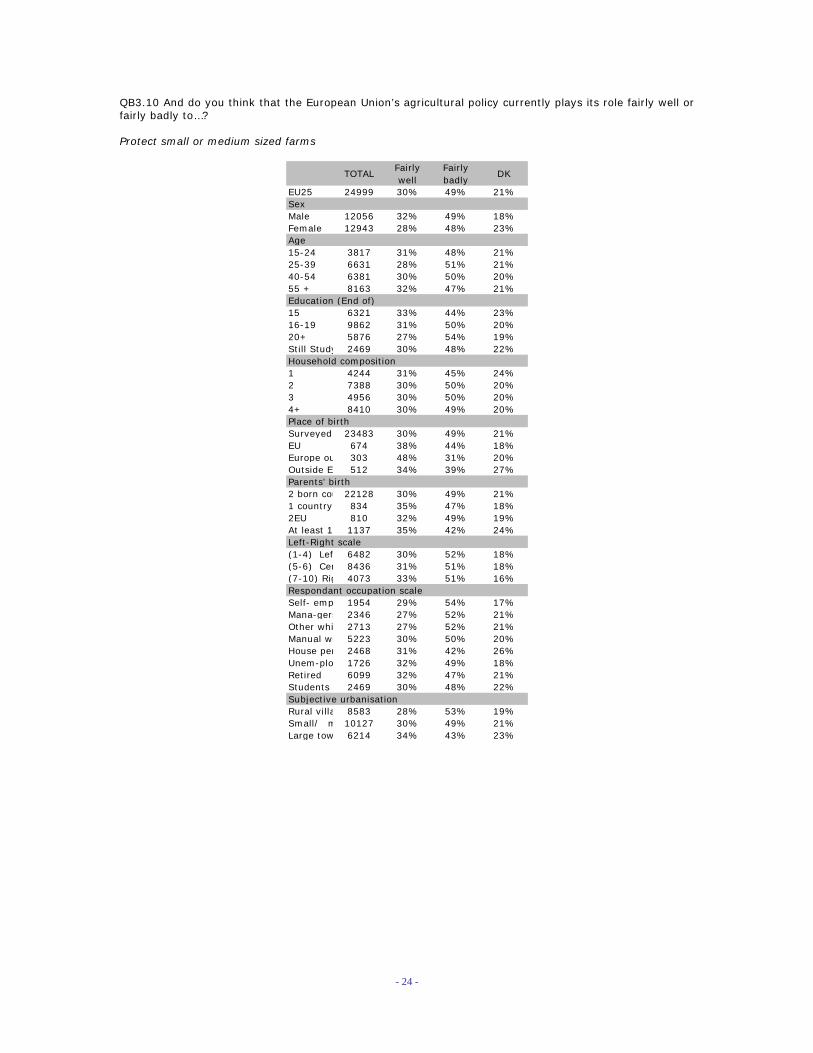
- 24 -
TOTALFairly well
Fairly badly
DK
EU25 24999 30% 49% 21%SexMale 12056 32% 49% 18%Female 12943 28% 48% 23%Age15-24 3817 31% 48% 21%25-39 6631 28% 51% 21%40-54 6381 30% 50% 20%55 + 8163 32% 47% 21%Education (End of)15 6321 33% 44% 23%16-19 9862 31% 50% 20%20+ 5876 27% 54% 19%Still Study 2469 30% 48% 22%Household composition1 4244 31% 45% 24%2 7388 30% 50% 20%3 4956 30% 50% 20%4+ 8410 30% 49% 20%Place of birthSurveyed 23483 30% 49% 21%EU 674 38% 44% 18%Europe ou 303 48% 31% 20%Outside E 512 34% 39% 27%Parents' birth2 born cou 22128 30% 49% 21%1 country 834 35% 47% 18%2EU 810 32% 49% 19%At least 1 1137 35% 42% 24%Left-Right scale(1-4) Left 6482 30% 52% 18%(5-6) Cen 8436 31% 51% 18%(7-10) Rig 4073 33% 51% 16%Respondant occupation scaleSelf- emp 1954 29% 54% 17%Mana-gers 2346 27% 52% 21%Other whi 2713 27% 52% 21%Manual wo 5223 30% 50% 20%House per 2468 31% 42% 26%Unem-plo 1726 32% 49% 18%Retired 6099 32% 47% 21%Students 2469 30% 48% 22%Subjective urbanisationRural villa 8583 28% 53% 19%Small/�m 10127 30% 49% 21%Large tow 6214 34% 43% 23%
QB3.10 And do you think that the European Union’s agricultural policy currently plays its role fairly well or fairly badly to…? Protect small or medium sized farms
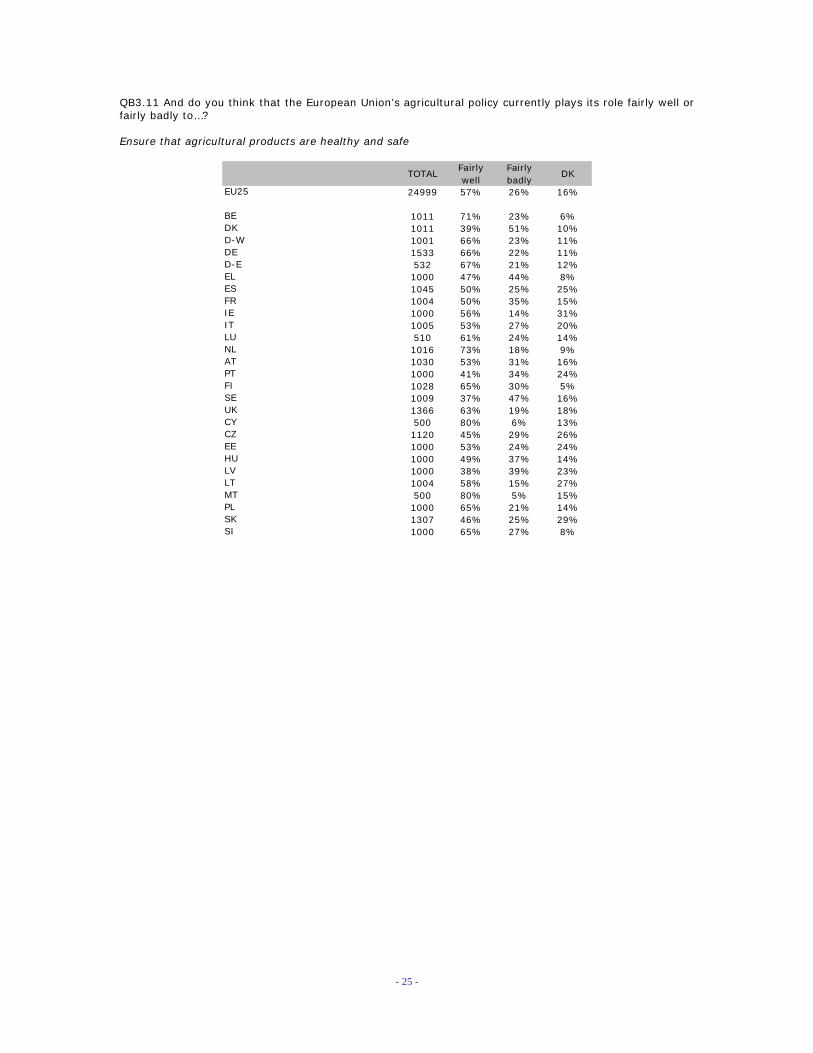
- 25 -
TOTALFairly well
Fairly badly
DK
EU25 24999 57% 26% 16%
BE 1011 71% 23% 6%DK 1011 39% 51% 10%D-W 1001 66% 23% 11%DE 1533 66% 22% 11%D-E 532 67% 21% 12%EL 1000 47% 44% 8%ES 1045 50% 25% 25%FR 1004 50% 35% 15%IE 1000 56% 14% 31%IT 1005 53% 27% 20%LU 510 61% 24% 14%NL 1016 73% 18% 9%AT 1030 53% 31% 16%PT 1000 41% 34% 24%FI 1028 65% 30% 5%SE 1009 37% 47% 16%UK 1366 63% 19% 18%CY 500 80% 6% 13%CZ 1120 45% 29% 26%EE 1000 53% 24% 24%HU 1000 49% 37% 14%LV 1000 38% 39% 23%LT 1004 58% 15% 27%MT 500 80% 5% 15%PL 1000 65% 21% 14%SK 1307 46% 25% 29%SI 1000 65% 27% 8%
QB3.11 And do you think that the European Union’s agricultural policy currently plays its role fairly well or fairly badly to…? Ensure that agricultural products are healthy and safe

- 26 -
TOTALFairly well
Fairly badly
DK
EU25 24999 57% 26% 16%SexMale 12056 60% 26% 14%Female 12943 54% 27% 19%Age15-24 3817 63% 22% 15%25-39 6631 59% 27% 15%40-54 6381 56% 29% 16%55 + 8163 54% 27% 19%Education (End of)15 6321 51% 28% 21%16-19 9862 59% 26% 15%20+ 5876 59% 28% 13%Still Study 2469 65% 20% 15%Household composition1 4244 54% 25% 20%2 7388 56% 27% 16%3 4956 58% 26% 15%4+ 8410 59% 26% 15%Place of birthSurveyed 23483 57% 27% 17%EU 674 61% 28% 12%Europe ou 303 60% 22% 18%Outside E 512 66% 20% 15%Parents' birth2 born cou 22128 57% 26% 17%1 country 834 63% 27% 10%2EU 810 55% 30% 15%At least 1 1137 65% 21% 14%Left-Right scale(1-4) Left 6482 59% 28% 13%(5-6) Cen 8436 61% 25% 14%(7-10) Rig 4073 61% 26% 13%Respondant occupation scaleSelf- emp 1954 56% 31% 13%Mana-gers 2346 62% 26% 12%Other whi 2713 58% 27% 16%Manual wo 5223 57% 27% 16%House per 2468 51% 26% 23%Unem-plo 1726 56% 28% 16%Retired 6099 56% 26% 18%Students 2469 65% 20% 15%Subjective urbanisationRural villa 8583 56% 28% 16%Small/�m 10127 57% 26% 17%Large tow 6214 60% 24% 16%
QB3.11 And do you think that the European Union’s agricultural policy currently plays its role fairly well or fairly badly to…? Ensure that agricultural products are healthy and safe

- 27 -
TOTALFairly well
Fairly badly
DK
EU25 24999 47% 32% 21%
BE 1011 56% 33% 11%DK 1011 17% 76% 7%D-W 1001 58% 28% 14%DE 1533 59% 28% 13%D-E 532 61% 30% 9%EL 1000 38% 47% 15%ES 1045 40% 29% 31%FR 1004 35% 38% 27%IE 1000 44% 16% 40%IT 1005 47% 29% 24%LU 510 51% 32% 17%NL 1016 42% 44% 14%AT 1030 48% 33% 19%PT 1000 35% 35% 30%FI 1028 54% 39% 7%SE 1009 23% 65% 12%UK 1366 43% 37% 20%CY 500 65% 12% 23%CZ 1120 39% 34% 27%EE 1000 49% 21% 29%HU 1000 54% 27% 19%LV 1000 39% 33% 29%LT 1004 51% 13% 36%MT 500 61% 8% 30%PL 1000 72% 12% 15%SK 1307 48% 23% 29%SI 1000 54% 31% 14%
QB3.12 And do you think that the European Union’s agricultural policy currently plays its role fairly well or fairly badly to…? Protect the welfare of farm animals

- 28 -
TOTALFairly well
Fairly badly
DK
EU25 24999 47% 32% 21%SexMale 12056 50% 33% 18%Female 12943 45% 31% 23%Age15-24 3817 50% 29% 21%25-39 6631 47% 32% 21%40-54 6381 47% 34% 19%55 + 8163 47% 31% 22%Education (End of)15 6321 46% 31% 23%16-19 9862 50% 31% 19%20+ 5876 44% 36% 20%Still Study 2469 49% 30% 22%Household composition1 4244 45% 33% 22%2 7388 47% 33% 20%3 4956 48% 32% 20%4+ 8410 49% 31% 20%Place of birthSurveyed 23483 47% 32% 21%EU 674 47% 35% 19%Europe ou 303 59% 20% 21%Outside E 512 47% 27% 26%Parents' birth2 born cou 22128 47% 32% 21%1 country 834 47% 37% 17%2EU 810 45% 35% 20%At least 1 1137 51% 26% 23%Left-Right scale(1-4) Left 6482 46% 36% 18%(5-6) Cen 8436 51% 32% 17%(7-10) Rig 4073 50% 33% 17%Respondant occupation scaleSelf- emp 1954 49% 35% 17%Mana-gers 2346 47% 35% 18%Other whi 2713 44% 34% 22%Manual wo 5223 48% 33% 19%House per 2468 43% 29% 28%Unem-plo 1726 50% 32% 18%Retired 6099 49% 30% 21%Students 2469 49% 30% 22%Subjective urbanisationRural villa 8583 48% 31% 21%Small/�m 10127 46% 33% 20%Large tow 6214 49% 31% 20%
QB3.12 And do you think that the European Union’s agricultural policy currently plays its role fairly well or fairly badly to…? Protect the welfare of farm animals

- 29 -
TOTALa very good thing
a fairly good thing
a fairly bad thing
a very bad thing
Neither good nor bad thing(SPONTANEOUS)
DKA good thing
A bad thing
EU25 24999 13% 53% 13% 4% 9% 8% 66% 17%
BE 1011 13% 58% 13% 3% 11% 2% 71% 16%DK 1011 6% 49% 27% 5% 8% 5% 55% 32%D-W 1001 10% 61% 13% 2% 10% 4% 71% 15%DE 1533 11% 61% 13% 2% 10% 4% 71% 15%D-E 532 12% 59% 10% 2% 12% 4% 72% 12%EL 1000 12% 42% 12% 9% 13% 13% 54% 21%ES 1045 9% 47% 13% 5% 11% 15% 56% 19%FR 1004 12% 56% 12% 4% 9% 7% 68% 16%IE 1000 22% 41% 6% 3% 10% 17% 63% 9%IT 1005 14% 40% 17% 9% 8% 11% 54% 26%LU 510 23% 53% 7% 4% 9% 4% 76% 11%NL 1016 9% 62% 17% 3% 5% 4% 71% 20%AT 1030 12% 43% 12% 4% 18% 11% 55% 16%PT 1000 6% 46% 11% 4% 16% 17% 52% 15%FI 1028 12% 55% 21% 6% 3% 4% 67% 26%SE 1009 9% 52% 19% 5% 5% 9% 62% 24%UK 1366 16% 56% 10% 3% 8% 5% 73% 13%CY 500 10% 58% 5% 2% 17% 8% 68% 7%CZ 1120 10% 52% 13% 2% 12% 11% 62% 15%EE 1000 17% 55% 10% 1% 6% 11% 71% 11%HU 1000 22% 48% 6% 2% 14% 8% 70% 9%LV 1000 21% 47% 9% 3% 11% 8% 68% 13%LT 1004 18% 53% 12% 2% 5% 11% 71% 13%MT 500 21% 46% 8% 3% 10% 13% 67% 10%PL 1000 14% 63% 9% 2% 6% 7% 77% 10%SK 1307 13% 52% 15% 4% 10% 5% 65% 20%SI 1000 10% 61% 16% 2% 7% 4% 71% 18%
QB4 The European Union is subsidising agricultural products less and less. However, it is granting more funds for the protection and development of the overall rural economy and for direct support to farmers. Do you think that this development is…?

- 30 -
TOTALa very good thing
a fairly good thing
a fairly bad thing
a very bad thing
Neither good nor bad thing(SPONTANEOUS)
DKA good thing
A bad thing
EU25 24999 13% 53% 13% 4% 9% 8% 66% 17%SexMale 12056 13% 54% 13% 5% 9% 6% 67% 18%Female 12943 12% 53% 13% 3% 10% 9% 65% 16%Age15-24 3817 12% 57% 12% 2% 8% 9% 68% 15%25-39 6631 13% 55% 13% 4% 9% 7% 68% 17%40-54 6381 13% 53% 14% 4% 10% 6% 66% 18%55 + 8163 12% 51% 12% 5% 10% 9% 63% 17%Education (End of)15 6321 12% 47% 13% 5% 11% 11% 59% 19%16-19 9862 12% 55% 13% 4% 10% 6% 67% 17%20+ 5876 14% 56% 13% 4% 7% 6% 70% 17%Still Study 2469 12% 59% 10% 3% 8% 8% 71% 13%Household composition1 4244 12% 52% 11% 4% 10% 9% 64% 16%2 7388 13% 53% 13% 5% 9% 8% 66% 18%3 4956 12% 53% 13% 4% 9% 9% 65% 18%4+ 8410 12% 55% 14% 3% 9% 7% 67% 17%Place of birthSurveyed 23483 12% 53% 13% 4% 9% 8% 66% 17%EU 674 14% 55% 13% 4% 9% 7% 69% 16%Europe ou 303 13% 53% 13% 2% 9% 11% 67% 14%Outside E 512 13% 55% 13% 4% 10% 5% 68% 17%Parents' birth2 born cou 22128 12% 53% 13% 4% 9% 8% 65% 17%1 country 834 17% 52% 11% 4% 10% 6% 69% 15%2EU 810 13% 57% 14% 2% 7% 8% 70% 15%At least 1 1137 13% 54% 13% 3% 10% 7% 67% 16%Left-Right scale(1-4) Left 6482 14% 54% 14% 5% 8% 6% 68% 18%(5-6) Cen 8436 12% 58% 13% 3% 9% 6% 69% 15%(7-10) Rig 4073 13% 57% 13% 4% 7% 5% 70% 17%Respondant occupation scaleSelf- emp 1954 14% 48% 15% 7% 10% 6% 62% 22%Mana-gers 2346 15% 59% 13% 3% 7% 4% 74% 16%Other whi 2713 13% 53% 14% 4% 9% 7% 66% 18%Manual wo 5223 11% 54% 14% 4% 10% 7% 65% 17%House per 2468 13% 48% 12% 4% 10% 13% 61% 16%Unem-plo 1726 14% 51% 15% 3% 9% 8% 65% 18%Retired 6099 12% 53% 13% 5% 10% 9% 64% 17%Students 2469 12% 59% 10% 3% 8% 8% 71% 13%Subjective urbanisationRural villa 8583 12% 52% 13% 5% 10% 8% 64% 18%Small/�m 10127 13% 53% 14% 4% 9% 7% 66% 18%Large tow 6214 13% 55% 11% 3% 9% 8% 68% 15%
QB4 The European Union is subsidising agricultural products less and less. However, it is granting more funds for the protection and development of the overall rural economy and for direct support to farmers. Do you think that this development is…?

TECHNICAL NOTE

SPECIAL EUROBAROMETER N°221
« Europeans and the Common Agricultural Policy » TECHNICAL SPECIFICATIONS
Between 22nd November and 19th December 2004, the TNS Opinion & Social, a consortium created between Taylor Nelson Sofres and EOS Gallup Europe, carried out wave 62.2 of the EUROBAROMETER, on request of the EUROPEAN COMMISSION, Directorate-General Press and Communication, Opinion Polls. The SPECIAL EUROBAROMETER N°221 is part of wave 62.2 and covers the population of the respective nationalities of the European Union member States, resident in each of the Member States and aged 15 years and over. The basic sample design applied in all Member States is a multi-stage, random (probability) one. In each EU country, a number of sampling points was drawn with probability proportional to population size (for a total coverage of the country) and to population density. In order to do so, the sampling points were drawn systematically from each of the "administrative regional units", after stratification by individual unit and type of area. They thus represent the whole territory of the countries surveyed according to the EUROSTAT NUTS 2 (or equivalent) and according to the distribution of the resident population of the respective EU-nationalities in terms of metropolitan, urban and rural areas. In each of the selected sampling points, a starting address was drawn, at random. Further addresses were selected as every Nth address by standard random route procedures, from the initial address. In each household, the respondent was drawn, at random (following the closest birthday rule). All interviews have been conducted face-to-face in people's home and in the appropriate national language. As far as the data capture is concerned, CAPI (Computer Assisted Personal Interview) was used in those countries where this technique was available.

ABREVIATIONS COUNTRIES INSTITUTES N° INTERVIEWS FIELDWORK DATES POPULATION 15+ AT Austria Österreichisches Gallup-Institute 1.030 30-11 / 19-12-2004 6.679.444 BE Belgium TNS Dimarso 1.011 01-12 / 19-12-2004 8.598.982 DK Denmark TNS Gallup DK 1.011 29-11 / 19-12-2004 4.380.063 FR France TNS Sofres 1.004 27-11 / 19-12-2004 44.010.619 FI Finland TNS Gallup OY 1.028 26-11 / 19-12-2004 4.279.286 DE Germany TNS Infratest 1.533 26-11 / 14-12-2004 64.174.295 EL Greece TNS ICAP 1.000 27-11 / 18-12-2004 8.674.230 UK United Kingdom TNS UK 1.366 26-11 / 19-12-2004 47.685.578 IE Ireland TNS MRBI 1.000 26-11 / 19-12-2004 3.089.775 IT Italy TNS Abacus 1.005 02-12 / 19-12-2004 49.208.000 LU Luxembourg TNS ILReS 510 25-11 / 16-12-2004 367.199 NL The Netherlands TNS NIPO 1.016 22-11 / 15-12-2004 13.242.328 PT Portugal TNS EUROTESTE 1.000 01-12 / 19-12-2004 8.080.915 ES Spain TNS Demoscopia 1.045 24-11 / 18-12-2004 35.882.820 SE Sweden TNS GALLUP 1.009 24-11 / 14-12-2004 7.376.680 CY Rep. Of Cyprus Synovate 500 01-12 / 17-12-2004 552.213 CZ Czech Rep. TNS Aisa 1.120 26-11 / 13-12-2004 8.571.710 EE Estonia Emor 1.000 01-12 / 17-12-2004 887.094 HU Hungary TNS Hungary 1.000 25-11 / 18-12-2004 8.503.379 LV Latvia TNS Baltic Data House 1.000 27-11 / 19-12-2004 1.394.351 LT Lithuania TNS Gallup Lithuania 1.004 27-11 / 15-12-2004 2.803.661 MT Malta MISCO 500 24-11 / 16-12-2004 322.917 PL Poland TNS OBOP 1.000 29-11 / 17-12-2004 31.610.437 SK Slovakia TNS AISA SK 1.307 26-11 / 17-12-2004 4.316.438 SI Slovenia RM PLUS 1.000 29-11 / 19-12-2004 1.663.869
TOTAL 24.999 22-11 / 19-12-2004 366.356.283

For each country a comparison between the sample and the universe was carried out. The Universe description was derived from Eurostat population data or from national statistics offices. For all EU member-countries a national weighting procedure, using marginal and intercellular weighting, was carried out based on this Universe description. As such in all countries, gender, age, region and size of locality were introduced in the iteration procedure. For international weighting (i.e. EU averages), TNS Opinion & Social applies the official population figures as provided by EUROSTAT or national statistic offices. The total population figures for input in this post-weighting procedure are listed above. Readers are reminded that survey results are estimations, the accuracy of which, everything being equal, rests upon the sample size and upon the observed percentage. With samples of about 1,000 interviews, the real percentages vary within the following confidence limits:
Observed percentages
10% or 90% 20% or 80% 30% or 70% 40% or 60% 50%
Confidence limits ± 1.9 points ± 2.5 points ± 2.7 points ± 3.0 points ± 3.1 points

QUESTIONNAIRE

A
B
C
D Interview number
EB62.1 D
our survey number
EB62.1 C
country code
EB62.1 B
your survey number
EB62.1 A

Q1
1,2,3,4,5,6,7,8,9,
10,11,12,13,14,15,16,17,18,19,20,21,22,23,24,25,26,27,28,29,DK
EB62.1 Q1 MODIFIED
RomaniaOther countries
SloveniaBulgaria
PolandSlovakia
LithuaniaMalta
HungaryLatvia
Czech RepublicEstonia
FinlandCyprus (South)
AustriaSweden
PortugalUnited Kingdom (Great Britain, Northern Ireland)
LuxembourgNetherlands
IrelandItaly
SpainFrance
GermanyGreece
BelgiumDenmark
What is your nationality? Please tell me the country(ies) that applies(y).
(MULTIPLE ANSWERS POSSIBLE)
ASK ITEM 26 ONLY IN BULGARIA
ASK ITEM 27 ONLY IN ROMANIA
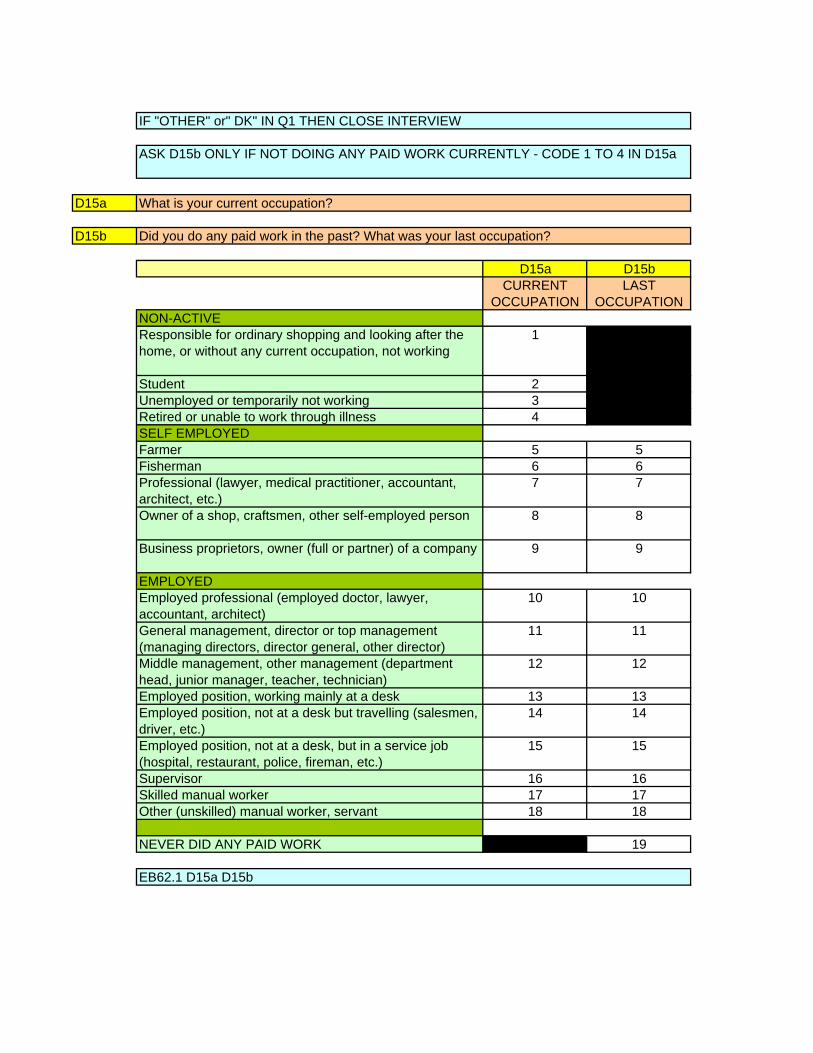
D15a
D15b
EB62.1 D15a D15b
NEVER DID ANY PAID WORK 19 19 Other (unskilled) manual worker, servant 18 18Skilled manual worker 17 17Supervisor 16 16
Employed position, not at a desk, but in a service job (hospital, restaurant, police, fireman, etc.)
15 15
Employed position, not at a desk but travelling (salesmen, driver, etc.)
14 14Employed position, working mainly at a desk 13 13
Middle management, other management (department head, junior manager, teacher, technician)
12 12
General management, director or top management (managing directors, director general, other director)
11 11
Employed professional (employed doctor, lawyer, accountant, architect)
10 10EMPLOYED
Business proprietors, owner (full or partner) of a company 9 9
Owner of a shop, craftsmen, other self-employed person 8 8
Professional (lawyer, medical practitioner, accountant, architect, etc.)
7 7Fisherman 6 6
SELF EMPLOYEDFarmer 5 5
Retired or unable to work through illness 4 4Unemployed or temporarily not working 3 3Student 2 2
NON-ACTIVEResponsible for ordinary shopping and looking after the home, or without any current occupation, not working
1 1
CURRENT OCCUPATION
LAST OCCUPATION
D15a D15b
What is your current occupation?
Did you do any paid work in the past? What was your last occupation?
IF "OTHER" or" DK" IN Q1 THEN CLOSE INTERVIEW
ASK D15b ONLY IF NOT DOING ANY PAID WORK CURRENTLY - CODE 1 TO 4 IN D15a

QB1
1,2,3,4,
5,
6,7,8,9,
10,11,12,
QB2
1,2,3,4,5,6,7,8,9,
10,11,12,13,14,DK
EB57.0 Q3 MODIFIED
Protect the welfare of farm animalsNone of these (SPONTANEOUS)
Protect small or medium sized farms Ensure that agricultural products are healthy and safe
Promote the respect of environment Protect the specificity and taste of European agricultural products
Encourage the diversification of agricultural products and activitiesFavour methods of organic production
Favour and improve life in the countrysideReduce development gaps between regions
Make European agriculture more competitive on world marketsHelp farmers to adapt their production to consumer’s expectations
(SHOW CARD - READ OUT - MAX. 3 ANSWERS)
Ensure stable and adequate incomes for farmers
EB57.0 Q2
In your opinion, which of the following should be the 3 main priorities of the European Union in terms of agriculture policy?
None of these (SPONTANEOUS)DK
It favours farmers rather than consumers It favours equally farmers and consumers
It ensures that farm animals are well treatedIt favours consumers rather than farmers
It ensures that you have enough information about the geographical area where your food comes fromIt ensures that you have enough information about how the food was produced and processed
It ensures that the food you buy is healthyIt ensures that the food you buy is reasonably priced
It ensures that the food you buy is safe to eatIt ensures that the food you buy is good quality
European Union agricultural policy aims to benefit consumers as well as farmers. With which of the following statements do you agree?
(SHOW CARD - READ OUT - MULTIPLE ANSWERS POSSIBLE)
Thinking now about agriculture
DO NOT ASK QB1 TO QC13 IN BULGARIA AND ROMENIA

QB3
12
3
456
789
1011
12
QB4
123456DK
EB57.0 Q5
a very bad thingNeither good nor bad thing (SPONTANEOUS)
a fairly good thinga fairly bad thing
(SHOW CARD - READ OUT - ONE ANSWER ONLY)
a very good thing
EB57.0 Q4 MODIFIED
The European Union is subsidising agricultural products less and less. However, it is granting more funds for the protection and development of the overall rural economy and for direct support to farmers. Do you think that this development is…?
protect the welfare of farm animals 1 2 3
ensure that agricultural products are healthy and safe
1 2 3protect small or medium sized farms 1 2 3
protect the specificity and taste of European agricultural products
1 2 3promote the respect of environment 1 2 3favour methods of organic production 1 2 3
encourage the diversification of agricultural products and activities
1 2 3reduce development gaps between regions 1 2 3favour and improve life in the countryside 1 2 3
help farmers to adapt their production to consumer’s expectations
1 2 3
make European agriculture more competitive on world markets
1 2 3ensure stable and adequate incomes for farmers 1 2 3
(READ OUT) FAIRLY WELL FAIRLY BADLY DK
And do you think that the European Union’s agricultural policy currently plays its role fairly well or fairly badly to…?
(SHOW CARD)

D1
1 2 3 4 5 6 7 8 9 10
11
12
D7
123456789
10
D8
(INT.: IF "STILL STUDYING", CODE '00' - IF "NO FULL-TIME EDUCATION", CODE '98' - IF "DK", CODE '99')
EB62.1 D8
EB62.1 D7
How old were you when you stopped full-time education?
Other (SPONTANEOUS)Refusal (SPONTANEOUS)
SeparatedWidowed
Unmarried, having previously lived with a partner, but now on my ownDivorced
Unmarried, currently living with partnerUnmarried, having never lived with a partner
MarriedRemarried
Could you give me the letter which corresponds best to your own current situation?
(SHOW CARD - READ OUT - ONE ANSWER ONLY)
EB62.1 D1
NO QUESTIONS D2 TO D6
Refusal
DK
(SHOW CARD) - (INT.: DO NOT PROMPT - IF CONTACT HESITATES, TRY AGAIN)
LEFT RIGHT
ASK ALL
In political matters people talk of "the left" and "the right". How would you place your views on this scale?
DEMOGRAPHICS

D10
12
D11
D25
1234
D40a1
EB62.1 D40a MODIFIED
Could you tell me how many people aged 15 to 24 live in your household, yourself included?
(INT.: READ OUT - WRITE DOWN )
EB62.1 D25
NO QUESTIONS D26 TO D39
large townDK
rural area or villagesmall or middle sized town
Would you say you live in a...?
(READ OUT)
D15a b ASKED AFTER Q1
NO QUESTIONS D16 TO D24
EB62.1 D11
NO QUESTION D12 TO D14
EB62.1 D10
How old are you?
MaleFemale
NO QUESTION D9
Gender.

D40a2
D40a3
D40b
D40c
D41
123456Refusal (SPONTANEOUS)
EB62.1 D41
in Asia, in Africa or in Latin Americain Northern America, in Japan or in Oceania
in another member country of the European Unionin Europe, but not in a member country of the European Union
SHOW CARD - READ OUT - ONE ANSWER ONLY)
in (OUR COUNTRY)
EB62.1 D40c
You personally, were you born…?
Could you tell me how many children aged 10 to 14 years old live in your household?
(INT.: READ OUT - WRITE DOWN - IF "NONE", PLEASE CODE '00')
(INT.: READ OUT - WRITE DOWN - IF "NONE" PLEASE CODE '00')
EB62.1 D40b
EB62.2 NEW
Could you tell me how many children less than 10 years old live in your household
Could you tell me how many people aged 65 or more live in your household, yourself included?
(INT.: READ OUT - WRITE DOWN )
(INT.: READ OUT - WRITE DOWN)
EB62.2 NEW
Could you tell me how many people aged 25 to 64 live in your household, yourself included?

D42
1
2
345
D43a
D43b
EB62.1 D43a D43b
No 2 2Yes 1 1
Fixed Mobile
Mobile telephone available in the household?
D43a D43b
EB62.1 D42
Fixed telephone available in the household?
At least one of your parents was born outside of the European UnionDK/Refusal (SPONTANEOUS)
One of your parents was born in (OUR COUNTRY) and the other was born in another Member State of the European UnionYour mother and your father were born in another Member State of the European Union
(SHOW CARD - READ OUT - ONE ANSWER ONLY)
Your mother and your father were born in (OUR COUNTRY)
DO NOT ASK ITEM 4 in BG and RO
Which of these proposals corresponds to your situation?

P1
P2
P3
P4
1234
P5
1234
P6
EB62.1 P6
Size of locality
(LOCAL CODES)
Bad
EB62.1 P5
FairAverage
Respondent cooperation
Excellent
Five or more
EB62.1 P4
ThreeFour
Number of persons present during the interview, including interviewer
Two (interviewer and respondent)
MINUTES
EB62.1 P3
EB62.1 P2
NUMBER OF MINUTES THE INTERVIEW LASTED
(INT.:USE 24 HOUR CLOCK)
HOUR MINUTES
EB62.1 P1
TIME OF THE BEGINNING OF THE INTERVIEW
DATE OF INTERVIEW
DAY MONTH
INTERVIEW PROTOCOLE

P7
P8
P9
P10
P11
P13
123Language 3
EB62.1 P13
Language 1Language 2
ASK ONLY in LU, BE, ES, FI, EE, LV and MT
Language of interview
Weighting factor
EB62.1 P11
Interviewer number
EB62.1 P10
Sample point number
EB62.1 P9
Postal code
EB62.1 P8
(LOCAL CODES)
EB62.1 P7
Region