Embed Size (px)
Citation preview

LIFE CYCLE IMPACTS FOR POSTCONSUMERRECYCLED RESINS: PET, HDPE, AND PP
SUBMITTED TO:
SUBMITTED BY:
Franklin Associates, A Division ofEastern Research Group (ERG)
December 2018

APR\KC18271112.19.18 4037.00.001
ii
TABLE OF CONTENTS
CHAPTER 1. LIFE CYCLE METHODOLOGY ..................................................................................... 1
1.1. OVERVIEW....................................................................................................................................... 11.2. METHODOLOGY ............................................................................................................................. 11.3. GOAL AND SCOPE .......................................................................................................................... 2
1.3.1. Functional Unit ........................................................................................................................... 31.3.2. Product Systems Studied............................................................................................................. 31.3.3. System Boundary ........................................................................................................................ 31.3.4. Data Requirements ...................................................................................................................... 41.3.5. Data Sources ............................................................................................................................... 51.3.6. Allocation Procedures ................................................................................................................. 51.3.7. Recycling Methodology.............................................................................................................. 61.3.8. Impact Assessment...................................................................................................................... 7
CHAPTER 2. RECOVERY AND RECYCLING PROCESSES.............................................................11
2.1. INTRODUCTION .............................................................................................................................112.2. RECOVERY......................................................................................................................................11
2.2.1. Fuel Use for Residential Curbside Collection............................................................................122.2.2. Fuel Use for Consumer Drop-off at a Recycling Center ............................................................142.2.3. Deposit and CRV Drop-off ........................................................................................................152.2.4. Commercial Collection ..............................................................................................................15
2.3. SORTING AND SEPARATION.......................................................................................................152.4. RECLAIMER OPERATIONS ..........................................................................................................16
2.4.1. PET Reclamation Processes .......................................................................................................172.4.2. HDPE Reclamation Processes....................................................................................................182.4.3. PP Reclamation Processes .........................................................................................................21
CHAPTER 3. RESULTS ............................................................................................................................23
3.1. INTRODUCTION .............................................................................................................................233.2. RECYCLING METHODOLOGIES .................................................................................................233.3. LIFE CYCLE INVENTORY RESULTS ..........................................................................................24
3.3.1. Energy Results ...........................................................................................................................243.3.2. Water Consumption Results.......................................................................................................273.3.3. Solid Waste Results ...................................................................................................................29
3.4. LIFE CYCLE IMPACT ASSESSMENT RESULTS ........................................................................313.4.1. Global Warming Potential (GWP) Results ................................................................................323.4.2. Acidification Potential Results...................................................................................................343.4.3. Eutrophication Potential Results ................................................................................................363.4.4. Smog Formation Potential Results.............................................................................................38
3.5. EQUIVALENCIES............................................................................................................................403.6. CONCLUSIONS ...............................................................................................................................43

APR\KC18271112.19.18 4037.00.001
iii
LIST OF TABLES
Table 1-1. Environmental Indicators Evaluated ............................................................................................. 9Table 2-1. Collection Systems for Recovery of Postconsumer PET, HDPE, and PP Containers and OtherPackaging ......................................................................................................................................................12Table 2-2. Curbside Collection Profile by Weight ........................................................................................13Table 2-3. Sorting at MRF.............................................................................................................................16Table 2-4. PET Reclaimer Operations...........................................................................................................19Table 2-5. HDPE Reclaimer Operations .......................................................................................................20Table 2-6. PP Reclaimer Operations .............................................................................................................22Table 3-1. Total Energy Results for Recycled Resin Compared to Virgin, With and Without FeedstockEnergy ...........................................................................................................................................................25Table 3-2. Water Consumption Results for Recycled Resin Compared to Virgin ........................................28Table 3-3. Solid Waste Results for Recycled Resin Compared to Virgin, With and Without IncomingContaminants.................................................................................................................................................30Table 3-4. Global Warming Potential Results for Recycled Resin Compared to Virgin...............................33Table 3-5. Acidification Potential Results for Recycled Resin Compared to Virgin ....................................35Table 3-6. Eutrophication Potential Results for Recycled Resin Compared to Virgin..................................37Table 3-7. Smog Potential Results for Recycled Resin Compared to Virgin ................................................39Table 3-8. Recycled Resin Savings for 2015 US Recovered Packaging Volume .........................................42Table 3-9. Savings for Recycled Resins Compared to Virgin Resins ...........................................................43
LIST OF FIGURES
Figure 3-1. Total Energy Results for Recycled and Virgin Resins (MJ/kg) ..................................................26Figure 3-2. Process and Transportation Energy for Recycled and Virgin Resins Excluding FeedstockEnergy (MJ/kg)..............................................................................................................................................27Figure 3-3. Water Consumption Results for Recycled and Virgin Resins (liters water/kg resin) ................29Figure 3-4. Solid Waste Results for Recycled and Virgin Resins, Including Contaminants in IncomingMaterial (kg waste/kg resin) .........................................................................................................................31Figure 3-5. Solid Waste Results for Recycled and Virgin Resins, Excluding Contaminants in IncomingMaterial (kg waste/kg resin) .........................................................................................................................31Figure 3-6. Global Warming Potential Results for Recycled and Virgin Resins (kg CO2 eq/kg resin)........34Figure 3-7. Acidification Potential Results for Recycled and Virgin Resins (kg SO2 eq/kg resin) ..............36Figure 3-9. Eutrophication Potential Results for Recycled and Virgin Resins (kg N eq/kg resin) ...............38Figure 3-10. Smog Potential Results for Recycled and Virgin Resins (kg O3 eq/kg resin) ..........................40

APR\KC18271112.19.18 4037.00.001
iv
TERMS AND DEFINITIONS(ALPHABETICAL)
Acidification Potential— potential of emissions such as sulfur dioxide and nitrogen oxides toresult in acid rain, with damaging effects on ecosystems and buildings.
Allocation—partitioning the input or output flows of a process or a product system between theproduct system under study and one or more other product systems.
Characterization Factor—factor derived from a characterization model which is applied toconvert an assigned life cycle inventory analysis result to the common unit of the category indicator.
Combustion Energy—the higher heat value directly released when coal, fuel oil, natural gas, orbiomass is burned for energy consumption.
Co-product—any of two or more products coming from the same unit process or product system.
Cradle-to-Gate—refers to an LCA or LCI covering life cycle stages from raw material extractionthrough raw material production (i.e. does not cover entire life cycle of a product system).
Cradle-to-Grave—an LCA or LCI covering all life cycle stages of a product system from rawmaterial extraction through end-of-life and recycling when applicable.
End-of-Life—refers to the life cycle stage of a product following disposal.
Energy Demand—energy requirements of a process/product, including energy from renewableand non-renewable resources). In this study, energy demand is measured by the higher heatingvalue of the fuel at point of extraction.
Energy of Material Resource—the energy value of fuel resources withdrawn from the planet’sfinite fossil reserves and used as material inputs. Some of this energy remains embodied in thematerial and can potentially be recovered. Alternative terms used by other LCA practitionersinclude “Feedstock Energy” and “Inherent Energy.”
Eutrophication Potential—assesses the potential of nutrient releases to the environment todecrease oxygen content in bodies of water, which can lead to detrimental effects such as algalblooms and fish kills.
Expended Energy—energy that has been consumed (e.g., through combustion) and is no longerrecoverable
Fossil Fuel—fuels with high carbon content from natural processes (e.g. decomposition of burieddead organisms) that are created over a geological time frame (e.g. millions of years). Natural gas,petroleum and coal are examples of fossil fuels.
Fugitive Emissions—unintended leaks of substances that escape to the environment withouttreatment. These are typically from the processing, transmission, and/or transportation of fossilfuels, but may also include leaks and spills from reaction vessels, other chemical processes,methane emissions escaping untreated from landfills, etc.

APR\KC18271112.19.18 4037.00.001
v
Functional Unit—quantified performance of a product system for use as a reference unit.
Global Warming Potential—an index, describing the radiative characteristics of well-mixedgreenhouse gases, that represents the combined effect of the differing times these gases remain inthe atmosphere and their relative effectiveness in absorbing outgoing infrared radiation. This indexapproximates the time-integrated warming effect of a unit mass of a given greenhouse gas intoday’s atmosphere, relative to that of carbon dioxide.1
Greenhouse Gas—gaseous constituents of the atmosphere, both natural and anthropogenic, thatabsorb and emit radiation at specific wavelengths within the spectrum of infrared radiation emittedby the Earth’s surface, the atmosphere, and clouds. This property causes the greenhouse effect.Water vapor, carbon dioxide, nitrous oxide, methane, and ozone are the primary greenhouse gasesin the Earth’s atmosphere.
Impact Category—class representing environmental issues of concern to which life cycleinventory analysis results may be assigned.
Life Cycle—consecutive and interlinked stages of a product system, from raw material acquisitionor generation from natural resources to final disposal.
Life Cycle Assessment—compilation and evaluation of the inputs, outputs and the potentialenvironmental impacts of a product system throughout its life cycle.
Life Cycle Inventory—phase of life cycle assessment involving the compilation and quantificationof inputs and outputs for a product throughout its life cycle.
Life Cycle Impact Assessment—phase of life cycle assessment aimed at understanding andevaluating the magnitude and significance of the potential environmental impacts for a productsystem throughout the life cycle of the product.
Life Cycle Interpretation—phase of life cycle assessment in which the findings of either theinventory analysis or the impact assessment, or both, are evaluated in relation to the defined goaland scope in order to reach conclusions and recommendations.
Non-Renewable Energy—energy from resources that cannot be created on scale to sustainconsumption (i.e. cannot re-generate on human time-scale). Fossil fuels (e.g. coal, petroleum,natural gas) and nuclear power (uranium) are considered non-renewable energy resources.
Postconsumer Waste—waste resulting directly from consumer disposal of the product system ofthe analysis.
Process Waste—wastes from processes along the entire life cycle of the product system. Does notinclude postconsumer waste.
1 Definition from the glossary of the Intergovernmental Panel on Climate Change (IPCC) ThirdAssessment Report - Climate Change 2001.

APR\KC18271112.19.18 4037.00.001
vi
Precombustion Energy—the energy required for the production and processing of energy fuels,such as coal, fuel oil, natural gas, or uranium, starting with their extraction from the ground, up tothe point of delivery to the customer.
Renewable Energy—energy from natural resources that can be replenished (e.g. biomass) or arenot depleted by use (e.g., hydropower, sunlight, wind).
Smog Formation Potential— potential of emissions to form ground-level ozone which can affecthuman health and ecosystems.
Solid Waste—any wastes resulting from fuel extraction and combustion, processing, orpostconsumer disposal. Solid waste in this study is measured as waste to a specific fate (e.g. landfill,incinerator).
System Boundary—set of criteria specifying which unit processes are part of a product system.
Transportation Energy—energy used to move materials or goods from one location to anotherthroughout the various stages of a product’s life cycle
Unit Process—smallest element considered in the life cycle inventory analysis for which input andoutput data are quantified.
Water Consumption—consumptive use of water includes freshwater that is withdrawn from awater source or watershed and not returned to that source. Consumptive water use includes waterconsumed in chemical reactions, water that is incorporated into a product or waste stream, waterthat becomes evaporative loss, and water that is discharged to a different watershed or water bodythan the one from which it was withdrawn.

Chapter 1. Methodology
APR\KC18271112.19.18 4037.00.001
1
CHAPTER 1. LIFE CYCLE METHODOLOGY
1.1. OVERVIEW
This analysis is an update and expansion of a recycled resin study completed in 20112 thatquantified the total energy requirements, energy sources, atmospheric pollutants,waterborne pollutants, and solid waste resulting from the production of recycled PET andHDPE resin from postconsumer plastic.
This study provides updated data on production of recycled PET and HDPE resin and addsnew data for recycling of postconsumer polypropylene (PP) resin. In addition to updatingresults categories addressed in the original analysis, this report includes life cycle impactassessment (LCIA) results for additional results categories including acidificationpotential, eutrophication potential, and smog formation potential.
The following sections of this chapter describe key aspects of life cycle assessmentmethodology as applied in this analysis.
1.2. METHODOLOGY
This analysis has been conducted following internationally accepted standards for LCI andLCA methodology as outlined in the ISO 14040 and 14044 standard documents3.
A full “cradle-to-grave” life cycle assessment (LCA) examines the sequence of steps in thelife cycle of a product system, beginning with raw material extraction and continuingthrough material production, product fabrication, use, reuse or recycling where applicable,and final disposition. This analysis of recycled resins is a “cradle-to-gate” analysis thatends at material production. The cradle-to-gate life cycle inventory (LCI) and life cycleimpact assessment (LCIA) results presented in this study quantify the total energyrequirements, energy sources, water consumption, atmospheric pollutants, waterbornepollutants, and solid waste resulting from the production of recycled resins. The resin datacan be linked with fabrication, use, and end-of-life data to create full life cycle inventoriesfor a variety of plastic products using recycled resin content, such as packaging or durableproducts.
An LCA consists of four phases:
Goal and scope definition
2 Life Cycle Inventory of 100% Postconsumer HDPE and PET Recycled Resin from PostconsumerContainers and Packaging. January 2011. Conducted by Franklin Associates, a Division of ERG forACC Plastics Division, APR, NAPCOR, and PETRA. Available athttps://plastics.americanchemistry.com/Education-Resources/Publications/Life-Cycle-Inventory-of-Postconsumer-HDPE-and-PET-Recycled-Resin.pdf
3 International Standards Organization. ISO 14040:2006 Environmental management—Life cycleassessment—Principles and framework, ISO 14044:2006, Environmental management – Life cycleassessment – Requirements and guidelines.

Chapter 1. Methodology
APR\KC18271112.19.18 4037.00.001
2
Life cycle inventory (LCI) Life cycle impact assessment (LCIA) Interpretation of results
The LCI phase identifies and quantifies the material inputs, energy consumption, waterconsumption, and environmental emissions (atmospheric emissions, waterborne wastes,and solid wastes) over the defined scope of the study. In the LCIA phase, the inventory ofemissions is classified into categories in which the emissions may contribute to impacts onhuman health or the environment. Within each impact category, the emissions are thennormalized to a common reporting basis, using characterization factors that express theimpact of each substance relative to a reference substance. The results presented in thisstudy include both inventory results and impact assessment results. Results for recycledresin are broken out by several life cycle stages to analyze the contributions of the differentprocesses required to collect, sort, and process recycled resins.
The remainder of this chapter addresses Goal and Scope issues. Life cycle inventory datasets developed for this study are presented in Chapter 2, and LCI and LCIA results arepresented in Chapter 3.
1.3. GOAL AND SCOPE
The goal of this study was to develop updated environmental data on the production ofthree postconsumer recycled resins: recycled PET, recycled HDPE, and recycled PP.
For a more comprehensive understanding of the environmental benefits and tradeoffs forrecycled resins compared to virgin resins, this updated analysis of recycled resin productionincludes results for an expanded set of environmental indicators:
Energy Consumption Water Consumption Solid Waste Global Warming Potential Acidification Potential Eutrophication Potential Smog Formation Potential
The geographic scope of this study is for recycled resin produced and sold in NorthAmerica. Recycled resin results are compared with results for corresponding virgin resinproduced in North America.
This analysis was conducted to provide APR, its members, and the life cycle communitywith transparent, detailed data and results for recycled resin. The information in this reportserves several important purposes:
1. To provide stakeholders with updated data on the processes involved in collecting,sorting, and reprocessing postconsumer resins into a form ready for use in anotherproduct system.

Chapter 1. Methodology
APR\KC18271112.19.18 4037.00.001
3
2. To provide stakeholders with information about the relative environmental impactsof recycled and virgin plastic resins.
3. To provide data sets that can be used by any life cycle practitioner to model systemsusing postconsumer recycled HDPE, PET, or PP.
The remaining sections of this chapter address scoping aspects including the functionalunit, product systems studied, system boundaries, data requirements, data sources, co-product allocation, recycling methodology, and impact assessment methodology.
1.3.1. Functional Unit
The function of resin is as a raw material for manufacturing a wide variety of products.Since material inputs for a product are typically specified on a mass basis, a mass of resinready for converting is used as the functional unit. Results in Chapter 3 are shown both ona metric unit output basis (1 kg) and a US unit basis (1,000 lb).
1.3.2. Product Systems Studied
The focus of this analysis is on production of the following postconsumer recycled resins: HDPE PET PP
Results for postconsumer recycled resins are compared to results for corresponding virginresins modeled using data from the ACC Plastics resins report.4
1.3.3. System Boundary
The recycled resin analysis begins with collection of postconsumer plastic resins andincludes sorting and separation processes as well as reclaimer processing. Transportationbetween process steps is included.
The following are not included in this study:
Product Manufacturing. The focus of this study is production of recycled resins that canbe used in a variety of product systems; therefore, converting of resins into any specificproduct(s) is excluded from the analysis.
Capital Equipment, Facilities, and Infrastructure. The energy and wastes associatedwith the manufacture of buildings, roads, pipelines, motor vehicles, industrial machinery,etc. are not included. The energy and emissions associated with production of capital
4 Cradle-to-Gate Life Cycle Assessment of Nine Plastic Resins and Four Polyurethane Precursors.August 2011. Conducted by Franklin Associates, a Division of ERG for ACC Plastics Division.Available at https://plastics.americanchemistry.com/LifeCycle-Inventory-of-9-Plastics-Resins-and-4-Polyurethane-Precursors-Rpt-Only/

Chapter 1. Methodology
APR\KC18271112.19.18 4037.00.001
4
equipment, facilities, and infrastructure generally become negligible when averaged overthe total output of product or service provided over their useful lifetimes.
Support Personnel Requirements. The energy and wastes associated with research anddevelopment, sales, and administrative personnel or related activities have not beenincluded in this study, as energy requirements and related emissions are assumed to bequite small for support personnel activities.
1.3.4. Data Requirements
ISO 14044:2006 lists a number of data quality requirements that should be addressed forstudies intended for public use. The data quality goals for this analysis were to use datathat are (1) geographically representative for the recycled resins studied based on thelocations where material sourcing and production take place, and (2) representative ofcurrent industry practices in these regions. To develop current representative data forpostconsumer resin recycling, data collection forms were sent to all PET, HDPE, and PPreclaimer members of APR. Responses were received from seven PET reclaimer facilities,six facilities processing HDPE, and three PP reclaimers. The data sets were used tocompile a weighted average for each resin based on each facility’s recycled resin output asa percentage of the total output of that recycled resin for all reporting facilities.
The background data sets used to model energy, chemicals, etc. used by the reclaiweredrawn primarily from the US LCI database. In some cases, such as modeling of certainchemicals reported by reclaimers, the data were supplemented with data from the ecoinventdatabase and ERG’s private North American database. The data sets used were the mostcurrent and most geographically and technologically relevant data sets available during thedata collection and modeling phase of the project.
Consistency, Completeness, Precision: Data evaluation procedures and criteria wereapplied consistently to all primary data provided by the resin reclaimers. All primary dataobtained specifically for this study were considered the most representative available forthe systems being studied. Data sets were reviewed for completeness and material balances,and follow-up was conducted as needed to resolve any questions about the input and outputflows, process technology, etc.
Reproducibility: To maximize transparency and reproducibility, the report identifiesspecific data sources, assumptions, and approaches used in the analysis to the extentpossible; however, reproducibility of study results is limited to some extent by the need toprotect proprietary primary data that were judged to be the most representative data setsfor modeling purposes but could not be shown due to confidentiality.
Uncertainty: In LCA studies with thousands of numeric data points used in thecalculations, the accuracy of the data and how it affects conclusions is truly a complexsubject, and one that does not lend itself to standard error analysis techniques. Techniquessuch as Monte Carlo analysis can be used to assess study uncertainty, but the greatestchallenge is the lack of uncertainty data or probability distributions for key parameters,

Chapter 1. Methodology
APR\KC18271112.19.18 4037.00.001
5
which are often only available as single point estimates. However, steps are taken to ensurethe reliability of data and results, as previously described.
The accuracy of the environmental results depends on the accuracy of the numbers that arecombined to arrive at that conclusion. For some processes, the data sets are based on actualplant data reported by plant personnel, while other data sets may be based on engineeringestimates or secondary data sources. Primary data collected from actual facilities areconsidered the best available data for representing industry operations. In this study,primary data were used to model the reclaimer processes used to produce the recycledresins. All data received were carefully evaluated before compiling the production-weighted average data sets used to generate results. Supporting background data weredrawn from credible, widely used databases including the US LCI database and ecoinvent.
1.3.5. Data Sources
Data sources used for modeling postconsumer resin collection, sorting, and recyclingprocesses are listed in each section of Chapter 2. The recycled resin results are comparedwith corresponding virgin resin results modeled using data from the ACC resins report.5
1.3.6. Allocation Procedures
In some cases, a process may produce more than one useful output. The ISO 14044: 2006standard on life cycle assessment requirements and guidelines lists the preferred hierarchyfor handling allocation as (1) avoid allocation where possible, (2) allocate flows based ondirect physical relationships to product outputs, (3) use some other relationship betweenelementary flows and product output. No single allocation method is suitable for everyscenario. How product allocation is made will vary from one system to another, but thechoice of parameter is not arbitrary. ISO 14044 section 4.3.4.2 states “the inventory isbased on material balances between input and output. Allocation procedures shouldtherefore approximate as much as possible such fundamental input/output relationships andcharacteristics.”
Some processes lend themselves to physical allocation because they have physicalparameters that provide a good representation of the environmental burdens of each co-product. Examples of various allocation methods are mass, stoichiometric, elemental,reaction enthalpy, and economic allocation. In most cases, mass allocation has been usedwhere allocation is necessary in this analysis. Allocation choices for specific processes aredescribed in the rest of this section.
For material recovery facilities (MRFs), operating data were provided at a facility level, soit was not possible to allocate energy use to specific subprocesses or materials within the
5 Cradle-to-Gate Life Cycle Assessment of Nine Plastic Resins and Four Polyurethane Precursors.August 2011. Conducted by Franklin Associates, a Division of ERG for ACC Plastics Division.Available at https://plastics.americanchemistry.com/LifeCycle-Inventory-of-9-Plastics-Resins-and-4-Polyurethane-Precursors-Rpt-Only/

Chapter 1. Methodology
APR\KC18271112.19.18 4037.00.001
6
facility. Facility energy use and wastes were therefore allocated over the total mass ofuseful materials separated at the MRF.
Similarly, reclaimers provided operating data at a facility level. Reclaimers reported theamount of recycled resin produced, as well as the amounts of other useful materialrecovered from incoming material, including other resins, metals, etc. that are sold to otherprocessors. The amount of material transported to the reclaimer also includes contaminants.The burdens associated with the contaminants in the incoming material (incomingtransportation and contaminants removed as solid waste) were allocated over the total massof useful material recovered from the incoming material. After sorting and separation,useful materials other than the intended resin type are sent to other locations for processing.Since the primary recycled resin is the only product that goes through the completesequence of processing steps at the facility, all facility process requirements (energy, waterand chemical use, emissions) were allocated to the primary resin output product.
In the sequence of processes used to produce virgin plastic resins from natural gas andpetroleum feedstocks, some processes produce material or energy co-products. When theco-product is heat or steam or a co-product sold for use as a fuel, the energy content of theexported heat, steam, or fuel was treated as an energy credit for that process (i.e., allocationby energy content). When the co-product is a material, the process inputs and emissionswere allocated to the primary product and co-product material(s) on a mass basis.
1.3.7. Recycling Methodology
When material is used in one system and subsequently recovered, reprocessed, and used inanother application, there are different methods that can be used to allocate environmentalburdens among different useful lives of the material.
This analysis presents results for two commonly used recycling allocation methodologies.Both of these methodological approaches are acceptable under the ISO standards; however,there are differences in the results obtained by using the two approaches.
In the method referred to here as the “cut-off” method, all virgin material productionburdens are assigned to the first use of the material, and the burdens assigned to therecycled resin system begin with recovery of the postconsumer material. All of the burdensfor material recovery, transport, separation and sorting, and reprocessing are assigned tothe recycled material.
In the open-loop allocation method, the burdens for virgin material production, recoveryand recycling, and ultimate disposal of recycled material are shared among all thesequential useful lives of the material. Therefore, the share of virgin material burdensallocated to any individual use of the resin depends upon assumptions about the totalnumber of useful lives of the resin. This analysis does not define the application in whichthe recycled resin will be used, and no projections are made about future recovery andrecycling of the material. For the purposes of presenting cradle-to-gate open-loop resultsfor recycled resin, this analysis uses an assumption of two useful lives of the material (resin

Chapter 1. Methodology
APR\KC18271112.19.18 4037.00.001
7
used in a virgin product, then in a recycled product, then disposed), so the burdens forvirgin material production, postconsumer recovery, and reprocessing are divided betweenthe virgin and recycled uses of the material.
Because this analysis is focused on production of resin used as an input to productmanufacturing, no burdens are included here for manufacturing, use, or end-of-lifemanagement of a product made from the recycled resin. Those life cycle stages will dependon the specific product application in which the resin is being used.
1.3.8. Impact Assessment
The output of a life cycle inventory is a lengthy and diverse list of elementary andintermediate inputs and outputs, making it difficult to interpret the emissions inventory ina concise and meaningful manner. Life Cycle Impact Assessment (LCIA) helps withinterpretation of the emissions inventory. LCIA is defined in ISO 14044 section 3.4 as the“phase of life cycle assessment aimed at understanding and evaluating the magnitude andsignificance of the potential environmental impacts for a product system throughout thelife cycle of the product.” In the LCIA phase, the inventory of emissions is first classifiedinto categories in which the emissions may contribute to impacts on human health or theenvironment. Within each impact category, the emissions are then normalized to a commonreporting basis, using characterization factors that express the impact of each substancerelative to a reference substance.
Characterization factors have been defined to estimate the amount of impact potential ofLCI results. Impacts can be characterized as midpoint or endpoint indicators. The‘midpoint’ approach links results to categories of commonly defined environmentalconcerns like eutrophication and climate change. The ‘endpoint’ approach further modelsthe causality chain of environmental stressors to link LCI results to environmental damages(e.g., to human and ecosystem health). ISO standards allow the use of either method in theLCIA characterization step. Overall, indicators close to the inventory result (midpoint)have a higher level of scientific consensus, as less of the environmental mechanism ismodeled. Conversely, endpoint and damage-oriented characterization models inevitablyinclude much aggregation and some value-based weighting of parameters. To reduceuncertainty in communication of the results, this study focuses on indicators at the midpointlevel.
1.3.8.1. Scope of Impact Assessment
This study evaluates a variety of environmental indicators for recycled resins. Theindicators, along with brief descriptions, evaluation methodology, and reporting units, areshown in

Chapter 1. Methodology
APR\KC18271112.19.18 4037.00.001
8
Table 1-1.

Chapter 1. Methodology
APR\KC18271112.19.18 4037.00.001
9
Table 1-1. Environmental Indicators Evaluated
Impact/InventoryDescription Unit
LCIA/LCIMethodologyCategory
LC
I C
ateg
orie
s
Total energydemand
Total energy from point ofextraction; results include bothrenewable and non-renewableenergy sources
MJCumulativeenergy inventory
Expended energy
Energy irretrievably consumed;calculated as total energy minus thepotentially recoverable energyembodied in the material.
MJ
Cumulativeenergy inventoryminus energyembodied inmaterial
Waterconsumption
Freshwater withdrawals which areevaporated, incorporated intoproducts and waste, transferred todifferent watersheds, or disposedinto the sea after usage
liters H2O
Cumulativewaterconsumptioninventory
Solid waste byweight
Mass of waste materials sent tovarious waste managementfacilities (e.g., landfill, WTE) forfinal disposal
kgCumulativesolid wasteinventory
LC
IA C
ateg
orie
s
Global warmingpotential (GWP)
Represents the heat trappingcapacity of greenhouse gases.Important emissions include fossilCO2, CH4, N2O, fluorinated gases.
kg CO2
equivalents(eq)
IPCC (2013)GWP 100a
Acidificationpotential
Quantifies the acidifying effect ofsubstances on their environment.Important emissions: SO2, NOx,NH3, HCl, HF, H2S
kg SO2 eq TRACI v2.1
Eutrophicationpotential
Assesses impacts from excessiveload of macro-nutrients to theenvironment. Important emissions:NH3, NOx, COD and BOD, N andP compounds
kg N eq TRACI v2.1
Smog formationpotential
Determines the formation ofreactive substances (e.g.tropospheric ozone) that causeharm to human health andvegetation. Important emissions:NOx, BTEX, NMVOC, CH4, C2H6,C4H10, C3H8, C6H14, acetylene, Et-OH, formaldehyde
kg O3 eq TRACI v2.1
1.3.8.2. Energy Demand Accounting
ERG uses its own method to assess energy demand. The energy demand method is not animpact assessment, but rather is a cumulative inventory of energy extracted and utilized,including both renewable and non-renewable energy. Non-renewable fuels include fossil

Chapter 1. Methodology
APR\KC18271112.19.18 4037.00.001
10
fuels (i.e., natural gas, petroleum, and coal) and nuclear energy, while fuels classified asrenewable include hydroelectric energy, wind energy, hydropower, geothermal energy, andbiomass energy.
Energy demand results include consumption of fuels for process and transportation energy,as well as the fuel-energy equivalent for materials that are derived from fossil fuels orbiomass. The energy value of resources used as material feedstock is referred to as energyof material resource, or EMR. EMR is not expended energy (i.e., energy that is consumedthrough combustion) but the energy value of resources with fuel value (e.g., oil, naturalgas) that are used to provide material content for virgin plastic resins. Some of this energyremains embodied in the material produced rather than being irretrievably expendedthrough combustion, as is the case for process and transportation fuels. In this study, EMRapplies to the crude oil and natural gas used to produce virgin plastic resins.
The energy values for fuels and electricity consumed in each industrial process are summedand categorized into an energy profile including the energy types (i.e., sources) listedbelow:
Natural gas Petroleum Coal Nuclear Hydropower Biomass Other non-fossil Other fossil
The “other non-fossil” category includes sources such as solar, wind, and geothermalenergy. The “other fossil” category refers to other fuels derived from fossil fuel sourcessuch as combustion of fossil-derived plastics and rubbers in municipal solid waste. Allconversions for fuel inputs reflect the fuels’ higher heating values (HHV).

Chapter 2. Recovery and Recycling Processes
APR\KC18271112.19.18 4037.00.001
11
CHAPTER 2. RECOVERY AND RECYCLING PROCESSES
2.1. INTRODUCTION
In this analysis, the steps for production of postconsumer recycled resin are divided intothree main stages:
(1) Recovery: Collection of postconsumer plastic,(2) Sorting and Separation: Sorting of plastics from other co-collected
recovered materials (such as paper, steel, and aluminum), and separatingmixed plastics into individual resins,
(3) Reclaimer Operations: Additional separation and processing ofpostconsumer resin by a reclaimer to convert the received material intoclean resin ready for use in manufacturing.
This chapter describes the methodology and data sources used to quantify each stage.
2.2. RECOVERY
Postconsumer PET, HDPE and PP products that are recovered for recycling are primarilypackaging products, including soft drink and milk bottles, other bottles and containers, andother PET and HDPE packaging, such as PET thermoforms. Collection of these materialsoccurs through residential curbside collection, drop-off programs, deposit redemptionsystems, and commercial collection programs. The percentage of containers recoveredthrough the California deposit system is shown as “CRV” (California refund value) inTable 2-1.
The percent of PET, HDPE and PP recovery through the various collection programs wasdetermined from an analysis of the following data sources:
National PET, HDPE and PP Recovery for 2015: U.S. EPA. Advancing Sustainable Materials Management: Facts and Figures 2015.
https://www.epa.gov/facts-and-figures-about-materials-waste-and-recycling/advancing-sustainable-materials-management
Curbside/Drop-off/Deposit Mix: Governmental Advisory Associates, Inc. 2016-2017 Materials Recycling and
Processing in the United States Database. 2016. California Department of Resources Recycling and Recovery. November 7, 2016.
Biannual Report of Beverage Container Sales, Returns, Redemption, and RecyclingRates. Accessed 16 February 2017. http://www.calrecycle.ca.gov
California Department of Conservation Division of Recycling. June 2009. MarketAnalysis for Recycled Beverage Container Materials: 2009 Update. Accessed 16February 2017http://www.calrecycle.ca.gov/Publications/Documents/BevContainer/2011024.pdf

Chapter 2. Recovery and Recycling Processes
APR\KC18271112.19.18 4037.00.001
12
Commercial Recovery: PET and HDPE containers calculated as total recovery minus residential recovery
and deposit recovery PP commercial recovery assumed to be negligible.
The results of this analysis are shown below.
Table 2-1. Collection Systems for Recovery of Postconsumer PET, HDPE, and PPContainers and Other Packaging
Curbside(1)
Drop-off
Deposit(2) CRV (3)
CommercialThrough
MRF Other
PET 54% 5% 17% 16% 2% 6%
HDPE(4) 62% 5% 5% 4% 23% 2%
PP 95% 5% <0.1%
(1) Includes deposit and non-deposit containers collected through curbside.(2) Includes deposit and non-deposit containers collected through deposit centers.(3) California refund value(4) Excludes HDPE film packaging.
The following sections describe how fuel use for each type of collection was estimated forthis analysis. Some of the estimates utilize default data from the U.S. EPA Municipal SolidWaste (MSW) Decision Support Tool (DST):
U.S. EPA. Office of Research and Development, APPCD. Default Data and DataInput Requirement for the Municipal Solid Waste Management Decision SupportTool Final. December 2000.https://webdstmsw.rti.org/docs/Inputs_Document_OCR.pdf
2.2.1. Fuel Use for Residential Curbside Collection
Residential curbside collection accounts for the majority of postconsumer plastic recovery(over 50 percent of PET, over 60 percent of HDPE, and 95 percent of the PP). To developfuel requirements for curbside collection of PET, HDPE, and PP, data were gathered fromvarious sources to determine the percentage of material collected curbside for three levelsof separation: single stream, dual stream, and curbside sort. Single stream and dual streamwere further divided into manual and automated collection. Curbside sort is manual.

Chapter 2. Recovery and Recycling Processes
APR\KC18271112.19.18 4037.00.001
13
Curbside collection modeling was developed from the following data sources:
Collection System – Percentages of Single Stream, Dual Stream, Curbside Sort;Percentages of Automated/Manual Collection
Governmental Advisory Associates, Inc. 2016-2017 Materials Recycling andProcessing in the United States Database. 2016.
Collection System – Fuel Profile: Environmental Research & Education Foundation (EREF) and University of
Central Florida. Ergonomic & Environmental Study of Solid Waste CollectionFinal Report. November 8, 2012.
Texas Gas Service. Refuse Companies Waste No Time Switching to CNG.(undated).
Clean Energy Compression. What Refuse Truck Fleets are doing to Make Our AirCleaner. July 30, 2015.
The total quantity of recyclables per truckload was based on the number of householdsserved per collection vehicle route, the average pounds of recyclables set out per householdper week, and the composition of the recyclables generated. The truck fuel requirementswere then allocated to the materials collected. The following data sources were used:
Composition by Weight of Materials Collected per Vehicle Load: U.S. EPA. Advancing Sustainable Materials Management: Facts and Figures 2015.
https://www.epa.gov/facts-and-figures-about-materials-waste-and-recycling/advancing-sustainable-materials-management
California Department of Conservation Division of Recycling. June 2009. MarketAnalysis for Recycled Beverage Container Materials: 2009 Update. Accessed 16February 2017.http://www.calrecycle.ca.gov/Publications/Documents/BevContainer/2011024.pdf
The results of this analysis are shown in Table 2-2.
Collection route planning is typically based on the number of household stops that can bemade by the vehicle, taking into account the level of automation of the vehicle (affectingtime spent per stop) and the volume of material that will be collected from the householdson the route. Consumer compaction of recyclables prior to set-out can vary widelydepending on household practices. Additional compaction of the material is done by thecompaction mechanism on the collection vehicle. The fuel profile of collection vehicleswas modeled as 96 percent trucks using diesel fuel at 2.80 mpg and 4 percent vehiclesusing compressed natural gas (CNG) at 2.47 mpg. This include fuel use while idling atstops, as well as fuel used while the vehicle is traveling.
Table 2-2. Curbside Collection Profile by Weight

Chapter 2. Recovery and Recycling Processes
APR\KC18271112.19.18 4037.00.001
14
Single stream collection Dual stream collectionCurbside sort
collectionPercent ofMaterialCollected
91.8% 6.9% 1.3%
27.7% 64.1% 5.2% 1.7% 1.3%
Trucktype Manual
Fully/semi-Automated Manual
Fully/semi-automated Manual
Route distanceround trip 50 50 50 50 50
Households perroute 710 1,200 800 1,000 560
Set-out rate 57% 57% 57% 57% 57%Average set-outs per route 405 684 456 570 319
Poundsmaterial perset-out
12.5 12.5 9.5 9.5 7.3
Poundsmaterial perload
5,044 8,526 4,325 5,407 2,331
Truck Load Composition (by weight)*PET 2.8% 2.8% 2.8% 2.8% 3.6%HDPE 1.5% 1.5% 1.5% 1.5% 2.0%PP 0.3% 0.3% 0.3% 0.3% 0.4%Other plastic 0.9% 0.9% 0.9% 0.9%ONP (oldnewspaper)
28.3% 28.3% 28.3% 28.3% 36.8%
Corrugatedcontainers 4.8% 4.8% 4.8% 4.8% 6.2%
Other paper 28.7% 28.7% 29.7% 28.7% 37.2Aluminum 1.3% 1.3% 1.3% 1.3% 1.7%Steel 5.8% 5.8% 5.8% 5.8% 7.5%Glass 3.5% 3.5% 3.5% 3.5% 4.5%Otherpackaging
11.4% 11.4% 11.4% 11.4%
Nonrecyclables 10.7% 10.7% 10.7% 10.7%Total 100% 100% 100% 100% 100%*Curbside sort individual percentages are higher due to fewer materials in the curbsidesort mix compared to single and dual stream.
2.2.2. Fuel Use for Consumer Drop-off at a Recycling Center
As shown in Table 2-1, drop-off recycling centers account for approximately 5 percent ofpostconsumer plastic recovery. Fuel use by consumers delivering household recyclables toa drop-off center was estimated based on following assumptions:
12.5 pounds of household recyclables generated per week (EPA MSWreport and weekly set-out rate shown in Table 2-2)
Recyclables dropped off every other week (ERG assumption) Distance driven: 10 miles (EPA MSW Decision Support Tool default value)

Chapter 2. Recovery and Recycling Processes
APR\KC18271112.19.18 4037.00.001
15
Fuel economy of personal vehicle used for trip: 22 mpg (EPA GreenhouseGases Equivalencies Calculator - Calculations and References6)
Percent of trips that are dedicated trips for the purpose of dropping offrecyclables: 50% (MSW DST default)
Remainder of trips are assumed to have a different primary purpose so thatdrop-off of recyclables requires incremental additional travel, estimated as5 miles, to make an extra stop at a drop-off center (ERG assumption).
2.2.3. Deposit and CRV Drop-off
It is assumed that a consumer would not make a trip for the sole purpose of returningdeposit containers. Consumers would drop off bottles as an incidental stop on a trip withsome other primary purpose (e.g., deposit bottles purchased at a grocery store would bereturned on the next trip to the store to buy groceries), so fuel use for returning depositcontainers is treated as incidental, with no consumer transport burdens assigned toreturning deposit containers. Accumulated quantities of deposit containers are modeled asbeing transported from the collection point to an intermediate processing center (IPC).Based on information provided by a confidential source, transport of deposit containers tothe IPC is modeled as a volume-limited load of loose bottles transported 20 miles by asingle-unit truck. At the IPC, the containers are baled for shipment to the next processinglocation.
2.2.4. Commercial Collection
No consumer transport burdens are assigned to postconsumer plastic recovered fromcommercial sources. For this scenario, it is assumed that the accumulated quantitiestransported per load are larger and a tractor-trailer truck is used. Based on informationprovided by a confidential source, the distance hauled is longer and is estimated as 150miles. At the MRF some additional sorting may be done before the postconsumer materialis baled for shipment to the next processing location.
2.3. SORTING AND SEPARATION
Once the postconsumer PET, HDPE, and PP have been collected, they must be separatedfrom other co-collected materials and plastics. Although some recovered plastic isseparated by curbside sorting and the use of separate bins at drop-off recycling centers,sorting and separation of plastics most commonly takes place at material recovery facilities(MRFs). Sorting operations at MRFs range from manual sorting of items on a conveyor tohighly automated systems using magnets, air classifiers, optical sorters, and othertechnologies to sort and separate mixed incoming materials. Postconsumer plastics may beseparated and baled as mixed plastics, or the facility may have the capability to further sortdown to individual resin bales.
6 Accessed at https://www.epa.gov/energy/greenhouse-gases-equivalencies-calculator-calculations-and-references. “In 2015, the weighted average fuel economy of cars and light trucks combined was 22.0miles per gallon (FHWA 2017).”

Chapter 2. Recovery and Recycling Processes
APR\KC18271112.19.18 4037.00.001
16
For the original (2011) recycled resin analysis, data were collected from MRFs and a PRFusing data collection forms developed specifically for the project by ERG. Four completedMRF surveys and one completed PRF survey were received. For the MRFs, one data setwas for a large facility that processed both single-stream and dual-stream collectedmaterial, two were for medium dual-stream facilities, and one was for a small dual-streamfacility. The data provided on the forms included information on the sources of materialreceived at the MRF, the transportation mode and distance for incoming material from eachsource, the types and quantities of useful materials recovered from the incoming material,the types of equipment used at the facility, energy and water use at the facility, and thesolid wastes, atmospheric and waterborne emissions from the facility. For each facility, theoperating data were allocated over the total weight of recovered materials.
Individual MRF facility data cannot be shown because of data confidentiality; however, aweighted average data set was developed based on the amount of collected plastic materialprocessed at each type of facility, using the single- and dual-stream collection data fromsection 2.1. The weighted average data set is shown in Table 2-3. To protect confidentialdata, the PRF data set cannot be shown.
Table 2-3. Sorting at MRF
For sorting at MRFs, total solid wastes were allocated over the total pounds of usefuloutput, so that the pounds of MRF sorting waste is the same for 1,000 pounds of output,whether it is PET, HDPE, PP. The same approach was used to calculate the sorting wasteper 1,000 pounds of output material for the PRF.
2.4. RECLAIMER OPERATIONS
Data collection forms for PET, HDPE, and PP reclaimers were developed for this projectby ERG. Completed forms were received from seven PET reclaimer facilities, six facilitiesprocessing HDPE, and three PP reclaimers. The data sets were used to compile a weightedaverage for each resin based on each facility’s recycled resin output as a percentage of the
Per 1000 lb Per 1 kgIncoming MaterialCollected postconsumer resin (1) 1,100 lb 1.10 kg
EnergyElectricity 6.56 kWh 0.014 kWhNatural gas 0.052 cu ft 3.3E-06 cu mDiesel 0.24 gal 0.0020 literLPG 0.40 gal 0.0033 liter
Solid WasteIncoming wastes removed at MRF 100 lb 0.1 kg
(1) Includes the weight of incoming contaminants removed at the MRF.

Chapter 2. Recovery and Recycling Processes
APR\KC18271112.19.18 4037.00.001
17
total output of that recycled resin for all reporting facilities. As with the MRF data sets,only the weighted average data sets can be shown in order to protect the confidentiality ofindividual facility data sets.
While the majority of reclaimers participating in this analysis were located in the US, somedata were provided by reclaimers in Canada and Mexico. The weighted average electricityshown in the reclaimer tables does not separate out the weighted average amounts ofelectricity use by country, to prevent any possibility of backing out individual reclaimerelectricity use based on their share of recycled resin production. The results in Chapter 3reflect the weighted average mix of electricity for resin produced in each country.
2.4.1. PET Reclamation Processes
The reclaimers that provided data for this study produced over 416 million pounds of cleanPET flake and converted 337 million pounds of flake to solid stated food grade pellet. Theaverage incoming transport distance to reclaimers was 366 miles by truck. Overall, theparticipating reclaimers reported receiving about 90% of incoming shipments from MRFs,8.7% from deposit centers, and less than 1% from PRFs. Impacts for collection of materialprior to shipment to the reclaimer were based on the industry average profile described insection 2.2. Reclaimers reported that the majority of the incoming material was bottles(95%), with the remainder thermoforms.
Most of the reporting facilities receive postconsumer PET as individual resin bales. Balesare broken down and the material sorted to remove foreign material. Some reclaimers pre-wash sorted material before it is flaked, and some reclaimers receive some resin at alreadyin flake form. Incoming flake may be clean or dirty, but all reclaimed flake is washed tomarket specifications as part of reclaimer processing operations. This is most oftenachieved with a caustic wash, but different reclaimers reported using a variety of washingchemicals including surfactants, defoamers, and wetting agents.
Even though the incoming material has undergone some presorting before it is received,other materials are mixed in with the incoming PET. Some of the non-PET material issaleable, such as polyolefin cap material (HDPE, PP) and aluminum, while other materialsare unusable contaminants. Non-PET saleable materials comprised, on average, about 14%of the weight of incoming material received, while unusable contaminants accounted foran average of 15% of the weight of incoming material.
Clean postconsumer PET can be sold in flake form, or it can be pelletized, with or withoutsolid stating. Depending on the level of processing, the postconsumer PET resin may beused for food-grade or non-food applications. All reclaimers who reported processing cleanflake to pellet produced food-grade LNO pellet. Most reclaimers reported solid stating thematerial in flake form, then converting to pellet, but some reported solid stating in pelletform.

Chapter 2. Recovery and Recycling Processes
APR\KC18271112.19.18 4037.00.001
18
Material and energy requirements per 1,000 pounds of postconsumer PET flake output arelisted in the top of Table 2-4, and process data for converting flake to food-grade pellet arereported in the bottom of the table. Data are presented in both US and metric units.
2.4.2. HDPE Reclamation Processes
HDPE reclaimers providing data for this analysis produced 448 million pounds of cleanflake and converted 427 million pounds of flake to pellet. The weighted average incomingtransport profile of postconsumer material was 350 miles by truck and 134 miles by rail. Asmall amount of ocean transport was also reported. Approximately 92% of incomingmaterial was shipped to participating reclaimers from MRFs, 6% from deposit centers, andless than 1% each from PRFs and other sources. The majority of the incoming material wasreported as bottles (82%), with the remainder rigids.
As with PET, incoming bales are broken down and the material sorted to remove foreignmaterial. Processing steps include debaling, grinding, washing, drying, extruding andpelletizing. A small amount of reclaimed resin was reported as received already in flakeform (weighted average less than 3%). Material may be washed before grinding, aftergrinding, or both. Most reclaimers reported using a variety of chemicals in the washingprocess, although types and quantities varied by reclaimer.
Incoming HDPE material contains small amounts of non-HDPE saleable material as wellas unusable contaminants. The weighted average percentage of non-HDPE saleablematerial recovered from incoming bales was less than 1%, while 17% of the incomingmaterial was unusable contaminants.
The weighted average material and energy requirements for producing 1,000 pounds ofpostconsumer recycled HDPE flake are listed in the top section of Table 2-5, and energyuse for pelletizing is reported in the bottom section of the table.

Chapter 2. Recovery and Recycling Processes
APR\KC18271112.19.18 4037.00.001
19
Table 2-4. PET Reclaimer Operations
Per 1000 lb Per 1 kgBale to FlakeIncoming MaterialCollected and sorted postconsumer resin (1) 1,178 lb 1.18 kg
Chemical InputsSodium hydroxide, 50% 9.50 lb 0.0095 kgWashing agents (2) 2.67 lb 0.0027 kgDefoamants 3.08 lb 0.0031 kgChemicals with aluminum compounds 0.68 lb 6.8E-04 kgFerric chloride 0.068 lb 6.8E-05 kgHydrogen peroxide, 35% 0.0054 lb 5.4E-06 kgAcid 0.99 lb 0.0010 kgSalt 0.48 lb 4.8E-04 kgWastewater treatment polymer 0.10 lb 9.9E-05 kgOther confidential chemicals 0.018 lb 1.8E-05 kg
Water consumption 105 gal 0.88 liters
EnergyElectricity (3) 155 kWh 0.34 kWhNatural gas 1,070 cu ft 0.067 cu mDiesel 0.079 gal 6.6E-04 literLPG 0.13 gal 0.0011 literPropane 0.37 gal 0.0031 liter
Incoming TransportationCombination truck transport, diesel (resin) 216 ton miles 0.70 tonne-kmCombination truck transport, diesel (chemicals) 1.01 ton miles 0.0033 tonne-km
Solid WasteIncoming contaminants removed by reclaimer (4) 178 lb 0.18 kgWastes generated by reclamation processes 11.5 lb 0.011 kg
Emissions to airParticulates, unspecified 0.0074 lb 7.4E-06 kg
Emissions to waterBOD (Biological Oxygen Demand) 1.83 lb 0.0018 kgCOD (Chemical Oxygen Demand) 1.57 lb 0.0016 kgSuspended solids, unspecified 0.78 lb 7.8E-04 kgDissolved solids, unspecified 0.036 lb 3.6E-05 kg
Flake to PelletProcess InputsNitrogen 50.3 cu ft 0.0031 cu m
EnergyElectricity (3) 218 kWh 0.48 kWhNatural gas 549 cu ft 0.034 cu mLPG 0.010 gal 8.3E-05 literPropane 0.035 gal 2.9E-04 liter
(1) Incoming transport of resin includes the weight of incoming contaminants allocated to the resinbased on its share of total weight of saleable outputs (resin and other recovered materials).(2) Washing agents include a variety of detergents and surfactants; not listed individually due toconfidentiality.(3) Includes electricity reported by participating reclaimers in US, Canada, and Mexico; kWh by countrynot listed individually to protect confidentiality.(4) Weight of contaminants in incoming material allocated to the resin based on its share of total weightof saleable outputs (resin and other recovered materials).

Chapter 2. Recovery and Recycling Processes
APR\KC18271112.19.18 4037.00.001
20
Table 2-5. HDPE Reclaimer Operations
Per 1000 lb Per 1 kgBale to FlakeIncoming MaterialCollected and sorted postconsumer resin (1) 1,192 lb 1.19 kg
Chemical InputsSodium hydroxide, 50% 2.35 lb 0.0023 kgWashing agents (2) 1.99 lb 0.0020 kgDefoamants 1.49 lb 0.0015 kgChemicals with aluminum compounds 0.27 lb 2.7E-04 kgFerric chloride 0.0043 lb 4.3E-06 kgHydrogen peroxide, 35% 2.9E-05 lb 2.9E-08 kgSodium hypochlorite, 12.5% 0.14 lb 1.4E-04 kgAcid 0.047 lb 4.7E-05 kgWastewater treatment polymer 0.0089 lb 8.9E-06 kg
Water consumption 104 gal 0.87 liters
EnergyElectricity (3) 87.8 kWh 0.19 kWhNatural gas 168 cu ft 0.010 cu mDiesel 0.043 gal 3.6E-04 literLPG 0.015 gal 1.3E-04 literPropane 0.14 gal 0.0011 liter
Incoming TransportationCombination truck transport, diesel (resin) 209 ton miles 0.67 tonne-kmRail transport (resin) 79.9 ton miles 0.26 tonne-kmAverage ocean freighter transport (resin) 11.2 ton miles 0.036 tonne-kmCombination truck transport, diesel (chemicals) 0.35 ton miles 0.0011 tonne-km
Solid WasteIncoming contaminants removed by reclaimer (4) 192 lb 0.19 kgWastes generated by reclamation processes 26.2 lb 0.026 kg
Emissions to airNone reported
Emissions to waterBOD (Biological Oxygen Demand) 0.31 lb 3.1E-04 kgCOD (Chemical Oxygen Demand) 0.54 lb 5.4E-04 kgSuspended solids, unspecified 0.42 lb 4.2E-04 kgDissolved solids, unspecified 0.10 lb 1.0E-04 kg
Flake to PelletEnergyElectricity (3) 151 kWh 0.33 kWh
(4) Weight of contaminants in incoming material allocated to the resin based on its share of totalweight of saleable outputs (resin and other recovered materials).
(1) Incoming transport of resin includes the weight of incoming contaminants allocated to the resinbased on its share of total weight of saleable outputs (resin and other recovered materials).(2) Washing agents include a variety of detergents and surfactants; not listed individually due toconfidentiality.(3) All participating reclaimers were located in the US.

Chapter 2. Recovery and Recycling Processes
APR\KC18271112.19.18 4037.00.001
21
2.4.3. PP Reclamation Processes
Because only three facilities provided data on PP recycling, and not all the facilitiesconverted clean flake to pellet, limited details can be provided about PP reclaimeroperations in order to protect confidentiality of individual reclaimer data. A minimum ofthree data sets are required to compile a weighted average that can be shown separatelywhile protecting individual data providers’ confidential information.
PP reclaimers providing data for this analysis produced 142 million pounds of clean flake.To protect confidential information, the amount of pellet cannot be shown because lessthan three participating reclaimers reported converting flake to pellet. The weightedaverage incoming transport profile of postconsumer material was 408 miles by truck and154 miles by rail. About 90% of incoming material was shipped to participating reclaimersfrom MRFs, less than 3% from PRFs, and 6% from other sources. The incoming materialwas divided fairly evenly between bottles and rigids. On average, less than 1% of theincoming material was non-PP saleable material and almost 15% was contaminants.Reclaimers reported little use of chemicals.
The combined weighted average material and energy requirements for producing 1,000pounds of postconsumer recycled PP pellet are listed in Table 2-6. Because less than threereclaimers reported converting flake to pellet, it is not possible to show separate weightedaverages for clean flake processing and pelletizing of clean flake.

Chapter 2. Recovery and Recycling Processes
APR\KC18271112.19.18 4037.00.001
22
Table 2-6. PP Reclaimer Operations
Per 1000 lb Per 1 kgBale to PelletIncoming MaterialCollected and sorted postconsumer resin (1) 1,172 lb 1.17 kg
Chemical InputsSodium hydroxide, 50% 0.69 lb 6.9E-04 kgWashing agents (2) 1.68 lb 0.0017 kgDefoamants 1.48 lb 0.0015 kg
Water consumption 124 gal 1.03 liters
EnergyElectricity (3) 240 kWh 0.53 kWhNatural gas 395 cu ft 0.025 cu mDiesel 0.097 gal 8.1E-04 literLPG 0.074 gal 6.2E-04 liter
Incoming TransportationCombination truck transport, diesel (resin) 239 ton miles 0.77 tonne-kmRail transport (resin) 90.2 ton miles 0.29 tonne-km
Solid WasteIncoming contaminants removed by reclaimer (4) 172 lb 0.17 kgWastes generated by reclamation processes 25.1 lb 0.025 kg
Emissions to airNone reported
Emissions to waterBOD (Biological Oxygen Demand) 0.0055 lb 5.5E-06 kgCOD (Chemical Oxygen Demand) 0.25 lb 2.5E-04 kgSuspended solids, unspecified 0.20 lb 2.0E-04 kg
(4) Weight of contaminants in incoming material allocated to the resin based on its share of totalweight of saleable outputs (resin and other recovered materials).
(1) Incoming transport of resin includes the weight of incoming contaminants allocated to the resinbased on its share of total weight of saleable outputs (resin and other recovered materials).(2) Washing agents include a variety of detergents and surfactants; not listed individually due toconfidentiality.(3) Includes electricity reported by participating reclaimers in the US and Canada; kWh by countrynot listed individually to protect confidentiality.

Chapter 3. Results
APR\KC18271112.19.18 4037.00.001
23
CHAPTER 3. RESULTS
3.1. INTRODUCTION
This chapter presents the energy requirements, water consumption, solid wastes, and otheremission-related environmental impacts for the sequence of processes used to collect, transport,separate, and process postconsumer PET, HDPE, and PP into clean recycled resin ready for useto manufacture a plastic product. The process data sets for each step were presented in Chapter2. The production and combustion of fuels used for process and transportation energy andgeneration of U.S. grid electricity were modeled using data sets developed by ERG for the USLCI Database. The recycled resin production data are compared to virgin PET, HDPE, and PPresults modeled using data from the ACC 2011 resins database.
As noted in Chapter 2 section 2.4, the majority of reclaimers participating in this analysis werelocated in the US; however, some data were provided by reclaimers in Canada and Mexico. Theresults in this chapter reflect the weighted average mix of electricity for the share of recycledresin production by participating reclaimers in each country.
3.2. RECYCLING METHODOLOGIES
As described in the Postconsumer Recycling section of Chapter 1, results are presented fortwo commonly used recycling allocation methodologies, cut-off and open-loop. While bothmethodological approaches are acceptable under ISO LCA standards, there are differences inthe results obtained by using the two approaches.
In the cut-off method, all virgin material production burdens are assigned to the first use of thematerial, and all burdens for material recovery, transport, separation and sorting, andreprocessing are assigned to the recycled material.
In the open-loop allocation method, the burdens for virgin material production, recovery andrecycling, and ultimate disposal of recycled material are shared among all the sequential usefullives of the material. For the purposes of presenting cradle-to-gate open-loop results forrecycled resin, this analysis uses an assumption of two useful lives of the material (resin usedin a virgin product, then in a recycled product, with no projections about any further recyclingafter the second use). For two useful lives of the resin, half of the burdens for virgin materialproduction, postconsumer recovery, and reprocessing are assignedto the first use of the resinand half is assigned to its recycled use. When recycled resin data are used for open-loopmodeling of product systems, the number of useful lives of the material should be adjusted asappropriate if there is recycling of the secondary product at the end of its useful life.
To summarize, the recycled resin results presented in this chapter represent the following: Cut-off method: Full burdens for collection, sorting, and reclaimer operations; no virgin
resin burdens Open-loop method: Half burdens for virgin resin production, collection, sorting, and
reclaimer operations

Chapter 3. Results
APR\KC18271112.19.18 4037.00.001
24
Because this analysis is focused on production of resin used as an input to productmanufacturing, no burdens are included here for manufacturing, use, or end-of-lifemanagement of a product made from the recycled resin. Those life cycle stages will depend onthe specific product application in which the resin is being used.
3.3. LIFE CYCLE INVENTORY RESULTS
For each recycled resin, the results tables and figures break out results by several life cyclestages:
Collection and sorting of postconsumer plastic, Transport to reclaimer, Impacts for process water and chemicals used at reclaimer, Process energy to convert incoming material to clean flake, Process energy to convert clean flake to pellet, Process emissions and wastes from reclaimer operations.
Each set of tables and figures shows results for both recycling allocation methods describedabove (cut-off and open-loop). The top section of each table shows results for the cut-offmethod, and the bottom section shows results for the open-loop method. Each section showsresults for 1 kg resin and for 1,000 lb resin. In each table, the virgin resin data results weremodeled using virgin resin data sets from the ACC resin report from 2011, with electricity gridmodeling updated to represent 2014 generation. Because virgin resin impacts are generallygreater than impacts for collection and recycling processes, results for the open-loop methodwith an allocated share of virgin resin production burdens are generally higher than results forthe cut-off method. Exceptions are seen in a few cases.
3.3.1. Energy Results
Cumulative energy demand results include all renewable and non-renewable energy sourcesused for process and transportation energy, as well as material feedstock energy. Processenergy includes direct use of fuels as well as use of fossil fuels, hydropower, nuclear, wind,solar, and other energy sources to generate electricity used by processes. The feedstock energyis the energy content of the resources removed from nature and used as material feedstocks(e.g., the energy content of oil and gas resources used as material feedstocks to produce virginresins).
Total energy results for recycled and virgin resins are shown in Table 3-1 and Figure 3-1. Thetotal energy results shown in Figure 3-1 for virgin resin include the feedstock energy embodiedin the resin, and feedstock energy is also included in the allocated virgin resin burdens in theopen-loop recycled resin results. Total energy requirements for food-grade rPET pellet are 21percent of virgin PET resin burdens when the cut-off recycling method is used, and 61 percentof virgin resin energy using the open-loop recycling allocation method. For HDPE and PP,recycled HDPE and PP pellets require 12 percent as much energy as virgin resin using the cut-off recycling method, and 56 percent as much energy as virgin for the open-loop recyclingmethod.

Chapter 3. Results
APR\KC18271112.19.18 4037.00.001
25
Table 3-1. Total Energy Results for Recycled Resin Compared to Virgin, With and Without Feedstock Energy
PC ResinCollection& Sorting
PC ResinTransport
toReclaimer
ProcessWater &
Chemicals
ProcessEnergy,Bale toFlake
ProcessEnergy,Flake toPellet*
ProcessEmissions& Wastes
RecycledResin Pellet
Total**
VirginPellet
(includingFeedstock
Energy)Recycled %
of Virgin
RecycledResin %
Reductionfrom Virgin
VirginPellet
(excludingFeedstock
Energy)Recycled %
of Virgin
RecycledResin %
Reductionfrom Virgin
Recycled PET 1.19 0.87 0.21 6.44 6.14 0 14.8 69.8 21% 79% 33.3 45% 55%Recycled HDPE 1.52 0.92 0.13 2.55 3.57 0 8.69 75.3 12% 88% 25.0 35% 65%Recycled PP 1.64 1.04 0.11 0 8.89 74.4 12% 88% 25.1 35% 65%
Recycled PET 0.51 0.37 0.089 2.77 2.64 0 6.38 30.0 21% 79% 14.3 45% 55%Recycled HDPE 0.65 0.40 0.058 1.10 1.53 0 3.74 32.4 12% 88% 10.8 35% 65%Recycled PP 0.71 0.45 0.049 0 3.82 32.0 12% 88% 10.8 35% 65%
Recycled PET 0.60 0.43 0.10 3.22 3.07 0 42.3 69.8 61% 39% 33.3 72% 28%Recycled HDPE 0.76 0.46 0.067 1.27 1.78 0 42.0 75.3 56% 44% 25.0 67% 33%Recycled PP 0.82 0.52 0.057 0 41.6 74.4 56% 44% 25.1 68% 32%
Recycled PET 0.26 0.19 0.044 1.38 1.32 0 18.2 30.0 61% 39% 14.3 72% 28%Recycled HDPE 0.33 0.20 0.029 0.55 0.77 0 18.0 32.4 56% 44% 10.8 67% 33%Recycled PP 0.35 0.22 0.024 0 17.9 32.0 56% 44% 10.8 68% 32%
*For PP, only combined results for bale to pellet are shown in order to protect confidential data from participating reclaimers.**In Open-loop results, recycled resin total includes allocated share of virgin resin impacts.
2.62
CUT-OFF
6.09
3.04
1.31
MJ per kg of resin
Million Btu per 1000 lb of resin
MJ per kg of resin
Million Btu per 1000 lb of resin
OPEN LOOP

Chapter 3. Results
APR\KC18271112.19.18 4037.00.001
26
Figure 3-1. Total Energy Results for Recycled and Virgin Resins (MJ/kg)
Figure 3-2 shows comparative results for recycled and virgin burdens with feedstockenergy embodied in the resin excluded, so that the results represent the expended processand transportation energy that is consumed in producing virgin and recycled resins. Theresults in Figure 3-2 are shown on the same scale as the results in Figure 3-1. Becausefeedstock energy accounts for a significant share of the total energy requirements for virginresin, excluding feedstock energy in the virgin resin significantly reduces the overall resultsfor virgin resin as well as open-loop results for recycled resin that include an allocatedshare of virgin impacts. When virgin and recycled resins are compared on the basis ofprocess and transportation energy consumed, cut-off results for recycled PET are 45percent of virgin PET energy, and cut-off results for recycled HDPE and PP are 35 percentof virgin energy. Open-loop results for recycled resins as a percentage of correspondingvirgin resin results are 72 percent for PET, 67 percent for HDPE, and 68 percent for PP.

Chapter 3. Results
APR\KC18271112.19.18 4037.00.001
27
Figure 3-2. Process and Transportation Energy for Recycled and Virgin ResinsExcluding Feedstock Energy (MJ/kg)
3.3.2. Water Consumption Results
Consumptive use of water in this study includes freshwater that is withdrawn from a water sourceor watershed and not returned to that source. Consumptive water use includes water consumedin chemical reactions, water that is incorporated into a product or waste stream, water thatbecomes evaporative loss, and water that is discharged to a different watershed or water bodythan the one from which it was withdrawn. Water consumption results shown for each life cyclestage include process water consumption as well as water consumption associated withproduction of the electricity and fuels used in that stage. Electricity-related water consumptionincludes evaporative losses associated with thermal generation of electricity from fossil andnuclear fuels, as well as evaporative losses due to establishment of dams for hydropower.
Water consumption results for recycled and virgin resins are shown in Table 3-2 and Figure 3-3.The figure shows that water consumption associated with energy use for flake and pelletprocessing steps is greater than direct water consumption for washing and flotation separationoperations at reclaimer facilities. Water consumption results for flake and pellet processinginclude evaporative losses of cooling water associated with electricity generation via fossil fuelcombustion, as well as evaporative losses from reservoirs used for hydropower generation.Hydropower accounts for a significant share of the electricity used by reclaimers in Canada.
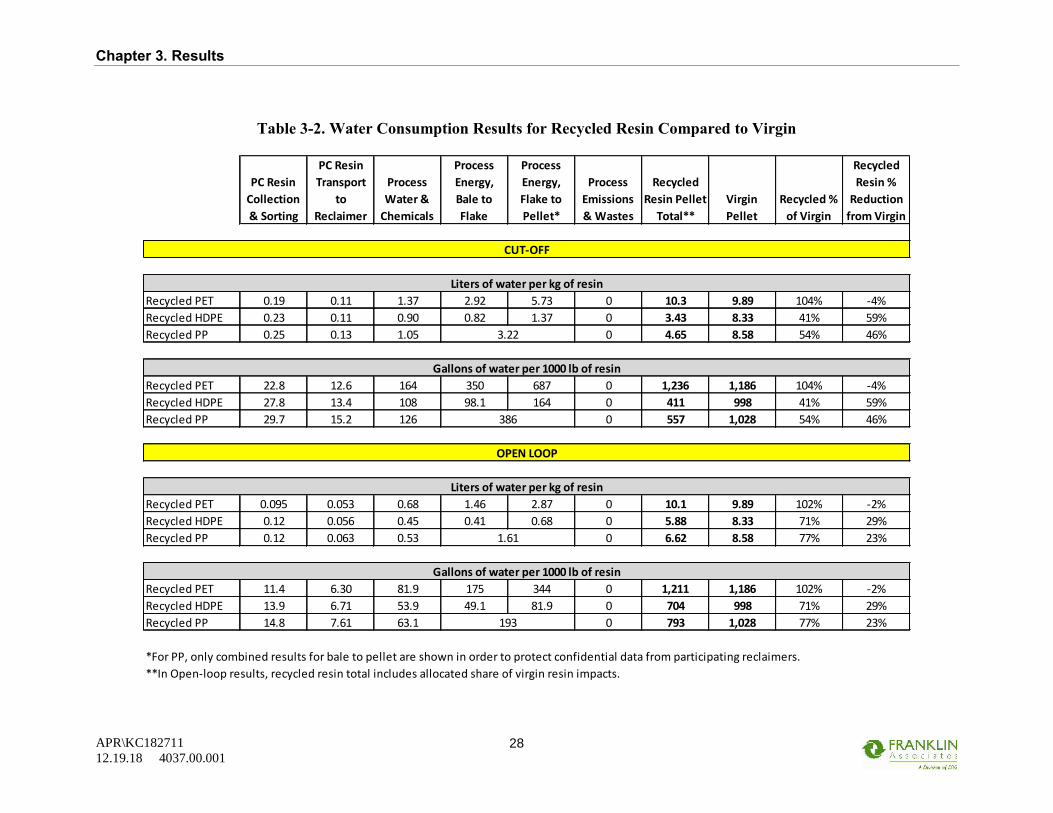
Water consumption results for food-grade rPET pellet are 104 percent of virgin PET resinburdens when the cut-off recycling method is used, and 102 percent of virgin resin energy usingthe open-loop recycling allocation method. For HDPE, recycled resin pellets consume 41 percentas much water as virgin resin using the cut-off recycling method, and 71 percent as much wateras virgin for the open-loop recycling method. For PP, recycled resin pellets consume 54 percentas much water as virgin resin using the cut-off recycling method, and 77 percent as much wateras virgin for the open-loop recycling method.
Chapter 3. Results
APR\KC18271112.19.18 4037.00.001
28
Table 3-2. Water Consumption Results for Recycled Resin Compared to Virgin
PC ResinCollection& Sorting
PC ResinTransport
toReclaimer
ProcessWater &
Chemicals
ProcessEnergy,Bale toFlake
ProcessEnergy,Flake toPellet*
ProcessEmissions& Wastes
RecycledResin Pellet
Total**VirginPellet
Recycled %of Virgin
RecycledResin %
Reductionfrom Virgin
Recycled PET 0.19 0.11 1.37 2.92 5.73 0 10.3 9.89 104% -4%Recycled HDPE 0.23 0.11 0.90 0.82 1.37 0 3.43 8.33 41% 59%Recycled PP 0.25 0.13 1.05 0 4.65 8.58 54% 46%
Recycled PET 22.8 12.6 164 350 687 0 1,236 1,186 104% -4%Recycled HDPE 27.8 13.4 108 98.1 164 0 411 998 41% 59%Recycled PP 29.7 15.2 126 0 557 1,028 54% 46%
Recycled PET 0.095 0.053 0.68 1.46 2.87 0 10.1 9.89 102% -2%Recycled HDPE 0.12 0.056 0.45 0.41 0.68 0 5.88 8.33 71% 29%Recycled PP 0.12 0.063 0.53 0 6.62 8.58 77% 23%
Recycled PET 11.4 6.30 81.9 175 344 0 1,211 1,186 102% -2%Recycled HDPE 13.9 6.71 53.9 49.1 81.9 0 704 998 71% 29%Recycled PP 14.8 7.61 63.1 0 793 1,028 77% 23%
*For PP, only combined results for bale to pellet are shown in order to protect confidential data from participating reclaimers.**In Open-loop results, recycled resin total includes allocated share of virgin resin impacts.
Liters of water per kg of resin
Gallons of water per 1000 lb of resin
CUT-OFF
OPEN LOOP
3.22
386
Liters of water per kg of resin
1.61
Gallons of water per 1000 lb of resin
193

Chapter 3. Results
APR\KC18271112.19.18 4037.00.001
29
Figure 3-3. Water Consumption Results for Recycled and Virgin Resins(liters water/kg resin)
3.3.3. Solid Waste Results
Solid waste includes sludges and residues from chemical reactions and material processingsteps, wastes associated with production and combustion of fuels (e.g., refinery wastes, coalcombustion ash from power generation), and waste materials removed from collectedpostconsumer material.
Total solid waste results for recycled and virgin resins are shown in Table 3-3 and Figure 3-4.The results include the weight of contaminants in the material received by MRFs andreclaimers. The contaminants are separated from the received material during sorting andseparation processes. The contaminant wastes make large contributions to the total solid wastesfor recycled resins, as shown in Figure 3-4.
Although the contaminant wastes are removed and disposed at reclaimer facilities, these wastesare not caused by reclaimer operations. Reclaimers recover all saleable materials from theincoming material, including materials other than the desired resin. Therefore, the majority ofthe solid waste disposed from the sorting and processing operations is material that would havebeen disposed as waste regardless of whether postconsumer plastic recycling takes place. Ifincoming contaminant wastes are excluded, the process solid wastes for recycled resins dropdramatically, as can be seen by comparing Figure 3-5 with Figure 3-4.
With incoming contaminant wastes excluded, total solid waste results for food-grade rPETpellet are 42 percent of virgin PET resin burdens when the cut-off recycling method is used,and 71 percent of virgin resin solid waste using the open-loop recycling allocation method.Recycled HDPE solid wastes are essentially the same as virgin HDPE solid wastes for bothrecycling methodologies. Recycled PP pellets result in 77 percent as much solid waste as virginresin using the cut-off recycling method, and 88 percent as much waste as virgin for the open-loop recycling method.

Chapter 3. Results
APR\KC18271112.19.18 4037.00.001
30
Table 3-3. Solid Waste Results for Recycled Resin Compared to Virgin, With and Without Incoming Contaminants
PC ResinCollection& Sorting
PC ResinTransport
toReclaimer
ProcessWater &
Chemicals
ProcessEnergy,Bale toFlake
ProcessEnergy,Flake toPellet*
ProcessEmissions& Wastes
RecycledResin Pellet
Total w/IncomingContam**
VirginPellet
RecycledTotal
Comparedto Virgin
RecycledTotal w/oIncomingContam
Recycled %of Virgin
Recycled PET 0.15 8.3E-04 4.4E-04 0.020 0.022 0.19 0.39 0.14 2.8 0.058 42%Recycled HDPE 0.24 8.9E-04 2.3E-04 0.015 0.025 0.22 0.50 0.070 7.1 0.071 101%Recycled PP 0.27 0.0010 1.9E-04 0.20 0.50 0.078 6.4 0.060 77%
Recycled PET 155 0.83 0.44 20.1 22.5 190 388 136 2.8 57.7 42%Recycled HDPE 236 0.89 0.23 15.0 25.3 219 496 70.2 7.1 70.6 101%Recycled PP 269 1.01 0.19 197 498 77.9 6.4 59.6 77%
Recycled PET 0.077 4.2E-04 2.2E-04 0.010 0.011 0.095 0.26 0.14 1.9 0.097 71%Recycled HDPE 0.12 4.4E-04 1.2E-04 0.0075 0.013 0.11 0.28 0.070 4.0 0.070 100%Recycled PP 0.13 5.0E-04 9.3E-05 0.099 0.29 0.078 3.7 0.069 88%
Recycled PET 77 0.42 0.22 10.0 11.2 94.8 262 136 1.9 97.0 71%Recycled HDPE 118 0.44 0.12 7.49 12.6 109 283 70.2 4.0 70.4 100%Recycled PP 134 0.50 0.093 98.7 288 77.9 3.7 68.8 88%
*For PP, only combined results for bale to pellet are shown in order to protect confidential data from participating reclaimers.**In Open-loop results, recycled resin total includes allocated share of virgin resin impacts.
Kg solid waste per kg of resin
Pounds of solid waste per 1000 lb of resin
Kg solid waste per kg of resin
Pounds of solid waste per 1000 lb of resin
CUT-OFF
OPEN LOOP
30.2
0.015
15.1
0.030

Chapter 3. Results
APR\KC18271112.19.18 4037.00.001
31
Figure 3-4. Solid Waste Results for Recycled and Virgin Resins, IncludingContaminants in Incoming Material
(kg waste/kg resin)
Figure 3-5. Solid Waste Results for Recycled and Virgin Resins, ExcludingContaminants in Incoming Material
(kg waste/kg resin)
3.4. LIFE CYCLE IMPACT ASSESSMENT RESULTS
Atmospheric and waterborne emissions for each system include emissions from processesas well as emissions associated with the combustion of fuels. Process emissions refers toemissions released directly from the processes that are used to extract, transform, convert,or otherwise effect changes on a material during its life cycle, while fuel-related emissionsare those associated with the combustion of fuels used for process energy andtransportation energy.

Chapter 3. Results
APR\KC18271112.19.18 4037.00.001
32
In the LCIA phase, the inventory of process and fuel-related emissions is classified intocategories in which the emissions may contribute to impacts on human health or theenvironment. Within each impact category, the emissions are then normalized to a commonreporting basis, using characterization factors that express the impact of each substancerelative to a reference substance. The following sections present results for the LCIAresults categories analyzed.
3.4.1. Global Warming Potential (GWP) Results
Life cycle global warming potential results include the impacts of process emissions (e.g.,fugitive or direct emissions from chemical reactions or converting operations), emissionsfrom the extraction, processing, and combustion of fuels used for process andtransportation energy, and emissions from extraction and processing of fossil fuels used asmaterial feedstocks.
Global warming potential results for recycled and virgin resins are shown in Table 3-4 andFigure 3-6. For the cut-off recycling methodology, results for recycled PET are 33 percentof virgin PET GWP, and recycled HDPE and PP results are 29 percent of virgin. Open-loop results for all three recycled resins are 64-66 percent of the corresponding virginresins. Reclaimer energy use (for converting incoming material to clean flake andconverting flake to pellet) account for the majority of GWP impacts for recycled resinproduction steps.

Chapter 3. Results
APR\KC18271112.19.18 4037.00.001
33
Table 3-4. Global Warming Potential Results for Recycled Resin Compared to Virgin
PC ResinCollection& Sorting
PC ResinTransport
toReclaimer
ProcessWater &
Chemicals
ProcessEnergy,Bale toFlake
ProcessEnergy,Flake toPellet*
ProcessEmissions& Wastes
RecycledResin Pellet
Total**VirginPellet
Recycled %of Virgin
RecycledResin %
Reductionfrom Virgin
Recycled PET 0.082 0.060 0.0088 0.40 0.36 0 0.91 2.78 33% 67%Recycled HDPE 0.10 0.064 0.0064 0.16 0.22 0 0.56 1.89 29% 71%Recycled PP 0.11 0.073 0.0054 0 0.53 1.84 29% 71%
Recycled PET 37.0 27.4 4.00 181 165 0 415 1,262 33% 67%Recycled HDPE 47.4 29.2 2.91 72.1 100 0 252 857 29% 71%Recycled PP 51.3 33.1 2.45 0 239 835 29% 71%
Recycled PET 0.041 0.030 0.0044 0.20 0.18 0 1.85 2.78 66% 34%Recycled HDPE 0.052 0.032 0.0032 0.079 0.11 0 1.22 1.89 65% 35%Recycled PP 0.057 0.036 0.0027 0 1.18 1.84 64% 36%
Recycled PET 18.5 13.7 2.00 90.5 82.7 0 838 1,262 66% 34%Recycled HDPE 23.7 14.6 1.46 36.0 50.2 0 554 857 65% 35%Recycled PP 25.6 16.5 1.22 0 537 835 64% 36%
*For PP, only combined results for bale to pellet are shown in order to protect confidential data from participating reclaimers.**In Open-loop results, recycled resin total includes allocated share of virgin resin impacts.
kg CO2 eq per kg of resin
kg CO2 eq per 1000 lb of resin
152
OPEN LOOP
kg CO2 eq per kg of resin
0.33
0.17
kg CO2 eq per 1000 lb of resin
75.9
CUT-OFF

Chapter 3. Results
APR\KC18271112.19.18 4037.00.001
34
Figure 3-6. Global Warming Potential Results for Recycled and Virgin Resins(kg CO2 eq/kg resin)
3.4.2. Acidification Potential Results
Acidification assesses the potential of emissions to contribute to the formation and depositof acid rain on soil and water, which can cause serious harm to plant and animal life as wellas damage to infrastructure. Acidification potential modeling in TRACI incorporates theresults of an atmospheric chemistry and transport model, developed by the U.S. NationalAcid Precipitation Assessment Program (NAPAP), to estimate total North Americanterrestrial deposition due to atmospheric emissions of NOx and SO2, as a function of theemissions location.7,8
Acidification impacts are typically dominated by fossil fuel combustion emissions,particularly sulfur dioxide (SO2) and nitrogen oxides (NOx). Emissions from combustionof fossil fuels, especially coal, to generate grid electricity are a significant contributor toacidification impacts.
Acidification potential results for recycled and virgin resins are shown in Table 3-4 andFigure 3-7. Results for food-grade rPET pellet are 30 percent of virgin PET resin burdenswhen the cut-off recycling method is used and 65 percent of virgin resin acidification usingthe open-loop recycling allocation method. For recycled HDPE, cut-off results are 53percent of virgin results and 77 percent of virgin for open-loop. Recycled PP results are 42percent of virgin using the cut-off recycling method and 71 percent of virgin for the open-loop recycling method.
7 Bare J.C., Norris G.A., Pennington D.W., McKone T. (2003). TRACI: The Tool for the Reduction andAssessment of Chemical and Other Environmental Impacts, Journal of Industrial Ecology, 6(3–4): 49–78. Available at URL: http://mitpress.mit.edu/journals/pdf/jiec_6_3_49_0.pdf.
8 Bare J.C. (2002). Developing a consistent decision-making framework by using the US EPA’s TRACI,AICHE. Available at URL: http://www.epa.gov/nrmrl/std/sab/traci/aiche2002paper.pdf.

Chapter 3. Results
APR\KC18271112.19.18 4037.00.001
35
Table 3-5. Acidification Potential Results for Recycled Resin Compared to Virgin
PC ResinCollection& Sorting
PC ResinTransport
toReclaimer
ProcessWater &
Chemicals
ProcessEnergy,Bale toFlake
ProcessEnergy,Flake toPellet*
ProcessEmissions& Wastes
RecycledResin Pellet
Total**VirginPellet
Recycled %of Virgin
RecycledResin %
Reductionfrom Virgin
Recycled PET 2.7E-04 2.5E-04 5.0E-05 0.0013 0.0014 0 0.0032 0.011 30% 70%Recycled HDPE 3.5E-04 3.4E-04 2.0E-05 8.3E-04 0.0014 0 0.0029 0.0055 53% 47%Recycled PP 3.8E-04 3.7E-04 1.5E-05 0 0.0025 0.0059 42% 58%
Recycled PET 0.12 0.11 0.023 0.58 0.62 0 1.46 4.80 30% 70%Recycled HDPE 0.16 0.16 0.0092 0.38 0.62 0 1.32 2.48 53% 47%Recycled PP 0.17 0.17 0.0066 0 1.12 2.67 42% 58%
Recycled PET 1.4E-04 1.2E-04 2.5E-05 6.4E-04 6.8E-04 0 0.0069 0.011 65% 35%Recycled HDPE 1.7E-04 1.7E-04 1.0E-05 4.2E-04 6.8E-04 0 0.0042 0.0055 77% 23%Recycled PP 1.9E-04 1.8E-04 7.3E-06 0 0.0042 0.0059 71% 29%
Recycled PET 0.062 0.056 0.011 0.29 0.31 0 3.13 4.80 65% 35%Recycled HDPE 0.079 0.078 0.0046 0.19 0.31 0 1.90 2.48 77% 23%Recycled PP 0.086 0.083 0.0033 0 1.89 2.67 71% 29%
*For PP, only combined results for bale to pellet are shown in order to protect confidential data from participating reclaimers.**In Open-loop results, recycled resin total includes allocated share of virgin resin impacts.
kg SO2 eq per kg of resin
kg SO2 eq per 1000 lb of resin
0.78
0.0017
OPEN LOOP
kg SO2 eq per kg of resin
8.6E-04
kg SO2 eq per 1000 lb of resin
0.39
CUT-OFF

Chapter 3. Results
APR\KC18271112.19.18 4037.00.001
36
Figure 3-7. Acidification Potential Results for Recycled and Virgin Resins(kg SO2 eq/kg resin)
3.4.3. Eutrophication Potential Results
Eutrophication occurs when excess nutrients are introduced to surface water causing therapid growth of aquatic plants. This growth (generally referred to as an “algal bloom”)reduces the amount of dissolved oxygen in the water, thus decreasing oxygen available forother aquatic species. The TRACI characterization factors for eutrophication are theproduct of a nutrient factor and a transport factor.9 The nutrient factor is based on theamount of plant growth caused by each pollutant, while the transport factor accounts forthe probability that the pollutant will reach a body of water. Atmospheric emissions ofnitrogen oxides (NOx) as well as waterborne emissions of nitrogen, phosphorus, ammonia,biochemical oxygen demand (BOD), and chemical oxygen demand (COD) are typicallythe main contributors to eutrophication impacts.
Eutrophication potential results for recycled and virgin resins are shown in Table 3-6 andFigure 3-8. Process emissions in wastewater are the largest contribution to eutrophicationresults for recycled PET and HDPE, while PP reclaimers reported low wastewateremissions.
Eutrophication results for recycled PET and PP pellet are 54-57 percent of correspondingvirgin resin burdens when the cut-off recycling methodology is used, and 77-79 percent ofvirgin resin eutrophication using the open-loop recycling allocation methodology.Eutrophication results for recycled HDPE for both recycling methodologies are essentiallythe same as virgin HDPE.
9 Bare J.C., Norris G.A., Pennington D.W., McKone T. (2003). TRACI: The Tool for the Reduction andAssessment of Chemical and Other Environmental Impacts, Journal of Industrial Ecology, 6(3–4): 49–78. Available at URL: http://mitpress.mit.edu/journals/pdf/jiec_6_3_49_0.pdf.

Chapter 3. Results
APR\KC18271112.19.18 4037.00.001
37
Table 3-6. Eutrophication Potential Results for Recycled Resin Compared to Virgin
PC ResinCollection& Sorting
PC ResinTransport
toReclaimer
ProcessWater &
Chemicals
ProcessEnergy,Bale toFlake
ProcessEnergy,Flake toPellet*
ProcessEmissions& Wastes
RecycledResin Pellet
Total**VirginPellet
Recycled %of Virgin
RecycledResin %
Reductionfrom Virgin
Recycled PET 1.2E-05 1.4E-05 1.5E-05 2.5E-05 2.6E-05 1.7E-04 2.6E-04 4.8E-04 54% 46%Recycled HDPE 1.5E-05 1.8E-05 1.8E-06 1.4E-05 2.2E-05 4.2E-05 1.1E-04 1.1E-04 102% -2%Recycled PP 1.7E-05 2.0E-05 7.8E-07 1.3E-05 8.0E-05 1.4E-04 57% 43%
Recycled PET 0.0053 0.0062 0.0068 0.011 0.012 0.077 0.12 0.22 54% 46%Recycled HDPE 0.0070 0.0084 8.2E-04 0.0064 0.010 0.019 0.052 0.051 102% -2%Recycled PP 0.0077 0.0092 3.6E-04 0.0059 0.036 0.064 57% 43%
Recycled PET 5.8E-06 6.8E-06 7.5E-06 1.3E-05 1.3E-05 8.5E-05 3.7E-04 4.8E-04 77% 23%Recycled HDPE 7.7E-06 9.2E-06 9.0E-07 7.1E-06 1.1E-05 2.1E-05 1.1E-04 1.1E-04 101% -1%Recycled PP 8.5E-06 1.0E-05 3.9E-07 6.5E-06 1.1E-04 1.4E-04 79% 21%
Recycled PET 0.0026 0.0031 0.0034 0.0057 0.0058 0.039 0.17 0.22 77% 23%Recycled HDPE 0.0035 0.0042 4.1E-04 0.0032 0.0050 0.0096 0.051 0.051 101% -1%Recycled PP 0.0039 0.0046 1.8E-04 0.0029 0.050 0.064 79% 21%
*For PP, only combined results for bale to pellet are shown in order to protect confidential data from participating reclaimers.**In Open-loop results, recycled resin total includes allocated share of virgin resin impacts.
kg N eq per kg of resin
0.013
kg N eq per 1000 lb of resin
2.9E-05
OPEN LOOP
kg N eq per kg of resin
CUT-OFF
1.5E-05
kg N eq per 1000 lb of resin
0.0066
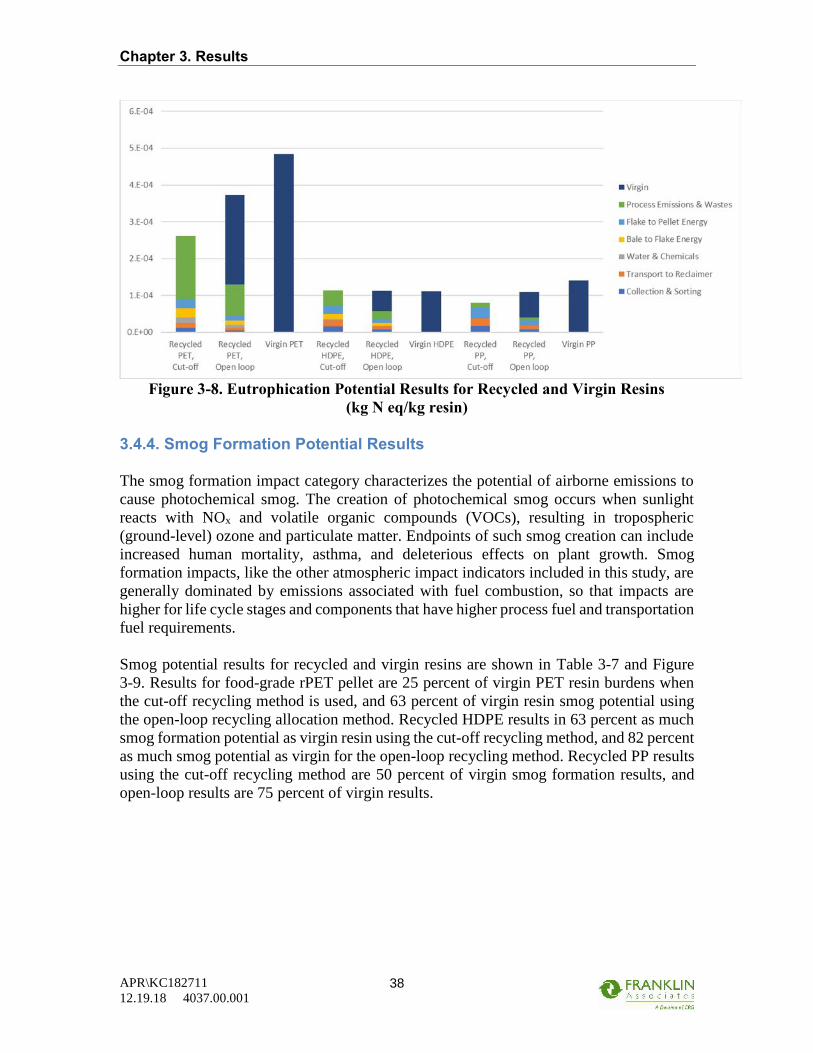
Chapter 3. Results
APR\KC18271112.19.18 4037.00.001
38
Figure 3-8. Eutrophication Potential Results for Recycled and Virgin Resins(kg N eq/kg resin)
3.4.4. Smog Formation Potential Results
The smog formation impact category characterizes the potential of airborne emissions tocause photochemical smog. The creation of photochemical smog occurs when sunlightreacts with NOx and volatile organic compounds (VOCs), resulting in tropospheric(ground-level) ozone and particulate matter. Endpoints of such smog creation can includeincreased human mortality, asthma, and deleterious effects on plant growth. Smogformation impacts, like the other atmospheric impact indicators included in this study, aregenerally dominated by emissions associated with fuel combustion, so that impacts arehigher for life cycle stages and components that have higher process fuel and transportationfuel requirements.
Smog potential results for recycled and virgin resins are shown in Table 3-7 and Figure3-9. Results for food-grade rPET pellet are 25 percent of virgin PET resin burdens whenthe cut-off recycling method is used, and 63 percent of virgin resin smog potential usingthe open-loop recycling allocation method. Recycled HDPE results in 63 percent as muchsmog formation potential as virgin resin using the cut-off recycling method, and 82 percentas much smog potential as virgin for the open-loop recycling method. Recycled PP resultsusing the cut-off recycling method are 50 percent of virgin smog formation results, andopen-loop results are 75 percent of virgin results.

Chapter 3. Results
APR\KC18271112.19.18 4037.00.001
39
Table 3-7. Smog Potential Results for Recycled Resin Compared to Virgin
PC ResinCollection& Sorting
PC ResinTransport
toReclaimer
ProcessWater &
Chemicals
ProcessEnergy,Bale toFlake
ProcessEnergy,Flake toPellet*
ProcessEmissions& Wastes
RecycledResin Pellet
Total**VirginPellet
Recycled %of Virgin
RecycledResin %
Reductionfrom Virgin
Recycled PET 0.0063 0.0074 4.8E-04 0.014 0.014 0 0.043 0.17 25% 75%Recycled HDPE 0.0083 0.010 3.1E-04 0.0079 0.012 0 0.039 0.062 63% 37%Recycled PP 0.0092 0.011 2.5E-04 0 0.037 0.073 50% 50%
Recycled PET 2.86 3.37 0.22 6.37 6.50 0 19.3 76.6 25% 75%Recycled HDPE 3.78 4.61 0.14 3.60 5.56 0 17.7 28.0 63% 37%Recycled PP 4.19 5.03 0.11 0 16.8 33.3 50% 50%
Recycled PET 0.0031 0.0037 2.4E-04 0.0070 0.0072 0 0.11 0.17 63% 37%Recycled HDPE 0.0042 0.0051 1.5E-04 0.0040 0.0061 0 0.050 0.062 82% 18%Recycled PP 0.0046 0.0055 1.3E-04 0 0.055 0.073 75% 25%
Recycled PET 1.43 1.68 0.11 3.19 3.25 0 47.9 76.6 63% 37%Recycled HDPE 1.89 2.30 0.070 1.80 2.78 0 22.8 28.0 82% 18%Recycled PP 2.09 2.52 0.057 0 25.0 33.3 75% 25%
*For PP, only combined results for bale to pellet are shown in order to protect confidential data from participating reclaimers.**In Open-loop results, recycled resin total includes allocated share of virgin resin impacts.
7.42
kg O3 eq per kg of resin
kg O3 eq per 1000 lb of resin
0.016
0.0082
kg O3 eq per 1000 lb of resin
3.71
CUT-OFF
OPEN LOOP
kg O3 eq per kg of resin

Chapter 3. Results
APR\KC18271112.19.18 4037.00.001
40
Figure 3-9. Smog Potential Results for Recycled and Virgin Resins(kg O3 eq/kg resin)
3.5. EQUIVALENCIES
In the preceding sections, the results for recycled resin compared to virgin resin areexpressed on the basis of 1 kg and 1,000 pounds. To provide a better sense of the magnitudeof savings achieved by recycling plastics on a national level, the 1,000 pound savings foreach resin were scaled up to the amount of PET, HDPE, and PP packaging recovered fromthe US municipal solid waste supply in 2015.10 The total amounts of recovered plasticpackaging (excluding film) were 940,000 short tons of PET packaging, 580,000 short tonsof HDPE packaging, and 70,000 short tons of PP packaging.
The savings for US packaging recycling can be visualized using equivalency factors. Theequivalency factors used are listed below. Table 3-8 shows the recycled resin savings for2015 US recovered plastic packaging expressed as equivalencies.
The total energy savings for recycled resins compared to virgin is expressed asequivalent number of US households’ annual electricity use, using informationfrom the US EPA Greenhouse Gas Equivalencies Calculator.11 Average electricityuse per household is reported as 12,148 kWh year. Multiplied by 3,412 Btu/kWh,the average electricity use per household is equivalent to 41.45 million Btu. For thetotal amount of US PET, HDPE, and PP packaging recovered in 2015, Table 3-8shows that total energy savings using cut-off recycling methodology are 81.5
10 Advancing Sustainable Materials Management: 2015 Tables and Figures. Assessing Trends in MaterialGeneration, Recycling, Composting, Combustion with Energy Recovery and Landfilling in the UnitedStates. July 2018. Recovery of PET, HDPE, and PP packaging shown in Table 8. Accessed athttps://www.epa.gov/sites/production/files/2018-07/documents/smm_2015_tables_and_figures_07252018_fnl_508_0.pdf
11 Home Electricity Use section of https://www.epa.gov/energy/greenhouse-gases-equivalencies-calculator-calculations-and-references

Chapter 3. Results
APR\KC18271112.19.18 4037.00.001
41
trillion Btu, equivalent to almost 2 million households’ annual electricity use, andthe savings using open-loop recycling methodology total 40.8 trillion Btu,equivalent to 983 million households’ electricity use.
Savings in water consumption for recycled resins compared to virgin can bevisualized as the equivalent number of Olympic swimming pools holding 2,500,000liters of water.12 For the total amount of PET, HDPE, and PP packaging recoveredin the US in 2015, water consumption savings using cut-off recycling methodologyare 652 million liters, equivalent to 261 Olympic pools, and the savings using open-loop recycling methodology are 326 million liters, equivalent to 130 pools.
Solid waste savings are expressed as the equivalent number of 747 airplanes withan empty weight of 402,300 pounds.13 For the total 2015 recovery of US PET,HDPE, and PP packaging, solid waste savings (excluding incoming contaminantwastes) using cut-off recycling methodology are almost 150 million pounds,equivalent to 372 747 airplanes, and the savings using open-loop recyclingmethodology are 74.9 million pounds, equivalent to the weight of 186 747s.
The GWP savings can be visualized as the emissions from the equivalent numberof personal vehicles driven per year, using factors from the US EPA GreenhouseGas Equivalencies Calculator.14 For the total amount of US packaging recovered in2015, recycled resin GHG savings using the cut-off method are 2.4 million metrictons CO2 eq, which is equivalent to the GHG emissions saved by taking over500,000 passenger vehicles off the road for a year. For open-loop recycled resinresults compared to virgin, the total GHG savings are 1.2 million metric tons CO2
eq, equivalent to the GHG emissions saved by taking 254,000 passenger vehiclesoff the road for a year.
12 Olympic pool dimensions 50 meters long x 25 meters wide x 2 meters deep.http://www.dimensionsinfo.com/olympic-pool-size-dimensions/
13 Empty weight of 747-400 is 402,300 pounds perhttp://www.boeing.com/resources/boeingdotcom/company/about_bca/startup/pdf/historical/747-400-passenger.pdf
14 Emissions calculated as 4.67 tons CO2 eq/vehicle/year in Passenger Vehicles per Year section ofhttps://www.epa.gov/energy/greenhouse-gases-equivalencies-calculator-calculations-and-references

Chapter 3. Results
APR\KC18271112.19.18 4037.00.001
42
Table 3-8. Recycled Resin Savings for 2015 US Recovered Packaging Volume
Total EnergyWater
Consumption
Solid Waste(excluding
contaminants)Global Warming
Potential
EPA 2015 PlasticPackagingRecovery*
million Btu liters lb kg CO2 eq thou lb
Recycled PET 23.6 -50.4 78.5 847 1,880,000Recycled HDPE 28.6 587 -0.39 605 1,160,000Recycled PP 28.2 471 18.3 596 140,000
Recycled PET 11.8 -25.2 39.3 423 1,880,000Recycled HDPE 14.3 293 -0.19 302 1,160,000Recycled PP 14.1 235 9.15 298 140,000
Recycled PET 4.44E+07 -9.47E+07 1.48E+08 1.59E+09Recycled HDPE 3.32E+07 6.81E+08 -4.52E+05 7.01E+08Recycled PP 3.94E+06 6.59E+07 2.56E+06 8.34E+07Total 8.15E+07 6.52E+08 1.50E+08 2.38E+09
Recycled PET 2.22E+07 -4.74E+07 7.38E+07 7.96E+08Recycled HDPE 1.66E+07 3.40E+08 -2.26E+05 3.51E+08Recycled PP 1.97E+06 3.29E+07 1.28E+06 4.17E+07Total 4.08E+07 3.26E+08 7.49E+07 1.19E+09
Electricity Useper Home per
YearOlympic
Swimming Pool 747 AirplanePersonal VehicleDriven per Year
million Btu liters lb kg CO2 eq41.45 2,500,000 402,300 4,675
ThousandHouseholds'
AnnualElectricity Use Olympic Pools 747 Airplanes
ThousandVehicles
Driven perYear
Recycled PET 1,071 -38 367 341Recycled HDPE 801 272 -1.1 150Recycled PP 95 26 6.4 18Total 1,967 261 372 508
Recycled PET 536 -19 184 170Recycled HDPE 401 136 -0.6 75Recycled PP 48 13 3.2 9Total 984 130 186 254
Open-loop Savings
Open-loop Savings/1,000 lb Recycled Resin Compared to Virgin
Cut-off Savings/1,000 lb Recycled Resin Compared to Virgin
*Converted from thousands of short tons in EPA 2015 Sustainable Materials Report, Table 8. Includes recoveredbottles and jars, rigid packaging, and other packaging; excludes film packaging.
Equivalencies
Scaled to US 2015 Recovered Plastic PackagingCut-off Savings
Open-loop Savings
Cut-off Savings

Chapter 3. Results
APR\KC18271112.19.18 4037.00.001
43
3.6. CONCLUSIONS
This analysis shows that recycled resins have lower environmental impacts thancorresponding virgin resins across the range of results categories analyzed, with fewexceptions. Savings are summarized in Table 3-9, with two columns shown for each resin.The first column shows recycled resin results as a percentage of corresponding virgin resinresults. The second column in each pair shows the percent reduction in results for recycledresin compared to virgin resin.
Table 3-9. Savings for Recycled Resins Compared to Virgin Resins
The table shows that savings for recycled resins are greatest when using the cut-offrecycling methodology. For open-loop methodology, the addition of an allocated share ofvirgin resin burdens increases the results for recycled resins. As a result, open-loop savingscompared to virgin resin are lower.
Recycled % ofVirgin
Recycled Resin% Reductionfrom Virgin
Recycled % ofVirgin
Recycled Resin% Reductionfrom Virgin
Recycled % ofVirgin
Recycled Resin% Reductionfrom Virgin
CUT-OFFTotal Energy 21% 79% 12% 88% 12% 88%Water Consumption 104% -4% 41% 59% 54% 46%Solid Waste* 42% 58% 101% -1% 77% 23%Global Warming 33% 67% 29% 71% 29% 71%Acidification 30% 70% 53% 47% 42% 58%Eutrophication 54% 46% 102% -2% 57% 43%Smog 25% 75% 63% 37% 50% 50%OPEN LOOPTotal Energy 61% 39% 56% 44% 56% 44%Water Consumption 102% -2% 71% 29% 77% 23%Solid Waste* 71% 29% 100% 0% 88% 12%Global Warming 66% 34% 65% 35% 64% 36%Acidification 65% 35% 77% 23% 71% 29%Eutrophication 77% 23% 101% -1% 79% 21%Smog 63% 37% 82% 18% 75% 25%
Recycled PET Recycled HDPE Recycled PP
*Solid waste excluding contaminants removed from incoming material. These contaminants are not caused by recycling andwould have been disposed as waste regardless of whether postconsumer plastic recycling takes place.