Embed Size (px)
Citation preview
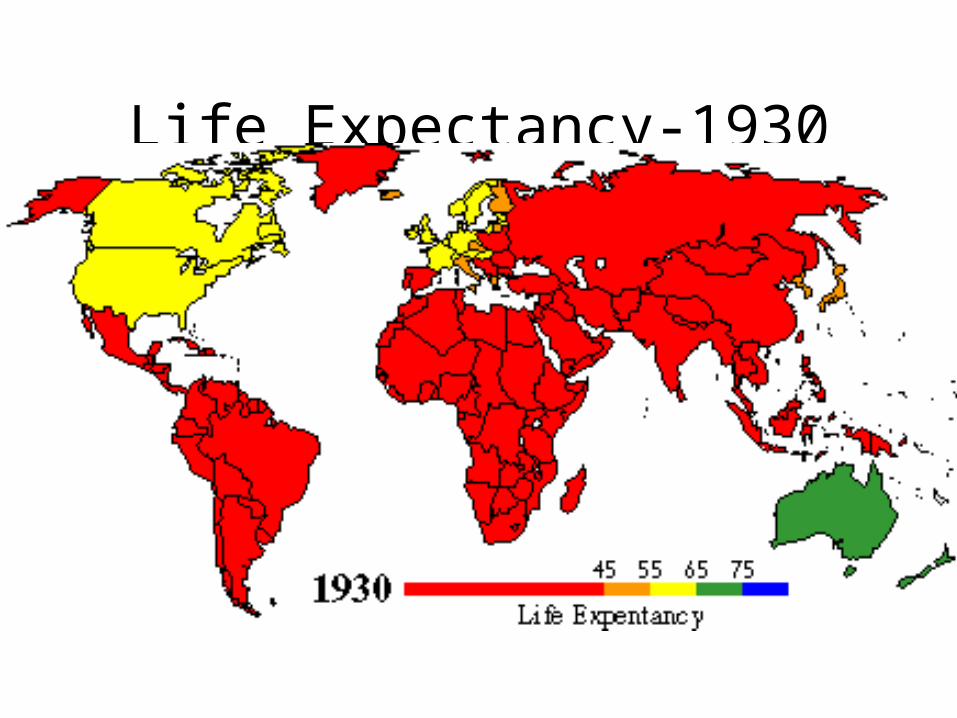
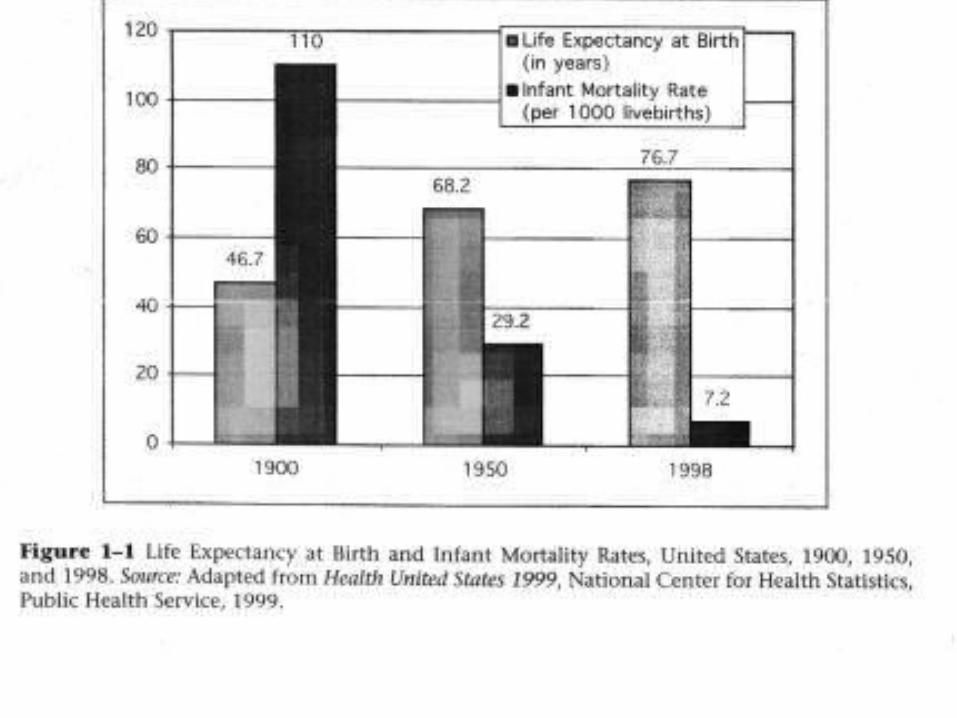
Life Expectancy-1930
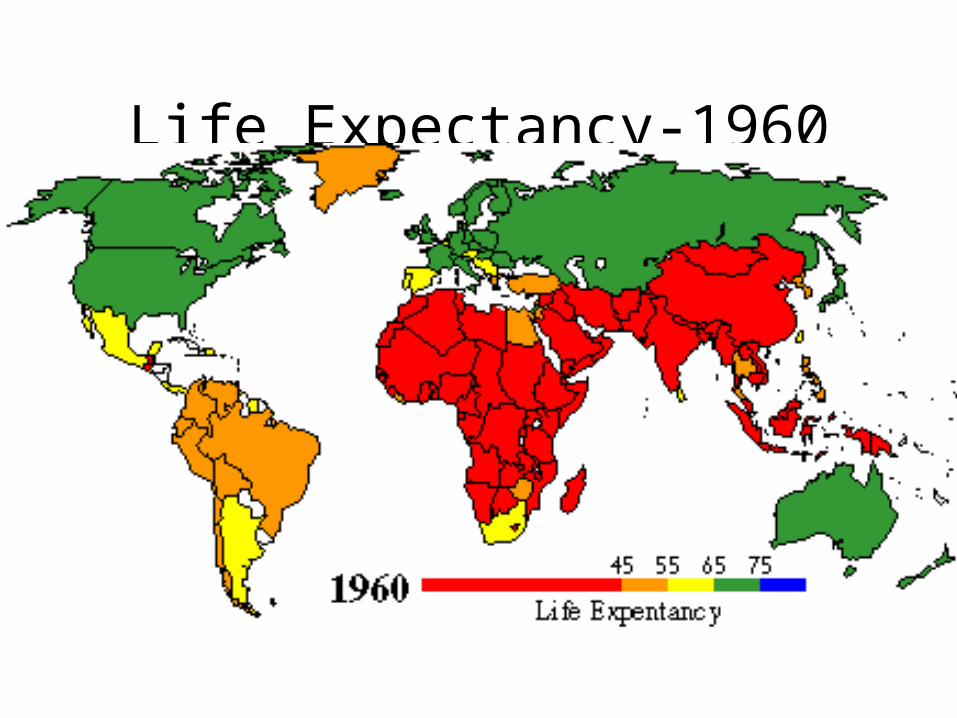
Life Expectancy-1960
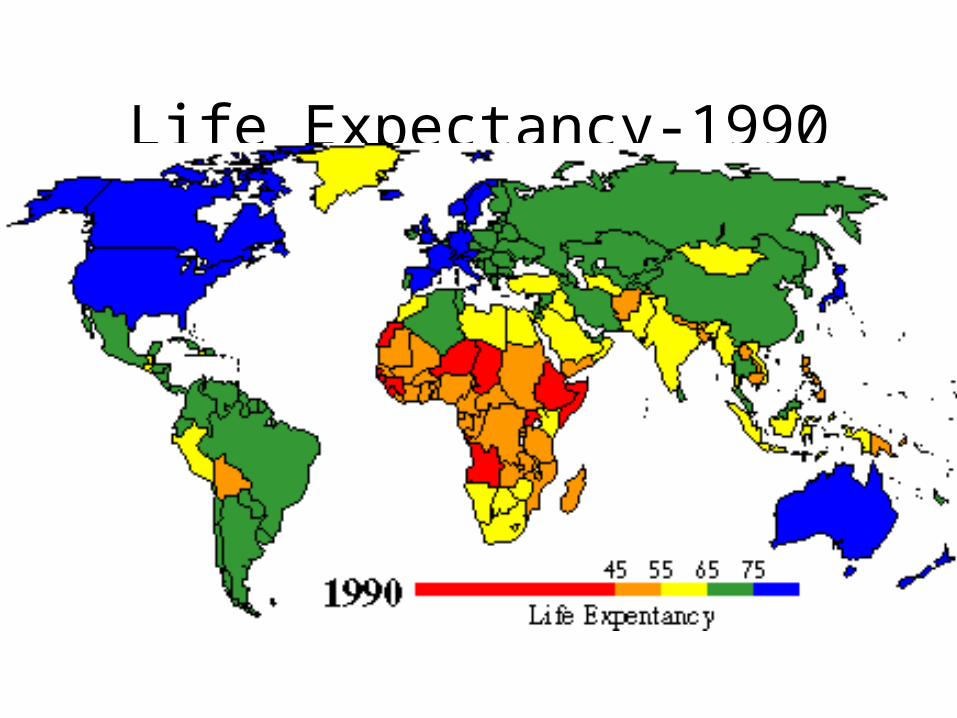
Life Expectancy-1990
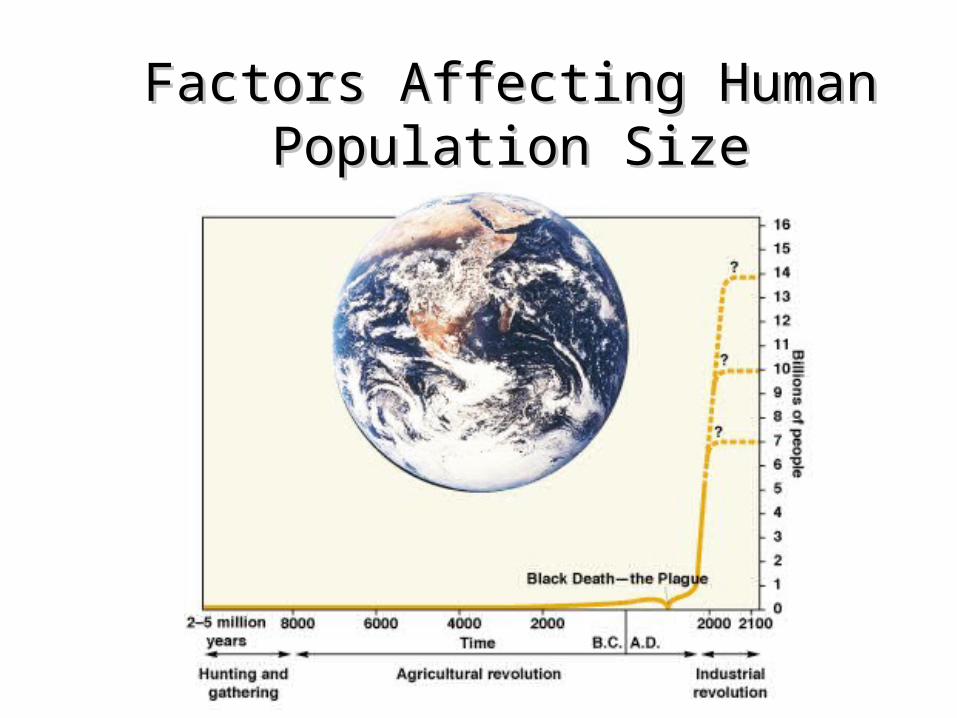
Factors Affecting Human Factors Affecting Human Population SizePopulation Size
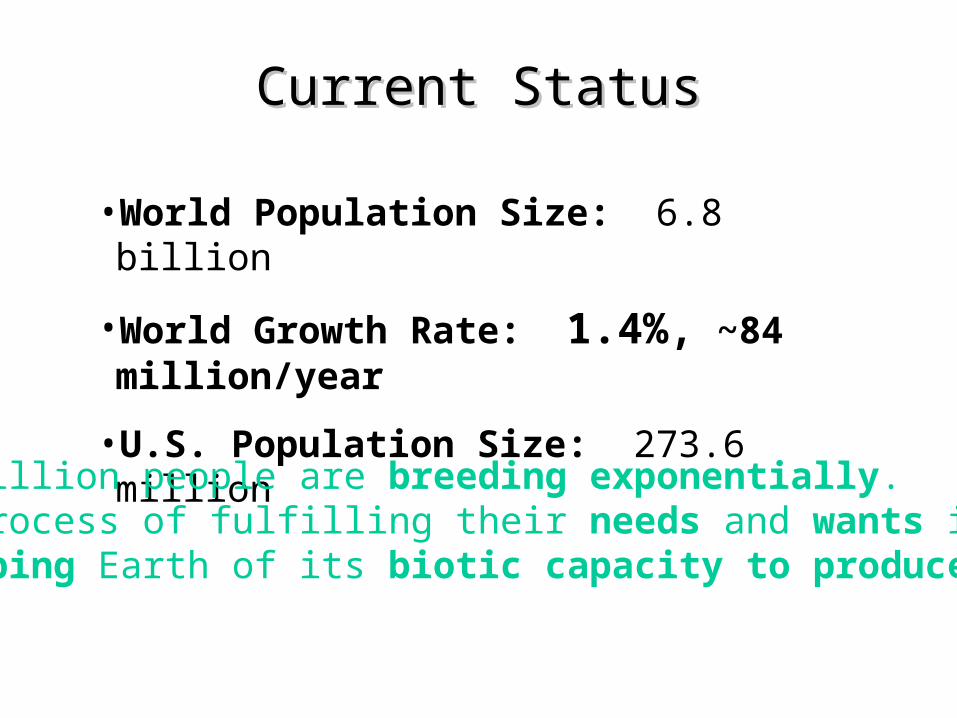
Current StatusCurrent Status
• World Population Size: 6.8 billion
• World Growth Rate: 1.4%, ~84 million/year
• U.S. Population Size: 273.6 million
6.1 billion people are breeding exponentially. The process of fulfilling their needs and wants is stripping Earth of its biotic capacity to produce life.
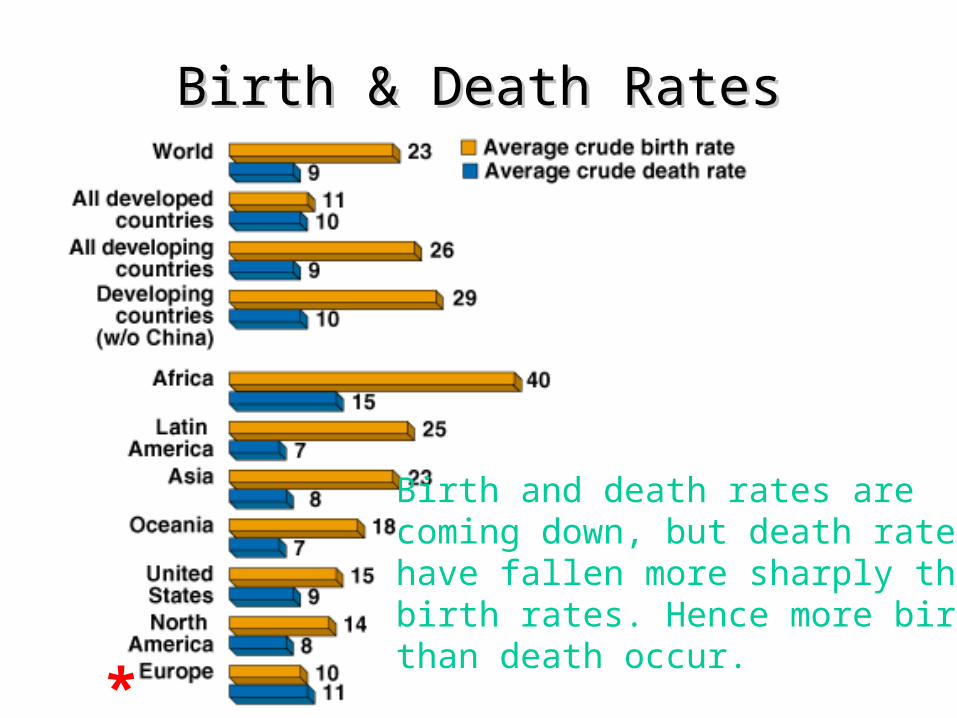
Birth & Death RatesBirth & Death Rates
Birth and death rates arecoming down, but death rateshave fallen more sharply thanbirth rates. Hence more birththan death occur.
*
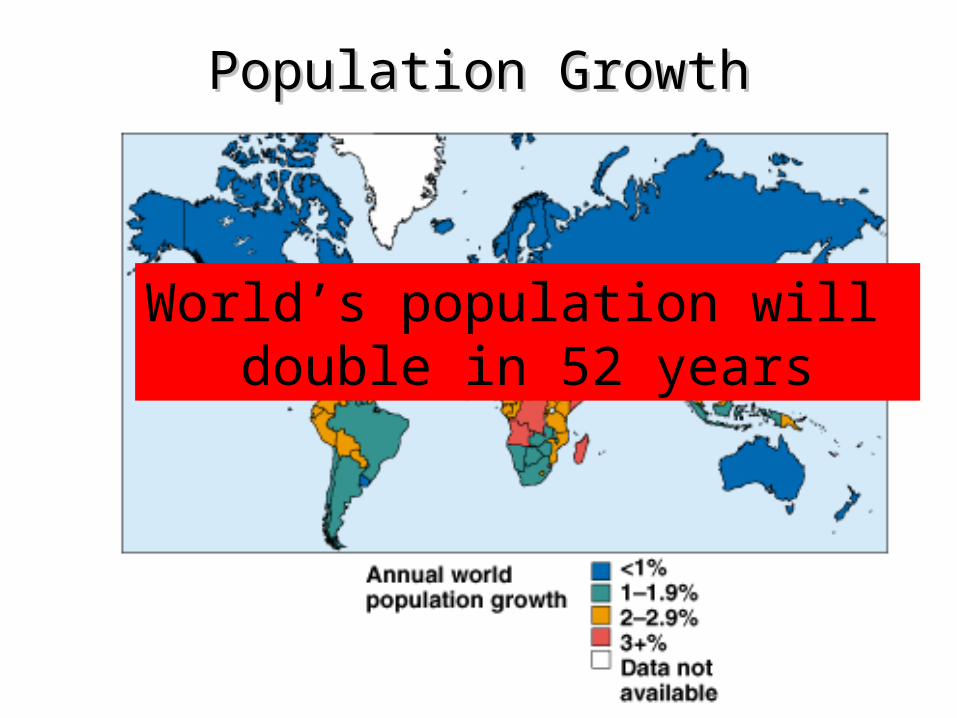
Population GrowthPopulation Growth
World’s population will double in 52 years
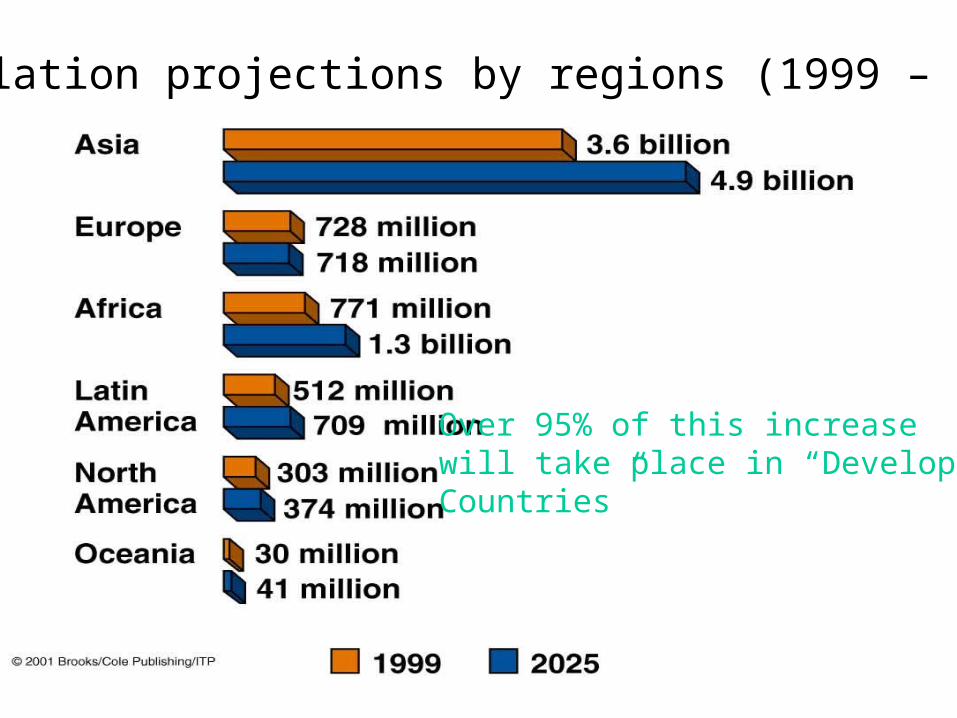
Population projections by regions (1999 – 2025)
Over 95% of this increasewill take place in “DevelopingCountries”
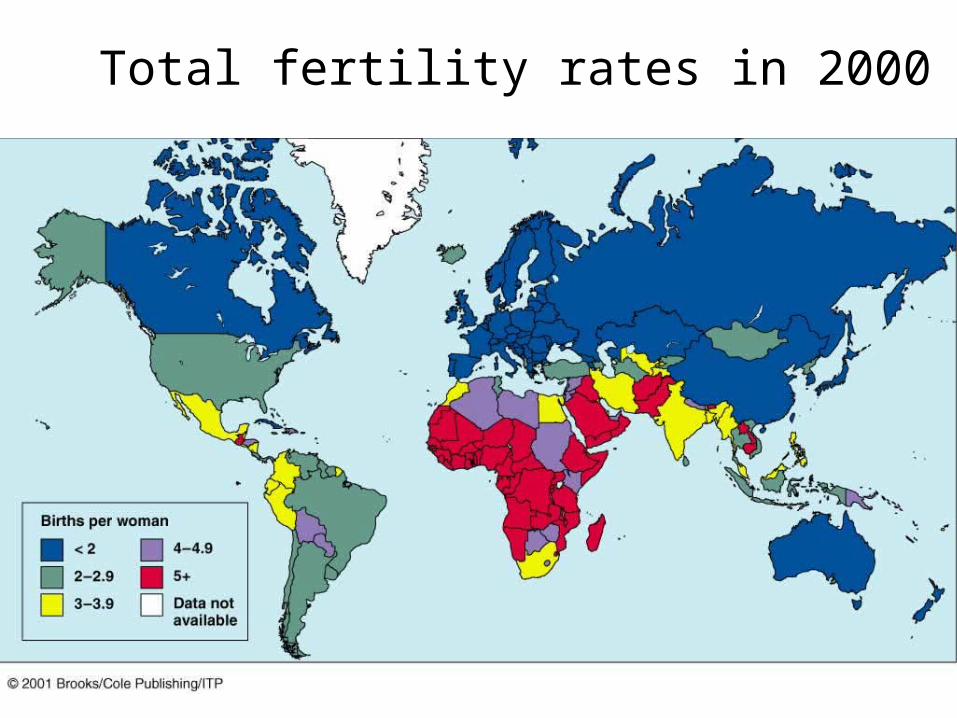
Total fertility rates in 2000
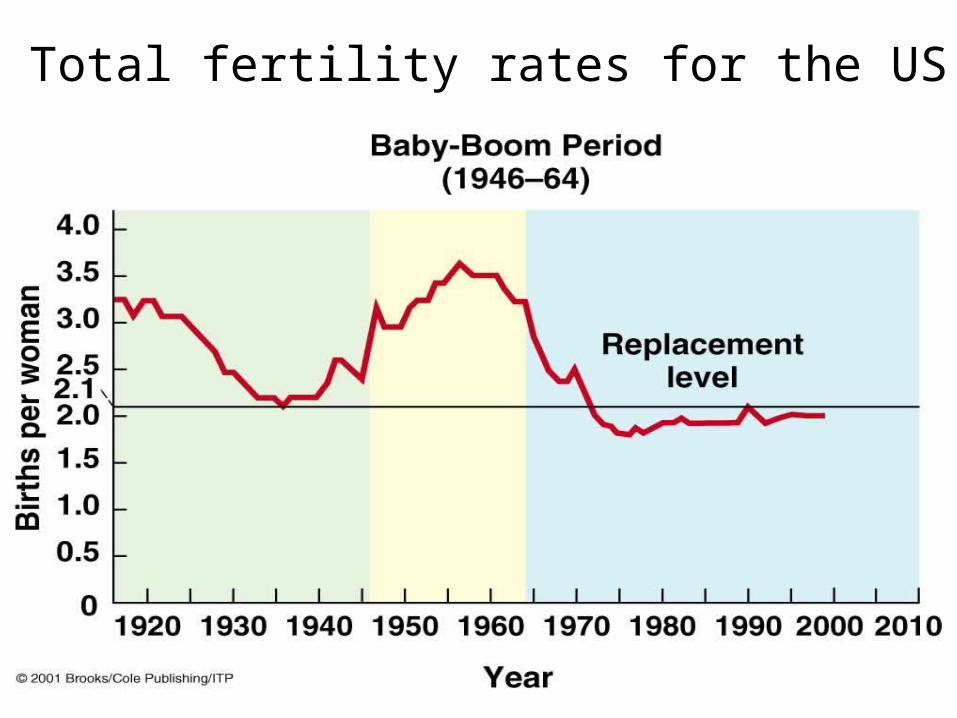
Total fertility rates for the US
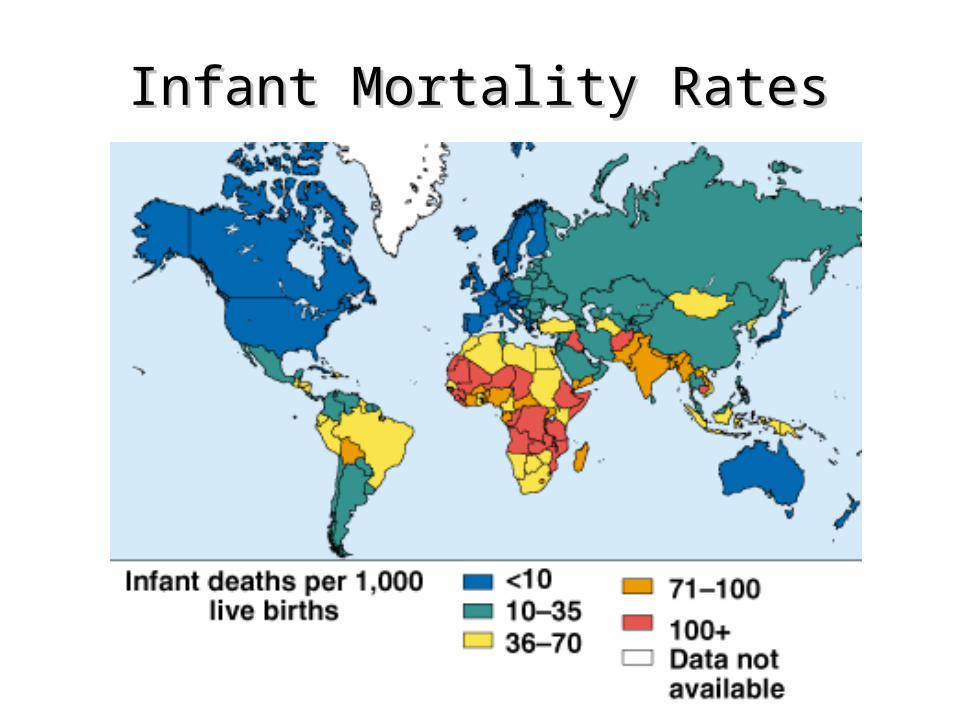
Infant Mortality RatesInfant Mortality Rates
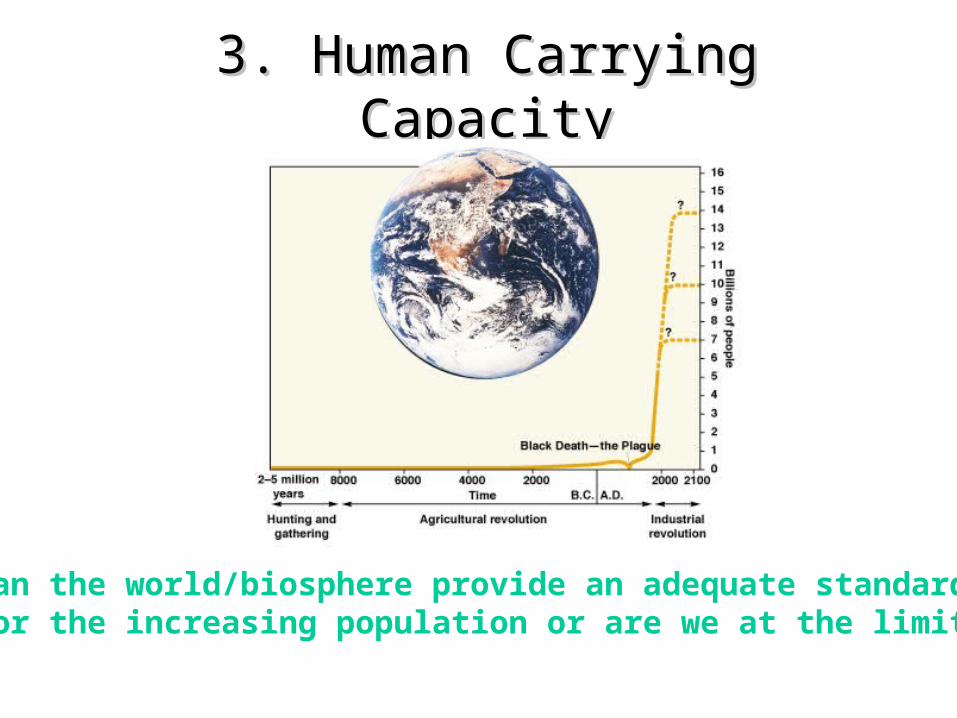
3. Human Carrying Capacity3. Human Carrying Capacity
Can the world/biosphere provide an adequate standard for the increasing population or are we at the limit?
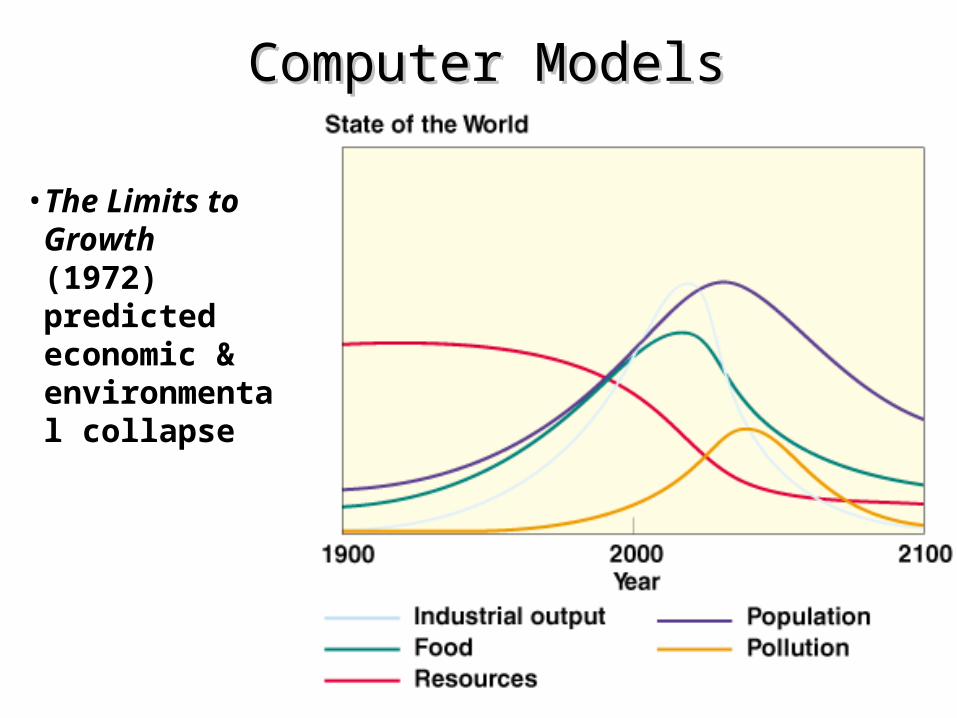
• The Limits to Growth (1972) predicted economic & environmental collapse
Computer ModelsComputer Models
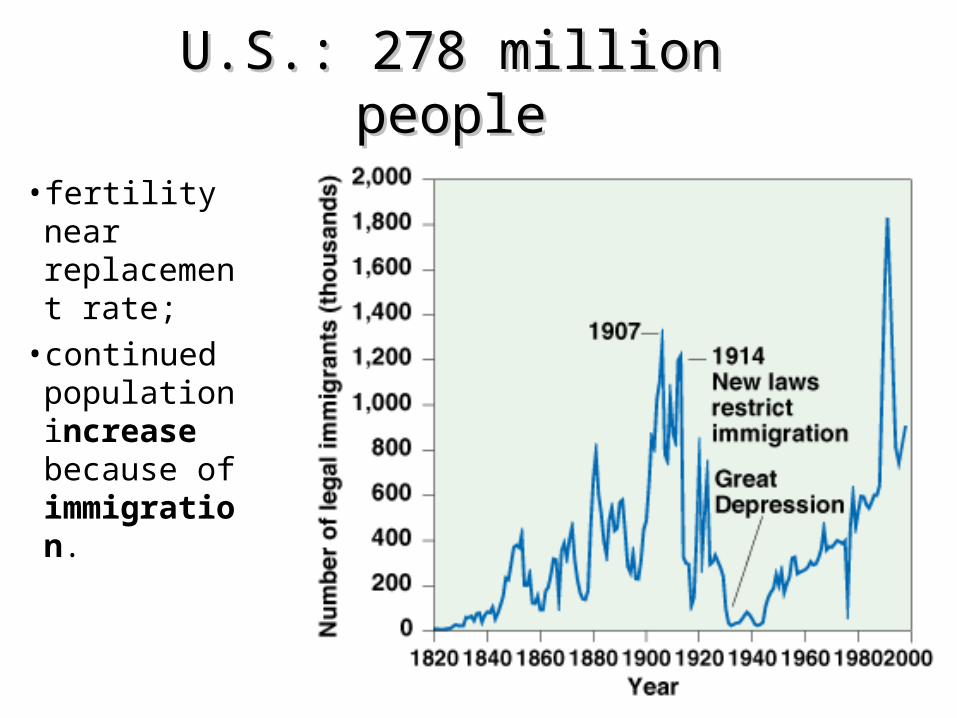
U.S.: 278 million peopleU.S.: 278 million people
• fertility near replacement rate;
• continued population increase because of immigration.
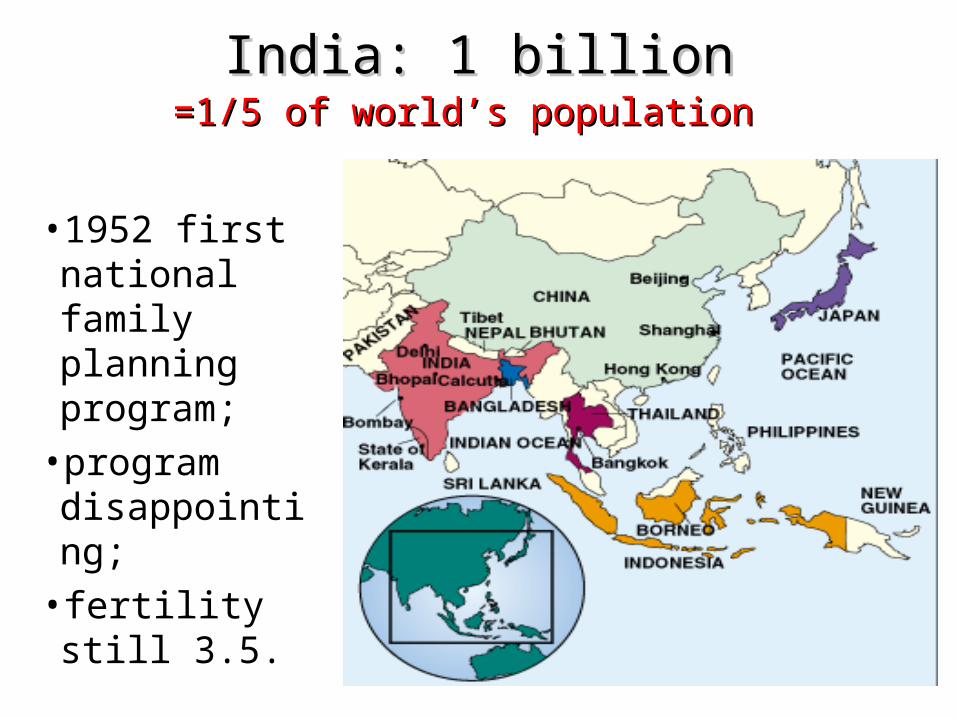
India: 1 billionIndia: 1 billion=1/5 of world’s population=1/5 of world’s population
• 1952 first national family planning program;
• program disappointing;
• fertility still 3.5.
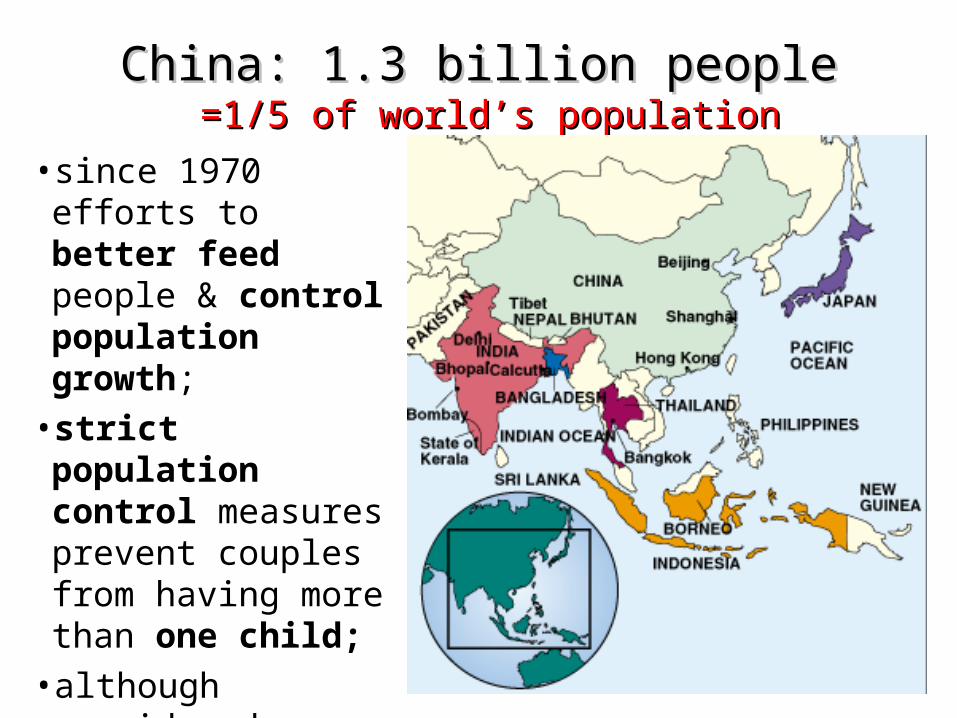
China: 1.3 billion peopleChina: 1.3 billion people =1/5 of world’s population =1/5 of world’s population
• since 1970 efforts to better feed people & control population growth;
• strict population control measures prevent couples from having more than one child;
• although considered coercive, the policy is significantly slowing population growth.
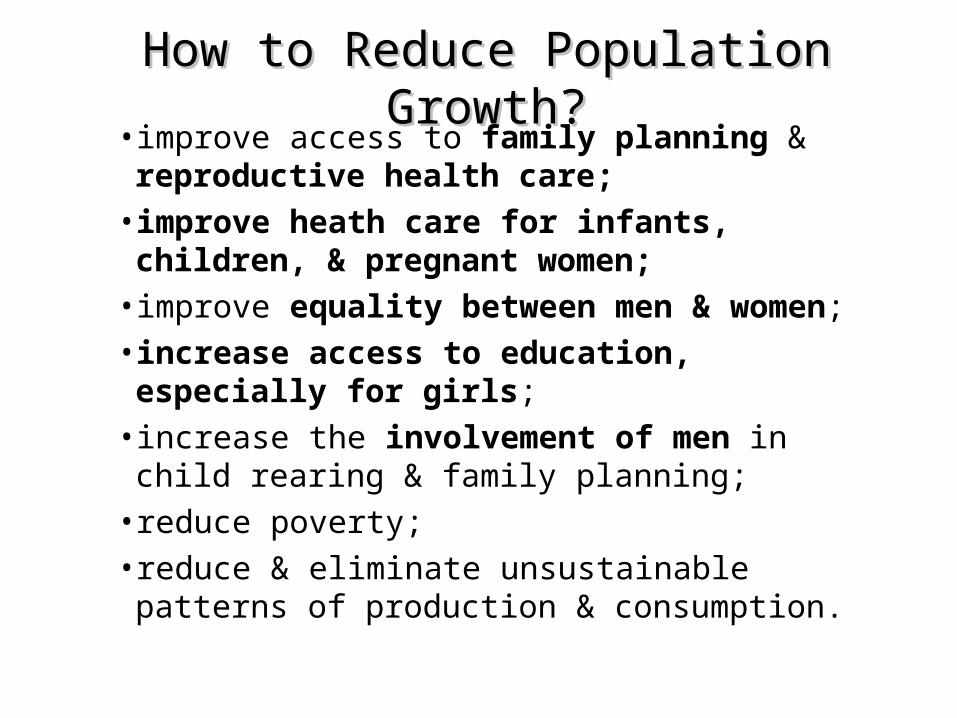
How to Reduce Population Growth?How to Reduce Population Growth?• improve access to family planning & reproductive
health care;• improve heath care for infants, children, &
pregnant women;• improve equality between men & women;• increase access to education, especially for
girls;• increase the involvement of men in child rearing &
family planning;• reduce poverty;• reduce & eliminate unsustainable patterns of
production & consumption.
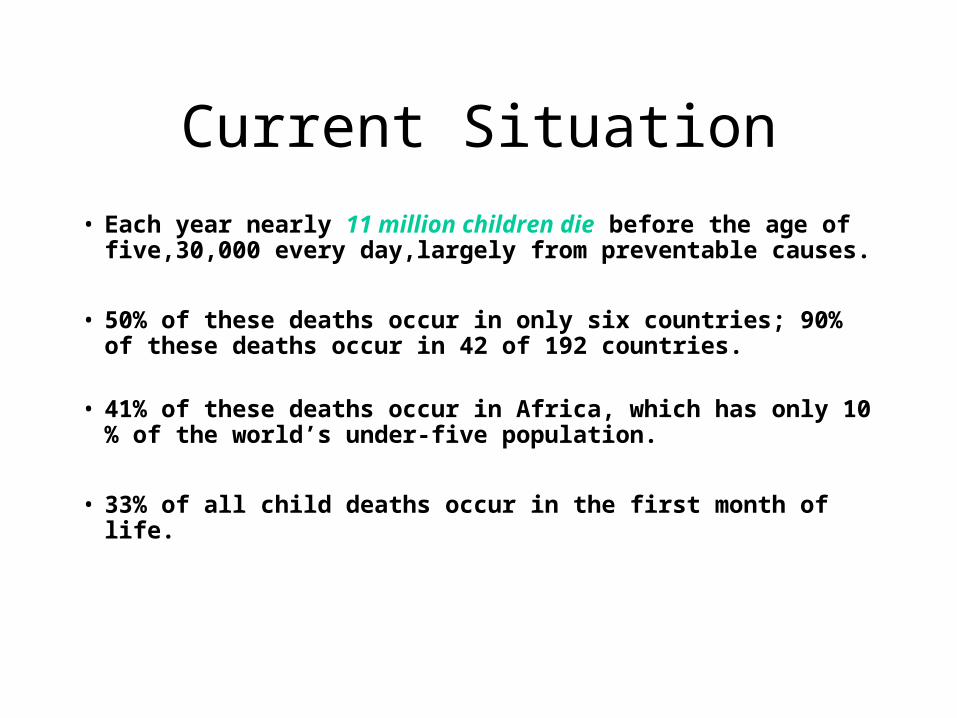
Current Situation
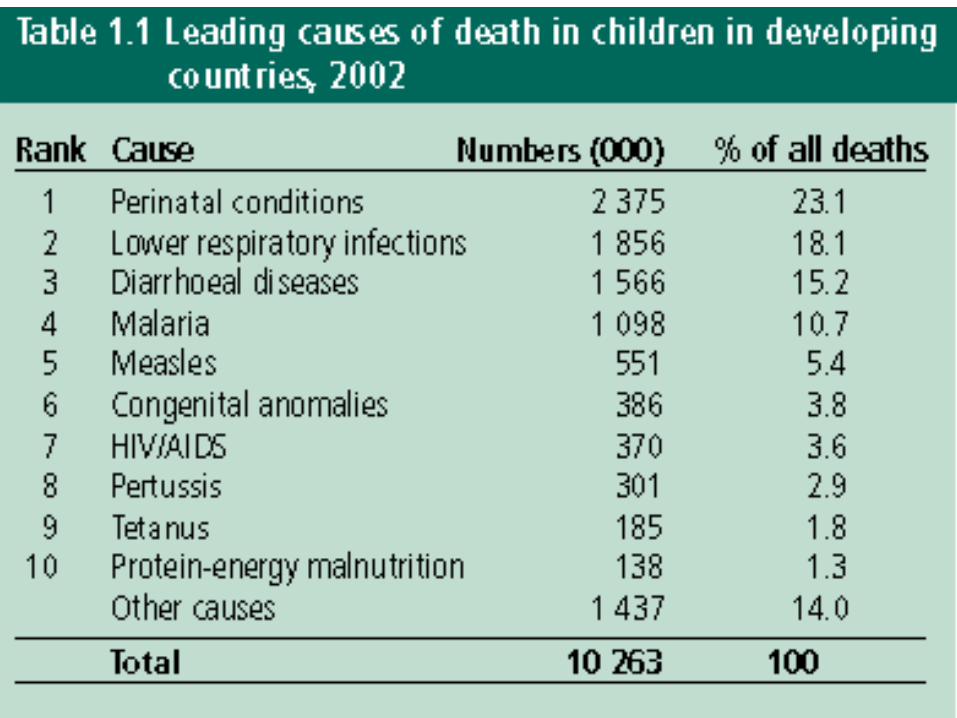
• Each year nearly 11 million children die before the age of five,30,000 every day,largely from preventable causes.
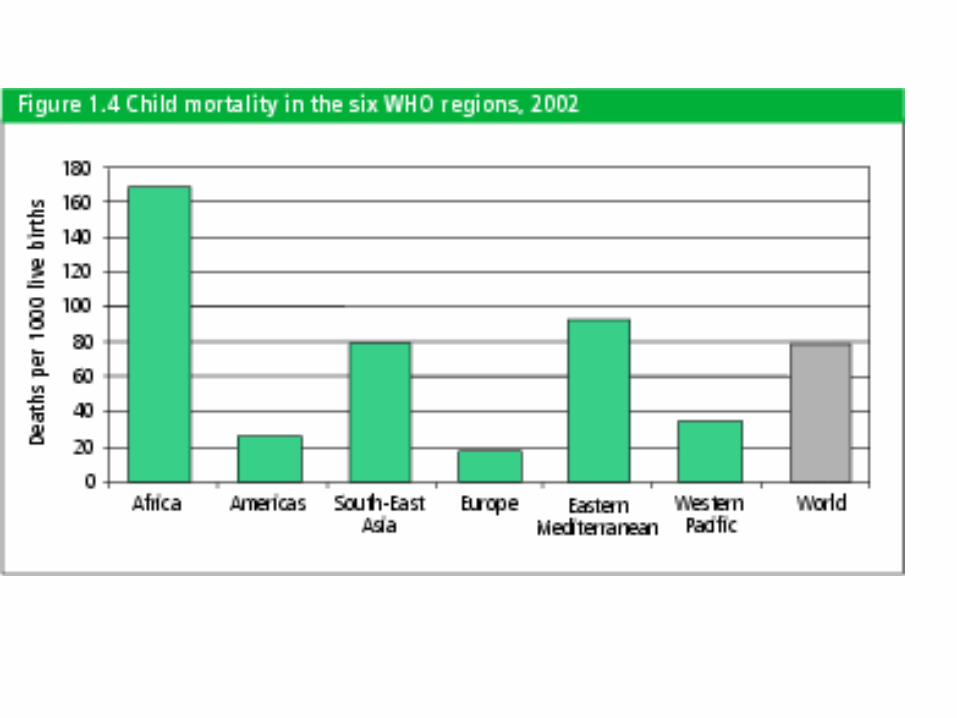
• 50% of these deaths occur in only six countries; 90% of these deaths occur in 42 of 192 countries.
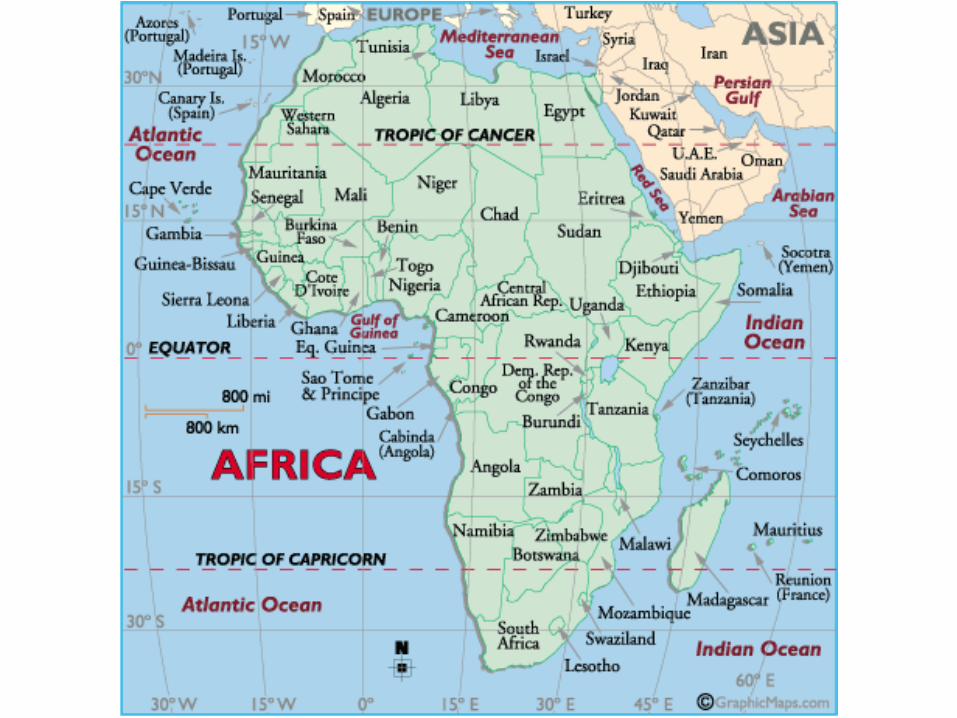
• 41% of these deaths occur in Africa, which has only 10 % of the world’s under-five population.
• 33% of all child deaths occur in the first month of life.
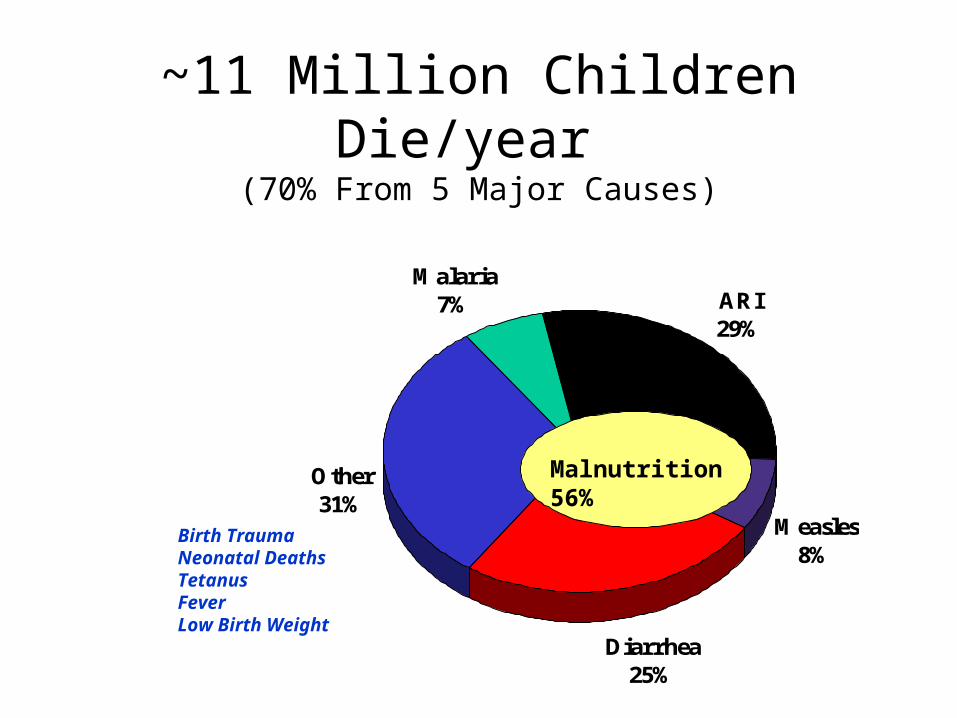
~11 Million Children Die/year (70% From 5 Major Causes)
Malaria7% ARI
29%
Measles8%
Diarrhea25%
Other31%
Malnutrition 56%
Birth TraumaNeonatal DeathsTetanusFeverLow Birth Weight
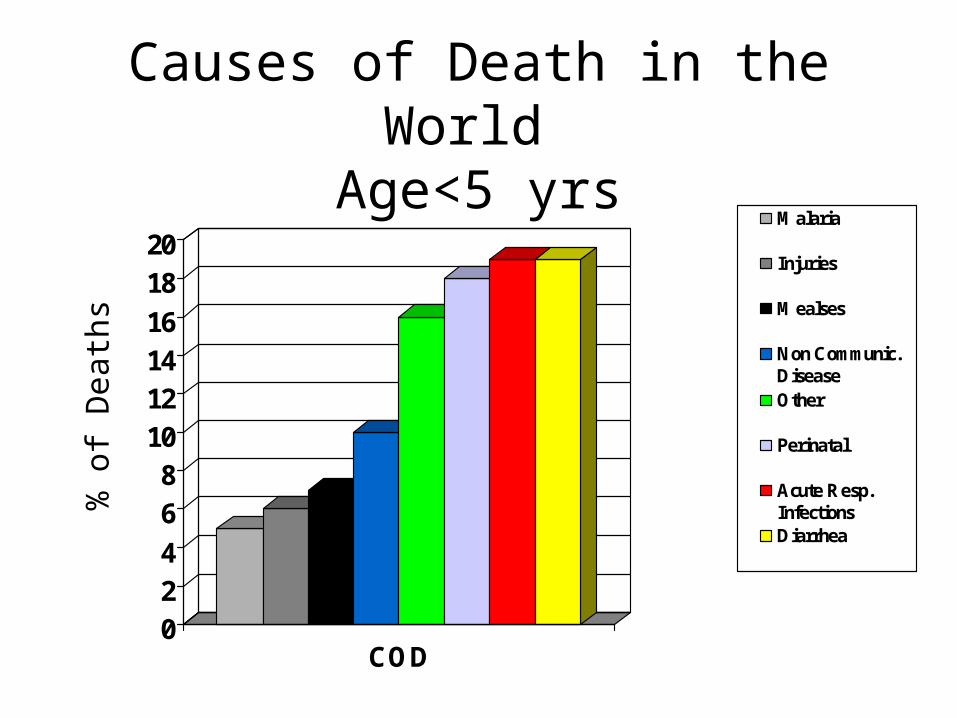
Causes of Death in the World Age<5 yrs
024
68
10121416
1820
COD
Malaria
Injuries
Mealses
Non Communic.DiseaseOther
Perinatal
Acute Resp.InfectionsDiarrhea
% o
f D
eath
s
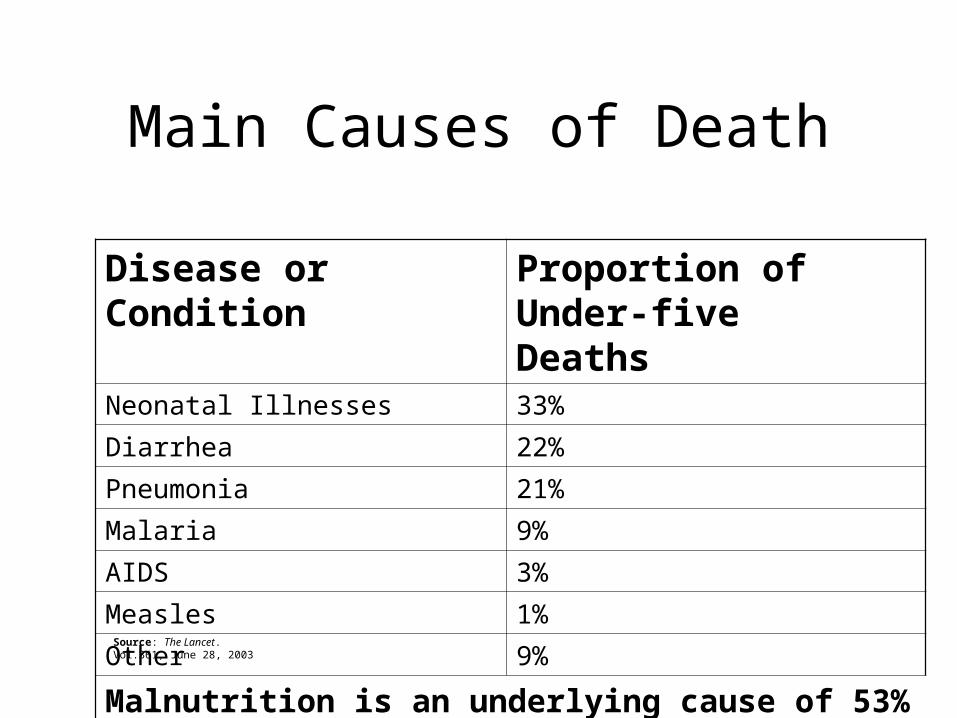
Main Causes of Death
Disease or Condition Proportion of Under-five Deaths
Neonatal Illnesses 33%
Diarrhea 22%
Pneumonia 21%
Malaria 9%
AIDS 3%
Measles 1%
Other 9%
Malnutrition is an underlying cause of 53% of all child deaths
Source: The Lancet. Vol.361, June 28, 2003
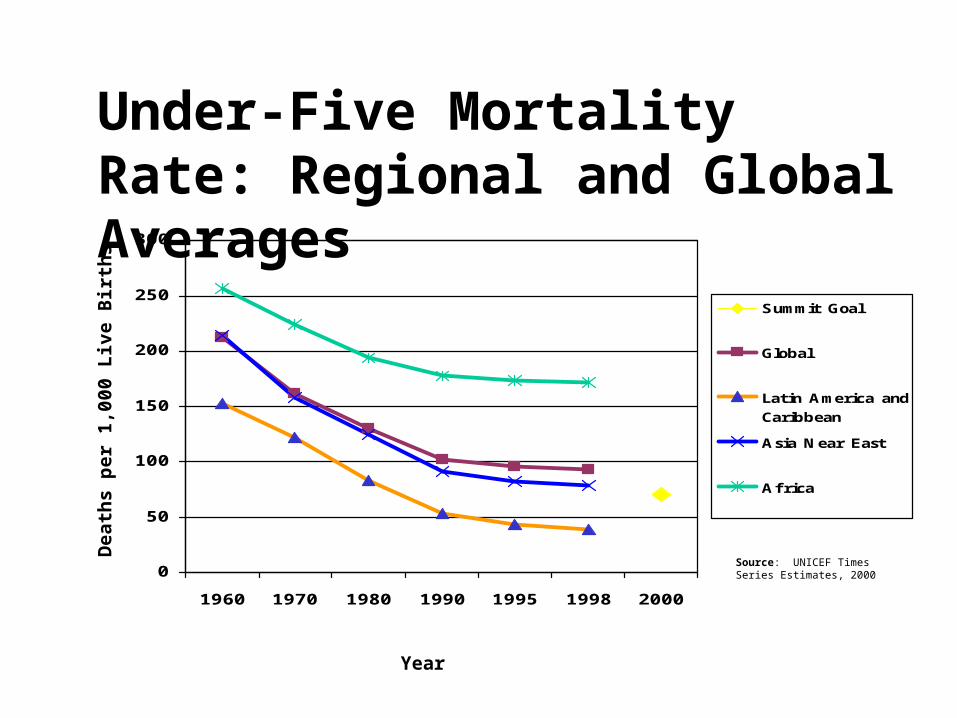
0
50
100
150
200
250
300
1960 1970 1980 1990 1995 1998 2000
Summit Goal
Global
Latin America and
Caribbean
Asia Near East
Africa
Death
s p
er
1,0
00 L
ive B
irth
s
Year
Under-Five Mortality Rate: Regional and Global Averages
Source: UNICEF Times Series Estimates, 2000
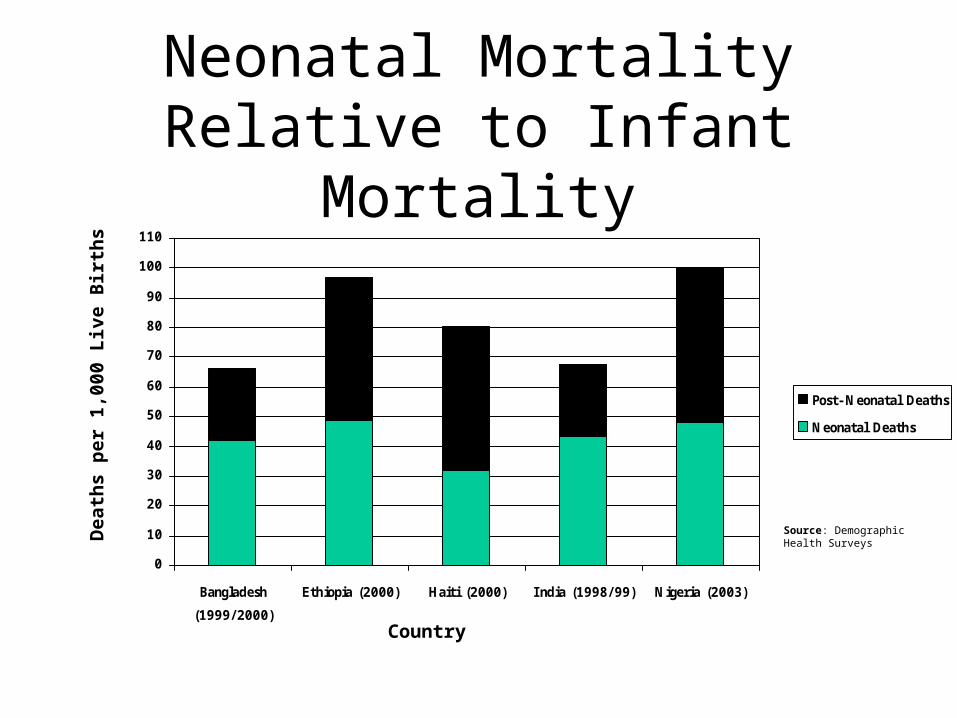
Neonatal Mortality Relative to Infant Mortality
0
10
20
30
40
50
60
70
80
90
100
110
Bangladesh
(1999/2000)
Ethiopia (2000) Haiti (2000) India (1998/99) Nigeria (2003)
Post- Neonatal Deaths
Neonatal Deaths
Death
s p
er
1,0
00 L
ive B
irth
s
Country
Source: Demographic Health Surveys
• Tuberculosis prevention, control & treatment
• Malaria prevention, control & treatment
• Anti-microbial resistance
• Local capacity for surveillance and response
Infectious Diseases
Gaps in Child Survival
• Gaps in child mortality are increasing between rich and poor countries.
• Mortality rates in sub-Saharan Africa average 175 per 1,000, compared to 6 per 1000 in industrialized countries.
• Within countries, gaps in mortality rates between rich and poor children are also increasing.
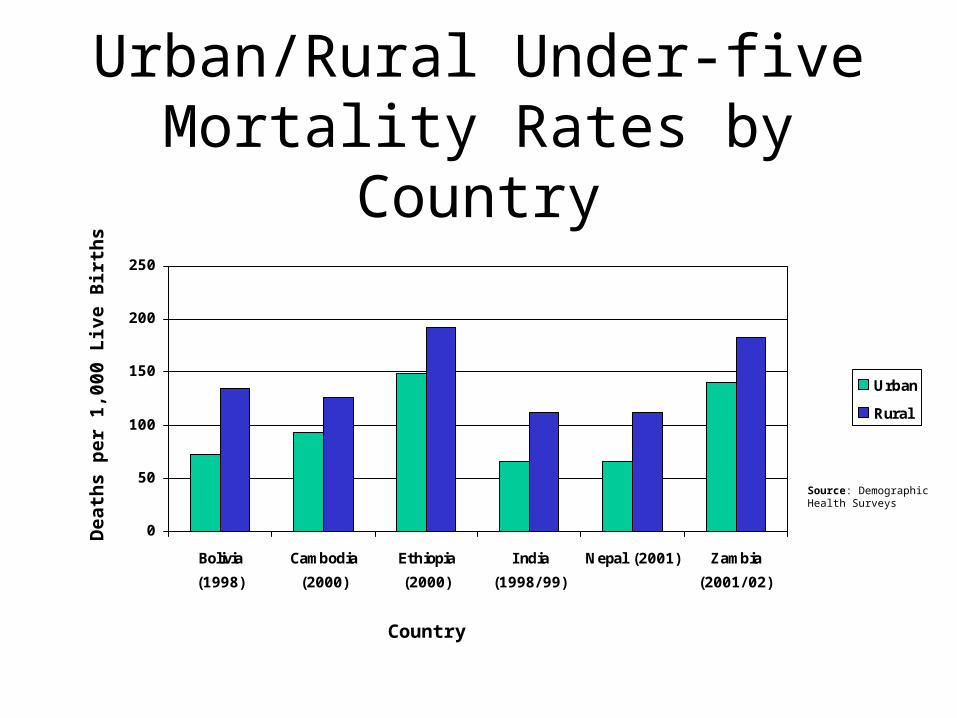
Urban/Rural Under-five Mortality Rates by Country
0
50
100
150
200
250
Bolivia
(1998)
Cambodia
(2000)
Ethiopia
(2000)
India
(1998/99)
Nepal (2001) Zambia
(2001/02)
Urban
Rural
Death
s p
er
1,0
00 L
ive B
irth
s
Country
Source: Demographic Health Surveys
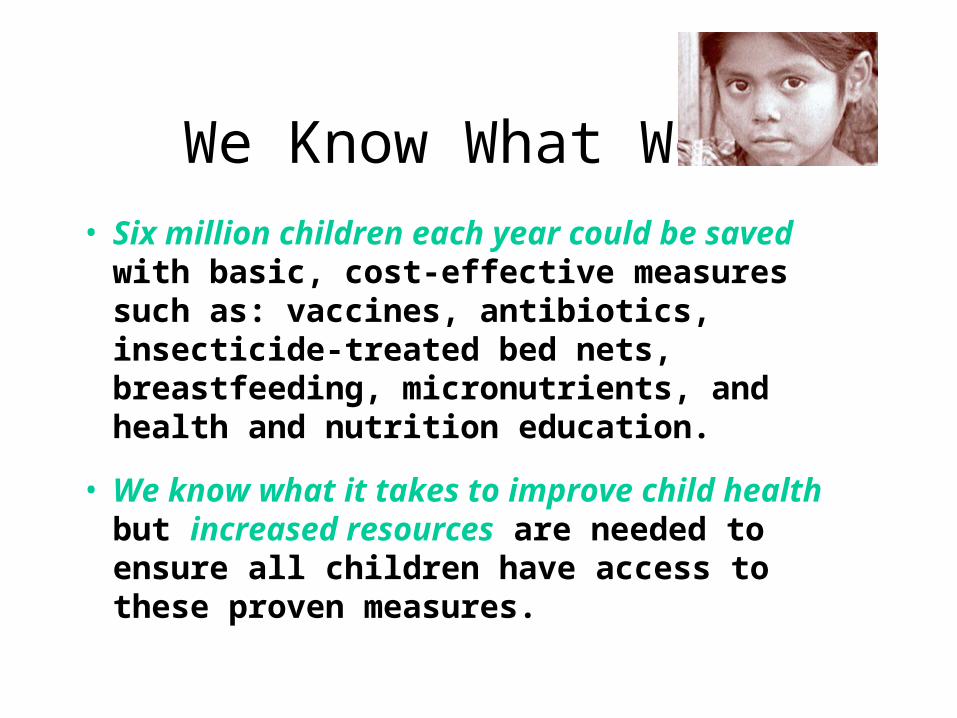
We Know What Works
• Six million children each year could be saved with basic, cost-effective measures such as: vaccines, antibiotics, insecticide-treated bed nets, breastfeeding, micronutrients, and health and nutrition education.
• We know what it takes to improve child health but increased resources are needed to ensure all children have access to these proven measures.
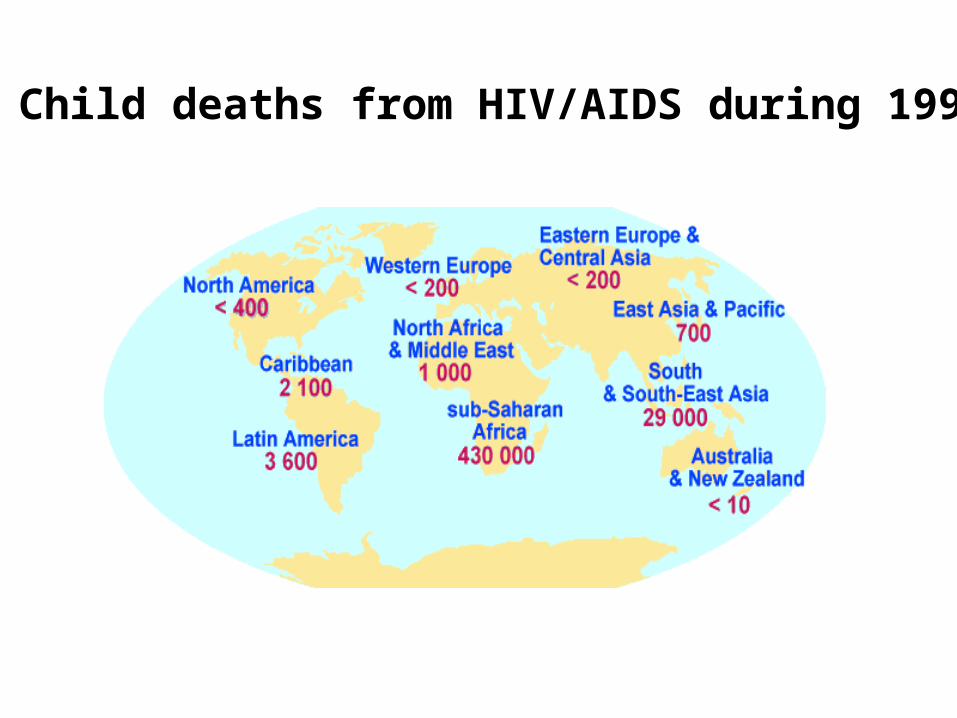
Child deaths from HIV/AIDS during 1997
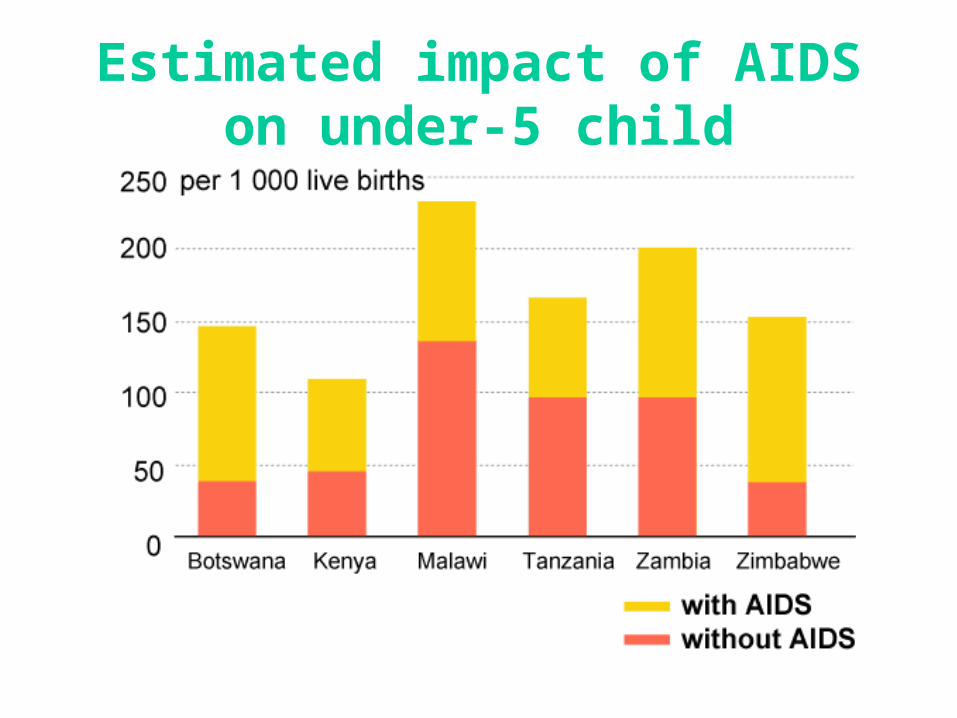
Estimated impact of AIDS on under-5 child mortality rates
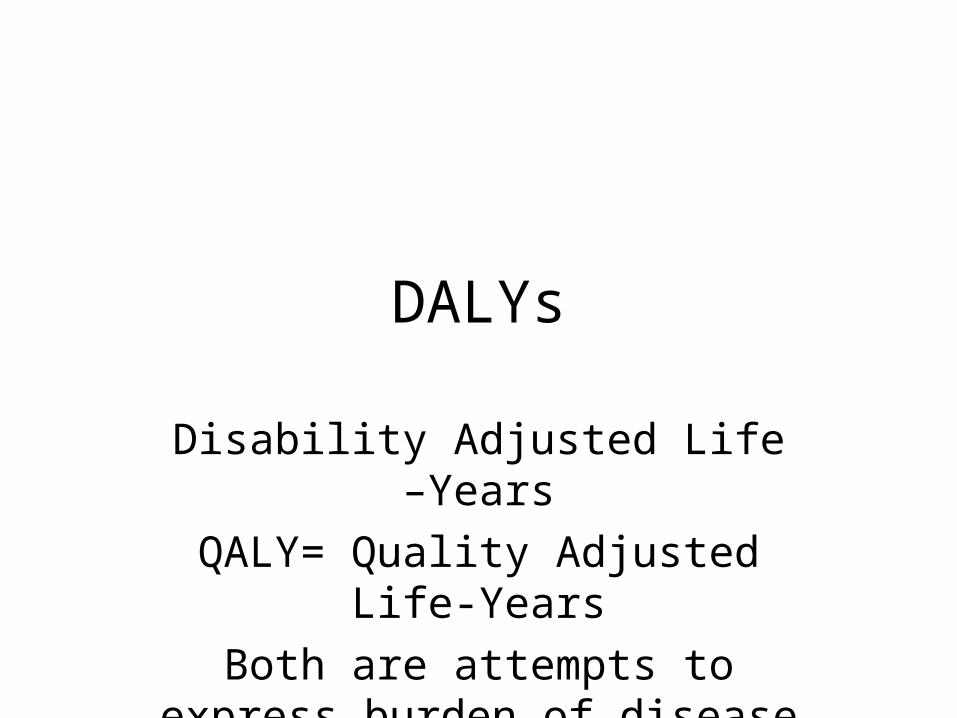
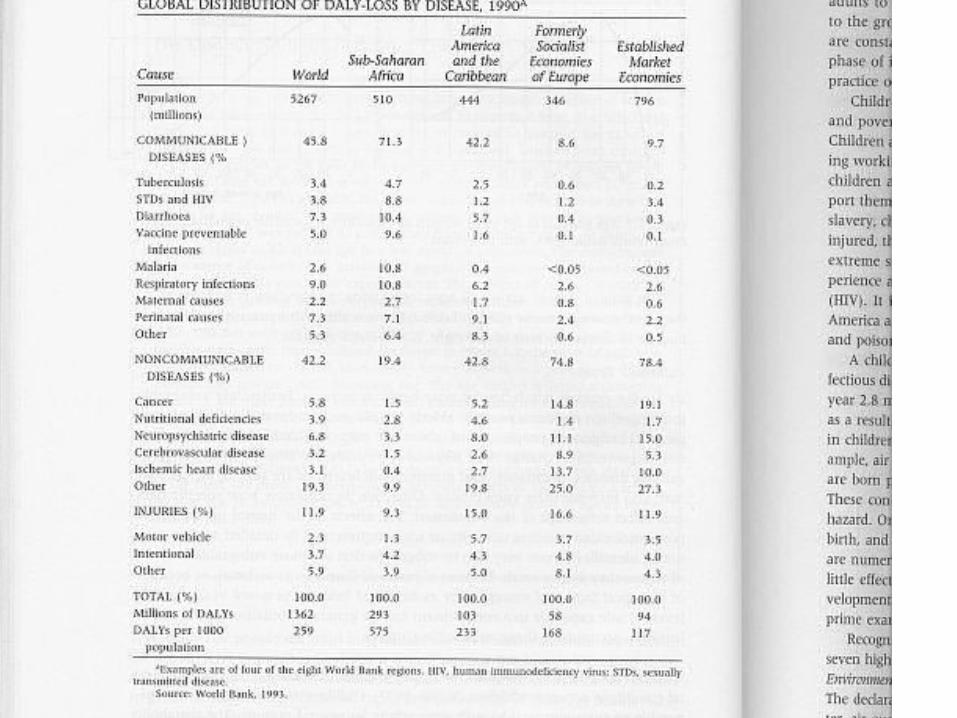
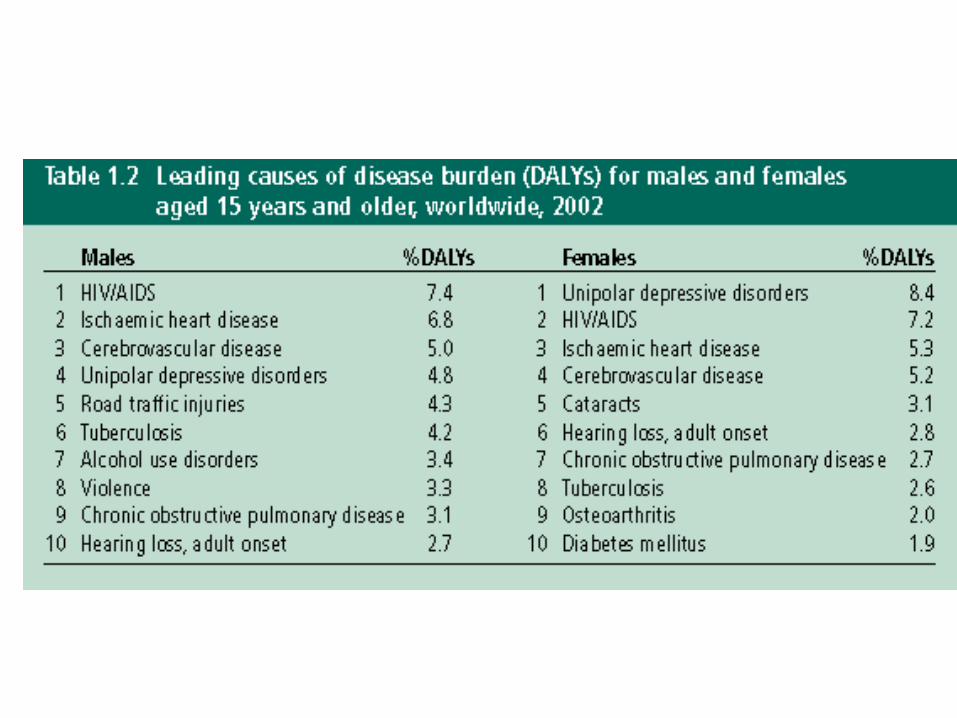
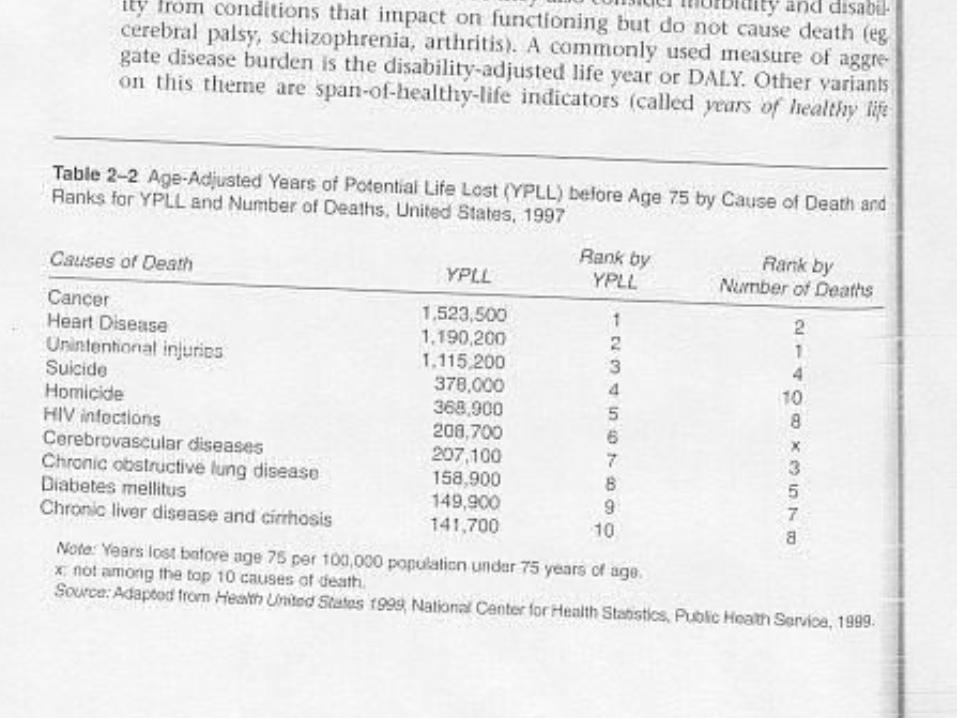
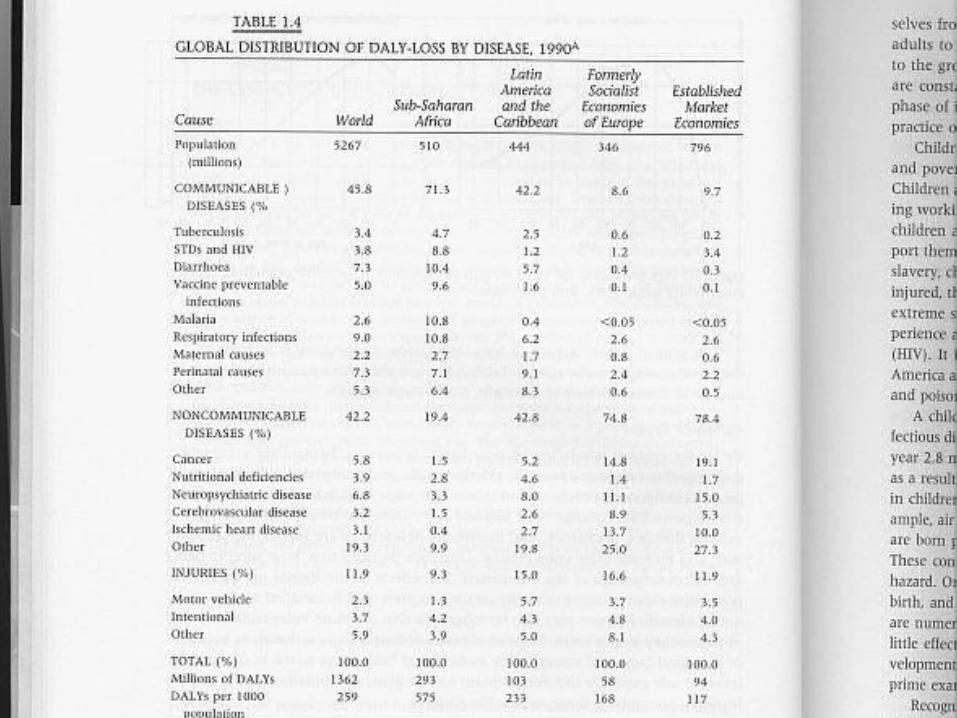
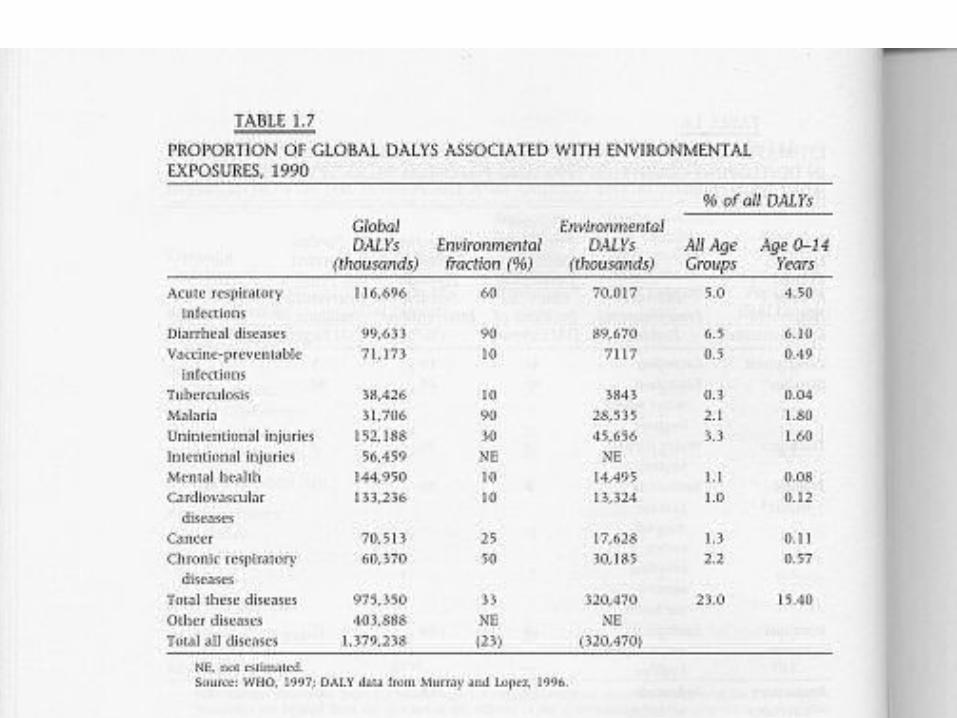
DALYs
Disability Adjusted Life –Years
QALY= Quality Adjusted Life-Years
Both are attempts to express burden of disease in a single number
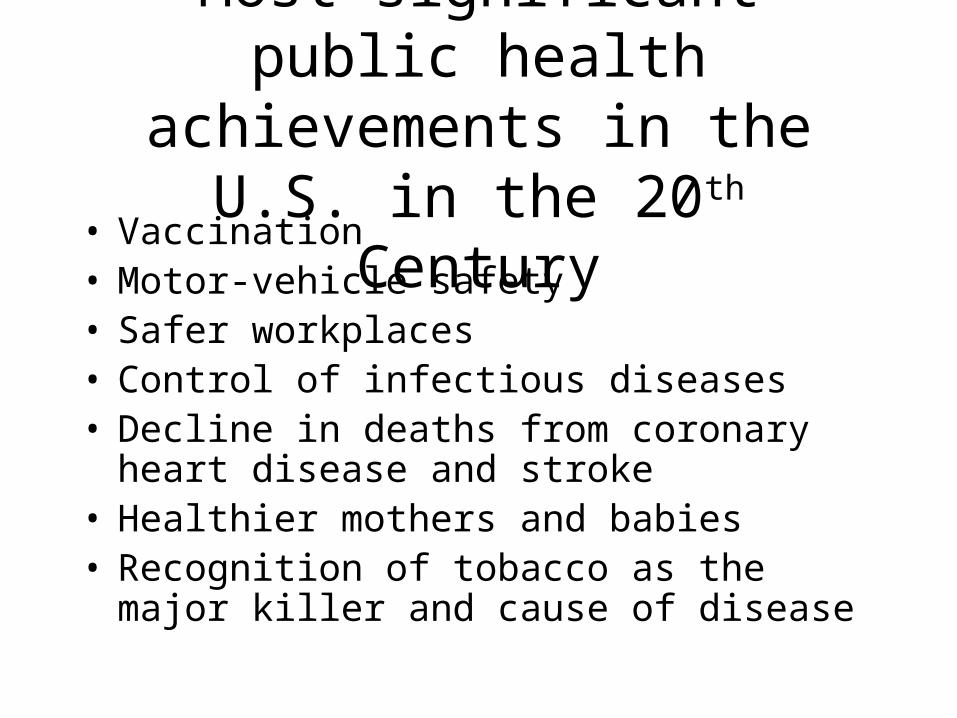
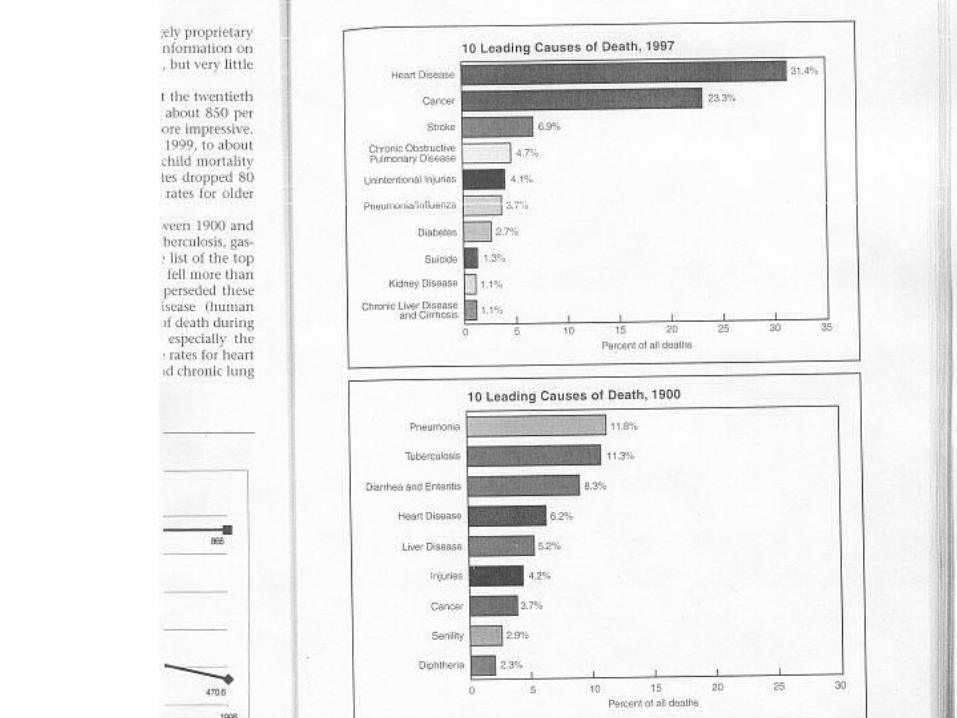
Most significant public health achievements in the U.S. in the
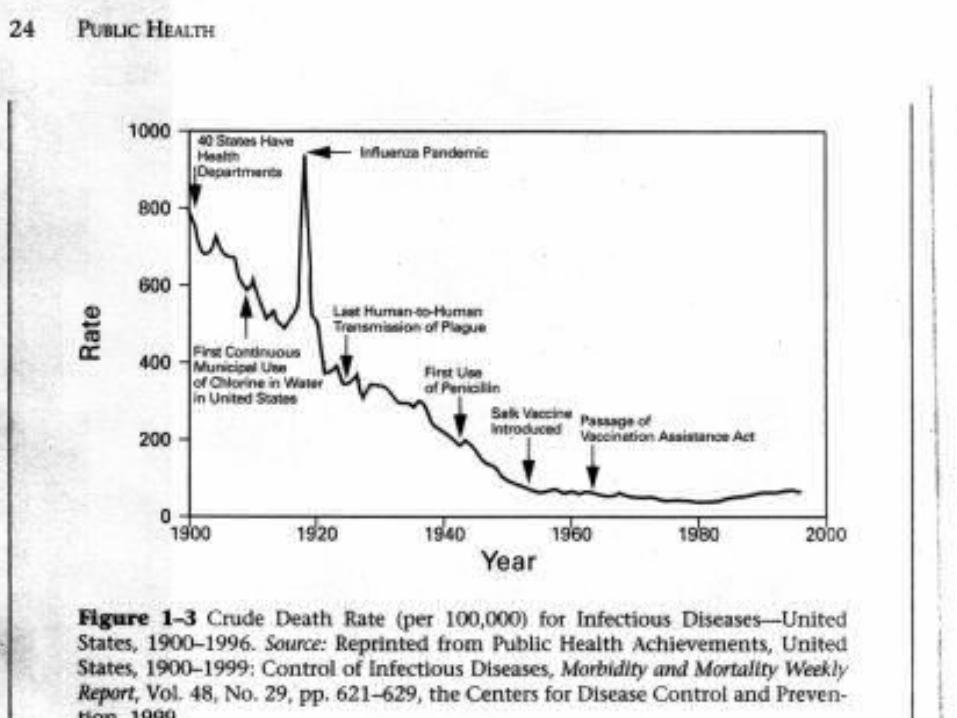
20th Century• Vaccination• Motor-vehicle safety• Safer workplaces• Control of infectious diseases• Decline in deaths from coronary heart disease and
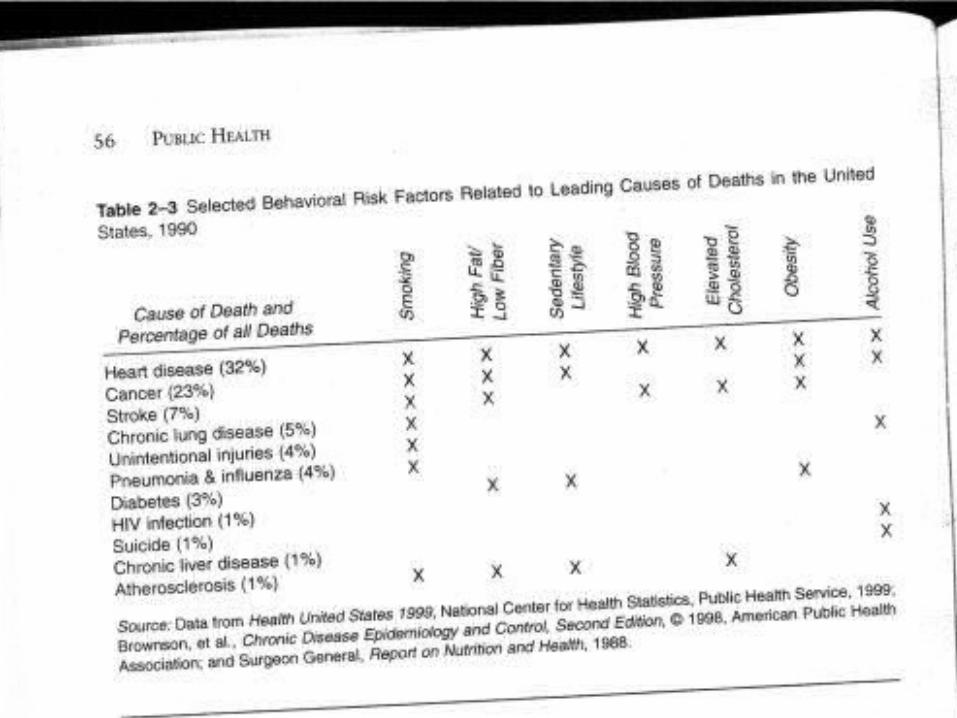
stroke• Healthier mothers and babies• Recognition of tobacco as the major killer and
cause of disease
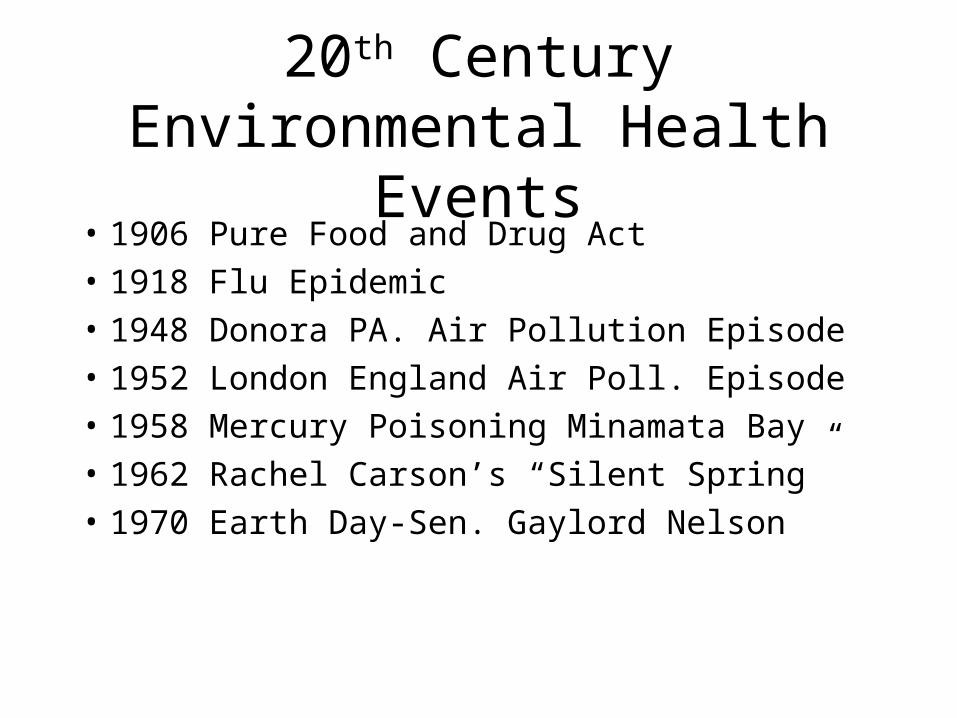
20th Century Environmental Health Events
• 1906 Pure Food and Drug Act
• 1918 Flu Epidemic
• 1948 Donora PA. Air Pollution Episode
• 1952 London England Air Poll. Episode
• 1958 Mercury Poisoning Minamata Bay
• 1962 Rachel Carson’s “Silent Spring”
• 1970 Earth Day-Sen. Gaylord Nelson
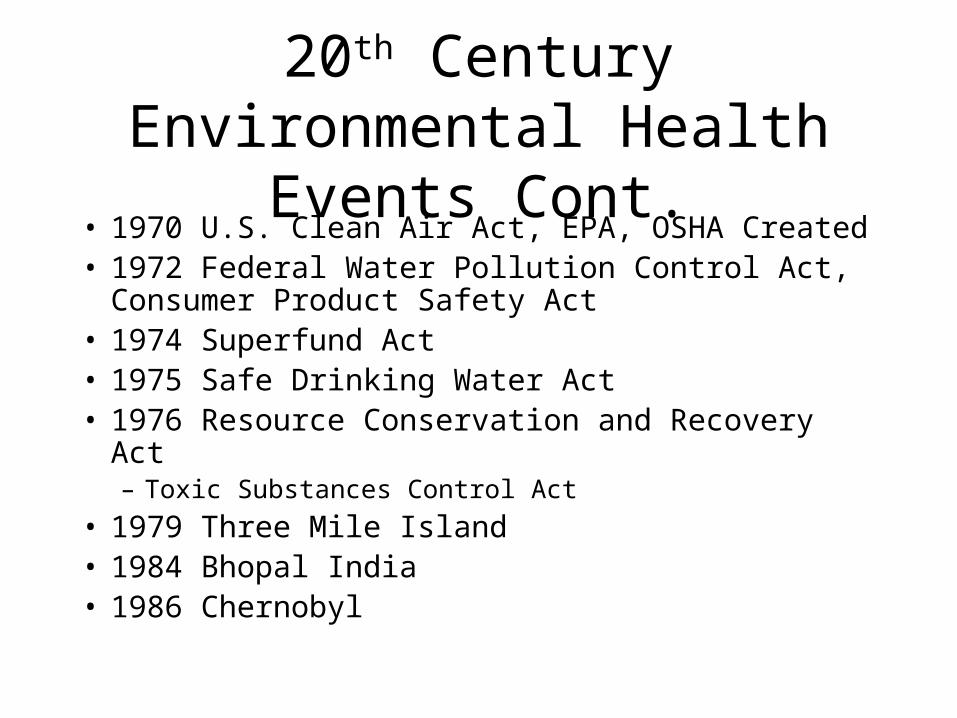
20th Century Environmental Health Events Cont.
• 1970 U.S. Clean Air Act, EPA, OSHA Created• 1972 Federal Water Pollution Control Act, Consumer
Product Safety Act• 1974 Superfund Act• 1975 Safe Drinking Water Act• 1976 Resource Conservation and Recovery Act
– Toxic Substances Control Act
• 1979 Three Mile Island• 1984 Bhopal India• 1986 Chernobyl