Embed Size (px)
Citation preview

LIFE IN THE BLACK
Professor Barry Crittenden
Department of Chemical Engineering
Faculty of Engineering and Design
University of Bath, Bath, UK
Heat Transfer Society 22nd October 2013
A PICTORIAL ROMP
THROUGH LIFE WITH
HEAT TRANSFER AND CARBON

STRIKE THE ODD ONES OUT FROM MY LIFE IN THE BLACK

SOME INTERESTING REACTIONS OF COPPER

THE PROBLEM WITH POLYNUCLEAR AROMATIC HYDROCARBONS…
95% carbon by weight

…IS THAT THEY ARE EVERYWHERE

THE SOOT MAKER

MEASUREMENT AND THE MECHANISM?

THERMAL DIFFUSION AND NUCLEAR WARHEADS?

SOJOURN INTO HEAT TRANSFER AND AMMONIA
Heat Transfer
Kellogg International
Corporation
Baker Street

Consider a heat exchanger with 14.8
mm ID tubes with an overall heat
transfer coefficient of 500 W/m2K. A
1.0 mm layer of deposit builds up on
the tube surface and it is found that
the thermal conductivity of the deposit
is 0.04 W/mK. By how much will the
overall heat transfer coefficient have
reduced?
If the pressure drop through this
exchanger when clean was 1.0 bar
what will the pressure drop have
increased to if the mass flow rate
through the exchanger is to be kept
the same as when clean? (Assume
that the surface roughness does not
alter.)
HEAT TRANSFER AND PRESSURE DROP PROBLEMS…
Crude oil preheat unit of
100,000 BPSD oil refinery
Deposit thicknesses mm

Consider a heat exchanger with 14.8
mm ID tubes with an overall heat
transfer coefficient of 500 W/m2K. A
1.0 mm layer of deposit builds up on
the tube surface and it is found that
the thermal conductivity of the deposit
is 0.04 W/mK. By how much will the
overall heat transfer coefficient have
reduced? (Ans: by 93% to 37 W/mK)
If the pressure drop through this
exchanger when clean was 1.0 bar
what will the pressure drop have
increased to if the mass flow rate
through the exchanger is to be kept
the same as when clean? (Assume
that the surface roughness does not
alter.) (Ans: doubled to about 2 bar)
HEAT TRANSFER AND PRESSURE DROP PROBLEMS…
Crude oil preheat unit of
100,000 BPSD oil refinery
Deposit thicknesses mm

All fouling:
0.25% of GDP1
Crude oil fouling:
$1.2 billion in USA2
$4.5 billion in Western World2
10% of refinery carbon dioxide footprint3
Why:
Reduced thermal efficiency, additional pressure drop (50% together),
reduced or lost production, extra maintenance, extra surface area,
cleaning, safety issues, etc
1Pugh S J, Hewitt G F and Muller-Steinhagen H 2007, Heat Exchanger Fouling & Cleaning VII, Proc. Int. Conf. on
Heat Exchanger Fouling & Cleaning – Challenges & Opportunities, Tomar, Portugal, July 2007
2IHS ESDU, 2000, Fouling in the pre-heat train of a crude oil distillation unit, ESDU 00016, IHS ESDU International
plc, London
3Muller-Steinhagen H, Malayeri M R and Watkinson A P, 2007, Heat Exchanger Fouling & Cleaning VII, Proc. Int.
Conf. on Heat Exchanger Fouling & Cleaning – Challenges & Opportunities, Tomar, Portugal, July 2007
…ARE EXPENSIVE

WHO WANTS TO GET THEIR HANDS DIRTY?

WHAT ARE THE DEPOSITS?
Mainly organic with some inorganic content. Typically contain organic polymers
(eg asphaltenes), coke, particulates, inorganic salts, corrosion products, etc.
Archipelago structure in
Maya (Mexico) crude Continental structure in
Venezuelan crude
Element C H N S Fe
Crude A 36.12 4.11 <0.1 16.61 13.71
Crude B 53.98 6.11 0.48 13.82 7.53
Deposit analyses plant ↑ and laboratory ↓

23
0 m
m a
pp
roxim
ate
ly
t wb t ws
t bulk
INS
UL
AT
ION
INS
UL
AT
ION
© 2008 University of
Bath, England
t wm
Fil Level
0
t
bs
t
bs
fq
TT
q
TTR
q
TTR sost
f
KEEP IT SIMPLE IN THE LABORATORY…

Velocity field Temperature field
…AND LEAVE THE COMPLICATED STUFF TO CFD
0.00
10.00
20.00
30.00
40.00
50.00
60.00
0 0.002 0.004 0.006 0.008 0.01 0.012 0.014 0.016
Position in z direction
Sh
ea
r s
tre
ss
(P
a)
0.5m/s 0.7m/s 1m/s 1.5m/s

-1.00E-08
-5.00E-09
0.00E+00
5.00E-09
1.00E-08
0 0.5 1 1.5 2
Surface shear stress (Pa)
Fo
uli
ng
rate
(m
2K
/J)
600 K 610 K 620 K 630 K 640 K 650 K 660 K
TWO RECENT ACHIEVEMENTS
Equivalent velocity concept for complex geometries
Interpolation method to locate fouling thresholds
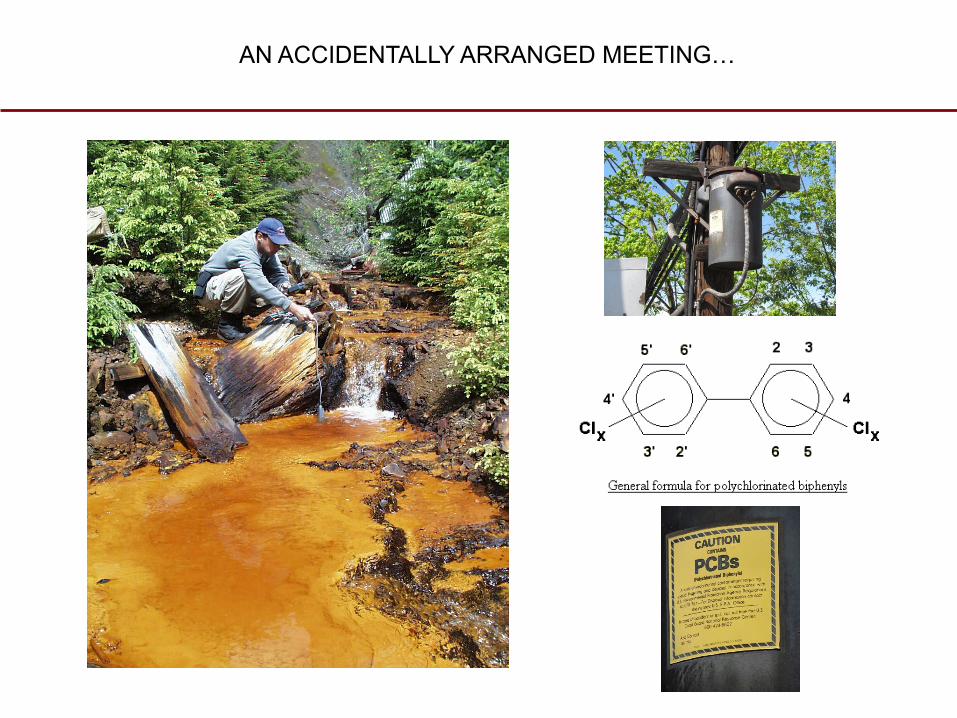
AN ACCIDENTALLY ARRANGED MEETING…

AN INVITATION…BUT NOT TO MAKE MONEY

VOC EMISSIONS…A WORLD-WIDE ENVIRONMENTAL PROBLEM
UK GDP = 4.6% of global GDP (Scaruffi, 2004)
UK VOC emissions reduced to 1.5 million tonnes in 2002 (Environment Agency)
Worldwide VOC emissions therefore are approximately 32.6 million tonnes/year
Adsorption is used for 25% of total VOC control market (Frost & Sullivan, 2000)
Therefore about 8 million tonnes/year might be controlled by adsorption worldwide
A typical VOC concentration might be 2 g/m3
Volume of air to be cleaned therefore could be 130,000 m3/s

Gothenburg Protocol to Abate Acidification, Eutrophication & Ground-level
Ozone (1999)
EU Solvent Directive (1999/13/EC)
EU Directive on National Emissions Ceilings (the NEC Directive 2001/81/EC)
EU Paints Directive (2004/42/CE)
and others
require the UK to reduce its VOC emissions to 1.2 million tonnes by 2010.
Requirement will be met primarily through
UK Environmental Protection Act 1990 (EPA90)
UK Pollution and Prevention Control (England and Wales) Regulations 2000
(PPC Regulations)
LEGISLATIVE DRIVERS

Granular activated carbons (GAC) have enjoyed a long and successful record in
removing pollutants from aqueous and gaseous environments.
With pressures now to reduce energy demands and CO2 emissions in all forms of
processing, focus is shifting towards ways of operating AC systems at very much
reduced pressure drops.
As an example, activated carbon monoliths (ACMs) can be used to remove volatile
organic compounds (VOCs) from air streams with substantially reduced energy
demands because (i) they have intrinsically low pressure drops, and (ii) they can
be thermally cycled much faster than GAC and hence their carbon inventories can
be reduced considerably.
Replace the large GAC bed with a much
smaller volume of structured ACM
REDUCE THE INVENTORY OF CARBON…

MANUFACTURE OF ACMs
Gadkaree Carbon from high carbon yield
phenolic resin impregnated on
ceramic honeycomb support
1998
Yates et al. Activated carbon mixed with
silicate clay before extrusion
2000
Tennison et al. Binder-less activated carbon
made from extruded phenolic
Novolak resin
2001
Fuertes et al. Carbon from phenolic Novolak
resin mixed with Nomex fibres
2003
Valdés-Solis et al. Carbon from phenolic Novolak
resin dip-coated on ceramic
support
2003 30% linear & 50%
volumetric shrinkage
on carbonisation

Granular activated carbon needs to
be heated with steam or hot gas for
its regeneration. This is a slow
process, causing thermal swing
adsorption (TSA) cycle times to be
high, eg 8 hours. Recovery of the
solvents is more difficult if steam is
used although this is a good heating
medium.
COMPARE AND CONTRAST

Granular activated carbon needs to
be heated with steam or hot gas for
its regeneration. This is a slow
process, causing thermal swing
adsorption (TSA) cycle times to be
high, eg 8 hours. Recovery of the
solvents is more difficult if steam is
used although this is a good heating
medium.
Activated carbon monoliths can be
heated electrically at low potential
difference. This is a fast process,
thereby allowing operation at much
shorter cycle times, eg 60 minutes.
The consequence is that much less
adsorbent is required and so the
equipment is much smaller.
COMPARE AND CONTRAST

MONOLITH ELECTRICAL RESISTANCE
Electrothermal cycles of 30 mins heating
and 30 mins cooling with 2 litres/min
nitrogen (3 surface thermocouples)

EXTRUDED ACMs IN VOC RECOVERY UNIT
Place R N, Blackburn A J, Tennison S R, Rawlinson A P and
Crittenden B D
“Method and equipment for removing volatile compounds from air”
US Patent 6964695 (2005), European Patent EP 1372917 (2008)
Winner – IChemE Severn Trent Water Safety Award 2002

COMPARE THE PRESSURE DROPS…
4
4.28
a
Q
L
P
ppd
u
e
e
d
u
e
e
L
P 2
323
21
75.11
150
Skin friction only
(laminar flow)
Patton et al (2004)
Skin friction and form drag with the latter
as a function of u2 predominating
Ergun (1952)

Assume an average 20% loading (w/w) on both the granular and monolithic
adsorbents (it has been shown that the kinetic performances of the two
systems are quite similar).
Assume an 8.0 hour cycle time for granular (spherical) adsorbent.
Assume that the Ergun equation is applicable for the pressure drop through a
bed of granular activated carbon (GAC).
Assume a 1.0 hour cycle time for monolith adsorbent.
Assume that the Poiseuille equation is applicable for the pressure drop for
laminar flow through the monolith channels.
What is the potential benefit from switching from GAC to ACM for VOC
control?
BASIS OF PRESSURE DROP COMPARISON

GLOBAL POTENTIAL
Pressure Drops for Worldwide Control of VOCs
Packed bed Monolith
Pellet diameter, mm 1.0 -
Square channel monolith dimension, mm - 0.63
Square channel monolith wall thickness, mm - 0.43
Air flow rate, m3 s
-1 130,000 130,000
Bed volume, m3 50,000 6250
Reynolds number 100 157
Superficial velocity, m s-1
1.55 1.55
Bed voidage or monolith fractional free volume 0.4 0.4
fp or fm 49.7 0.41
Bed cross sectional area, m2 83,870 83,870
Bed length, m 0.60 0.075
Pressure gradient, N m-3 70,747 5790
Pressure drop, N m-2
42,450 434
Power requirement, MW 5500 56
Potential power saving is substantial.
Potential for CO2 reduction depends on energy sources.

FUNDAMENTAL DESIGN
Gas phase
Solid phase
Gas flow
0
x y
z
tw
a
Decisions:
3D diffusion & convection in the
channel gas phase
Various flow regimes in the
channels (eg plug, axially dispersed
plug, fully developed, developing)
3D diffusion in the solid phase
Adsorption at the gas-solid interface
(eg Langmuir, Tóth)
Isotropic, anisotropic solid phase
Isothermal, non-isothermal
Uniform, non-uniform channels

FLOW AND CONVECTION
02
2
2
2
2
2
x
cu
z
c
y
c
x
cD
t
caveM
2
2
2
2
2
2
z
q
y
q
x
qD
t
qeff
Mass balance gas phase:
Mass balance solid phase:
Tóth model:
0,2
2
2
2
2
2
z
T
y
T
x
Tzyuc
z
T
y
T
x
T
t
Tc
ggg
pgg
ggg
g
g
pgg
02
2
2
2
2
2
z
T
y
T
x
T
t
Tc sss
s
s
pss
0TTAdt
qdH
z
Tsg
az
ss
45.0
095.01977.2
PrRe
L
dhdNu ch
g
ch
Energy balance gas phase:
Energy balance solid phase:
Energy balance interface:
Gas channel heat transfer coefficient:
nnmax
bp
bpqq
1
1

…STILL DO NOT MAKE MUCH MONEY FROM PUBLISHING

AND FINALLY…BLACK POWDER?
Sulphur + charcoal + potassium nitrate

INNOCENT ANGLER

CHARCOAL, SULPHUR & SALTPETRE IS ON THE WAY…

FINALLY…BACK TO THE BEGINNING