Embed Size (px)
Citation preview
8/9/2019 LIFE Paper PDF
http://slidepdf.com/reader/full/life-paper-pdf 1/32
REGULATED RIVERS: RESEARCH & MANAGEMENT
Regul . Ri ers: Res. Mgmt. 15: 543–574 (1999)
RIVER FLOW INDEXING USING BRITISH BENTHICMACROINVERTEBRATES: A FRAMEWORK FOR SETTING
HYDROECOLOGICAL OBJECTIVES
C.A. EXTENCE*, D.M. BALBI AND R.P. CHADDThe Enironment Agency of England & Wales, Anglian Region, Northern Area, Waterside North, Lincoln, UK
ABSTRACT
A method linking qualitative and semi-quantitative change in riverine benthic macroinvertebrate communities toprevailing flow regimes is proposed. The Lotic-invertebrate Index for Flow Evaluation (LIFE) technique is based ondata derived from established survey methods, that incorporate sampling strategies considered highly appropriate forassessing the impact of variable flows on benthic populations.
Hydroecological links have been investigated in a number of English rivers, after correlating LIFE scores obtainedover a number of years with several hundred different flow variables. This process identifies the most significant
relationships between flow and LIFE which, in turn, enables those features of flow that are of critical importance ininfluencing community structure in different rivers to be defined. Summer flow variables are thus highlighted as beingmost influential in predicting community structure in most chalk and limestone streams, whereas invertebratecommunities colonizing rivers draining impermeable catchments are much more influenced by short-term hydrologicalevents. Biota present in rivers with regulated or augmented flows tend to be most strongly affected by non-seasonal,interannual flow variation.
These responses provide opportunities for analysing and elucidating hydroecological relationships in some detail,and it should ultimately be possible to use these data to set highly relevant, cost-effective hydroecological objectives.An example is presented to show how this might be accomplished.
Key areas of further work include the need to provide robust procedures for setting hydroecological objectives,investigation of habitat quality and LIFE score relationships in natural and degraded river reaches and evaluation of potential links with other biological modelling methods such as RIVPACS. Copyright © 1999 John Wiley & Sons,Ltd.
KEYWORDS: drought; flow; hydroecology; macroinvertebrates
INTRODUCTION
Changing weather patterns, possibly linked to global climate change, are currently of major concern, not
least because alterations in hydrological regime could lead to significant and sustained shifts in riverine
ecology (Arnell, 1996). In the UK, periods of drought are becoming more frequent (Mawdsley et al .,
1994) and general declines in precipitation, coupled with unremitting demands on surface and groundwa-
ter resources, are resulting in diminished or disappearing river flows.
A number of historic studies have focused on general ecological change associated with drought (for
example, Ladle and Bass, 1981) and further work (Extence, 1981; Wright, 1992; Bickerton et al ., 1993;
Wood and Petts, 1994; Castella et al ., 1995) has specifically examined the impact of low flows on lotic
macroinvertebrate communities. Many freshwater invertebrates have precise requirements for particular
current velocities or flow ranges (Chutter, 1969; Hynes, 1970; Statzner et al ., 1988; Brooks, 1990), and
certain taxa may be ideal indicators of prevailing flow conditions.
As well as qualitative responses to flow changes, site specific studies also show that most taxa
associated with slow flow tend to increase in abundance as flows decline, whereas most species associated
with faster flows exhibit the opposite response (Moth Iversen et al ., 1978; Extence, 1981; Cowx et al .,
* Correspondence to: The Environment Agency of England & Wales, Anglian Region, Northern Area, Waterside House, WatersideNorth, Lincoln LN2 5HA, UK.
CCC 0886–9375/99/060543–32$17.50
Copyright © 1999 John Wiley & Sons, Ltd.
Recei ed 1 June 1998
Reised 5 October 1998
Accepted 24 March 1999

8/9/2019 LIFE Paper PDF
http://slidepdf.com/reader/full/life-paper-pdf 2/32
C.A. EXTENCE ET AL.544
1984; Wright and Berrie, 1987; Boulton and Lake, 1992; Wright, 1992; Miller and Golladay, 1996).
Alterations in community structure may occur as a direct consequence of varying flow patterns, or
indirectly through associated habitat change (Petts and Maddock, 1994; Petts and Bickerton, 1997a).
There have been comparatively few attempts to directly link observed changes in benthic invertebrate
communities with permutations in hydrological regime. A number of efforts have historically been made,
however, to utilize and adapt techniques designed to meet other needs, for the purpose of flow assessment.
Scott Wilson Kirkpatrick (1992), for example, considered that the water quality index Average Score perTaxon (Chesters, 1980) could be incorporated into a method to appraise low flow conditions, and a
number of initiatives (Armitage et al ., 1987; Brown et al ., 1991; Armitage and Petts, 1992) have used the
River InVertebrate Prediction And Classification System (RIVPACS) methodology (Wright et al ., 1984)
for assessing the effects of variable flows on macroinvertebrates. None of these approaches are, however,
currently able to provide a comprehensive and all embracing flow assessment method.
Explicit attempts to connect macroinvertebrate populations with flow conditions are less prevalent,
although two decades ago Jones and Peters (1977) made some headway in linking flows in unpolluted
British rivers to invertebrate community structure. More recently, Armitage (1995) has associated
community response with variable current velocities in experimental situations, and Petts and Bickerton
(1997a) provide a summary of detailed investigations into invertebrate/flow relationships in the River
Wissey, Norfolk.Despite these advances, there is still a need for a straightforward and reliable ecological assessment
method which is sensitive and responsive to varying flow patterns and that can be used with existing data.
This paper presents results obtained from a number of English rivers, after application of a new indexing
technique, based on the known flow preferences of selected British benthic macroinvertebrates. Such a
technique should enable the effects of low flows, as well as abstraction and augmentation outputs and
inputs, to be monitored and assessed. In addition, the method could provide a basis for setting benchmark
flows suitable for protecting and maintaining ecological integrity, thus overcoming some of the problems
associated with established techniques for setting hydroecological objectives, such as high costs and
inadequate ecological input.
SITES AND METHODS
Study sites
In order to critically examine the effectiveness of the proposed flow index, results from five geograph-
ically and geologically distinct rivers in England (Figure 1) are presented in detail. Data from a number
of other rivers routinely monitored by the UK Environment Agency (EA) are additionally provided in
summary form and, in these cases, study site details are more appropriately placed in the Results section.
Chalk rivers are now recognized as a key biodiversity habitat in Europe (HMSO, 1995a,b) and most
European rivers of this type are found in England, including the Lark and Waithe Beck (Anglian region)and the Kennet (Thames region). Waithe Beck, rising on the chalk uplands of the Lincolnshire Wolds at
117 m above Ordnance Datum (aOD), flows 27 km to the North Sea. Low flows, exacerbated by
groundwater abstraction, have characterized this high quality river over the last decade. A number of
long-term biological sampling points have been established on Waithe Beck, including Brigsley (TA 253
017) which is located close to a permanent flow gauging station (catchment area 108 km2).
The River Lark is also a high quality chalk stream, rising at 80 m aOD, and running in a northwesterly
direction, before joining the River Great Ouse in Cambridgeshire. The river, which has undergone
substantial habitat modification in the past (Barham, personal communication) has numerous abstrac-
tions from the chalk aquifer, and low flows are an increasing problem. Flow data for the Upper Lark
originated from the Fornham St. Martin gauging station (catchment area 110 km2) and family level
biological data were available from a nearby monitoring point at Fornham All Saints (TL 842 678).
Copyright © 1999 John Wiley & Sons, Ltd. Regul . Ri ers: Res. Mgmt. 15: 543–574 (1999)

8/9/2019 LIFE Paper PDF
http://slidepdf.com/reader/full/life-paper-pdf 3/32
RIVER FLOW INDEXING 545
With a catchment area of 1156 km2, the River Kennet is the largest single tributary of the Thames. The
river rises at 150 m aOD, and runs for 98 km before joining the Thames at Reading, Berkshire. The
Kennet is another high quality chalk stream, summer flow being principally provided from a number of
groundwater fed perennial tributaries. Periods of low winter rainfall have historically led to considerable
variation in flow source and volume. Three large public water supply boreholes are located close to the
river, and groundwater abstraction from these sources can total 50 ML a day. This demand on the chalk
aquifer can intensify low flow impacts, particularly during low rainfall/hot summer periods. Biological
data were available from several routine sampling points on the Kennet, including Stitchcombe Mill (SU
227 695), daily flows being gauged 7 km downstream from this point at Knighton (catchment area 295
km2).
Figure 1. Location map showing rivers and study sites
Copyright © 1999 John Wiley & Sons, Ltd. Regul . Ri ers: Res. Mgmt. 15: 543–574 (1999)
8/9/2019 LIFE Paper PDF
http://slidepdf.com/reader/full/life-paper-pdf 4/32
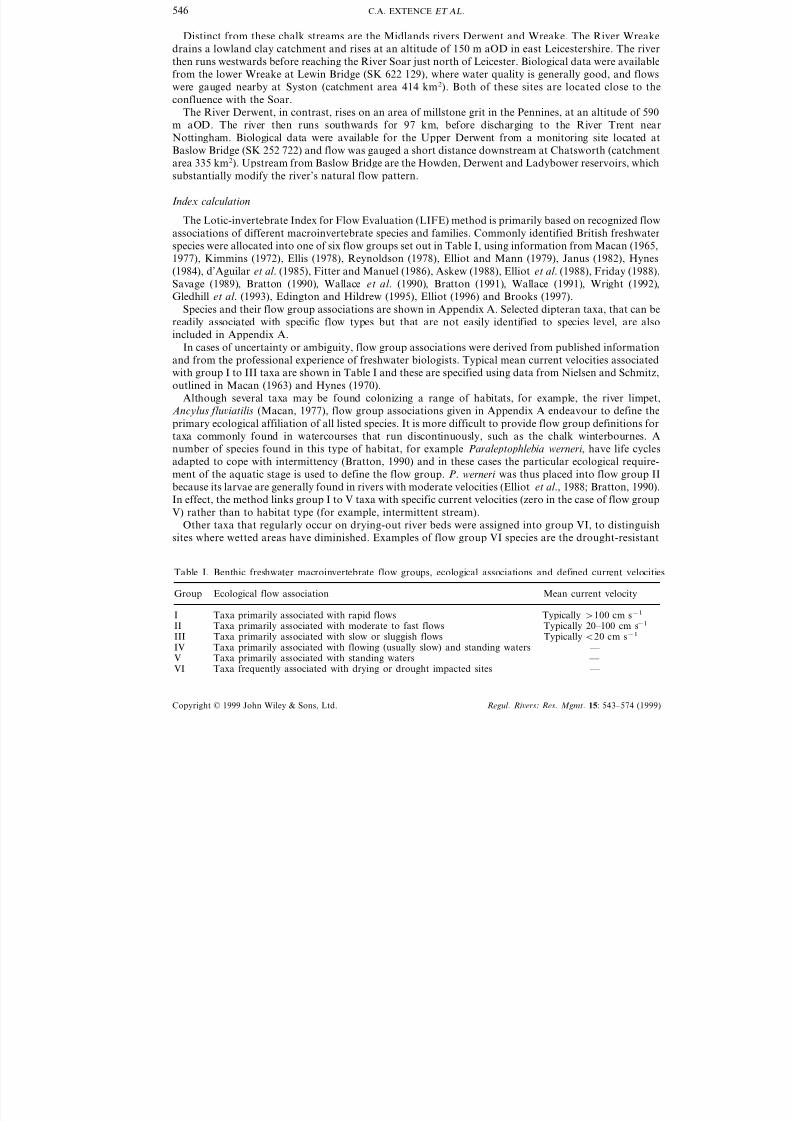
C.A. EXTENCE ET AL.546
Distinct from these chalk streams are the Midlands rivers Derwent and Wreake. The River Wreake
drains a lowland clay catchment and rises at an altitude of 150 m aOD in east Leicestershire. The river
then runs westwards before reaching the River Soar just north of Leicester. Biological data were available
from the lower Wreake at Lewin Bridge (SK 622 129), where water quality is generally good, and flows
were gauged nearby at Syston (catchment area 414 km2). Both of these sites are located close to the
confluence with the Soar.
The River Derwent, in contrast, rises on an area of millstone grit in the Pennines, at an altitude of 590
m aOD. The river then runs southwards for 97 km, before discharging to the River Trent near
Nottingham. Biological data were available for the Upper Derwent from a monitoring site located atBaslow Bridge (SK 252 722) and flow was gauged a short distance downstream at Chatsworth (catchment
area 335 km2). Upstream from Baslow Bridge are the Howden, Derwent and Ladybower reservoirs, which
substantially modify the river’s natural flow pattern.
Index calculation
The Lotic-invertebrate Index for Flow Evaluation (LIFE) method is primarily based on recognized flow
associations of different macroinvertebrate species and families. Commonly identified British freshwater
species were allocated into one of six flow groups set out in Table I, using information from Macan (1965,
1977), Kimmins (1972), Ellis (1978), Reynoldson (1978), Elliot and Mann (1979), Janus (1982), Hynes
(1984), d’Aguilar et al . (1985), Fitter and Manuel (1986), Askew (1988), Elliot et al . (1988), Friday (1988),Savage (1989), Bratton (1990), Wallace et al . (1990), Bratton (1991), Wallace (1991), Wright (1992),
Gledhill et al . (1993), Edington and Hildrew (1995), Elliot (1996) and Brooks (1997).
Species and their flow group associations are shown in Appendix A. Selected dipteran taxa, that can be
readily associated with specific flow types but that are not easily identified to species level, are also
included in Appendix A.
In cases of uncertainty or ambiguity, flow group associations were derived from published information
and from the professional experience of freshwater biologists. Typical mean current velocities associated
with group I to III taxa are shown in Table I and these are specified using data from Nielsen and Schmitz,
outlined in Macan (1963) and Hynes (1970).
Although several taxa may be found colonizing a range of habitats, for example, the river limpet,
Ancylus flu
iatilis (Macan, 1977), flow group associations given in Appendix A endeavour to define theprimary ecological affiliation of all listed species. It is more difficult to provide flow group definitions for
taxa commonly found in watercourses that run discontinuously, such as the chalk winterbournes. A
number of species found in this type of habitat, for example Paraleptophlebia werneri , have life cycles
adapted to cope with intermittency (Bratton, 1990) and in these cases the particular ecological require-
ment of the aquatic stage is used to define the flow group. P. werneri was thus placed into flow group II
because its larvae are generally found in rivers with moderate velocities (Elliot et al ., 1988; Bratton, 1990).
In effect, the method links group I to V taxa with specific current velocities (zero in the case of flow group
V) rather than to habitat type (for example, intermittent stream).
Other taxa that regularly occur on drying-out river beds were assigned into group VI, to distinguish
sites where wetted areas have diminished. Examples of flow group VI species are the drought-resistant
Table I. Benthic freshwater macroinvertebrate flow groups, ecological associations and defined current velocities
Group Ecological flow association Mean current velocity
Typically 100 cm s−1Taxa primarily associated with rapid flowsITaxa primarily associated with moderate to fast flows Typically 20–100 cm s−1II
III Taxa primarily associated with slow or sluggish flows Typically 20 cm s−1
IV Taxa primarily associated with flowing (usually slow) and standing waters — Taxa primarily associated with standing waters — V
VI Taxa frequently associated with drying or drought impacted sites —
Copyright © 1999 John Wiley & Sons, Ltd. Regul . Ri ers: Res. Mgmt. 15: 543–574 (1999)

8/9/2019 LIFE Paper PDF
http://slidepdf.com/reader/full/life-paper-pdf 5/32
RIVER FLOW INDEXING 547
amphibious gastropod Lymnaea palustris (Janus, 1982) and the dytiscid beetle Agabus biguttatus. A.
biguttatus moves underground as surface water disappears (Foster, 1980) and the species is a good
indicator of intermittent flow.
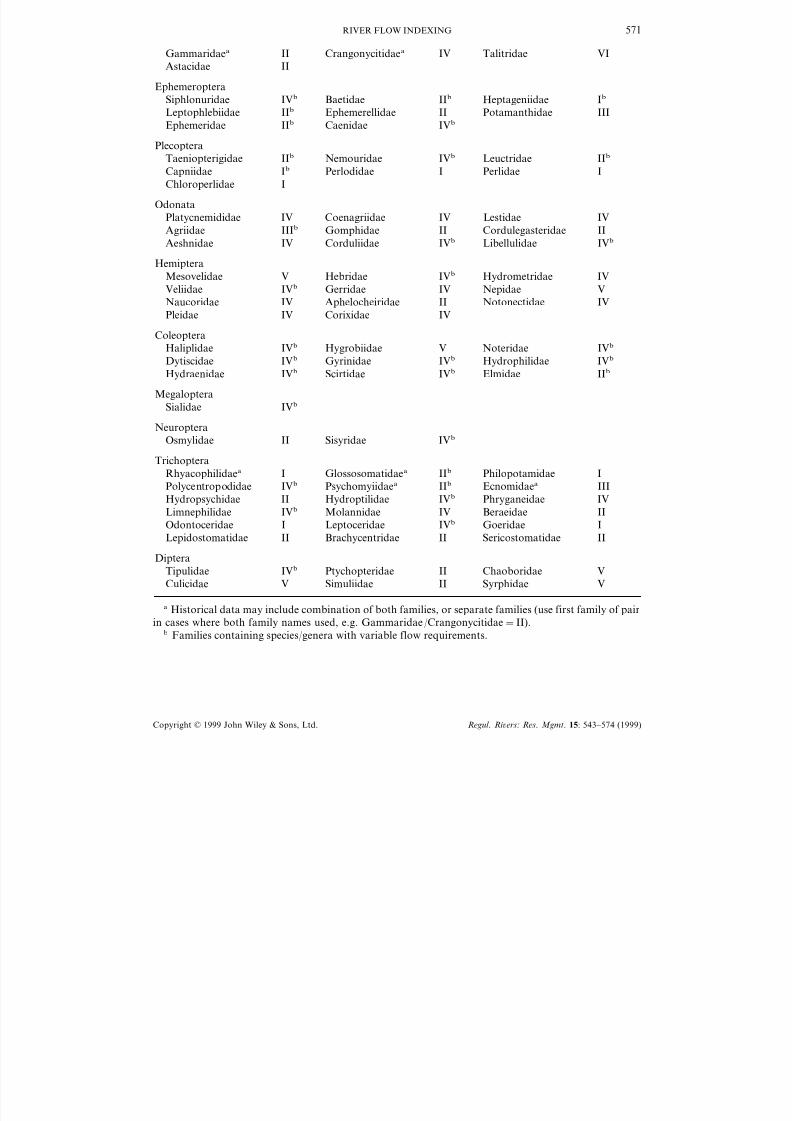
Where species data are unavailable, it is possible to work at family level, and family flow group
associations are shown in Appendix B. The use of family level data may result in a loss of precision, since
a number of families (marked b in Appendix B) contain species with fairly wide-ranging flow
requirements.Ubiquitous taxa such as Chironomidae and Oligochaeta are not used in this method, since there
appears to be no definitive relationship between flow and chironomid/oligochaete abundance at this level
of taxonomic resolution (Extence, 1981; Ladle and Bass, 1981; Cowx et al ., 1984; Wright, 1992; Miller and
Golladay, 1996).
Benthic macroinvertebrate data were derived from samples taken following standard EA protocols
(Murray-Bligh, 1997) at riffle sites. These techniques require timed 3 min kick/sweep net sampling of all
habitats, and different habitats are sampled in proportion to their occurrence. Environmental change
linked to flow, such as siltation and the build up of macrophytes, are thus effectively accounted for.
Agency procedures also include techniques for assessing population size (Murray-Bligh, 1997) thereby
providing mechanisms for incorporating quantitative change into the LIFE method. Standard EA
abundance classes are shown in Table II, and the abundance of all taxa present in a sample should be
estimated following these guidelines.
The LIFE calculation involves individual flow scores ( fs ) for each scoring taxon present in a sample
being obtained from the matrix shown in Table III, by using estimated abundancies (Table II) and defined
flow group associations (Appendices A and B). The matrix design in Table III is based on the
infrastructure of the biotic score system proposed by Chandler (1970) for assessing water quality.
Table II. Standard EA macroinvertebrate
abundance categories
Estimated abundanceCategory
A 1–910–99B
C 100–999D 1000–9999E 10 000+
Table III. Scores ( fs ) for different abundance categories of taxa associated with flowgroups I–VI
Abundance categoriesFlow groups
D/ECBA
9Rapid 11I 10 12II Moderate/fast 8 9 10 11III Slow/sluggish 7 7 7 7
3IV 456Flowing/standing2345StandingV
1VI 234Drought resistant
Copyright © 1999 John Wiley & Sons, Ltd. Regul . Ri ers: Res. Mgmt. 15: 543–574 (1999)
8/9/2019 LIFE Paper PDF
http://slidepdf.com/reader/full/life-paper-pdf 6/32
C.A. EXTENCE ET AL.548
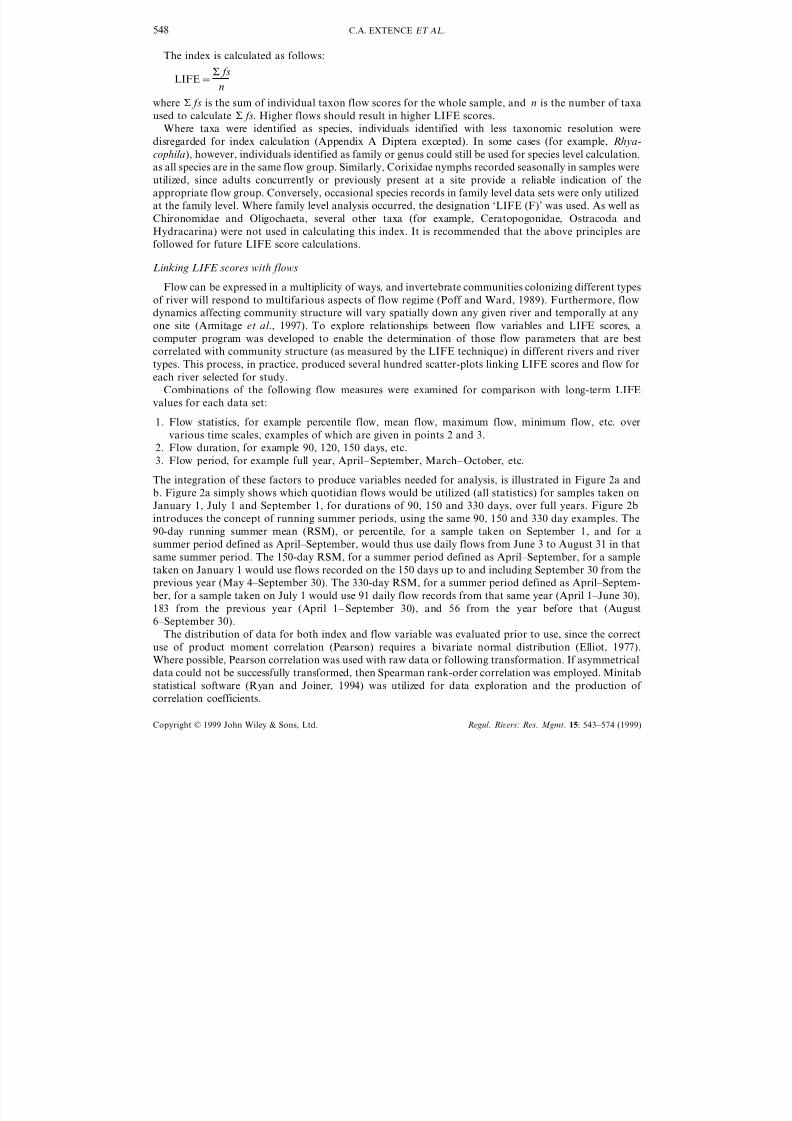
The index is calculated as follows:
LIFE= fs
n
where fs is the sum of individual taxon flow scores for the whole sample, and n is the number of taxa
used to calculate fs. Higher flows should result in higher LIFE scores.
Where taxa were identified as species, individuals identified with less taxonomic resolution were
disregarded for index calculation (Appendix A Diptera excepted). In some cases (for example, Rhya-cophila), however, individuals identified as family or genus could still be used for species level calculation,
as all species are in the same flow group. Similarly, Corixidae nymphs recorded seasonally in samples were
utilized, since adults concurrently or previously present at a site provide a reliable indication of the
appropriate flow group. Conversely, occasional species records in family level data sets were only utilized
at the family level. Where family level analysis occurred, the designation ‘LIFE (F)’ was used. As well as
Chironomidae and Oligochaeta, several other taxa (for example, Ceratopogonidae, Ostracoda and
Hydracarina) were not used in calculating this index. It is recommended that the above principles are
followed for future LIFE score calculations.
Linking LIFE scores with flows
Flow can be expressed in a multiplicity of ways, and invertebrate communities colonizing different types
of river will respond to multifarious aspects of flow regime (Poff and Ward, 1989). Furthermore, flow
dynamics affecting community structure will vary spatially down any given river and temporally at any
one site (Armitage et al ., 1997). To explore relationships between flow variables and LIFE scores, a
computer program was developed to enable the determination of those flow parameters that are best
correlated with community structure (as measured by the LIFE technique) in different rivers and river
types. This process, in practice, produced several hundred scatter-plots linking LIFE scores and flow for
each river selected for study.
Combinations of the following flow measures were examined for comparison with long-term LIFE
values for each data set:
1. Flow statistics, for example percentile flow, mean flow, maximum flow, minimum flow, etc. over
various time scales, examples of which are given in points 2 and 3.
2. Flow duration, for example 90, 120, 150 days, etc.
3. Flow period, for example full year, April– September, March– October, etc.
The integration of these factors to produce variables needed for analysis, is illustrated in Figure 2a and
b. Figure 2a simply shows which quotidian flows would be utilized (all statistics) for samples taken on
January 1, July 1 and September 1, for durations of 90, 150 and 330 days, over full years. Figure 2b
introduces the concept of running summer periods, using the same 90, 150 and 330 day examples. The
90-day running summer mean (RSM), or percentile, for a sample taken on September 1, and for a
summer period defined as April–September, would thus use daily flows from June 3 to August 31 in that
same summer period. The 150-day RSM, for a summer period defined as April–September, for a sampletaken on January 1 would use flows recorded on the 150 days up to and including September 30 from the
previous year (May 4–September 30). The 330-day RSM, for a summer period defined as April–Septem-
ber, for a sample taken on July 1 would use 91 daily flow records from that same year (April 1–June 30),
183 from the previous year (April 1– September 30), and 56 from the year before that (August
6–September 30).
The distribution of data for both index and flow variable was evaluated prior to use, since the correct
use of product moment correlation (Pearson) requires a bivariate normal distribution (Elliot, 1977).
Where possible, Pearson correlation was used with raw data or following transformation. If asymmetrical
data could not be successfully transformed, then Spearman rank-order correlation was employed. Minitab
statistical software (Ryan and Joiner, 1994) was utilized for data exploration and the production of
correlation coefficients.
Copyright © 1999 John Wiley & Sons, Ltd. Regul . Ri ers: Res. Mgmt. 15: 543–574 (1999)
8/9/2019 LIFE Paper PDF
http://slidepdf.com/reader/full/life-paper-pdf 7/32
RIVER FLOW INDEXING 549
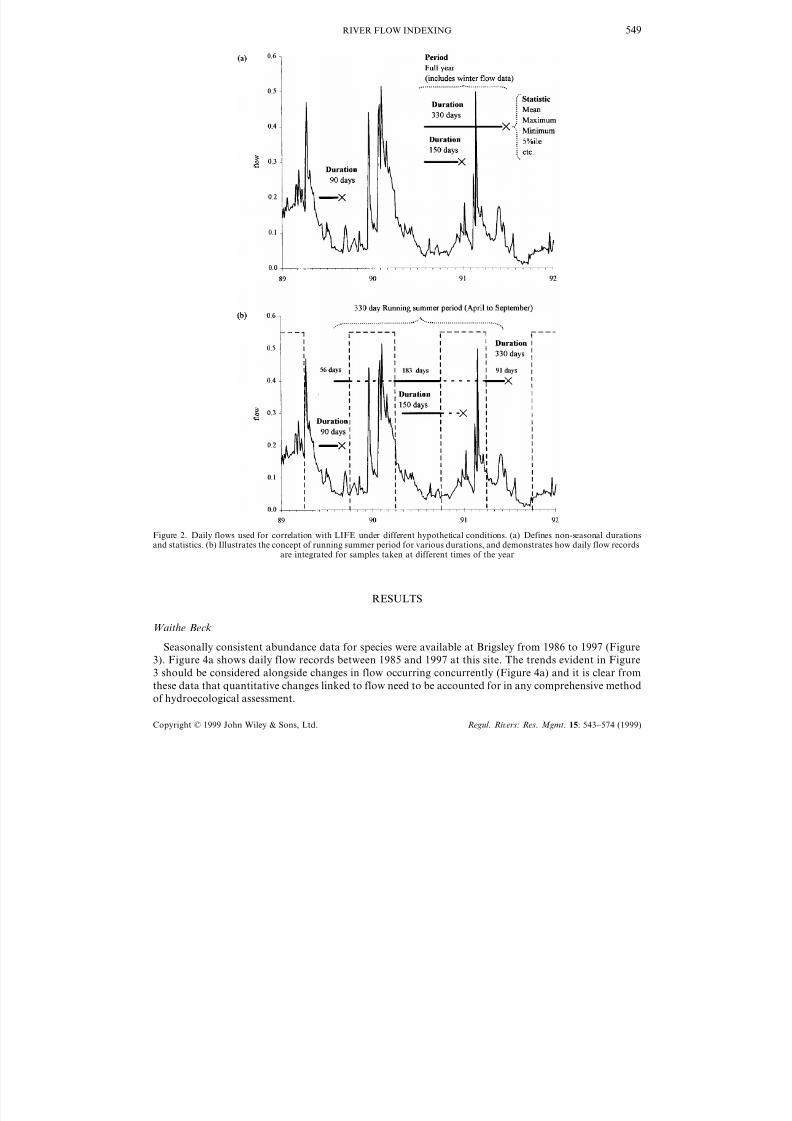
Figure 2. Daily flows used for correlation with LIFE under different hypothetical conditions. (a) Defines non-seasonal durationsand statistics. (b) Illustrates the concept of running summer period for various durations, and demonstrates how daily flow records
are integrated for samples taken at different times of the year
RESULTS
Waithe Beck
Seasonally consistent abundance data for species were available at Brigsley from 1986 to 1997 (Figure
3). Figure 4a shows daily flow records between 1985 and 1997 at this site. The trends evident in Figure
3 should be considered alongside changes in flow occurring concurrently (Figure 4a) and it is clear from
these data that quantitative changes linked to flow need to be accounted for in any comprehensive method
of hydroecological assessment.
Copyright © 1999 John Wiley & Sons, Ltd. Regul . Ri ers: Res. Mgmt. 15: 543–574 (1999)
8/9/2019 LIFE Paper PDF
http://slidepdf.com/reader/full/life-paper-pdf 8/32
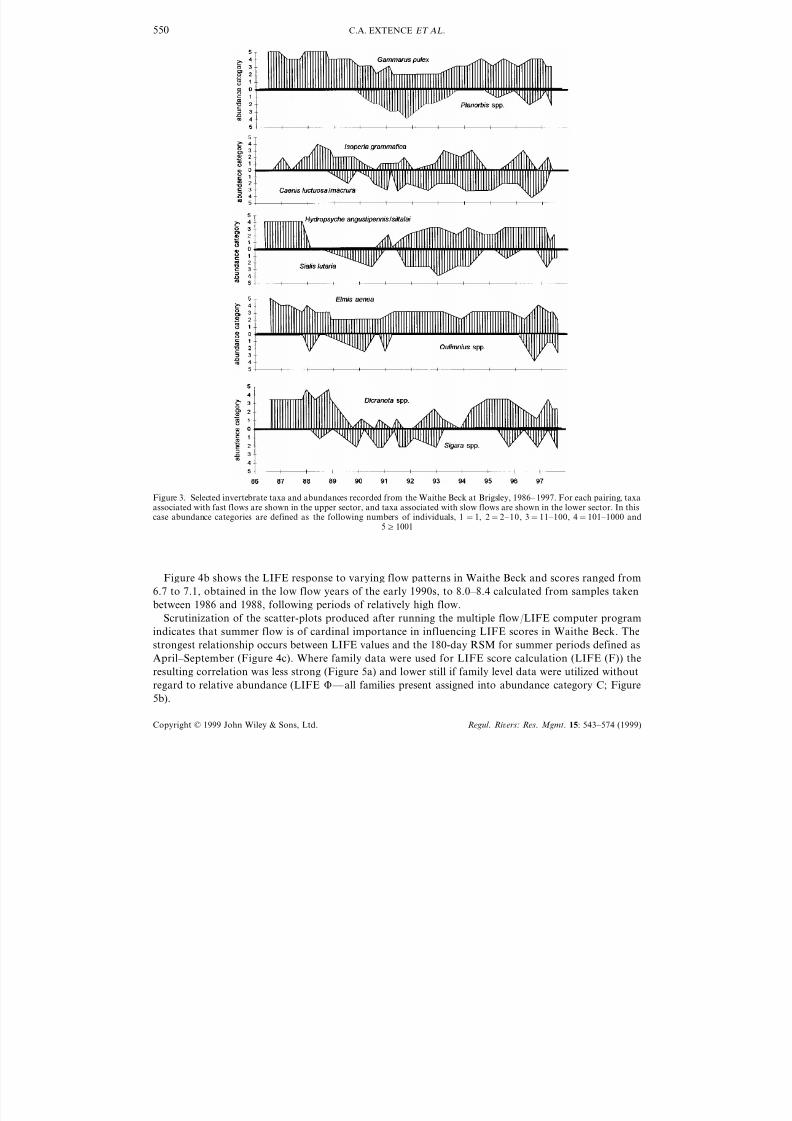
C.A. EXTENCE ET AL.550
Figure 3. Selected invertebrate taxa and abundances recorded from the Waithe Beck at Brigsley, 1986– 1997. For each pairing, taxaassociated with fast flows are shown in the upper sector, and taxa associated with slow flows are shown in the lower sector. In thiscase abundance categories are defined as the following numbers of individuals, 1=1, 2=2–10, 3=11–100, 4=101–1000 and
51001
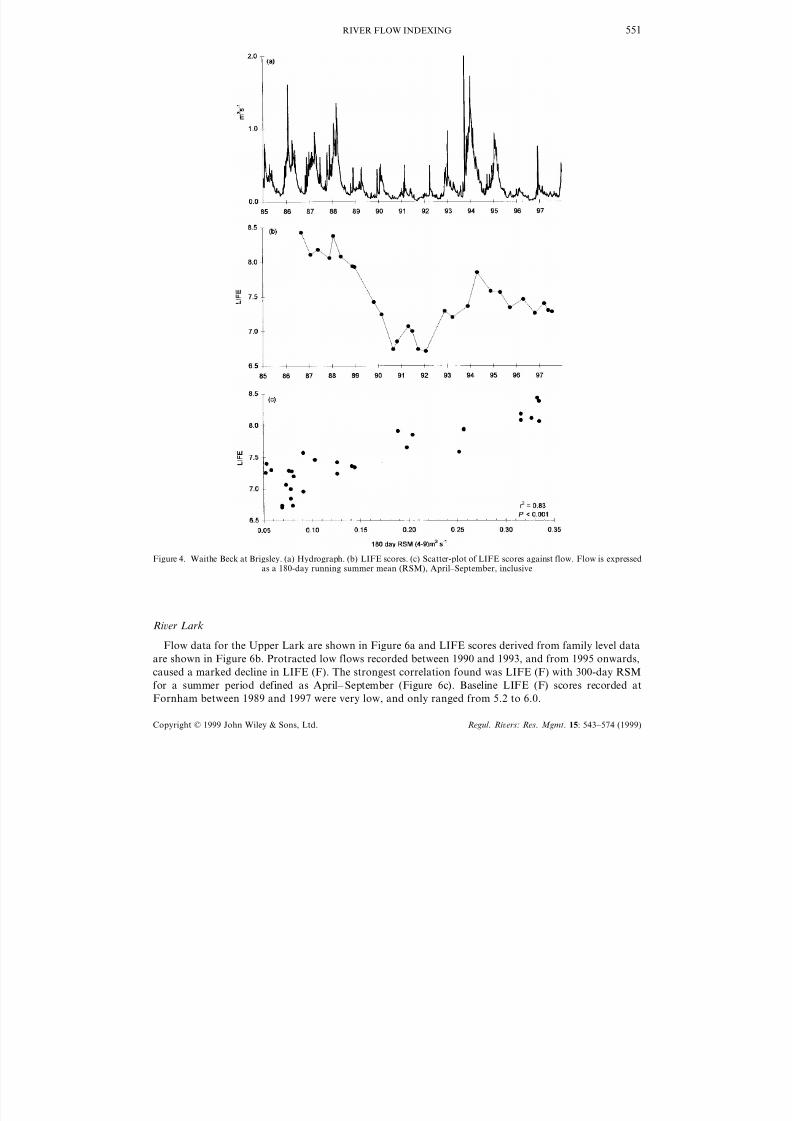
Figure 4b shows the LIFE response to varying flow patterns in Waithe Beck and scores ranged from
6.7 to 7.1, obtained in the low flow years of the early 1990s, to 8.0–8.4 calculated from samples taken
between 1986 and 1988, following periods of relatively high flow.
Scrutinization of the scatter-plots produced after running the multiple flow/LIFE computer program
indicates that summer flow is of cardinal importance in influencing LIFE scores in Waithe Beck. The
strongest relationship occurs between LIFE values and the 180-day RSM for summer periods defined as
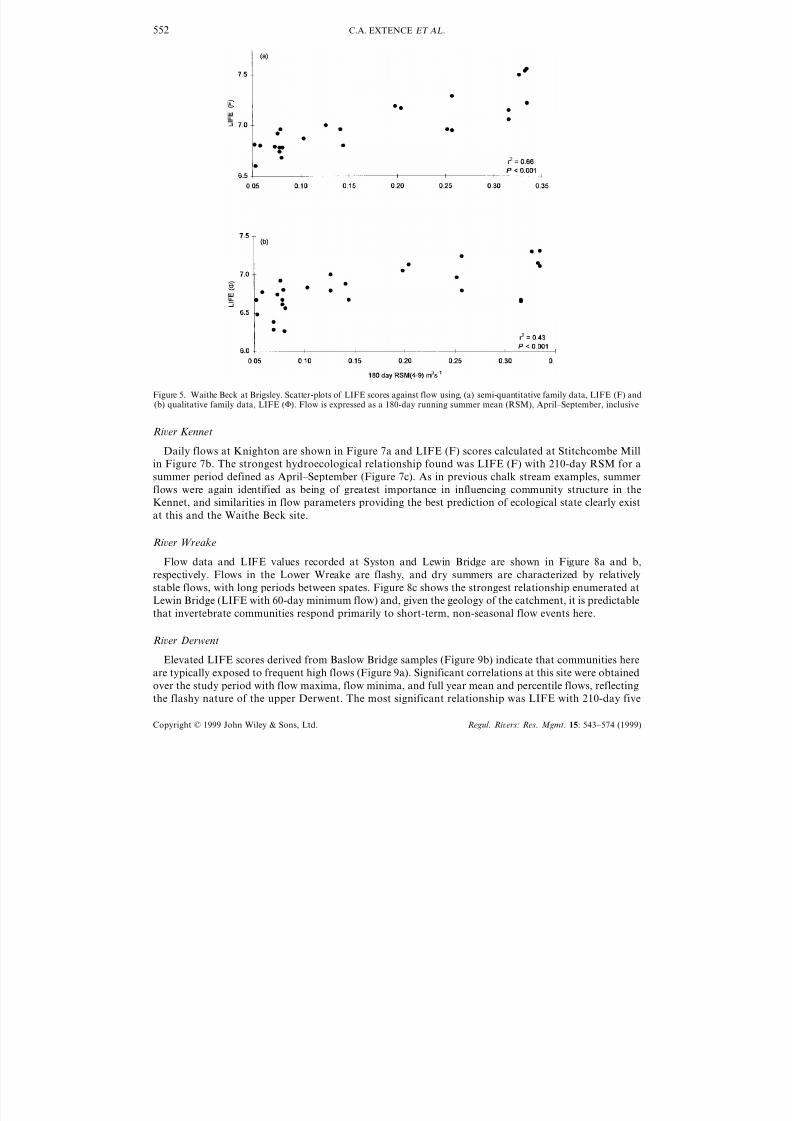
April–September (Figure 4c). Where family data were used for LIFE score calculation (LIFE (F)) the
resulting correlation was less strong (Figure 5a) and lower still if family level data were utilized without
regard to relative abundance (LIFE — all families present assigned into abundance category C; Figure
5b).
Copyright © 1999 John Wiley & Sons, Ltd. Regul . Ri ers: Res. Mgmt. 15: 543–574 (1999)
8/9/2019 LIFE Paper PDF
http://slidepdf.com/reader/full/life-paper-pdf 9/32
RIVER FLOW INDEXING 551
Figure 4. Waithe Beck at Brigsley. (a) Hydrograph. (b) LIFE scores. (c) Scatter-plot of LIFE scores against flow. Flow is expressedas a 180-day running summer mean (RSM), April–September, inclusive
Ri er Lark
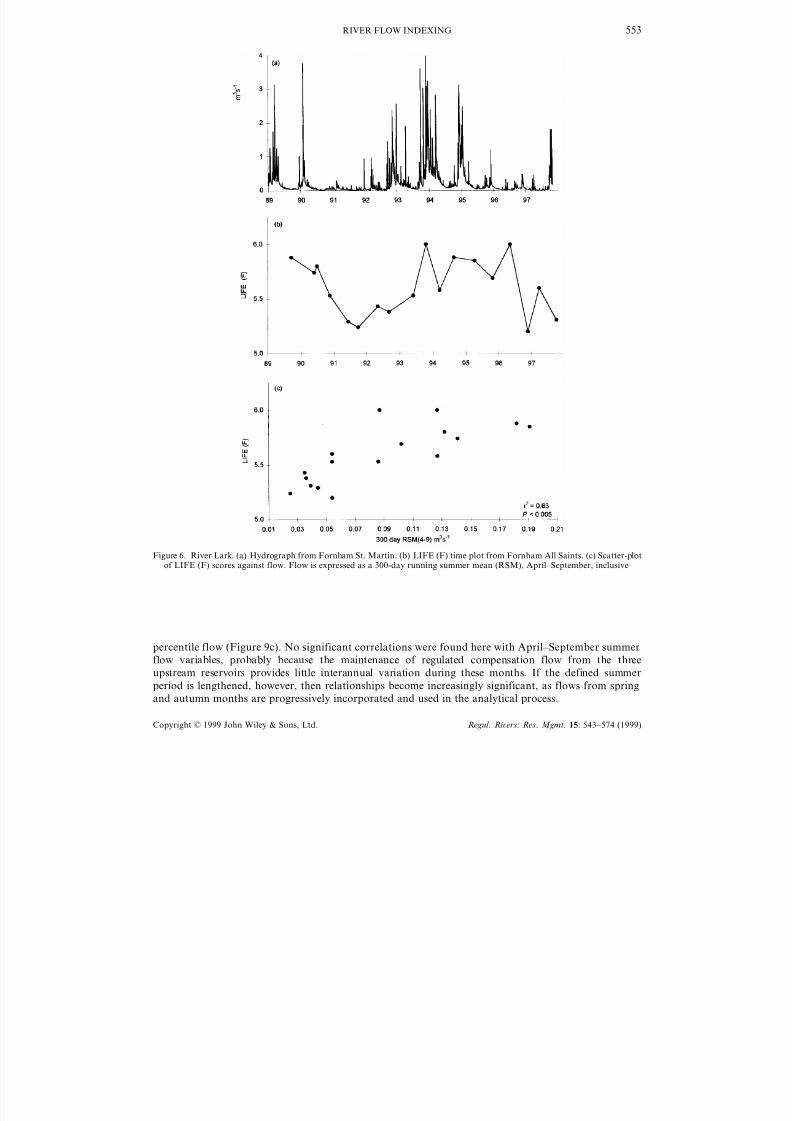
Flow data for the Upper Lark are shown in Figure 6a and LIFE scores derived from family level data
are shown in Figure 6b. Protracted low flows recorded between 1990 and 1993, and from 1995 onwards,
caused a marked decline in LIFE (F). The strongest correlation found was LIFE (F) with 300-day RSM
for a summer period defined as April– September (Figure 6c). Baseline LIFE (F) scores recorded at
Fornham between 1989 and 1997 were very low, and only ranged from 5.2 to 6.0.
Copyright © 1999 John Wiley & Sons, Ltd. Regul . Ri ers: Res. Mgmt. 15: 543–574 (1999)
8/9/2019 LIFE Paper PDF
http://slidepdf.com/reader/full/life-paper-pdf 10/32
C.A. EXTENCE ET AL.552
Figure 5. Waithe Beck at Brigsley. Scatter-plots of LIFE scores against flow using, (a) semi-quantitative family data, LIFE (F) and(b) qualitative family data, LIFE (). Flow is expressed as a 180-day running summer mean (RSM), April–September, inclusive
Ri er Kennet
Daily flows at Knighton are shown in Figure 7a and LIFE (F) scores calculated at Stitchcombe Mill
in Figure 7b. The strongest hydroecological relationship found was LIFE (F) with 210-day RSM for a
summer period defined as April–September (Figure 7c). As in previous chalk stream examples, summer
flows were again identified as being of greatest importance in influencing community structure in the
Kennet, and similarities in flow parameters providing the best prediction of ecological state clearly exist
at this and the Waithe Beck site.
Ri er Wreake
Flow data and LIFE values recorded at Syston and Lewin Bridge are shown in Figure 8a and b,
respectively. Flows in the Lower Wreake are flashy, and dry summers are characterized by relatively
stable flows, with long periods between spates. Figure 8c shows the strongest relationship enumerated at
Lewin Bridge (LIFE with 60-day minimum flow) and, given the geology of the catchment, it is predictable
that invertebrate communities respond primarily to short-term, non-seasonal flow events here.
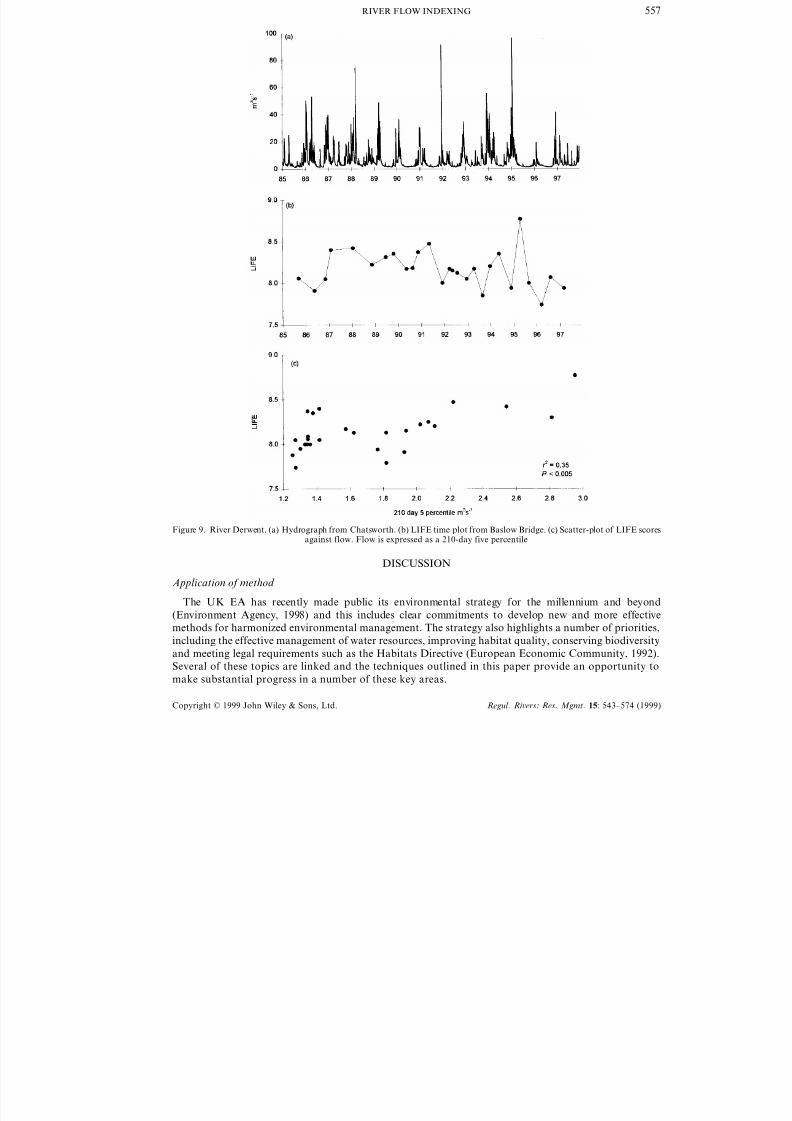
Ri er Derwent
Elevated LIFE scores derived from Baslow Bridge samples (Figure 9b) indicate that communities here
are typically exposed to frequent high flows (Figure 9a). Significant correlations at this site were obtained
over the study period with flow maxima, flow minima, and full year mean and percentile flows, reflecting
the flashy nature of the upper Derwent. The most significant relationship was LIFE with 210-day five
Copyright © 1999 John Wiley & Sons, Ltd. Regul . Ri ers: Res. Mgmt. 15: 543–574 (1999)
8/9/2019 LIFE Paper PDF
http://slidepdf.com/reader/full/life-paper-pdf 11/32
RIVER FLOW INDEXING 553
Figure 6. River Lark. (a) Hydrograph from Fornham St. Martin. (b) LIFE (F) time plot from Fornham All Saints. (c) Scatter-plotof LIFE (F) scores against flow. Flow is expressed as a 300-day running summer mean (RSM), April–September, inclusive
percentile flow (Figure 9c). No significant correlations were found here with April–September summer
flow variables, probably because the maintenance of regulated compensation flow from the three
upstream reservoirs provides little interannual variation during these months. If the defined summer
period is lengthened, however, then relationships become increasingly significant, as flows from spring
and autumn months are progressively incorporated and used in the analytical process.
Copyright © 1999 John Wiley & Sons, Ltd. Regul . Ri ers: Res. Mgmt. 15: 543–574 (1999)

8/9/2019 LIFE Paper PDF
http://slidepdf.com/reader/full/life-paper-pdf 12/32
C.A. EXTENCE ET AL.554
Figure 7. River Kennet. (a) Hydrograph from Knighton. (b) LIFE (F) time plot from Stitchcombe Mill. (c) Scatter-plot of LIFE(F) scores against flow. Flow is expressed as a 210-day running summer mean (RSM), April to September, inclusive
Other examples
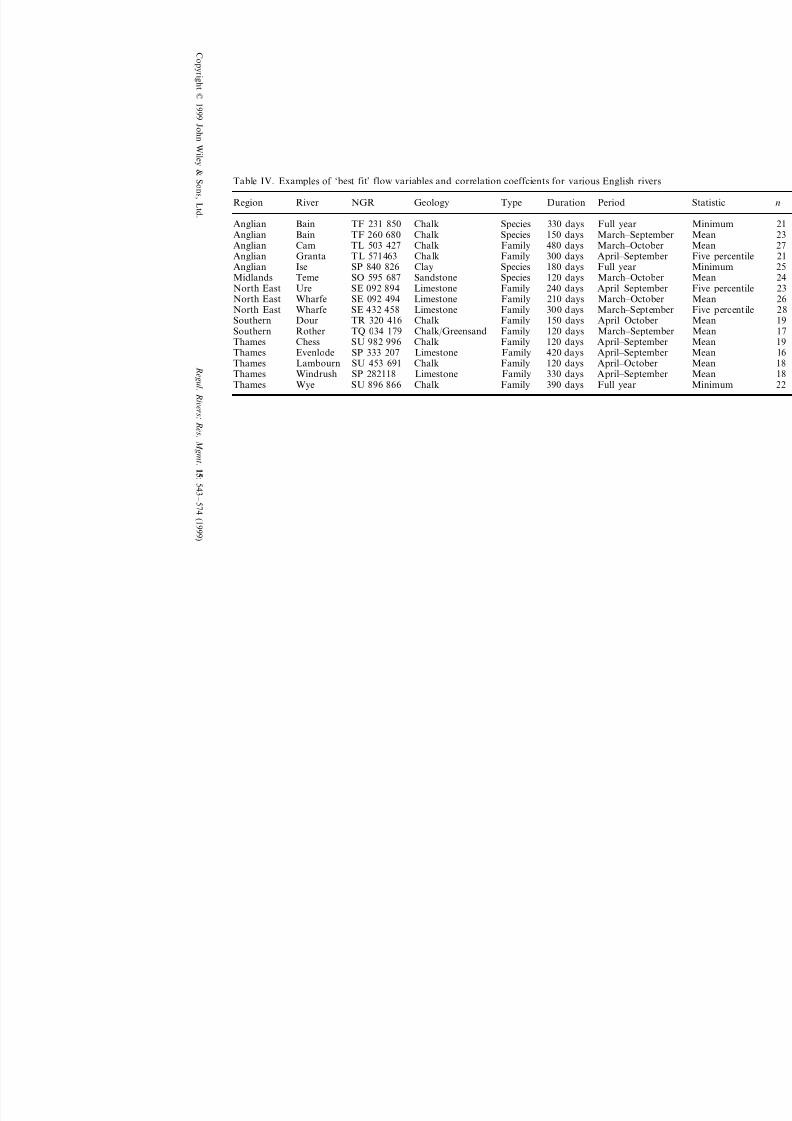
Relationships between flow parameters and LIFE values have been analysed for a variety of additional
rivers in England (Figure 1). It is not intended to examine these data in detail, but some examples of
further results obtained are summarized in Table IV. Flow variables shown in this table are those
providing the best prediction of LIFE score.
Confirmation of the importance of summer flows in influencing chalk stream ecology is provided by
these results, although different flow variables gave the strongest correlations (probably because of
dissimilar aquifer characteristics, discharge regimes and habitat structure in the rivers in question).
Copyright © 1999 John Wiley & Sons, Ltd. Regul . Ri ers: Res. Mgmt. 15: 543–574 (1999)
8/9/2019 LIFE Paper PDF
http://slidepdf.com/reader/full/life-paper-pdf 13/32
C o p yr i gh t ©1 9 9 9 J oh n Wi l e y & S on s ,L t d .
R e g u l .R i
e r s :
R e s .M g m t .1 5 : 5 4 3 – 5 7 4
( 1 9 9 9 )
Table IV. Examples of ‘best fit’ flow variables and correlation coeffcients for various English rivers
Geology Type Duration Period River NGRRegion
Chalk Species 330 days Full year BainAnglian TF 231 850150 days March–SeptemberSpeciesChalkTF 260 680BainAnglian480 days March–October Anglian Cam TL 503 427 Chalk Family300 days April–September FamilyTL 571463 ChalkAnglian Granta
SpeciesAnglian 180 days Full year Ise SP 840 826 Clay
SpeciesMidlands 120 days March–October Teme SO 595 687 Sandstone240 days April–September FamilyLimestoneSE 092 894UreNorth East
Limestone Family 210 days March–October Wharfe SE 092 494North East300 days March–September FamilyNorth East LimestoneSE 432 458Wharfe
FamilySouthern 150 days April–October Dour TR 320 416 ChalkFamilySouthern 120 days March–SeptemberRother TQ 034 179 Chalk/Greensand
120 days April–September FamilyChalkSU 982 996ChessThames420 daysThames April–SeptemberEvenlode SP 333 207 Limestone Family120 days April–October FamilyChalkThames Lambourn SU 453 691330 days April–September Thames Windrush SP 282118 Limestone Family390 days Full year FamilyThames Wye ChalkSU 896 866
8/9/2019 LIFE Paper PDF
http://slidepdf.com/reader/full/life-paper-pdf 14/32
C.A. EXTENCE ET AL.556
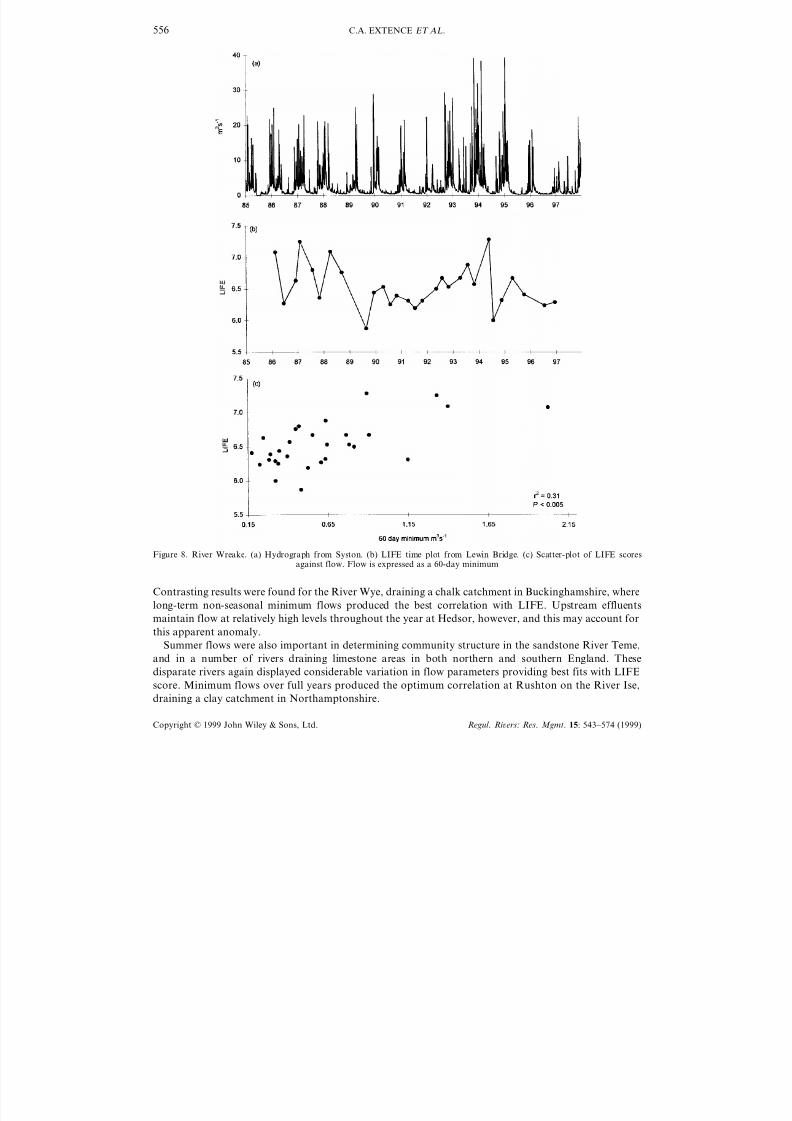
Figure 8. River Wreake. (a) Hydrograph from Syston. (b) LIFE time plot from Lewin Bridge. (c) Scatter-plot of LIFE scoresagainst flow. Flow is expressed as a 60-day minimum
Contrasting results were found for the River Wye, draining a chalk catchment in Buckinghamshire, where
long-term non-seasonal minimum flows produced the best correlation with LIFE. Upstream effluents
maintain flow at relatively high levels throughout the year at Hedsor, however, and this may account for
this apparent anomaly.
Summer flows were also important in determining community structure in the sandstone River Teme,
and in a number of rivers draining limestone areas in both northern and southern England. These
disparate rivers again displayed considerable variation in flow parameters providing best fits with LIFE
score. Minimum flows over full years produced the optimum correlation at Rushton on the River Ise,
draining a clay catchment in Northamptonshire.
Copyright © 1999 John Wiley & Sons, Ltd. Regul . Ri ers: Res. Mgmt. 15: 543–574 (1999)
8/9/2019 LIFE Paper PDF
http://slidepdf.com/reader/full/life-paper-pdf 15/32
RIVER FLOW INDEXING 557
Figure 9. River Derwent. (a) Hydrograph from Chatsworth. (b) LIFE time plot from Baslow Bridge. (c) Scatter-plot of LIFE scoresagainst flow. Flow is expressed as a 210-day five percentile
DISCUSSION
Application of method
The UK EA has recently made public its environmental strategy for the millennium and beyond
(Environment Agency, 1998) and this includes clear commitments to develop new and more effective
methods for harmonized environmental management. The strategy also highlights a number of priorities,
including the effective management of water resources, improving habitat quality, conserving biodiversity
and meeting legal requirements such as the Habitats Directive (European Economic Community, 1992).
Several of these topics are linked and the techniques outlined in this paper provide an opportunity to
make substantial progress in a number of these key areas.
Copyright © 1999 John Wiley & Sons, Ltd. Regul . Ri ers: Res. Mgmt. 15: 543–574 (1999)

8/9/2019 LIFE Paper PDF
http://slidepdf.com/reader/full/life-paper-pdf 16/32
C.A. EXTENCE ET AL.558
The advantages and use of benthic macroinvertebrates in environmental assessment are long established
(Cairns and Pratt, 1993) and the proposed LIFE method offers new opportunities to utilize key taxa in
highly topical hydroecological work. Results presented here show LIFE to be robust (working at variable
levels of resolution — Figures 4c, 5a and b) and very effective in encapsulating ecological response to
changing flow patterns in a range of river types. The method can thus be used to summarize the multiple
effects of flow on invertebrate populations, much as biotic indices have historically been used to integrate
water quality effects. This positive response occurs despite the fact that the flow data used in the LIFE
method may not necessarily be the flows to which benthic macroinvertebrates are normally exposed
because of the complex interactions that exist between river hydraulics, habitat morphology and habitatcomposition (Gore, 1996).
It is clear that baseline LIFE values are inextricably linked with the geographical location of the
biological sampling site. Upland rivers like the Derwent thus support proportionally more taxa associated
with fast current velocities (and consequently produce higher LIFE scores) than lower altitude rivers, like
the Wreake or Waithe Beck (Figures 4b, 8b and 9b). Analysis has, moreover, shown that on rivers like
the Lincolnshire Bain, where a number of biological sampling sites are established, LIFE scores show a
progressive downstream decline as current velocities diminish and associated habitat features change.
LIFE values enumerated at individual sites will be further influenced by the quantity and quality of
instream habitat available for invertebrate colonization. In this context, it is of interest to note that, even
during periods of relatively high flow, LIFE (F) scores at Fornham on the channelized River Lark (Figure6c) were poor compared with family derived scores obtained at all times from other chalk stream sites on
the Kennet (Figure 7c) and Waithe Beck (Figure 5a). This variability may be explained by a number of
factors, including geological and structural differences between disparate rivers, the latter being strongly
influenced by past and present engineering practices and policies.
A number of authors have recently made efforts to quantify the hydroecological link, including
Bickerton (1995) who demonstrated that mean flows in April and low flows prior to sample collection on
the River Glen, Lincolnshire, could be linked to the summer invertebrate fauna, at both the community
and the individual taxon level. An alternative approach has been described by Clausen and Biggs (1997)
who examined the relationship between a number of biotic measures, including invertebrate density and
diversity, and 34 hydrological variables in New Zealand streams. This work has several features in
common with the present study, including the production of a range of hydroecological correlationcoefficients, and the subsequent determination of ecologically-relevant flow variables. The LIFE method-
ology, however, offers substantial progress in this area, most notably in enabling the performance of an
extended range of flow measures to be assessed against an index specifically designed to reflect flow
variation, and not simply to general measures of community structure, such as species richness or
diversity.
The LIFE software currently produces several hundred different scatter-plots at each site being
evaluated, and this procedure can be shortened or expanded as appropriate. The output from this process
provides a wealth of salient data, permitting the in-depth evaluation of hydroecological relationships. At
Brigsley on the Waithe Beck, for example, there are 177 separate correlation coeffficients significant at
p
0.001, 13 at p
0.005, six at p
0.01, ten at p
0.05 and eight correlations that are non-significant,for the period 1986–1997. From this surfeit of usable statistics, those flow variables showing the best
relationships with the invertebrate fauna are proposed as being of primary importance in determining
community structure in particular river systems.
In most cases considered so far, single flow variables account very effectively for much of the ecological
variation exhibited at individual river sites. Where data are normally distributed, or can be transformed
to approximate normality, flow variables can be combined using multiple regression to produce a more
comprehensive description of the flow factors influencing the invertebrate community. For example, LIFE
scores obtained from the Lincolnshire Bain (TF 235 743) correlate separately with 180-day RSM
(April–September) and 30-day minimum (both p0.005). These variables can be combined to increase
the level of significance to p0.001 (based on adjusted r2 values).
Copyright © 1999 John Wiley & Sons, Ltd. Regul . Ri ers: Res. Mgmt. 15: 543–574 (1999)
8/9/2019 LIFE Paper PDF
http://slidepdf.com/reader/full/life-paper-pdf 17/32
RIVER FLOW INDEXING 559
The facility to enhance the general ecopredictive power of the various flow components may be worth
exploiting at selected river sites, and this approach could ultimately help define multiple flow objectives
in appropriate cases. An alternative way forward involves exploration of the interrelationships between
correlation coefficients derived from single flow variables. This process can provide added insight, for
example, demonstrating the possible importance of spring and autumn flow periods in determining
community structure in the River Derwent.
Setting hydroecological objecti es
Producing an extended range of correlations between LIFE and hydrological parameters identifies
different key flow variables in contrasting types of river. Summer flows are thus pinpointed as being of
paramount importance in chalk and limestone streams, as are short-term flow events in rivers like the
Wreake, draining impermeable catchments. Provided significant relationships exist between hydrological
and ecological variables, these distinct responses provide the opportunity to set flow objectives that are
ecologically relevant. This process is far from straightforward (see Future Work section) but detailed
evaluation of results should enable provisional targets to be set for most sites. On several rivers, for
example, the relationship between key flow parameters and LIFE deteriorates during periods of prolonged
drought, and this is well-illustrated at Brigsley on the Waithe Beck (Figure 4c) where such conditionsresult in LIFE scores becoming independent of flows. In this case, examination of the residuals produced
during regression analysis identifies several outliers that correspond to periods of extreme drought. These
points can justifiably be removed from the main data set and used to define flow and ecological
thresholds, below which significant ‘damage’ occurs. Flow thresholds identified in this way must be
evaluated against long-term hydrological records before being incorporated into any targeting procedure.
The use of twinned targets is advocated because failure to meet the hydrological objective may not
necessarily result in an equivalent failure to attain the ecological standard (ecological response will lag
behind hydrological change, and allowance must also be made for the influence of healthy antecedal flows
at a site). Active water resource management procedures, such as providing river support or prohibiting
surface water abstraction, would only be needed in cases where concomitant failures to reach hydrological
and ecological objectives occurred. In practice, employing integrated objectives in this way maximizes the judicious use of water resources, while simultaneously minimizing inconvenience and disruption to
abstractors and water managers.
The issue of setting practical and utilitarian flow targets for lotic waters has been the focus of much
worldwide attention and research over the last decade. Approaches to setting river flow objectives have
recently been reviewed by Dunbar et al . (1998) and a more specific appraisal of the use of ecological
information in the management of low flows has latterly been provided by Armitage et al . (1997).
The most commonly applied techniques currently employed for setting benchmark flows involve the use
of ‘look up’ tables, wherein hydrological targets are set after examining a river’s natural flow pattern (for
example, Tennant, 1976). These methods make no direct reference to ecology, although more complex
analyses of flow data, such as that provided by the Range of Variability Approach (Richter et al ., 1997)
can provide a highly relevant hydrological framework for setting ecological objectives.Other initiatives that have been developed to help set flow standards involve holistic and professional
judgement methods. These techniques generally attempt to use cross-functional ecological and hydrolog-
ical expertise to propose flow objectives for rivers, and include procedures like the Expert Panel
Assessment Method of Swales and Harris (1995).
Alternative approaches to setting benchmark flows have focused on biological response modelling
(BRM) and the methodology outlined in this paper fits unequivocally into the array of BRM techniques
that have gradually developed over the last 30 years or so. This evolutionary process has culminated in
a group of techniques generally referred to as IFIM, or Instream Flow Incremental Methodology
(Stalnaker, 1994; Bovee, 1995). One important component of IFIM is the Physical HABitat SImulation
Model, or PHABSIM (Milhous, 1990) and the use of this model enables the impact of changing flow
regimes on physical instream habitat to be assessed for specified target species. The technique has been
Copyright © 1999 John Wiley & Sons, Ltd. Regul . Ri ers: Res. Mgmt. 15: 543–574 (1999)

8/9/2019 LIFE Paper PDF
http://slidepdf.com/reader/full/life-paper-pdf 18/32
C.A. EXTENCE ET AL.560
applied to a number of British rivers since 1989 (Dunbar et al ., 1998), including the River Wissey, Norfolk
(Petts and Bickerton, 1997b,c), where its application, alongside new methodologies, has enabled accept-
able end-of-summer minimum target flows to be defined.
It is our view that the LIFE method is suitable for use within, alongside or in lieu of many of these
techniques, and indeed, the LIFE approach may offer some considerable advantages. PHABSIM, for
example, is not specifically designed for measuring low flow effects and the methodology is, therefore,
unable to easily provide information regarding drought and abstraction impacts on freshwater biota(Armitage et al ., 1997). Nor does the PHABSIM procedure take into account the dynamic nature of a
site’s flow history, and the impact of this variation on the structure of the resident invertebrate community
at any one point in time. LIFE can potentially accomplish all this. PHABSIM additionally requires
considerable financial and technical resources, and this is likely to restrict its use to high priority sites. In
contrast, by using widely available long-term flow and ecological records, the LIFE approach offers the
possibility of evaluating hydroecological relationships at many more river sites than has hitherto been
possible. Ideally, accurate daily flow records and bi- or triannual species level data should co-exist over
a time scale encompassing a wide range of flows, although the method appears robust enough to provide
very usable results when these criteria are not met. The continuation or upgrading of current biological
sampling programmes for localities with long-term results available, should improve the fit between
hydrological and ecological components as databases continue to expand. For areas where this informa-tion is lacking or insufficient, the instigation of regular invertebrate sampling programmes at priority sites
will enable hydroecological relationships to be determined in the future, as well as providing valuable
additional information on water quality. This process may be relatively straightforward for much of
Britain, with its long history of catchment-based river management and a substantial database of
hydrological and biological information. Other parts of the world may not have such detailed data
available, but the LIFE approach could be readily adapted and used for future hydroecological analysis.
Future work
There is considerable scope for further work arising from the present studies. Index scores should, for
example, be examined in watercourses that periodically dry up, and the hydroecological relationship needselucidating in small streams where flows are discontinuously recorded rather than permanently gauged.
There are also opportunities to appraise ecological response to modelled flows, either in situations where
hydrological data are missing, or in cases where biological sampling sites are considered to be too remote
from permanent flow gauging stations for results to be reliable. Ultimately, it may prove possible to define
general responses for specific river types, that could then be transferred from river to river.
Additional research is also needed to establish the connection between LIFE scores and habitat
characteristics. A link exists between poor habitat quality and depressed LIFE scores, and results derived
from rivers like the Lark aptly demonstrate this. In this situation, it may be helpful to identify typical
LIFE ranges for natural rivers with common physical and chemical attributes. Shortfalls in LIFE scores,
particularly during high flow periods, would indicate the need for more detailed habitat assessment to be
made. Poor habitat subsequently identified would suggest that some measure of habitat restoration mightbe necessary as an adjunct to the introduction of active flow management procedures. Good river habitat
identified would imply that flow inadequacies were primarily responsible for poor LIFE scores.
A variety of techniques are available for assessing instream habitat, including the River Habitat Survey
methods currently being used by the EA (Boon and Raven, 1998) and other methods could be equally
useful in this context, including the Functional Habitat Approach summarized by Harper et al . (1995) and
the Riparian Channel and Environmental Inventory method of Petersen (1992). This latter technique
generates a numerical habitat score that can then be used to compare the physical and biological
condition of different streams within a region or catchment. The use of a habitat-based grading system
like this is an interesting prospect, since results obtained could be considered alongside measured LIFE
scores, enabling remediation measures involving habitat restoration and/or water resource schemes to be
prioritized.
Copyright © 1999 John Wiley & Sons, Ltd. Regul . Ri ers: Res. Mgmt. 15: 543–574 (1999)
8/9/2019 LIFE Paper PDF
http://slidepdf.com/reader/full/life-paper-pdf 19/32
RIVER FLOW INDEXING 561
Another potentially productive area of future work involves establishing the relationship between
RIVPACS (Wright et al ., 1984) and LIFE methodologies. LIFE may, for example, provide a sensible
explanation for situations where shortfalls in the predicted fauna cannot be accounted for by water
quality impairment.
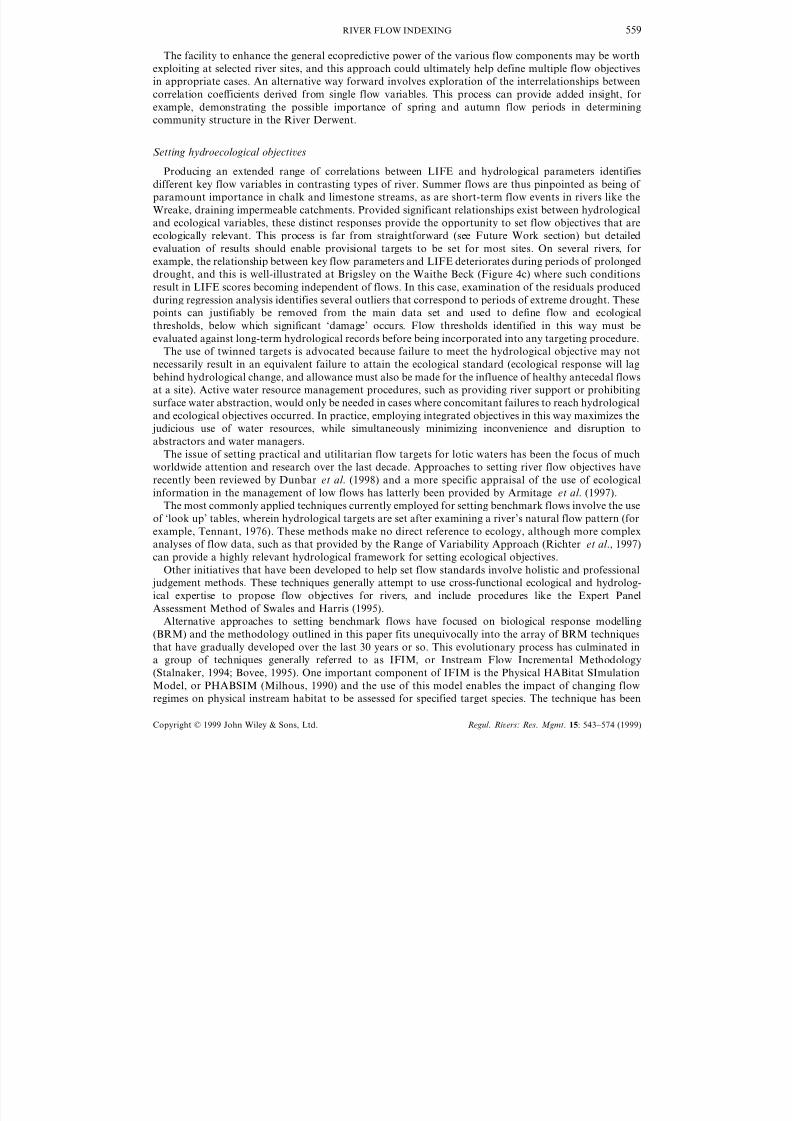
For individual rivers, it should eventually be possible to provide information on threshold LIFE scores
necessary to preserve invertebrate diversity, although rules to facilitate this will be needed before any new
water resource licensing strategy can be proposed. These potential applications of LIFE are summarizedin Figure 10, which illustrates some of the key points that should be considered, along with proposed
decision routes and feedback loops.
At its most basic, the methodology could be used to compare achieved LIFE scores with those expected
for a particular river type. Additionally, the success of river restoration projects could be readily
quantified. Although the incorporation of the LIFE methodology into ground and surface water licensing
procedure is likely to be more complex, this process will be simplified if reliable hydroecological data
exists. The availability of good quality discharge data is considered to be more important, for example,
than a site’s proximity to a gauging station. It is also preferable to use biological sampling sites with
potential for change, since it is this process that is exploited in the LIFE methodology.
The identification of flow response type is the next critical stage in the licensing process. Experience so
far suggests that rivers with a short response (90 days) over full years are normally flashy, with littleor no base flow component. In groundwater fed systems, LIFE scores generally correlate most signifi-
cantly with longer-term changes in discharge (100 days) over summer periods. Once a response has
Figure 10. Future or potential applications of LIFE
Copyright © 1999 John Wiley & Sons, Ltd. Regul . Ri ers: Res. Mgmt. 15: 543–574 (1999)
8/9/2019 LIFE Paper PDF
http://slidepdf.com/reader/full/life-paper-pdf 20/32
C.A. EXTENCE ET AL.562
been established, and areas of hydrological and ecological damage have been identified, then proposed
flow thresholds must be evaluated against long-term actual and natural flow data and expressed
appropriately, for example, as return periods. At this stage management decisions may need to be made
about the impact of current or future licensing policy. If, for example, ‘damage’ occurs at a frequency of
1:20, and a proposed abstraction is likely to increase this to 1:18, will this be considered acceptable?
Using the methodology for drought impact assessment is, in practice, very similar to the licensing route.
If drought is resulting in serious environmental damage, then the impact may have to be set into itslong-term perspective, and licensing policy reviewed as necessary. The implementation of procedures like
these could ultimately offer an unprecedented degree of protection to freshwater biota. Unquestionably,
there is an urgent need, both nationally and globally, for methods to facilitate the sustainable use and
development of water resources. The conceptual ideas and detailed methodologies elaborated in this paper
may provide a timely opportunity for additional cost-effective input into these crucial areas.
Discussions of this manuscript are inited and should be sent to the Editor -in-Chief within 3 months of the
publication date.
ACKNOWLEDGEMENTS
Particular thanks go to Patrick Armitage and his colleagues at the Institute of Freshwater Ecology, for
commenting on the preliminary list of flow group associations, and other parts of the draft manuscript.
We are additionally grateful to Mike Dunbar of the Institute of Hydrology for the assistance he provided.
We would also like to thank numerous people within the Environment Agency for help with supplying
data, technical advice and comment. The support and direction provided by Tony Warn was particularly
appreciated, as was the input from Dan Cadman, Sarah Chadd and Alastair Ferguson. Finally this work
would not have been possible without the help and assistance provided by our colleagues in the Spalding
and Lincoln biology laboratories.
The views expressed in this paper are those of the authors, and not necessarily those of the
Environment Agency.
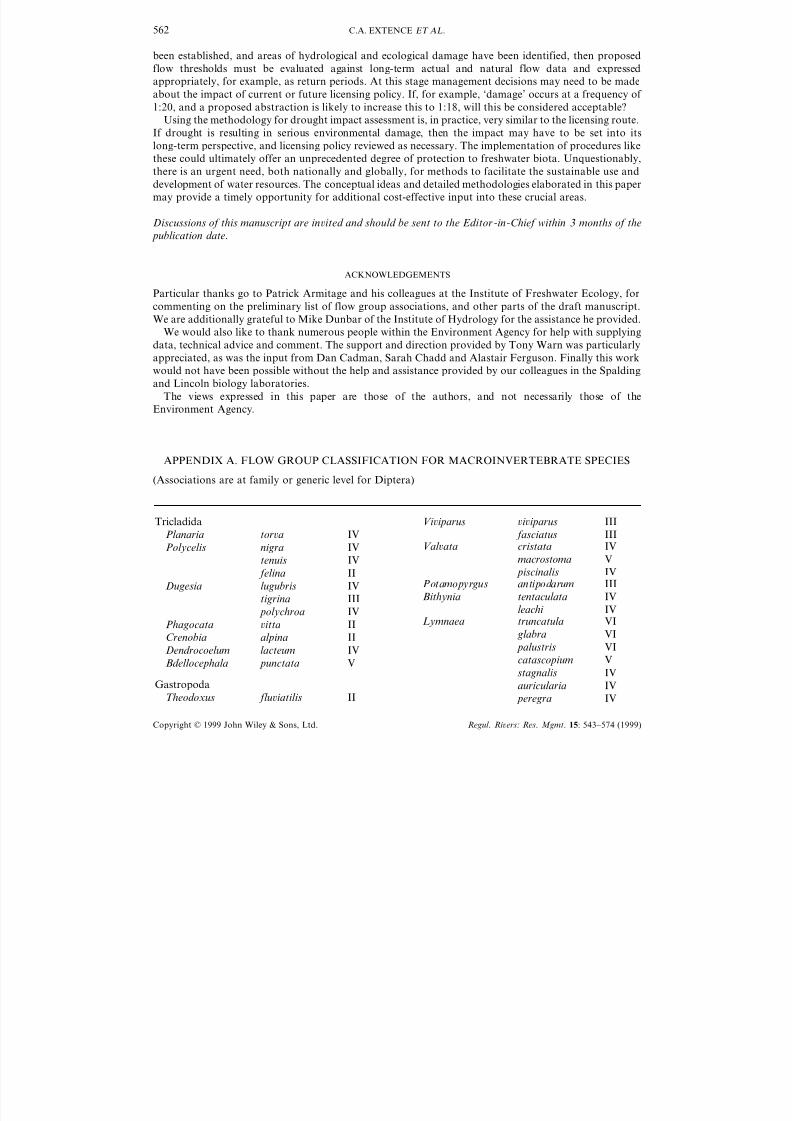
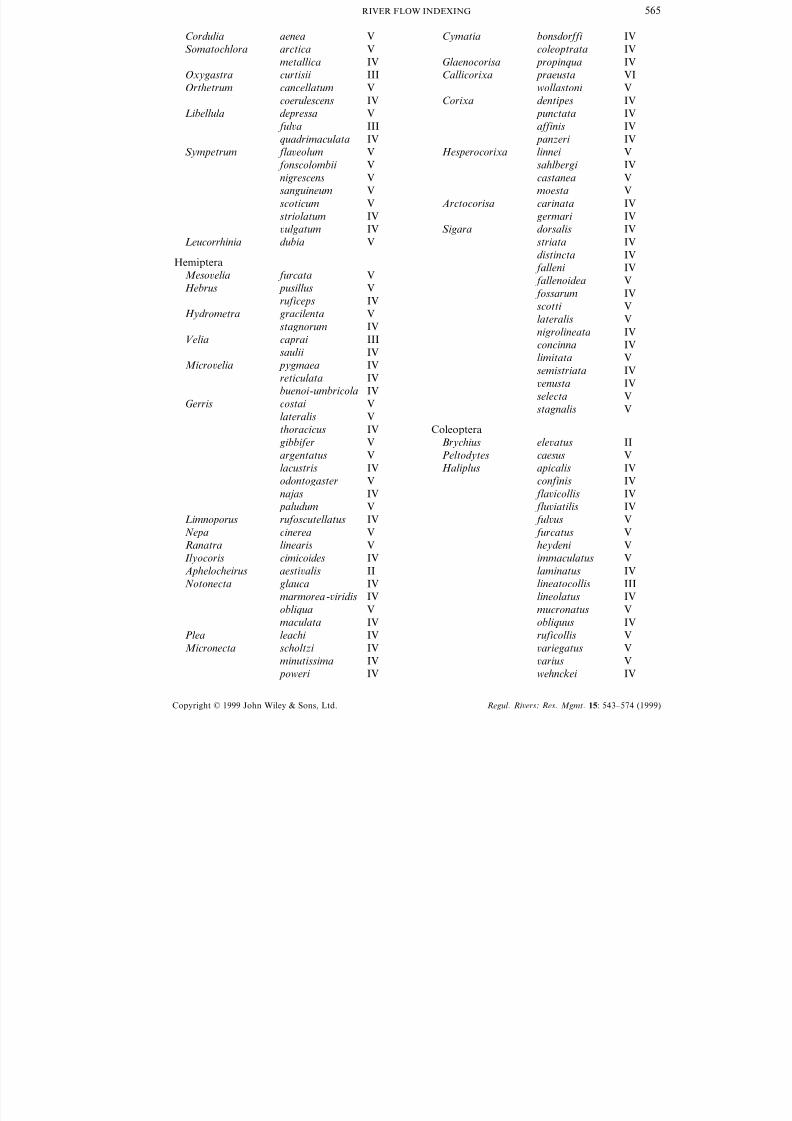
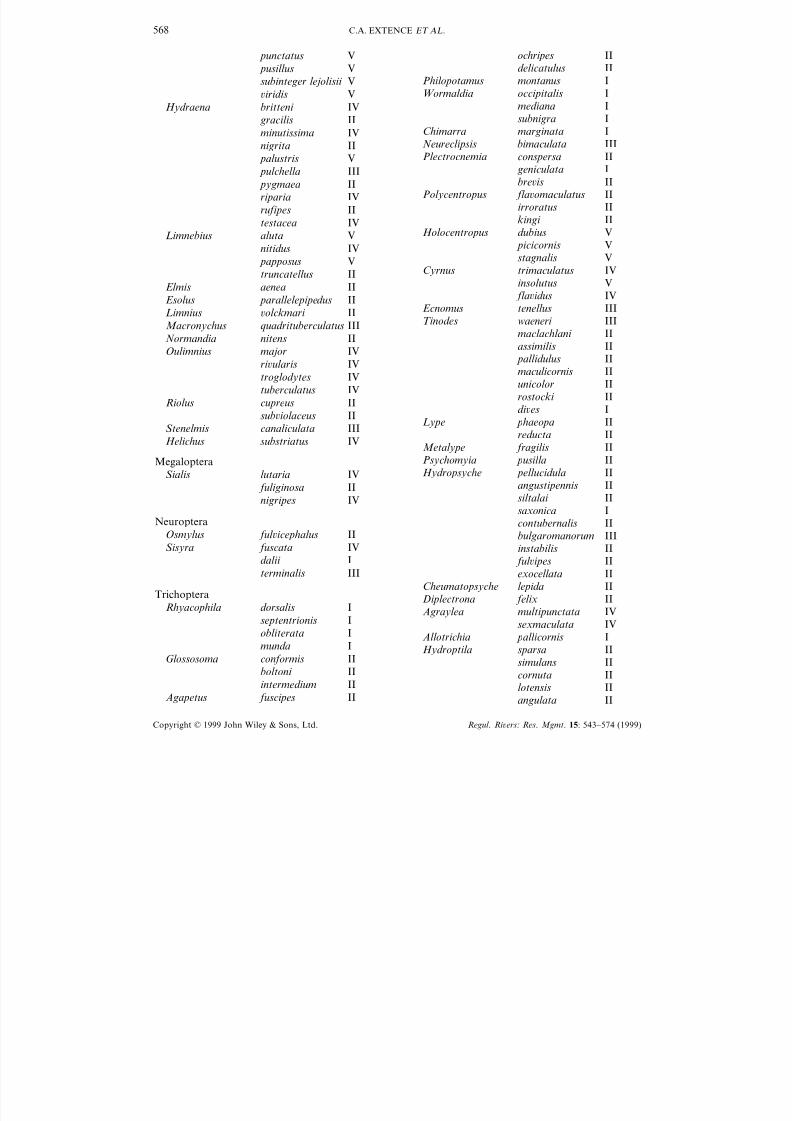
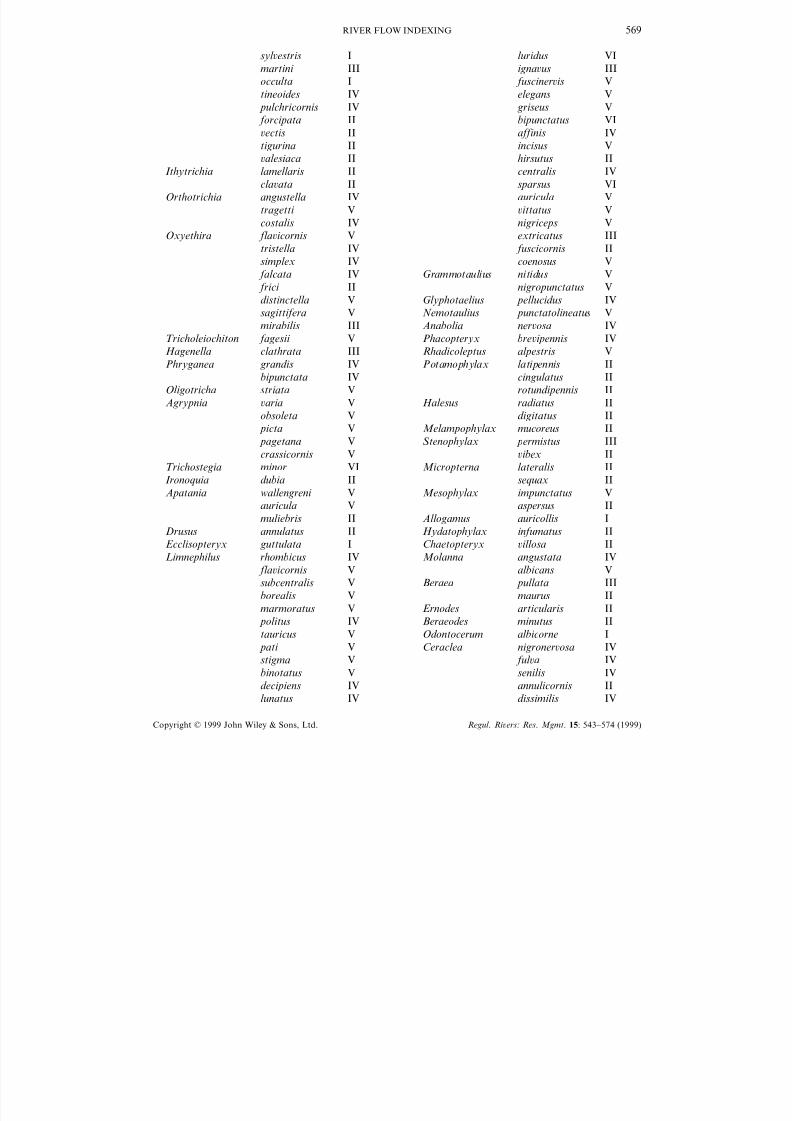
APPENDIX A. FLOW GROUP CLASSIFICATION FOR MACROINVERTEBRATE SPECIES
(Associations are at family or generic level for Diptera)
Tricladida
IVPlanaria tora
nigraPolycelis IVtenuis IV
II felina
IVlugubrisDugesia
IIItigrina
IV polychroa
ittaPhagocata II
alpina IICrenobia
IVDendrocoelum lacteum
V punctataBdellocephala
Gastropoda
II fluiatilisTheodoxus
i iparusVi iparus III
III fasciatuscristataVal ata IV
macrostoma V
IV piscinalisIIIPotamopyrgus antipodarum
IVBithynia tentaculata
IVleachi truncatulaLymnaea VI
VI glabra
palustris VI
Vcatascopium
IVstagnalis
IVauricularia peregra IV
Copyright © 1999 John Wiley & Sons, Ltd. Regul . Ri ers: Res. Mgmt. 15: 543–574 (1999)

8/9/2019 LIFE Paper PDF
http://slidepdf.com/reader/full/life-paper-pdf 21/32
RIVER FLOW INDEXING 563
IVMyxas glutinosa
hypnorum VIAplexa
Physa III fontinalis
Planorbarius corneus IV
dilatatus VMenetus
Planorbis carinatus IV
IV planorbisAnisus orticulus VI
ortex IV
leucostoma VI
VlaeisGyraulus
IValbus
IVacronicus
Armiger crista IV
IVcontortusBathyomphalus
Hippeutis complanata V
Segmentina nitida V
lacustris IVAcroloxusAncylus fluiatilis II
Bivalvia
Margaritifera margaritifera II
IVUnio pictorum
tumidus III
IVcygneaAnodonta
IIIanatina
IIIcomplanata
Sphaerium ri icola III
IVcorneumtransersum IV
Vlacustre
IIIsolidumPisidium IIIamnicum
IVcasertanum
conentus V
V personatum
obtusale IV
IIImilium
IV pseudosphaerium
IVsubtruncatumsupinum III
IIIhenslowanum
lilljeborgii V
hibernicum IV
nitidum IV
pulchellum IV
IVmoitessierianum
tenuilineatum IVDreissena polymorpha IV
Hirudinea
Piscicola II geometra
IVtessulatumTheromyzon
Hemiclepsis marginata IV
Glossiphonia heteroclita IV
IVcomplanataBoreobdella IVerrucata
Haementeria costata IV
paludosa IVBatracobdella
Helobdella stagnalis IV
Haemopis sanguisuga IV
Hirudo medicinalis IV
testacea VErpobdella
octoculata IVIVlineataDina
IVTrocheta subiridis
IIbykowskii
Araneae
Argyroneta aquatica V
Anostraca
Artemia salina VI
VIChirocephalus diaphanus
Notostraca
VITriops cancriformis
Malacostraca
Mysis relicta V
IVaquaticusAsellus
communis V
meridianus IVCorophium curispinum III
IVCrangonyx pseudogracilis
IIIGammarus duebeni
lacustris V
II pulex
tigrinus IIIOrchestia caimana VI
IIAustropotamobius pallipes
Ephemeroptera
Siphlonurus armatus IV
IVlacustris
linnaeanus IVAmeletus Iinopinatus
Baetis fuscatus II
IIscambus
ernus II
buceratus II
rhodani II
atrebatinus II
IImuticus
niger IIIIdigitatus
Copyright © 1999 John Wiley & Sons, Ltd. Regul . Ri ers: Res. Mgmt. 15: 543–574 (1999)

8/9/2019 LIFE Paper PDF
http://slidepdf.com/reader/full/life-paper-pdf 22/32
C.A. EXTENCE ET AL.564
IIICentroptilum luteolum
pennulatum III
Cloeon IVdipterum
simile IV
pseudorufulum IIIProcloeon
Rhithrogena semicolorata I
Ihaarupi
Heptagenia sulphurea I
longicauda I fuscogrisea IV
Ilateralis
Arthroplea IIIcongener
Ecdyonurus Ienosus
torrentis I
Idispar
insignis I
Leptophlebia marginata IV
espertina IV
Paraleptophlebia submarginata II
IIcincta
werneri II
III fuscaHabrophlebia
Ephemerella ignita II
IInotata
Potamanthus luteus III
Ephemera ulgata III
danica II
IIIlineata
Brachycercus harrisella III
macrura IIICaenis luctuosa IV
IVrobusta
horaria IV
ri ulorum II
pusilla II
II pseudori ulorum
beskidensis II
Plecoptera
Taeniopteryx nebulosa II
IRhabdiopteryx acuminata
Brachyptera III putata
risi I
praecox IProtonemura
Imontana
Imeyeri
Amphinemura standfussi II
sulcicollis II
picteti Nemurella IV
Nemoura cinerea IV
IIdubitans
aicularis IV
cambrica II
erratica II
Leuctra II geniculata
inermis I
hippopus I
nigra II
II fusca
moselyi ICapnia bifrons I
atra V
Iidua
Isogenus Inubecula
Perlodes Imicrocephala
Diura bicaudata I
I grammaticaIsoperla
obscura III
Dinocras cephalotes I
bipunctata IPerla
Chloroperla torrentium I
Itripunctata
apicalis II
Odonata
Platycnemis pennipes IV
Pyrrhosoma nymphula IV
IVelegansIschnura
V pumilio
Enallagma IVcyathigerum
Coenagrion armatum V
IVhastulatummercuriale III
puella IV
pulchellum IV
scitulum V
Ceriagrion IVtenellum
Erythromma najas IV
Lestes dryas V
IVsponsa
IIIsplendensCalopteryx
IIirgo
Gomphus IIIulgatissimus
Cordulegaster boltonii II
IV pratenseBrachytron
Aeshna caerulea V
cyanea IV
grandis V
isosceles V
V juncea
IVmixta
VAnax imperator
Copyright © 1999 John Wiley & Sons, Ltd. Regul . Ri ers: Res. Mgmt. 15: 543–574 (1999)
8/9/2019 LIFE Paper PDF
http://slidepdf.com/reader/full/life-paper-pdf 23/32
RIVER FLOW INDEXING 565
VCordulia aenea
arctica VSomatochlora
metallica IV
IIIcurtisii Oxygastra
Orthetrum Vcancellatum
IVcoerulescens
Libellula depressa V
ful a III
quadrimaculata IVV flaeolumSympetrum
V fonscolombii
Vnigrescens
sanguineum V
Vscoticum
striolatum IV
ulgatum IV
dubia VLeucorrhinia
Hemiptera
Mesoelia furcata VHebrus pusillus V
ruficeps IV
Hydrometra gracilenta V
IVstagnorum
Velia IIIcaprai
IVsaulii
Microelia pygmaea IV
IVreticulata
buenoi -umbricola IV
Gerris costai V
lateralis Vthoracicus IV
V gibbifer
argentatus V
lacustris IV
odontogaster V
IVnajas
V paludum
Limnoporus IVrufoscutellatus
Nepa cinerea V
VlinearisRanatra
Ilyocoris IVcimicoides
Aphelocheirus aesti alis II
glauca IVNotonecta
IVmarmorea -iridis
Vobliqua
maculata IV
Plea leachi IV
scholtzi Micronecta IV
minutissima IV
IV poweri
Cymatia bonsdorffi IV
coleoptrata IV
propinquaGlaenocorisa IV
Callicorixa VI praeusta
wollastoni V
dentipes IVCorixa
punctata IV
IVaffinis
panzeri IVHesperocorixa linnei V
IVsahlbergi
Vcastanea
Vmoesta
Arctocorisa IVcarinata
germari IV
IVdorsalisSigara
IVstriata
distincta IV
falleni IV
V fallenoidea
IV fossarum
scotti V
lateralis V
nigrolineata IV
IVconcinna
Vlimitata
IVsemistriata
IVenusta
selecta V
VstagnalisColeoptera
eleatus IIBrychius
Peltodytes Vcaesus
IVapicalisHaliplus
confinis IV
flaicollis IV
fluiatilis IV
ful us V
V furcatus
Vheydeni
Vimmaculatus
laminatus IV
IIIlineatocollis
lineolatus IV
mucronatus V
obliquus IV
ruficollis V
Variegatus
Varius
IVwehnckei
Copyright © 1999 John Wiley & Sons, Ltd. Regul . Ri ers: Res. Mgmt. 15: 543–574 (1999)

8/9/2019 LIFE Paper PDF
http://slidepdf.com/reader/full/life-paper-pdf 24/32
C.A. EXTENCE ET AL.566
Hygrobia hermanni VNoterus IVclaicornis
VcrassicornisIIIhyalinusLaccophilus
minutus IV
obsoletus VHydroatus clypealis V
oatus IVHyphydrusV geminusHydroglyphusIVBidessus minutissimus
unistriatus VHygrotus decoratus V
inaequalis IV
quinquelineatus V
ersicolor IVCoelambus confluens V
impressopunctatus V
noemlineatus V
parallelogrammus VHydroporus angustatus V
IIdiscretus
elongatulus V
Verythrocephalus
IV ferrugineus
V glabriusculus
gyllenhalii IV
IVincognitus
longicornis V
longulus II
marginatus VI
melanarius V
Vmemnonius
morio V
neglectus IV
nigrita V
obscurus V
obsoletus II
palustris IV
V planus
pubescens IVVrufifrons
Vscalesianus
striola V
tessellatus IV
tristis V
VumbrosusSuphrodytes dorsalis VStictonectes lepidus IV
VbilineatusGraptodytes
flaipes V
V granularis IV pictus
VPorhydrus lineatus
latus IIDeronectes
Potamonectes assimilis V
depressus depressus IV
depressus elegans III
griseostriatus V
Stictotarsus duodecimpustulatus IIOreodytes daisii I
sanmarkii II
septentrionalis II
IVScarodytes halensis
VLaccornis oblongus
Platambus maculatus II
VhaemorrhoidalisCopelatus
Agabus affinis V
arcticus V
biguttatus VIIVbipustulatus
IVchalconatus
congener V
conspersus V
didymus III
guttatus II
Vlabiatus
Vmelanarius
IVmelanocornis
nebulosus V
II paludosusstriolatus V
sturmii IV
uliginosus V
undulatus V
Vunguicularis
Ilybius Vaenescens
ater V
IV fenestratus
IV fuliginosus
guttiger V
quadriguttatus Vsubaeneus V
Rhantus Vbistriatus
exsoletus V
V frontalis
grapii V
suturalis V
fuscus VColymbetes
Hydaticus seminiger V
Vtransersalis
VAcilius canaliculatus Vsulcatus
Copyright © 1999 John Wiley & Sons, Ltd. Regul . Ri ers: Res. Mgmt. 15: 543–574 (1999)

8/9/2019 LIFE Paper PDF
http://slidepdf.com/reader/full/life-paper-pdf 25/32
RIVER FLOW INDEXING 567
VGraphoderus bilineatus
cinereus V
Vzonatus
Dytiscus circumcinctus V
circumflexus V
dimidiatus V
Vlapponicusmarginalis IV
semisulcatus V
Gyrinus aeratus IV
IVcaspius
Vdistinctus
Vmarinus
minutus V
V paykulli
substriatus IV
suffriani V
urinator IIIOrectochilus illosus II
Georissus VIcrenulatus
Spercheus emarginatus V
VangustatusHydrochus
Vbreis
Vcarinatus
Velongatus
Vignicollis
megaphallus V
IVnitidicollis
Helophorus aequalis Valternans V
arernicus III
breipalpis IV
Vdorsalis
flaipes V
fulgidicollis V
grandis IV
V granularis
V griseus
Vlongitarsis
minutus VVnanus
Vnubilus
obscurus V
strigifrons VI
Vtuberculatus
VIorbiculareCoelostoma
Cercyon bifenestratus VI
conexiusculus VI
depressus VI
granarius VI
VIimpressus
lateralis VI
littoralis VI
lugubris VI
VImarinus
melanocephalus VI
sternalis VI
tristis VIVIustulatus
Paracymus scutellaris IV
Hydrobius fuscipes V
Limnoxenus Vniger
IVbipustulataAnacaena
IV globulus
IVlimbata
lutescens IV
VatratusLaccobius
VIatrocephalus
biguttatus IVbipunctatus VI
Vminutus
IVsinuatus
striatulus III
Helochares li idus V
obscurus V
punctatus V
VaffinisEnochrus
Vbicolor
Vcoarctatus
fuscipennis VVhalophilus
isotae V
melanocephalus V
ochropterus V
quadripunctatus IV
IVtestaceus
Cymbiodyta marginella V
Chaetarthria seminulum VI
Hydrochara caraboides V
Hydrophilus piceus V
affinis VBerosus
luridus V
Vsignaticollis
spinosus V
VIauriculatusOchthebius
VIbicolon
dilatatus V
exsculptus II
marinus V
Vminimus
Vnanus VI poweri
Copyright © 1999 John Wiley & Sons, Ltd. Regul . Ri ers: Res. Mgmt. 15: 543–574 (1999)
8/9/2019 LIFE Paper PDF
http://slidepdf.com/reader/full/life-paper-pdf 26/32
C.A. EXTENCE ET AL.568
V punctatus
pusillus V
Vsubinteger lejolisii
iridis V
britteni IVHydraena
gracilis II
IVminutissimanigrita II
palustris V
pulchella III
II pygmaea
IVriparia
IIrufipes
testacea IV
ValutaLimnebius
nitidus IV
papposus V
truncatellus IIElmis aenea II
Esolus II parallelepipedus
Limnius olckmari II
IIIquadrituberculatusMacronychus
Normandia IInitens
IVmajorOulimnius
ri ularis IV
troglodytes IV
tuberculatus IV
Riolus cupreus II
subiolaceus IIcanaliculata IIIStenelmis
Helichus substriatus IV
Megaloptera
Sialis lutaria IV
II fuliginosa
nigripes IV
Neuroptera
Osmylus II ful icephalus
Sisyra fuscata IVIdalii
IIIterminalis
Trichoptera
Rhyacophila dorsalis I
septentrionis I
Iobliterata
Imunda
Glossosoma conformis II
boltoni II
intermedium II
Agapetus fuscipes II
IIochripes
delicatulus II
Philopotamus montanus I
occipitalisWormaldia I
Imediana
subnigra I
marginata IChimarra
Neureclipsis bimaculata III
Plectrocnemia IIconspersa
geniculata I
breis IIPolycentropus II flaomaculatus
IIirroratus
IIkingi
Holocentropus Vdubius
picicornis V
Vstagnalis
Cyrnus IVtrimaculatus
insolutus V
flaidus IV
Ecnomus IIItenellus
IIIwaeneri Tinodes
maclachlani II
assimilis II pallidulus II
maculicornis II
IIunicolor
IIrostocki
Idi
esLype phaeopa II
IIreducta
Metalype fragilis II
Psychomyia pusilla II
pellucidula IIHydropsyche
angustipennis II
IIsiltalai
saxonica Icontubernalis II
bulgaromanorum III
instabilis II ful ipes II
exocellata II
Cheumatopsyche IIlepida
Diplectrona felix II
IVmultipunctataAgraylea
IVsexmaculata
Allotrichia pallicornis I
sparsa IIHydroptila
simulans II
IIcornuta
IIlotensis IIangulata
Copyright © 1999 John Wiley & Sons, Ltd. Regul . Ri ers: Res. Mgmt. 15: 543–574 (1999)
8/9/2019 LIFE Paper PDF
http://slidepdf.com/reader/full/life-paper-pdf 27/32
RIVER FLOW INDEXING 569
Isyl estris
martini III
Iocculta
tineoides IV
pulchricornis IV
forcipata II
II
ectistigurina II
alesiaca II
Ithytrichia lamellaris II
IIclaata
Orthotrichia IVangustella
Vtragetti
costalis IV
V flaicornisOxyethira
tristella IV
simplex IV
falcata IV frici II
Vdistinctella
sagittifera V
IIImirabilis
Tricholeiochiton V fagesii
IIIclathrataHagenella
Phryganea IV grandis
IVbipunctata
Oligotricha striata V
VariaAgrypnia
obsoleta V picta V
pagetana V
crassicornis V
Trichostegia VIminor
Ironoquia dubia II
Apatania wallengreni V
auricula V
IImuliebris
Drusus IIannulatus
Ecclisopteryx I guttulata
Limnephilus rhombicus IVV flaicornis
Vsubcentralis
borealis V
marmoratus V
IV politus
Vtauricus
pati V
stigma V
binotatus V
decipiens IV
IVlunatus
luridus VI
ignaus III
fuscineris V
Velegans
griseus V
bipunctatus VI
affinis IVVincisus
hirsutus II
centralis IV
VIsparsus
Vauricula
Vittatus
Vnigriceps
extricatus III
II fuscicornis
Vcoenosus
Grammotaulius nitidus Vnigropunctatus V
Glyphotaelius IV pellucidus
V punctatolineatusNemotaulius
Anabolia nerosa IV
Phacopteryx breipennis IV
alpestris VRhadicoleptus
Potamophylax latipennis II
IIcingulatus
IIrotundipennis
Halesus IIradiatus
digitatus IIIImucoreusMelampophylax
Stenophylax permistus III
ibex II
lateralis IIMicropterna
sequax II
Mesophylax Vimpunctatus
aspersus II
Allogamus auricollis I
Hydatophylax infumatus II
Chaetopteryx illosa II
angustata IVMolanna
albicans V
Beraea III pullata
maurus II
IIarticularisErnodes
IIBeraeodes minutus
Odontocerum albicorne I
nigronerosa IVCeraclea
ful a IV
IVsenilis
IIannulicornis IVdissimilis
Copyright © 1999 John Wiley & Sons, Ltd. Regul . Ri ers: Res. Mgmt. 15: 543–574 (1999)

8/9/2019 LIFE Paper PDF
http://slidepdf.com/reader/full/life-paper-pdf 28/32
C.A. EXTENCE ET AL.570
Athripsodes IVaterrimus
IIcinereus
albifrons II
bilineatus II
commutatus I
Mystacides IVnigra
IVazurealongicornis IV
Triaenodes bicolor IV
Ylodes IIconspersus
IIsimulans
IIIreuteri
Erotesis Vbaltica
Adicella reducta III
II filicornis
Oecetis ochracea IV
fura V
lacustris IVnotata II
IVtestacea
Leptocerus tineiformis V
lusitanicus III
interruptus IIISetodes punctatus II
argentipunctellus VGoera pilosa I
ISilo pallipes
Inigricornis
IIirrorataCrunoeciaLepidostoma IIhirtum
Lasiocephala IIbasalis
Brachycentrus subnubilus II
Sericostoma personatum II
IIINotidobia ciliaris
Diptera
Dicranota sp. IIIIPedicia sp.
IIPtychoptera sp.
Eristalis sp. VSimuliidae II
VChaoboridae
VCulicidae
APPENDIX B. FLOW GROUP CLASSIFICATION FOR MACROINVERTEBRATE FAMILIES
Tricladida
Dugesiidaea IV Dendrocoelidae IVIVbPlanariidaea
Gastropoda
III IVValvatidaeNeritidae II Viviparidae
Bithyniidaea IV LymnaeidaeHydrobiidaea IVb IVb
Ancylidaea IIIVPlanorbidaeIVbPhysidae
Acroloxidaea IV
Bivalvia
IVbUnionidae IVbSphaeriidaeIIMargaritiferidae
Dreissenidae IV
Hirudinea
II Glossiphoniidae IV Hirudidae IVPiscicolidaeIVErpobdellidae
Araneae
VAgelinidae
Anostraca
Chirocephalidae VI
Notostraca
Triopsidae VI
Malacostraca V Asellidae IV Corophidae IIIMysidae
Copyright © 1999 John Wiley & Sons, Ltd. Regul . Ri ers: Res. Mgmt. 15: 543–574 (1999)
8/9/2019 LIFE Paper PDF
http://slidepdf.com/reader/full/life-paper-pdf 29/32
RIVER FLOW INDEXING 571
VIIVII Crangonycitidaea TalitridaeGammaridaea
Astacidae II
Ephemeroptera
IIb Heptageniidae IbSiphlonuridae IVb Baetidae
II IIIPotamanthidaeLeptophlebiidae IIb Ephemerellidae
IIb Caenidae IVbEphemeridae
Plecoptera
Nemouridae IVb LeuctridaeTaeniopterigidae IIbIIb
I IPerlidaeCapniidae Ib Perlodidae
IChloroperlidae
Odonata
IV Lestidae IVPlatycnemididae IV Coenagriidae
IICordulegasteridaeIIGomphidaeIIIbAgriidae
IVb IVbLibellulidaeAeshnidae IV Corduliidae
Hemiptera
V Hebridae IVb
Hydrometridae IVMesovelidaeVNepidaeIVGerridaeIVbVeliidae
II IVNotonectidaeNaucoridae IV Aphelocheiridae
IVPleidae IV Corixidae
Coleoptera
Hygrobiidae NoteridaeV IVbIVbHaliplidae
IVb Hydrophilidae IVbDytiscidae IVb Gyrinidae
IVb Scirtidae IVb ElmidaeHydraenidae IIb
Megaloptera
IVbSialidae
Neuroptera
II Sisyridae IVbOsmylidae
Trichoptera
I Glossosomatidaea IIb Philopotamidae IRhyacophilidaea
IIb Ecnomidaea IIIPolycentropodidae IVb Psychomyiidaea
Hydroptilidae IVb PhryganeidaeHydropsychidae II IV
IVMolannidae Beraeidae IIIVbLimnephilidae
IVb IGoeridaeOdontoceridae I Leptoceridae
II Brachycentridae II SericostomatidaeLepidostomatidae II
Diptera
IVb Ptychopteridae II Chaoboridae VTipulidae
Simuliidae II SyrphidaeCulicidae V V
a Historical data may include combination of both families, or separate families (use first family of pair
in cases where both family names used, e.g. Gammaridae/Crangonycitidae=II).b Families containing species/genera with variable flow requirements.
Copyright © 1999 John Wiley & Sons, Ltd. Regul . Ri ers: Res. Mgmt. 15: 543–574 (1999)
8/9/2019 LIFE Paper PDF
http://slidepdf.com/reader/full/life-paper-pdf 30/32
C.A. EXTENCE ET AL.572
REFERENCES
d’Aguilar, J., Dommanget J.L., and Prechac, R. 1985. Guide des Libellules d ’ Europe et d ’ Afrique du Nord , English Edition, 1986,
Collins, London.
Armitage, P.D., Gunn, R.J.M., Furse, M.T., Wright, J.F., and Moss, D. 1987. ‘The use of prediction to assess macroinvertebrate
response to river regulation’, Hydrobiologia, 144, 25–32.
Armitage, P.D. and Petts, G.E. 1992. ‘Biotic score and prediction to assess the effects of water abstraction on river macroinverte-
brates for conservation purposes’, Aquat. Conser.: Mar. Freshwater Ecosyst., 2, 1–17.
Armitage, P.D. 1995. ‘Faunal community change in response to flow manipulation’, in Harper, D.M. and Ferguson, A.J.D. (Eds),The Ecological Basis for Ri er Management, Wiley, Chichester.
Armitage, P.D., Cannan, C.A., and Symes, K.L. 1997. ‘Appraisal of the use of ecological information in the management of low
flows in rivers’, Enironment Agency, R&D Technical Report W 72 , Bristol, UK.
Arnell, N.W. 1996. ‘Hydrology & climate change’, in Calow, P. and Petts, G.E. (Eds), The Ri er Handbook Hydrological and
Ecological Principles Volume 2 , Blackwell Scientific Publications, London.
Askew, R.R. 1988. The Dragonflies of Europe, Harley Books, Colchester.
Bickerton, M.A., Petts, G.E., Armitage, P.D., and Castella, E. 1993. ‘Effects of groundwater abstraction on the ecology of chalk
streams’, Regul . Ri ers, 8, 121–134.
Bickerton, M.A. 1995. ‘Long term changes of macroinvertebrate communities in relation to flow variations: the River Glen,
Lincolnshire, England’, Regul . Ri ers, 10, 81–92.
Boon, P.J. and Raven, P.J. (Eds) 1998. ‘The application of classification and assessment methods to river management in the UK’,
Aquat. Conser.: Mar. Freshwater Ecosyst., 8(4), 383–644 (special issue).
Boulton, A.J. and Lake, P.S. 1992. ‘The ecology of two intermittent streams in Victoria Australia. III. Temporal changes in faunalcomposition’, Freshwater Biol ., 27, 123–138.
Bovee, K.D. (Ed.) 1995. A Comprehensi e Oeriew of the Instream Flow Incremental Methodology, National Biological Service, Fort
Collins, CO.
Bratton, J.H. 1990. A review of the scarcer Ephemeroptera and Plecoptera of Great Britain. Research & Surey in Nature
Conseration. Nature Conserancy Council , No. 29 , Joint Nature Conservation Committee, Peterborough, UK.
Bratton, J.H. (Ed.) 1991. British Red Data Books, 3 , Inertebrates other than Insects, Joint Nature Conservation Committee,
Peterborough, UK.
Brooks, A. 1990. Channelized Ri ers Perspecti es for Enironmental Management, Wiley, Chichester.
Brooks, S. 1997. Field Guide to the Dragonflies & Damselflies of Great Britain and Ireland , British Wildlife Publishing, Hook.
Brown, R.P.C., Ironside, N., and Johnson, S. 1991. ‘Defining an environmentally acceptable flow regime for the River Darent,
Kent’, British Hydrological Society 3 rd National Hydrology Symposium. Southampton, UK.
Cairns, J. and Pratt, J.R. 1993. ‘A history of biological monitoring using benthic macroinvertebrates’, in Rosenberg, D.M. and Resh,
V.H. (Eds), Freshwater Monitoring and Benthic Inertebrates, Chapman and Hall, New York.Castella, E., Bickerton, M.A., Armitage, P.D., and Petts, G.E. 1995. ‘The effect of water abstractions on invertebrate communities
in UK streams’, Hydrobiologia, 308, 167–182.
Chandler, J.R. 1970. ‘A biological approach to water quality management’, Water Pollut. Control , 4, 415–422.
Chesters, R.K. 1980. Biological monitoring working party. The 1978 National Testing Exercise, Department of the Enironment,
Water Data Unit, Technical Memorandum 19 , Reading, UK.
Chutter, F.M. 1969. ‘The distribution of some stream invertebrates in relation to current speed’, Int. Reue ges Hydrobiol ., 54,
413–422.
Clausen, B. and Biggs, B.J.F. 1997. ‘Relationships between benthic biota and hydrological indices in New Zealand streams’,
Freshwater Biol ., 38, 327– 342.
Cowx, I.G., Young, W.O., and Hellawell, J.M. 1984. ‘The effect of drought on the fish and invertebrate populations of an upland
stream in Wales’, Freshwater Biol ., 14, 165– 177.
Dunbar, M.J., Gustard, A., Acreman, M.C., and Elliot, C.R.N. 1998. ‘Overseas approaches to setting river flow objectives’,
Enironment Agency and Institute of Hydrology R&D Technical Report W 6 B (96)4 , Environment Agency, Bristol, UK andInstitute of Hydrology, Wallingford, UK.
Edington, J.M. and Hildrew, A.G. 1995. ‘Caseless Caddis Larvae of the British Isles. A key with ecological notes’, FBA Scientific
Publication, No. 53 , Ambleside, UK.
Elliot, J.M. 1977. ‘Some methods for the statistical analysis of samples of benthic invertebrates’, FBA Scientific Publication, No. 25 ,
Ambleside, UK.
Elliot, J.M. and Mann, K.H. 1979. ‘A key to the British freshwater leeches’, FBA Scientific Publication, No. 40 , Ambleside, UK.
Elliot, J.M., Humpesch, W.H., and Macan, T.T. 1988. ‘Larvae of the British Ephemeroptera. A key with ecological notes’, FBA
Scientific Publication, No. 49 , Ambleside, UK.
Elliot, J.M. 1996. ‘British freshwater Megaloptera and Neuroptera. A key with ecological notes’, FBA Scientific Publication, No. 54 ,
Ambleside, UK.
Ellis, A.E. 1978. ‘British freshwater Bivalve Mollusca’, Synopsis of the British Fauna, No. 11, Academic Press, London.
Environment Agency 1998. An Enironmental Strategy for the Millennium and Beyond , Environment Agency, Bristol, UK.
European Economic Community 1992. Council Directi e 92 /43 /EEC of 21 /5 /92 on the Conseration of Natural Habitas and of Wild Flora and Fauna ( Habitats Directi e ) , EEC, Brussels.
Copyright © 1999 John Wiley & Sons, Ltd. Regul . Ri ers: Res. Mgmt. 15: 543–574 (1999)

8/9/2019 LIFE Paper PDF
http://slidepdf.com/reader/full/life-paper-pdf 31/32
RIVER FLOW INDEXING 573
Extence, C.A. 1981. ‘The effect of drought on benthic invertebrate communities in a lowland river’, Hydrobiologia, 83, 217–224.
Fitter, R. and Manuel, R. 1986. Collins Field Guide to Freshwater Life, Collins, London.
Foster, G.N. 1980. ‘Subterranean statistics II’, The Balfour – Browne Club Newsl ., 15, 3–7.
Friday, L.E. 1988. ‘A key to the adults of British water beetles’, Field Stud ., 7, 1– 151.
Gledhill, T., Sutcliffe, D.W., and Williams, W.D. 1993. ‘British freshwater Crustacea Malacostraca. A key with ecological notes’,
FBA Scientific Publication No. 52 , Ambleside, UK.
Gore, J.A. 1996. ‘Response of aquatic biota to hydrological change’, in Petts, G.E. and Calow, P. (Eds), Ri er Biota Di ersity &
Dynamics, Blackwell Scientific Publication, London.
Harper, D.M., Smith, C., Barham, P., and Howell, R. 1995. ‘The ecological basis for the management of the natural riverenvironment’, in Harper, D.M. and Fergusen, A.J.D. (Eds), The Ecological Basis for Ri er Management, Wiley, Chichester.
HMSO 1995a. Biodi ersity: The UK Steering Group Report. Volume 1: Meeting the Rio Challenge, HMSO, London.
HMSO 1995b. Biodi ersity: The UK Steering Group Report. Volume 2 . Action Plans, HMSO, London.
Hynes, H.B.N. 1970. The Ecology of Running Water, Liverpool University Press, Liverpool.
Hynes, H.B.N. 1984. ‘Adults & nymphs of British Stoneflies (Plecoptera). A key’, FBA Scientific Publication No. 17 , Ambleside, UK.
Janus, H. 1982. The Illustrated Guide to Molluscs, Harold Starke Ltd., London.
Jones, H.R. and Peters, J.C. 1977. ‘Physical & biological typing of unpolluted rivers’, Water Research Council Technical Report
TR41, WRC, Medmenham.
Kimmins, D.E. 1972. ‘A revised key to the Adults of the British species of Ephemeroptera with notes on their ecology’, FBA
Scientific Publication No. 15 , Ambleside, UK.
Ladle, M. and Bass, J.A.B. 1981. ‘The ecology of a small stream and its responses to drying during drought conditions’, Arch.
Hydrobiol ., 30, 448–466.
Macan, T.T. 1963. Freshwater Ecology, Longmans, London.
Macan, T.T. 1965. ‘A revised key to the British water bugs (Hemiptera-Heteroptera)’, FBA Scientific Publication No. 16 , Ambleside,
UK.
Macan, T.T. 1977. ‘A key to the British Fresh and Brackish water gastropods’, FBA Scientific Publication No. 13 , Ambleside, UK.
Mawdsley, J., Petts, G.E., and Walker, S. 1994. ‘Assessment of drought severity’, British Hydrological Society Occasional Paper, No.
3 , Institute of Hydrology, Wallingford, UK.
Milhous, R.T. 1990. ‘Users guide to the physical habitat simulation system—Version 2’, Instream Flow Information Paper, No 32 ,
USDI Fish & Wildlife Serice — Biological Report 90 .
Miller, A.M. and Golladay, S.W. 1996. ‘Effects of spates & drying on macroinvertebrate assembledges of an intermittent and a
perennial prairie stream’, J . N . Am. Benthol . Soc., 15, 670– 689.
Moth Iversen, T., Wiberg-Larsen, P., Birkholm Hansen, S., and Hansen, F.S. 1978. ‘The effect of partial and total drought on the
macroinvertebrate communities of three small Danish streams’, Hydrobiologia, 60, 235–242.
Murray-Bligh, J. 1997. Procedures for Collecting & Analysing Macroinertebrate Samples, Environment Agency, Bristol, UK.
Petersen, R.C. 1992. ‘The R.C.E: a Riparian, Channel & Environmental Inventory for small streams in the agricultural landscape’,
Freshwater Biology, 27, 295–306.
Petts, G.E. and Maddock, I. 1994. ‘Flow allocation for in-river needs’, in Calow, P. and Petts, G.E. (Eds), The Ri ers Handbook ,
Volume 2 . Hydrological and Ecological Principles, Blackwell Scientific Publications, London.
Petts, G.E. and Bickerton, M.A. 1997a. ‘River Wissey lnvestigations: linking hydrology & ecology. Eocective summary’, Enironment
Agency Project Report, 01/526 /1/A, Environment Agency, Bristol, UK.
Petts, G.E. and Bickerton, M.A. 1997b. ‘River Wissey investigations: linking hydrology & ecology. Manual for using macroinverte-
brates to assess in-river needs’, Enironment Agency Project Report 01/526 /3 /A, Environment Agency, Bristol, UK.
Petts, G.E. and Bickerton, M.A. 1997c. ‘River Wissey investigations: linking hydrology & ecology. Main report Part II’, Enironment
Agency Project Report 01/526 /4 /A, Environment Agency, Bristol, UK.
Poff, N.L. and Ward, J.V. 1989. ‘Implications of streamflow variability and predictability for lotic community structure: a regional
analysis of streamflow patterns’, Can. J . Fish Aquat. Sci ., 46, 1805–1817.
Reynoldson, T.B. 1978. ‘A key to the British species of freshwater Triclads’, FBA Scientific Publication, No. 23 , Ambleside, UK.Richter, B.D., Baumgartner J.V., Wigington, R., and Braun, D.P. 1997. ‘How much water does a river need?’, Freshwater Biology,
37, 231– 249.
Ryan, F.R. and Joiner, L.J. 1994. Minitab Handbook , Duxbury Press, California.
Savage, A.A. 1989. ‘Adults of the British aquatic Hemiptera Heteroptera. A key with ecological notes’, FBA Scientific Publication
No. 50 , Ambleside, UK.
Scott Wilson Kirkpatrick 1992. Method for Assessment of Low Flow Conditions Caused by Abstraction . National Rivers Authority
R & D Note. 45. Environment Agency, Bristol, UK.
Stalnaker, C.B. 1994. ‘Evaluation of instream flow habitat modelling’, in Petts, G.E. and Calow, P. (Eds), The Ri ers Handbook
Volume 2 . Hydrological and Ecological Principles, Blackwell Scientific Publications, London.
Statzner, B., Gore, J.A., and Resh, V.H. 1988. ‘Hydraulic stream ecology: observed patterns & potential applications’, J . N . Am.
Benthol . Soc., 7, 307– 360.
Swales, S. and Harris, J.H. 1995. ‘The Expert Panel Assessment Method (EPAM): a new tool for determining environmental flows
in regulated rivers’, in Harper, D.M. and Ferguson, A.J.D. (Eds), The Ecological Basis for Ri
er Management, Wiley, Chichester.Tennant, D.L. 1976. ‘Instream flow regimens for fish, wildlife, recreation and related environmental resources’, Fisheries, 1(4), 6–10.
Copyright © 1999 John Wiley & Sons, Ltd. Regul . Ri ers: Res. Mgmt. 15: 543–574 (1999)

8/9/2019 LIFE Paper PDF
http://slidepdf.com/reader/full/life-paper-pdf 32/32
C.A. EXTENCE ET AL.574
Wallace, I.D., Wallace, B., and Philipson, G.N. 1990. ‘A key to the case bearing Caddis Larvae of Britain and Ireland’, FBA
Scientific Publication, No 51, Ambleside, UK.
Wallace, I.D. 1991. ‘A review of the Trichoptera of Great Britain. Research and survey in nature conservation’, Nature Conserancy
Council No. 32 , Joint Nature Conservation Committee, Peterborough, UK.
Wood, P.J. and Petts, G.E. 1994. ‘Low flows and recovery of macroinvertebrates in a small regulated chalk stream’, Regul . Ri ers,
9, 303–316.
Wright, J.F., Moss, D., Armitage, P.D., and Furse, M.T. 1984. ‘A preliminary classification of running water sites in Great Britain
based on macroinvertebrate species and the prediction of community type using environmental data’, Freshwater Biol ., 14,
221–256.
Wright, J.F. and Berrie, A.D. 1987. ‘Ecological effects of groundwater pumping and a natural drought on upper reaches of a chalk
stream’, Regul . Ri ers, 1, 145– 160.
Wright, J.F. 1992. ‘Spatial and temporal occurrence of invertebrates in a chalk stream, Berkshire England’, Hydrobiologia, 248,
11–30.
Copyright © 1999 John Wiley & Sons, Ltd. Regul . Ri ers: Res. Mgmt. 15: 543–574 (1999)