Embed Size (px)
Citation preview

NREL is a national laboratory of the U.S. Department of Energy Office of Energy Efficiency & Renewable Energy Operated by the Alliance for Sustainable Energy, LLC
This report is available at no cost from the National Renewable Energy Laboratory (NREL) at www.nrel.gov/publications.
Contract No. DE-AC36-08GO28308
Life Prediction Model for Grid-Connected Li-ion Battery Energy Storage System Preprint Kandler Smith, Aron Saxon, Matthew Keyser, and Blake Lundstrom National Renewable Energy Laboratory
Ziwei Cao and Albert Roc SunPower Corp.
Presented at the 2017 American Control Conference Seattle, Washington May 24-26, 2017
Conference Paper NREL/CP-5400-67102 August 2017

NOTICE
The submitted manuscript has been offered by an employee of the Alliance for Sustainable Energy, LLC (Alliance), a contractor of the US Government under Contract No. DE-AC36-08GO28308. Accordingly, the US Government and Alliance retain a nonexclusive royalty-free license to publish or reproduce the published form of this contribution, or allow others to do so, for US Government purposes.
This report was prepared as an account of work sponsored by an agency of the United States government. Neither the United States government nor any agency thereof, nor any of their employees, makes any warranty, express or implied, or assumes any legal liability or responsibility for the accuracy, completeness, or usefulness of any information, apparatus, product, or process disclosed, or represents that its use would not infringe privately owned rights. Reference herein to any specific commercial product, process, or service by trade name, trademark, manufacturer, or otherwise does not necessarily constitute or imply its endorsement, recommendation, or favoring by the United States government or any agency thereof. The views and opinions of authors expressed herein do not necessarily state or reflect those of the United States government or any agency thereof.
This report is available at no cost from the National Renewable Energy Laboratory (NREL) at www.nrel.gov/publications.
Available electronically at SciTech Connect http:/www.osti.gov/scitech
Available for a processing fee to U.S. Department of Energy and its contractors, in paper, from:
U.S. Department of Energy Office of Scientific and Technical Information P.O. Box 62 Oak Ridge, TN 37831-0062 OSTI http://www.osti.gov Phone: 865.576.8401 Fax: 865.576.5728 Email: [email protected]
Available for sale to the public, in paper, from:
U.S. Department of Commerce National Technical Information Service 5301 Shawnee Road Alexandria, VA 22312 NTIS http://www.ntis.gov Phone: 800.553.6847 or 703.605.6000 Fax: 703.605.6900 Email: [email protected]
Cover Photos by Dennis Schroeder: (left to right) NREL 26173, NREL 18302, NREL 19758, NREL 29642, NREL 19795.
NREL prints on paper that contains recycled content.

1 This report is available at no cost from the National Renewable Energy Laboratory at www.nrel.gov/publications
Abstract— Lithium-ion (Li-ion) batteries are being deployed on the electrical grid for a variety of purposes, such as to smooth fluctuations in solar renewable power generation. The lifetime of these batteries will vary depending on their thermal environment and how they are charged and discharged. To optimal utilization of a battery over its lifetime requires characterization of its performance degradation under different storage and cycling conditions. Aging tests were conducted on commercial graphite/nickel-manganese-cobalt (NMC) Li-ion cells. A general lifetime prognostic model framework is applied to model changes in capacity and resistance as the battery degrades. Across 9 aging test conditions from 0oC to 55oC, the model predicts capacity fade with 1.4% RMS error and resistance growth with 15% RMS error. The model, recast in state variable form with 8 states representing separate fade mechanisms, is used to extrapolate lifetime for example applications of the energy storage system integrated with renewable photovoltaic (PV) power generation. Uncertainty quantification and further validation are needed.
I. INTRODUCTION As the percentage of renewable energy generation
increases on the electrical grid, energy storage can help smooth fluctuations in power generation from variable sources such as wind and solar. These can be large utility-scale installations or, depending on electricity rate structures, small energy storage installations installed in an individual home or business. Due in part to significant developments in the mobile electronics and automotive industry, Li-ion batteries at present hold cost, performance, energy/power density and lifetime advantages over other electrochemical battery chemistries.
Like all battery chemistries, Li-ion degrades with each charge and discharge cycle. Cycle life can be maximized by maintaining battery temperature near room temperature but drops significantly at high and low temperature extremes. Cycle life is also dependent on depth-of-discharge (DOD) and current, or C-rate. While it is common to discuss Li-ion lifetime in terms of number of cycles, often the calendar life
This work was supported by the U.S. Department of Energy under
Contract No. DE-AC36-08GO28308 with the National Renewable Energy Laboratory (NREL). Funding provided by SunPower Corporation and the U.S. DOE Office of Energy Efficiency and Renewable Energy Solar Energy Technologies Program. Kandler Smith is with NREL, Golden, CO 80401 USA (corresponding author phone: 303-275-4423; fax: 303-275-4415; e-mail: [email protected]). Aron Saxon is with NREL, Golden, CO 80401 USA (email: [email protected]). Matthew Keyser is with NREL, Golden, CO 80401 USA (email: [email protected]). Blake Lundstrom is with NREL, Golden, CO 80401 USA (email: [email protected]). Ziwei Cao is with SunPower Corp., Austin, TX 78758 USA (e-mail: [email protected]). Albert Roc is with SunPower Corp., Richmond, CA 94804 USA (e-mail: [email protected]).
of the cell is more limiting than cycle life. Detrimental side reactions occur within the cell even during storage. The rate of these deleterious side reactions increases with high temperature and high SOC. The electrochemical literature provides theoretical models of some individual mechanisms including side reactions impacting calendar life [1], cycling-driven electrode stress [2] and fracture [3], as well as coupling of calendar and cycling mechanisms [4]. The physics models are complex however, and not all degradation mechanisms are fully understood. As a result, the industry mainly uses semi-empirical lifetime models with varying range of complexity and accuracy [5-8]. These models extrapolate component-level accelerated aging test data to real-world lifetime scenarios.
As renewable power and energy storage industries work to optimize utilization and lifecycle value of battery energy storage, life predictive modeling becomes increasingly important. Typically, end-of-life (EOL) is defined when the battery degrades to a point where only 70-80% of beginning-of-life (BOL) capacity is remaining under nameplate conditions. Understanding temperature impact on battery performance is equally important to understanding degradation performance from a control or energy dispatch perspective. A battery’s capacity at 0oC, may be just 70% of that under nameplate conditions.
Under a cooperative research and development agreement with SunPower, NREL characterized the thermal and aging performance of commercial Li-ion cells with graphite negative and NMC positive electrodes. A thermal/life prognostic model is developed based on the experimental data from those tests. The model is used to extrapolate lifetime for an application where the battery energy storage system is integrated with renewable PV power generation.
II. CELL AGING EXPERIMENTS Eleven 75-Ah Kokam cells were tested under nine
different aging conditions (Table I). Cells were fully charged at constant current to 4.2V followed by constant voltage until current tapered to less than C/10. Cells were fully discharged at constant current to a minimum voltage limit of 3.0V. The 4.2V/3.0V max/min voltage range for 100% DOD aging tests was narrowed to 4.1V/3.4V for 80% DOD tests. All aging tests were interrupted once per month to run a reference performance test (RPT), nominally a full capacity measurement at the C/5 rate and resistance measurement via the hybrid pulse power characterization (HPPC) test procedure [9]. All RPTs were run at the aging test temperature, except for cell 11, 55oC storage, whose RPT temperature was lowered to 45oC to respect manufacturer temperature limits during charging. Two conditions included
Life Prediction Model for Grid-Connected Li-ion Battery Energy Storage System
Kandler Smith, Aron Saxon, Matthew Keyser, Blake Lundstrom, Ziwei Cao, Albert Roc

2 This report is available at no cost from the National Renewable Energy Laboratory at www.nrel.gov/publications
TABLE I. AGING TESTS FOR KOKAM 75-AH CELL
Test # Cycling tests
Temperature DOD Dis./charge rate Duty-cyclea # of cells
1,2 23oC 80% 1C/1C 100% 2 3 30oC 100% 1C/1C 100% 1 4 30oC 80% 1C/1C 50% 1 6,7 0oC 80% 1C/0.3C 100% 2 9 45oC 80% 1C/1C 100% 1
Test # Storage tests
Temperature SOC # of cells
5 30oC 100% 1 8 45oC 65% 1 10 45oC 100% 1 11 55oC 100% 1
a. Fraction of cycling time to total time
replicate cells. Under room temperature cycling with minimal fade, replicate cells 1 and 2 aged nearly identically to one another. Cells 6 and 7, aged at 0oC and experiencing severe fade, showed around 10% difference in fade rate.
III. CAPACITY FADE MODEL A life model including reversible thermal effects on performance is developed describing the cell’s capacity as measured at the C/5 rate as it varies with temperature, state-of-charge (SOC), depth-of-discharge (DOD), calendar time, and number of cycles. The approach follows previous battery life modeling framework [8] where capacity is controlled by the limiting of several competing degradation mechanisms. Amp-hour capacity directly relates to the number of moles of lithium (Li) that are shuttled between the negative and positive electrodes during discharge or charge of the battery. In rough order of importance, capacity changes over lifetime for the Kokam cell are due to three mechanisms:
1. Cyclable Li is consumed due to a solid-electrolyte interface (SEI) growth side reaction with time, coupled with electrode mechanical damage due to cycling
2. Negative electrode active sites that store cyclable Li are lost due to mechanical damage with cycling
3. Positive electrode active sites that store cyclable Li are gained due to increased surface area/electrolyte wetting during initial cycles, increasing the capacity that the positive electrode can hold with initial cycling. (Note that this phenomenon is much smaller than the other two and is only evident at BOL.)
Provided the battery is not severely cycled, the first mechanism, SEI growth, generally dominates in real-world aging conditions. Growth of the SEI accelerates with high average temperature and high average SOC. Generally the second mechanism, loss of electrode sites, outpaces the first
Fig. 1. Battery capacity as the minimum of three limiting mechanisms.
mechanism under low temperatures, high DODs, C-rates, and/or frequent cycling greater than, e.g., 4 cycles per day. Cycle life aging tests, particularly at low temperature, follow this limiting mechanism.
Development of the model from capacity and resistance aging data follows previous work [8]. Measured Amp-hour capacity, Q, is taken to be the minimum of Li-limited capacity QLi, negative electrode-site-limited capacity Qneg, or positive electrode-site-limited capacity Qpos.
( )posnegLi QQQQ ,,min= (1)
Fig. 1 shows an example how these three separate mechanisms can interact to each separately control capacity. Capacity on the y-axis is relative to BOL nameplate. during different portions of the battery’s life. Many other combinations of these mechanisms and thus fade patterns are also possible depending on the aging condition.Model equations below use common reference constants Tref = 298.15 K, Vref = 3.7 V, and U-,ref = 0.08 V, Faraday constant F = 96485 A s mol-1, and universal gas constant Rug = 8.314 J K-1 mol-1.
A. Beginning-of-Life Capacity Increase & Temperature Dependence First we consider battery capacity at BOL, assumed to be
controlled by positive electrode-site-limited capacity, Qpos. Fig. 2 shows data for the first several cycles of the aging test. Temperature is the main factor controlling capacity at BOL. Capacity increases a small amount, on the order of 0.5%, over the first cycles. These two effects are captured mathematically as:
( ))))) ())))
BOLatcapacityinIncrease
dispos AhddQ )228/exp(130 −−+=
(2)
−
−
−−=
222,,1,,
,001
)(11
)(1exp 00
refRPTug
da
refRPTug
daref TtTR
ETtTR
Edd
(3)

3 This report is available at no cost from the National Renewable Energy Laboratory at www.nrel.gov/publications
Fig. 2. Initial capacity described by positive electrode-site-limited capacity model.
where Ahdis is the cumulative Amp-hours discharged from the cell. The remaining parameters are fit using the nonlinear least-squares function nlinfit in Matlab©, with values of d3 = 0.46 Ah, d0,ref = 75.10 Ah, Ea,d0,1=34300 J mol-1, and Ea,d0,2 = 74860 J mol-1 providing the best fit.
A. Calendar Life Capacity Fade with Mild Dependence on Cycling Next, we consider the Li-limited capacity, QLi, generally
exhibited under storage aging conditions, but also for mild-to-moderate cycling conditions where capacity fade rate decelerates with time and does not experience sudden fade. All Li-ion batteries with graphite or carbon negative electrodes lose Li due to a SEI growth side reaction. The side reaction is generally diffusion limited and therefore proceeds with the square root of time. Individual storage capacity fade test conditions dominated by this diffusion-limited side reaction can be described using a model of the form 2/1
10 tbb + . For the present cell, two additional terms must also be included to account for Li loss proportional to cycling and a small loss of Li at BOL as the cell is broken in. With these three Li loss mechanisms, the model is
( )
−−−−−=−
))) ()))
BOLatmechanisminBreak
b
cyclingwithLoss
timecalendarwithgrowthSEI
Li tbNbtbbdQ 3322/1
100 /exp(1 t
(4)
In this Li loss model, d0 captures temperature dependence of initial capacity as previously described. Coefficients b1, b2, and b3 are dependent on the aging condition as follows:
[ ]1
1
11 )(exp)()(exp1
)(1exp max
,,11
bDODTU
tTtU
RF
TtTRE
bb bref
ref
ug
b
refug
baref
bga
−
−−= −
(5)
−−=
refug
baref TtTR
Ebb 1
)(1exp 2,
,22
(6)
( )max,
,33 1)()(exp1
)(1exp 33 DOD
TV
tTtV
RF
TtTRE
bbref
refOC
ug
b
refug
baref θ
a+
−
−−=
(7)
The data show that high or low average temperature, high average SOC and high maximum DOD all accelerate Li-loss capacity fade. High temperature and SOC both accelerate the SEI growth side reaction. Deep cycling mechanically disturbs the SEI, creating fresh electrode surface area where new SEI can form. This mechanical damage can also be accelerated by low temperature.
Li-loss model parameters are fit mostly in a sequential fashion following dominant trends in the data as described below. However, small iterative adjustments are made along the way to improve overall quality of fit.
1. First, a simple model 2/110 tbyy −= is fit only to storage
aging data (DODmax = 0) for data after 50 days of aging, providing parameters b1,ref = 3.503e-3 day-0.5, Ea,b1 = 35392 J mol-1 and αb1 = 1.0.
2. Next, the simple model is also fit to moderate cycling conditions that follow the square root of time fade trajectory, providing parameters γ = 2.472 and βb1 = 2.157.
3. Fitting the simple model 2/110 tbyy −= to data beyond the
first 50 days showed that the y-intercept, y0, varied with temperature and DOD. This motivated the inclusion of the break-in mechanism model. Fitted parameters are b0 = 1.07, b3,ref = 2.805e-2, Ea,b3 = 42800 J mol-1, αb3 = 0.0066, τb3 = 5, and θ = 0.135.
4. Initially neglecting the b2 term, model error increased proportionally with number of cycles, motivating the inclusion of the cycling dependent term. Including this term in the model with parameters b2,ref = 1.541e-5 and Ea,b2 = –42800 J mol-1 improved the quality of fit.
Fig. 3 shows a comparison of the model with data. The model matches all cases well except 0°C cycling conditions for which the model under predicts capacity fade after 200 days. (In the following section, those under-predicted aging conditions are captured by including an additional negative electrode site loss mechanism.) Excluding the 0°C test cases, the model has a quality of fit of R2 = 0.97 and root mean square error, RMSE = 0.77 Ah, or an average error of 1.0% relative to the cell’s 75-Ah nameplate capacity.
B. Cycle Life Model Active sites may be lost from both electrodes due to
expansion and contraction of the Li host materials during charge and discharge cycling causing mechanical stress and fatigue. The graphite negative electrode expands up to 8% during a full discharge. The NMC positive electrode expands on the order of 2%; hence, the loss of negative electrode active sites is assumed to outpace the positive. The negative electrode site-loss model assumes that the site capacity lost with each cycle, N, is inversely proportional to the amount of remaining sites. In other words, as sites are lost, the remaining sites are stressed more and more in order to maintain the same duty cycle,

4 This report is available at no cost from the National Renewable Energy Laboratory at www.nrel.gov/publications
Fig. 3. Positive- and Li-limited capacity fade model. (a) Model versus data. (b) Model error.
−=
neg
neg
Qc
dNdQ 2
. (8)
The analytical solution to this ordinary differential equation is:
[ ]21
022
0 2 NcccQneg −= (9)
Coefficient c0 represents the initial negative electrode site capacity. Rate of capacity loss per cycle, c2, is dependent on temperature, DOD, and C-rate. Too little data are available here to separately characterize C-rate and DOD effects, however based on previous experience, DOD is the dominant effect. The present rate model captures temperature and DOD dependence
( ) 22 1)(
1exp ,,22
cDODTtTR
Ecc
refug
caref
b
−−=
(10)
Data beyond 170 days for 0oC and 23oC are used to fit the negative electrode site loss model, providing c2,ref=
Fig. 4. Final capacity fade model, incorporating positive-, negative-, and Li-limiting mechanisms. (a) Model versus data. (b) Model error.
3.9193e-3 Ah cycle-1, βc2 = 4.54, and Ea,c2 = –48260 J mol-1. The initial negative site capacity, c0 also shows slight temperature dependence fitted with parameters c0,ref = 75.64 Ah and Ea,c0 = 2224 J mol-1.
−−=
refug
caref TtTR
Ecc 1
)(1exp 0,
,00
(11)
Fig. 4 shows the final capacity fade model, with R2=0.99 and RMSE of 1.05 Ah, or 1.4% of nameplate. The cases with largest model error are those with the most fade. For cell 11 aged under storage at 55oC, the model slightly under-predicts fade. For 0oC cycling, cells 6 and 7, the model falls between the fade experienced by the two replicate cells. Cell 6 fade is slightly under-predicted; Cell 7 is slightly over-predicted. Fade is predicted within ±5% error bounds for all cells.
IV. RESISTANCE MODEL
Additional model equations are developed and parameterized describing cell resistance at 50% SOC for a 10-second pulse discharge, as it evolved over the course ofthe cell aging tests. Similar to the capacity fade model, theresistance growth model captures resistance changes with
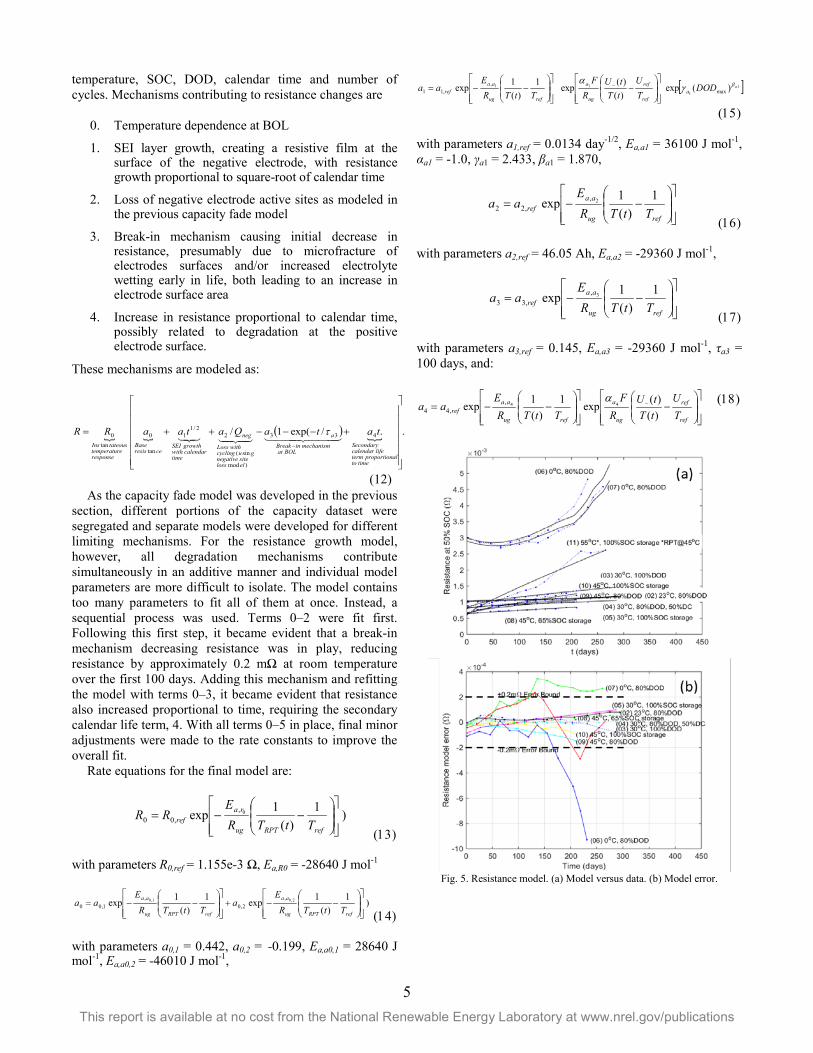
5 This report is available at no cost from the National Renewable Energy Laboratory at www.nrel.gov/publications
temperature, SOC, DOD, calendar time and number of cycles. Mechanisms contributing to resistance changes are
0. Temperature dependence at BOL
1. SEI layer growth, creating a resistive film at the surface of the negative electrode, with resistance growth proportional to square-root of calendar time
2. Loss of negative electrode active sites as modeled in the previous capacity fade model
3. Break-in mechanism causing initial decrease in resistance, presumably due to microfracture of electrodes surfaces and/or increased electrolyte wetting early in life, both leading to an increase in electrode surface area
4. Increase in resistance proportional to calendar time, possibly related to degradation at the positive electrode surface.
These mechanisms are modeled as:
( )
../exp(1/ 433
)mod
sin(
22/1
1
tan
0tan
0
+−−−++=−
timetoalproportionterm
lifecalendarSecondary
BOLatmechanisminBreak
a
ellosssitenegative
gucyclingwithLoss
neg
timecalendarwithgrowthSEI
ceresisBase
responseetemperatur
tateousIns
tataQataaRR))) ())) )()(
t
(12) As the capacity fade model was developed in the previous
section, different portions of the capacity dataset were segregated and separate models were developed for different limiting mechanisms. For the resistance growth model, however, all degradation mechanisms contribute simultaneously in an additive manner and individual model parameters are more difficult to isolate. The model contains too many parameters to fit all of them at once. Instead, a sequential process was used. Terms 0–2 were fit first. Following this first step, it became evident that a break-in mechanism decreasing resistance was in play, reducing resistance by approximately 0.2 mΩ at room temperature over the first 100 days. Adding this mechanism and refitting the model with terms 0–3, it became evident that resistance also increased proportional to time, requiring the secondary calendar life term, 4. With all terms 0–5 in place, final minor adjustments were made to the rate constants to improve the overall fit.
Rate equations for the final model are:
)1
)(1exp 0,
,00
−−=
refRPTug
raref TtTR
ERR
(13)
with parameters R0,ref = 1.155e-3 Ω, Ea,R0 = -28640 J mol-1
)1)(
1exp1)(
1exp 2,01,0 ,2,0
,1,00
−−+
−−=
refRPTug
aa
refRPTug
aa
TtTRE
aTtTR
Eaa
(14)
with parameters a0,1 = 0.442, a0,2 = -0.199, Ea,a0,1 = 28640 J mol-1, Ea,a0,2 = -46010 J mol-1,
[ ]1
1
11 )(exp)()(exp1
)(1exp max
,,11
aDODTU
tTtU
RF
TtTRE
aa aref
ref
ug
a
refug
aaref
bga
−
−−= −
(15)
with parameters a1,ref = 0.0134 day-1/2, Ea,a1 = 36100 J mol-1, αa1 = -1.0, γa1 = 2.433, βa1 = 1.870,
−−=
refug
aaref TtTR
Eaa 1
)(1exp 2,
,22
(16)
with parameters a2,ref = 46.05 Ah, Ea,a2 = -29360 J mol-1,
−−=
refug
aaref TtTR
Eaa 1
)(1exp 3,
,33
(17)
with parameters a3,ref = 0.145, Ea,a3 = -29360 J mol-1, τa3 = 100 days, and:
−
−−= −
ref
ref
ug
a
refug
aaref T
UtTtU
RF
TtTRE
aa)()(exp1
)(1exp 44,
,44
a (18)
Fig. 5. Resistance model. (a) Model versus data. (b) Model error.

6 This report is available at no cost from the National Renewable Energy Laboratory at www.nrel.gov/publications
Fig. 6. Resistance model versus all data except the most severe fade cases at 0°C and 55°C. (a) Model versus data. (b) Model error.
with parameters a4,ref = 5.357e-4 day-1, Ea,a4 = 77470 J mol-1
and αa4 = -1.0.
Fig. 5 shows the resistance model together with data for all 13 cell tests. The model has quality of fit R2 = 0.98. Root- mean-square error is 0.15 mΩ, which is 15% of the cell’s nameplate 1-mΩ resistance at room temperature and BOL. The largest model error is for cells that aged at 0°C or 55°C and experienced the most significant fade.
Fig. 6 shows the resistance model against all data except the 0°C and 55°C severe aging cases. Within this subset of moderate aging conditions the model has quality of fit R2 = 0.96. Root-mean-square error is 0.044 mΩ, which is 4.4% of the cell’s nameplate resistance.
V. SIMULATION OF GRID STORAGE APPLICATIONS For simulation of variable temperature, variable cycling
scenarios, the model is recast in state variable form [8]. The model has eight states, with equations (2), (4), (8) and (12) contributing 1,3,1 and 4 states respectively. Here, example simulation results are given for capacity degradation of the battery in a PV-battery integrated system operating in self-consumption mode. In this mode, the inverter attempts to
Fig. 7. Battery response when integrated with PV system operating in self-consumption mode. Synthetic data was added to experimental data to complete a 24-hour scenario for purposes of battery aging simulation.
Fig. 8. Simulated battery capacity fade under self-consumption mode operation with seasonal ambient temperature variation of 18/28/12/5oC for spring/summer/fall/winter seasons, respectively.
serve local loads using only PV and/or battery as long as possible until an SOC limit is reached. Other battery/PV modes of operation and experimental test results are explored in [10].
Figure 7 shows experimental data of battery cell response to self-consumption mode power profile with 28oC ambient temperature. Key factors impacting battery degradation rate are battery average temperature of 32oC, average SOC of 45%, maximum DOD of 74%, and daily Amp-hour throughput of 69 Ah (discharge direction, with positive current). Assuming repeated cycling in this mode for 365 days/year, the battery lasts 7.3 years to 70% of 75Ah name-

7 This report is available at no cost from the National Renewable Energy Laboratory at www.nrel.gov/publications
Fig. 9. Impact of battery oversizing and thermal management on lifetime.
plate. In the case the battery is mounted outside a building, it will be exposed to ambient temperature variation. Cell-to-cell aging inhomogeneity due to temperature gradients and aging process non-uniformity are neglected.
Figure 8 shows a simulated aging result with seasonal ambient temperature variation of 18/28/12/5oC representing spring, summer, fall and winter seasons, respectively, together with modest cell temperature rise. The cold temperatures impose additional degradation compared to the constant 28oC ambient temperature. In this case, the battery lasts 4.9 years until it degrades to 70% of nameplate capacity. The battery first falls below this performance threshold during a winter season.
The utility of the simulation model is that it enables rapid exploration of multiple system design and control scenarios. Two methods to extend lifetime include (1) oversizing the battery and thereby restricting its maximum daily DOD and (2) adding battery thermal management. These tradeoffs are shown in Figure 9. Daily average SOC is maintained at 45% across all cases. The SOC operating range is narrowed at the maximum and minimum extremes to sweep DOD. In the case of no thermal management, battery temperature varies with outside ambient temperature, heat generation and heat dissipation rate. The impact is that cell temperatures swing from 5oC in the winter to 35oC in the summer. In this case it is only possible to get 7 years life out of the battery using it within a restricted 47% DOD operating range. If a thermal management system were added to maintain battery cell temperatures within a 20-30oC operating range year-round, the battery life is extended from 4.9 years to 7.0 years cycling the battery at 74% DOD. Life is improved to 10 years using the same thermal management and further restricting DOD to 54%. The cost/benefit of oversizing the battery versus adding thermal management can readily be quantified versus the cost/benefit of importing/exporting electricity from/to the grid.
VI. CONCLUSION A battery life prognostic model was identified from 9 cell
accelerated aging experiments conducted on 11 cells over
300 days at temperatures ranging from 0oC to 55oC and DODs ranging from storage to 100% DOD. Model error increases with the magnitude of fade and further efforts are desired to improve model accuracy and validate the model versus untested aging conditions, including long-term, real-world aging in the field. Model error, averaging 1.4% of capacity and 15% of resistance, is nonetheless reasonably low that the model is valuable to provide tradeoffs in battery lifetime for different battery system designs and operating scenarios for energy storage integrated with renewable power generation. An example scenario was simulated wherein an integrated battery-PV system was controlled in self-consumption mode, attempting to minimize energy exchanged with the grid. For this application, battery lifetimes ranging from 7-10 years may be expected. Without active thermal management, 7 years lifetime is possible provided the battery is cycled within a restricted 47% DOD operating range. With active thermal management, 10 years lifetime is possible provided the battery is cycled within a restricted 54% operating range. Together with battery capital cost and electricity cost, the life model can be used to optimize the overall life-cycle benefit of integrating battery energy storage on the grid.
ACKNOWLEDGMENT The U.S. Government retains and the publisher, by
accepting the article for publication, acknowledges that the U.S. Government retains a nonexclusive, paid-up, irrevocable, worldwide license to publish or reproduce the published form of this work, or allow others to do so, for U.S. Government purposes.
REFERENCES [1] H.J. Ploehn, R. Premanand, R.E.White, “Solvent diffusion model for aging of lithium-ion battery cells,” J. Echem. Soc. (2004) 151 (3) A456-A462. [2] J. Christensen, J. Newman, “A mathematical model of stress generation and fracture in lithium manganese oxide,” J. Echem. Soc. (2006) 153 (6) A1019-1030. [3] K. An, P. Barai, K. Smith, P.P. Mukherjee, (2014) “Probing the Thermal Implications in Mechanical Degradation of Lithium-Ion Battery Electrodes,” J. Electrochem Soc. 161 (6) A1058-A1070. [4] R. Deshpande, M. Verbrugge, Y.-T. Cheng, J. Wang, P. Liu, “ Battery cycle life prediction with coupled chemical degradation and fatigue mechanics,” J. Electrochem. Soc., 159 (10) A1730-A1738 (2012). [5] J. Wang, P. Liu, J. Hicks-Garner, E. Sherman, S. Soukiazian, M. Verbrugge, H. Tataria, J. Musser, P. Finamore, “Cycle-life model for graphite-LiFePO4 cells,” J. Power Sources 196 (2011) 3942-3948. [6] S.B. Peterson, J. Apt, J.F. Whitacre, “Lithium-ion battery cell degradation resulting from realistic vehicle and vehicle-to-grid utilization,” J. Power Sources, 195 (2010) 2385-2392. [7] J. Schmalstieg, S. Kabitz, M. Ecker, D.U. Sauer, “A holistic aging model for Li(NiMnCo)O2 based 18650 lithium-ion batteries,” J. Power Sources 257 (2014), 325-334. [8] S. Santhanagopalan, K. Smith, J. Neubauer, G.-H. Kim, A. Pesaran, M. Keyser, Design and Analysis of Large Lithium-Ion Battery Systems, Artech House, Boston, 2015. [9] US Department of Energy - Vehicle Technologies Program Battery Test Manual for Plug-In Hybrid Electric Vehicles, Revision 3, Sept. 2014, INL/EXT-14-32849. [10] B. Lundstrom, et al. (in preparation).
35 40 45 50 55 60 65 70 75
DOD (%)
4
5
6
7
8
9
10
11
12Y
ears
to 7
0% re
mai
ning
cap
acity
No thermal management (5 ° C < Tcell
< 35 ° C)
w/ thermal management (20 ° C < Tcell
< 30 ° C)


![Title Surface and interface sciences of Li-ion …...small electric devices because they offered high energy densities [7]. At present, Li-ion batteries are At present, Li-ion batteries](https://img.pdfslide.net/doc/110x75/5fca8c1a4ca84c29b868f81b/title-surface-and-interface-sciences-of-li-ion-small-electric-devices-because.jpg)