Embed Size (px)
Citation preview
OBSERVATORIO DE POLÍTICAS PÚBLICAS - POLISFacultad de Ciencias Administrativas y Económicas
Universidad IcesiISSUE N° 19 January 2019
ISSN: 1909-7964
Policy Brief N° 19
AN EXPANDING RESEARCH AREA
LIFESATISFACTION

Policy Brief N° 19
OBSERVATORIO DE POLÍTICAS PÚBLICAS - POLISFacultad de Ciencias Administrativas y Económicas
Universidad IcesiISSUE N° 19 January 2019
ISSN: 1909-7964
LIFESATISFACTION
AN EXPANDING RESEARCH AREA

INDEX
Subjective well-being in Cali. CaliBRANDO measurement system
SECTION 1
SECTION 2
CaliBRANDO surveyMethodologySurvey results
Life satisfaction in Cali. Equal satisfaction for all?Lina Martínez
Measuring subjetive well-being
Official statistics of subjective well-being: continuing topush the measurement agendaVincent Siegerink
Subjective social indicators and public policy: 1993 to 2017Robert A. Cummins
PresentationAbout POLISAbout Cali
3 -678
9 -10
11- 1213
14 - 30
31 -38
39 -40
41 -46
47 - 54
Page

SECTION 3
SECTION 4
Country level research
Subjective well-being analysis: the Colombian caseFelipe Castro, Nadia Puerta & Carlos Castañeda
Quality of life in CroatiaLjiljana Kaliterna
The many overlapping areas of research in well-being: economics,education and international migration
Research on happiness and economicsBruno Frey
Subjective well-being an education: a brief overview of the literatureMaría del Mar Salinas & Lucía Mateos
Happiness consequences of international migrationMartijn Hendricks
55 -56
57 -62
63 - 68
69 - 70
71 - 76
77 - 82
83 - 88
Page

3
Policy Brief Polis N° 19 | CaliBRANDO
Happiness, life satisfaction or subjective well-be-ing. All of them elusive concepts that have been strongly related to the quality of life. Since the 70’s, there has been an acknowledgment that life satisfaction goes beyond a personal sphere. The growing literature on life satisfaction - that is feed from a broad scope of disciplines- has large-ly established that life satisfaction goes beyond personal and private factors such as money or financial stability. Now life satisfaction is well connected with many societal factors: a high degree of trust in the community, social capital, government performance, inequality, environ-mental policies, residential location or political
participation, amongst many more. The bulk of evidence has led to the discussion of the signifi-cant role that the government plays on promoting better policies for enhancing the overall well- being of the population. We now understand that where people live, the services they receive from government, the safety of their streets and the quality of their children’s education are important factors in making people more satis-fied with their lives.
The larger share of the evidence of the connec-tion with life satisfaction with government performance is reported in developed countries.
Presentation

4
Survey results | CaliBRANDO
In Latin America, in the recent past, there have been important efforts to measure life satisfaction and include this dimension in the national statisti-cal systems with findings that challenge the tradi-tional view –build from evidence in the global North- of what increases people´s well-being.
Let´s take the case of Colombia as an example of the significant differences in the research on life satisfaction. During the last two decades, Colom-bia moved from low income to a middle income country. The reduction in poverty rates, income increase, and the expansion of a middle class are improving the quality of life across all
socioeconomic brackets. Colombia has also made a reputation around the world for all the wrong reasons: the largest civil conflict in Latin Ameri-ca and the violence provoked by drug-trafficking during the 80’s and 90’s. Like many countries in the global South, the economic affluence expe-rienced in the country has been limited for a few generating deep social inequalities and promo-ting urban crime. There is also a widespread culture of illegality in the country and govern-ment corruption, which in turn affect civic trust and political participation.
5
Policy Brief Polis N° 19 | CaliBRANDO
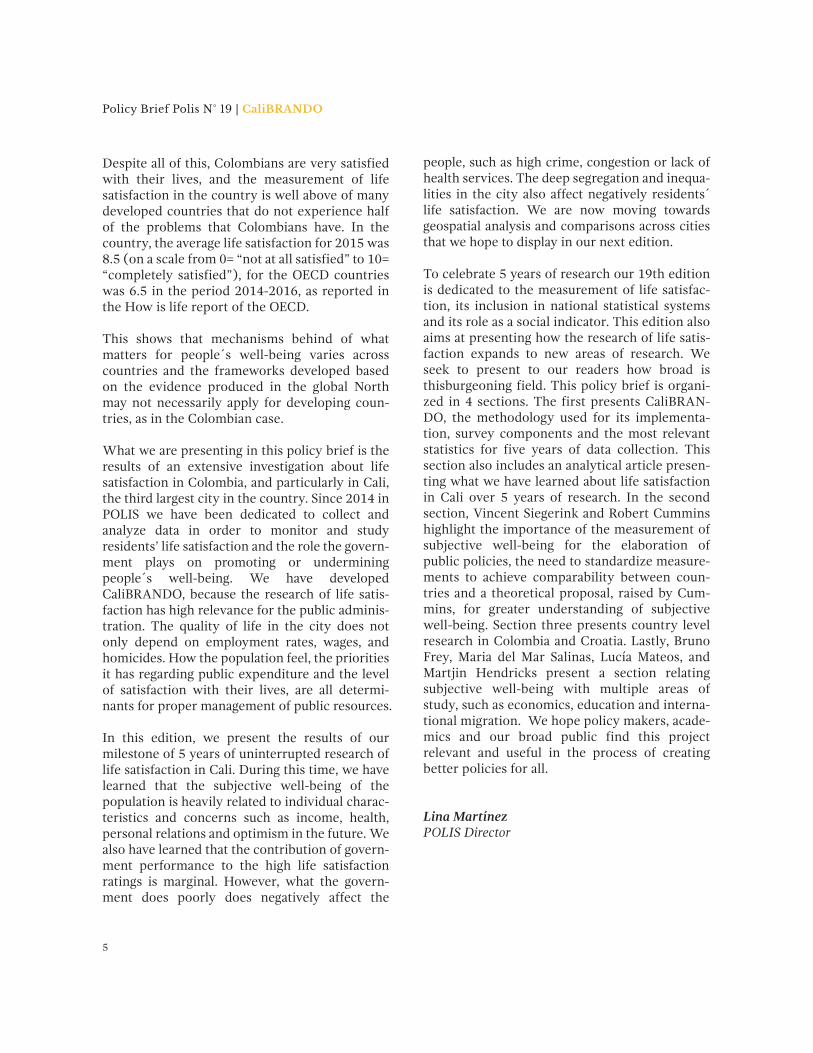
Despite all of this, Colombians are very satisfied with their lives, and the measurement of life satisfaction in the country is well above of many developed countries that do not experience half of the problems that Colombians have. In the country, the average life satisfaction for 2015 was 8.5 (on a scale from 0= “not at all satisfied” to 10= “completely satisfied”), for the OECD countries was 6.5 in the period 2014-2016, as reported in the How is life report of the OECD.
This shows that mechanisms behind of what matters for people´s well-being varies across countries and the frameworks developed based on the evidence produced in the global North may not necessarily apply for developing coun-tries, as in the Colombian case.
What we are presenting in this policy brief is the results of an extensive investigation about life satisfaction in Colombia, and particularly in Cali, the third largest city in the country. Since 2014 in POLIS we have been dedicated to collect and analyze data in order to monitor and study residents’ life satisfaction and the role the govern-ment plays on promoting or undermining people´s well-being. We have developed CaliBRANDO, because the research of life satis-faction has high relevance for the public adminis-tration. The quality of life in the city does not only depend on employment rates, wages, and homicides. How the population feel, the priorities it has regarding public expenditure and the level of satisfaction with their lives, are all determi-nants for proper management of public resources.
In this edition, we present the results of our milestone of 5 years of uninterrupted research of life satisfaction in Cali. During this time, we have learned that the subjective well-being of the population is heavily related to individual charac-teristics and concerns such as income, health, personal relations and optimism in the future. We also have learned that the contribution of govern-ment performance to the high life satisfaction ratings is marginal. However, what the govern-ment does poorly does negatively affect the
people, such as high crime, congestion or lack of health services. The deep segregation and inequa-lities in the city also affect negatively residents´ life satisfaction. We are now moving towards geospatial analysis and comparisons across cities that we hope to display in our next edition.
To celebrate 5 years of research our 19th edition is dedicated to the measurement of life satisfac-tion, its inclusion in national statistical systems and its role as a social indicator. This edition also aims at presenting how the research of life satis-faction expands to new areas of research. We seek to present to our readers how broad is thisburgeoning field. This policy brief is organi-zed in 4 sections. The first presents CaliBRAN-DO, the methodology used for its implementa-tion, survey components and the most relevant statistics for five years of data collection. This section also includes an analytical article presen-ting what we have learned about life satisfaction in Cali over 5 years of research. In the second section, Vincent Siegerink and Robert Cummins highlight the importance of the measurement of subjective well-being for the elaboration of public policies, the need to standardize measure-ments to achieve comparability between coun-tries and a theoretical proposal, raised by Cum-mins, for greater understanding of subjective well-being. Section three presents country level research in Colombia and Croatia. Lastly, Bruno Frey, Maria del Mar Salinas, Lucía Mateos, and Martjin Hendricks present a section relating subjective well-being with multiple areas of study, such as economics, education and interna-tional migration. We hope policy makers, acade-mics and our broad public find this project relevant and useful in the process of creating better policies for all.
Lina MartínezPOLIS Director


POLIS in an observatory of public policy of Universidad Icesi. We are located in Cali, the third largest city in Colombia. At POLIS we are committed to conducting empirical research on policy relevant topics using the rigorousness of the academic research but responding to the needs of governments. We aim at providing relevant information to promote an evidence based policy making culture in the city. We produce research on urban policies, crime, subjective well-being, health and informal economy.
Our main unit of analysis is the city of Cali but we also study policy issues in the Pacific region.
About POLIS
Policy Brief Polis N° 19 | CaliBRANDO

About CaliCali is the third largest city in Colombia, with a population of 2.4 million. The city is one of the main industrial centers of the country and the major economic hub in the Pacific region.
Cali is a standing case study from a public policy perspective. Alike many cities in Latin America, the city is experiencing demographic and economic growth and present a high prevalence of informal economy that is the resort of the poor. The middle class is expanding and the government is in a process of improving govern-ment performance, accountability and offering better public services to its population.
The city is also unique in the region on other fronts. Cali has a long crime history, is a major host for displaced population of the internal conflict and also has a distinctive confluence of culture from the Pacific region.
At POLIS we are committed to understanding this city and people´s perceptions about gover-nment performance. From the academia, we aim at providing relevant information for a better policy making.
8
About POLIS - Cali | CaliBRANDO

Subjective well-beingin Cali. CaliBRANDOmeasurement system
Section 1
CaliBRANDO surveyMethodologySurvey results
Life Satisfaction in Cali. Equal satisfaction for all?Lina Martínez


11
Policy Brief Polis N° 19 | CaliBRANDO
Since 2014, the Observatory of Public Policy - POLIS - of Universidad Icesi is implementing a survey about life satisfaction in Cali (Colombia) called CaliBRANDO. The purpose of this survey is to measure life satisfaction within the population. The project also aims at understanding the relationship between life satisfaction and government performance.
This survey allows to:
• Identify aspects of the city that matter (and do not matter) to the population.
• Understand in a more integrated manner the basic needs of the population.
Since 2014, the survey has been replicated in 2015, 2016, 2017 and 2018. In this first section, the aggregated results of the five years are presented, as well as an analytical article of life satisfaction in Cali.
1.Socio-demographic conditions
5.Health
2.Education
3.Employment
4.Income
CaliBRANDOsurvey
12
CaliBRANDO survey | CaliBRANDO
Since 2017, an institutional and interpersonal trust section was included, which was based on the methodological guide for measuring inter-personal and institutional trust of the OECD. The purpose of this section is to assess the level of trust that citizen has in different institutions in the city: town council, national police and the civil services.
6.Life satisfaction
7.City satisfaction
8.Personal satisfaction
9.Institutional trust
10.Satisfaction and other areasof research
Trust
Since 2016, CaliBRANDO introduced a middle class section, which is collected every two years in the city. In this section, the consumption patterns and other socieconomic aspects of the low income and middle income population are compared. The middle class survey was desig-ned in order to collect information about the following topics: consumption and aspirations, access to banking services, attitudes towards government programs and evaluation of govern-ment performance.
Middle class: expansion and consumption
Since 2014, CaliBRANDO has introduced the measures used by the Centers for Disease Control and Prevention (CDC) to conduct a population assessment of health-related quality of life. The set of variables included in the health section of CaliBRANDO allows to proxy for mental, physical health and overweight - obesity. The survey uses objective measures to estimate the body mass index (BMI) of the population participating in the survey. Respondents are measured and weighted using electronic portable scales. Since 2015, questions about physical activity have been included in the survey.
Physical - mental health and obesity
Other research usingCaliBRANDO data
13
Policy Brief Polis N° 19 | CaliBRANDO
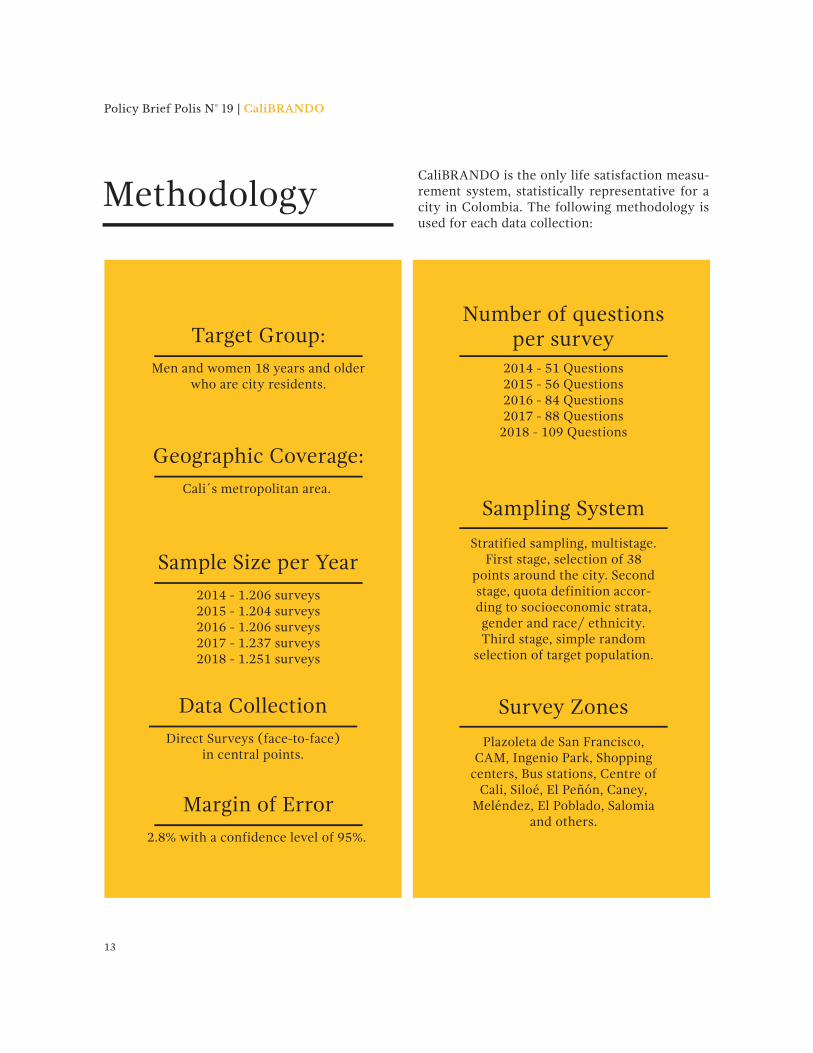
CaliBRANDO is the only life satisfaction measu-rement system, statistically representative for a city in Colombia. The following methodology is used for each data collection:
Target Group:
Men and women 18 years and olderwho are city residents.
per surveyNumber of questions
2014 - 51 Questions2015 - 56 Questions2016 - 84 Questions2017 - 88 Questions
2018 - 109 Questions
Sampling System
Geographic Coverage:
Cali´s metropolitan area.
Sample Size per Year
2014 - 1.206 surveys2015 - 1.204 surveys2016 - 1.206 surveys2017 - 1.237 surveys2018 - 1.251 surveys
Data Collection
Direct Surveys (face-to-face)in central points.
Margin of Error
2.8% with a confidence level of 95%.
Stratified sampling, multistage. First stage, selection of 38
points around the city. Second stage, quota definition accor-ding to socioeconomic strata, gender and race/ ethnicity. Third stage, simple random
selection of target population.
Survey Zones
Plazoleta de San Francisco, CAM, Ingenio Park, Shopping
centers, Bus stations, Centre of Cali, Siloé, El Peñón, Caney,
Meléndez, El Poblado, Salomia and others.
Methodology

Survey results

Socioeconomic strata1
Cali is composed in greater proportion by socioeconomic strata 1, 2 and 3. Although most of the population is in the lowest strata (50%), a considerable proportion of the city belongs to the middle class (40%). When analyzed by race/ethnicity it is found that there is a considerable gap between the afro population and the white/mestizo population, 66% of afro population live in strata 1 and 2, while around 44% of whites or mestizos live in these strata.
1 National government uses households stratification as a mechanism for targeting social spending. Households are classified in a scale 1 to 6 based on their physical and social conditions. Households classified as 1 in the scale are the poorest, 6 are the richest.2 Socioeconomic strata.
2014 2015 2016 2017 2018
10%
0%
20%
30%
40%
50%
SES2 1 SES 2 SES 3 SES 4 SES 5 SES 6
20% 20%
30%30% 30% 30% 30%29%
33%34%
10% 10% 10%10%8% 8% 8%
1% 1%2% 2% 2%
5% 5%
11%
21%
26%25% 25% 25%
Graph 1.1
1. Socio-demographicconditions
15
Policy Brief Polis N° 19 | CaliBRANDO

The racial/ethnic composition shows that the majority of the population surveyed according to their cultural, ethnic group or physical characteris-tics identify themselves as mestizo (multi-racial). The white population, follow by the black/afro community. In 2016, the survey was adjusted to be representative of race/ethnicity.
2014 2015 2016 2017 2018
30%
43%
49%
38%40%41%
6% 6%7%
16%17%
27% 27%
25%
4% 4% 3%2% 2%2% 2% 2% 2% 2%1%
3%
26% 26%
24%25%
10%
0%
20%
30%
40%
50%
Mestizo White Black/Afro Native Other None
65%
34%
44%
38%
39%
35%
61%
62%
66%
56%
Have children
Do not havechildren
2014 2015 2016 2017 2018 Single Cohabitation Married Divorced Widowed
2014
2017
2018
2015
2016
EthnicityGraph 1.2
Marital statusGraph 1.3
Percentage of people with childrenGraph 1.4
16
Survey results | CaliBRANDO
43% 26% 22% 6% 3%
46% 27% 20% 5% 2%
47% 25% 23% 4% 1%
47% 25% 19% 8% 2%
49% 27% 15% 6% 2%

Most Cali citizens have studied until secondary school. An important proportion has reached a technical/technological level. Comparing by gender it is found that more women have reached technical studies (24%) than men (20%). However, more men have achieved professional studies compared to women (21% and 19%, respectively). Only 12% of the afro population have reached college whereas within whites and mestizos the proportions increases to (23%).
Elementary Secondary Technical Professional Graduate None
10% 10%
3% 3% 3% 3%
1% 1% 1%
40%
23% 23%
1%
47%
21% 21%21%
17% 17% 18%
12% 12%
46% 45%
10%
0%
20%
30%
40%
50%
2014 2015 2016 2017 2018
4%
0%
26%
23%
6%
41%
Education levelGraph 2.1
2. Education
17
Policy Brief Polis N° 19 | CaliBRANDO

In all the years analyzed, most respondents are working in a company. When analyzed by socioeco-nomic strata, respondents on strata 1 are the ones who work mostly as independent (41%) compa-red to the middle class (33%) or high class (29.5%). The proportion of citizens of lower strata who are working in a company formally tends to be lower (28%).
Work in acompany
Self-employed No activity Domestic work Studying Unemployed Other
38%36%
40%
35% 34%
30%
33%33%
37%
10%
0%
20%
30%
40%
50%
2014 2015 2016 2017 2018
8% 8% 8% 8%9%
7% 7% 7%
2%3% 4%4%
6% 6%
4% 4% 4% 4%2% 2%
41%
7%
10%
5%3% 1%
Economic activityGraph 3.1
3. Employment
18
Survey results | CaliBRANDO
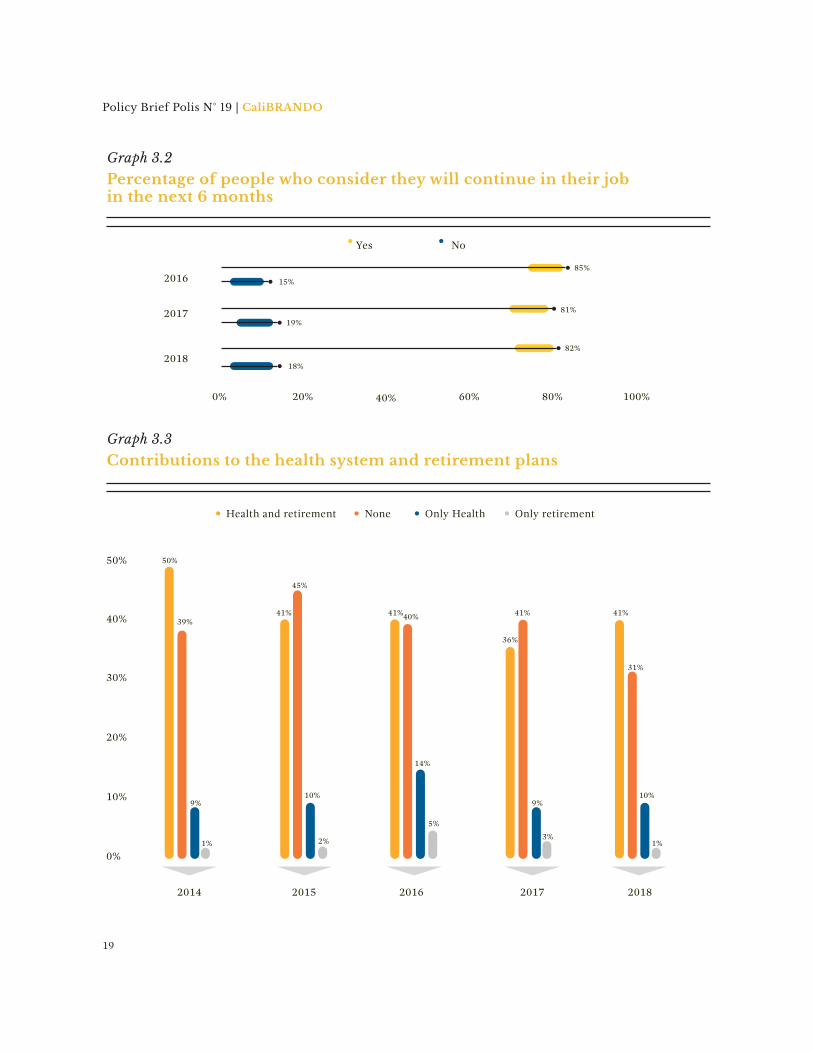
Health and retirement None Only Health Only retirement
10%
0%
20%
30%
40%
50%
2014 2015 2016 2017 2018
50%
39%
36%
41% 41% 41%40%
45%
9% 9%10%
14%
2% 3%1%
5%
Yes No
2017
2016
0% 20% 40% 60% 80% 100%
15%
19%
85%
201818%
82%
81%
Percentage of people who consider they will continue in their jobin the next 6 months
Graph 3.2
Contributions to the health system and retirement plansGraph 3.3
19
Policy Brief Polis N° 19 | CaliBRANDO
10%
31%
41%
1%

Approximately, 50% of the population earns between 1 and 2 minimum wages. When compared by gender, the proportion of women earning less than minimum wage (23%) is higher compared to men (19%). In the higher income ranges, the differences between men and women are considera-ble, given that 15% of men earn between 2 and 4 minimum wages, but only 10% of women earn this amount. When analyzed by ethnicity, only 9% of the afro population earns more than two mini-mum wages, while 21% of whites/mestizos earn more than this amount.
Less tan1 mmw*
Between 1 andless than 2 mmw
Between 2 andless than 4 mmw
Between 4 andless than 8 mmw
More than8 mmw
No income No answer
4. Income
10%
0%
20%
30%
40%
50%
2014 2015 2016 2017 2018
19%21%
24%
12%
4% 2%
9%
2%
47%
14% 15%
6%
1%
16%
2%
47%45%
4% 2%1%
12%
24%
10%
15%12%
3%
43%
49%
15%
5%
1%1% 1% 1%
16%
Average incomeGraph 4.1
* Monthly minimum wage (mmw) = 254 USD (2900 COP)
20
Survey results | CaliBRANDO

Improved Remainsthe same
Worsened No answer
Improved Worsened Remainsthe same
No answer
Respondents, in general, declare being optimistic about their economic future. In all the years, more than 80% consider that in the future their economic condition will be better. The percentage of people who think that the socioe-conomic conditions will worsen next year is higher in the highest socioeconomic strata (10.5%) than in the lowest or middle class (7%).
201488% 6% 4% 3%
86% 6% 5% 3%
84% 9% 4% 3%
85% 7% 4% 4%
2015
2016
2017
86% 9% 2% 5%
2018
2014 2015 20172016
0%
20%
40%
60%
2018
22%
65%
60%
12%
1%
27%
12%
1%
0%
61%
28%
10%
1%
62%
30%
7%1%
60%
29%
11%
In general, half of the respondents, consider that the economic situa-tion of their home has improved compared to the previous year. The majority of respondents, regardless of gender, race/ethnici-ty and socioeconomic strat, consi-der that they are better than their parents.
Percentage of people who consider their economic situation at home has…Graph 4.2
Percentage of people who consider that their economic conditions at home will…Graph 4.3
21
Policy Brief Polis N° 19 | CaliBRANDO
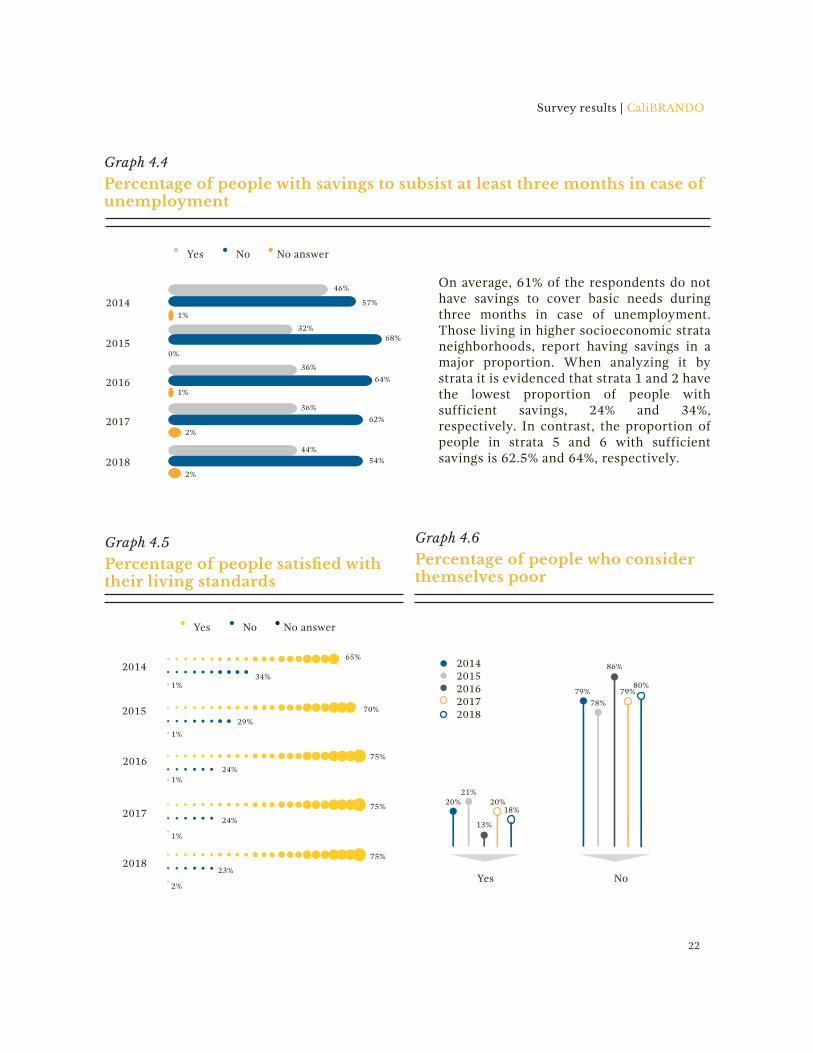
On average, 61% of the respondents do not have savings to cover basic needs during three months in case of unemployment. Those living in higher socioeconomic strata neighborhoods, report having savings in a major proportion. When analyzing it by strata it is evidenced that strata 1 and 2 have the lowest proportion of people with sufficient savings, 24% and 34%, respectively. In contrast, the proportion of people in strata 5 and 6 with sufficient savings is 62.5% and 64%, respectively.
Yes No No answer
2014
46%
57%
1%
2016
36%
64%
1%
201736%
62%
2%
201844%
54%
2%
2015
32%
0%
68%
70%
65%
29%
24%
24%
34%
1%
1%
1%
1%
2014
2015
2016
2017
75%
75%
23%
2%
201875%
Percentage of people satis�ed withtheir living standards
Graph 4.5
Percentage of people with savings to subsist at least three months in case ofunemployment
Graph 4.4
Percentage of people who considerthemselves poor
Graph 4.6
21%
13%
20% 20%
Yes
18%
78%
86%
79% 79%
No
80%
20142015201620172018
22
Survey results | CaliBRANDO
Yes No No answer

In general, respondents perceive their health condition as excellent or good. When analyzing differences by gender, 12.3% of men and 18.5% of women consider their health condition as fair. Women in Cali tend to be less satisfied with their health compared to men. In addition, the lower socioeconomic strata tend to categorize their health condition as fair or poor compared to higher strata.
Excellent Very good Good Fair Poor
10%
0%
20%
30%
40%
50%
2014 2015 2016 2017 2018
25%
14%
17%
2%
42%
24%
15%
17%
2%
42%
23%
28%
13%
1%
34%
20%
14%
18%
2%
46%
31%
13% 13%
3%
40%
Percentage of people who consider that their health condition is…Graph 5.1
5. Health
23
Policy Brief Polis N° 19 | CaliBRANDO
Normal 18.5 - 24.9 Overweight 25-29.9 Obesity 30-47Underweight <18.5
0%
20%
40%
60%
2014
33%
55%
9%
3%
2015
50%
3%
33%
14%
2016
50%
34%
11%
4%
2017
3%
46%
34%
17%
2018
3%
52%
34%
11%
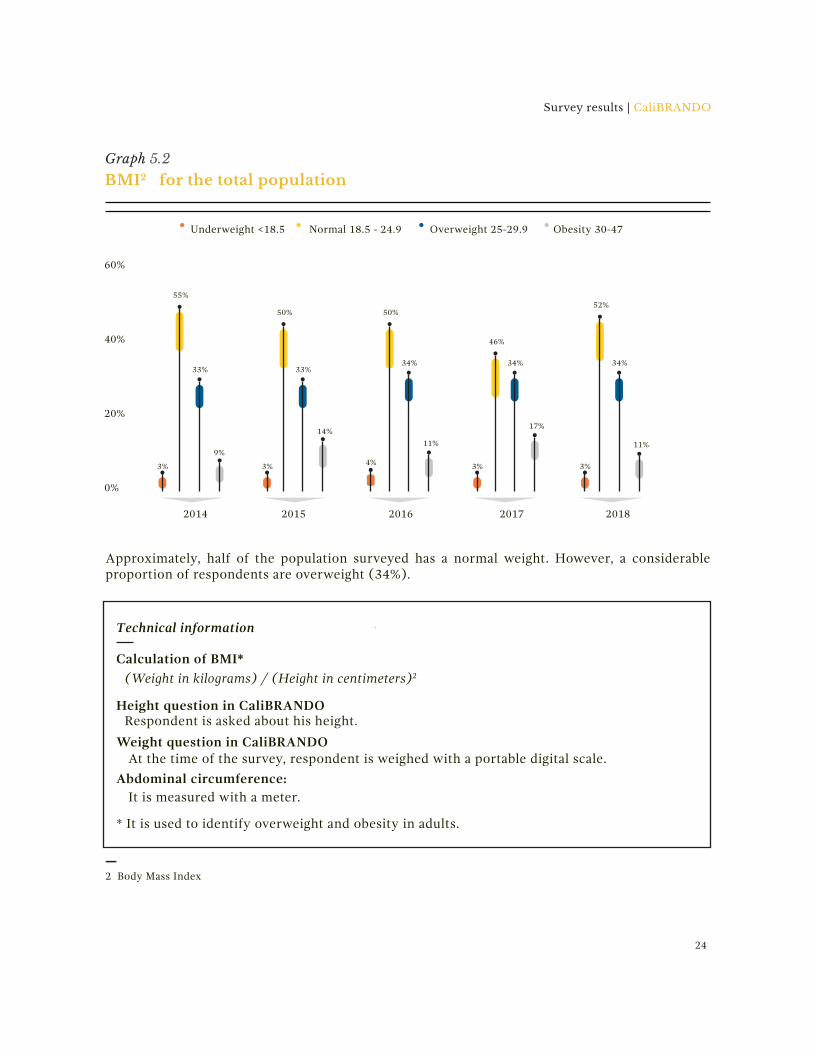
Approximately, half of the population surveyed has a normal weight. However, a considerable proportion of respondents are overweight (34%).
BMI2 for the total populationGraph 5.2
Technical information
Height question in CaliBRANDO
Weight question in CaliBRANDO
Respondent is asked about his height.
At the time of the survey, respondent is weighed with a portable digital scale.
(Weight in kilograms) / (Height in centimeters)2
Calculation of BMI*
* It is used to identify overweight and obesity in adults.
Abdominal circumference:It is measured with a meter.
24
Survey results | CaliBRANDO
2 Body Mass Index

Respondents are very happy with their lives. The average level of life satisfaction during the five years of analysis is 8.5. Regardless of gender and income level. The majority of the population surveyed ranges their life satisfaction between 8 and 10 on the measuring scale4.
3 Scale measuring life satisfaction from 0 to 10, where 0 represents the lowest level of satisfaction and 10 the highest level.
4 The measurement of CaliBRANDO reports values very similar to the life satisfaction measurements made by Colombia´s National Planning Department (DNP).
2014 2015 2016 2017 2018 60%
50%
40%
30%
20%
10%
0%
+ 75% of the participants
Life SatisfactionGraph 6.1
6. Life Satisfaction3
25
Policy Brief Polis N° 19 | CaliBRANDO
0 1 2 3 4 5 6 7 8 9 10

5 Scale measuring satisfaction with the city from 1 to 10, where 1 represents the lowest level of satisfaction and 10 the highest level.
10
9
8
7
6
5
4
3
2
1
CaliBRANDO inquires about the perception of local government performance. We ask about nine government areas. Generally speaking, respondents consider that the government does a better job in parks and public spaces, education and interventions at the neighborhood level. However, the satisfaction with the government performance in education had a significant reduction compared to the years 2014 and 2015, it went from 6 to 5.2. Also, it can be evidenced that the satisfaction with the dimension of public transport had a considerable increase, from 3.6, in 2014, to 4.6 in 2018.
Security Healthservices
Publictransport
Employmentgeneration
Parks andpublicspaces
Education Publicservices
Traffic Neighborhood
4.4
4.4
4.8 4.8
4.1
6.06.1
6.0
5.9
6.2
5.5
5.2
5.3
3.7
4.0
5.4 5.5 5.65.6 5.6 5.7
6.1 6.2
4.5
4.5 4.5 4.2
5.95.9
5.8
4.3
4.65.0
5.2
4.3
4.3
4.3
4.24.2 4.2
4.7
3.93.6
3.5
2014 2015 2016 2017 2018
Most important aspects of
government performance:
Security
Health services
Education
Employment generation
1.2.3.4.
50%
31%
29%
18%
City SatisfactionGraph 7.1
7. City Satisfaction5
26
Survey results | CaliBRANDO

6 Personal satisfaction measurement scale from 1 to 10, where 1 represents the lowest level of satisfaction and 10 the highest level.
For all respondets, satisfaction with personal factors are higher than the satisfaction with government performance. On average, the eight dimensions evaluated in personal satisfaction received a score higher than 7 on the scale. In general, there were few variations from one year to another. Income is the personal aspect with the lowest score, whilst family has consistently reported the highest value. Health and employment also rank in the upper end of the scale.
2014 2015 2016 2017 2018
Personal SatisfactionGraph 8.1
Family Employment Emotionallife
Health Householdeconomy
Income Education Place ofliving
3
2
1
4
5
6
7
8
9
10
9.18.9
7.9
7.8 7.9
7.6
7.5 7.6 7.67.7
7.4
7.4
7.47.4 7.4
7.5
7.5
8.1 8.2
8.5
8.5
8.5
8.5
8.6
8.0
9.0 9.09.0
7.0
7.0
6.97.1
7.9 7.9 7.9
7.77.9
7.8 7.8
7.4
Most important aspects
of personal life:
Family
Employment
Health
House hold economy
64%
30%
29%
19%
1.2.3.4.
8. Personal Satisfaction6
27
Policy Brief Polis N° 19 | CaliBRANDO

In 2017, a new module of institutional trust was incorporated, which was based on the OECD Guidelines on Measuring Subjective Well-being.
The purpose of this section is to assess the level of trust that citizen have in different institutions in the city: town council, national police and the civil service. It should be clarified that the responses of people were based on the general impression they have of the institutions and not necessarily if they had very little or no contact with them.
In general, respondents trust very little the institutions of the city. The ratings were given to the Police, the town council and the civil service are less than 4, on a 0 to 10 scale. Furthermore, a large number of citizens are unaware of the role of institutions such as the town council, which indicates that there is a lack of widespread political culture in the city.
Institutional trustGraph 9.1
10 2 3 4 5 6
2.8
3.0
7 8 9 10
3.9Police
Town council
Civil service
9. Institutional trust
Technical information
Trust level is measured on a scalefrom 0 to 10. 0 means you do not trustan institution at all, and 10 means youhave complete trust
Measurement scale
Organization for Economic Co-operationand Development - OECD (2017).OECD Guidelines on Measuring Trust.Paris: OECD Publishing.
Source
28
Survey results | CaliBRANDO

SES 1 SES 2 SES 3 SES 4 SES 5 SES 6
1
2
3
4
5
6
7
2015 2016 2017
Number of close friends or relativesGraph 10.1
Yes NoMan Woman
2016
21
25
21
23
21
23
2017 2018
21
24
2015
69%
31%
41%
49%59%
52%
2015
2016
2017
38%
62%2018
Victim of a violent actGraph 10.2
Average age of parenthood (�rst child)Graph 10.3
2.83.1
3.2 3.4
4.0
3.5
2.4
2.82.9
3.63.2
3.8
3.33.5
3.93.7
4.8
4.1
2018
2.4 2.5
2.82.7
3.4
2.2
10. Satisfaction andother areas of research
29
Policy Brief Polis N° 19 | CaliBRANDO

2015 2016 2017 2018
For the four years evaluated, motorcycles are the dominant mean of transportation within the population. It should be noted that, compared to 2015, the number of respondents who claimed to have motorcycles in 2018 increased by around 12%.
Approximately, 33% of respondents have their own motorized vehicle. 38% of women have their own transport compared with 62% of men. When analyzed by ethnicity, there are marked differences, 17% of afros own a car or a motorcycle compared with 30% and 45% of whites and mestizos, respectively.
Motorcycle Car
28%
68%
60%
67%
33%
32%
40%
72%
YesNo
2015
2016
2017
60% 46%
67% 41%
66% 42%
2018
64% 43%
Percentage of people with motorized vehicleGraph 10.4
Type of vehicleGraph 10.5
30
Survey results | CaliBRANDO

Life Satisfaction in Cali.Equal satisfaction for all?Page 31 - 38
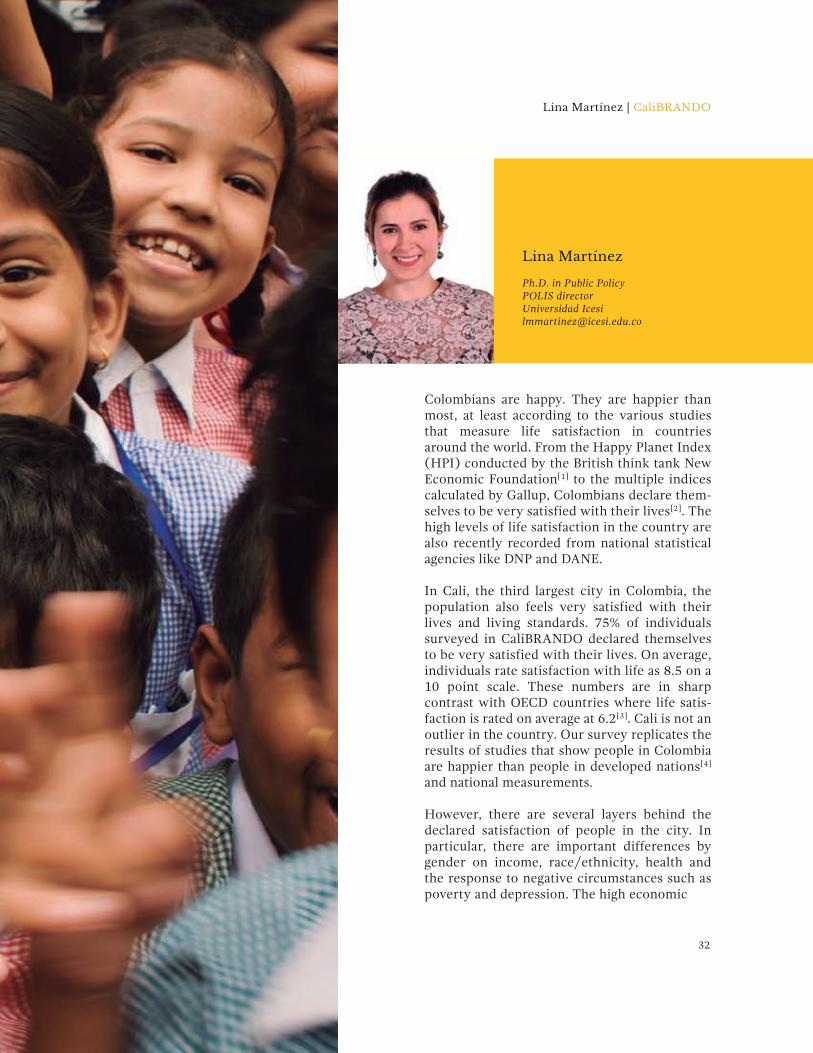
Colombians are happy. They are happier than most, at least according to the various studies that measure life satisfaction in countries around the world. From the Happy Planet Index (HPI) conducted by the British think tank New Economic Foundation[1] to the multiple indices calculated by Gallup, Colombians declare them-selves to be very satisfied with their lives[2]. The high levels of life satisfaction in the country are also recently recorded from national statistical agencies like DNP and DANE.
In Cali, the third largest city in Colombia, the population also feels very satisfied with their lives and living standards. 75% of individuals surveyed in CaliBRANDO declared themselves to be very satisfied with their lives. On average, individuals rate satisfaction with life as 8.5 on a 10 point scale. These numbers are in sharp contrast with OECD countries where life satis-faction is rated on average at 6.2[3]. Cali is not an outlier in the country. Our survey replicates the results of studies that show people in Colombia are happier than people in developed nations[4]
and national measurements.
However, there are several layers behind the declared satisfaction of people in the city. In particular, there are important differences by gender on income, race/ethnicity, health andthe response to negative circumstances such as poverty and depression. The high economic
32
Lina Martínez | CaliBRANDO
Lina Martínez Ph.D. in Public Policy POLIS directorUniversidad [email protected]

optimism in the population is also worrisome given the lack of employment stability and low savings rates. And lastly, the high life satisfac-tion in the city does not translate into a positive perception of government performance. respondents are very satisfied with their perso-nal lives, but the role the government plays in that satisfaction is at best, marginal.
Life Satisfaction is not equal for all: issues of money, gender, health and race/ethnicity
The bulk of the literature on life satisfaction is dedicated to understanding its relationship with money and socioeconomic status[5,6,7,8]. The most common analysis uses national data in the global North. Several conclusions have been reached. First, money seems to make people on average, happier. Second, people project that more money will make them happier[9]. Third, happi-ness rises with money, but there is no further progress beyond an annual income of 75000 USD in developed nations[10]. Our data supports most of these claims. We find that the relation ship between income and life satisfaction is positive, linear and very strong: the higher the income, the higher the life satisfaction.
In CaliBRANDO, 19% of individuals surveyed earn less than minimum wage (about 300 USD a month), the majority (42%) makes between 300 USD and 600 USD monthly and only 21% makes more than 600 USD. Over 15% do not have income, mostly women. On average, males have higher income than females despite similar educational attainment. To the question “what do you need to be com-pletely satisfied with your life”, 24% declared money, 18% replied better job and 13% reported that owning a house will make them completely happy. The survey also asked about how much money will allow respondents to live comforta-bly without worrying about financial issues. People who make the minimum wage declarethat they need to double their current income. Those who have a higher income report needing
an extra 10%. Women’s expectations are lower than men. In all income brackets, females report needing less money than men to live a comforta-ble life. On average, women need 200 USD a year less than men to be completely happy with their earnings. Previous research has identified several factors that correlate positively with high levels of satis-faction[11,12]. Health is probably the most salient. To proxy health conditions, CaliBRANDO uses the CDC composite index based on responses to question about general health condition and number of days with poor physical and mental health. 85% of individuals who rate their health as excellent or very good, rate their life satisfac-tion 8 or higher. This proportion progressively declines as perceived health status worsens.
These numbers show that respondents are
quite vulnerable in economic terms and only a few would be
able to economically cope with an episode
of prolongedunemployment.
“
“
33
Policy Brief Polis N° 19 | CaliBRANDO
34
Lina Martínez | CaliBRANDO
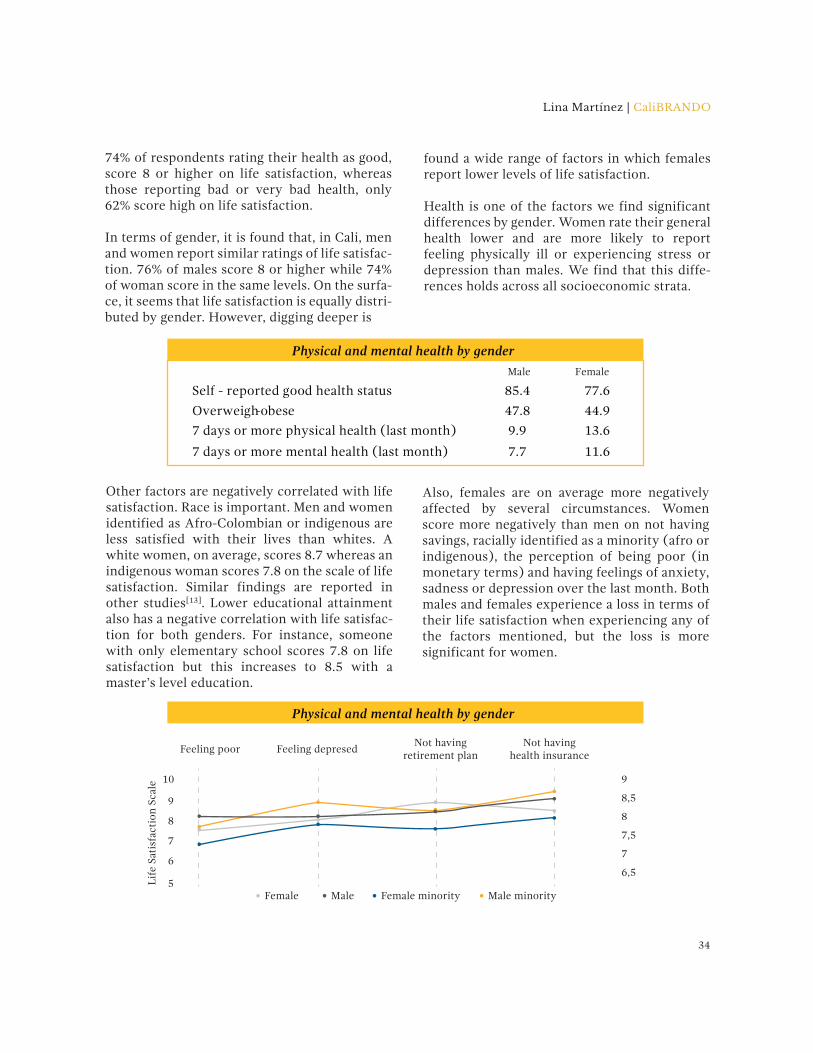
74% of respondents rating their health as good, score 8 or higher on life satisfaction, whereas those reporting bad or very bad health, only 62% score high on life satisfaction. In terms of gender, it is found that, in Cali, men and women report similar ratings of life satisfac-tion. 76% of males score 8 or higher while 74% of woman score in the same levels. On the surfa-ce, it seems that life satisfaction is equally distri-buted by gender. However, digging deeper is
Other factors are negatively correlated with life satisfaction. Race is important. Men and women identified as Afro-Colombian or indigenous are less satisfied with their lives than whites. A white women, on average, scores 8.7 whereas an indigenous woman scores 7.8 on the scale of life satisfaction. Similar findings are reported in other studies[13]. Lower educational attainment also has a negative correlation with life satisfac-tion for both genders. For instance, someone with only elementary school scores 7.8 on life satisfaction but this increases to 8.5 with a master’s level education.
Male Female
Self - reported good health status 85.4 77.6
Overweigh-obese 47.8 44.9
7 days or more physical health (last month) 9.9 13.6
7 days or more mental health (last month) 7.7 11.6
found a wide range of factors in which females report lower levels of life satisfaction.
Health is one of the factors we find significant differences by gender. Women rate their general health lower and are more likely to report feeling physically ill or experiencing stress or depression than males. We find that this diffe-rences holds across all socioeconomic strata.
Also, females are on average more negatively affected by several circumstances. Women score more negatively than men on not having savings, racially identified as a minority (afro or indigenous), the perception of being poor (in monetary terms) and having feelings of anxiety, sadness or depression over the last month. Both males and females experience a loss in terms of their life satisfaction when experiencing any of the factors mentioned, but the loss is more significant for women.
Lif
e Sa
tisf
acti
on S
cale
5
6
7
8
9
10
Feeling poor Feeling depresedNot having
retirement planNot having
health insurance
Female Male Female minority Male minority
9
8,5
8
7,5
7
6,5
Physical and mental health by gender
Physical and mental health by gender
High optimism
The high life satisfaction in Cali comes is accom-panied by high optimism. Around two thirds, 65% of respondents, are satisfied with their living standards (what they can do and buy with their current income), and this holds across all income brackets and gender. This proportion is very similar to reports in the USA[14]. Even amongst those who declare not having any income, 56% are happy with the things they can buy and access. Respondents also report high optimism about their present and future life. 65% declare that financially their households are better off than last year, and 87% consider that next year they would be even better. Nevertheless, despite all of this optimism, only 43% report having enough savings to live at least three months in case of unemployment. There are important differences by gender. Only 33% of females have savings to live at least three months in case of unexpected employment, whereas 51% of males report savings.
In one reading this optimism can be seen as concerning. Only 39% of respondents are contri-buting to health and retirement system, 43% live in a rented house, only 29% own any kind of property and only 31% own a motorcycle or a car. These numbers show that Respondents are quite vulnerable in economic terms and only a few would be able to economically cope with an episode of prolonged unemployment. Based on our results, it seems that respondents, in most cases, are underestimating a possibility of negati-ve economical outcomes in their lives.
City satisfaction and government performance
Increasing people’s happiness as a government goal goes beyond individual concerns. The shared space of the public sphere is important. Citizens who are satisfied with public services, not only report higher levels of happiness in their private lives[15], but also have a higher trust
in public institutions[16]. CaliBRANDO survey asked respondents to rate their satisfaction, on a 1-10 scale, with government performance in providing public transportation, employment opportunities and safety.
35
Policy Brief Polis N° 19 | CaliBRANDO

36
Lina Martínez | CaliBRANDO
If high levels of individual life satisfaction donot translate intoa collective project,the fabric that holds social participation, and active democracies won´t be able to build active and pluralistic societies.
“
“Respondents score high on subjective well-be-ing but lower on satisfaction with the public sphere. This is a countrywide problem. Accor-ding to Gallup data, between 2009 and 2013 people declared low trust in the police, and high perceptions of insecurity and vulnerability to crime[17]. CaliBRANDO data shows an important difference between individual feelings of well-being compared to civic and government satisfaction. This point is not trivial. If high levels of individual life satisfaction do not trans-late into a collective project, the fabric that holds social participation, and active democra-cies won´t be able to build active and pluralistic societies. To some extent, the findings of high life satisfac-tion in the country can be easily trivialized. Since the scores are very high, many may perceive them as the simple conformism of a society that does not demand and expects better from the private and public realm. Others may perceive these results as the resilience of a society that finds optimism amongst the many problems that faces daily. Regardless the take on either point of view, the government seems not knowing what to do with the information of life satisfaction and what actions (if any action needs to be taken) with the evidence available.
It may be shortsighted from the government perspective not to identify deep disparities by gender and race/ethnicity that these data display. Is also worrisome the lack of governmental action in face of a society that is highly vulnera-ble in economic terms and does nothing to educate better in terms of financial capacities. The high economic optimism in the population may reflect the lack of understanding of their real economic situation and few values that socially are promoted to save and plan for a future life.
What is even more shortsighted from the gover-nment is to turn its back on the fact that the society is very much satisfied with their lives not as a consequence of its role, is in spite of what the population is getting from the government.
References
[1] New Economic Foundation. The happy planet index: 2012 report. A global index of sustai-nable well-being; 2012.Technical report.
[2] Standish M, Witters D. Country Well-Be-ing Varies Greatly Worldwide [Internet]. Washin-gton DC: Gallup; 2014 [Accessed August 19th, 2015]. Retrieved from: http://www.gallup.-com/poll/175694/country-varies-greatly-world wide.aspx?utm_source=COUNTRY_COL&utm_-medium=topic&utm_campaign=tilesOpera Stable\Shell\Open\Command
[3] OECD. How´s life? 2013: Measuring wellbeing. Paris: OECD Publishing; 2013. [4] Clifton J. Mood of the World Upbeat on Inter-national Happiness Day [Internet]. Washington D.C: Gallup; 2015. [Accessed August 21th, 2015]. Retrieved from: http://www.gallup.com/poll/182 009/mood-world-upbeat-international-happi-ness-day.aspx. [5] Deaton A. Income, Health and Wellbeing around the World: Evidence from the Gallup World Poll. The Journal of Economic Perspectives: A Journal of the American Economic Association. 2008; 22(2): 53–72. [6] Easterlin RA, McVey LA, Switek M, Sawangfa O, Zweig JS. The happiness–income paradox revisited. Proceedings of the National Academy of Sciences. 2010; 107(52): 22463-22468.
[7] Diener E, Tay L. Subjective well-being and human welfare around the world as reflected in the Gallup World Poll. Int J Psychol. Mar. 2015; 50(2):135-49
[8] Di Tella R, MacCulloch RJ, Oswald AJ. The macroeconomics of happiness. Review of Econo-mics and Statistics. 2013; 85(4): 809-827.
[9] Bok D. The Politics of Happiness: What Govern-ment Can Learn from The New Research on Well-
being. Princeton: Princeton University Press; 2010. [10] Kahneman D, Deaton A. High income impro-ves evaluation of life but not emotional well-being. Proceedings of the national academy of science. 2010; 107(38): 16489-16493.
[11] Schimmel J. Development and happiness: The subjective perception of happiness and UNDP’s analysis of poverty, wealth and development. Journal of Happiness Studies. 2009; 10(1): 93–111.
[12] Deiner E, Suh E, Lucas RE, Smith HL. Subjective well-being: Three decades of progress. Psychological Bulletin. 1999; 125(2): 276-302.
[13] Barger SD, Donoho CJ, Wayment HA. The relative contributions of race/ethnicity, socioeco-nomic status, health, and social relationships to life satisfaction in the United States. Quality of Life Research. 2009; 18(2): 179-189.
[14] Dugan A. In U.S., Standard-of-Living Opti-mism at Five-Year High [Internet]. Washington D.C: Gallup; 2013. [Accessed, November 13, 2015]. Retrieved from: http://www.gallup.-com/poll/160340/standard-living-optimism-fi-ve-year-high.aspx
[15] Leyden KM, Goldberg A, Michelbach P. Understanding the pursuit of happiness in ten major cities. Urban Affairs Review. 2011; 47(6): 861-888.
[16] Christensen T, Lægreid P. Trust in govern-ment: The relative importance of service satisfac-tion, political factors, and demography. Public Performance & Management Review. 2005; 28(4): 487-511.
[17] Sonnenschein J. Latin America Scores Lowest on Security [Internet]. Washington, D.C: Gallup; 2014. [Accessed August 19th, 2015]. Retrieved from: http://www.gallup.com/poll/17 5082/latin-america-scores-lowest-security.as-px?utm_source=COUNTRY_COL&utm_medium =topic&utm_campaign=tiles
37
Policy Brief Polis N° 19 | CaliBRANDO


Vincent Siegerink Robert A. Cummins
Measuring subjetivewell-being
Section 2

Official statistics of subjectivewell-being: continuing to pushthe measurement agendaPage 41 - 46

Vincent Siegerink
Master in Economics and Public Policy OECDParis, [email protected]
i.See http://www.oecd.org/statistics/better-life-initia tive.htm for more information on the Better Life Initiative
The measurement of subjective well-being is a central component of the OECD’s Better Life Initiativei, a wide-ranging work programme aiming to improve our understanding of the aspects of people’s lives that matter for well-being. Through its Guidelines on the Measurement of Subjective Well-being and other projects, the OECD is advocating for National Statis-tical Offices and other agencies to collect high-quality data with large nationally representative samples, and consistent, internationally-comparable methods.
Everything we know about subjective well-being, from its widely discussed relationship with income, to the high levels of life satisfaction in Latin America in comparison to other regions in the world, relies on having accurate measures of the same concept between countries, between groups, and over time. For a long time, the collec-tion of such data was the territory of academics and large polling companies. For example, many recent works investigating the determinants of life satisfaction are based on data from the Gallup World Poll (GWP), a large-scale international survey that has collected a large body of life satis-faction data in over 160 countries[1,2,3]. But for
42
Vincent Siegerink | CaliBRANDO
In 2009, the Commission on the measurement of economic performance and social progress, chaired by Amartya Sen, Joseph Stiglitz, and Jean-Paul Fitoussi recommended that governments start collecting official data on subjective well-being, in a move to go “beyond GDP” in measuring and evaluating progress[4].The OECD has embraced this recommendation, along with many NSOs, who have since started to include subjective well-being measures in large survey vehicles. The OECD launched its Better Life Initiative in 2011, assembling and reporting on progress in different well-being dimensions, including subjective well-being. The flagship How’s Life? Report[5], of which the most recent version was published in November 2017, is one of the leading reports highlighting official subjective well-being data (alongside a wide range of other indicators) across countries. Through these efforts, the OECD attempts to showcase the value of official subjective well-being data, and convince govern-ments to start taking a more broad-based and people-centred approach in how they measure progress and the impact of policy on people’s lives.
The necessity of official subjective well-being data
While non-official surveys generally perform well in ranking countries in terms of average levels of life satisfaction, there is evidence to suggest that they lack the quality and statistical power to reliably support more in-depth analy-ses. When assessing the subjective well-being impact of a change in life circumstances that might affect only a small share of the total popu-lation (e.g. becoming unemployed, taking paren-tal leave, falling into poverty, or becoming disabled) large sample sizes are needed to enable robust estimates. To support this idea, Deaton[6]
found that the initial employment and income effects of the 2008 financial crisis on life satisfac-tion in the United States were smaller than the standard error on a sample of 1000 respondents. This shows that larger sample sizes are required in order to assess changes in life satisfaction within a country over timeii .
More granular data is also needed to evaluate the analysis of subjective well-being among subgroups of the population. To support this, Siegerink & Exton[7] compare official and Gallup data on life satisfaction for thirty-nine countries. We find that while there is a high gh convergent
ii. The Gallup World Poll does have more granular data available for the United States, but not for other countries
If subjectivewell-being data is to
be used to pick up on group differences
or changes in well-being over
time, NSOs need to systematically
include subjective well-being questions
in their larger survey vehicles.
“
“
43
Policy Brief Polis N° 19 | CaliBRANDO
subjective well-being data to reliably allow for analyses of changes over time and between subgroups of the population, and to be taken seriously by policymakers and the public alike, National Statistical Offices (NSOs) need to collect high-quality data themselves.

iii. The full question reads: “The following question aks you how you feel, on a scale from 0 to 10. Zero means you feel “not at all satisfied” and 10 means you feel “completely satisfied. Overall how satisfied are you with life as a whole these days?”.
validity in terms of average estimates from the two countries, there are often large differences between the two sources when comparing subgroups or estimating the direction of life satisfaction changes over time. For example, in three out of thirty-nine countries official data suggest a negative gender gap in life satisfaction when Gallup shows a statistically significant positive gap, or the other way around. In twenty-two cases a gender gap is identified by one of the two sources but no significant gender gap is found in the other. Such disagreements among data sources prevent life satisfaction data from serving as a credible alternative to conventional measures of progress. If subjective well-being data is to be used to pick up on group differences or changes in well-being over time, NSOs need to systematically include subjective well-being questions in their larger survey vehicles. The UK’s Office for National Statistics now includes subjective well-being questions in its Annual Population Survey which covers over 150000 respondents per year, and more OECD countries are following suit. In addition, NSOs also have the highest quality sampling frames, with more resources to invest in follow-ups to minimise non-response bias. This is important, especially because non-response patterns are likely not to be completely random[8]. Moreover, including subjective well-being measures in official data collections also gives these measures the quality assurance they need to be used to inform policy debates. Striving for comparability between countries
High-quality data collections are not the only condition for subjective well-being data to be useful for policymakers and academics alike. The harmonisation of measurement items across countries is equally important in order to compare results and exchange policy experiences. To this end, the OECD published its Guidelines on Measuring Subjective Well-being in 2013[9]. The goal of these guidelines is to
provide support for NSOs and other data producers in designing, collecting, publishing and analysing subjective well-being data, particularly on an internationally comparable basis. The Guidelines provide the methodological grounds for the development of quality subjective well-being metrics in three dimensions:
Life evaluation: a reflective assessment on a person’s life or some specific aspect of it
Affect: a person’s feelings or emotion states, typically measured with reference to a particular point in time.
Eudaimonia: a sense of meaning and purpose in life, or good psychological functioning.
Topics covered by the Guidelines include the concept and validity of subjective well-being measures; how survey methodology (e.g. question wording, response format, question order and context effects, survey mode and timing, and response styles) affect the data; guidance on good practice measurement approaches; and the reporting and analysis of subjective well-being data. The Guidelines also include a series of suggested question modules that countries can adopt to harmonise and further develop their subjective well-being measures.
In the core question module of the OECD Guidelines, the suggested question on life evaluation is rooted in traditional survey questions on life satisfaction, but has a number of important features that need to be taken into consideration. It employs the commonly used “life as a whole” question, where respondents are asked to indicate their level of satisfaction on aneleven-point scaleiii. To ensure full comparability;
44
Vincent Siegerink | CaliBRANDO

45
Policy Brief Polis N° 19 | CaliBRANDO
the scale length and scale labels (“not at all satisfied” to “completely satisfied”) should follow those suggested in the Guidelines. In addition, a neutral preceding question (or none at all) is preferable in order to minimise potential question order and context effects.
To include questions in official survey vehicles, a careful translation process is necessary to ensure the comparability of questions. A forthcoming stocktake of NSO data collections (Exton, Siegerink and Smith) reveals that different Spanish-speaking countries employ different life satisfaction questions in their official survey vehicles. For example, three of the Spanish-language surveys covered in the stocktake -
CASEN in Chile (2011 and 2013), BIARE in Mexico (2012 and 2014) and EU-SILC in Spain (2013) each use the “life as a whole” question as a starting point, but there are slight wording differences, as well as variations in the response scale format (see Box 1 below). While it may be necessary to adapt question wording according to regional language variations and dialects, where common base language exists, it is preferable to harmonise the question wording as far as possible, in order to maximise comparability across countries. Data collected on a 1-10 scale also cannot be directly compared with those collected on a 0-10 scale.
Chile: Encuesta de Caracterización Socioeconómica Nacional (CASEN) 2011
Considerando todas las cosas: ¿cuán satisfecho está usted con su vida en este momento?
1. Completamente insatisfecho 10. Completamente satisfecho
Mexico: Bienestar Subjectivo (BIARE) 2014
¿Podría decirme qué tan satisfecho se encuentra actualmente con su vida? (Entregue la tarjeta azul, al tiempo que lee la indicación)
Mire esta tarjeta con números que van del 0 al 10, donde 0 significa totalmente insatisfecho y 10 totalmente satisfecho; viendo toda la escala numérica, dígame cuál de los 11 números refleja mejor
su opinión al respecto.
Spain: European Union Statistics on Income and Living Conditions (EU-SILC) 2013
¿Cuál es su grado de satisfacción global con su vida en la actualidad?
0. Nada satisfecho 10. Plenamente satisfecho
Box 1. Differences in question wording for life satisfaction among Spanish-speaking NSOs:
While it may be necessary to adapt question wording according to regional language variations and dialects, where common base language exists, it is preferable to harmonise the question wordingas far as possible, in order to maximise comparability across countries.
“
“
46
Vincent Siegerink | CaliBRANDO
Progress in Latin America
Currently, NSOs in thirty-four out of thirty-five OECD countries have collected life evaluation data in recent years, and more than three-quarters of NSOs have collected at least some data on eudaimonia and affect[10]. Thirteen OECD countries have meanwhile adopted subjective well-being questions in regular survey vehicles. With the expected adoption of a standard life satisfaction question in core (annual) European Statistics on Income and Living Conditions (EU-SILC) data collection from 2019, this number will grow to thirty. In
Latin America, there is still ground to cover. Initiatives like the CaliBRANDO show that there is an interest and need for new measures of progress in countries like Colombia. The next step is to expand such measures to the national level and include them as official statistics. Because the more progress is made on the measurement agenda, the better subjective well-being measures are positioned to add to policy debates.
References
[1] Deaton A. Income, health, and well-being aroud the world: evidence from the gallup world poll. Journal of Economic Perspectives. 2008; 22 (2): 53-72.
[2] Helliwell J, Layard R & Sachs J. World happiness report 2012. New York: Sustainable Development Solutions Network; 2012.
[3] Stevenson, B. and Wolfers J. Economic growth and subjective well-being: reassessing the easterlin paradox. Cambridge: National bureau of economic research; 2008. NBER working paper series, No. 3654.
[4] Stiglitz JE, Sen A & Fitoussi JP. Report by the commission on the measurement of economic performance and social progress [Internet]. Paris: Commission on the Measurement of Economic Performance and Social Progress, 2010. Retrieved from: https://www.insee.fr/en/ information/2662494
[5] OECD. How's life? 2017: Measuring well-being [Internet]. Paris: OECD Publishing; 2017. Retrieved from: http://dx.doi.org/ 10.1787/how_life-2017-en
[6] Deaton A. The financial crisis and the well-being of Americans. Oxford Economics Papers. 2012; 64 (1): 1-26.
[7] Siegerink V & Exton C. Comparing official and non-official life satisfaction data: first insights from new survey vehicles. Paris: OECD Publishing. Forthcoming.
[8] Osier G. Unit non-response in household wealth surveys. ECB Statistics Paper. 2016; 15.
[9] OECD. OECD Guidelines on measuring subjective well-being [Internet]. Paris: OECD Publishing; 2013. Retrieved from: http://dx.doi.org/10.1787/978926419165 5-en
[10] Exton C, Siegerink V & Smith C. Measuring subjective well-being in national statistics: taking stock of recent OECD activities. Paris: OECD Publishing. Forthcoming.

Page 47 - 54
Subjective social indicatorsand public policy: 1933 to 2017

Abstract
For almost 85 years, politicians and academics have been discussing subjective social indica-tors in the context of public policy. The former through rhetoric and the latter through empiri-cal research. While the researchers have supplied elegant psychometric demonstrations of reliability, the administrators of national surveys remain doubtful regarding the useful-ness of subjective indicators for policy. One reason is a poor understanding of validity, most especially how to interpret higher or lower values. This understanding is now supplied by the theory of subjective well-being homeosta-sis. This theory is described and the usefulness of subjective well-being as a public policy indicator is explained. It is timely for national statistical agencies to embrace subjective well-being indicators.
Introduction
In their historical account of social indicators, Land and Michalos[1] note that such measures are commonly regarded as a proxy for national “life quality”. That is, as social indicators rise so to, it is assumed, does the life quality of the population. There is, however, a major problem in according social indicators this role. Whereas life quality is understood to comprise both objective and subjective indices[2], the social
48
Robert A. Cummins | CaliBRANDO
Robert A. Cummins
Ph.D. Deakin University Victoria, [email protected]

It is interesting to note that this dependence on objective measures of national progress has not substantially changed over the past 85 years. The earliest opportunity to begin a systematic consideration of subjective indicators arose from an initiative of USA President Hoover[3]. In 1929 he formed the Research Committee on Social Trends, with a charter to “examine into the feasibility of a national survey of social trends”. In 1933 his committee produced a massive report of over 1600 pages, with 29 chapters written by some 40 authors. Notwithstanding chapter headings such as “Vitality” and “Changing social attitudes and interests”, the content relies purely on objective data; a limitation noted at that time as a “paradox of the social sciences” by R. F. Remer[4]. Yet he, and other critics, offered no guidance as to how to actually create subjective evaluations of population well-being.
It is also notable that Hoover’s Committee failed to acknowledge contemporary literature in the social sciences. In fact, the technology for measuring subjective evaluations had been well described decades earlier. In his 1923 review, Freyd[5] discusses the various forms of response scale available at that time, which subsequently became dominated by Likert’s[6] 5-level rating scale. All of this early development in the social sciences was ignored by the members of Hoover’s committee.
Thirty years later, little had changed. The beginnings of subjective social indicators, as a systematic topic for study, is usually attributed to Bauer’s (1966) edited work “Social Indicators”[1]. In fact, however, the authors of this work evidenced substantial misgivings, describing subjective indicators by terms such
as “impressionistic”, “qualitative”, and “mysterious”. Evidently, some new catalyst was required to interest econometricians in subjective indicators, and this was supplied by Easterlin[7] who reported that the positive association between income and happiness did not simply apply over time. While this news electrified the academic community, the national statistical agencies were less impressed, and continued to represent national life quality through economic data.
Some yet stronger stimulus was needed to jolt the agencies out of their complacency. This was precipitated by the global financial crisis of 2007-2008. The Stiglitz Commission[8] again reminded governments that Gross Domestic Product is not sufficient as an indicator of national progress, and proposed that countries turn to the measurement of subjective wellbeing as a complementary social and economic indicator. This authoritative voice engendered action. Both the World Health Organization[9] and the Organization for Economic Cooperation and Development[10] revised their definitions of well-being, with both organizations also recommending the national measurement of subjective well-being.
In the current era, subjective social indicators are starting to appear more commonly in national surveys. However, their inclusion usually appears as an after-thought. Understandably, the employees of national agencies have backgrounds in economics, business, or associated statistics. Subjective social indicators, on the other hand, are the province of the social sciences, particularly psychology. Thus, because the knowledge-silos of economics and psychology are so distinct from one another, subjective indicators are not valued by national statistical offices, are poorly understood, and poorly analyzed. As a consequence they yield uninteresting data, which leads to them not being valued. The cycle is complete.
Breaking this nexus requires two forms of action; one on each side of the disciplinary fence. The first is a willingness by national statistical offices to comprehend the contemporary potential of subjective social indicators for public policy advice. The second is for psychological scientists to make their work accessible outside their disci-pline, emphasizing the usefulness of their measu-res. In order for this to occur, all of those invol-ved need to agree on how to define and measure subjective life quality.
Understanding Subjective Wellbeing
The greatest single impediment to advancing acceptance of SWB as a social indicator is the absence of rules for nomenclature. It is surely not surprising that policy makers show indiffe-rence in the face of a variable with quite arbitrary descriptions. For example, SWB is often referred to in the social indicator literatu-re as “happiness”. Yet this term has two impor-tantly different meanings.
The common meaning of happiness is a positive feeling consequential to a short term event. When something happens to them that’s nice, people feel happy. This form of happiness is transitory, and is what psychologists refer to as an emotional state. The second kind of happi-ness is a mood. This form of happiness is not generated in reaction to something that has happened, but rather is a genetic trait that normally forms a constant background to our thoughts[11]. It is a gentle, mildly activated form of positive affect and its major importance is to keep us feeling good about ourselves.
In the context of social indicators, emotional happiness is noise in the measurement, varying from moment to moment. The measure of policy interest is mood happiness, and this is the major component of SWB[12,13,14]. This form of happiness causes SWB to have some very interesting properties. For example, SWB is normally experienced as a positive feeling and its level is normally quite stable.
Subjective wellbeing homeostasis
Why are these SWB mean scores so predictable? The theory of SWB homeostasis offers an explanation. This theory proposes that, in a manner analogous to the homeostatic main- tenance of blood calcium or body temperature, the level of SWB is actively controlled and maintained by a set of psychological devices, described in detail elsewhere[16,17,18].
At the heart of homeostasis is each person’s set-point for their SWB. This set-point is what homeostasis is defending. While each set-point is determined genetically, and does not change, responses to SWB questions do show variation. This is caused by intrusive emotions becoming incorporated into each SWB response[19].
This understanding, that SWB can vary while set-points do not, introduces a major caution to the interpretation of SWB measurement. Consider the analogy with the set-point for core body temperature (37o C). Prolonged exposure to a sufficiently persistent hot or cold thermal challenge will cause core body temperature to rise or fall. This does not represent a change in set-point. It is a defeat of homeostasis and, once the source of thermal challenge is removed, body temperature will normally revert to its set-point. This explains why, contrary to the views expressed by some authors[20,21], set-point theory does not carry an assumption of immutability in measured SWB.
Crucially, however, in order for SWB to return to set-point following an emotion, external and internal resources must be directed to the restoration of homeostasis. If these resources are sufficient, SWB returns to approximate its set-point. If the resources are insufficient, SWB remains below its normal range and the person is at high risk of depression[11].
Homeostatic resources
There are several internal psychological forms of homeostatic defence[18] which will not be discussed here. Of more direct relevance to the current context are three objective social indicators. These have been identified as the three domains of the Personal Well-being Index[22] which most strongly contribute to Global Life satisfaction (GLS) using multiple regression[15]. They are collectively referred to as the “Golden Triangle of Happiness” and comprise money, relationships, and achieving in life through a purposeful activity.
Each of these resources has a dual action. They both defend against homeostatic failure and also assist homeostatic maintenance. This is because active engagement with each resource is intrinsically rewarding. For example:
• Money can be used as a defensive resource. To avoid the negative experience of dog-washing, someone else can be paid to do the job. The time saved can then be used for a personally satisfying activity.
• Relationships, when positive and intimate, allow much of daily life to occur within a secure social environment. This both reduces the probability of unpleasant social encounters and also increases the probability of positive social interactions.
• Achieving something personally important each day engages positive life routines in a secure context and provides a positive sense of purpose.
In summary, engagement with these three resources assists homeostatic defense by reducing the probability of negative events and maintaining positive feelings through engagement with secure and rewarding activities.
SWB as a useful social indicator The practical implications of this understanding for public policy concerns the distribution of resources, especially financial resources, to support homeostasis. If people are living under conditions of chronic resource deprivation, that is sufficiently adverse to defeat homeostasis, then their SWB will be maintained at levels significantly below their set-point. Under such conditions people will be highly susceptible to depression and, in Australia, this applies to about 5% of the population[23]. However, when vulnerable groups are targeted for measurement[24] the proportion of people in homeostatic defeat is much higher. Moreover, and importantly for
policy, additional resources provided to people in homeostatic failure will reliably lift their SWB towards the average of the population[25]. The policy implications of this are clear. The most efficient way to increase population levels of SWB is to allocate additional resources to people with chronically low levels of SWB.
Summary
A great deal of understanding has accumulated in the 85 year history of subjective social indicators. Reliable and valid measures of subjective well-being (SWB) are now available and the results can be interpreted in terms of the most effective distribution of resources. These advances are also framed by a plausible theoretical model, in the form of subjective well-being homeostasis. If it is considered desirable for all citizens to experience normal levels of life quality, then SWB is an excellent national indicator of the degree to which it is being achieved. Whether our politicians and national statistical offices decide to collect data on subjective well-being is now based on political, rather than a scientific, reasoning.
Acknowledgement: This work was supported by the National Research Foundation of Korea Grant funded by the Korean Government (NRF-2013S1A3A2054622).
References
[1] Land KC, Michalos AC. Fifty years after the social indicators movement: has the promise been fulfilled? An assessment and an agenda for the future. Social Indicators Research. 2017; 135: 835-868.
[2] Australian Centre on Quality of Life. What is quality of life? [Internet]. Victoria, Australia: Deakin University; 2017. Retrieved from: http://www.deakin.edu.au/research/acqol/instruments/instrument.php
[3] Hoover H. Foreword. In W. C. Mitchell & et al (Eds.). U.S. president's research committee on social trends: recent social trends in the united states (Vol. Volume 1, pp. v). New York: McGraw-Hill Book Company; 1933. [4] Angell RC. Recent social trends in the united states: report of the president's research committee: I. Summary and comment. Michigan Law Review. 1933; 31(5): 638-658
[5] Freyd, M. The graphic rating scale. Journal of Educational Psychology.1923; 14: 83-102.
[6] Likert R. A technique for the measurement of attitudes. Archives in Psychology.1932; 22(140): 1-55.
[7] Easterlin RA. Does economic growth improve the human lot? Some empirical evidence. In David P & Reder M (Eds.), Nations and households in economic growth (pp. 89-125). New York: Academic Press; 1974.
[8] Stiglitz, J., Sen, A., & Fitoussi, J.-P. Report by the commission on the measurement of economic performance and social progress. Paris: Commi- ssion on the Measurement of Economic Perfor- mance and Social Progress; 2010. Retrieved from: http ://www.st igl i tz-sen-f i touss i . f r/docu- ments/rapport_anglais.pdf
[9] WHO. The European health report 2012: charting the way to well-being. Copenhagen, Dinamark: The regional office of Europe of World Health Organization; 2012. Retrieved from: h t t p : // w w w. e u ro .wh o . i n t / _ _ da ta / a s s e t s /pdf_file/0004/197113/EHR2012-Eng.pdf
[10]OECD. OECD guidelines on measuring subjective well-being. París: OECD Publishing; 2013. Retrieved from: http://dx.doi.org/ 10.1787/9789264191655-en
[11] Cummins RA. Subjective wellbeing, homeos- tatically protected mood and depression: a synthesis.
Journal of Happiness Studies. 2010(a); 11(1), 1-17. Retrieved from: doi:10.1007/s10902-009-9167-0[12] Blore JD, Stokes MA, Mellor D, Firth L & Cummins RA. Comparing multiple discrepancies theory to affective models of subjective wellbeing. Social Indicators Research. 2011; 100(1): 1-16. Retrieved from: doi:10.1007/s11205-010-9599-2
[13] Davern M, Cummins RA & Stokes M. Subjective wellbeing as an affective/cognitive construct. Journal of Happiness Studies. 2007; 8(4): 429-449. Retrieved from: doi:10.1007/s10902-007-9066-1
[14] Tomyn AJ & Cummins RA. Subjective wellbeing and homeostatically protected mood: theory validation with adolescents. Journal of Happiness Studies. 2011(a); 12(5): 897-914. Retrieved from: doi:10.1007/s10902-010-9235 -5
[15] Cummins RA, Woerner J, Weinberg M, Collard J, Hartley-Clark L & Horfiniak K. Australian Unity Wellbeing Index: -Report 30.0 - The wellbeing of Australians: social media, personal achievement, and work. Melbourne: Australian Centre on Quality of Life, School of Psychology, Deakin University; 2013c. Retrieved from: http://www.acqol.com.au/ reports/auwbi.php.
[16] Cummins RA. Subjective wellbeing homeostasis D. S. Dunn (Ed.) Oxford Bibliographies Online; 2013a. Retrieved from: http://www.oxfordbibliographies.com/view/document/obo-9780199828340/obo-9780199828340-0167.xml [17] Cummins RA. Can happiness change? theories and evidence. In K. M. Sheldon & R. E. Lucas (Eds.) Stability of happiness: theories and evidence on whether happiness can change (pp. 75-97). Amsterdam: Elsevier; 2014b.
[18] Cummins, R. A. The theory of subjective wellbeing homeostasis: a contribution to understanding life quality. In F. Maggino (Ed.). A life devoted to quality of life - festschrift in honor of alex c. michalos (Vol. 60, pp. 61-79). Dordrecht,
In terms of this stability, over the past 15 years we have measured the SWB of the Australian population through 30 surveys, each of 2000 people, nationally representative. When the results are standardized to lie on a 0-100 point scale, and survey mean scores are used as data, the full range of values lies between 73.8–76.7 percentage points[15]. In other words, the mean score of a random survey of people in Australia can be predicted, with 95% certainty, to lie within a 2.9 percentage point range. There is no precedent in the literature for such extraordinary stability in self-report data.
49
Policy Brief Polis N° 19 | CaliBRANDO
indicators used by national statistical agencies are usually confined to objective indices, such as housing, physical health, and income. This omission of subjective indicators distorts the representation of national life quality, to mainly reflect national economic growth.
Netherlands: Springer; 2016a.
[19] Cummins RA, Li L, Wooden M. & Stokes M.. A demonstration of set-points for subjective wellbeing. Journal of Happiness Studies. 2014a; 15: 183-206. Retrieved from: doi:10.1007/ s10902-013-9444-9
[20] Easterlin, R. A. Do people adapt to poorer health? health and health satisfaction over the life cycle. In F. Maggino (Ed.), A life devoted to quality of life - festschrift in honor of alex c. michalos (Vol. 60, pp. 81-92). Dordrecht, Netherlands: Springer; 2016.
[21] Headey B, Muffels R. & Wagner GG. National panel studies show substantial minorities recording long-term change in life satisfaction: implications for set point theory. In K. M. Sheldon & R. E. Lucas (Eds.), Stability of happiness: theories and evidence on whether happiness can change (pp. 99-126). New York: Elsevier; 2014.
[22] International wellbeing group. personal wellbeing index manual: 5th Edition; 2013. Retrieved from: http://www.acqol.com.au/ iwbg/wellbeing-index/index.php
[23] Cummins RA & Nistico H. Maintaining life satisfaction: the role of positive cognitive bias. Journal of Happiness Studies. 2002; 3(1): 37-69. [24] Hammond T, Weinberg MK & Cummins RA. The dyadic interaction of relationships and disability type on informal carer subjective well-being. Quality of Life Research. 2014; 23(5): 1535-1542.
[25] Tomyn AJ, Weinberg MK & Cummins RA. Intervention efficacy among ‘at risk’ adolescents: A test of subjective wellbeing homeostasis theory. Social Indicators Research. 2015; 120(3): 883-895. Retrieved from:doi:10.1007/s11205 -014-0619-5
It is interesting to note that this dependence on objective measures of national progress has not substantially changed over the past 85 years. The earliest opportunity to begin a systematic consideration of subjective indicators arose from an initiative of USA President Hoover[3]. In 1929 he formed the Research Committee on Social Trends, with a charter to “examine into the feasibility of a national survey of social trends”. In 1933 his committee produced a massive report of over 1600 pages, with 29 chapters written by some 40 authors. Notwithstanding chapter headings such as “Vitality” and “Changing social attitudes and interests”, the content relies purely on objective data; a limitation noted at that time as a “paradox of the social sciences” by R. F. Remer[4]. Yet he, and other critics, offered no guidance as to how to actually create subjective evaluations of population well-being.
It is also notable that Hoover’s Committee failed to acknowledge contemporary literature in the social sciences. In fact, the technology for measuring subjective evaluations had been well described decades earlier. In his 1923 review, Freyd[5] discusses the various forms of response scale available at that time, which subsequently became dominated by Likert’s[6] 5-level rating scale. All of this early development in the social sciences was ignored by the members of Hoover’s committee.
Thirty years later, little had changed. The beginnings of subjective social indicators, as a systematic topic for study, is usually attributed to Bauer’s (1966) edited work “Social Indicators”[1]. In fact, however, the authors of this work evidenced substantial misgivings, describing subjective indicators by terms such
as “impressionistic”, “qualitative”, and “mysterious”. Evidently, some new catalyst was required to interest econometricians in subjective indicators, and this was supplied by Easterlin[7] who reported that the positive association between income and happiness did not simply apply over time. While this news electrified the academic community, the national statistical agencies were less impressed, and continued to represent national life quality through economic data.
Some yet stronger stimulus was needed to jolt the agencies out of their complacency. This was precipitated by the global financial crisis of 2007-2008. The Stiglitz Commission[8] again reminded governments that Gross Domestic Product is not sufficient as an indicator of national progress, and proposed that countries turn to the measurement of subjective wellbeing as a complementary social and economic indicator. This authoritative voice engendered action. Both the World Health Organization[9] and the Organization for Economic Cooperation and Development[10] revised their definitions of well-being, with both organizations also recommending the national measurement of subjective well-being.
In the current era, subjective social indicators are starting to appear more commonly in national surveys. However, their inclusion usually appears as an after-thought. Understandably, the employees of national agencies have backgrounds in economics, business, or associated statistics. Subjective social indicators, on the other hand, are the province of the social sciences, particularly psychology. Thus, because the knowledge-silos of economics and psychology are so distinct from one another, subjective indicators are not valued by national statistical offices, are poorly understood, and poorly analyzed. As a consequence they yield uninteresting data, which leads to them not being valued. The cycle is complete.
Breaking this nexus requires two forms of action; one on each side of the disciplinary fence. The first is a willingness by national statistical offices to comprehend the contemporary potential of subjective social indicators for public policy advice. The second is for psychological scientists to make their work accessible outside their disci-pline, emphasizing the usefulness of their measu-res. In order for this to occur, all of those invol-ved need to agree on how to define and measure subjective life quality.
Understanding Subjective Wellbeing
The greatest single impediment to advancing acceptance of SWB as a social indicator is the absence of rules for nomenclature. It is surely not surprising that policy makers show indiffe-rence in the face of a variable with quite arbitrary descriptions. For example, SWB is often referred to in the social indicator literatu-re as “happiness”. Yet this term has two impor-tantly different meanings.
The common meaning of happiness is a positive feeling consequential to a short term event. When something happens to them that’s nice, people feel happy. This form of happiness is transitory, and is what psychologists refer to as an emotional state. The second kind of happi-ness is a mood. This form of happiness is not generated in reaction to something that has happened, but rather is a genetic trait that normally forms a constant background to our thoughts[11]. It is a gentle, mildly activated form of positive affect and its major importance is to keep us feeling good about ourselves.
In the context of social indicators, emotional happiness is noise in the measurement, varying from moment to moment. The measure of policy interest is mood happiness, and this is the major component of SWB[12,13,14]. This form of happiness causes SWB to have some very interesting properties. For example, SWB is normally experienced as a positive feeling and its level is normally quite stable.
Subjective wellbeing homeostasis
Why are these SWB mean scores so predictable? The theory of SWB homeostasis offers an explanation. This theory proposes that, in a manner analogous to the homeostatic main- tenance of blood calcium or body temperature, the level of SWB is actively controlled and maintained by a set of psychological devices, described in detail elsewhere[16,17,18].
At the heart of homeostasis is each person’s set-point for their SWB. This set-point is what homeostasis is defending. While each set-point is determined genetically, and does not change, responses to SWB questions do show variation. This is caused by intrusive emotions becoming incorporated into each SWB response[19].
This understanding, that SWB can vary while set-points do not, introduces a major caution to the interpretation of SWB measurement. Consider the analogy with the set-point for core body temperature (37o C). Prolonged exposure to a sufficiently persistent hot or cold thermal challenge will cause core body temperature to rise or fall. This does not represent a change in set-point. It is a defeat of homeostasis and, once the source of thermal challenge is removed, body temperature will normally revert to its set-point. This explains why, contrary to the views expressed by some authors[20,21], set-point theory does not carry an assumption of immutability in measured SWB.
Crucially, however, in order for SWB to return to set-point following an emotion, external and internal resources must be directed to the restoration of homeostasis. If these resources are sufficient, SWB returns to approximate its set-point. If the resources are insufficient, SWB remains below its normal range and the person is at high risk of depression[11].
Homeostatic resources
There are several internal psychological forms of homeostatic defence[18] which will not be discussed here. Of more direct relevance to the current context are three objective social indicators. These have been identified as the three domains of the Personal Well-being Index[22] which most strongly contribute to Global Life satisfaction (GLS) using multiple regression[15]. They are collectively referred to as the “Golden Triangle of Happiness” and comprise money, relationships, and achieving in life through a purposeful activity.
Each of these resources has a dual action. They both defend against homeostatic failure and also assist homeostatic maintenance. This is because active engagement with each resource is intrinsically rewarding. For example:
• Money can be used as a defensive resource. To avoid the negative experience of dog-washing, someone else can be paid to do the job. The time saved can then be used for a personally satisfying activity.
• Relationships, when positive and intimate, allow much of daily life to occur within a secure social environment. This both reduces the probability of unpleasant social encounters and also increases the probability of positive social interactions.
• Achieving something personally important each day engages positive life routines in a secure context and provides a positive sense of purpose.
In summary, engagement with these three resources assists homeostatic defense by reducing the probability of negative events and maintaining positive feelings through engagement with secure and rewarding activities.
SWB as a useful social indicator The practical implications of this understanding for public policy concerns the distribution of resources, especially financial resources, to support homeostasis. If people are living under conditions of chronic resource deprivation, that is sufficiently adverse to defeat homeostasis, then their SWB will be maintained at levels significantly below their set-point. Under such conditions people will be highly susceptible to depression and, in Australia, this applies to about 5% of the population[23]. However, when vulnerable groups are targeted for measurement[24] the proportion of people in homeostatic defeat is much higher. Moreover, and importantly for
policy, additional resources provided to people in homeostatic failure will reliably lift their SWB towards the average of the population[25]. The policy implications of this are clear. The most efficient way to increase population levels of SWB is to allocate additional resources to people with chronically low levels of SWB.
Summary
A great deal of understanding has accumulated in the 85 year history of subjective social indicators. Reliable and valid measures of subjective well-being (SWB) are now available and the results can be interpreted in terms of the most effective distribution of resources. These advances are also framed by a plausible theoretical model, in the form of subjective well-being homeostasis. If it is considered desirable for all citizens to experience normal levels of life quality, then SWB is an excellent national indicator of the degree to which it is being achieved. Whether our politicians and national statistical offices decide to collect data on subjective well-being is now based on political, rather than a scientific, reasoning.
Acknowledgement: This work was supported by the National Research Foundation of Korea Grant funded by the Korean Government (NRF-2013S1A3A2054622).
References
[1] Land KC, Michalos AC. Fifty years after the social indicators movement: has the promise been fulfilled? An assessment and an agenda for the future. Social Indicators Research. 2017; 135: 835-868.
[2] Australian Centre on Quality of Life. What is quality of life? [Internet]. Victoria, Australia: Deakin University; 2017. Retrieved from: http://www.deakin.edu.au/research/acqol/instruments/instrument.php
[3] Hoover H. Foreword. In W. C. Mitchell & et al (Eds.). U.S. president's research committee on social trends: recent social trends in the united states (Vol. Volume 1, pp. v). New York: McGraw-Hill Book Company; 1933. [4] Angell RC. Recent social trends in the united states: report of the president's research committee: I. Summary and comment. Michigan Law Review. 1933; 31(5): 638-658
[5] Freyd, M. The graphic rating scale. Journal of Educational Psychology.1923; 14: 83-102.
[6] Likert R. A technique for the measurement of attitudes. Archives in Psychology.1932; 22(140): 1-55.
[7] Easterlin RA. Does economic growth improve the human lot? Some empirical evidence. In David P & Reder M (Eds.), Nations and households in economic growth (pp. 89-125). New York: Academic Press; 1974.
[8] Stiglitz, J., Sen, A., & Fitoussi, J.-P. Report by the commission on the measurement of economic performance and social progress. Paris: Commi- ssion on the Measurement of Economic Perfor- mance and Social Progress; 2010. Retrieved from: http ://www.st igl i tz-sen-f i touss i . f r/docu- ments/rapport_anglais.pdf
[9] WHO. The European health report 2012: charting the way to well-being. Copenhagen, Dinamark: The regional office of Europe of World Health Organization; 2012. Retrieved from: h t t p : // w w w. e u ro .wh o . i n t / _ _ da ta / a s s e t s /pdf_file/0004/197113/EHR2012-Eng.pdf
[10]OECD. OECD guidelines on measuring subjective well-being. París: OECD Publishing; 2013. Retrieved from: http://dx.doi.org/ 10.1787/9789264191655-en
[11] Cummins RA. Subjective wellbeing, homeos- tatically protected mood and depression: a synthesis.
Journal of Happiness Studies. 2010(a); 11(1), 1-17. Retrieved from: doi:10.1007/s10902-009-9167-0[12] Blore JD, Stokes MA, Mellor D, Firth L & Cummins RA. Comparing multiple discrepancies theory to affective models of subjective wellbeing. Social Indicators Research. 2011; 100(1): 1-16. Retrieved from: doi:10.1007/s11205-010-9599-2
[13] Davern M, Cummins RA & Stokes M. Subjective wellbeing as an affective/cognitive construct. Journal of Happiness Studies. 2007; 8(4): 429-449. Retrieved from: doi:10.1007/s10902-007-9066-1
[14] Tomyn AJ & Cummins RA. Subjective wellbeing and homeostatically protected mood: theory validation with adolescents. Journal of Happiness Studies. 2011(a); 12(5): 897-914. Retrieved from: doi:10.1007/s10902-010-9235 -5
[15] Cummins RA, Woerner J, Weinberg M, Collard J, Hartley-Clark L & Horfiniak K. Australian Unity Wellbeing Index: -Report 30.0 - The wellbeing of Australians: social media, personal achievement, and work. Melbourne: Australian Centre on Quality of Life, School of Psychology, Deakin University; 2013c. Retrieved from: http://www.acqol.com.au/ reports/auwbi.php.
[16] Cummins RA. Subjective wellbeing homeostasis D. S. Dunn (Ed.) Oxford Bibliographies Online; 2013a. Retrieved from: http://www.oxfordbibliographies.com/view/document/obo-9780199828340/obo-9780199828340-0167.xml [17] Cummins RA. Can happiness change? theories and evidence. In K. M. Sheldon & R. E. Lucas (Eds.) Stability of happiness: theories and evidence on whether happiness can change (pp. 75-97). Amsterdam: Elsevier; 2014b.
[18] Cummins, R. A. The theory of subjective wellbeing homeostasis: a contribution to understanding life quality. In F. Maggino (Ed.). A life devoted to quality of life - festschrift in honor of alex c. michalos (Vol. 60, pp. 61-79). Dordrecht,
50
Robert A. Cummins | CaliBRANDO
The greatest single impediment to
advancing acceptance of SWB as a social
indicator is the absence of rules for
nomenclature. It is surely not surprising
that policy makers show indifference in the face of a variable with quite arbitrary
descriptions.
“
“
In terms of this stability, over the past 15 years we have measured the SWB of the Australian population through 30 surveys, each of 2000 people, nationally representative. When the results are standardized to lie on a 0-100 point scale, and survey mean scores are used as data, the full range of values lies between 73.8–76.7 percentage points[15]. In other words, the mean score of a random survey of people in Australia can be predicted, with 95% certainty, to lie within a 2.9 percentage point range. There is no precedent in the literature for such extraordinary stability in self-report data.
Netherlands: Springer; 2016a.
[19] Cummins RA, Li L, Wooden M. & Stokes M.. A demonstration of set-points for subjective wellbeing. Journal of Happiness Studies. 2014a; 15: 183-206. Retrieved from: doi:10.1007/ s10902-013-9444-9
[20] Easterlin, R. A. Do people adapt to poorer health? health and health satisfaction over the life cycle. In F. Maggino (Ed.), A life devoted to quality of life - festschrift in honor of alex c. michalos (Vol. 60, pp. 81-92). Dordrecht, Netherlands: Springer; 2016.
[21] Headey B, Muffels R. & Wagner GG. National panel studies show substantial minorities recording long-term change in life satisfaction: implications for set point theory. In K. M. Sheldon & R. E. Lucas (Eds.), Stability of happiness: theories and evidence on whether happiness can change (pp. 99-126). New York: Elsevier; 2014.
[22] International wellbeing group. personal wellbeing index manual: 5th Edition; 2013. Retrieved from: http://www.acqol.com.au/ iwbg/wellbeing-index/index.php
[23] Cummins RA & Nistico H. Maintaining life satisfaction: the role of positive cognitive bias. Journal of Happiness Studies. 2002; 3(1): 37-69. [24] Hammond T, Weinberg MK & Cummins RA. The dyadic interaction of relationships and disability type on informal carer subjective well-being. Quality of Life Research. 2014; 23(5): 1535-1542.
[25] Tomyn AJ, Weinberg MK & Cummins RA. Intervention efficacy among ‘at risk’ adolescents: A test of subjective wellbeing homeostasis theory. Social Indicators Research. 2015; 120(3): 883-895. Retrieved from:doi:10.1007/s11205 -014-0619-5

It is interesting to note that this dependence on objective measures of national progress has not substantially changed over the past 85 years. The earliest opportunity to begin a systematic consideration of subjective indicators arose from an initiative of USA President Hoover[3]. In 1929 he formed the Research Committee on Social Trends, with a charter to “examine into the feasibility of a national survey of social trends”. In 1933 his committee produced a massive report of over 1600 pages, with 29 chapters written by some 40 authors. Notwithstanding chapter headings such as “Vitality” and “Changing social attitudes and interests”, the content relies purely on objective data; a limitation noted at that time as a “paradox of the social sciences” by R. F. Remer[4]. Yet he, and other critics, offered no guidance as to how to actually create subjective evaluations of population well-being.
It is also notable that Hoover’s Committee failed to acknowledge contemporary literature in the social sciences. In fact, the technology for measuring subjective evaluations had been well described decades earlier. In his 1923 review, Freyd[5] discusses the various forms of response scale available at that time, which subsequently became dominated by Likert’s[6] 5-level rating scale. All of this early development in the social sciences was ignored by the members of Hoover’s committee.
Thirty years later, little had changed. The beginnings of subjective social indicators, as a systematic topic for study, is usually attributed to Bauer’s (1966) edited work “Social Indicators”[1]. In fact, however, the authors of this work evidenced substantial misgivings, describing subjective indicators by terms such
as “impressionistic”, “qualitative”, and “mysterious”. Evidently, some new catalyst was required to interest econometricians in subjective indicators, and this was supplied by Easterlin[7] who reported that the positive association between income and happiness did not simply apply over time. While this news electrified the academic community, the national statistical agencies were less impressed, and continued to represent national life quality through economic data.
Some yet stronger stimulus was needed to jolt the agencies out of their complacency. This was precipitated by the global financial crisis of 2007-2008. The Stiglitz Commission[8] again reminded governments that Gross Domestic Product is not sufficient as an indicator of national progress, and proposed that countries turn to the measurement of subjective wellbeing as a complementary social and economic indicator. This authoritative voice engendered action. Both the World Health Organization[9] and the Organization for Economic Cooperation and Development[10] revised their definitions of well-being, with both organizations also recommending the national measurement of subjective well-being.
In the current era, subjective social indicators are starting to appear more commonly in national surveys. However, their inclusion usually appears as an after-thought. Understandably, the employees of national agencies have backgrounds in economics, business, or associated statistics. Subjective social indicators, on the other hand, are the province of the social sciences, particularly psychology. Thus, because the knowledge-silos of economics and psychology are so distinct from one another, subjective indicators are not valued by national statistical offices, are poorly understood, and poorly analyzed. As a consequence they yield uninteresting data, which leads to them not being valued. The cycle is complete.
Breaking this nexus requires two forms of action; one on each side of the disciplinary fence. The first is a willingness by national statistical offices to comprehend the contemporary potential of subjective social indicators for public policy advice. The second is for psychological scientists to make their work accessible outside their disci-pline, emphasizing the usefulness of their measu-res. In order for this to occur, all of those invol-ved need to agree on how to define and measure subjective life quality.
Understanding Subjective Wellbeing
The greatest single impediment to advancing acceptance of SWB as a social indicator is the absence of rules for nomenclature. It is surely not surprising that policy makers show indiffe-rence in the face of a variable with quite arbitrary descriptions. For example, SWB is often referred to in the social indicator literatu-re as “happiness”. Yet this term has two impor-tantly different meanings.
The common meaning of happiness is a positive feeling consequential to a short term event. When something happens to them that’s nice, people feel happy. This form of happiness is transitory, and is what psychologists refer to as an emotional state. The second kind of happi-ness is a mood. This form of happiness is not generated in reaction to something that has happened, but rather is a genetic trait that normally forms a constant background to our thoughts[11]. It is a gentle, mildly activated form of positive affect and its major importance is to keep us feeling good about ourselves.
In the context of social indicators, emotional happiness is noise in the measurement, varying from moment to moment. The measure of policy interest is mood happiness, and this is the major component of SWB[12,13,14]. This form of happiness causes SWB to have some very interesting properties. For example, SWB is normally experienced as a positive feeling and its level is normally quite stable.
Subjective wellbeing homeostasis
Why are these SWB mean scores so predictable? The theory of SWB homeostasis offers an explanation. This theory proposes that, in a manner analogous to the homeostatic main- tenance of blood calcium or body temperature, the level of SWB is actively controlled and maintained by a set of psychological devices, described in detail elsewhere[16,17,18].
At the heart of homeostasis is each person’s set-point for their SWB. This set-point is what homeostasis is defending. While each set-point is determined genetically, and does not change, responses to SWB questions do show variation. This is caused by intrusive emotions becoming incorporated into each SWB response[19].
This understanding, that SWB can vary while set-points do not, introduces a major caution to the interpretation of SWB measurement. Consider the analogy with the set-point for core body temperature (37o C). Prolonged exposure to a sufficiently persistent hot or cold thermal challenge will cause core body temperature to rise or fall. This does not represent a change in set-point. It is a defeat of homeostasis and, once the source of thermal challenge is removed, body temperature will normally revert to its set-point. This explains why, contrary to the views expressed by some authors[20,21], set-point theory does not carry an assumption of immutability in measured SWB.
Crucially, however, in order for SWB to return to set-point following an emotion, external and internal resources must be directed to the restoration of homeostasis. If these resources are sufficient, SWB returns to approximate its set-point. If the resources are insufficient, SWB remains below its normal range and the person is at high risk of depression[11].
Homeostatic resources
There are several internal psychological forms of homeostatic defence[18] which will not be discussed here. Of more direct relevance to the current context are three objective social indicators. These have been identified as the three domains of the Personal Well-being Index[22] which most strongly contribute to Global Life satisfaction (GLS) using multiple regression[15]. They are collectively referred to as the “Golden Triangle of Happiness” and comprise money, relationships, and achieving in life through a purposeful activity.
Each of these resources has a dual action. They both defend against homeostatic failure and also assist homeostatic maintenance. This is because active engagement with each resource is intrinsically rewarding. For example:
• Money can be used as a defensive resource. To avoid the negative experience of dog-washing, someone else can be paid to do the job. The time saved can then be used for a personally satisfying activity.
• Relationships, when positive and intimate, allow much of daily life to occur within a secure social environment. This both reduces the probability of unpleasant social encounters and also increases the probability of positive social interactions.
• Achieving something personally important each day engages positive life routines in a secure context and provides a positive sense of purpose.
In summary, engagement with these three resources assists homeostatic defense by reducing the probability of negative events and maintaining positive feelings through engagement with secure and rewarding activities.
SWB as a useful social indicator The practical implications of this understanding for public policy concerns the distribution of resources, especially financial resources, to support homeostasis. If people are living under conditions of chronic resource deprivation, that is sufficiently adverse to defeat homeostasis, then their SWB will be maintained at levels significantly below their set-point. Under such conditions people will be highly susceptible to depression and, in Australia, this applies to about 5% of the population[23]. However, when vulnerable groups are targeted for measurement[24] the proportion of people in homeostatic defeat is much higher. Moreover, and importantly for
policy, additional resources provided to people in homeostatic failure will reliably lift their SWB towards the average of the population[25]. The policy implications of this are clear. The most efficient way to increase population levels of SWB is to allocate additional resources to people with chronically low levels of SWB.
Summary
A great deal of understanding has accumulated in the 85 year history of subjective social indicators. Reliable and valid measures of subjective well-being (SWB) are now available and the results can be interpreted in terms of the most effective distribution of resources. These advances are also framed by a plausible theoretical model, in the form of subjective well-being homeostasis. If it is considered desirable for all citizens to experience normal levels of life quality, then SWB is an excellent national indicator of the degree to which it is being achieved. Whether our politicians and national statistical offices decide to collect data on subjective well-being is now based on political, rather than a scientific, reasoning.
Acknowledgement: This work was supported by the National Research Foundation of Korea Grant funded by the Korean Government (NRF-2013S1A3A2054622).
References
[1] Land KC, Michalos AC. Fifty years after the social indicators movement: has the promise been fulfilled? An assessment and an agenda for the future. Social Indicators Research. 2017; 135: 835-868.
[2] Australian Centre on Quality of Life. What is quality of life? [Internet]. Victoria, Australia: Deakin University; 2017. Retrieved from: http://www.deakin.edu.au/research/acqol/instruments/instrument.php
[3] Hoover H. Foreword. In W. C. Mitchell & et al (Eds.). U.S. president's research committee on social trends: recent social trends in the united states (Vol. Volume 1, pp. v). New York: McGraw-Hill Book Company; 1933. [4] Angell RC. Recent social trends in the united states: report of the president's research committee: I. Summary and comment. Michigan Law Review. 1933; 31(5): 638-658
[5] Freyd, M. The graphic rating scale. Journal of Educational Psychology.1923; 14: 83-102.
[6] Likert R. A technique for the measurement of attitudes. Archives in Psychology.1932; 22(140): 1-55.
[7] Easterlin RA. Does economic growth improve the human lot? Some empirical evidence. In David P & Reder M (Eds.), Nations and households in economic growth (pp. 89-125). New York: Academic Press; 1974.
[8] Stiglitz, J., Sen, A., & Fitoussi, J.-P. Report by the commission on the measurement of economic performance and social progress. Paris: Commi- ssion on the Measurement of Economic Perfor- mance and Social Progress; 2010. Retrieved from: http ://www.st igl i tz-sen-f i touss i . f r/docu- ments/rapport_anglais.pdf
[9] WHO. The European health report 2012: charting the way to well-being. Copenhagen, Dinamark: The regional office of Europe of World Health Organization; 2012. Retrieved from: h t t p : // w w w. e u ro .wh o . i n t / _ _ da ta / a s s e t s /pdf_file/0004/197113/EHR2012-Eng.pdf
[10]OECD. OECD guidelines on measuring subjective well-being. París: OECD Publishing; 2013. Retrieved from: http://dx.doi.org/ 10.1787/9789264191655-en
[11] Cummins RA. Subjective wellbeing, homeos- tatically protected mood and depression: a synthesis.
Journal of Happiness Studies. 2010(a); 11(1), 1-17. Retrieved from: doi:10.1007/s10902-009-9167-0[12] Blore JD, Stokes MA, Mellor D, Firth L & Cummins RA. Comparing multiple discrepancies theory to affective models of subjective wellbeing. Social Indicators Research. 2011; 100(1): 1-16. Retrieved from: doi:10.1007/s11205-010-9599-2
[13] Davern M, Cummins RA & Stokes M. Subjective wellbeing as an affective/cognitive construct. Journal of Happiness Studies. 2007; 8(4): 429-449. Retrieved from: doi:10.1007/s10902-007-9066-1
[14] Tomyn AJ & Cummins RA. Subjective wellbeing and homeostatically protected mood: theory validation with adolescents. Journal of Happiness Studies. 2011(a); 12(5): 897-914. Retrieved from: doi:10.1007/s10902-010-9235 -5
[15] Cummins RA, Woerner J, Weinberg M, Collard J, Hartley-Clark L & Horfiniak K. Australian Unity Wellbeing Index: -Report 30.0 - The wellbeing of Australians: social media, personal achievement, and work. Melbourne: Australian Centre on Quality of Life, School of Psychology, Deakin University; 2013c. Retrieved from: http://www.acqol.com.au/ reports/auwbi.php.
[16] Cummins RA. Subjective wellbeing homeostasis D. S. Dunn (Ed.) Oxford Bibliographies Online; 2013a. Retrieved from: http://www.oxfordbibliographies.com/view/document/obo-9780199828340/obo-9780199828340-0167.xml [17] Cummins RA. Can happiness change? theories and evidence. In K. M. Sheldon & R. E. Lucas (Eds.) Stability of happiness: theories and evidence on whether happiness can change (pp. 75-97). Amsterdam: Elsevier; 2014b.
[18] Cummins, R. A. The theory of subjective wellbeing homeostasis: a contribution to understanding life quality. In F. Maggino (Ed.). A life devoted to quality of life - festschrift in honor of alex c. michalos (Vol. 60, pp. 61-79). Dordrecht,
In terms of this stability, over the past 15 years we have measured the SWB of the Australian population through 30 surveys, each of 2000 people, nationally representative. When the results are standardized to lie on a 0-100 point scale, and survey mean scores are used as data, the full range of values lies between 73.8–76.7 percentage points[15]. In other words, the mean score of a random survey of people in Australia can be predicted, with 95% certainty, to lie within a 2.9 percentage point range. There is no precedent in the literature for such extraordinary stability in self-report data.
They are collectively referred to as the “Golden Triangle of Happiness” and comprise money, relationships, and achieving in life through a purposeful activity.
“
“
51
Policy Brief Polis N° 19 | CaliBRANDO
Netherlands: Springer; 2016a.
[19] Cummins RA, Li L, Wooden M. & Stokes M.. A demonstration of set-points for subjective wellbeing. Journal of Happiness Studies. 2014a; 15: 183-206. Retrieved from: doi:10.1007/ s10902-013-9444-9
[20] Easterlin, R. A. Do people adapt to poorer health? health and health satisfaction over the life cycle. In F. Maggino (Ed.), A life devoted to quality of life - festschrift in honor of alex c. michalos (Vol. 60, pp. 81-92). Dordrecht, Netherlands: Springer; 2016.
[21] Headey B, Muffels R. & Wagner GG. National panel studies show substantial minorities recording long-term change in life satisfaction: implications for set point theory. In K. M. Sheldon & R. E. Lucas (Eds.), Stability of happiness: theories and evidence on whether happiness can change (pp. 99-126). New York: Elsevier; 2014.
[22] International wellbeing group. personal wellbeing index manual: 5th Edition; 2013. Retrieved from: http://www.acqol.com.au/ iwbg/wellbeing-index/index.php
[23] Cummins RA & Nistico H. Maintaining life satisfaction: the role of positive cognitive bias. Journal of Happiness Studies. 2002; 3(1): 37-69. [24] Hammond T, Weinberg MK & Cummins RA. The dyadic interaction of relationships and disability type on informal carer subjective well-being. Quality of Life Research. 2014; 23(5): 1535-1542.
[25] Tomyn AJ, Weinberg MK & Cummins RA. Intervention efficacy among ‘at risk’ adolescents: A test of subjective wellbeing homeostasis theory. Social Indicators Research. 2015; 120(3): 883-895. Retrieved from:doi:10.1007/s11205 -014-0619-5
It is interesting to note that this dependence on objective measures of national progress has not substantially changed over the past 85 years. The earliest opportunity to begin a systematic consideration of subjective indicators arose from an initiative of USA President Hoover[3]. In 1929 he formed the Research Committee on Social Trends, with a charter to “examine into the feasibility of a national survey of social trends”. In 1933 his committee produced a massive report of over 1600 pages, with 29 chapters written by some 40 authors. Notwithstanding chapter headings such as “Vitality” and “Changing social attitudes and interests”, the content relies purely on objective data; a limitation noted at that time as a “paradox of the social sciences” by R. F. Remer[4]. Yet he, and other critics, offered no guidance as to how to actually create subjective evaluations of population well-being.
It is also notable that Hoover’s Committee failed to acknowledge contemporary literature in the social sciences. In fact, the technology for measuring subjective evaluations had been well described decades earlier. In his 1923 review, Freyd[5] discusses the various forms of response scale available at that time, which subsequently became dominated by Likert’s[6] 5-level rating scale. All of this early development in the social sciences was ignored by the members of Hoover’s committee.
Thirty years later, little had changed. The beginnings of subjective social indicators, as a systematic topic for study, is usually attributed to Bauer’s (1966) edited work “Social Indicators”[1]. In fact, however, the authors of this work evidenced substantial misgivings, describing subjective indicators by terms such
as “impressionistic”, “qualitative”, and “mysterious”. Evidently, some new catalyst was required to interest econometricians in subjective indicators, and this was supplied by Easterlin[7] who reported that the positive association between income and happiness did not simply apply over time. While this news electrified the academic community, the national statistical agencies were less impressed, and continued to represent national life quality through economic data.
Some yet stronger stimulus was needed to jolt the agencies out of their complacency. This was precipitated by the global financial crisis of 2007-2008. The Stiglitz Commission[8] again reminded governments that Gross Domestic Product is not sufficient as an indicator of national progress, and proposed that countries turn to the measurement of subjective wellbeing as a complementary social and economic indicator. This authoritative voice engendered action. Both the World Health Organization[9] and the Organization for Economic Cooperation and Development[10] revised their definitions of well-being, with both organizations also recommending the national measurement of subjective well-being.
In the current era, subjective social indicators are starting to appear more commonly in national surveys. However, their inclusion usually appears as an after-thought. Understandably, the employees of national agencies have backgrounds in economics, business, or associated statistics. Subjective social indicators, on the other hand, are the province of the social sciences, particularly psychology. Thus, because the knowledge-silos of economics and psychology are so distinct from one another, subjective indicators are not valued by national statistical offices, are poorly understood, and poorly analyzed. As a consequence they yield uninteresting data, which leads to them not being valued. The cycle is complete.
Breaking this nexus requires two forms of action; one on each side of the disciplinary fence. The first is a willingness by national statistical offices to comprehend the contemporary potential of subjective social indicators for public policy advice. The second is for psychological scientists to make their work accessible outside their disci-pline, emphasizing the usefulness of their measu-res. In order for this to occur, all of those invol-ved need to agree on how to define and measure subjective life quality.
Understanding Subjective Wellbeing
The greatest single impediment to advancing acceptance of SWB as a social indicator is the absence of rules for nomenclature. It is surely not surprising that policy makers show indiffe-rence in the face of a variable with quite arbitrary descriptions. For example, SWB is often referred to in the social indicator literatu-re as “happiness”. Yet this term has two impor-tantly different meanings.
The common meaning of happiness is a positive feeling consequential to a short term event. When something happens to them that’s nice, people feel happy. This form of happiness is transitory, and is what psychologists refer to as an emotional state. The second kind of happi-ness is a mood. This form of happiness is not generated in reaction to something that has happened, but rather is a genetic trait that normally forms a constant background to our thoughts[11]. It is a gentle, mildly activated form of positive affect and its major importance is to keep us feeling good about ourselves.
In the context of social indicators, emotional happiness is noise in the measurement, varying from moment to moment. The measure of policy interest is mood happiness, and this is the major component of SWB[12,13,14]. This form of happiness causes SWB to have some very interesting properties. For example, SWB is normally experienced as a positive feeling and its level is normally quite stable.
Subjective wellbeing homeostasis
Why are these SWB mean scores so predictable? The theory of SWB homeostasis offers an explanation. This theory proposes that, in a manner analogous to the homeostatic main- tenance of blood calcium or body temperature, the level of SWB is actively controlled and maintained by a set of psychological devices, described in detail elsewhere[16,17,18].
At the heart of homeostasis is each person’s set-point for their SWB. This set-point is what homeostasis is defending. While each set-point is determined genetically, and does not change, responses to SWB questions do show variation. This is caused by intrusive emotions becoming incorporated into each SWB response[19].
This understanding, that SWB can vary while set-points do not, introduces a major caution to the interpretation of SWB measurement. Consider the analogy with the set-point for core body temperature (37o C). Prolonged exposure to a sufficiently persistent hot or cold thermal challenge will cause core body temperature to rise or fall. This does not represent a change in set-point. It is a defeat of homeostasis and, once the source of thermal challenge is removed, body temperature will normally revert to its set-point. This explains why, contrary to the views expressed by some authors[20,21], set-point theory does not carry an assumption of immutability in measured SWB.
Crucially, however, in order for SWB to return to set-point following an emotion, external and internal resources must be directed to the restoration of homeostasis. If these resources are sufficient, SWB returns to approximate its set-point. If the resources are insufficient, SWB remains below its normal range and the person is at high risk of depression[11].
Homeostatic resources
There are several internal psychological forms of homeostatic defence[18] which will not be discussed here. Of more direct relevance to the current context are three objective social indicators. These have been identified as the three domains of the Personal Well-being Index[22] which most strongly contribute to Global Life satisfaction (GLS) using multiple regression[15]. They are collectively referred to as the “Golden Triangle of Happiness” and comprise money, relationships, and achieving in life through a purposeful activity.
Each of these resources has a dual action. They both defend against homeostatic failure and also assist homeostatic maintenance. This is because active engagement with each resource is intrinsically rewarding. For example:
• Money can be used as a defensive resource. To avoid the negative experience of dog-washing, someone else can be paid to do the job. The time saved can then be used for a personally satisfying activity.
• Relationships, when positive and intimate, allow much of daily life to occur within a secure social environment. This both reduces the probability of unpleasant social encounters and also increases the probability of positive social interactions.
• Achieving something personally important each day engages positive life routines in a secure context and provides a positive sense of purpose.
In summary, engagement with these three resources assists homeostatic defense by reducing the probability of negative events and maintaining positive feelings through engagement with secure and rewarding activities.
SWB as a useful social indicator The practical implications of this understanding for public policy concerns the distribution of resources, especially financial resources, to support homeostasis. If people are living under conditions of chronic resource deprivation, that is sufficiently adverse to defeat homeostasis, then their SWB will be maintained at levels significantly below their set-point. Under such conditions people will be highly susceptible to depression and, in Australia, this applies to about 5% of the population[23]. However, when vulnerable groups are targeted for measurement[24] the proportion of people in homeostatic defeat is much higher. Moreover, and importantly for
policy, additional resources provided to people in homeostatic failure will reliably lift their SWB towards the average of the population[25]. The policy implications of this are clear. The most efficient way to increase population levels of SWB is to allocate additional resources to people with chronically low levels of SWB.
Summary
A great deal of understanding has accumulated in the 85 year history of subjective social indicators. Reliable and valid measures of subjective well-being (SWB) are now available and the results can be interpreted in terms of the most effective distribution of resources. These advances are also framed by a plausible theoretical model, in the form of subjective well-being homeostasis. If it is considered desirable for all citizens to experience normal levels of life quality, then SWB is an excellent national indicator of the degree to which it is being achieved. Whether our politicians and national statistical offices decide to collect data on subjective well-being is now based on political, rather than a scientific, reasoning.
Acknowledgement: This work was supported by the National Research Foundation of Korea Grant funded by the Korean Government (NRF-2013S1A3A2054622).
References
[1] Land KC, Michalos AC. Fifty years after the social indicators movement: has the promise been fulfilled? An assessment and an agenda for the future. Social Indicators Research. 2017; 135: 835-868.
[2] Australian Centre on Quality of Life. What is quality of life? [Internet]. Victoria, Australia: Deakin University; 2017. Retrieved from: http://www.deakin.edu.au/research/acqol/instruments/instrument.php
[3] Hoover H. Foreword. In W. C. Mitchell & et al (Eds.). U.S. president's research committee on social trends: recent social trends in the united states (Vol. Volume 1, pp. v). New York: McGraw-Hill Book Company; 1933. [4] Angell RC. Recent social trends in the united states: report of the president's research committee: I. Summary and comment. Michigan Law Review. 1933; 31(5): 638-658
[5] Freyd, M. The graphic rating scale. Journal of Educational Psychology.1923; 14: 83-102.
[6] Likert R. A technique for the measurement of attitudes. Archives in Psychology.1932; 22(140): 1-55.
[7] Easterlin RA. Does economic growth improve the human lot? Some empirical evidence. In David P & Reder M (Eds.), Nations and households in economic growth (pp. 89-125). New York: Academic Press; 1974.
[8] Stiglitz, J., Sen, A., & Fitoussi, J.-P. Report by the commission on the measurement of economic performance and social progress. Paris: Commi- ssion on the Measurement of Economic Perfor- mance and Social Progress; 2010. Retrieved from: http ://www.st igl i tz-sen-f i touss i . f r/docu- ments/rapport_anglais.pdf
[9] WHO. The European health report 2012: charting the way to well-being. Copenhagen, Dinamark: The regional office of Europe of World Health Organization; 2012. Retrieved from: h t t p : // w w w. e u ro .wh o . i n t / _ _ da ta / a s s e t s /pdf_file/0004/197113/EHR2012-Eng.pdf
[10]OECD. OECD guidelines on measuring subjective well-being. París: OECD Publishing; 2013. Retrieved from: http://dx.doi.org/ 10.1787/9789264191655-en
[11] Cummins RA. Subjective wellbeing, homeos- tatically protected mood and depression: a synthesis.
Journal of Happiness Studies. 2010(a); 11(1), 1-17. Retrieved from: doi:10.1007/s10902-009-9167-0[12] Blore JD, Stokes MA, Mellor D, Firth L & Cummins RA. Comparing multiple discrepancies theory to affective models of subjective wellbeing. Social Indicators Research. 2011; 100(1): 1-16. Retrieved from: doi:10.1007/s11205-010-9599-2
[13] Davern M, Cummins RA & Stokes M. Subjective wellbeing as an affective/cognitive construct. Journal of Happiness Studies. 2007; 8(4): 429-449. Retrieved from: doi:10.1007/s10902-007-9066-1
[14] Tomyn AJ & Cummins RA. Subjective wellbeing and homeostatically protected mood: theory validation with adolescents. Journal of Happiness Studies. 2011(a); 12(5): 897-914. Retrieved from: doi:10.1007/s10902-010-9235 -5
[15] Cummins RA, Woerner J, Weinberg M, Collard J, Hartley-Clark L & Horfiniak K. Australian Unity Wellbeing Index: -Report 30.0 - The wellbeing of Australians: social media, personal achievement, and work. Melbourne: Australian Centre on Quality of Life, School of Psychology, Deakin University; 2013c. Retrieved from: http://www.acqol.com.au/ reports/auwbi.php.
[16] Cummins RA. Subjective wellbeing homeostasis D. S. Dunn (Ed.) Oxford Bibliographies Online; 2013a. Retrieved from: http://www.oxfordbibliographies.com/view/document/obo-9780199828340/obo-9780199828340-0167.xml [17] Cummins RA. Can happiness change? theories and evidence. In K. M. Sheldon & R. E. Lucas (Eds.) Stability of happiness: theories and evidence on whether happiness can change (pp. 75-97). Amsterdam: Elsevier; 2014b.
[18] Cummins, R. A. The theory of subjective wellbeing homeostasis: a contribution to understanding life quality. In F. Maggino (Ed.). A life devoted to quality of life - festschrift in honor of alex c. michalos (Vol. 60, pp. 61-79). Dordrecht,
In terms of this stability, over the past 15 years we have measured the SWB of the Australian population through 30 surveys, each of 2000 people, nationally representative. When the results are standardized to lie on a 0-100 point scale, and survey mean scores are used as data, the full range of values lies between 73.8–76.7 percentage points[15]. In other words, the mean score of a random survey of people in Australia can be predicted, with 95% certainty, to lie within a 2.9 percentage point range. There is no precedent in the literature for such extraordinary stability in self-report data.
52
Robert A. Cummins | CaliBRANDO
Netherlands: Springer; 2016a.
[19] Cummins RA, Li L, Wooden M. & Stokes M.. A demonstration of set-points for subjective wellbeing. Journal of Happiness Studies. 2014a; 15: 183-206. Retrieved from: doi:10.1007/ s10902-013-9444-9
[20] Easterlin, R. A. Do people adapt to poorer health? health and health satisfaction over the life cycle. In F. Maggino (Ed.), A life devoted to quality of life - festschrift in honor of alex c. michalos (Vol. 60, pp. 81-92). Dordrecht, Netherlands: Springer; 2016.
[21] Headey B, Muffels R. & Wagner GG. National panel studies show substantial minorities recording long-term change in life satisfaction: implications for set point theory. In K. M. Sheldon & R. E. Lucas (Eds.), Stability of happiness: theories and evidence on whether happiness can change (pp. 99-126). New York: Elsevier; 2014.
[22] International wellbeing group. personal wellbeing index manual: 5th Edition; 2013. Retrieved from: http://www.acqol.com.au/ iwbg/wellbeing-index/index.php
[23] Cummins RA & Nistico H. Maintaining life satisfaction: the role of positive cognitive bias. Journal of Happiness Studies. 2002; 3(1): 37-69. [24] Hammond T, Weinberg MK & Cummins RA. The dyadic interaction of relationships and disability type on informal carer subjective well-being. Quality of Life Research. 2014; 23(5): 1535-1542.
[25] Tomyn AJ, Weinberg MK & Cummins RA. Intervention efficacy among ‘at risk’ adolescents: A test of subjective wellbeing homeostasis theory. Social Indicators Research. 2015; 120(3): 883-895. Retrieved from:doi:10.1007/s11205 -014-0619-5
It is interesting to note that this dependence on objective measures of national progress has not substantially changed over the past 85 years. The earliest opportunity to begin a systematic consideration of subjective indicators arose from an initiative of USA President Hoover[3]. In 1929 he formed the Research Committee on Social Trends, with a charter to “examine into the feasibility of a national survey of social trends”. In 1933 his committee produced a massive report of over 1600 pages, with 29 chapters written by some 40 authors. Notwithstanding chapter headings such as “Vitality” and “Changing social attitudes and interests”, the content relies purely on objective data; a limitation noted at that time as a “paradox of the social sciences” by R. F. Remer[4]. Yet he, and other critics, offered no guidance as to how to actually create subjective evaluations of population well-being.
It is also notable that Hoover’s Committee failed to acknowledge contemporary literature in the social sciences. In fact, the technology for measuring subjective evaluations had been well described decades earlier. In his 1923 review, Freyd[5] discusses the various forms of response scale available at that time, which subsequently became dominated by Likert’s[6] 5-level rating scale. All of this early development in the social sciences was ignored by the members of Hoover’s committee.
Thirty years later, little had changed. The beginnings of subjective social indicators, as a systematic topic for study, is usually attributed to Bauer’s (1966) edited work “Social Indicators”[1]. In fact, however, the authors of this work evidenced substantial misgivings, describing subjective indicators by terms such
as “impressionistic”, “qualitative”, and “mysterious”. Evidently, some new catalyst was required to interest econometricians in subjective indicators, and this was supplied by Easterlin[7] who reported that the positive association between income and happiness did not simply apply over time. While this news electrified the academic community, the national statistical agencies were less impressed, and continued to represent national life quality through economic data.
Some yet stronger stimulus was needed to jolt the agencies out of their complacency. This was precipitated by the global financial crisis of 2007-2008. The Stiglitz Commission[8] again reminded governments that Gross Domestic Product is not sufficient as an indicator of national progress, and proposed that countries turn to the measurement of subjective wellbeing as a complementary social and economic indicator. This authoritative voice engendered action. Both the World Health Organization[9] and the Organization for Economic Cooperation and Development[10] revised their definitions of well-being, with both organizations also recommending the national measurement of subjective well-being.
In the current era, subjective social indicators are starting to appear more commonly in national surveys. However, their inclusion usually appears as an after-thought. Understandably, the employees of national agencies have backgrounds in economics, business, or associated statistics. Subjective social indicators, on the other hand, are the province of the social sciences, particularly psychology. Thus, because the knowledge-silos of economics and psychology are so distinct from one another, subjective indicators are not valued by national statistical offices, are poorly understood, and poorly analyzed. As a consequence they yield uninteresting data, which leads to them not being valued. The cycle is complete.
Breaking this nexus requires two forms of action; one on each side of the disciplinary fence. The first is a willingness by national statistical offices to comprehend the contemporary potential of subjective social indicators for public policy advice. The second is for psychological scientists to make their work accessible outside their disci-pline, emphasizing the usefulness of their measu-res. In order for this to occur, all of those invol-ved need to agree on how to define and measure subjective life quality.
Understanding Subjective Wellbeing
The greatest single impediment to advancing acceptance of SWB as a social indicator is the absence of rules for nomenclature. It is surely not surprising that policy makers show indiffe-rence in the face of a variable with quite arbitrary descriptions. For example, SWB is often referred to in the social indicator literatu-re as “happiness”. Yet this term has two impor-tantly different meanings.
The common meaning of happiness is a positive feeling consequential to a short term event. When something happens to them that’s nice, people feel happy. This form of happiness is transitory, and is what psychologists refer to as an emotional state. The second kind of happi-ness is a mood. This form of happiness is not generated in reaction to something that has happened, but rather is a genetic trait that normally forms a constant background to our thoughts[11]. It is a gentle, mildly activated form of positive affect and its major importance is to keep us feeling good about ourselves.
In the context of social indicators, emotional happiness is noise in the measurement, varying from moment to moment. The measure of policy interest is mood happiness, and this is the major component of SWB[12,13,14]. This form of happiness causes SWB to have some very interesting properties. For example, SWB is normally experienced as a positive feeling and its level is normally quite stable.
Subjective wellbeing homeostasis
Why are these SWB mean scores so predictable? The theory of SWB homeostasis offers an explanation. This theory proposes that, in a manner analogous to the homeostatic main- tenance of blood calcium or body temperature, the level of SWB is actively controlled and maintained by a set of psychological devices, described in detail elsewhere[16,17,18].
At the heart of homeostasis is each person’s set-point for their SWB. This set-point is what homeostasis is defending. While each set-point is determined genetically, and does not change, responses to SWB questions do show variation. This is caused by intrusive emotions becoming incorporated into each SWB response[19].
This understanding, that SWB can vary while set-points do not, introduces a major caution to the interpretation of SWB measurement. Consider the analogy with the set-point for core body temperature (37o C). Prolonged exposure to a sufficiently persistent hot or cold thermal challenge will cause core body temperature to rise or fall. This does not represent a change in set-point. It is a defeat of homeostasis and, once the source of thermal challenge is removed, body temperature will normally revert to its set-point. This explains why, contrary to the views expressed by some authors[20,21], set-point theory does not carry an assumption of immutability in measured SWB.
Crucially, however, in order for SWB to return to set-point following an emotion, external and internal resources must be directed to the restoration of homeostasis. If these resources are sufficient, SWB returns to approximate its set-point. If the resources are insufficient, SWB remains below its normal range and the person is at high risk of depression[11].
Homeostatic resources
There are several internal psychological forms of homeostatic defence[18] which will not be discussed here. Of more direct relevance to the current context are three objective social indicators. These have been identified as the three domains of the Personal Well-being Index[22] which most strongly contribute to Global Life satisfaction (GLS) using multiple regression[15]. They are collectively referred to as the “Golden Triangle of Happiness” and comprise money, relationships, and achieving in life through a purposeful activity.
Each of these resources has a dual action. They both defend against homeostatic failure and also assist homeostatic maintenance. This is because active engagement with each resource is intrinsically rewarding. For example:
• Money can be used as a defensive resource. To avoid the negative experience of dog-washing, someone else can be paid to do the job. The time saved can then be used for a personally satisfying activity.
• Relationships, when positive and intimate, allow much of daily life to occur within a secure social environment. This both reduces the probability of unpleasant social encounters and also increases the probability of positive social interactions.
• Achieving something personally important each day engages positive life routines in a secure context and provides a positive sense of purpose.
In summary, engagement with these three resources assists homeostatic defense by reducing the probability of negative events and maintaining positive feelings through engagement with secure and rewarding activities.
SWB as a useful social indicator The practical implications of this understanding for public policy concerns the distribution of resources, especially financial resources, to support homeostasis. If people are living under conditions of chronic resource deprivation, that is sufficiently adverse to defeat homeostasis, then their SWB will be maintained at levels significantly below their set-point. Under such conditions people will be highly susceptible to depression and, in Australia, this applies to about 5% of the population[23]. However, when vulnerable groups are targeted for measurement[24] the proportion of people in homeostatic defeat is much higher. Moreover, and importantly for
policy, additional resources provided to people in homeostatic failure will reliably lift their SWB towards the average of the population[25]. The policy implications of this are clear. The most efficient way to increase population levels of SWB is to allocate additional resources to people with chronically low levels of SWB.
Summary
A great deal of understanding has accumulated in the 85 year history of subjective social indicators. Reliable and valid measures of subjective well-being (SWB) are now available and the results can be interpreted in terms of the most effective distribution of resources. These advances are also framed by a plausible theoretical model, in the form of subjective well-being homeostasis. If it is considered desirable for all citizens to experience normal levels of life quality, then SWB is an excellent national indicator of the degree to which it is being achieved. Whether our politicians and national statistical offices decide to collect data on subjective well-being is now based on political, rather than a scientific, reasoning.
Acknowledgement: This work was supported by the National Research Foundation of Korea Grant funded by the Korean Government (NRF-2013S1A3A2054622).
References
[1] Land KC, Michalos AC. Fifty years after the social indicators movement: has the promise been fulfilled? An assessment and an agenda for the future. Social Indicators Research. 2017; 135: 835-868.
[2] Australian Centre on Quality of Life. What is quality of life? [Internet]. Victoria, Australia: Deakin University; 2017. Retrieved from: http://www.deakin.edu.au/research/acqol/instruments/instrument.php
[3] Hoover H. Foreword. In W. C. Mitchell & et al (Eds.). U.S. president's research committee on social trends: recent social trends in the united states (Vol. Volume 1, pp. v). New York: McGraw-Hill Book Company; 1933. [4] Angell RC. Recent social trends in the united states: report of the president's research committee: I. Summary and comment. Michigan Law Review. 1933; 31(5): 638-658
[5] Freyd, M. The graphic rating scale. Journal of Educational Psychology.1923; 14: 83-102.
[6] Likert R. A technique for the measurement of attitudes. Archives in Psychology.1932; 22(140): 1-55.
[7] Easterlin RA. Does economic growth improve the human lot? Some empirical evidence. In David P & Reder M (Eds.), Nations and households in economic growth (pp. 89-125). New York: Academic Press; 1974.
[8] Stiglitz, J., Sen, A., & Fitoussi, J.-P. Report by the commission on the measurement of economic performance and social progress. Paris: Commi- ssion on the Measurement of Economic Perfor- mance and Social Progress; 2010. Retrieved from: http ://www.st igl i tz-sen-f i touss i . f r/docu- ments/rapport_anglais.pdf
[9] WHO. The European health report 2012: charting the way to well-being. Copenhagen, Dinamark: The regional office of Europe of World Health Organization; 2012. Retrieved from: h t t p : // w w w. e u ro .wh o . i n t / _ _ da ta / a s s e t s /pdf_file/0004/197113/EHR2012-Eng.pdf
[10]OECD. OECD guidelines on measuring subjective well-being. París: OECD Publishing; 2013. Retrieved from: http://dx.doi.org/ 10.1787/9789264191655-en
[11] Cummins RA. Subjective wellbeing, homeos- tatically protected mood and depression: a synthesis.
Journal of Happiness Studies. 2010(a); 11(1), 1-17. Retrieved from: doi:10.1007/s10902-009-9167-0[12] Blore JD, Stokes MA, Mellor D, Firth L & Cummins RA. Comparing multiple discrepancies theory to affective models of subjective wellbeing. Social Indicators Research. 2011; 100(1): 1-16. Retrieved from: doi:10.1007/s11205-010-9599-2
[13] Davern M, Cummins RA & Stokes M. Subjective wellbeing as an affective/cognitive construct. Journal of Happiness Studies. 2007; 8(4): 429-449. Retrieved from: doi:10.1007/s10902-007-9066-1
[14] Tomyn AJ & Cummins RA. Subjective wellbeing and homeostatically protected mood: theory validation with adolescents. Journal of Happiness Studies. 2011(a); 12(5): 897-914. Retrieved from: doi:10.1007/s10902-010-9235 -5
[15] Cummins RA, Woerner J, Weinberg M, Collard J, Hartley-Clark L & Horfiniak K. Australian Unity Wellbeing Index: -Report 30.0 - The wellbeing of Australians: social media, personal achievement, and work. Melbourne: Australian Centre on Quality of Life, School of Psychology, Deakin University; 2013c. Retrieved from: http://www.acqol.com.au/ reports/auwbi.php.
[16] Cummins RA. Subjective wellbeing homeostasis D. S. Dunn (Ed.) Oxford Bibliographies Online; 2013a. Retrieved from: http://www.oxfordbibliographies.com/view/document/obo-9780199828340/obo-9780199828340-0167.xml [17] Cummins RA. Can happiness change? theories and evidence. In K. M. Sheldon & R. E. Lucas (Eds.) Stability of happiness: theories and evidence on whether happiness can change (pp. 75-97). Amsterdam: Elsevier; 2014b.
[18] Cummins, R. A. The theory of subjective wellbeing homeostasis: a contribution to understanding life quality. In F. Maggino (Ed.). A life devoted to quality of life - festschrift in honor of alex c. michalos (Vol. 60, pp. 61-79). Dordrecht,
In terms of this stability, over the past 15 years we have measured the SWB of the Australian population through 30 surveys, each of 2000 people, nationally representative. When the results are standardized to lie on a 0-100 point scale, and survey mean scores are used as data, the full range of values lies between 73.8–76.7 percentage points[15]. In other words, the mean score of a random survey of people in Australia can be predicted, with 95% certainty, to lie within a 2.9 percentage point range. There is no precedent in the literature for such extraordinary stability in self-report data.
Netherlands: Springer; 2016a.
[19] Cummins RA, Li L, Wooden M. & Stokes M.. A demonstration of set-points for subjective wellbeing. Journal of Happiness Studies. 2014a; 15: 183-206. Retrieved from: doi:10.1007/ s10902-013-9444-9
[20] Easterlin, R. A. Do people adapt to poorer health? health and health satisfaction over the life cycle. In F. Maggino (Ed.), A life devoted to quality of life - festschrift in honor of alex c. michalos (Vol. 60, pp. 81-92). Dordrecht, Netherlands: Springer; 2016.
[21] Headey B, Muffels R. & Wagner GG. National panel studies show substantial minorities recording long-term change in life satisfaction: implications for set point theory. In K. M. Sheldon & R. E. Lucas (Eds.), Stability of happiness: theories and evidence on whether happiness can change (pp. 99-126). New York: Elsevier; 2014.
[22] International wellbeing group. personal wellbeing index manual: 5th Edition; 2013. Retrieved from: http://www.acqol.com.au/ iwbg/wellbeing-index/index.php
[23] Cummins RA & Nistico H. Maintaining life satisfaction: the role of positive cognitive bias. Journal of Happiness Studies. 2002; 3(1): 37-69. [24] Hammond T, Weinberg MK & Cummins RA. The dyadic interaction of relationships and disability type on informal carer subjective well-being. Quality of Life Research. 2014; 23(5): 1535-1542.
[25] Tomyn AJ, Weinberg MK & Cummins RA. Intervention efficacy among ‘at risk’ adolescents: A test of subjective wellbeing homeostasis theory. Social Indicators Research. 2015; 120(3): 883-895. Retrieved from:doi:10.1007/s11205 -014-0619-5

It is interesting to note that this dependence on objective measures of national progress has not substantially changed over the past 85 years. The earliest opportunity to begin a systematic consideration of subjective indicators arose from an initiative of USA President Hoover[3]. In 1929 he formed the Research Committee on Social Trends, with a charter to “examine into the feasibility of a national survey of social trends”. In 1933 his committee produced a massive report of over 1600 pages, with 29 chapters written by some 40 authors. Notwithstanding chapter headings such as “Vitality” and “Changing social attitudes and interests”, the content relies purely on objective data; a limitation noted at that time as a “paradox of the social sciences” by R. F. Remer[4]. Yet he, and other critics, offered no guidance as to how to actually create subjective evaluations of population well-being.
It is also notable that Hoover’s Committee failed to acknowledge contemporary literature in the social sciences. In fact, the technology for measuring subjective evaluations had been well described decades earlier. In his 1923 review, Freyd[5] discusses the various forms of response scale available at that time, which subsequently became dominated by Likert’s[6] 5-level rating scale. All of this early development in the social sciences was ignored by the members of Hoover’s committee.
Thirty years later, little had changed. The beginnings of subjective social indicators, as a systematic topic for study, is usually attributed to Bauer’s (1966) edited work “Social Indicators”[1]. In fact, however, the authors of this work evidenced substantial misgivings, describing subjective indicators by terms such
as “impressionistic”, “qualitative”, and “mysterious”. Evidently, some new catalyst was required to interest econometricians in subjective indicators, and this was supplied by Easterlin[7] who reported that the positive association between income and happiness did not simply apply over time. While this news electrified the academic community, the national statistical agencies were less impressed, and continued to represent national life quality through economic data.
Some yet stronger stimulus was needed to jolt the agencies out of their complacency. This was precipitated by the global financial crisis of 2007-2008. The Stiglitz Commission[8] again reminded governments that Gross Domestic Product is not sufficient as an indicator of national progress, and proposed that countries turn to the measurement of subjective wellbeing as a complementary social and economic indicator. This authoritative voice engendered action. Both the World Health Organization[9] and the Organization for Economic Cooperation and Development[10] revised their definitions of well-being, with both organizations also recommending the national measurement of subjective well-being.
In the current era, subjective social indicators are starting to appear more commonly in national surveys. However, their inclusion usually appears as an after-thought. Understandably, the employees of national agencies have backgrounds in economics, business, or associated statistics. Subjective social indicators, on the other hand, are the province of the social sciences, particularly psychology. Thus, because the knowledge-silos of economics and psychology are so distinct from one another, subjective indicators are not valued by national statistical offices, are poorly understood, and poorly analyzed. As a consequence they yield uninteresting data, which leads to them not being valued. The cycle is complete.
Breaking this nexus requires two forms of action; one on each side of the disciplinary fence. The first is a willingness by national statistical offices to comprehend the contemporary potential of subjective social indicators for public policy advice. The second is for psychological scientists to make their work accessible outside their disci-pline, emphasizing the usefulness of their measu-res. In order for this to occur, all of those invol-ved need to agree on how to define and measure subjective life quality.
Understanding Subjective Wellbeing
The greatest single impediment to advancing acceptance of SWB as a social indicator is the absence of rules for nomenclature. It is surely not surprising that policy makers show indiffe-rence in the face of a variable with quite arbitrary descriptions. For example, SWB is often referred to in the social indicator literatu-re as “happiness”. Yet this term has two impor-tantly different meanings.
The common meaning of happiness is a positive feeling consequential to a short term event. When something happens to them that’s nice, people feel happy. This form of happiness is transitory, and is what psychologists refer to as an emotional state. The second kind of happi-ness is a mood. This form of happiness is not generated in reaction to something that has happened, but rather is a genetic trait that normally forms a constant background to our thoughts[11]. It is a gentle, mildly activated form of positive affect and its major importance is to keep us feeling good about ourselves.
In the context of social indicators, emotional happiness is noise in the measurement, varying from moment to moment. The measure of policy interest is mood happiness, and this is the major component of SWB[12,13,14]. This form of happiness causes SWB to have some very interesting properties. For example, SWB is normally experienced as a positive feeling and its level is normally quite stable.
Subjective wellbeing homeostasis
Why are these SWB mean scores so predictable? The theory of SWB homeostasis offers an explanation. This theory proposes that, in a manner analogous to the homeostatic main- tenance of blood calcium or body temperature, the level of SWB is actively controlled and maintained by a set of psychological devices, described in detail elsewhere[16,17,18].
At the heart of homeostasis is each person’s set-point for their SWB. This set-point is what homeostasis is defending. While each set-point is determined genetically, and does not change, responses to SWB questions do show variation. This is caused by intrusive emotions becoming incorporated into each SWB response[19].
This understanding, that SWB can vary while set-points do not, introduces a major caution to the interpretation of SWB measurement. Consider the analogy with the set-point for core body temperature (37o C). Prolonged exposure to a sufficiently persistent hot or cold thermal challenge will cause core body temperature to rise or fall. This does not represent a change in set-point. It is a defeat of homeostasis and, once the source of thermal challenge is removed, body temperature will normally revert to its set-point. This explains why, contrary to the views expressed by some authors[20,21], set-point theory does not carry an assumption of immutability in measured SWB.
Crucially, however, in order for SWB to return to set-point following an emotion, external and internal resources must be directed to the restoration of homeostasis. If these resources are sufficient, SWB returns to approximate its set-point. If the resources are insufficient, SWB remains below its normal range and the person is at high risk of depression[11].
Homeostatic resources
There are several internal psychological forms of homeostatic defence[18] which will not be discussed here. Of more direct relevance to the current context are three objective social indicators. These have been identified as the three domains of the Personal Well-being Index[22] which most strongly contribute to Global Life satisfaction (GLS) using multiple regression[15]. They are collectively referred to as the “Golden Triangle of Happiness” and comprise money, relationships, and achieving in life through a purposeful activity.
Each of these resources has a dual action. They both defend against homeostatic failure and also assist homeostatic maintenance. This is because active engagement with each resource is intrinsically rewarding. For example:
• Money can be used as a defensive resource. To avoid the negative experience of dog-washing, someone else can be paid to do the job. The time saved can then be used for a personally satisfying activity.
• Relationships, when positive and intimate, allow much of daily life to occur within a secure social environment. This both reduces the probability of unpleasant social encounters and also increases the probability of positive social interactions.
• Achieving something personally important each day engages positive life routines in a secure context and provides a positive sense of purpose.
In summary, engagement with these three resources assists homeostatic defense by reducing the probability of negative events and maintaining positive feelings through engagement with secure and rewarding activities.
SWB as a useful social indicator The practical implications of this understanding for public policy concerns the distribution of resources, especially financial resources, to support homeostasis. If people are living under conditions of chronic resource deprivation, that is sufficiently adverse to defeat homeostasis, then their SWB will be maintained at levels significantly below their set-point. Under such conditions people will be highly susceptible to depression and, in Australia, this applies to about 5% of the population[23]. However, when vulnerable groups are targeted for measurement[24] the proportion of people in homeostatic defeat is much higher. Moreover, and importantly for
policy, additional resources provided to people in homeostatic failure will reliably lift their SWB towards the average of the population[25]. The policy implications of this are clear. The most efficient way to increase population levels of SWB is to allocate additional resources to people with chronically low levels of SWB.
Summary
A great deal of understanding has accumulated in the 85 year history of subjective social indicators. Reliable and valid measures of subjective well-being (SWB) are now available and the results can be interpreted in terms of the most effective distribution of resources. These advances are also framed by a plausible theoretical model, in the form of subjective well-being homeostasis. If it is considered desirable for all citizens to experience normal levels of life quality, then SWB is an excellent national indicator of the degree to which it is being achieved. Whether our politicians and national statistical offices decide to collect data on subjective well-being is now based on political, rather than a scientific, reasoning.
Acknowledgement: This work was supported by the National Research Foundation of Korea Grant funded by the Korean Government (NRF-2013S1A3A2054622).
References
[1] Land KC, Michalos AC. Fifty years after the social indicators movement: has the promise been fulfilled? An assessment and an agenda for the future. Social Indicators Research. 2017; 135: 835-868.
[2] Australian Centre on Quality of Life. What is quality of life? [Internet]. Victoria, Australia: Deakin University; 2017. Retrieved from: http://www.deakin.edu.au/research/acqol/instruments/instrument.php
[3] Hoover H. Foreword. In W. C. Mitchell & et al (Eds.). U.S. president's research committee on social trends: recent social trends in the united states (Vol. Volume 1, pp. v). New York: McGraw-Hill Book Company; 1933. [4] Angell RC. Recent social trends in the united states: report of the president's research committee: I. Summary and comment. Michigan Law Review. 1933; 31(5): 638-658
[5] Freyd, M. The graphic rating scale. Journal of Educational Psychology.1923; 14: 83-102.
[6] Likert R. A technique for the measurement of attitudes. Archives in Psychology.1932; 22(140): 1-55.
[7] Easterlin RA. Does economic growth improve the human lot? Some empirical evidence. In David P & Reder M (Eds.), Nations and households in economic growth (pp. 89-125). New York: Academic Press; 1974.
[8] Stiglitz, J., Sen, A., & Fitoussi, J.-P. Report by the commission on the measurement of economic performance and social progress. Paris: Commi- ssion on the Measurement of Economic Perfor- mance and Social Progress; 2010. Retrieved from: http ://www.st igl i tz-sen-f i touss i . f r/docu- ments/rapport_anglais.pdf
[9] WHO. The European health report 2012: charting the way to well-being. Copenhagen, Dinamark: The regional office of Europe of World Health Organization; 2012. Retrieved from: h t t p : // w w w. e u ro .wh o . i n t / _ _ da ta / a s s e t s /pdf_file/0004/197113/EHR2012-Eng.pdf
[10]OECD. OECD guidelines on measuring subjective well-being. París: OECD Publishing; 2013. Retrieved from: http://dx.doi.org/ 10.1787/9789264191655-en
[11] Cummins RA. Subjective wellbeing, homeos- tatically protected mood and depression: a synthesis.
Journal of Happiness Studies. 2010(a); 11(1), 1-17. Retrieved from: doi:10.1007/s10902-009-9167-0[12] Blore JD, Stokes MA, Mellor D, Firth L & Cummins RA. Comparing multiple discrepancies theory to affective models of subjective wellbeing. Social Indicators Research. 2011; 100(1): 1-16. Retrieved from: doi:10.1007/s11205-010-9599-2
[13] Davern M, Cummins RA & Stokes M. Subjective wellbeing as an affective/cognitive construct. Journal of Happiness Studies. 2007; 8(4): 429-449. Retrieved from: doi:10.1007/s10902-007-9066-1
[14] Tomyn AJ & Cummins RA. Subjective wellbeing and homeostatically protected mood: theory validation with adolescents. Journal of Happiness Studies. 2011(a); 12(5): 897-914. Retrieved from: doi:10.1007/s10902-010-9235 -5
[15] Cummins RA, Woerner J, Weinberg M, Collard J, Hartley-Clark L & Horfiniak K. Australian Unity Wellbeing Index: -Report 30.0 - The wellbeing of Australians: social media, personal achievement, and work. Melbourne: Australian Centre on Quality of Life, School of Psychology, Deakin University; 2013c. Retrieved from: http://www.acqol.com.au/ reports/auwbi.php.
[16] Cummins RA. Subjective wellbeing homeostasis D. S. Dunn (Ed.) Oxford Bibliographies Online; 2013a. Retrieved from: http://www.oxfordbibliographies.com/view/document/obo-9780199828340/obo-9780199828340-0167.xml [17] Cummins RA. Can happiness change? theories and evidence. In K. M. Sheldon & R. E. Lucas (Eds.) Stability of happiness: theories and evidence on whether happiness can change (pp. 75-97). Amsterdam: Elsevier; 2014b.
[18] Cummins, R. A. The theory of subjective wellbeing homeostasis: a contribution to understanding life quality. In F. Maggino (Ed.). A life devoted to quality of life - festschrift in honor of alex c. michalos (Vol. 60, pp. 61-79). Dordrecht,
In terms of this stability, over the past 15 years we have measured the SWB of the Australian population through 30 surveys, each of 2000 people, nationally representative. When the results are standardized to lie on a 0-100 point scale, and survey mean scores are used as data, the full range of values lies between 73.8–76.7 percentage points[15]. In other words, the mean score of a random survey of people in Australia can be predicted, with 95% certainty, to lie within a 2.9 percentage point range. There is no precedent in the literature for such extraordinary stability in self-report data.
54
Robert A. Cummins | CaliBRANDO
Netherlands: Springer; 2016a.
[19] Cummins RA, Li L, Wooden M. & Stokes M.. A demonstration of set-points for subjective wellbeing. Journal of Happiness Studies. 2014a; 15: 183-206. Retrieved from: doi:10.1007/ s10902-013-9444-9
[20] Easterlin, R. A. Do people adapt to poorer health? health and health satisfaction over the life cycle. In F. Maggino (Ed.), A life devoted to quality of life - festschrift in honor of alex c. michalos (Vol. 60, pp. 81-92). Dordrecht, Netherlands: Springer; 2016.
[21] Headey B, Muffels R. & Wagner GG. National panel studies show substantial minorities recording long-term change in life satisfaction: implications for set point theory. In K. M. Sheldon & R. E. Lucas (Eds.), Stability of happiness: theories and evidence on whether happiness can change (pp. 99-126). New York: Elsevier; 2014.
[22] International wellbeing group. personal wellbeing index manual: 5th Edition; 2013. Retrieved from: http://www.acqol.com.au/ iwbg/wellbeing-index/index.php
[23] Cummins RA & Nistico H. Maintaining life satisfaction: the role of positive cognitive bias. Journal of Happiness Studies. 2002; 3(1): 37-69. [24] Hammond T, Weinberg MK & Cummins RA. The dyadic interaction of relationships and disability type on informal carer subjective well-being. Quality of Life Research. 2014; 23(5): 1535-1542.
[25] Tomyn AJ, Weinberg MK & Cummins RA. Intervention efficacy among ‘at risk’ adolescents: A test of subjective wellbeing homeostasis theory. Social Indicators Research. 2015; 120(3): 883-895. Retrieved from:doi:10.1007/s11205 -014-0619-5

Country level ResearchSection 3Felipe Castro / Nadia Puerta / Carlos CastañedaLjiljana Kaliterna


It is interesting to note that this dependence on objective measures of national progress has not substantially changed over the past 85 years. The earliest opportunity to begin a systematic consideration of subjective indicators arose from an initiative of USA President Hoover[3]. In 1929 he formed the Research Committee on Social Trends, with a charter to “examine into the feasibility of a national survey of social trends”. In 1933 his committee produced a massive report of over 1600 pages, with 29 chapters written by some 40 authors. Notwithstanding chapter headings such as “Vitality” and “Changing social attitudes and interests”, the content relies purely on objective data; a limitation noted at that time as a “paradox of the social sciences” by R. F. Remer[4]. Yet he, and other critics, offered no guidance as to how to actually create subjective evaluations of population well-being.
It is also notable that Hoover’s Committee failed to acknowledge contemporary literature in the social sciences. In fact, the technology for measuring subjective evaluations had been well described decades earlier. In his 1923 review, Freyd[5] discusses the various forms of response scale available at that time, which subsequently became dominated by Likert’s[6] 5-level rating scale. All of this early development in the social sciences was ignored by the members of Hoover’s committee.
Thirty years later, little had changed. The beginnings of subjective social indicators, as a systematic topic for study, is usually attributed to Bauer’s (1966) edited work “Social Indicators”[1]. In fact, however, the authors of this work evidenced substantial misgivings, describing subjective indicators by terms such
as “impressionistic”, “qualitative”, and “mysterious”. Evidently, some new catalyst was required to interest econometricians in subjective indicators, and this was supplied by Easterlin[7] who reported that the positive association between income and happiness did not simply apply over time. While this news electrified the academic community, the national statistical agencies were less impressed, and continued to represent national life quality through economic data.
Some yet stronger stimulus was needed to jolt the agencies out of their complacency. This was precipitated by the global financial crisis of 2007-2008. The Stiglitz Commission[8] again reminded governments that Gross Domestic Product is not sufficient as an indicator of national progress, and proposed that countries turn to the measurement of subjective wellbeing as a complementary social and economic indicator. This authoritative voice engendered action. Both the World Health Organization[9] and the Organization for Economic Cooperation and Development[10] revised their definitions of well-being, with both organizations also recommending the national measurement of subjective well-being.
In the current era, subjective social indicators are starting to appear more commonly in national surveys. However, their inclusion usually appears as an after-thought. Understandably, the employees of national agencies have backgrounds in economics, business, or associated statistics. Subjective social indicators, on the other hand, are the province of the social sciences, particularly psychology. Thus, because the knowledge-silos of economics and psychology are so distinct from one another, subjective indicators are not valued by national statistical offices, are poorly understood, and poorly analyzed. As a consequence they yield uninteresting data, which leads to them not being valued. The cycle is complete.
Breaking this nexus requires two forms of action; one on each side of the disciplinary fence. The first is a willingness by national statistical offices to comprehend the contemporary potential of subjective social indicators for public policy advice. The second is for psychological scientists to make their work accessible outside their disci-pline, emphasizing the usefulness of their measu-res. In order for this to occur, all of those invol-ved need to agree on how to define and measure subjective life quality.
Understanding Subjective Wellbeing
The greatest single impediment to advancing acceptance of SWB as a social indicator is the absence of rules for nomenclature. It is surely not surprising that policy makers show indiffe-rence in the face of a variable with quite arbitrary descriptions. For example, SWB is often referred to in the social indicator literatu-re as “happiness”. Yet this term has two impor-tantly different meanings.
The common meaning of happiness is a positive feeling consequential to a short term event. When something happens to them that’s nice, people feel happy. This form of happiness is transitory, and is what psychologists refer to as an emotional state. The second kind of happi-ness is a mood. This form of happiness is not generated in reaction to something that has happened, but rather is a genetic trait that normally forms a constant background to our thoughts[11]. It is a gentle, mildly activated form of positive affect and its major importance is to keep us feeling good about ourselves.
In the context of social indicators, emotional happiness is noise in the measurement, varying from moment to moment. The measure of policy interest is mood happiness, and this is the major component of SWB[12,13,14]. This form of happiness causes SWB to have some very interesting properties. For example, SWB is normally experienced as a positive feeling and its level is normally quite stable.
Subjective wellbeing homeostasis
Why are these SWB mean scores so predictable? The theory of SWB homeostasis offers an explanation. This theory proposes that, in a manner analogous to the homeostatic main- tenance of blood calcium or body temperature, the level of SWB is actively controlled and maintained by a set of psychological devices, described in detail elsewhere[16,17,18].
At the heart of homeostasis is each person’s set-point for their SWB. This set-point is what homeostasis is defending. While each set-point is determined genetically, and does not change, responses to SWB questions do show variation. This is caused by intrusive emotions becoming incorporated into each SWB response[19].
This understanding, that SWB can vary while set-points do not, introduces a major caution to the interpretation of SWB measurement. Consider the analogy with the set-point for core body temperature (37o C). Prolonged exposure to a sufficiently persistent hot or cold thermal challenge will cause core body temperature to rise or fall. This does not represent a change in set-point. It is a defeat of homeostasis and, once the source of thermal challenge is removed, body temperature will normally revert to its set-point. This explains why, contrary to the views expressed by some authors[20,21], set-point theory does not carry an assumption of immutability in measured SWB.
Crucially, however, in order for SWB to return to set-point following an emotion, external and internal resources must be directed to the restoration of homeostasis. If these resources are sufficient, SWB returns to approximate its set-point. If the resources are insufficient, SWB remains below its normal range and the person is at high risk of depression[11].
Homeostatic resources
There are several internal psychological forms of homeostatic defence[18] which will not be discussed here. Of more direct relevance to the current context are three objective social indicators. These have been identified as the three domains of the Personal Well-being Index[22] which most strongly contribute to Global Life satisfaction (GLS) using multiple regression[15]. They are collectively referred to as the “Golden Triangle of Happiness” and comprise money, relationships, and achieving in life through a purposeful activity.
Each of these resources has a dual action. They both defend against homeostatic failure and also assist homeostatic maintenance. This is because active engagement with each resource is intrinsically rewarding. For example:
• Money can be used as a defensive resource. To avoid the negative experience of dog-washing, someone else can be paid to do the job. The time saved can then be used for a personally satisfying activity.
• Relationships, when positive and intimate, allow much of daily life to occur within a secure social environment. This both reduces the probability of unpleasant social encounters and also increases the probability of positive social interactions.
• Achieving something personally important each day engages positive life routines in a secure context and provides a positive sense of purpose.
In summary, engagement with these three resources assists homeostatic defense by reducing the probability of negative events and maintaining positive feelings through engagement with secure and rewarding activities.
SWB as a useful social indicator The practical implications of this understanding for public policy concerns the distribution of resources, especially financial resources, to support homeostasis. If people are living under conditions of chronic resource deprivation, that is sufficiently adverse to defeat homeostasis, then their SWB will be maintained at levels significantly below their set-point. Under such conditions people will be highly susceptible to depression and, in Australia, this applies to about 5% of the population[23]. However, when vulnerable groups are targeted for measurement[24] the proportion of people in homeostatic defeat is much higher. Moreover, and importantly for
policy, additional resources provided to people in homeostatic failure will reliably lift their SWB towards the average of the population[25]. The policy implications of this are clear. The most efficient way to increase population levels of SWB is to allocate additional resources to people with chronically low levels of SWB.
Summary
A great deal of understanding has accumulated in the 85 year history of subjective social indicators. Reliable and valid measures of subjective well-being (SWB) are now available and the results can be interpreted in terms of the most effective distribution of resources. These advances are also framed by a plausible theoretical model, in the form of subjective well-being homeostasis. If it is considered desirable for all citizens to experience normal levels of life quality, then SWB is an excellent national indicator of the degree to which it is being achieved. Whether our politicians and national statistical offices decide to collect data on subjective well-being is now based on political, rather than a scientific, reasoning.
Acknowledgement: This work was supported by the National Research Foundation of Korea Grant funded by the Korean Government (NRF-2013S1A3A2054622).
References
[1] Land KC, Michalos AC. Fifty years after the social indicators movement: has the promise been fulfilled? An assessment and an agenda for the future. Social Indicators Research. 2017; 135: 835-868.
[2] Australian Centre on Quality of Life. What is quality of life? [Internet]. Victoria, Australia: Deakin University; 2017. Retrieved from: http://www.deakin.edu.au/research/acqol/instruments/instrument.php
[3] Hoover H. Foreword. In W. C. Mitchell & et al (Eds.). U.S. president's research committee on social trends: recent social trends in the united states (Vol. Volume 1, pp. v). New York: McGraw-Hill Book Company; 1933. [4] Angell RC. Recent social trends in the united states: report of the president's research committee: I. Summary and comment. Michigan Law Review. 1933; 31(5): 638-658
[5] Freyd, M. The graphic rating scale. Journal of Educational Psychology.1923; 14: 83-102.
[6] Likert R. A technique for the measurement of attitudes. Archives in Psychology.1932; 22(140): 1-55.
[7] Easterlin RA. Does economic growth improve the human lot? Some empirical evidence. In David P & Reder M (Eds.), Nations and households in economic growth (pp. 89-125). New York: Academic Press; 1974.
[8] Stiglitz, J., Sen, A., & Fitoussi, J.-P. Report by the commission on the measurement of economic performance and social progress. Paris: Commi- ssion on the Measurement of Economic Perfor- mance and Social Progress; 2010. Retrieved from: http ://www.st igl i tz-sen-f i touss i . f r/docu- ments/rapport_anglais.pdf
[9] WHO. The European health report 2012: charting the way to well-being. Copenhagen, Dinamark: The regional office of Europe of World Health Organization; 2012. Retrieved from: h t t p : // w w w. e u ro .wh o . i n t / _ _ da ta / a s s e t s /pdf_file/0004/197113/EHR2012-Eng.pdf
[10]OECD. OECD guidelines on measuring subjective well-being. París: OECD Publishing; 2013. Retrieved from: http://dx.doi.org/ 10.1787/9789264191655-en
[11] Cummins RA. Subjective wellbeing, homeos- tatically protected mood and depression: a synthesis.
Journal of Happiness Studies. 2010(a); 11(1), 1-17. Retrieved from: doi:10.1007/s10902-009-9167-0[12] Blore JD, Stokes MA, Mellor D, Firth L & Cummins RA. Comparing multiple discrepancies theory to affective models of subjective wellbeing. Social Indicators Research. 2011; 100(1): 1-16. Retrieved from: doi:10.1007/s11205-010-9599-2
[13] Davern M, Cummins RA & Stokes M. Subjective wellbeing as an affective/cognitive construct. Journal of Happiness Studies. 2007; 8(4): 429-449. Retrieved from: doi:10.1007/s10902-007-9066-1
[14] Tomyn AJ & Cummins RA. Subjective wellbeing and homeostatically protected mood: theory validation with adolescents. Journal of Happiness Studies. 2011(a); 12(5): 897-914. Retrieved from: doi:10.1007/s10902-010-9235 -5
[15] Cummins RA, Woerner J, Weinberg M, Collard J, Hartley-Clark L & Horfiniak K. Australian Unity Wellbeing Index: -Report 30.0 - The wellbeing of Australians: social media, personal achievement, and work. Melbourne: Australian Centre on Quality of Life, School of Psychology, Deakin University; 2013c. Retrieved from: http://www.acqol.com.au/ reports/auwbi.php.
[16] Cummins RA. Subjective wellbeing homeostasis D. S. Dunn (Ed.) Oxford Bibliographies Online; 2013a. Retrieved from: http://www.oxfordbibliographies.com/view/document/obo-9780199828340/obo-9780199828340-0167.xml [17] Cummins RA. Can happiness change? theories and evidence. In K. M. Sheldon & R. E. Lucas (Eds.) Stability of happiness: theories and evidence on whether happiness can change (pp. 75-97). Amsterdam: Elsevier; 2014b.
[18] Cummins, R. A. The theory of subjective wellbeing homeostasis: a contribution to understanding life quality. In F. Maggino (Ed.). A life devoted to quality of life - festschrift in honor of alex c. michalos (Vol. 60, pp. 61-79). Dordrecht,
In terms of this stability, over the past 15 years we have measured the SWB of the Australian population through 30 surveys, each of 2000 people, nationally representative. When the results are standardized to lie on a 0-100 point scale, and survey mean scores are used as data, the full range of values lies between 73.8–76.7 percentage points[15]. In other words, the mean score of a random survey of people in Australia can be predicted, with 95% certainty, to lie within a 2.9 percentage point range. There is no precedent in the literature for such extraordinary stability in self-report data.
Page 57 - 62
Subjective well-beinganalysis: the Colombian case
Netherlands: Springer; 2016a.
[19] Cummins RA, Li L, Wooden M. & Stokes M.. A demonstration of set-points for subjective wellbeing. Journal of Happiness Studies. 2014a; 15: 183-206. Retrieved from: doi:10.1007/ s10902-013-9444-9
[20] Easterlin, R. A. Do people adapt to poorer health? health and health satisfaction over the life cycle. In F. Maggino (Ed.), A life devoted to quality of life - festschrift in honor of alex c. michalos (Vol. 60, pp. 81-92). Dordrecht, Netherlands: Springer; 2016.
[21] Headey B, Muffels R. & Wagner GG. National panel studies show substantial minorities recording long-term change in life satisfaction: implications for set point theory. In K. M. Sheldon & R. E. Lucas (Eds.), Stability of happiness: theories and evidence on whether happiness can change (pp. 99-126). New York: Elsevier; 2014.
[22] International wellbeing group. personal wellbeing index manual: 5th Edition; 2013. Retrieved from: http://www.acqol.com.au/ iwbg/wellbeing-index/index.php
[23] Cummins RA & Nistico H. Maintaining life satisfaction: the role of positive cognitive bias. Journal of Happiness Studies. 2002; 3(1): 37-69. [24] Hammond T, Weinberg MK & Cummins RA. The dyadic interaction of relationships and disability type on informal carer subjective well-being. Quality of Life Research. 2014; 23(5): 1535-1542.
[25] Tomyn AJ, Weinberg MK & Cummins RA. Intervention efficacy among ‘at risk’ adolescents: A test of subjective wellbeing homeostasis theory. Social Indicators Research. 2015; 120(3): 883-895. Retrieved from:doi:10.1007/s11205 -014-0619-5

It is interesting to note that this dependence on objective measures of national progress has not substantially changed over the past 85 years. The earliest opportunity to begin a systematic consideration of subjective indicators arose from an initiative of USA President Hoover[3]. In 1929 he formed the Research Committee on Social Trends, with a charter to “examine into the feasibility of a national survey of social trends”. In 1933 his committee produced a massive report of over 1600 pages, with 29 chapters written by some 40 authors. Notwithstanding chapter headings such as “Vitality” and “Changing social attitudes and interests”, the content relies purely on objective data; a limitation noted at that time as a “paradox of the social sciences” by R. F. Remer[4]. Yet he, and other critics, offered no guidance as to how to actually create subjective evaluations of population well-being.
It is also notable that Hoover’s Committee failed to acknowledge contemporary literature in the social sciences. In fact, the technology for measuring subjective evaluations had been well described decades earlier. In his 1923 review, Freyd[5] discusses the various forms of response scale available at that time, which subsequently became dominated by Likert’s[6] 5-level rating scale. All of this early development in the social sciences was ignored by the members of Hoover’s committee.
Thirty years later, little had changed. The beginnings of subjective social indicators, as a systematic topic for study, is usually attributed to Bauer’s (1966) edited work “Social Indicators”[1]. In fact, however, the authors of this work evidenced substantial misgivings, describing subjective indicators by terms such
as “impressionistic”, “qualitative”, and “mysterious”. Evidently, some new catalyst was required to interest econometricians in subjective indicators, and this was supplied by Easterlin[7] who reported that the positive association between income and happiness did not simply apply over time. While this news electrified the academic community, the national statistical agencies were less impressed, and continued to represent national life quality through economic data.
Some yet stronger stimulus was needed to jolt the agencies out of their complacency. This was precipitated by the global financial crisis of 2007-2008. The Stiglitz Commission[8] again reminded governments that Gross Domestic Product is not sufficient as an indicator of national progress, and proposed that countries turn to the measurement of subjective wellbeing as a complementary social and economic indicator. This authoritative voice engendered action. Both the World Health Organization[9] and the Organization for Economic Cooperation and Development[10] revised their definitions of well-being, with both organizations also recommending the national measurement of subjective well-being.
In the current era, subjective social indicators are starting to appear more commonly in national surveys. However, their inclusion usually appears as an after-thought. Understandably, the employees of national agencies have backgrounds in economics, business, or associated statistics. Subjective social indicators, on the other hand, are the province of the social sciences, particularly psychology. Thus, because the knowledge-silos of economics and psychology are so distinct from one another, subjective indicators are not valued by national statistical offices, are poorly understood, and poorly analyzed. As a consequence they yield uninteresting data, which leads to them not being valued. The cycle is complete.
Breaking this nexus requires two forms of action; one on each side of the disciplinary fence. The first is a willingness by national statistical offices to comprehend the contemporary potential of subjective social indicators for public policy advice. The second is for psychological scientists to make their work accessible outside their disci-pline, emphasizing the usefulness of their measu-res. In order for this to occur, all of those invol-ved need to agree on how to define and measure subjective life quality.
Understanding Subjective Wellbeing
The greatest single impediment to advancing acceptance of SWB as a social indicator is the absence of rules for nomenclature. It is surely not surprising that policy makers show indiffe-rence in the face of a variable with quite arbitrary descriptions. For example, SWB is often referred to in the social indicator literatu-re as “happiness”. Yet this term has two impor-tantly different meanings.
The common meaning of happiness is a positive feeling consequential to a short term event. When something happens to them that’s nice, people feel happy. This form of happiness is transitory, and is what psychologists refer to as an emotional state. The second kind of happi-ness is a mood. This form of happiness is not generated in reaction to something that has happened, but rather is a genetic trait that normally forms a constant background to our thoughts[11]. It is a gentle, mildly activated form of positive affect and its major importance is to keep us feeling good about ourselves.
In the context of social indicators, emotional happiness is noise in the measurement, varying from moment to moment. The measure of policy interest is mood happiness, and this is the major component of SWB[12,13,14]. This form of happiness causes SWB to have some very interesting properties. For example, SWB is normally experienced as a positive feeling and its level is normally quite stable.
Subjective wellbeing homeostasis
Why are these SWB mean scores so predictable? The theory of SWB homeostasis offers an explanation. This theory proposes that, in a manner analogous to the homeostatic main- tenance of blood calcium or body temperature, the level of SWB is actively controlled and maintained by a set of psychological devices, described in detail elsewhere[16,17,18].
At the heart of homeostasis is each person’s set-point for their SWB. This set-point is what homeostasis is defending. While each set-point is determined genetically, and does not change, responses to SWB questions do show variation. This is caused by intrusive emotions becoming incorporated into each SWB response[19].
This understanding, that SWB can vary while set-points do not, introduces a major caution to the interpretation of SWB measurement. Consider the analogy with the set-point for core body temperature (37o C). Prolonged exposure to a sufficiently persistent hot or cold thermal challenge will cause core body temperature to rise or fall. This does not represent a change in set-point. It is a defeat of homeostasis and, once the source of thermal challenge is removed, body temperature will normally revert to its set-point. This explains why, contrary to the views expressed by some authors[20,21], set-point theory does not carry an assumption of immutability in measured SWB.
Crucially, however, in order for SWB to return to set-point following an emotion, external and internal resources must be directed to the restoration of homeostasis. If these resources are sufficient, SWB returns to approximate its set-point. If the resources are insufficient, SWB remains below its normal range and the person is at high risk of depression[11].
Homeostatic resources
There are several internal psychological forms of homeostatic defence[18] which will not be discussed here. Of more direct relevance to the current context are three objective social indicators. These have been identified as the three domains of the Personal Well-being Index[22] which most strongly contribute to Global Life satisfaction (GLS) using multiple regression[15]. They are collectively referred to as the “Golden Triangle of Happiness” and comprise money, relationships, and achieving in life through a purposeful activity.
Each of these resources has a dual action. They both defend against homeostatic failure and also assist homeostatic maintenance. This is because active engagement with each resource is intrinsically rewarding. For example:
• Money can be used as a defensive resource. To avoid the negative experience of dog-washing, someone else can be paid to do the job. The time saved can then be used for a personally satisfying activity.
• Relationships, when positive and intimate, allow much of daily life to occur within a secure social environment. This both reduces the probability of unpleasant social encounters and also increases the probability of positive social interactions.
• Achieving something personally important each day engages positive life routines in a secure context and provides a positive sense of purpose.
In summary, engagement with these three resources assists homeostatic defense by reducing the probability of negative events and maintaining positive feelings through engagement with secure and rewarding activities.
SWB as a useful social indicator The practical implications of this understanding for public policy concerns the distribution of resources, especially financial resources, to support homeostasis. If people are living under conditions of chronic resource deprivation, that is sufficiently adverse to defeat homeostasis, then their SWB will be maintained at levels significantly below their set-point. Under such conditions people will be highly susceptible to depression and, in Australia, this applies to about 5% of the population[23]. However, when vulnerable groups are targeted for measurement[24] the proportion of people in homeostatic defeat is much higher. Moreover, and importantly for
policy, additional resources provided to people in homeostatic failure will reliably lift their SWB towards the average of the population[25]. The policy implications of this are clear. The most efficient way to increase population levels of SWB is to allocate additional resources to people with chronically low levels of SWB.
Summary
A great deal of understanding has accumulated in the 85 year history of subjective social indicators. Reliable and valid measures of subjective well-being (SWB) are now available and the results can be interpreted in terms of the most effective distribution of resources. These advances are also framed by a plausible theoretical model, in the form of subjective well-being homeostasis. If it is considered desirable for all citizens to experience normal levels of life quality, then SWB is an excellent national indicator of the degree to which it is being achieved. Whether our politicians and national statistical offices decide to collect data on subjective well-being is now based on political, rather than a scientific, reasoning.
Acknowledgement: This work was supported by the National Research Foundation of Korea Grant funded by the Korean Government (NRF-2013S1A3A2054622).
References
[1] Land KC, Michalos AC. Fifty years after the social indicators movement: has the promise been fulfilled? An assessment and an agenda for the future. Social Indicators Research. 2017; 135: 835-868.
[2] Australian Centre on Quality of Life. What is quality of life? [Internet]. Victoria, Australia: Deakin University; 2017. Retrieved from: http://www.deakin.edu.au/research/acqol/instruments/instrument.php
[3] Hoover H. Foreword. In W. C. Mitchell & et al (Eds.). U.S. president's research committee on social trends: recent social trends in the united states (Vol. Volume 1, pp. v). New York: McGraw-Hill Book Company; 1933. [4] Angell RC. Recent social trends in the united states: report of the president's research committee: I. Summary and comment. Michigan Law Review. 1933; 31(5): 638-658
[5] Freyd, M. The graphic rating scale. Journal of Educational Psychology.1923; 14: 83-102.
[6] Likert R. A technique for the measurement of attitudes. Archives in Psychology.1932; 22(140): 1-55.
[7] Easterlin RA. Does economic growth improve the human lot? Some empirical evidence. In David P & Reder M (Eds.), Nations and households in economic growth (pp. 89-125). New York: Academic Press; 1974.
[8] Stiglitz, J., Sen, A., & Fitoussi, J.-P. Report by the commission on the measurement of economic performance and social progress. Paris: Commi- ssion on the Measurement of Economic Perfor- mance and Social Progress; 2010. Retrieved from: http ://www.st igl i tz-sen-f i touss i . f r/docu- ments/rapport_anglais.pdf
[9] WHO. The European health report 2012: charting the way to well-being. Copenhagen, Dinamark: The regional office of Europe of World Health Organization; 2012. Retrieved from: h t t p : // w w w. e u ro .wh o . i n t / _ _ da ta / a s s e t s /pdf_file/0004/197113/EHR2012-Eng.pdf
[10]OECD. OECD guidelines on measuring subjective well-being. París: OECD Publishing; 2013. Retrieved from: http://dx.doi.org/ 10.1787/9789264191655-en
[11] Cummins RA. Subjective wellbeing, homeos- tatically protected mood and depression: a synthesis.
Journal of Happiness Studies. 2010(a); 11(1), 1-17. Retrieved from: doi:10.1007/s10902-009-9167-0[12] Blore JD, Stokes MA, Mellor D, Firth L & Cummins RA. Comparing multiple discrepancies theory to affective models of subjective wellbeing. Social Indicators Research. 2011; 100(1): 1-16. Retrieved from: doi:10.1007/s11205-010-9599-2
[13] Davern M, Cummins RA & Stokes M. Subjective wellbeing as an affective/cognitive construct. Journal of Happiness Studies. 2007; 8(4): 429-449. Retrieved from: doi:10.1007/s10902-007-9066-1
[14] Tomyn AJ & Cummins RA. Subjective wellbeing and homeostatically protected mood: theory validation with adolescents. Journal of Happiness Studies. 2011(a); 12(5): 897-914. Retrieved from: doi:10.1007/s10902-010-9235 -5
[15] Cummins RA, Woerner J, Weinberg M, Collard J, Hartley-Clark L & Horfiniak K. Australian Unity Wellbeing Index: -Report 30.0 - The wellbeing of Australians: social media, personal achievement, and work. Melbourne: Australian Centre on Quality of Life, School of Psychology, Deakin University; 2013c. Retrieved from: http://www.acqol.com.au/ reports/auwbi.php.
[16] Cummins RA. Subjective wellbeing homeostasis D. S. Dunn (Ed.) Oxford Bibliographies Online; 2013a. Retrieved from: http://www.oxfordbibliographies.com/view/document/obo-9780199828340/obo-9780199828340-0167.xml [17] Cummins RA. Can happiness change? theories and evidence. In K. M. Sheldon & R. E. Lucas (Eds.) Stability of happiness: theories and evidence on whether happiness can change (pp. 75-97). Amsterdam: Elsevier; 2014b.
[18] Cummins, R. A. The theory of subjective wellbeing homeostasis: a contribution to understanding life quality. In F. Maggino (Ed.). A life devoted to quality of life - festschrift in honor of alex c. michalos (Vol. 60, pp. 61-79). Dordrecht,
In terms of this stability, over the past 15 years we have measured the SWB of the Australian population through 30 surveys, each of 2000 people, nationally representative. When the results are standardized to lie on a 0-100 point scale, and survey mean scores are used as data, the full range of values lies between 73.8–76.7 percentage points[15]. In other words, the mean score of a random survey of people in Australia can be predicted, with 95% certainty, to lie within a 2.9 percentage point range. There is no precedent in the literature for such extraordinary stability in self-report data.
58
Castro, Puerta & Castañeda | CaliBRANDO
In 2015, Colombian National Planning Depart-menti- DNP by its acronym in Spanish - began to measure the subjective well-being of people through a Citizen Perception Surveyii - ECP -, contracted, designed and supervised by the Directorate of Monitoring and Evaluation of Public Policiesiii - DSSEP-. Using the guidelines issued by the OECD[1], a basic measurement module was built, which has been expanded and improved through the six rounds that EPC has had collected between 2015 and 2018.
Based on this module, life satisfaction, happi-ness, concern, depression and anger reported by Colombians in recent years has been measu-red. The methodology that has been used to measure subjective people’s well-being consists
Felipe Castro
Master in PublicManagement and GovernanceCentro de los ODS paraAmérica Latina y el CaribeBogotá - [email protected]
Nadia Puerta
Master in EconomicsDirección de Seguimientoy Evaluación de PolíticasPúblicas - DNPBogotá - [email protected]
Carlos Castañeda
Master in Economics Dirección de Seguimientoy Evaluación de PolíticasPúblicas - DNPBogotá, [email protected]
Netherlands: Springer; 2016a.
[19] Cummins RA, Li L, Wooden M. & Stokes M.. A demonstration of set-points for subjective wellbeing. Journal of Happiness Studies. 2014a; 15: 183-206. Retrieved from: doi:10.1007/ s10902-013-9444-9
[20] Easterlin, R. A. Do people adapt to poorer health? health and health satisfaction over the life cycle. In F. Maggino (Ed.), A life devoted to quality of life - festschrift in honor of alex c. michalos (Vol. 60, pp. 81-92). Dordrecht, Netherlands: Springer; 2016.
[21] Headey B, Muffels R. & Wagner GG. National panel studies show substantial minorities recording long-term change in life satisfaction: implications for set point theory. In K. M. Sheldon & R. E. Lucas (Eds.), Stability of happiness: theories and evidence on whether happiness can change (pp. 99-126). New York: Elsevier; 2014.
[22] International wellbeing group. personal wellbeing index manual: 5th Edition; 2013. Retrieved from: http://www.acqol.com.au/ iwbg/wellbeing-index/index.php
[23] Cummins RA & Nistico H. Maintaining life satisfaction: the role of positive cognitive bias. Journal of Happiness Studies. 2002; 3(1): 37-69. [24] Hammond T, Weinberg MK & Cummins RA. The dyadic interaction of relationships and disability type on informal carer subjective well-being. Quality of Life Research. 2014; 23(5): 1535-1542.
[25] Tomyn AJ, Weinberg MK & Cummins RA. Intervention efficacy among ‘at risk’ adolescents: A test of subjective wellbeing homeostasis theory. Social Indicators Research. 2015; 120(3): 883-895. Retrieved from:doi:10.1007/s11205 -014-0619-5
i. Departamento Nacional de Planeación in Spanish.ii. Encuesta de Percepción Ciudadana in Spanish. iii.Dirección de Seguimiento y Evaluación de Políticas Públicas in Spanish.

It is interesting to note that this dependence on objective measures of national progress has not substantially changed over the past 85 years. The earliest opportunity to begin a systematic consideration of subjective indicators arose from an initiative of USA President Hoover[3]. In 1929 he formed the Research Committee on Social Trends, with a charter to “examine into the feasibility of a national survey of social trends”. In 1933 his committee produced a massive report of over 1600 pages, with 29 chapters written by some 40 authors. Notwithstanding chapter headings such as “Vitality” and “Changing social attitudes and interests”, the content relies purely on objective data; a limitation noted at that time as a “paradox of the social sciences” by R. F. Remer[4]. Yet he, and other critics, offered no guidance as to how to actually create subjective evaluations of population well-being.
It is also notable that Hoover’s Committee failed to acknowledge contemporary literature in the social sciences. In fact, the technology for measuring subjective evaluations had been well described decades earlier. In his 1923 review, Freyd[5] discusses the various forms of response scale available at that time, which subsequently became dominated by Likert’s[6] 5-level rating scale. All of this early development in the social sciences was ignored by the members of Hoover’s committee.
Thirty years later, little had changed. The beginnings of subjective social indicators, as a systematic topic for study, is usually attributed to Bauer’s (1966) edited work “Social Indicators”[1]. In fact, however, the authors of this work evidenced substantial misgivings, describing subjective indicators by terms such
as “impressionistic”, “qualitative”, and “mysterious”. Evidently, some new catalyst was required to interest econometricians in subjective indicators, and this was supplied by Easterlin[7] who reported that the positive association between income and happiness did not simply apply over time. While this news electrified the academic community, the national statistical agencies were less impressed, and continued to represent national life quality through economic data.
Some yet stronger stimulus was needed to jolt the agencies out of their complacency. This was precipitated by the global financial crisis of 2007-2008. The Stiglitz Commission[8] again reminded governments that Gross Domestic Product is not sufficient as an indicator of national progress, and proposed that countries turn to the measurement of subjective wellbeing as a complementary social and economic indicator. This authoritative voice engendered action. Both the World Health Organization[9] and the Organization for Economic Cooperation and Development[10] revised their definitions of well-being, with both organizations also recommending the national measurement of subjective well-being.
In the current era, subjective social indicators are starting to appear more commonly in national surveys. However, their inclusion usually appears as an after-thought. Understandably, the employees of national agencies have backgrounds in economics, business, or associated statistics. Subjective social indicators, on the other hand, are the province of the social sciences, particularly psychology. Thus, because the knowledge-silos of economics and psychology are so distinct from one another, subjective indicators are not valued by national statistical offices, are poorly understood, and poorly analyzed. As a consequence they yield uninteresting data, which leads to them not being valued. The cycle is complete.
Breaking this nexus requires two forms of action; one on each side of the disciplinary fence. The first is a willingness by national statistical offices to comprehend the contemporary potential of subjective social indicators for public policy advice. The second is for psychological scientists to make their work accessible outside their disci-pline, emphasizing the usefulness of their measu-res. In order for this to occur, all of those invol-ved need to agree on how to define and measure subjective life quality.
Understanding Subjective Wellbeing
The greatest single impediment to advancing acceptance of SWB as a social indicator is the absence of rules for nomenclature. It is surely not surprising that policy makers show indiffe-rence in the face of a variable with quite arbitrary descriptions. For example, SWB is often referred to in the social indicator literatu-re as “happiness”. Yet this term has two impor-tantly different meanings.
The common meaning of happiness is a positive feeling consequential to a short term event. When something happens to them that’s nice, people feel happy. This form of happiness is transitory, and is what psychologists refer to as an emotional state. The second kind of happi-ness is a mood. This form of happiness is not generated in reaction to something that has happened, but rather is a genetic trait that normally forms a constant background to our thoughts[11]. It is a gentle, mildly activated form of positive affect and its major importance is to keep us feeling good about ourselves.
In the context of social indicators, emotional happiness is noise in the measurement, varying from moment to moment. The measure of policy interest is mood happiness, and this is the major component of SWB[12,13,14]. This form of happiness causes SWB to have some very interesting properties. For example, SWB is normally experienced as a positive feeling and its level is normally quite stable.
Subjective wellbeing homeostasis
Why are these SWB mean scores so predictable? The theory of SWB homeostasis offers an explanation. This theory proposes that, in a manner analogous to the homeostatic main- tenance of blood calcium or body temperature, the level of SWB is actively controlled and maintained by a set of psychological devices, described in detail elsewhere[16,17,18].
At the heart of homeostasis is each person’s set-point for their SWB. This set-point is what homeostasis is defending. While each set-point is determined genetically, and does not change, responses to SWB questions do show variation. This is caused by intrusive emotions becoming incorporated into each SWB response[19].
This understanding, that SWB can vary while set-points do not, introduces a major caution to the interpretation of SWB measurement. Consider the analogy with the set-point for core body temperature (37o C). Prolonged exposure to a sufficiently persistent hot or cold thermal challenge will cause core body temperature to rise or fall. This does not represent a change in set-point. It is a defeat of homeostasis and, once the source of thermal challenge is removed, body temperature will normally revert to its set-point. This explains why, contrary to the views expressed by some authors[20,21], set-point theory does not carry an assumption of immutability in measured SWB.
Crucially, however, in order for SWB to return to set-point following an emotion, external and internal resources must be directed to the restoration of homeostasis. If these resources are sufficient, SWB returns to approximate its set-point. If the resources are insufficient, SWB remains below its normal range and the person is at high risk of depression[11].
Homeostatic resources
There are several internal psychological forms of homeostatic defence[18] which will not be discussed here. Of more direct relevance to the current context are three objective social indicators. These have been identified as the three domains of the Personal Well-being Index[22] which most strongly contribute to Global Life satisfaction (GLS) using multiple regression[15]. They are collectively referred to as the “Golden Triangle of Happiness” and comprise money, relationships, and achieving in life through a purposeful activity.
Each of these resources has a dual action. They both defend against homeostatic failure and also assist homeostatic maintenance. This is because active engagement with each resource is intrinsically rewarding. For example:
• Money can be used as a defensive resource. To avoid the negative experience of dog-washing, someone else can be paid to do the job. The time saved can then be used for a personally satisfying activity.
• Relationships, when positive and intimate, allow much of daily life to occur within a secure social environment. This both reduces the probability of unpleasant social encounters and also increases the probability of positive social interactions.
• Achieving something personally important each day engages positive life routines in a secure context and provides a positive sense of purpose.
In summary, engagement with these three resources assists homeostatic defense by reducing the probability of negative events and maintaining positive feelings through engagement with secure and rewarding activities.
SWB as a useful social indicator The practical implications of this understanding for public policy concerns the distribution of resources, especially financial resources, to support homeostasis. If people are living under conditions of chronic resource deprivation, that is sufficiently adverse to defeat homeostasis, then their SWB will be maintained at levels significantly below their set-point. Under such conditions people will be highly susceptible to depression and, in Australia, this applies to about 5% of the population[23]. However, when vulnerable groups are targeted for measurement[24] the proportion of people in homeostatic defeat is much higher. Moreover, and importantly for
policy, additional resources provided to people in homeostatic failure will reliably lift their SWB towards the average of the population[25]. The policy implications of this are clear. The most efficient way to increase population levels of SWB is to allocate additional resources to people with chronically low levels of SWB.
Summary
A great deal of understanding has accumulated in the 85 year history of subjective social indicators. Reliable and valid measures of subjective well-being (SWB) are now available and the results can be interpreted in terms of the most effective distribution of resources. These advances are also framed by a plausible theoretical model, in the form of subjective well-being homeostasis. If it is considered desirable for all citizens to experience normal levels of life quality, then SWB is an excellent national indicator of the degree to which it is being achieved. Whether our politicians and national statistical offices decide to collect data on subjective well-being is now based on political, rather than a scientific, reasoning.
Acknowledgement: This work was supported by the National Research Foundation of Korea Grant funded by the Korean Government (NRF-2013S1A3A2054622).
References
[1] Land KC, Michalos AC. Fifty years after the social indicators movement: has the promise been fulfilled? An assessment and an agenda for the future. Social Indicators Research. 2017; 135: 835-868.
[2] Australian Centre on Quality of Life. What is quality of life? [Internet]. Victoria, Australia: Deakin University; 2017. Retrieved from: http://www.deakin.edu.au/research/acqol/instruments/instrument.php
[3] Hoover H. Foreword. In W. C. Mitchell & et al (Eds.). U.S. president's research committee on social trends: recent social trends in the united states (Vol. Volume 1, pp. v). New York: McGraw-Hill Book Company; 1933. [4] Angell RC. Recent social trends in the united states: report of the president's research committee: I. Summary and comment. Michigan Law Review. 1933; 31(5): 638-658
[5] Freyd, M. The graphic rating scale. Journal of Educational Psychology.1923; 14: 83-102.
[6] Likert R. A technique for the measurement of attitudes. Archives in Psychology.1932; 22(140): 1-55.
[7] Easterlin RA. Does economic growth improve the human lot? Some empirical evidence. In David P & Reder M (Eds.), Nations and households in economic growth (pp. 89-125). New York: Academic Press; 1974.
[8] Stiglitz, J., Sen, A., & Fitoussi, J.-P. Report by the commission on the measurement of economic performance and social progress. Paris: Commi- ssion on the Measurement of Economic Perfor- mance and Social Progress; 2010. Retrieved from: http ://www.st igl i tz-sen-f i touss i . f r/docu- ments/rapport_anglais.pdf
[9] WHO. The European health report 2012: charting the way to well-being. Copenhagen, Dinamark: The regional office of Europe of World Health Organization; 2012. Retrieved from: h t t p : // w w w. e u ro .wh o . i n t / _ _ da ta / a s s e t s /pdf_file/0004/197113/EHR2012-Eng.pdf
[10]OECD. OECD guidelines on measuring subjective well-being. París: OECD Publishing; 2013. Retrieved from: http://dx.doi.org/ 10.1787/9789264191655-en
[11] Cummins RA. Subjective wellbeing, homeos- tatically protected mood and depression: a synthesis.
Journal of Happiness Studies. 2010(a); 11(1), 1-17. Retrieved from: doi:10.1007/s10902-009-9167-0[12] Blore JD, Stokes MA, Mellor D, Firth L & Cummins RA. Comparing multiple discrepancies theory to affective models of subjective wellbeing. Social Indicators Research. 2011; 100(1): 1-16. Retrieved from: doi:10.1007/s11205-010-9599-2
[13] Davern M, Cummins RA & Stokes M. Subjective wellbeing as an affective/cognitive construct. Journal of Happiness Studies. 2007; 8(4): 429-449. Retrieved from: doi:10.1007/s10902-007-9066-1
[14] Tomyn AJ & Cummins RA. Subjective wellbeing and homeostatically protected mood: theory validation with adolescents. Journal of Happiness Studies. 2011(a); 12(5): 897-914. Retrieved from: doi:10.1007/s10902-010-9235 -5
[15] Cummins RA, Woerner J, Weinberg M, Collard J, Hartley-Clark L & Horfiniak K. Australian Unity Wellbeing Index: -Report 30.0 - The wellbeing of Australians: social media, personal achievement, and work. Melbourne: Australian Centre on Quality of Life, School of Psychology, Deakin University; 2013c. Retrieved from: http://www.acqol.com.au/ reports/auwbi.php.
[16] Cummins RA. Subjective wellbeing homeostasis D. S. Dunn (Ed.) Oxford Bibliographies Online; 2013a. Retrieved from: http://www.oxfordbibliographies.com/view/document/obo-9780199828340/obo-9780199828340-0167.xml [17] Cummins RA. Can happiness change? theories and evidence. In K. M. Sheldon & R. E. Lucas (Eds.) Stability of happiness: theories and evidence on whether happiness can change (pp. 75-97). Amsterdam: Elsevier; 2014b.
[18] Cummins, R. A. The theory of subjective wellbeing homeostasis: a contribution to understanding life quality. In F. Maggino (Ed.). A life devoted to quality of life - festschrift in honor of alex c. michalos (Vol. 60, pp. 61-79). Dordrecht,
In terms of this stability, over the past 15 years we have measured the SWB of the Australian population through 30 surveys, each of 2000 people, nationally representative. When the results are standardized to lie on a 0-100 point scale, and survey mean scores are used as data, the full range of values lies between 73.8–76.7 percentage points[15]. In other words, the mean score of a random survey of people in Australia can be predicted, with 95% certainty, to lie within a 2.9 percentage point range. There is no precedent in the literature for such extraordinary stability in self-report data.
59
Policy Brief Polis N° 19 | CaliBRANDO
Netherlands: Springer; 2016a.
[19] Cummins RA, Li L, Wooden M. & Stokes M.. A demonstration of set-points for subjective wellbeing. Journal of Happiness Studies. 2014a; 15: 183-206. Retrieved from: doi:10.1007/ s10902-013-9444-9
[20] Easterlin, R. A. Do people adapt to poorer health? health and health satisfaction over the life cycle. In F. Maggino (Ed.), A life devoted to quality of life - festschrift in honor of alex c. michalos (Vol. 60, pp. 81-92). Dordrecht, Netherlands: Springer; 2016.
[21] Headey B, Muffels R. & Wagner GG. National panel studies show substantial minorities recording long-term change in life satisfaction: implications for set point theory. In K. M. Sheldon & R. E. Lucas (Eds.), Stability of happiness: theories and evidence on whether happiness can change (pp. 99-126). New York: Elsevier; 2014.
[22] International wellbeing group. personal wellbeing index manual: 5th Edition; 2013. Retrieved from: http://www.acqol.com.au/ iwbg/wellbeing-index/index.php
[23] Cummins RA & Nistico H. Maintaining life satisfaction: the role of positive cognitive bias. Journal of Happiness Studies. 2002; 3(1): 37-69. [24] Hammond T, Weinberg MK & Cummins RA. The dyadic interaction of relationships and disability type on informal carer subjective well-being. Quality of Life Research. 2014; 23(5): 1535-1542.
[25] Tomyn AJ, Weinberg MK & Cummins RA. Intervention efficacy among ‘at risk’ adolescents: A test of subjective wellbeing homeostasis theory. Social Indicators Research. 2015; 120(3): 883-895. Retrieved from:doi:10.1007/s11205 -014-0619-5
of asking about the level of each dimension on a 0 to 10 scale, as recommended by literature[2,3]. For affect variables, a unique measure was built called affect balance. As Kahneman[4] recom-mends, this measure integrates each of the affect dimensions (happiness, worry, depre- ssion and anger) and it is calculated as the subtraction between the average of positive and negative emotions.
Based on this methodology, the DNP has carried out three main exercises. First, a general diagnosis of the population was carried out. Where comparisons were made between life satisfaction and affect balanceiv. variables with a set of population characteristics, to find relevant relationships and patterns. Second, a determinant analysis was made, where the variables that best predict the subjective well-being of the Colombian population were identified. Finally, in order to begin linking subjective well-being with public policy, a first approximation was made measuring the impact of social programs on Colombians’ subjective well-being. The main results of the three exerci-ses described are presented in this article.
Generally speaking, the Colombian population reports high levels of life satisfaction and affect balance with an average satisfaction of 0.85 and affect balance of 0.77 for the analyzed periods (Chart 1). Compared to OECD countries, Colombia presents life satisfaction levels well above the average of this group of countries (0.65 compared to 0.85 from Colombia). Likewise, Norway, the country with the highest OECD score, presents a level of 0.75. Neverthe-less, the levels of satisfaction and affect balance have been reducing over time. The level of life satisfaction at the national level has gone from 0.86 in 2015 to 0.84 in 2017. The affect balance at the national level has gone from 0.78 in 2015 to 0.76 in 2017.
In addition, life satisfaction and affect balance behavior was analyzed in relation with variables that have been shown to affect the subjective well-being of people. At the national level and the four major metropolitan areas, (Barranqui-lla, Bogotá, Cali y Valle de Aburrá), there is a positive relationship between the level of income and life satisfaction levels. People who report income above 690 USD in their home, which are 7.6% of the population, have a turning point in their levels of satisfaction around 1724 USD. Moreover, when comparing the income distribution at the national level with the satisfaction, it is evident that satisfac-tion is much better distributed than income, with a GINI coefficient of 0.11 for 2017 compa-red to the GINI income of 0.52. Also, when analyzing relative income, people who consider having a better standard of living than their neighbors have higher levels of life satisfaction and affect balance than those who consider having an equal or lower level. This same pattern can be seen in people who do not consi-der themselves poor regarding those who do and those who consider that their economic situation will be better than the current one in the next 12 months.
Chart 1. Life satisfaction and affect balance at a national level
iv. Both the satisfaction variables and the affect balance were normalized and were on a scale of 0 to 1.
8,6
2015-II 2016-I 2016-II 2017-I 2017-II
7,8
9,50
8,50
7,50
6,50
5,50
4,50
3,50
2,50
1,50
0,50
7,87,6 7,6
7,98,6 8,5 8,4 8,4
Life satisfaction Affect balance

It is interesting to note that this dependence on objective measures of national progress has not substantially changed over the past 85 years. The earliest opportunity to begin a systematic consideration of subjective indicators arose from an initiative of USA President Hoover[3]. In 1929 he formed the Research Committee on Social Trends, with a charter to “examine into the feasibility of a national survey of social trends”. In 1933 his committee produced a massive report of over 1600 pages, with 29 chapters written by some 40 authors. Notwithstanding chapter headings such as “Vitality” and “Changing social attitudes and interests”, the content relies purely on objective data; a limitation noted at that time as a “paradox of the social sciences” by R. F. Remer[4]. Yet he, and other critics, offered no guidance as to how to actually create subjective evaluations of population well-being.
It is also notable that Hoover’s Committee failed to acknowledge contemporary literature in the social sciences. In fact, the technology for measuring subjective evaluations had been well described decades earlier. In his 1923 review, Freyd[5] discusses the various forms of response scale available at that time, which subsequently became dominated by Likert’s[6] 5-level rating scale. All of this early development in the social sciences was ignored by the members of Hoover’s committee.
Thirty years later, little had changed. The beginnings of subjective social indicators, as a systematic topic for study, is usually attributed to Bauer’s (1966) edited work “Social Indicators”[1]. In fact, however, the authors of this work evidenced substantial misgivings, describing subjective indicators by terms such
as “impressionistic”, “qualitative”, and “mysterious”. Evidently, some new catalyst was required to interest econometricians in subjective indicators, and this was supplied by Easterlin[7] who reported that the positive association between income and happiness did not simply apply over time. While this news electrified the academic community, the national statistical agencies were less impressed, and continued to represent national life quality through economic data.
Some yet stronger stimulus was needed to jolt the agencies out of their complacency. This was precipitated by the global financial crisis of 2007-2008. The Stiglitz Commission[8] again reminded governments that Gross Domestic Product is not sufficient as an indicator of national progress, and proposed that countries turn to the measurement of subjective wellbeing as a complementary social and economic indicator. This authoritative voice engendered action. Both the World Health Organization[9] and the Organization for Economic Cooperation and Development[10] revised their definitions of well-being, with both organizations also recommending the national measurement of subjective well-being.
In the current era, subjective social indicators are starting to appear more commonly in national surveys. However, their inclusion usually appears as an after-thought. Understandably, the employees of national agencies have backgrounds in economics, business, or associated statistics. Subjective social indicators, on the other hand, are the province of the social sciences, particularly psychology. Thus, because the knowledge-silos of economics and psychology are so distinct from one another, subjective indicators are not valued by national statistical offices, are poorly understood, and poorly analyzed. As a consequence they yield uninteresting data, which leads to them not being valued. The cycle is complete.
Breaking this nexus requires two forms of action; one on each side of the disciplinary fence. The first is a willingness by national statistical offices to comprehend the contemporary potential of subjective social indicators for public policy advice. The second is for psychological scientists to make their work accessible outside their disci-pline, emphasizing the usefulness of their measu-res. In order for this to occur, all of those invol-ved need to agree on how to define and measure subjective life quality.
Understanding Subjective Wellbeing
The greatest single impediment to advancing acceptance of SWB as a social indicator is the absence of rules for nomenclature. It is surely not surprising that policy makers show indiffe-rence in the face of a variable with quite arbitrary descriptions. For example, SWB is often referred to in the social indicator literatu-re as “happiness”. Yet this term has two impor-tantly different meanings.
The common meaning of happiness is a positive feeling consequential to a short term event. When something happens to them that’s nice, people feel happy. This form of happiness is transitory, and is what psychologists refer to as an emotional state. The second kind of happi-ness is a mood. This form of happiness is not generated in reaction to something that has happened, but rather is a genetic trait that normally forms a constant background to our thoughts[11]. It is a gentle, mildly activated form of positive affect and its major importance is to keep us feeling good about ourselves.
In the context of social indicators, emotional happiness is noise in the measurement, varying from moment to moment. The measure of policy interest is mood happiness, and this is the major component of SWB[12,13,14]. This form of happiness causes SWB to have some very interesting properties. For example, SWB is normally experienced as a positive feeling and its level is normally quite stable.
Subjective wellbeing homeostasis
Why are these SWB mean scores so predictable? The theory of SWB homeostasis offers an explanation. This theory proposes that, in a manner analogous to the homeostatic main- tenance of blood calcium or body temperature, the level of SWB is actively controlled and maintained by a set of psychological devices, described in detail elsewhere[16,17,18].
At the heart of homeostasis is each person’s set-point for their SWB. This set-point is what homeostasis is defending. While each set-point is determined genetically, and does not change, responses to SWB questions do show variation. This is caused by intrusive emotions becoming incorporated into each SWB response[19].
This understanding, that SWB can vary while set-points do not, introduces a major caution to the interpretation of SWB measurement. Consider the analogy with the set-point for core body temperature (37o C). Prolonged exposure to a sufficiently persistent hot or cold thermal challenge will cause core body temperature to rise or fall. This does not represent a change in set-point. It is a defeat of homeostasis and, once the source of thermal challenge is removed, body temperature will normally revert to its set-point. This explains why, contrary to the views expressed by some authors[20,21], set-point theory does not carry an assumption of immutability in measured SWB.
Crucially, however, in order for SWB to return to set-point following an emotion, external and internal resources must be directed to the restoration of homeostasis. If these resources are sufficient, SWB returns to approximate its set-point. If the resources are insufficient, SWB remains below its normal range and the person is at high risk of depression[11].
Homeostatic resources
There are several internal psychological forms of homeostatic defence[18] which will not be discussed here. Of more direct relevance to the current context are three objective social indicators. These have been identified as the three domains of the Personal Well-being Index[22] which most strongly contribute to Global Life satisfaction (GLS) using multiple regression[15]. They are collectively referred to as the “Golden Triangle of Happiness” and comprise money, relationships, and achieving in life through a purposeful activity.
Each of these resources has a dual action. They both defend against homeostatic failure and also assist homeostatic maintenance. This is because active engagement with each resource is intrinsically rewarding. For example:
• Money can be used as a defensive resource. To avoid the negative experience of dog-washing, someone else can be paid to do the job. The time saved can then be used for a personally satisfying activity.
• Relationships, when positive and intimate, allow much of daily life to occur within a secure social environment. This both reduces the probability of unpleasant social encounters and also increases the probability of positive social interactions.
• Achieving something personally important each day engages positive life routines in a secure context and provides a positive sense of purpose.
In summary, engagement with these three resources assists homeostatic defense by reducing the probability of negative events and maintaining positive feelings through engagement with secure and rewarding activities.
SWB as a useful social indicator The practical implications of this understanding for public policy concerns the distribution of resources, especially financial resources, to support homeostasis. If people are living under conditions of chronic resource deprivation, that is sufficiently adverse to defeat homeostasis, then their SWB will be maintained at levels significantly below their set-point. Under such conditions people will be highly susceptible to depression and, in Australia, this applies to about 5% of the population[23]. However, when vulnerable groups are targeted for measurement[24] the proportion of people in homeostatic defeat is much higher. Moreover, and importantly for
policy, additional resources provided to people in homeostatic failure will reliably lift their SWB towards the average of the population[25]. The policy implications of this are clear. The most efficient way to increase population levels of SWB is to allocate additional resources to people with chronically low levels of SWB.
Summary
A great deal of understanding has accumulated in the 85 year history of subjective social indicators. Reliable and valid measures of subjective well-being (SWB) are now available and the results can be interpreted in terms of the most effective distribution of resources. These advances are also framed by a plausible theoretical model, in the form of subjective well-being homeostasis. If it is considered desirable for all citizens to experience normal levels of life quality, then SWB is an excellent national indicator of the degree to which it is being achieved. Whether our politicians and national statistical offices decide to collect data on subjective well-being is now based on political, rather than a scientific, reasoning.
Acknowledgement: This work was supported by the National Research Foundation of Korea Grant funded by the Korean Government (NRF-2013S1A3A2054622).
References
[1] Land KC, Michalos AC. Fifty years after the social indicators movement: has the promise been fulfilled? An assessment and an agenda for the future. Social Indicators Research. 2017; 135: 835-868.
[2] Australian Centre on Quality of Life. What is quality of life? [Internet]. Victoria, Australia: Deakin University; 2017. Retrieved from: http://www.deakin.edu.au/research/acqol/instruments/instrument.php
[3] Hoover H. Foreword. In W. C. Mitchell & et al (Eds.). U.S. president's research committee on social trends: recent social trends in the united states (Vol. Volume 1, pp. v). New York: McGraw-Hill Book Company; 1933. [4] Angell RC. Recent social trends in the united states: report of the president's research committee: I. Summary and comment. Michigan Law Review. 1933; 31(5): 638-658
[5] Freyd, M. The graphic rating scale. Journal of Educational Psychology.1923; 14: 83-102.
[6] Likert R. A technique for the measurement of attitudes. Archives in Psychology.1932; 22(140): 1-55.
[7] Easterlin RA. Does economic growth improve the human lot? Some empirical evidence. In David P & Reder M (Eds.), Nations and households in economic growth (pp. 89-125). New York: Academic Press; 1974.
[8] Stiglitz, J., Sen, A., & Fitoussi, J.-P. Report by the commission on the measurement of economic performance and social progress. Paris: Commi- ssion on the Measurement of Economic Perfor- mance and Social Progress; 2010. Retrieved from: http ://www.st igl i tz-sen-f i touss i . f r/docu- ments/rapport_anglais.pdf
[9] WHO. The European health report 2012: charting the way to well-being. Copenhagen, Dinamark: The regional office of Europe of World Health Organization; 2012. Retrieved from: h t t p : // w w w. e u ro .wh o . i n t / _ _ da ta / a s s e t s /pdf_file/0004/197113/EHR2012-Eng.pdf
[10]OECD. OECD guidelines on measuring subjective well-being. París: OECD Publishing; 2013. Retrieved from: http://dx.doi.org/ 10.1787/9789264191655-en
[11] Cummins RA. Subjective wellbeing, homeos- tatically protected mood and depression: a synthesis.
Journal of Happiness Studies. 2010(a); 11(1), 1-17. Retrieved from: doi:10.1007/s10902-009-9167-0[12] Blore JD, Stokes MA, Mellor D, Firth L & Cummins RA. Comparing multiple discrepancies theory to affective models of subjective wellbeing. Social Indicators Research. 2011; 100(1): 1-16. Retrieved from: doi:10.1007/s11205-010-9599-2
[13] Davern M, Cummins RA & Stokes M. Subjective wellbeing as an affective/cognitive construct. Journal of Happiness Studies. 2007; 8(4): 429-449. Retrieved from: doi:10.1007/s10902-007-9066-1
[14] Tomyn AJ & Cummins RA. Subjective wellbeing and homeostatically protected mood: theory validation with adolescents. Journal of Happiness Studies. 2011(a); 12(5): 897-914. Retrieved from: doi:10.1007/s10902-010-9235 -5
[15] Cummins RA, Woerner J, Weinberg M, Collard J, Hartley-Clark L & Horfiniak K. Australian Unity Wellbeing Index: -Report 30.0 - The wellbeing of Australians: social media, personal achievement, and work. Melbourne: Australian Centre on Quality of Life, School of Psychology, Deakin University; 2013c. Retrieved from: http://www.acqol.com.au/ reports/auwbi.php.
[16] Cummins RA. Subjective wellbeing homeostasis D. S. Dunn (Ed.) Oxford Bibliographies Online; 2013a. Retrieved from: http://www.oxfordbibliographies.com/view/document/obo-9780199828340/obo-9780199828340-0167.xml [17] Cummins RA. Can happiness change? theories and evidence. In K. M. Sheldon & R. E. Lucas (Eds.) Stability of happiness: theories and evidence on whether happiness can change (pp. 75-97). Amsterdam: Elsevier; 2014b.
[18] Cummins, R. A. The theory of subjective wellbeing homeostasis: a contribution to understanding life quality. In F. Maggino (Ed.). A life devoted to quality of life - festschrift in honor of alex c. michalos (Vol. 60, pp. 61-79). Dordrecht,
In terms of this stability, over the past 15 years we have measured the SWB of the Australian population through 30 surveys, each of 2000 people, nationally representative. When the results are standardized to lie on a 0-100 point scale, and survey mean scores are used as data, the full range of values lies between 73.8–76.7 percentage points[15]. In other words, the mean score of a random survey of people in Australia can be predicted, with 95% certainty, to lie within a 2.9 percentage point range. There is no precedent in the literature for such extraordinary stability in self-report data.
Netherlands: Springer; 2016a.
[19] Cummins RA, Li L, Wooden M. & Stokes M.. A demonstration of set-points for subjective wellbeing. Journal of Happiness Studies. 2014a; 15: 183-206. Retrieved from: doi:10.1007/ s10902-013-9444-9
[20] Easterlin, R. A. Do people adapt to poorer health? health and health satisfaction over the life cycle. In F. Maggino (Ed.), A life devoted to quality of life - festschrift in honor of alex c. michalos (Vol. 60, pp. 81-92). Dordrecht, Netherlands: Springer; 2016.
[21] Headey B, Muffels R. & Wagner GG. National panel studies show substantial minorities recording long-term change in life satisfaction: implications for set point theory. In K. M. Sheldon & R. E. Lucas (Eds.), Stability of happiness: theories and evidence on whether happiness can change (pp. 99-126). New York: Elsevier; 2014.
[22] International wellbeing group. personal wellbeing index manual: 5th Edition; 2013. Retrieved from: http://www.acqol.com.au/ iwbg/wellbeing-index/index.php
[23] Cummins RA & Nistico H. Maintaining life satisfaction: the role of positive cognitive bias. Journal of Happiness Studies. 2002; 3(1): 37-69. [24] Hammond T, Weinberg MK & Cummins RA. The dyadic interaction of relationships and disability type on informal carer subjective well-being. Quality of Life Research. 2014; 23(5): 1535-1542.
[25] Tomyn AJ, Weinberg MK & Cummins RA. Intervention efficacy among ‘at risk’ adolescents: A test of subjective wellbeing homeostasis theory. Social Indicators Research. 2015; 120(3): 883-895. Retrieved from:doi:10.1007/s11205 -014-0619-5
The relationship between age and life satisfac-tion at the national and city levels presents a similar behavior. Life satisfaction decreases as age increases up to a turning point of 53 years where life satisfaction begins to increase. This turning point in Bogota is 52 years, in the Valle de Aburrá is 49 years, in the metropolitan area of Cali is 51 years and in the metropolitan area of Barranquilla is 50 years.
In relation to health, people who consider having a very good health have significantly higher levels of satisfaction and affect balance than those who consider having only good, fair, poor or very poor health. Furthermore, people affiliated with a public health insurance scheme (around 95% of the population) have higher levels of subjective well-being compared to those who do not. Regarding variables related to employment, people who do not consider having job stability have lower levels of life satisfaction, as well as those that are not part of formal markets. Lastly, in terms of personal relationships, there is a positive relationship between life satisfaction and having more people counting on.
After making an initial diagnosis where relationships between subjective well-being and variables that commonly predict subjective well-being where analyzed, there is a need to deepen on the joint relationships between the variables. That is why, a determinant analysis was performed. Its main objective is to identify the variables that best predict subjective well-being in Colombia. For this, a different methodology was used for each variable of interest. In the analysis of determinants for life satisfaction, a Stereotype Logistic Regression was used; instead due to the continuity of the affect balance variable a linear regression model by Ordinary Least Squares was carried out.
The results of this exercise are consistent with the results found internationally. In Colombia, self-reported health seems to be the variable
that best predicts subjective well-being. Report having a very good health is associated with having higher levels of satisfaction and affect balance, while living with a disabled person is negatively associated.
Income also has an important relationship with the levels of subjective well-being of Colom-bians; however, relative income seems to be more important than absolute income. Not considering yourself poor and believing to have a better standard of living than your neighbors has a significant positive relationship with life satisfaction and affect balance. Furthermore, having a household income greater than 690 USD per month is positively associated with subjective well-being.
Regarding employment variables, being a salaried worker and having the perception of job stability are positively associated with life satisfaction. On the other hand, having a smar-tphone with internet access is positively asso-ciated with life satisfaction of Colombians. Social capital variables (trust in acquaintances and family) are positively related to the subjec-tive well-being of Colombians. Finally, there is a negative relationship, although small, and statistically significant between age and life satisfaction, as well as being affected by crime in the last year.
60
Castro, Puerta & Castañeda | CaliBRANDO
Satisfaction is much better distributed than
income, with a GINI coefficient of 0.11 for 2017 compared to the
GINI income of 0.52.
“
“

It is interesting to note that this dependence on objective measures of national progress has not substantially changed over the past 85 years. The earliest opportunity to begin a systematic consideration of subjective indicators arose from an initiative of USA President Hoover[3]. In 1929 he formed the Research Committee on Social Trends, with a charter to “examine into the feasibility of a national survey of social trends”. In 1933 his committee produced a massive report of over 1600 pages, with 29 chapters written by some 40 authors. Notwithstanding chapter headings such as “Vitality” and “Changing social attitudes and interests”, the content relies purely on objective data; a limitation noted at that time as a “paradox of the social sciences” by R. F. Remer[4]. Yet he, and other critics, offered no guidance as to how to actually create subjective evaluations of population well-being.
It is also notable that Hoover’s Committee failed to acknowledge contemporary literature in the social sciences. In fact, the technology for measuring subjective evaluations had been well described decades earlier. In his 1923 review, Freyd[5] discusses the various forms of response scale available at that time, which subsequently became dominated by Likert’s[6] 5-level rating scale. All of this early development in the social sciences was ignored by the members of Hoover’s committee.
Thirty years later, little had changed. The beginnings of subjective social indicators, as a systematic topic for study, is usually attributed to Bauer’s (1966) edited work “Social Indicators”[1]. In fact, however, the authors of this work evidenced substantial misgivings, describing subjective indicators by terms such
as “impressionistic”, “qualitative”, and “mysterious”. Evidently, some new catalyst was required to interest econometricians in subjective indicators, and this was supplied by Easterlin[7] who reported that the positive association between income and happiness did not simply apply over time. While this news electrified the academic community, the national statistical agencies were less impressed, and continued to represent national life quality through economic data.
Some yet stronger stimulus was needed to jolt the agencies out of their complacency. This was precipitated by the global financial crisis of 2007-2008. The Stiglitz Commission[8] again reminded governments that Gross Domestic Product is not sufficient as an indicator of national progress, and proposed that countries turn to the measurement of subjective wellbeing as a complementary social and economic indicator. This authoritative voice engendered action. Both the World Health Organization[9] and the Organization for Economic Cooperation and Development[10] revised their definitions of well-being, with both organizations also recommending the national measurement of subjective well-being.
In the current era, subjective social indicators are starting to appear more commonly in national surveys. However, their inclusion usually appears as an after-thought. Understandably, the employees of national agencies have backgrounds in economics, business, or associated statistics. Subjective social indicators, on the other hand, are the province of the social sciences, particularly psychology. Thus, because the knowledge-silos of economics and psychology are so distinct from one another, subjective indicators are not valued by national statistical offices, are poorly understood, and poorly analyzed. As a consequence they yield uninteresting data, which leads to them not being valued. The cycle is complete.
Breaking this nexus requires two forms of action; one on each side of the disciplinary fence. The first is a willingness by national statistical offices to comprehend the contemporary potential of subjective social indicators for public policy advice. The second is for psychological scientists to make their work accessible outside their disci-pline, emphasizing the usefulness of their measu-res. In order for this to occur, all of those invol-ved need to agree on how to define and measure subjective life quality.
Understanding Subjective Wellbeing
The greatest single impediment to advancing acceptance of SWB as a social indicator is the absence of rules for nomenclature. It is surely not surprising that policy makers show indiffe-rence in the face of a variable with quite arbitrary descriptions. For example, SWB is often referred to in the social indicator literatu-re as “happiness”. Yet this term has two impor-tantly different meanings.
The common meaning of happiness is a positive feeling consequential to a short term event. When something happens to them that’s nice, people feel happy. This form of happiness is transitory, and is what psychologists refer to as an emotional state. The second kind of happi-ness is a mood. This form of happiness is not generated in reaction to something that has happened, but rather is a genetic trait that normally forms a constant background to our thoughts[11]. It is a gentle, mildly activated form of positive affect and its major importance is to keep us feeling good about ourselves.
In the context of social indicators, emotional happiness is noise in the measurement, varying from moment to moment. The measure of policy interest is mood happiness, and this is the major component of SWB[12,13,14]. This form of happiness causes SWB to have some very interesting properties. For example, SWB is normally experienced as a positive feeling and its level is normally quite stable.
Subjective wellbeing homeostasis
Why are these SWB mean scores so predictable? The theory of SWB homeostasis offers an explanation. This theory proposes that, in a manner analogous to the homeostatic main- tenance of blood calcium or body temperature, the level of SWB is actively controlled and maintained by a set of psychological devices, described in detail elsewhere[16,17,18].
At the heart of homeostasis is each person’s set-point for their SWB. This set-point is what homeostasis is defending. While each set-point is determined genetically, and does not change, responses to SWB questions do show variation. This is caused by intrusive emotions becoming incorporated into each SWB response[19].
This understanding, that SWB can vary while set-points do not, introduces a major caution to the interpretation of SWB measurement. Consider the analogy with the set-point for core body temperature (37o C). Prolonged exposure to a sufficiently persistent hot or cold thermal challenge will cause core body temperature to rise or fall. This does not represent a change in set-point. It is a defeat of homeostasis and, once the source of thermal challenge is removed, body temperature will normally revert to its set-point. This explains why, contrary to the views expressed by some authors[20,21], set-point theory does not carry an assumption of immutability in measured SWB.
Crucially, however, in order for SWB to return to set-point following an emotion, external and internal resources must be directed to the restoration of homeostasis. If these resources are sufficient, SWB returns to approximate its set-point. If the resources are insufficient, SWB remains below its normal range and the person is at high risk of depression[11].
Homeostatic resources
There are several internal psychological forms of homeostatic defence[18] which will not be discussed here. Of more direct relevance to the current context are three objective social indicators. These have been identified as the three domains of the Personal Well-being Index[22] which most strongly contribute to Global Life satisfaction (GLS) using multiple regression[15]. They are collectively referred to as the “Golden Triangle of Happiness” and comprise money, relationships, and achieving in life through a purposeful activity.
Each of these resources has a dual action. They both defend against homeostatic failure and also assist homeostatic maintenance. This is because active engagement with each resource is intrinsically rewarding. For example:
• Money can be used as a defensive resource. To avoid the negative experience of dog-washing, someone else can be paid to do the job. The time saved can then be used for a personally satisfying activity.
• Relationships, when positive and intimate, allow much of daily life to occur within a secure social environment. This both reduces the probability of unpleasant social encounters and also increases the probability of positive social interactions.
• Achieving something personally important each day engages positive life routines in a secure context and provides a positive sense of purpose.
In summary, engagement with these three resources assists homeostatic defense by reducing the probability of negative events and maintaining positive feelings through engagement with secure and rewarding activities.
SWB as a useful social indicator The practical implications of this understanding for public policy concerns the distribution of resources, especially financial resources, to support homeostasis. If people are living under conditions of chronic resource deprivation, that is sufficiently adverse to defeat homeostasis, then their SWB will be maintained at levels significantly below their set-point. Under such conditions people will be highly susceptible to depression and, in Australia, this applies to about 5% of the population[23]. However, when vulnerable groups are targeted for measurement[24] the proportion of people in homeostatic defeat is much higher. Moreover, and importantly for
policy, additional resources provided to people in homeostatic failure will reliably lift their SWB towards the average of the population[25]. The policy implications of this are clear. The most efficient way to increase population levels of SWB is to allocate additional resources to people with chronically low levels of SWB.
Summary
A great deal of understanding has accumulated in the 85 year history of subjective social indicators. Reliable and valid measures of subjective well-being (SWB) are now available and the results can be interpreted in terms of the most effective distribution of resources. These advances are also framed by a plausible theoretical model, in the form of subjective well-being homeostasis. If it is considered desirable for all citizens to experience normal levels of life quality, then SWB is an excellent national indicator of the degree to which it is being achieved. Whether our politicians and national statistical offices decide to collect data on subjective well-being is now based on political, rather than a scientific, reasoning.
Acknowledgement: This work was supported by the National Research Foundation of Korea Grant funded by the Korean Government (NRF-2013S1A3A2054622).
References
[1] Land KC, Michalos AC. Fifty years after the social indicators movement: has the promise been fulfilled? An assessment and an agenda for the future. Social Indicators Research. 2017; 135: 835-868.
[2] Australian Centre on Quality of Life. What is quality of life? [Internet]. Victoria, Australia: Deakin University; 2017. Retrieved from: http://www.deakin.edu.au/research/acqol/instruments/instrument.php
[3] Hoover H. Foreword. In W. C. Mitchell & et al (Eds.). U.S. president's research committee on social trends: recent social trends in the united states (Vol. Volume 1, pp. v). New York: McGraw-Hill Book Company; 1933. [4] Angell RC. Recent social trends in the united states: report of the president's research committee: I. Summary and comment. Michigan Law Review. 1933; 31(5): 638-658
[5] Freyd, M. The graphic rating scale. Journal of Educational Psychology.1923; 14: 83-102.
[6] Likert R. A technique for the measurement of attitudes. Archives in Psychology.1932; 22(140): 1-55.
[7] Easterlin RA. Does economic growth improve the human lot? Some empirical evidence. In David P & Reder M (Eds.), Nations and households in economic growth (pp. 89-125). New York: Academic Press; 1974.
[8] Stiglitz, J., Sen, A., & Fitoussi, J.-P. Report by the commission on the measurement of economic performance and social progress. Paris: Commi- ssion on the Measurement of Economic Perfor- mance and Social Progress; 2010. Retrieved from: http ://www.st igl i tz-sen-f i touss i . f r/docu- ments/rapport_anglais.pdf
[9] WHO. The European health report 2012: charting the way to well-being. Copenhagen, Dinamark: The regional office of Europe of World Health Organization; 2012. Retrieved from: h t t p : // w w w. e u ro .wh o . i n t / _ _ da ta / a s s e t s /pdf_file/0004/197113/EHR2012-Eng.pdf
[10]OECD. OECD guidelines on measuring subjective well-being. París: OECD Publishing; 2013. Retrieved from: http://dx.doi.org/ 10.1787/9789264191655-en
[11] Cummins RA. Subjective wellbeing, homeos- tatically protected mood and depression: a synthesis.
Journal of Happiness Studies. 2010(a); 11(1), 1-17. Retrieved from: doi:10.1007/s10902-009-9167-0[12] Blore JD, Stokes MA, Mellor D, Firth L & Cummins RA. Comparing multiple discrepancies theory to affective models of subjective wellbeing. Social Indicators Research. 2011; 100(1): 1-16. Retrieved from: doi:10.1007/s11205-010-9599-2
[13] Davern M, Cummins RA & Stokes M. Subjective wellbeing as an affective/cognitive construct. Journal of Happiness Studies. 2007; 8(4): 429-449. Retrieved from: doi:10.1007/s10902-007-9066-1
[14] Tomyn AJ & Cummins RA. Subjective wellbeing and homeostatically protected mood: theory validation with adolescents. Journal of Happiness Studies. 2011(a); 12(5): 897-914. Retrieved from: doi:10.1007/s10902-010-9235 -5
[15] Cummins RA, Woerner J, Weinberg M, Collard J, Hartley-Clark L & Horfiniak K. Australian Unity Wellbeing Index: -Report 30.0 - The wellbeing of Australians: social media, personal achievement, and work. Melbourne: Australian Centre on Quality of Life, School of Psychology, Deakin University; 2013c. Retrieved from: http://www.acqol.com.au/ reports/auwbi.php.
[16] Cummins RA. Subjective wellbeing homeostasis D. S. Dunn (Ed.) Oxford Bibliographies Online; 2013a. Retrieved from: http://www.oxfordbibliographies.com/view/document/obo-9780199828340/obo-9780199828340-0167.xml [17] Cummins RA. Can happiness change? theories and evidence. In K. M. Sheldon & R. E. Lucas (Eds.) Stability of happiness: theories and evidence on whether happiness can change (pp. 75-97). Amsterdam: Elsevier; 2014b.
[18] Cummins, R. A. The theory of subjective wellbeing homeostasis: a contribution to understanding life quality. In F. Maggino (Ed.). A life devoted to quality of life - festschrift in honor of alex c. michalos (Vol. 60, pp. 61-79). Dordrecht,
In terms of this stability, over the past 15 years we have measured the SWB of the Australian population through 30 surveys, each of 2000 people, nationally representative. When the results are standardized to lie on a 0-100 point scale, and survey mean scores are used as data, the full range of values lies between 73.8–76.7 percentage points[15]. In other words, the mean score of a random survey of people in Australia can be predicted, with 95% certainty, to lie within a 2.9 percentage point range. There is no precedent in the literature for such extraordinary stability in self-report data.
61
Policy Brief Polis N° 19 | CaliBRANDO
Netherlands: Springer; 2016a.
[19] Cummins RA, Li L, Wooden M. & Stokes M.. A demonstration of set-points for subjective wellbeing. Journal of Happiness Studies. 2014a; 15: 183-206. Retrieved from: doi:10.1007/ s10902-013-9444-9
[20] Easterlin, R. A. Do people adapt to poorer health? health and health satisfaction over the life cycle. In F. Maggino (Ed.), A life devoted to quality of life - festschrift in honor of alex c. michalos (Vol. 60, pp. 81-92). Dordrecht, Netherlands: Springer; 2016.
[21] Headey B, Muffels R. & Wagner GG. National panel studies show substantial minorities recording long-term change in life satisfaction: implications for set point theory. In K. M. Sheldon & R. E. Lucas (Eds.), Stability of happiness: theories and evidence on whether happiness can change (pp. 99-126). New York: Elsevier; 2014.
[22] International wellbeing group. personal wellbeing index manual: 5th Edition; 2013. Retrieved from: http://www.acqol.com.au/ iwbg/wellbeing-index/index.php
[23] Cummins RA & Nistico H. Maintaining life satisfaction: the role of positive cognitive bias. Journal of Happiness Studies. 2002; 3(1): 37-69. [24] Hammond T, Weinberg MK & Cummins RA. The dyadic interaction of relationships and disability type on informal carer subjective well-being. Quality of Life Research. 2014; 23(5): 1535-1542.
[25] Tomyn AJ, Weinberg MK & Cummins RA. Intervention efficacy among ‘at risk’ adolescents: A test of subjective wellbeing homeostasis theory. Social Indicators Research. 2015; 120(3): 883-895. Retrieved from:doi:10.1007/s11205 -014-0619-5
While life satisfaction is explained by variables, such as absolute income, access to ICT and mari-tal status; affect balance is mainly explained by variables as head of household, relative income, having been a victim of natural disasters and hours dedicated to sleep.
Finally, in order to find causal relationships between public policy and the role of the State in subjective well-being, the impact of receiving social programs on life satisfaction and satisfac-tion domains of Colombians was measured. For this, the two rounds of the EPC for 2017 were used. A Propensity Score Matching methodology was applied to the cross-sectional sample and later a double Robust estimator, proposed by Imbens y Wooldridge[5], was used. Using this methodology, it was calculated the impact of living in a household with at least one-member beneficiary of a social program over life satisfac-tion and its domains, measured from 0 to 10. The impact of several social programs was measured separately such as: Familias en Acción, Jóvenes en Acción, ICBF programs and programs related to education and/or job training.
The results of this exercise show that all the analyzed social programs have no impact on individual life satisfaction. This may be related to the high life satisfaction levels in the country, which means that there is little space for public policy to influence subjective well-being. Moreover, these programs are not designed to increase individual life satisfaction, therefore, it is expected the lack of impact.
However, analyzing program impacts over satisfac-tion domains, some interesting impacts are found. Being a member of a household with one or more beneficiaries of Jóvenes en Acción, has positive impacts on satisfaction with living standard in 0.31 units, on satisfaction with personal relationships (not including the family) in 0.37 units and on satisfaction with education in 0.49 units. These results show that this program is affecting different aspects of the lives of young people, which is reflec-ted in greater satisfaction in some aspects of life.

It is interesting to note that this dependence on objective measures of national progress has not substantially changed over the past 85 years. The earliest opportunity to begin a systematic consideration of subjective indicators arose from an initiative of USA President Hoover[3]. In 1929 he formed the Research Committee on Social Trends, with a charter to “examine into the feasibility of a national survey of social trends”. In 1933 his committee produced a massive report of over 1600 pages, with 29 chapters written by some 40 authors. Notwithstanding chapter headings such as “Vitality” and “Changing social attitudes and interests”, the content relies purely on objective data; a limitation noted at that time as a “paradox of the social sciences” by R. F. Remer[4]. Yet he, and other critics, offered no guidance as to how to actually create subjective evaluations of population well-being.
It is also notable that Hoover’s Committee failed to acknowledge contemporary literature in the social sciences. In fact, the technology for measuring subjective evaluations had been well described decades earlier. In his 1923 review, Freyd[5] discusses the various forms of response scale available at that time, which subsequently became dominated by Likert’s[6] 5-level rating scale. All of this early development in the social sciences was ignored by the members of Hoover’s committee.
Thirty years later, little had changed. The beginnings of subjective social indicators, as a systematic topic for study, is usually attributed to Bauer’s (1966) edited work “Social Indicators”[1]. In fact, however, the authors of this work evidenced substantial misgivings, describing subjective indicators by terms such
as “impressionistic”, “qualitative”, and “mysterious”. Evidently, some new catalyst was required to interest econometricians in subjective indicators, and this was supplied by Easterlin[7] who reported that the positive association between income and happiness did not simply apply over time. While this news electrified the academic community, the national statistical agencies were less impressed, and continued to represent national life quality through economic data.
Some yet stronger stimulus was needed to jolt the agencies out of their complacency. This was precipitated by the global financial crisis of 2007-2008. The Stiglitz Commission[8] again reminded governments that Gross Domestic Product is not sufficient as an indicator of national progress, and proposed that countries turn to the measurement of subjective wellbeing as a complementary social and economic indicator. This authoritative voice engendered action. Both the World Health Organization[9] and the Organization for Economic Cooperation and Development[10] revised their definitions of well-being, with both organizations also recommending the national measurement of subjective well-being.
In the current era, subjective social indicators are starting to appear more commonly in national surveys. However, their inclusion usually appears as an after-thought. Understandably, the employees of national agencies have backgrounds in economics, business, or associated statistics. Subjective social indicators, on the other hand, are the province of the social sciences, particularly psychology. Thus, because the knowledge-silos of economics and psychology are so distinct from one another, subjective indicators are not valued by national statistical offices, are poorly understood, and poorly analyzed. As a consequence they yield uninteresting data, which leads to them not being valued. The cycle is complete.
Breaking this nexus requires two forms of action; one on each side of the disciplinary fence. The first is a willingness by national statistical offices to comprehend the contemporary potential of subjective social indicators for public policy advice. The second is for psychological scientists to make their work accessible outside their disci-pline, emphasizing the usefulness of their measu-res. In order for this to occur, all of those invol-ved need to agree on how to define and measure subjective life quality.
Understanding Subjective Wellbeing
The greatest single impediment to advancing acceptance of SWB as a social indicator is the absence of rules for nomenclature. It is surely not surprising that policy makers show indiffe-rence in the face of a variable with quite arbitrary descriptions. For example, SWB is often referred to in the social indicator literatu-re as “happiness”. Yet this term has two impor-tantly different meanings.
The common meaning of happiness is a positive feeling consequential to a short term event. When something happens to them that’s nice, people feel happy. This form of happiness is transitory, and is what psychologists refer to as an emotional state. The second kind of happi-ness is a mood. This form of happiness is not generated in reaction to something that has happened, but rather is a genetic trait that normally forms a constant background to our thoughts[11]. It is a gentle, mildly activated form of positive affect and its major importance is to keep us feeling good about ourselves.
In the context of social indicators, emotional happiness is noise in the measurement, varying from moment to moment. The measure of policy interest is mood happiness, and this is the major component of SWB[12,13,14]. This form of happiness causes SWB to have some very interesting properties. For example, SWB is normally experienced as a positive feeling and its level is normally quite stable.
Subjective wellbeing homeostasis
Why are these SWB mean scores so predictable? The theory of SWB homeostasis offers an explanation. This theory proposes that, in a manner analogous to the homeostatic main- tenance of blood calcium or body temperature, the level of SWB is actively controlled and maintained by a set of psychological devices, described in detail elsewhere[16,17,18].
At the heart of homeostasis is each person’s set-point for their SWB. This set-point is what homeostasis is defending. While each set-point is determined genetically, and does not change, responses to SWB questions do show variation. This is caused by intrusive emotions becoming incorporated into each SWB response[19].
This understanding, that SWB can vary while set-points do not, introduces a major caution to the interpretation of SWB measurement. Consider the analogy with the set-point for core body temperature (37o C). Prolonged exposure to a sufficiently persistent hot or cold thermal challenge will cause core body temperature to rise or fall. This does not represent a change in set-point. It is a defeat of homeostasis and, once the source of thermal challenge is removed, body temperature will normally revert to its set-point. This explains why, contrary to the views expressed by some authors[20,21], set-point theory does not carry an assumption of immutability in measured SWB.
Crucially, however, in order for SWB to return to set-point following an emotion, external and internal resources must be directed to the restoration of homeostasis. If these resources are sufficient, SWB returns to approximate its set-point. If the resources are insufficient, SWB remains below its normal range and the person is at high risk of depression[11].
Homeostatic resources
There are several internal psychological forms of homeostatic defence[18] which will not be discussed here. Of more direct relevance to the current context are three objective social indicators. These have been identified as the three domains of the Personal Well-being Index[22] which most strongly contribute to Global Life satisfaction (GLS) using multiple regression[15]. They are collectively referred to as the “Golden Triangle of Happiness” and comprise money, relationships, and achieving in life through a purposeful activity.
Each of these resources has a dual action. They both defend against homeostatic failure and also assist homeostatic maintenance. This is because active engagement with each resource is intrinsically rewarding. For example:
• Money can be used as a defensive resource. To avoid the negative experience of dog-washing, someone else can be paid to do the job. The time saved can then be used for a personally satisfying activity.
• Relationships, when positive and intimate, allow much of daily life to occur within a secure social environment. This both reduces the probability of unpleasant social encounters and also increases the probability of positive social interactions.
• Achieving something personally important each day engages positive life routines in a secure context and provides a positive sense of purpose.
In summary, engagement with these three resources assists homeostatic defense by reducing the probability of negative events and maintaining positive feelings through engagement with secure and rewarding activities.
SWB as a useful social indicator The practical implications of this understanding for public policy concerns the distribution of resources, especially financial resources, to support homeostasis. If people are living under conditions of chronic resource deprivation, that is sufficiently adverse to defeat homeostasis, then their SWB will be maintained at levels significantly below their set-point. Under such conditions people will be highly susceptible to depression and, in Australia, this applies to about 5% of the population[23]. However, when vulnerable groups are targeted for measurement[24] the proportion of people in homeostatic defeat is much higher. Moreover, and importantly for
policy, additional resources provided to people in homeostatic failure will reliably lift their SWB towards the average of the population[25]. The policy implications of this are clear. The most efficient way to increase population levels of SWB is to allocate additional resources to people with chronically low levels of SWB.
Summary
A great deal of understanding has accumulated in the 85 year history of subjective social indicators. Reliable and valid measures of subjective well-being (SWB) are now available and the results can be interpreted in terms of the most effective distribution of resources. These advances are also framed by a plausible theoretical model, in the form of subjective well-being homeostasis. If it is considered desirable for all citizens to experience normal levels of life quality, then SWB is an excellent national indicator of the degree to which it is being achieved. Whether our politicians and national statistical offices decide to collect data on subjective well-being is now based on political, rather than a scientific, reasoning.
Acknowledgement: This work was supported by the National Research Foundation of Korea Grant funded by the Korean Government (NRF-2013S1A3A2054622).
References
[1] Land KC, Michalos AC. Fifty years after the social indicators movement: has the promise been fulfilled? An assessment and an agenda for the future. Social Indicators Research. 2017; 135: 835-868.
[2] Australian Centre on Quality of Life. What is quality of life? [Internet]. Victoria, Australia: Deakin University; 2017. Retrieved from: http://www.deakin.edu.au/research/acqol/instruments/instrument.php
[3] Hoover H. Foreword. In W. C. Mitchell & et al (Eds.). U.S. president's research committee on social trends: recent social trends in the united states (Vol. Volume 1, pp. v). New York: McGraw-Hill Book Company; 1933. [4] Angell RC. Recent social trends in the united states: report of the president's research committee: I. Summary and comment. Michigan Law Review. 1933; 31(5): 638-658
[5] Freyd, M. The graphic rating scale. Journal of Educational Psychology.1923; 14: 83-102.
[6] Likert R. A technique for the measurement of attitudes. Archives in Psychology.1932; 22(140): 1-55.
[7] Easterlin RA. Does economic growth improve the human lot? Some empirical evidence. In David P & Reder M (Eds.), Nations and households in economic growth (pp. 89-125). New York: Academic Press; 1974.
[8] Stiglitz, J., Sen, A., & Fitoussi, J.-P. Report by the commission on the measurement of economic performance and social progress. Paris: Commi- ssion on the Measurement of Economic Perfor- mance and Social Progress; 2010. Retrieved from: http ://www.st igl i tz-sen-f i touss i . f r/docu- ments/rapport_anglais.pdf
[9] WHO. The European health report 2012: charting the way to well-being. Copenhagen, Dinamark: The regional office of Europe of World Health Organization; 2012. Retrieved from: h t t p : // w w w. e u ro .wh o . i n t / _ _ da ta / a s s e t s /pdf_file/0004/197113/EHR2012-Eng.pdf
[10]OECD. OECD guidelines on measuring subjective well-being. París: OECD Publishing; 2013. Retrieved from: http://dx.doi.org/ 10.1787/9789264191655-en
[11] Cummins RA. Subjective wellbeing, homeos- tatically protected mood and depression: a synthesis.
Journal of Happiness Studies. 2010(a); 11(1), 1-17. Retrieved from: doi:10.1007/s10902-009-9167-0[12] Blore JD, Stokes MA, Mellor D, Firth L & Cummins RA. Comparing multiple discrepancies theory to affective models of subjective wellbeing. Social Indicators Research. 2011; 100(1): 1-16. Retrieved from: doi:10.1007/s11205-010-9599-2
[13] Davern M, Cummins RA & Stokes M. Subjective wellbeing as an affective/cognitive construct. Journal of Happiness Studies. 2007; 8(4): 429-449. Retrieved from: doi:10.1007/s10902-007-9066-1
[14] Tomyn AJ & Cummins RA. Subjective wellbeing and homeostatically protected mood: theory validation with adolescents. Journal of Happiness Studies. 2011(a); 12(5): 897-914. Retrieved from: doi:10.1007/s10902-010-9235 -5
[15] Cummins RA, Woerner J, Weinberg M, Collard J, Hartley-Clark L & Horfiniak K. Australian Unity Wellbeing Index: -Report 30.0 - The wellbeing of Australians: social media, personal achievement, and work. Melbourne: Australian Centre on Quality of Life, School of Psychology, Deakin University; 2013c. Retrieved from: http://www.acqol.com.au/ reports/auwbi.php.
[16] Cummins RA. Subjective wellbeing homeostasis D. S. Dunn (Ed.) Oxford Bibliographies Online; 2013a. Retrieved from: http://www.oxfordbibliographies.com/view/document/obo-9780199828340/obo-9780199828340-0167.xml [17] Cummins RA. Can happiness change? theories and evidence. In K. M. Sheldon & R. E. Lucas (Eds.) Stability of happiness: theories and evidence on whether happiness can change (pp. 75-97). Amsterdam: Elsevier; 2014b.
[18] Cummins, R. A. The theory of subjective wellbeing homeostasis: a contribution to understanding life quality. In F. Maggino (Ed.). A life devoted to quality of life - festschrift in honor of alex c. michalos (Vol. 60, pp. 61-79). Dordrecht,
In terms of this stability, over the past 15 years we have measured the SWB of the Australian population through 30 surveys, each of 2000 people, nationally representative. When the results are standardized to lie on a 0-100 point scale, and survey mean scores are used as data, the full range of values lies between 73.8–76.7 percentage points[15]. In other words, the mean score of a random survey of people in Australia can be predicted, with 95% certainty, to lie within a 2.9 percentage point range. There is no precedent in the literature for such extraordinary stability in self-report data.
Netherlands: Springer; 2016a.
[19] Cummins RA, Li L, Wooden M. & Stokes M.. A demonstration of set-points for subjective wellbeing. Journal of Happiness Studies. 2014a; 15: 183-206. Retrieved from: doi:10.1007/ s10902-013-9444-9
[20] Easterlin, R. A. Do people adapt to poorer health? health and health satisfaction over the life cycle. In F. Maggino (Ed.), A life devoted to quality of life - festschrift in honor of alex c. michalos (Vol. 60, pp. 81-92). Dordrecht, Netherlands: Springer; 2016.
[21] Headey B, Muffels R. & Wagner GG. National panel studies show substantial minorities recording long-term change in life satisfaction: implications for set point theory. In K. M. Sheldon & R. E. Lucas (Eds.), Stability of happiness: theories and evidence on whether happiness can change (pp. 99-126). New York: Elsevier; 2014.
[22] International wellbeing group. personal wellbeing index manual: 5th Edition; 2013. Retrieved from: http://www.acqol.com.au/ iwbg/wellbeing-index/index.php
[23] Cummins RA & Nistico H. Maintaining life satisfaction: the role of positive cognitive bias. Journal of Happiness Studies. 2002; 3(1): 37-69. [24] Hammond T, Weinberg MK & Cummins RA. The dyadic interaction of relationships and disability type on informal carer subjective well-being. Quality of Life Research. 2014; 23(5): 1535-1542.
[25] Tomyn AJ, Weinberg MK & Cummins RA. Intervention efficacy among ‘at risk’ adolescents: A test of subjective wellbeing homeostasis theory. Social Indicators Research. 2015; 120(3): 883-895. Retrieved from:doi:10.1007/s11205 -014-0619-5
The impacts of education or training programs are those that have the greatest impact on satis-faction domains, this was expected given the nature of these programs. Being a beneficiary or having someone in the family participating in education or training programs increase satis-faction with education in 0.23 units and satis-faction with work in 0.22. Furthermore, being part of a beneficiary household decreases finan-cial satisfaction by 0.28 units, which can be expected due to the present opportunity cost that people incur when educating themselves over their financial situation.
These results imply that public policy efforts must continue to ensure that social programs have a more comprehensive vision of individual well-being. Not only in terms of the variables which impact is estimated but in terms of program design. In addition, the importance of including subjective variables in policy evalua-tion is evidenced. This can allow gathering more evidence on whether social programs have impacts on this type of variables of their beneficiaries.
References
[1] Organization for Economic Cooperation and Development (OECD). OECD Guidelines on Measu-ring Subjective Well-being. OECD Publishing; 2013.
[2] Cummins R, Eckersley R, Pallant J, Vugt J and Misajon R. Developing a National Index of Subjective Wellbeing: The Australian Unity Wellbeing Index. Social Indicators Research. 2003; 64(2): 159-190.
[3] Alwin DF. Feeling Thermometers versus 7-point Scales: Which are better? Sociological Methods and Research. 1997; 25(3): 318-340.
[4] Kahneman D & Krueger A. Developments in the measurement of subjective well- being. Journal of Economic Perspectives. 2006; 20(21): 3-24.
[5] Imbens G & Wooldridge J. Recent developments in the econometrics of program evaluation. Journal of Economic Literature. 2009; 47(1): 5-86.
62
Castro, Puerta & Castañeda | CaliBRANDO
Quality of life in CroatiaPage 63 - 68

Ljiljana Kaliterna Ph.D. in PsychologyIvo Pilar Institute of Social SciencesZagreb, [email protected]
64
Ljiljana Kaliterna | CaliBRANDO
Croatia is a relatively small country in South-Eas-tern Europe with 57 thousand square km of a land, 31 thousand square km of coastal sea and 1246 islands. According to the 2011 Census, the Republic of Croatia has 4.3 million inhabitants. The capital is Zagreb with 790 thousand inhabi-tants. Recent Croatian history has been marked by three important political events: the fall of communism (the first free elections in 1990), the declaration of independence from Yugoslavia (1991), and the War of Independence, which started in 1991 and ended in 1995, when Croatia regained much of its occupied territories by military force. The war caused serious conse-quences in terms of human and material losses. The transitional problems together with war-re-lated problems contributed to a slower economic development in Croatia than in other post-com-munist countries. In July 2013 Croatia became the European Union member-state. Now Croatia is facing several challenges: recovery from economic crisis, demographic changes characte-rized by an aging society with a high proportion of elderly people, shrinking working-age popula-tion and relatively high unemployment rate.
Young people feel quite happy and
satisfied with their lives, while in the
middle thirties subjective well- being starts to be lower and
the lowest levels are noticed in older
generations, in people older than 65. This
pattern is typical for transition countries.
“
“Subjective well-being of Croatian population is not yet at the agenda of political debate, nor is it monitored officially. However, there are resear-chers who are working on a systematic monito-ring of quality of life and subjective well-being indices. There are two main sources of data from which we can conclude about overall well-being of the society: systematic monitoring of well-being through public-opinion surveys conducted by Ivo Pilar Institute of Social Scien-ces in Zagreb (named “Pilar’s Barometer of Croatian Society”), and the European Quality of Life Survey (EQLS) which covers 28 EU coun-tries. Institute of Social Sciences Ivo Pilar conducted seven surveys in years 2003, 2005, 2007, 2008, 2014, 2015 and 2016, on nationally representative samples of Croatian citizens. Depending on the year, sample sizes varied from N=900 to N=4000 participants. Data was gathered via face-to-face interviews in partici-pant’s home. By the similar methodology EQLS conducted three surveys with Croatia included: in 2007, 2012 and 2016. And additionally, there is a World Happiness Report which ranks world countries by their happiness levels every year since 2012. The World happiness report for 2017 ranked Croatia right in the middle of 155 world countries – at 77th position[1]. What are the main findings about the quality of life and subjective well-being of Croatian citizens? Systematically through the years subjective well-being levels (happiness and/or life satisfaction) are quite high, especially for the younger generations. Young people feel quite happy and satisfied with their lives, while in the middle thirties subjective well- being starts to be lower and the lowest levels are noticed in older generations, in people older than 65 years[2]. This pattern is typical for transition countries, while in more developed economies there is usually the U-shape relationship between age and subjective well-being, with younger and older people being happier than middle-aged people are. The most important reason for lower well-being in older generations is the relatively low income of
retired people. The average old age pension in Croatia is about 40% of the average salary[3].In that respect, older people together with unem-ployed and those with low education level can be considered as the most vulnerable social groups that are dependent on public goods provision.
65
Policy Brief Polis N° 19 | CaliBRANDO

When speaking about different life domains, people in Croatia are the most satisfied with their relationships with family and friends. In that respect, the society can be generally viewed as traditional one, with strong family ties. Family is perceived as the primary source of informal social support, especially practical support, but also emotional and financial one. Despite chan-ges in the traditional family structure, family, marriage and having children still dominate on the list of basic values of Croatian citizens, as shown by the European Values Study conducted in 2008. Besides satisfaction with family and friends, Croatian citizens through the years show the relatively high levels of satisfaction with their acceptance by the community and feelings of physical safety. Feeling of safety is one of the positive feature of Croatian society, as people in general feel quite safe in home, on the streets and in the public transport, even during the night[4].
According to the official crime statistics, Croatia is a relatively safe country and among the top 25% of countries in the world with the lowest recorded crime rates for specific crimes. The most unsatisfying life domain for Croatian citizens is their material status/standard of living. About 10% of population rate own mate-rial status as not satisfying at all since they cannot afford basic necessities. Among them there is a relatively high proportion of low educa-ted, unemployed and those older than 65. Overall trend of well-being from the year 2003 until today shows increase between 2003 and 2007, with sharp decrease in 2008 (when the economic crisis started) which continued until 2014 when we can observe again slight increase in the following years. These trends in subjective well-being can be linked partly to the objective circumstances (economic crisis) but also to perceived quality of society. Between the years 2008 and 2014 the general trust in public as well as political institutions was among the lowest in Europe. Croatian citizens expressed especially low levels of trust in justice (legal institutions), the national parliament, the government and the
press[3]. Average rates of trust in institutions, at both individual and country level, was found to be strongly associated with the perception of corruption, which was high at those years. Howe-ver, as the economic crisis ended we can observe increase in both objective and subjective indices of quality of life. Economic indicators for the country are improving in past two-three years and along with it also life satisfaction and happi-ness of Croatian citizens.
According to the data of the largest project on subjective well-being in Croatia (CRO-WELL: Croatian longitudinal survey of well-being; conducted by the Ivo Pilar Institute of Social Sciences and financed by the Croatian Science Foundation) the life satisfaction and happiness of Croatian citizens nowadays is relatively high, about point 7 on the scale 0 to 10, where 0 means the lowest and 10 means the highest possible life satisfaction and/or happiness. Besides general figures this project has also some other interes-ting data. It is designed to show how life circum-stances affect well-being. However, at this early stage of the project which started in 2015 we do not yet have full longitudinal data to have all the answers, but from the data that were collected until now (about 5000 participants followed once a year), we can have some idea about well-being and its correlates. For example, it is clear that people experience far more positive than negati-ve life events during the year. Among 69 diffe-rent life events in five domains (Family and relationships, Job and finances, Health, Leisure activities and Legal issues) that were offered to participants, they experienced over the year on average five positive and only two negative life events. Among most frequent life events were those from the domains of Family and relation- ships and Leisure activities, while the least frequent were Legal issues. We analyzed the frequency of occurrence of particular life events within each life domain. The most frequent event within the Family and relationships domain was “falling in love” while the least frequent was “death of the child”. In the Job and finances domain the most frequent event was
66
Ljiljana Kaliterna | CaliBRANDO
The monitoring of subjective well-being can provide valuable data. It feels good to
be happy, but we know from
numerous scientific evidence that happy
people tend to be successful across
multiple life domains and have more
positive work behavior.
“
““getting temporary job”, and the least “significant material or financial gain”. In Health domain the most frequent event was reported “health impro-vement”. In Leisure activities domain “going to summer or winter vacation” was the most frequent event. In Legal issues domain the most frequent was “took part in legal process” while “sexual abuse” was the least frequent event. Women experienced on average more positive and negative events during the year than men did. Interestingly they also rated positive events as more positive and negative events as more negative and additionally all events as more important than men did. This speaks in favor of women being more emotional and sensitive to life circumstances. As expected, younger people experienced more positive events than older ones, while there were no differences in occu-rrence of negative events in relation to age. Preli-minary analyses of relationships between expe-rienced life events and subsequent well-being a year later shows that frequent past positive events were associated with better life satisfac-tion, more positive and less negative emotions a year later. Frequency of past negative events was not significant predictor of well-being a year later. The findings highlight the positive long lasting impact of past positive events on compo-nents of well-being. Although at this early stage, this longitudinal survey is expected to bring interesting and important findings on relation- ships between life circumstances and well-being of Croatian citizens.
As for the general trends in quality of life of Croatian population, we expect general increase in different well-being indicators in the future, as the country is undergoing slow but stable econo-mic development. The monitoring of subjective well-being can provide valuable data. It feels good to be happy, but we know from numerous scientific evidence that happy people tend to be successful across multiple life domains and have more positive work behavior. In our recent analysis of representative samples of happy and unhappy Croatians we showed that happy people are more satisfied, of better subjective health,
67
Policy Brief Polis N° 19 | CaliBRANDO
report higher trust in people and institutions, and are more engaged in various activities and community life than the unhappy ones[5]. Subjec-tive well-being should therefore be seriously considered in policymaking, as an increase in individual well-being benefits society as a whole.
References:
[1] Eurofound. Trends in quality of life – Croa-tia: 2007–2012. Publications Office of the European Union, Luxembourg; 2014. [2] Franc R, Prizmić Larsen Z, Kaliterna Lipovčan L. Personal security and fear of crime as predictors of subjective well-being. In: Webb D. & Wills-Herre-ra (Eds) Subjective wellbeing and security. Dordre-cht, The Netherlands: Springer; 2011. p. 45-68.
[3] Helliwell J, Layard R & Sachs J. World happiness report 2017, New York: Sustainable Development Solutions Network; 2017.
[4] Kaliterna Lipovčan L, Burušić J. Age and gender differences in well-being in Croatia. In: Eckerman L (ed.) Gender, Lifespan and QOL: International Perspectives. Dordrecht, The Nether-lands: Springer; 2013. p. 199-219.
[5] Kaliterna Lipovcan L & Prizmic-Larsen Z. What differs between happy and unhappy people? SpringerPlus. 2016; 5(1):225. Retrieved from: doi 10.1186/s40064-016-1929-7
68
Ljiljana Kaliterna | CaliBRANDO
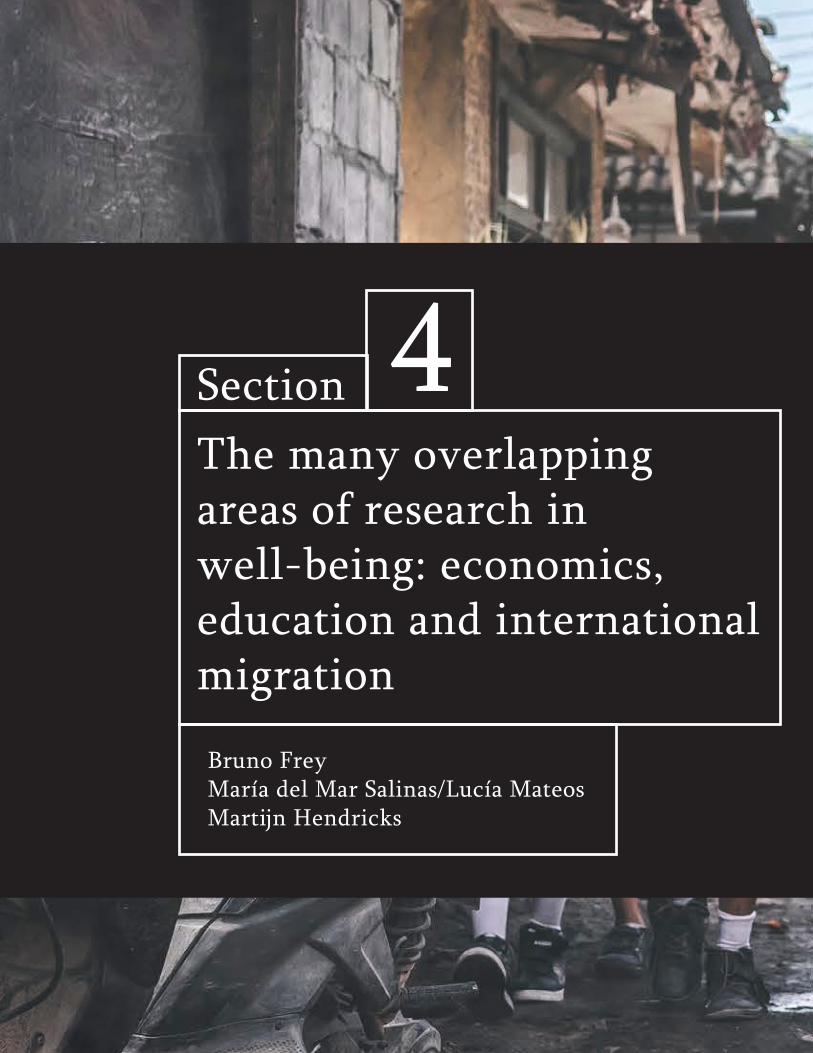
The many overlappingareas of research inwell-being: economics,education and internationalmigration
Section 4
Bruno Frey María del Mar Salinas/Lucía MateosMartijn Hendricks


Page 71 -76
Research on happinessand economics
72
Bruno S. Frey | CaliBRANDO
Research on happiness has recently become a hot topic in economics. For a long time, econo-mists were convinced that it is not possible to measure utility. Therefore they developed micro-economic theory avoiding measuring individual utilities by relying on “revealed preference”. This theory was quite successful in many respects. In particular, it enabled exten-ding economics to areas outside the narrow field of economics. Considerable insights were gained for instance with respect to politics, the natural environment, the family, or art and culture. Much of this successful extension is due to Becker[1,2,3]. This development was coined “economic imperialism” because it introduced economic concepts into other disci-plines and areas.
Essentially since the turn of the century, there has been cumulative research on well-being (or, more shortly happiness). This research has been inspired by social psychologists, i.e. economics has been an importer of concepts and methods from another discipline. Today, research on happiness is truly interdisciplinary. In contrast to previous scholarly research by philosophers, the modern research undertaken by economists and psychologists is strongly based on empirical data collected by careful surveys and analyzed by extensive econometric
Bruno S. Frey
Ph.D. in Economics University of Basel Zürich, [email protected]
Major results of happiness research
The econometric research on the determinants of well-being has reached challenging and important results. Many of them are in line with standard economic theory as conventionally taught at most universities all over the world. Among the best known results are:
• Individuals and households with higher income state to be happier – i.e. their subjective life satisfaction is higher – than those with lower income. There is a diminishing marginal effect of income on happiness. People rather quickly adapt to higher income, and they tend to compare themselves with people of higher income; this reduces their level of well-being because they consider themselves to be relatively less well-off.
• One of the most important factors for individual well-being are satisfactory personal relationships. Those persons having a good family life, friends and acquaintances are more satisfied with their lives than isolated persons.
• Good physical and psychic health are part of the most significant contributors to happiness. The inverse relationship also holds: happy persons are less affected by contagious diseases.
• To live in a democracy makes happy; individuals value the possibility to politically participate in a meaningful and effective way. People are also more satisfied with their lives if as many political decisions as possible are taken on a decentralized level.
These results are consistent with economic thinking. However, they do not necessarily correspond to what laypersons think and believe. For example, many think that people in poor developing nations are happier than those living in countries with higher average income, presumably they assume that they are under less economic pressure. The empirical research on happiness has demonstrated in a great number of
studies that this idea is mistaken. It greatly contributes to happiness if one lives in a rich country. Many people also believe that artists are unhappy because only then they can be productive and creative. Empirical happiness research also rejects this notion[11].
The econometrically based research on well-being has also produced results, which are not in line with standard economic theory. These are three examples:
• The unemployed are dramatically less happy than persons having a job. This result holds even when income is kept constant. Thus the reason why unemployed persons are much less happy is not (only) due to reduced income. This appears surprising to conventional economics. In that theory, work is considered a burden or a cost. People are assumed to work solely because of the pay they receive. Thus, to receive the same income but not having to work should raise well-being.
• The self-employed work more hours and on average have a lower income and higher risk than employees of firm or other organizations. Nevertheless, careful happiness studies reveal that the self-employed (ceteris paribus) are happier than those working as employees.
• According to standard economic theory more money and leisure always contribute to utility. Empirical studies on well-being suggest that the opposite also holds. Those giving money to other persons, or engaging in voluntary unpaid work are more satisfied with their lives than those persons giving less or nothing to others.
Ex post explanations
Once confronted with these results, modern economists are well equipped to provide ex post explanations. Such explanations made afterwards need to be clearly distinguished from predictions made before the empirical result has been reached. For the three results mentioned
before not in line with standard economic theory, the following perfectly reasonable explanations can be offered:
• The unemployed with equal income are less happy. This result can easily be explained by introducing ex post additional arguments in the utility function. When social relationships, reputation, recognition and self- esteem are relevant factors in individual utility functions, the unemployed are in a bad situation. They quickly lose social contacts because they lose their work environment, and they may even be ridiculed and disregarded by others. Above all they lose their self-esteem. These negative factors easily overshadow the possible advantages of getting income without having to work.
• The self-employed are happier. To explain this result one only needs to introduce the notion that people are risk loving. Those persons seeking independent work probably have a strong desire to take risks, and are therefore happy with working hard and long hours. The result may also be explained in a quite different way. People are prone to overestimate the chance of being successful in what they engage in. We therefore observe many persons in situations in which they are happy but thereafter fail. Introducing autonomy as a determinant can also serve to extend the utility function. Self-employed workers enjoy their autonomy and are therefore happier than those working in a hierarchical setting.
• Giving makes happy. This result can be explained by a desire to induce reciprocity by the persons receiving a gift. If such reciprocity is strong enough according to standard theory, it is rational to give. Even if this is not the case, the givers may raise their reputation in society. They therewith demonstrate that they are rich enough to afford to be generous. Such action may help them to increase their status in society.
The explanations offered make sense and can easily be introduced into economic theory. However, in each case additional assumptions
are required to reach such reasonable explanations. This procedure is perfectly all right as long as the additional explanations are not introduced ad hoc. If the extensions are introduced ad hoc, it is impossible to advance empirically testable hypotheses. But to be able to advance hypotheses, which can be wrong and therefore need to be tested empirically, is one of the most important foundations of any science. This notion shall be made clear with the example of the “happy self-employed”. Standard economics would predict that a person working harder and longer, having to bear higher risk, and moreover earning less has a lower utility than a person working less and earning more in a less risky occupation. Such a statement should only be made on the basis of a utility function, which always and from the beginning includes a desire for autonomy and risk. Such a utility function must be formulated before a prediction about a person’s utility level or happiness is made.
Conclusion
The advent of happiness research can in two respects be considered a happy occasion for economics.
Firstly, the modern interdisciplinary and strongly empirical happiness research clarifies the limits of standard economics. It directs attention to new aspects, which economic theory has little or not at all considered. Among them are for instance social relationships and particular political institutions with respect to political participation rights and decentralization. In addition, values such as recognition, autonomy or the benefits derived from fair procedures (procedural utility) are suggested as relevant arguments in the utility function. Standard economics is usefully generalized if such aspects and values are introduced as an integral part of a more encompassing theory. Research on happiness makes important contributions in this respect.
Secondly, the research on well-being provides crucial insights for economic and social policy
deviating from a fixation on Gross National Product. The digitalization of our world makes many activities free of charge; they are no longer done on markets. As a result GNP incompletely, or not at all, captures them. As recognition by other persons is an important motivator for human behavior, pay-for-performance becomes increasingly questionable as an incentive mechanism, and there are other possibilities – such as awards[12,13,14] – able to meet this desire. The research on happiness also calls attention to the relationship of psychic health on individual well-being[15,16]. In modern societies the concept of health has changed. While considerable progress was made with respect to supporting physical health, psychic problems become more relevant. Well-being research has emphasized the importance of these aspects for a long time.
References
[1] Becker GS. A theory of the allocation of time. The Economic Journal. 1965; 75(299):493-517. [2] Frey BS. Economics as a science of human behavior: towards a new social science paradigm. Boston/Dordrecht/London: Kluwer Academic Publishers; 1999.
[3] Frey BS. Inspiring economics: human motivation in political economy. Cheltenham, UK & Northampton, Mass.: Edward Elgar Publishing; 2001.
[4] Frey BS, Stutzer A. What can economists learn from happiness research? Journal of Economic Literature. 2002; 40(2): 402-435.
[5] Frey BS, Stutzer A. Happiness and economics: how the economy and institutions affect well-being. Princeton and Oxford: Princeton University Press; 2002.
[6] Frey BS, Stutzer A. Happiness research: state and prospects. review of social economy. 2005; 62(2): 207-28.
[7] Frey BS, Stutzer A. The use of happiness research for public policy. Social Choice and Welfare. 2012; 38(4): 659-674.
[8] Layard R. Happiness: lessons from a new science. London: Penguin; 2011.
[9] Dolan P, Peasgood T, White M. Do we really know what makes us happy? A review of the economic literature on the factors associated with subjective well-being. Journal of Economic Psychology. 2008; 29(1): 94-122.
[10] Frey BS. Happiness: a revolution in economics. Cambridge, MA: MIT Press; 2008.
[11] Steiner L. Artists are poor and thus unhappy. In: Frey BS, Iselin D. Economic Ideas You Should Forget. Cham: Springer; 2017. p. 135-136.
[12] Frey BS, Gallus J. Awards as non-monetary incentives. Evidence-based HRM: a Global Forum for Empirical Scholarship. 2016; 4(1): 81-91.
[13] Frey BS, Gallus J. Awards as strategic signals. Journal of Management Inquiry. 2017; 26(1): 76-85.
[14] Frey BS, Gallus J. Towards an economics of awards. Journal of Economic Surveys 2017; 31(1): 190–200.
[15] Layard R. A new priority for mental health. London: Centre for Economic Performance, London School of Economics; 2015. Paper No. EA036
[16] Layard R, Clark DM. Why more psychological therapy would cost nothing. Frontiers in Psychology. 2015; 6: 1713. Retrieved from: https://doi.org/10.3389/fpsyg.2015.01713.
estimates. The results gained are based on estimation equations simultaneously taking into account a large number of determinants relating to socio-demographic, economic, social, and political aspects.
The results reported in the following vary only one determinant at one time, i.e. they hold when all the other determinants are kept cons-tant (ceteris paribus).
Some of the insights gained are in line with general public opinion, but other insights are novel and surprising[4,5,6,7,8,9,10].
This research has been inspired by social psychologists, i.e. economics has been an importer of concepts and methods from another discipline. Today, research on happiness is truly interdisciplinary.
“
“
73
Policy Brief Polis N° 19 | CaliBRANDO
Major results of happiness research
The econometric research on the determinants of well-being has reached challenging and important results. Many of them are in line with standard economic theory as conventionally taught at most universities all over the world. Among the best known results are:
• Individuals and households with higher income state to be happier – i.e. their subjective life satisfaction is higher – than those with lower income. There is a diminishing marginal effect of income on happiness. People rather quickly adapt to higher income, and they tend to compare themselves with people of higher income; this reduces their level of well-being because they consider themselves to be relatively less well-off.
• One of the most important factors for individual well-being are satisfactory personal relationships. Those persons having a good family life, friends and acquaintances are more satisfied with their lives than isolated persons.
• Good physical and psychic health are part of the most significant contributors to happiness. The inverse relationship also holds: happy persons are less affected by contagious diseases.
• To live in a democracy makes happy; individuals value the possibility to politically participate in a meaningful and effective way. People are also more satisfied with their lives if as many political decisions as possible are taken on a decentralized level.
These results are consistent with economic thinking. However, they do not necessarily correspond to what laypersons think and believe. For example, many think that people in poor developing nations are happier than those living in countries with higher average income, presumably they assume that they are under less economic pressure. The empirical research on happiness has demonstrated in a great number of
studies that this idea is mistaken. It greatly contributes to happiness if one lives in a rich country. Many people also believe that artists are unhappy because only then they can be productive and creative. Empirical happiness research also rejects this notion[11].
The econometrically based research on well-being has also produced results, which are not in line with standard economic theory. These are three examples:
• The unemployed are dramatically less happy than persons having a job. This result holds even when income is kept constant. Thus the reason why unemployed persons are much less happy is not (only) due to reduced income. This appears surprising to conventional economics. In that theory, work is considered a burden or a cost. People are assumed to work solely because of the pay they receive. Thus, to receive the same income but not having to work should raise well-being.
• The self-employed work more hours and on average have a lower income and higher risk than employees of firm or other organizations. Nevertheless, careful happiness studies reveal that the self-employed (ceteris paribus) are happier than those working as employees.
• According to standard economic theory more money and leisure always contribute to utility. Empirical studies on well-being suggest that the opposite also holds. Those giving money to other persons, or engaging in voluntary unpaid work are more satisfied with their lives than those persons giving less or nothing to others.
Ex post explanations
Once confronted with these results, modern economists are well equipped to provide ex post explanations. Such explanations made afterwards need to be clearly distinguished from predictions made before the empirical result has been reached. For the three results mentioned
before not in line with standard economic theory, the following perfectly reasonable explanations can be offered:
• The unemployed with equal income are less happy. This result can easily be explained by introducing ex post additional arguments in the utility function. When social relationships, reputation, recognition and self- esteem are relevant factors in individual utility functions, the unemployed are in a bad situation. They quickly lose social contacts because they lose their work environment, and they may even be ridiculed and disregarded by others. Above all they lose their self-esteem. These negative factors easily overshadow the possible advantages of getting income without having to work.
• The self-employed are happier. To explain this result one only needs to introduce the notion that people are risk loving. Those persons seeking independent work probably have a strong desire to take risks, and are therefore happy with working hard and long hours. The result may also be explained in a quite different way. People are prone to overestimate the chance of being successful in what they engage in. We therefore observe many persons in situations in which they are happy but thereafter fail. Introducing autonomy as a determinant can also serve to extend the utility function. Self-employed workers enjoy their autonomy and are therefore happier than those working in a hierarchical setting.
• Giving makes happy. This result can be explained by a desire to induce reciprocity by the persons receiving a gift. If such reciprocity is strong enough according to standard theory, it is rational to give. Even if this is not the case, the givers may raise their reputation in society. They therewith demonstrate that they are rich enough to afford to be generous. Such action may help them to increase their status in society.
The explanations offered make sense and can easily be introduced into economic theory. However, in each case additional assumptions
are required to reach such reasonable explanations. This procedure is perfectly all right as long as the additional explanations are not introduced ad hoc. If the extensions are introduced ad hoc, it is impossible to advance empirically testable hypotheses. But to be able to advance hypotheses, which can be wrong and therefore need to be tested empirically, is one of the most important foundations of any science. This notion shall be made clear with the example of the “happy self-employed”. Standard economics would predict that a person working harder and longer, having to bear higher risk, and moreover earning less has a lower utility than a person working less and earning more in a less risky occupation. Such a statement should only be made on the basis of a utility function, which always and from the beginning includes a desire for autonomy and risk. Such a utility function must be formulated before a prediction about a person’s utility level or happiness is made.
Conclusion
The advent of happiness research can in two respects be considered a happy occasion for economics.
Firstly, the modern interdisciplinary and strongly empirical happiness research clarifies the limits of standard economics. It directs attention to new aspects, which economic theory has little or not at all considered. Among them are for instance social relationships and particular political institutions with respect to political participation rights and decentralization. In addition, values such as recognition, autonomy or the benefits derived from fair procedures (procedural utility) are suggested as relevant arguments in the utility function. Standard economics is usefully generalized if such aspects and values are introduced as an integral part of a more encompassing theory. Research on happiness makes important contributions in this respect.
Secondly, the research on well-being provides crucial insights for economic and social policy
deviating from a fixation on Gross National Product. The digitalization of our world makes many activities free of charge; they are no longer done on markets. As a result GNP incompletely, or not at all, captures them. As recognition by other persons is an important motivator for human behavior, pay-for-performance becomes increasingly questionable as an incentive mechanism, and there are other possibilities – such as awards[12,13,14] – able to meet this desire. The research on happiness also calls attention to the relationship of psychic health on individual well-being[15,16]. In modern societies the concept of health has changed. While considerable progress was made with respect to supporting physical health, psychic problems become more relevant. Well-being research has emphasized the importance of these aspects for a long time.
References
[1] Becker GS. A theory of the allocation of time. The Economic Journal. 1965; 75(299):493-517. [2] Frey BS. Economics as a science of human behavior: towards a new social science paradigm. Boston/Dordrecht/London: Kluwer Academic Publishers; 1999.
[3] Frey BS. Inspiring economics: human motivation in political economy. Cheltenham, UK & Northampton, Mass.: Edward Elgar Publishing; 2001.
[4] Frey BS, Stutzer A. What can economists learn from happiness research? Journal of Economic Literature. 2002; 40(2): 402-435.
[5] Frey BS, Stutzer A. Happiness and economics: how the economy and institutions affect well-being. Princeton and Oxford: Princeton University Press; 2002.
[6] Frey BS, Stutzer A. Happiness research: state and prospects. review of social economy. 2005; 62(2): 207-28.
[7] Frey BS, Stutzer A. The use of happiness research for public policy. Social Choice and Welfare. 2012; 38(4): 659-674.
[8] Layard R. Happiness: lessons from a new science. London: Penguin; 2011.
[9] Dolan P, Peasgood T, White M. Do we really know what makes us happy? A review of the economic literature on the factors associated with subjective well-being. Journal of Economic Psychology. 2008; 29(1): 94-122.
[10] Frey BS. Happiness: a revolution in economics. Cambridge, MA: MIT Press; 2008.
[11] Steiner L. Artists are poor and thus unhappy. In: Frey BS, Iselin D. Economic Ideas You Should Forget. Cham: Springer; 2017. p. 135-136.
[12] Frey BS, Gallus J. Awards as non-monetary incentives. Evidence-based HRM: a Global Forum for Empirical Scholarship. 2016; 4(1): 81-91.
[13] Frey BS, Gallus J. Awards as strategic signals. Journal of Management Inquiry. 2017; 26(1): 76-85.
[14] Frey BS, Gallus J. Towards an economics of awards. Journal of Economic Surveys 2017; 31(1): 190–200.
[15] Layard R. A new priority for mental health. London: Centre for Economic Performance, London School of Economics; 2015. Paper No. EA036
[16] Layard R, Clark DM. Why more psychological therapy would cost nothing. Frontiers in Psychology. 2015; 6: 1713. Retrieved from: https://doi.org/10.3389/fpsyg.2015.01713.
74
Bruno S. Frey | CaliBRANDO
Major results of happiness research
The econometric research on the determinants of well-being has reached challenging and important results. Many of them are in line with standard economic theory as conventionally taught at most universities all over the world. Among the best known results are:
• Individuals and households with higher income state to be happier – i.e. their subjective life satisfaction is higher – than those with lower income. There is a diminishing marginal effect of income on happiness. People rather quickly adapt to higher income, and they tend to compare themselves with people of higher income; this reduces their level of well-being because they consider themselves to be relatively less well-off.
• One of the most important factors for individual well-being are satisfactory personal relationships. Those persons having a good family life, friends and acquaintances are more satisfied with their lives than isolated persons.
• Good physical and psychic health are part of the most significant contributors to happiness. The inverse relationship also holds: happy persons are less affected by contagious diseases.
• To live in a democracy makes happy; individuals value the possibility to politically participate in a meaningful and effective way. People are also more satisfied with their lives if as many political decisions as possible are taken on a decentralized level.
These results are consistent with economic thinking. However, they do not necessarily correspond to what laypersons think and believe. For example, many think that people in poor developing nations are happier than those living in countries with higher average income, presumably they assume that they are under less economic pressure. The empirical research on happiness has demonstrated in a great number of
studies that this idea is mistaken. It greatly contributes to happiness if one lives in a rich country. Many people also believe that artists are unhappy because only then they can be productive and creative. Empirical happiness research also rejects this notion[11].
The econometrically based research on well-being has also produced results, which are not in line with standard economic theory. These are three examples:
• The unemployed are dramatically less happy than persons having a job. This result holds even when income is kept constant. Thus the reason why unemployed persons are much less happy is not (only) due to reduced income. This appears surprising to conventional economics. In that theory, work is considered a burden or a cost. People are assumed to work solely because of the pay they receive. Thus, to receive the same income but not having to work should raise well-being.
• The self-employed work more hours and on average have a lower income and higher risk than employees of firm or other organizations. Nevertheless, careful happiness studies reveal that the self-employed (ceteris paribus) are happier than those working as employees.
• According to standard economic theory more money and leisure always contribute to utility. Empirical studies on well-being suggest that the opposite also holds. Those giving money to other persons, or engaging in voluntary unpaid work are more satisfied with their lives than those persons giving less or nothing to others.
Ex post explanations
Once confronted with these results, modern economists are well equipped to provide ex post explanations. Such explanations made afterwards need to be clearly distinguished from predictions made before the empirical result has been reached. For the three results mentioned
before not in line with standard economic theory, the following perfectly reasonable explanations can be offered:
• The unemployed with equal income are less happy. This result can easily be explained by introducing ex post additional arguments in the utility function. When social relationships, reputation, recognition and self- esteem are relevant factors in individual utility functions, the unemployed are in a bad situation. They quickly lose social contacts because they lose their work environment, and they may even be ridiculed and disregarded by others. Above all they lose their self-esteem. These negative factors easily overshadow the possible advantages of getting income without having to work.
• The self-employed are happier. To explain this result one only needs to introduce the notion that people are risk loving. Those persons seeking independent work probably have a strong desire to take risks, and are therefore happy with working hard and long hours. The result may also be explained in a quite different way. People are prone to overestimate the chance of being successful in what they engage in. We therefore observe many persons in situations in which they are happy but thereafter fail. Introducing autonomy as a determinant can also serve to extend the utility function. Self-employed workers enjoy their autonomy and are therefore happier than those working in a hierarchical setting.
• Giving makes happy. This result can be explained by a desire to induce reciprocity by the persons receiving a gift. If such reciprocity is strong enough according to standard theory, it is rational to give. Even if this is not the case, the givers may raise their reputation in society. They therewith demonstrate that they are rich enough to afford to be generous. Such action may help them to increase their status in society.
The explanations offered make sense and can easily be introduced into economic theory. However, in each case additional assumptions
are required to reach such reasonable explanations. This procedure is perfectly all right as long as the additional explanations are not introduced ad hoc. If the extensions are introduced ad hoc, it is impossible to advance empirically testable hypotheses. But to be able to advance hypotheses, which can be wrong and therefore need to be tested empirically, is one of the most important foundations of any science. This notion shall be made clear with the example of the “happy self-employed”. Standard economics would predict that a person working harder and longer, having to bear higher risk, and moreover earning less has a lower utility than a person working less and earning more in a less risky occupation. Such a statement should only be made on the basis of a utility function, which always and from the beginning includes a desire for autonomy and risk. Such a utility function must be formulated before a prediction about a person’s utility level or happiness is made.
Conclusion
The advent of happiness research can in two respects be considered a happy occasion for economics.
Firstly, the modern interdisciplinary and strongly empirical happiness research clarifies the limits of standard economics. It directs attention to new aspects, which economic theory has little or not at all considered. Among them are for instance social relationships and particular political institutions with respect to political participation rights and decentralization. In addition, values such as recognition, autonomy or the benefits derived from fair procedures (procedural utility) are suggested as relevant arguments in the utility function. Standard economics is usefully generalized if such aspects and values are introduced as an integral part of a more encompassing theory. Research on happiness makes important contributions in this respect.
Secondly, the research on well-being provides crucial insights for economic and social policy
deviating from a fixation on Gross National Product. The digitalization of our world makes many activities free of charge; they are no longer done on markets. As a result GNP incompletely, or not at all, captures them. As recognition by other persons is an important motivator for human behavior, pay-for-performance becomes increasingly questionable as an incentive mechanism, and there are other possibilities – such as awards[12,13,14] – able to meet this desire. The research on happiness also calls attention to the relationship of psychic health on individual well-being[15,16]. In modern societies the concept of health has changed. While considerable progress was made with respect to supporting physical health, psychic problems become more relevant. Well-being research has emphasized the importance of these aspects for a long time.
References
[1] Becker GS. A theory of the allocation of time. The Economic Journal. 1965; 75(299):493-517. [2] Frey BS. Economics as a science of human behavior: towards a new social science paradigm. Boston/Dordrecht/London: Kluwer Academic Publishers; 1999.
[3] Frey BS. Inspiring economics: human motivation in political economy. Cheltenham, UK & Northampton, Mass.: Edward Elgar Publishing; 2001.
[4] Frey BS, Stutzer A. What can economists learn from happiness research? Journal of Economic Literature. 2002; 40(2): 402-435.
[5] Frey BS, Stutzer A. Happiness and economics: how the economy and institutions affect well-being. Princeton and Oxford: Princeton University Press; 2002.
[6] Frey BS, Stutzer A. Happiness research: state and prospects. review of social economy. 2005; 62(2): 207-28.
[7] Frey BS, Stutzer A. The use of happiness research for public policy. Social Choice and Welfare. 2012; 38(4): 659-674.
[8] Layard R. Happiness: lessons from a new science. London: Penguin; 2011.
[9] Dolan P, Peasgood T, White M. Do we really know what makes us happy? A review of the economic literature on the factors associated with subjective well-being. Journal of Economic Psychology. 2008; 29(1): 94-122.
[10] Frey BS. Happiness: a revolution in economics. Cambridge, MA: MIT Press; 2008.
[11] Steiner L. Artists are poor and thus unhappy. In: Frey BS, Iselin D. Economic Ideas You Should Forget. Cham: Springer; 2017. p. 135-136.
[12] Frey BS, Gallus J. Awards as non-monetary incentives. Evidence-based HRM: a Global Forum for Empirical Scholarship. 2016; 4(1): 81-91.
[13] Frey BS, Gallus J. Awards as strategic signals. Journal of Management Inquiry. 2017; 26(1): 76-85.
[14] Frey BS, Gallus J. Towards an economics of awards. Journal of Economic Surveys 2017; 31(1): 190–200.
[15] Layard R. A new priority for mental health. London: Centre for Economic Performance, London School of Economics; 2015. Paper No. EA036
[16] Layard R, Clark DM. Why more psychological therapy would cost nothing. Frontiers in Psychology. 2015; 6: 1713. Retrieved from: https://doi.org/10.3389/fpsyg.2015.01713.
In each case additional assumptions are required to reach such reasonable explanations. This procedure is perfectly all right as long as the additional explanations are not introduced ad hoc. If the extensions are introduced ad hoc, it is impossible to advance empirically testable hypotheses.
““
75
Policy Brief Polis N° 19 | CaliBRANDO

Major results of happiness research
The econometric research on the determinants of well-being has reached challenging and important results. Many of them are in line with standard economic theory as conventionally taught at most universities all over the world. Among the best known results are:
• Individuals and households with higher income state to be happier – i.e. their subjective life satisfaction is higher – than those with lower income. There is a diminishing marginal effect of income on happiness. People rather quickly adapt to higher income, and they tend to compare themselves with people of higher income; this reduces their level of well-being because they consider themselves to be relatively less well-off.
• One of the most important factors for individual well-being are satisfactory personal relationships. Those persons having a good family life, friends and acquaintances are more satisfied with their lives than isolated persons.
• Good physical and psychic health are part of the most significant contributors to happiness. The inverse relationship also holds: happy persons are less affected by contagious diseases.
• To live in a democracy makes happy; individuals value the possibility to politically participate in a meaningful and effective way. People are also more satisfied with their lives if as many political decisions as possible are taken on a decentralized level.
These results are consistent with economic thinking. However, they do not necessarily correspond to what laypersons think and believe. For example, many think that people in poor developing nations are happier than those living in countries with higher average income, presumably they assume that they are under less economic pressure. The empirical research on happiness has demonstrated in a great number of
studies that this idea is mistaken. It greatly contributes to happiness if one lives in a rich country. Many people also believe that artists are unhappy because only then they can be productive and creative. Empirical happiness research also rejects this notion[11].
The econometrically based research on well-being has also produced results, which are not in line with standard economic theory. These are three examples:
• The unemployed are dramatically less happy than persons having a job. This result holds even when income is kept constant. Thus the reason why unemployed persons are much less happy is not (only) due to reduced income. This appears surprising to conventional economics. In that theory, work is considered a burden or a cost. People are assumed to work solely because of the pay they receive. Thus, to receive the same income but not having to work should raise well-being.
• The self-employed work more hours and on average have a lower income and higher risk than employees of firm or other organizations. Nevertheless, careful happiness studies reveal that the self-employed (ceteris paribus) are happier than those working as employees.
• According to standard economic theory more money and leisure always contribute to utility. Empirical studies on well-being suggest that the opposite also holds. Those giving money to other persons, or engaging in voluntary unpaid work are more satisfied with their lives than those persons giving less or nothing to others.
Ex post explanations
Once confronted with these results, modern economists are well equipped to provide ex post explanations. Such explanations made afterwards need to be clearly distinguished from predictions made before the empirical result has been reached. For the three results mentioned
before not in line with standard economic theory, the following perfectly reasonable explanations can be offered:
• The unemployed with equal income are less happy. This result can easily be explained by introducing ex post additional arguments in the utility function. When social relationships, reputation, recognition and self- esteem are relevant factors in individual utility functions, the unemployed are in a bad situation. They quickly lose social contacts because they lose their work environment, and they may even be ridiculed and disregarded by others. Above all they lose their self-esteem. These negative factors easily overshadow the possible advantages of getting income without having to work.
• The self-employed are happier. To explain this result one only needs to introduce the notion that people are risk loving. Those persons seeking independent work probably have a strong desire to take risks, and are therefore happy with working hard and long hours. The result may also be explained in a quite different way. People are prone to overestimate the chance of being successful in what they engage in. We therefore observe many persons in situations in which they are happy but thereafter fail. Introducing autonomy as a determinant can also serve to extend the utility function. Self-employed workers enjoy their autonomy and are therefore happier than those working in a hierarchical setting.
• Giving makes happy. This result can be explained by a desire to induce reciprocity by the persons receiving a gift. If such reciprocity is strong enough according to standard theory, it is rational to give. Even if this is not the case, the givers may raise their reputation in society. They therewith demonstrate that they are rich enough to afford to be generous. Such action may help them to increase their status in society.
The explanations offered make sense and can easily be introduced into economic theory. However, in each case additional assumptions
are required to reach such reasonable explanations. This procedure is perfectly all right as long as the additional explanations are not introduced ad hoc. If the extensions are introduced ad hoc, it is impossible to advance empirically testable hypotheses. But to be able to advance hypotheses, which can be wrong and therefore need to be tested empirically, is one of the most important foundations of any science. This notion shall be made clear with the example of the “happy self-employed”. Standard economics would predict that a person working harder and longer, having to bear higher risk, and moreover earning less has a lower utility than a person working less and earning more in a less risky occupation. Such a statement should only be made on the basis of a utility function, which always and from the beginning includes a desire for autonomy and risk. Such a utility function must be formulated before a prediction about a person’s utility level or happiness is made.
Conclusion
The advent of happiness research can in two respects be considered a happy occasion for economics.
Firstly, the modern interdisciplinary and strongly empirical happiness research clarifies the limits of standard economics. It directs attention to new aspects, which economic theory has little or not at all considered. Among them are for instance social relationships and particular political institutions with respect to political participation rights and decentralization. In addition, values such as recognition, autonomy or the benefits derived from fair procedures (procedural utility) are suggested as relevant arguments in the utility function. Standard economics is usefully generalized if such aspects and values are introduced as an integral part of a more encompassing theory. Research on happiness makes important contributions in this respect.
Secondly, the research on well-being provides crucial insights for economic and social policy
deviating from a fixation on Gross National Product. The digitalization of our world makes many activities free of charge; they are no longer done on markets. As a result GNP incompletely, or not at all, captures them. As recognition by other persons is an important motivator for human behavior, pay-for-performance becomes increasingly questionable as an incentive mechanism, and there are other possibilities – such as awards[12,13,14] – able to meet this desire. The research on happiness also calls attention to the relationship of psychic health on individual well-being[15,16]. In modern societies the concept of health has changed. While considerable progress was made with respect to supporting physical health, psychic problems become more relevant. Well-being research has emphasized the importance of these aspects for a long time.
References
[1] Becker GS. A theory of the allocation of time. The Economic Journal. 1965; 75(299):493-517. [2] Frey BS. Economics as a science of human behavior: towards a new social science paradigm. Boston/Dordrecht/London: Kluwer Academic Publishers; 1999.
[3] Frey BS. Inspiring economics: human motivation in political economy. Cheltenham, UK & Northampton, Mass.: Edward Elgar Publishing; 2001.
[4] Frey BS, Stutzer A. What can economists learn from happiness research? Journal of Economic Literature. 2002; 40(2): 402-435.
[5] Frey BS, Stutzer A. Happiness and economics: how the economy and institutions affect well-being. Princeton and Oxford: Princeton University Press; 2002.
[6] Frey BS, Stutzer A. Happiness research: state and prospects. review of social economy. 2005; 62(2): 207-28.
[7] Frey BS, Stutzer A. The use of happiness research for public policy. Social Choice and Welfare. 2012; 38(4): 659-674.
[8] Layard R. Happiness: lessons from a new science. London: Penguin; 2011.
[9] Dolan P, Peasgood T, White M. Do we really know what makes us happy? A review of the economic literature on the factors associated with subjective well-being. Journal of Economic Psychology. 2008; 29(1): 94-122.
[10] Frey BS. Happiness: a revolution in economics. Cambridge, MA: MIT Press; 2008.
[11] Steiner L. Artists are poor and thus unhappy. In: Frey BS, Iselin D. Economic Ideas You Should Forget. Cham: Springer; 2017. p. 135-136.
[12] Frey BS, Gallus J. Awards as non-monetary incentives. Evidence-based HRM: a Global Forum for Empirical Scholarship. 2016; 4(1): 81-91.
[13] Frey BS, Gallus J. Awards as strategic signals. Journal of Management Inquiry. 2017; 26(1): 76-85.
[14] Frey BS, Gallus J. Towards an economics of awards. Journal of Economic Surveys 2017; 31(1): 190–200.
[15] Layard R. A new priority for mental health. London: Centre for Economic Performance, London School of Economics; 2015. Paper No. EA036
[16] Layard R, Clark DM. Why more psychological therapy would cost nothing. Frontiers in Psychology. 2015; 6: 1713. Retrieved from: https://doi.org/10.3389/fpsyg.2015.01713.
76
Bruno S. Frey | CaliBRANDO

Page 77 -82
Subjective well-being andeducation: a brief overviewof the literature
Introduction
In recent decades, the study of happiness or subjective wellbeing has gained interest in the economic literature, giving rise to the so-called "happiness economics". Most of this literature has focused on the relationship between income and subjective wellbeing, pointing to a significant positive effect of income on wellbeing. However, this relationship is not straightforward: on avera-ge, individuals with higher levels of income seem to enjoy greater satisfaction, although the levels of wellbeing do not tend to increase as a society becomes richer. This result was early pointed by Easterlin[1] and several explanations have been proposed to solve this paradox, most of them focusing on the role of relative income, income adaptation or rising income aspirations. In gene-ral, the empirical evidence shows the importance of relative income and social comparison[2,3] and several studies also suggest that individuals tend to adapt to their income, with greater adaption in terms of wellbeing when income increases[4]. In regard to aspirations, although they are difficult
to measure, some studies suggest that aspirations tend to grow with income, so that the positive effects on subjective well-being coming from a higher income could be offset by an increase in individual's aspirations[5]. Finally, some "collate-ral effects" of economic growth are sometimes emphasized, pointing to the negative effects that might come with higher levels of income, such as a worsening of social relations (relational goods), higher levels of stress, pollution or other environ-mental effects[6].
When studying the empirical relationship between income and wellbeing, it is usual to introduce some control variables related to diffe-rent individual and demographic characteristics and institutional and socio-cultural factors. Looking at the individual variables, there is a strong consensus on the positive effects of health on subjective wellbeing[7] or on the effects of age, with a U-shaped relationship showing that subjective wellbeing tends to be lower (once other variables are controlled for) in the middle age[8]. Evidence is also found supporting that married people, or people living with a partner, are more satisfied[9]. In contrast, a significant negative impact on individual wellbeing is found for being unemployed, this being so even when income effects are controlled for[10]. Furthermo-re, other individual variables such as the educa-tion level, the gender or having children show more ambiguous effects on wellbeing. Focusing on institutional and socio-cultural factors, subjective wellbeing also appears to differ across countries in ways that can be explained by diffe-rences in freedoms, social capital and trust[11]; moreover, the empirical evidence also suggests that social capital at the aggregate level has a positive effect on individual wellbeing, thus pointing to an external or environmental effect of social capital.[12]
Education and subjective wellbeing
The ambiguous effects of education on subjective wellbeing call for a closer look at this relationship. At first, education appears to be
significant and positively correlated with individual wellbeing in less developed countries[13],whereas this relationship tends to be weaker or even negative in countries with higher levels of per capita income[10]; this result suggests that the relationship between education and subjective wellbeing is non-linear. Moreover, even when a positive correlation between education and subjective wellbeing is found, this correlation tends to be reduced or to disappear when income and other occupational and social variables are controlled for[2], thus suggesting that the effects of education on individual wellbeing manifest in an indirect way through other variables such as health, labor participation, employment conditions, and particularly through income.
It is generally assumed, often implicitly, that income contributes to subjective wellbeing by allowing the individuals to satisfy their needs. However, higher levels of income do not necessarily translate into satisfaction since different types of consumption might contribute to individual wellbeing in different ways. Some theories emphasize the existence of a hierarchy related to the satisfaction of the individuals’ needs: starting from low levels of income, any income increase allows one to satisfy basic needs and increase individual satisfaction; however, when basic needs are satisfied, additional income increases do not guarantee per se the satisfaction of superior needs. In this line, Scitowsky[14] distinguished between comfort goods and stimulation goods. Comfort goods are subject to adaptation processes and are related to status or positional needs, and consequently their contribution to happiness is very fleeting. However, stimulation goods relate to the creativity of the individuals and have more lasting effects on wellbeing. Moreover, opposite to what happen with superfluous or luxury goods, stimulation or superior goods allow one to satisfy needs of self-realization. According to the self-determination theory[15], education can promote subjective wellbeing to the extent that it contributes to satisfying the psychological needs of relationship, autonomy, and competence, which could then be seen as intrinsic rewards to educational activities. However, the educational effort made by individuals could also respond to extrinsic rewards, mainly linked to income and returns coming from the labor market. In this sense, Scitovsky[16] emphasizes the cultural bias which appears in the individuals’ education in favor of production and skills demanded by the labor market at the expense of a liberal education oriented to the consumption of superior goods. The individuals dedicate greater time and effort to acquire specialized knowledge and skills oriented towards the production processes, without an education effort aimed to increase stimulus activities contributing to wellbeing. The expected rewards of education tend therefore to
be extrinsic, showing the role that it plays to get a better job, higher wages, or to attain a higher status; education would then be seen as a positional good[17]. When extrinsic rewards are at play, aspiration mechanisms will appear. Subjective wellbeing depends on the difference between real opportunities and perceived opportunities which shape individuals’ aspirations: higher opportunities can lead to greater wellbeing but they can also increase individuals’ aspirations and be a source of dissatisfaction. Education is among the variables that can explain both real opportunities and individuals’ aspirations since it offers greater opportunities for employment and income while its consideration as a positional good contributes to explain the formation of aspirations. Following Ferrante[18], the work and consumption opportunities and the individuals’ aspirations are determined both by the individuals’ abilities or skills and by external variables or environmental opportunities (i.e. institutional system, economic and labor market conditions, etc.). The effect of education on subjective wellbeing will at first be ambiguous: if real opportunities increase with education to a greater extent than aspirations, the effect of education on subjective wellbeing would be positive; on the other hand, if aspirations grow faster than real opportunities, the effect of education on individuals’ wellbeing would be negative. Although Ferrante's study focuses on a single country and get by without variables related to environmental opportunities, these ideas allow one to understand the different effects that education has on subjective wellbeing in countries with different levels of development. Thus, in more developed countries, where environmental opportunities are in principle more favorable, the socio-economic aspirations of the individuals tend to grow with education to a greater extent than real opportunities, which may be limited, for example, by an overqualified supply in the labor market or by mismatches between the education system and the labor market; in this
context, the empirical evidence suggests that over-qualification leads to lower perceived wellbeing[19]. On the other hand, in less developed countries, where environmental opportunities are more unfavorable (e.g. worse economic conditions and/or weaker institutions), education can in fact offer better real opportunities than those perceived by the individuals since the formation of aspirations tend to be weak, with a consequently positive
María del MarSalinas Jiménez
Ph.D. in EconomicsUniversidad de Extremadura Badajoz, [email protected]
Lucía MateosRomero
Ph.D. in EconomicsUniversidad de Extremadura Badajoz, [email protected]
Jiménez & Romero | CaliBRANDO
78
effect of education on subjective wellbeing.Conclusions
The empirical evidence suggests that education positively affects subjective wellbeing, though in an indirect manner and with a non-linear relationship. Education seems to affect subjective wellbeing through variables such as health, labor participation, employment conditions, and mainly through income. Education can enlarge the variety of goods that the individuals can enjoy, encouraging the consumption of stimulation goods and activities which contribute to the satisfaction of superior needs. However, two factors can limit this positive effect of education. On the one hand, economic development may deteriorate the process of production and consumption of superior goods, raising their price relative to comfort goods, which are progressively cheaper as a result of technical progress and standardization. On the other hand, from a certain educational level the education processes are oriented towards the acquisition of specialized knowledge and skills demanded by the labor market; this would explain that general education shows positive effects on subjective wellbeing whereas more specialized education (e.g. higher education) appears to be linked to external rewards and hardly leads to the satisfaction of superior needs. Finally, education can be seen as a positional good which allows one to get a better job, higher income or greater status. Education offers greater opportunities to individuals, but at the same time it will increase their aspirations. In addition to the individual’s education, the socio-economic context will condition real and perceived opportunities (i.e. aspirations), what allows one to understand the different effect of education on subjective wellbeing in countries with different levels of development, with this effect being weaker in more developed countries where perceived opportunities and aspirations might grow faster than real opportunities.
References
[1] Easterlin R. Does economic growth improve the human a lot? Some empirical evidence. In nations and households in economic growth: essays in honor of Moses Abramovitz. New York: Academic Press; 1974.
[2] Clark AE & Oswald AJ. Satisfaction and comparison income. Journal of Public Economics. 1966; 61: 359-381.
[3] Ferrer-i-Carbonell A. Income and well-being: an empirical analysis of the comparison income effect. Journal of Public Economics. 2005; 89: 997-1019.
[4] Burchardt T. Are one man’s rags another man’s riches? Identifying adaptive preferences using panel data. Social Indicators Research. 2005; 74: 57-102.
[5] Stutzer A. The role of income aspirations in individual happiness. Journal of Economic Behavior and Organization. 2004; 54: 89-109.
[6] Bartolini S & Bonatti L. Endogenous growth and negative externalities. Journal of Economics. 2003; 79(2):123-144.
[7] Blanchflower DG & Oswald AJ. International happiness: a new view on the measure of performance. The Academy of Management Perspectives. 2011; 25(1), 6-22.
[8] Easterlin R. Life cycle happiness and its sources. Intersections of psychology, economics and demography. Journal of Economic Psychology. 2006; 27: 463-482.
[9] Stutzer A & Frey BS. Does marriage make people happy, or do happy people get married? The Journal of Socio-Economics. 2006; 35(2): 326-347.
[10] Clark AE & Oswald AJ. Unhappiness and unemployment. Economic Journal, 1994; 14(424): 648-659.
[11] Helliwell JF & Putnam RD. The social context of well-being. Philosophical transactions-royal society of London series biological sciences. 2004; 359: 1435–1446.
[12] Portela M, Neira I & Salinas-Jiménez MM. Social capital and subjective wellbeing in Europe: a new approach on social capital. Social Indicators Research,
2013; 114: 493-511.[13] Argyle M. Causes and correlates of happiness. In Kahneman, Diener & Schwarz (eds.): Well-being: the foundations of hedonic psychology (153-373). New York: Russell Sage Foundation; 1999. [14] Scitovsky T. The joyless economy. Oxford: Oxford University Press; 1976.
[15] Ryan RM & Deci EL. Intrinsic and extrinsic motivations: classic definitions and new directions. Contemporary educational psychology. 2000; 25: 54-67.
[16] Scitovsky T. Human desires and economic satisfaction. Essays on the frontiers of economics. New York: New York University Press; 1986. [17] Hollis M. Education as a positional good. Journal of Philosophy of Education. 1982; 16(2): 235-244.
[18] Ferrante F. Education, aspirations and life satisfaction. Kyklos. 2009; 62(4): 542-562.
[19] Artés J, Salinas-Jiménez MM & Salinas-Jiménez J. Small fish in a big pond or big fish in a small pond? The effects of educational mismatch on subjective wellbeing. Social Indicators Research. 2014; 119(2): 771-789.

Introduction
In recent decades, the study of happiness or subjective wellbeing has gained interest in the economic literature, giving rise to the so-called "happiness economics". Most of this literature has focused on the relationship between income and subjective wellbeing, pointing to a significant positive effect of income on wellbeing. However, this relationship is not straightforward: on avera-ge, individuals with higher levels of income seem to enjoy greater satisfaction, although the levels of wellbeing do not tend to increase as a society becomes richer. This result was early pointed by Easterlin[1] and several explanations have been proposed to solve this paradox, most of them focusing on the role of relative income, income adaptation or rising income aspirations. In gene-ral, the empirical evidence shows the importance of relative income and social comparison[2,3] and several studies also suggest that individuals tend to adapt to their income, with greater adaption in terms of wellbeing when income increases[4]. In regard to aspirations, although they are difficult
to measure, some studies suggest that aspirations tend to grow with income, so that the positive effects on subjective well-being coming from a higher income could be offset by an increase in individual's aspirations[5]. Finally, some "collate-ral effects" of economic growth are sometimes emphasized, pointing to the negative effects that might come with higher levels of income, such as a worsening of social relations (relational goods), higher levels of stress, pollution or other environ-mental effects[6].
When studying the empirical relationship between income and wellbeing, it is usual to introduce some control variables related to diffe-rent individual and demographic characteristics and institutional and socio-cultural factors. Looking at the individual variables, there is a strong consensus on the positive effects of health on subjective wellbeing[7] or on the effects of age, with a U-shaped relationship showing that subjective wellbeing tends to be lower (once other variables are controlled for) in the middle age[8]. Evidence is also found supporting that married people, or people living with a partner, are more satisfied[9]. In contrast, a significant negative impact on individual wellbeing is found for being unemployed, this being so even when income effects are controlled for[10]. Furthermo-re, other individual variables such as the educa-tion level, the gender or having children show more ambiguous effects on wellbeing. Focusing on institutional and socio-cultural factors, subjective wellbeing also appears to differ across countries in ways that can be explained by diffe-rences in freedoms, social capital and trust[11]; moreover, the empirical evidence also suggests that social capital at the aggregate level has a positive effect on individual wellbeing, thus pointing to an external or environmental effect of social capital.[12]
Education and subjective wellbeing
The ambiguous effects of education on subjective wellbeing call for a closer look at this relationship. At first, education appears to be
significant and positively correlated with individual wellbeing in less developed countries[13],whereas this relationship tends to be weaker or even negative in countries with higher levels of per capita income[10]; this result suggests that the relationship between education and subjective wellbeing is non-linear. Moreover, even when a positive correlation between education and subjective wellbeing is found, this correlation tends to be reduced or to disappear when income and other occupational and social variables are controlled for[2], thus suggesting that the effects of education on individual wellbeing manifest in an indirect way through other variables such as health, labor participation, employment conditions, and particularly through income.
It is generally assumed, often implicitly, that income contributes to subjective wellbeing by allowing the individuals to satisfy their needs. However, higher levels of income do not necessarily translate into satisfaction since different types of consumption might contribute to individual wellbeing in different ways. Some theories emphasize the existence of a hierarchy related to the satisfaction of the individuals’ needs: starting from low levels of income, any income increase allows one to satisfy basic needs and increase individual satisfaction; however, when basic needs are satisfied, additional income increases do not guarantee per se the satisfaction of superior needs. In this line, Scitowsky[14] distinguished between comfort goods and stimulation goods. Comfort goods are subject to adaptation processes and are related to status or positional needs, and consequently their contribution to happiness is very fleeting. However, stimulation goods relate to the creativity of the individuals and have more lasting effects on wellbeing. Moreover, opposite to what happen with superfluous or luxury goods, stimulation or superior goods allow one to satisfy needs of self-realization. According to the self-determination theory[15], education can promote subjective wellbeing to the extent that it contributes to satisfying the psychological needs of relationship, autonomy, and competence, which could then be seen as intrinsic rewards to educational activities. However, the educational effort made by individuals could also respond to extrinsic rewards, mainly linked to income and returns coming from the labor market. In this sense, Scitovsky[16] emphasizes the cultural bias which appears in the individuals’ education in favor of production and skills demanded by the labor market at the expense of a liberal education oriented to the consumption of superior goods. The individuals dedicate greater time and effort to acquire specialized knowledge and skills oriented towards the production processes, without an education effort aimed to increase stimulus activities contributing to wellbeing. The expected rewards of education tend therefore to
be extrinsic, showing the role that it plays to get a better job, higher wages, or to attain a higher status; education would then be seen as a positional good[17]. When extrinsic rewards are at play, aspiration mechanisms will appear. Subjective wellbeing depends on the difference between real opportunities and perceived opportunities which shape individuals’ aspirations: higher opportunities can lead to greater wellbeing but they can also increase individuals’ aspirations and be a source of dissatisfaction. Education is among the variables that can explain both real opportunities and individuals’ aspirations since it offers greater opportunities for employment and income while its consideration as a positional good contributes to explain the formation of aspirations. Following Ferrante[18], the work and consumption opportunities and the individuals’ aspirations are determined both by the individuals’ abilities or skills and by external variables or environmental opportunities (i.e. institutional system, economic and labor market conditions, etc.). The effect of education on subjective wellbeing will at first be ambiguous: if real opportunities increase with education to a greater extent than aspirations, the effect of education on subjective wellbeing would be positive; on the other hand, if aspirations grow faster than real opportunities, the effect of education on individuals’ wellbeing would be negative. Although Ferrante's study focuses on a single country and get by without variables related to environmental opportunities, these ideas allow one to understand the different effects that education has on subjective wellbeing in countries with different levels of development. Thus, in more developed countries, where environmental opportunities are in principle more favorable, the socio-economic aspirations of the individuals tend to grow with education to a greater extent than real opportunities, which may be limited, for example, by an overqualified supply in the labor market or by mismatches between the education system and the labor market; in this
context, the empirical evidence suggests that over-qualification leads to lower perceived wellbeing[19]. On the other hand, in less developed countries, where environmental opportunities are more unfavorable (e.g. worse economic conditions and/or weaker institutions), education can in fact offer better real opportunities than those perceived by the individuals since the formation of aspirations tend to be weak, with a consequently positive
Education appears to be significant and
positively correlated with individual
wellbeing in less developed countries,
whereas this relationship tends to be
weaker or even negative in countries with higher levels of
per capita income.
“
“
79
Policy Brief Polis N° 19 | CaliBRANDO
effect of education on subjective wellbeing.Conclusions
The empirical evidence suggests that education positively affects subjective wellbeing, though in an indirect manner and with a non-linear relationship. Education seems to affect subjective wellbeing through variables such as health, labor participation, employment conditions, and mainly through income. Education can enlarge the variety of goods that the individuals can enjoy, encouraging the consumption of stimulation goods and activities which contribute to the satisfaction of superior needs. However, two factors can limit this positive effect of education. On the one hand, economic development may deteriorate the process of production and consumption of superior goods, raising their price relative to comfort goods, which are progressively cheaper as a result of technical progress and standardization. On the other hand, from a certain educational level the education processes are oriented towards the acquisition of specialized knowledge and skills demanded by the labor market; this would explain that general education shows positive effects on subjective wellbeing whereas more specialized education (e.g. higher education) appears to be linked to external rewards and hardly leads to the satisfaction of superior needs. Finally, education can be seen as a positional good which allows one to get a better job, higher income or greater status. Education offers greater opportunities to individuals, but at the same time it will increase their aspirations. In addition to the individual’s education, the socio-economic context will condition real and perceived opportunities (i.e. aspirations), what allows one to understand the different effect of education on subjective wellbeing in countries with different levels of development, with this effect being weaker in more developed countries where perceived opportunities and aspirations might grow faster than real opportunities.
References
[1] Easterlin R. Does economic growth improve the human a lot? Some empirical evidence. In nations and households in economic growth: essays in honor of Moses Abramovitz. New York: Academic Press; 1974.
[2] Clark AE & Oswald AJ. Satisfaction and comparison income. Journal of Public Economics. 1966; 61: 359-381.
[3] Ferrer-i-Carbonell A. Income and well-being: an empirical analysis of the comparison income effect. Journal of Public Economics. 2005; 89: 997-1019.
[4] Burchardt T. Are one man’s rags another man’s riches? Identifying adaptive preferences using panel data. Social Indicators Research. 2005; 74: 57-102.
[5] Stutzer A. The role of income aspirations in individual happiness. Journal of Economic Behavior and Organization. 2004; 54: 89-109.
[6] Bartolini S & Bonatti L. Endogenous growth and negative externalities. Journal of Economics. 2003; 79(2):123-144.
[7] Blanchflower DG & Oswald AJ. International happiness: a new view on the measure of performance. The Academy of Management Perspectives. 2011; 25(1), 6-22.
[8] Easterlin R. Life cycle happiness and its sources. Intersections of psychology, economics and demography. Journal of Economic Psychology. 2006; 27: 463-482.
[9] Stutzer A & Frey BS. Does marriage make people happy, or do happy people get married? The Journal of Socio-Economics. 2006; 35(2): 326-347.
[10] Clark AE & Oswald AJ. Unhappiness and unemployment. Economic Journal, 1994; 14(424): 648-659.
[11] Helliwell JF & Putnam RD. The social context of well-being. Philosophical transactions-royal society of London series biological sciences. 2004; 359: 1435–1446.
[12] Portela M, Neira I & Salinas-Jiménez MM. Social capital and subjective wellbeing in Europe: a new approach on social capital. Social Indicators Research,
2013; 114: 493-511.[13] Argyle M. Causes and correlates of happiness. In Kahneman, Diener & Schwarz (eds.): Well-being: the foundations of hedonic psychology (153-373). New York: Russell Sage Foundation; 1999. [14] Scitovsky T. The joyless economy. Oxford: Oxford University Press; 1976.
[15] Ryan RM & Deci EL. Intrinsic and extrinsic motivations: classic definitions and new directions. Contemporary educational psychology. 2000; 25: 54-67.
[16] Scitovsky T. Human desires and economic satisfaction. Essays on the frontiers of economics. New York: New York University Press; 1986. [17] Hollis M. Education as a positional good. Journal of Philosophy of Education. 1982; 16(2): 235-244.
[18] Ferrante F. Education, aspirations and life satisfaction. Kyklos. 2009; 62(4): 542-562.
[19] Artés J, Salinas-Jiménez MM & Salinas-Jiménez J. Small fish in a big pond or big fish in a small pond? The effects of educational mismatch on subjective wellbeing. Social Indicators Research. 2014; 119(2): 771-789.

Introduction
In recent decades, the study of happiness or subjective wellbeing has gained interest in the economic literature, giving rise to the so-called "happiness economics". Most of this literature has focused on the relationship between income and subjective wellbeing, pointing to a significant positive effect of income on wellbeing. However, this relationship is not straightforward: on avera-ge, individuals with higher levels of income seem to enjoy greater satisfaction, although the levels of wellbeing do not tend to increase as a society becomes richer. This result was early pointed by Easterlin[1] and several explanations have been proposed to solve this paradox, most of them focusing on the role of relative income, income adaptation or rising income aspirations. In gene-ral, the empirical evidence shows the importance of relative income and social comparison[2,3] and several studies also suggest that individuals tend to adapt to their income, with greater adaption in terms of wellbeing when income increases[4]. In regard to aspirations, although they are difficult
to measure, some studies suggest that aspirations tend to grow with income, so that the positive effects on subjective well-being coming from a higher income could be offset by an increase in individual's aspirations[5]. Finally, some "collate-ral effects" of economic growth are sometimes emphasized, pointing to the negative effects that might come with higher levels of income, such as a worsening of social relations (relational goods), higher levels of stress, pollution or other environ-mental effects[6].
When studying the empirical relationship between income and wellbeing, it is usual to introduce some control variables related to diffe-rent individual and demographic characteristics and institutional and socio-cultural factors. Looking at the individual variables, there is a strong consensus on the positive effects of health on subjective wellbeing[7] or on the effects of age, with a U-shaped relationship showing that subjective wellbeing tends to be lower (once other variables are controlled for) in the middle age[8]. Evidence is also found supporting that married people, or people living with a partner, are more satisfied[9]. In contrast, a significant negative impact on individual wellbeing is found for being unemployed, this being so even when income effects are controlled for[10]. Furthermo-re, other individual variables such as the educa-tion level, the gender or having children show more ambiguous effects on wellbeing. Focusing on institutional and socio-cultural factors, subjective wellbeing also appears to differ across countries in ways that can be explained by diffe-rences in freedoms, social capital and trust[11]; moreover, the empirical evidence also suggests that social capital at the aggregate level has a positive effect on individual wellbeing, thus pointing to an external or environmental effect of social capital.[12]
Education and subjective wellbeing
The ambiguous effects of education on subjective wellbeing call for a closer look at this relationship. At first, education appears to be
significant and positively correlated with individual wellbeing in less developed countries[13],whereas this relationship tends to be weaker or even negative in countries with higher levels of per capita income[10]; this result suggests that the relationship between education and subjective wellbeing is non-linear. Moreover, even when a positive correlation between education and subjective wellbeing is found, this correlation tends to be reduced or to disappear when income and other occupational and social variables are controlled for[2], thus suggesting that the effects of education on individual wellbeing manifest in an indirect way through other variables such as health, labor participation, employment conditions, and particularly through income.
It is generally assumed, often implicitly, that income contributes to subjective wellbeing by allowing the individuals to satisfy their needs. However, higher levels of income do not necessarily translate into satisfaction since different types of consumption might contribute to individual wellbeing in different ways. Some theories emphasize the existence of a hierarchy related to the satisfaction of the individuals’ needs: starting from low levels of income, any income increase allows one to satisfy basic needs and increase individual satisfaction; however, when basic needs are satisfied, additional income increases do not guarantee per se the satisfaction of superior needs. In this line, Scitowsky[14] distinguished between comfort goods and stimulation goods. Comfort goods are subject to adaptation processes and are related to status or positional needs, and consequently their contribution to happiness is very fleeting. However, stimulation goods relate to the creativity of the individuals and have more lasting effects on wellbeing. Moreover, opposite to what happen with superfluous or luxury goods, stimulation or superior goods allow one to satisfy needs of self-realization. According to the self-determination theory[15], education can promote subjective wellbeing to the extent that it contributes to satisfying the psychological needs of relationship, autonomy, and competence, which could then be seen as intrinsic rewards to educational activities. However, the educational effort made by individuals could also respond to extrinsic rewards, mainly linked to income and returns coming from the labor market. In this sense, Scitovsky[16] emphasizes the cultural bias which appears in the individuals’ education in favor of production and skills demanded by the labor market at the expense of a liberal education oriented to the consumption of superior goods. The individuals dedicate greater time and effort to acquire specialized knowledge and skills oriented towards the production processes, without an education effort aimed to increase stimulus activities contributing to wellbeing. The expected rewards of education tend therefore to
be extrinsic, showing the role that it plays to get a better job, higher wages, or to attain a higher status; education would then be seen as a positional good[17]. When extrinsic rewards are at play, aspiration mechanisms will appear. Subjective wellbeing depends on the difference between real opportunities and perceived opportunities which shape individuals’ aspirations: higher opportunities can lead to greater wellbeing but they can also increase individuals’ aspirations and be a source of dissatisfaction. Education is among the variables that can explain both real opportunities and individuals’ aspirations since it offers greater opportunities for employment and income while its consideration as a positional good contributes to explain the formation of aspirations. Following Ferrante[18], the work and consumption opportunities and the individuals’ aspirations are determined both by the individuals’ abilities or skills and by external variables or environmental opportunities (i.e. institutional system, economic and labor market conditions, etc.). The effect of education on subjective wellbeing will at first be ambiguous: if real opportunities increase with education to a greater extent than aspirations, the effect of education on subjective wellbeing would be positive; on the other hand, if aspirations grow faster than real opportunities, the effect of education on individuals’ wellbeing would be negative. Although Ferrante's study focuses on a single country and get by without variables related to environmental opportunities, these ideas allow one to understand the different effects that education has on subjective wellbeing in countries with different levels of development. Thus, in more developed countries, where environmental opportunities are in principle more favorable, the socio-economic aspirations of the individuals tend to grow with education to a greater extent than real opportunities, which may be limited, for example, by an overqualified supply in the labor market or by mismatches between the education system and the labor market; in this
context, the empirical evidence suggests that over-qualification leads to lower perceived wellbeing[19]. On the other hand, in less developed countries, where environmental opportunities are more unfavorable (e.g. worse economic conditions and/or weaker institutions), education can in fact offer better real opportunities than those perceived by the individuals since the formation of aspirations tend to be weak, with a consequently positive
Jiménez & Romero | CaliBRANDO
80
effect of education on subjective wellbeing.Conclusions
The empirical evidence suggests that education positively affects subjective wellbeing, though in an indirect manner and with a non-linear relationship. Education seems to affect subjective wellbeing through variables such as health, labor participation, employment conditions, and mainly through income. Education can enlarge the variety of goods that the individuals can enjoy, encouraging the consumption of stimulation goods and activities which contribute to the satisfaction of superior needs. However, two factors can limit this positive effect of education. On the one hand, economic development may deteriorate the process of production and consumption of superior goods, raising their price relative to comfort goods, which are progressively cheaper as a result of technical progress and standardization. On the other hand, from a certain educational level the education processes are oriented towards the acquisition of specialized knowledge and skills demanded by the labor market; this would explain that general education shows positive effects on subjective wellbeing whereas more specialized education (e.g. higher education) appears to be linked to external rewards and hardly leads to the satisfaction of superior needs. Finally, education can be seen as a positional good which allows one to get a better job, higher income or greater status. Education offers greater opportunities to individuals, but at the same time it will increase their aspirations. In addition to the individual’s education, the socio-economic context will condition real and perceived opportunities (i.e. aspirations), what allows one to understand the different effect of education on subjective wellbeing in countries with different levels of development, with this effect being weaker in more developed countries where perceived opportunities and aspirations might grow faster than real opportunities.
References
[1] Easterlin R. Does economic growth improve the human a lot? Some empirical evidence. In nations and households in economic growth: essays in honor of Moses Abramovitz. New York: Academic Press; 1974.
[2] Clark AE & Oswald AJ. Satisfaction and comparison income. Journal of Public Economics. 1966; 61: 359-381.
[3] Ferrer-i-Carbonell A. Income and well-being: an empirical analysis of the comparison income effect. Journal of Public Economics. 2005; 89: 997-1019.
[4] Burchardt T. Are one man’s rags another man’s riches? Identifying adaptive preferences using panel data. Social Indicators Research. 2005; 74: 57-102.
[5] Stutzer A. The role of income aspirations in individual happiness. Journal of Economic Behavior and Organization. 2004; 54: 89-109.
[6] Bartolini S & Bonatti L. Endogenous growth and negative externalities. Journal of Economics. 2003; 79(2):123-144.
[7] Blanchflower DG & Oswald AJ. International happiness: a new view on the measure of performance. The Academy of Management Perspectives. 2011; 25(1), 6-22.
[8] Easterlin R. Life cycle happiness and its sources. Intersections of psychology, economics and demography. Journal of Economic Psychology. 2006; 27: 463-482.
[9] Stutzer A & Frey BS. Does marriage make people happy, or do happy people get married? The Journal of Socio-Economics. 2006; 35(2): 326-347.
[10] Clark AE & Oswald AJ. Unhappiness and unemployment. Economic Journal, 1994; 14(424): 648-659.
[11] Helliwell JF & Putnam RD. The social context of well-being. Philosophical transactions-royal society of London series biological sciences. 2004; 359: 1435–1446.
[12] Portela M, Neira I & Salinas-Jiménez MM. Social capital and subjective wellbeing in Europe: a new approach on social capital. Social Indicators Research,
2013; 114: 493-511.[13] Argyle M. Causes and correlates of happiness. In Kahneman, Diener & Schwarz (eds.): Well-being: the foundations of hedonic psychology (153-373). New York: Russell Sage Foundation; 1999. [14] Scitovsky T. The joyless economy. Oxford: Oxford University Press; 1976.
[15] Ryan RM & Deci EL. Intrinsic and extrinsic motivations: classic definitions and new directions. Contemporary educational psychology. 2000; 25: 54-67.
[16] Scitovsky T. Human desires and economic satisfaction. Essays on the frontiers of economics. New York: New York University Press; 1986. [17] Hollis M. Education as a positional good. Journal of Philosophy of Education. 1982; 16(2): 235-244.
[18] Ferrante F. Education, aspirations and life satisfaction. Kyklos. 2009; 62(4): 542-562.
[19] Artés J, Salinas-Jiménez MM & Salinas-Jiménez J. Small fish in a big pond or big fish in a small pond? The effects of educational mismatch on subjective wellbeing. Social Indicators Research. 2014; 119(2): 771-789.

Introduction
In recent decades, the study of happiness or subjective wellbeing has gained interest in the economic literature, giving rise to the so-called "happiness economics". Most of this literature has focused on the relationship between income and subjective wellbeing, pointing to a significant positive effect of income on wellbeing. However, this relationship is not straightforward: on avera-ge, individuals with higher levels of income seem to enjoy greater satisfaction, although the levels of wellbeing do not tend to increase as a society becomes richer. This result was early pointed by Easterlin[1] and several explanations have been proposed to solve this paradox, most of them focusing on the role of relative income, income adaptation or rising income aspirations. In gene-ral, the empirical evidence shows the importance of relative income and social comparison[2,3] and several studies also suggest that individuals tend to adapt to their income, with greater adaption in terms of wellbeing when income increases[4]. In regard to aspirations, although they are difficult
to measure, some studies suggest that aspirations tend to grow with income, so that the positive effects on subjective well-being coming from a higher income could be offset by an increase in individual's aspirations[5]. Finally, some "collate-ral effects" of economic growth are sometimes emphasized, pointing to the negative effects that might come with higher levels of income, such as a worsening of social relations (relational goods), higher levels of stress, pollution or other environ-mental effects[6].
When studying the empirical relationship between income and wellbeing, it is usual to introduce some control variables related to diffe-rent individual and demographic characteristics and institutional and socio-cultural factors. Looking at the individual variables, there is a strong consensus on the positive effects of health on subjective wellbeing[7] or on the effects of age, with a U-shaped relationship showing that subjective wellbeing tends to be lower (once other variables are controlled for) in the middle age[8]. Evidence is also found supporting that married people, or people living with a partner, are more satisfied[9]. In contrast, a significant negative impact on individual wellbeing is found for being unemployed, this being so even when income effects are controlled for[10]. Furthermo-re, other individual variables such as the educa-tion level, the gender or having children show more ambiguous effects on wellbeing. Focusing on institutional and socio-cultural factors, subjective wellbeing also appears to differ across countries in ways that can be explained by diffe-rences in freedoms, social capital and trust[11]; moreover, the empirical evidence also suggests that social capital at the aggregate level has a positive effect on individual wellbeing, thus pointing to an external or environmental effect of social capital.[12]
Education and subjective wellbeing
The ambiguous effects of education on subjective wellbeing call for a closer look at this relationship. At first, education appears to be
significant and positively correlated with individual wellbeing in less developed countries[13],whereas this relationship tends to be weaker or even negative in countries with higher levels of per capita income[10]; this result suggests that the relationship between education and subjective wellbeing is non-linear. Moreover, even when a positive correlation between education and subjective wellbeing is found, this correlation tends to be reduced or to disappear when income and other occupational and social variables are controlled for[2], thus suggesting that the effects of education on individual wellbeing manifest in an indirect way through other variables such as health, labor participation, employment conditions, and particularly through income.
It is generally assumed, often implicitly, that income contributes to subjective wellbeing by allowing the individuals to satisfy their needs. However, higher levels of income do not necessarily translate into satisfaction since different types of consumption might contribute to individual wellbeing in different ways. Some theories emphasize the existence of a hierarchy related to the satisfaction of the individuals’ needs: starting from low levels of income, any income increase allows one to satisfy basic needs and increase individual satisfaction; however, when basic needs are satisfied, additional income increases do not guarantee per se the satisfaction of superior needs. In this line, Scitowsky[14] distinguished between comfort goods and stimulation goods. Comfort goods are subject to adaptation processes and are related to status or positional needs, and consequently their contribution to happiness is very fleeting. However, stimulation goods relate to the creativity of the individuals and have more lasting effects on wellbeing. Moreover, opposite to what happen with superfluous or luxury goods, stimulation or superior goods allow one to satisfy needs of self-realization. According to the self-determination theory[15], education can promote subjective wellbeing to the extent that it contributes to satisfying the psychological needs of relationship, autonomy, and competence, which could then be seen as intrinsic rewards to educational activities. However, the educational effort made by individuals could also respond to extrinsic rewards, mainly linked to income and returns coming from the labor market. In this sense, Scitovsky[16] emphasizes the cultural bias which appears in the individuals’ education in favor of production and skills demanded by the labor market at the expense of a liberal education oriented to the consumption of superior goods. The individuals dedicate greater time and effort to acquire specialized knowledge and skills oriented towards the production processes, without an education effort aimed to increase stimulus activities contributing to wellbeing. The expected rewards of education tend therefore to
be extrinsic, showing the role that it plays to get a better job, higher wages, or to attain a higher status; education would then be seen as a positional good[17]. When extrinsic rewards are at play, aspiration mechanisms will appear. Subjective wellbeing depends on the difference between real opportunities and perceived opportunities which shape individuals’ aspirations: higher opportunities can lead to greater wellbeing but they can also increase individuals’ aspirations and be a source of dissatisfaction. Education is among the variables that can explain both real opportunities and individuals’ aspirations since it offers greater opportunities for employment and income while its consideration as a positional good contributes to explain the formation of aspirations. Following Ferrante[18], the work and consumption opportunities and the individuals’ aspirations are determined both by the individuals’ abilities or skills and by external variables or environmental opportunities (i.e. institutional system, economic and labor market conditions, etc.). The effect of education on subjective wellbeing will at first be ambiguous: if real opportunities increase with education to a greater extent than aspirations, the effect of education on subjective wellbeing would be positive; on the other hand, if aspirations grow faster than real opportunities, the effect of education on individuals’ wellbeing would be negative. Although Ferrante's study focuses on a single country and get by without variables related to environmental opportunities, these ideas allow one to understand the different effects that education has on subjective wellbeing in countries with different levels of development. Thus, in more developed countries, where environmental opportunities are in principle more favorable, the socio-economic aspirations of the individuals tend to grow with education to a greater extent than real opportunities, which may be limited, for example, by an overqualified supply in the labor market or by mismatches between the education system and the labor market; in this
context, the empirical evidence suggests that over-qualification leads to lower perceived wellbeing[19]. On the other hand, in less developed countries, where environmental opportunities are more unfavorable (e.g. worse economic conditions and/or weaker institutions), education can in fact offer better real opportunities than those perceived by the individuals since the formation of aspirations tend to be weak, with a consequently positive
“
“
The individuals dedicate greater time and effort to acquire specialized knowledge and skills oriented towards the production processes, without an education effort aimed to increase stimulus activities contributing to wellbeing.
81
Policy Brief Polis N° 19 | CaliBRANDO
effect of education on subjective wellbeing.Conclusions
The empirical evidence suggests that education positively affects subjective wellbeing, though in an indirect manner and with a non-linear relationship. Education seems to affect subjective wellbeing through variables such as health, labor participation, employment conditions, and mainly through income. Education can enlarge the variety of goods that the individuals can enjoy, encouraging the consumption of stimulation goods and activities which contribute to the satisfaction of superior needs. However, two factors can limit this positive effect of education. On the one hand, economic development may deteriorate the process of production and consumption of superior goods, raising their price relative to comfort goods, which are progressively cheaper as a result of technical progress and standardization. On the other hand, from a certain educational level the education processes are oriented towards the acquisition of specialized knowledge and skills demanded by the labor market; this would explain that general education shows positive effects on subjective wellbeing whereas more specialized education (e.g. higher education) appears to be linked to external rewards and hardly leads to the satisfaction of superior needs. Finally, education can be seen as a positional good which allows one to get a better job, higher income or greater status. Education offers greater opportunities to individuals, but at the same time it will increase their aspirations. In addition to the individual’s education, the socio-economic context will condition real and perceived opportunities (i.e. aspirations), what allows one to understand the different effect of education on subjective wellbeing in countries with different levels of development, with this effect being weaker in more developed countries where perceived opportunities and aspirations might grow faster than real opportunities.
References
[1] Easterlin R. Does economic growth improve the human a lot? Some empirical evidence. In nations and households in economic growth: essays in honor of Moses Abramovitz. New York: Academic Press; 1974.
[2] Clark AE & Oswald AJ. Satisfaction and comparison income. Journal of Public Economics. 1966; 61: 359-381.
[3] Ferrer-i-Carbonell A. Income and well-being: an empirical analysis of the comparison income effect. Journal of Public Economics. 2005; 89: 997-1019.
[4] Burchardt T. Are one man’s rags another man’s riches? Identifying adaptive preferences using panel data. Social Indicators Research. 2005; 74: 57-102.
[5] Stutzer A. The role of income aspirations in individual happiness. Journal of Economic Behavior and Organization. 2004; 54: 89-109.
[6] Bartolini S & Bonatti L. Endogenous growth and negative externalities. Journal of Economics. 2003; 79(2):123-144.
[7] Blanchflower DG & Oswald AJ. International happiness: a new view on the measure of performance. The Academy of Management Perspectives. 2011; 25(1), 6-22.
[8] Easterlin R. Life cycle happiness and its sources. Intersections of psychology, economics and demography. Journal of Economic Psychology. 2006; 27: 463-482.
[9] Stutzer A & Frey BS. Does marriage make people happy, or do happy people get married? The Journal of Socio-Economics. 2006; 35(2): 326-347.
[10] Clark AE & Oswald AJ. Unhappiness and unemployment. Economic Journal, 1994; 14(424): 648-659.
[11] Helliwell JF & Putnam RD. The social context of well-being. Philosophical transactions-royal society of London series biological sciences. 2004; 359: 1435–1446.
[12] Portela M, Neira I & Salinas-Jiménez MM. Social capital and subjective wellbeing in Europe: a new approach on social capital. Social Indicators Research,
2013; 114: 493-511.[13] Argyle M. Causes and correlates of happiness. In Kahneman, Diener & Schwarz (eds.): Well-being: the foundations of hedonic psychology (153-373). New York: Russell Sage Foundation; 1999. [14] Scitovsky T. The joyless economy. Oxford: Oxford University Press; 1976.
[15] Ryan RM & Deci EL. Intrinsic and extrinsic motivations: classic definitions and new directions. Contemporary educational psychology. 2000; 25: 54-67.
[16] Scitovsky T. Human desires and economic satisfaction. Essays on the frontiers of economics. New York: New York University Press; 1986. [17] Hollis M. Education as a positional good. Journal of Philosophy of Education. 1982; 16(2): 235-244.
[18] Ferrante F. Education, aspirations and life satisfaction. Kyklos. 2009; 62(4): 542-562.
[19] Artés J, Salinas-Jiménez MM & Salinas-Jiménez J. Small fish in a big pond or big fish in a small pond? The effects of educational mismatch on subjective wellbeing. Social Indicators Research. 2014; 119(2): 771-789.

Introduction
In recent decades, the study of happiness or subjective wellbeing has gained interest in the economic literature, giving rise to the so-called "happiness economics". Most of this literature has focused on the relationship between income and subjective wellbeing, pointing to a significant positive effect of income on wellbeing. However, this relationship is not straightforward: on avera-ge, individuals with higher levels of income seem to enjoy greater satisfaction, although the levels of wellbeing do not tend to increase as a society becomes richer. This result was early pointed by Easterlin[1] and several explanations have been proposed to solve this paradox, most of them focusing on the role of relative income, income adaptation or rising income aspirations. In gene-ral, the empirical evidence shows the importance of relative income and social comparison[2,3] and several studies also suggest that individuals tend to adapt to their income, with greater adaption in terms of wellbeing when income increases[4]. In regard to aspirations, although they are difficult
to measure, some studies suggest that aspirations tend to grow with income, so that the positive effects on subjective well-being coming from a higher income could be offset by an increase in individual's aspirations[5]. Finally, some "collate-ral effects" of economic growth are sometimes emphasized, pointing to the negative effects that might come with higher levels of income, such as a worsening of social relations (relational goods), higher levels of stress, pollution or other environ-mental effects[6].
When studying the empirical relationship between income and wellbeing, it is usual to introduce some control variables related to diffe-rent individual and demographic characteristics and institutional and socio-cultural factors. Looking at the individual variables, there is a strong consensus on the positive effects of health on subjective wellbeing[7] or on the effects of age, with a U-shaped relationship showing that subjective wellbeing tends to be lower (once other variables are controlled for) in the middle age[8]. Evidence is also found supporting that married people, or people living with a partner, are more satisfied[9]. In contrast, a significant negative impact on individual wellbeing is found for being unemployed, this being so even when income effects are controlled for[10]. Furthermo-re, other individual variables such as the educa-tion level, the gender or having children show more ambiguous effects on wellbeing. Focusing on institutional and socio-cultural factors, subjective wellbeing also appears to differ across countries in ways that can be explained by diffe-rences in freedoms, social capital and trust[11]; moreover, the empirical evidence also suggests that social capital at the aggregate level has a positive effect on individual wellbeing, thus pointing to an external or environmental effect of social capital.[12]
Education and subjective wellbeing
The ambiguous effects of education on subjective wellbeing call for a closer look at this relationship. At first, education appears to be
significant and positively correlated with individual wellbeing in less developed countries[13],whereas this relationship tends to be weaker or even negative in countries with higher levels of per capita income[10]; this result suggests that the relationship between education and subjective wellbeing is non-linear. Moreover, even when a positive correlation between education and subjective wellbeing is found, this correlation tends to be reduced or to disappear when income and other occupational and social variables are controlled for[2], thus suggesting that the effects of education on individual wellbeing manifest in an indirect way through other variables such as health, labor participation, employment conditions, and particularly through income.
It is generally assumed, often implicitly, that income contributes to subjective wellbeing by allowing the individuals to satisfy their needs. However, higher levels of income do not necessarily translate into satisfaction since different types of consumption might contribute to individual wellbeing in different ways. Some theories emphasize the existence of a hierarchy related to the satisfaction of the individuals’ needs: starting from low levels of income, any income increase allows one to satisfy basic needs and increase individual satisfaction; however, when basic needs are satisfied, additional income increases do not guarantee per se the satisfaction of superior needs. In this line, Scitowsky[14] distinguished between comfort goods and stimulation goods. Comfort goods are subject to adaptation processes and are related to status or positional needs, and consequently their contribution to happiness is very fleeting. However, stimulation goods relate to the creativity of the individuals and have more lasting effects on wellbeing. Moreover, opposite to what happen with superfluous or luxury goods, stimulation or superior goods allow one to satisfy needs of self-realization. According to the self-determination theory[15], education can promote subjective wellbeing to the extent that it contributes to satisfying the psychological needs of relationship, autonomy, and competence, which could then be seen as intrinsic rewards to educational activities. However, the educational effort made by individuals could also respond to extrinsic rewards, mainly linked to income and returns coming from the labor market. In this sense, Scitovsky[16] emphasizes the cultural bias which appears in the individuals’ education in favor of production and skills demanded by the labor market at the expense of a liberal education oriented to the consumption of superior goods. The individuals dedicate greater time and effort to acquire specialized knowledge and skills oriented towards the production processes, without an education effort aimed to increase stimulus activities contributing to wellbeing. The expected rewards of education tend therefore to
be extrinsic, showing the role that it plays to get a better job, higher wages, or to attain a higher status; education would then be seen as a positional good[17]. When extrinsic rewards are at play, aspiration mechanisms will appear. Subjective wellbeing depends on the difference between real opportunities and perceived opportunities which shape individuals’ aspirations: higher opportunities can lead to greater wellbeing but they can also increase individuals’ aspirations and be a source of dissatisfaction. Education is among the variables that can explain both real opportunities and individuals’ aspirations since it offers greater opportunities for employment and income while its consideration as a positional good contributes to explain the formation of aspirations. Following Ferrante[18], the work and consumption opportunities and the individuals’ aspirations are determined both by the individuals’ abilities or skills and by external variables or environmental opportunities (i.e. institutional system, economic and labor market conditions, etc.). The effect of education on subjective wellbeing will at first be ambiguous: if real opportunities increase with education to a greater extent than aspirations, the effect of education on subjective wellbeing would be positive; on the other hand, if aspirations grow faster than real opportunities, the effect of education on individuals’ wellbeing would be negative. Although Ferrante's study focuses on a single country and get by without variables related to environmental opportunities, these ideas allow one to understand the different effects that education has on subjective wellbeing in countries with different levels of development. Thus, in more developed countries, where environmental opportunities are in principle more favorable, the socio-economic aspirations of the individuals tend to grow with education to a greater extent than real opportunities, which may be limited, for example, by an overqualified supply in the labor market or by mismatches between the education system and the labor market; in this
context, the empirical evidence suggests that over-qualification leads to lower perceived wellbeing[19]. On the other hand, in less developed countries, where environmental opportunities are more unfavorable (e.g. worse economic conditions and/or weaker institutions), education can in fact offer better real opportunities than those perceived by the individuals since the formation of aspirations tend to be weak, with a consequently positive
Jiménez & Romero | CaliBRANDO
82
effect of education on subjective wellbeing.Conclusions
The empirical evidence suggests that education positively affects subjective wellbeing, though in an indirect manner and with a non-linear relationship. Education seems to affect subjective wellbeing through variables such as health, labor participation, employment conditions, and mainly through income. Education can enlarge the variety of goods that the individuals can enjoy, encouraging the consumption of stimulation goods and activities which contribute to the satisfaction of superior needs. However, two factors can limit this positive effect of education. On the one hand, economic development may deteriorate the process of production and consumption of superior goods, raising their price relative to comfort goods, which are progressively cheaper as a result of technical progress and standardization. On the other hand, from a certain educational level the education processes are oriented towards the acquisition of specialized knowledge and skills demanded by the labor market; this would explain that general education shows positive effects on subjective wellbeing whereas more specialized education (e.g. higher education) appears to be linked to external rewards and hardly leads to the satisfaction of superior needs. Finally, education can be seen as a positional good which allows one to get a better job, higher income or greater status. Education offers greater opportunities to individuals, but at the same time it will increase their aspirations. In addition to the individual’s education, the socio-economic context will condition real and perceived opportunities (i.e. aspirations), what allows one to understand the different effect of education on subjective wellbeing in countries with different levels of development, with this effect being weaker in more developed countries where perceived opportunities and aspirations might grow faster than real opportunities.
References
[1] Easterlin R. Does economic growth improve the human a lot? Some empirical evidence. In nations and households in economic growth: essays in honor of Moses Abramovitz. New York: Academic Press; 1974.
[2] Clark AE & Oswald AJ. Satisfaction and comparison income. Journal of Public Economics. 1966; 61: 359-381.
[3] Ferrer-i-Carbonell A. Income and well-being: an empirical analysis of the comparison income effect. Journal of Public Economics. 2005; 89: 997-1019.
[4] Burchardt T. Are one man’s rags another man’s riches? Identifying adaptive preferences using panel data. Social Indicators Research. 2005; 74: 57-102.
[5] Stutzer A. The role of income aspirations in individual happiness. Journal of Economic Behavior and Organization. 2004; 54: 89-109.
[6] Bartolini S & Bonatti L. Endogenous growth and negative externalities. Journal of Economics. 2003; 79(2):123-144.
[7] Blanchflower DG & Oswald AJ. International happiness: a new view on the measure of performance. The Academy of Management Perspectives. 2011; 25(1), 6-22.
[8] Easterlin R. Life cycle happiness and its sources. Intersections of psychology, economics and demography. Journal of Economic Psychology. 2006; 27: 463-482.
[9] Stutzer A & Frey BS. Does marriage make people happy, or do happy people get married? The Journal of Socio-Economics. 2006; 35(2): 326-347.
[10] Clark AE & Oswald AJ. Unhappiness and unemployment. Economic Journal, 1994; 14(424): 648-659.
[11] Helliwell JF & Putnam RD. The social context of well-being. Philosophical transactions-royal society of London series biological sciences. 2004; 359: 1435–1446.
[12] Portela M, Neira I & Salinas-Jiménez MM. Social capital and subjective wellbeing in Europe: a new approach on social capital. Social Indicators Research,
2013; 114: 493-511.[13] Argyle M. Causes and correlates of happiness. In Kahneman, Diener & Schwarz (eds.): Well-being: the foundations of hedonic psychology (153-373). New York: Russell Sage Foundation; 1999. [14] Scitovsky T. The joyless economy. Oxford: Oxford University Press; 1976.
[15] Ryan RM & Deci EL. Intrinsic and extrinsic motivations: classic definitions and new directions. Contemporary educational psychology. 2000; 25: 54-67.
[16] Scitovsky T. Human desires and economic satisfaction. Essays on the frontiers of economics. New York: New York University Press; 1986. [17] Hollis M. Education as a positional good. Journal of Philosophy of Education. 1982; 16(2): 235-244.
[18] Ferrante F. Education, aspirations and life satisfaction. Kyklos. 2009; 62(4): 542-562.
[19] Artés J, Salinas-Jiménez MM & Salinas-Jiménez J. Small fish in a big pond or big fish in a small pond? The effects of educational mismatch on subjective wellbeing. Social Indicators Research. 2014; 119(2): 771-789.

Happiness consequences ofinternational migration Page 83 - 88
People consider the location in which they lead their lives to be a fundamental determinant of their quality of life and believe they have a better chance of a good life in some locations than in others. For example, a myriad of Vene-zuelans have taken major risks to live in Colom-bia, some even via illegal methods. In turn, countless Colombians have moved to other countries, such as the United States, in search of a better life. Altogether, approximately 250 million people (3.4% of the world’s population) are currently living in a country other than that in which they were born, and this number is expected to grow to more than 400 million by 2050[1]. Migration is not only potentially bene-ficial to immigrants; many countries also need immigrants, at least to some extent[2]. For instance, highly skilled immigrants bring specialized knowledge, while low-skilled immi-grants may do jobs the native population of Western countries does not want to do. Human migration is thus one of the most promising tools for reaching greater happiness for a grea-ter number of people across the globe.
Martijn Hendriks
Researcher in EconomicsErasmus University RotterdamRotterdam, [email protected]
84
Martijn Hendriks | CaliBRANDO
34
Notwithstanding the popularity and potential advantages of migration, there are deep concerns about the consequences of migration, for both immigrants and host societies alike. In many host societies, polarization and xenophobia are on the rise, with Brexit, the election of Trump, and the further rise of populist parties in Europe as prominent examples. The literature on immigra-tion also emphasizes many negative experiences from the immigrant perspective, including stories about unsuccessful assimilation[3], immigrant exploitation, and human trafficking[4]. Accordin-gly, human migration is under great pressure, and humanity seems to be a long way from maximi-zing the benefits of migration, for both immi-grants and host societies. Given the omnipresen-ce of migration and the concerns with migration, making more out of human migration is one of the biggest challenges we face in our globalizing world. To improve the benefits of migration, it is necessary to develop an understanding about whether and under what conditions migration is beneficial. To this end, this article summarizes the current body of knowledge on the happiness consequences of migration and its determinants. The article closes with policy recommendations.
Happiness consequences for various stakeholders
International migrants typically achieve substan-tial happiness gains when migrating to a more developed country[5,6]. In contrast, negative happiness outcomes are generally observed for people moving to a less developed country[5,7]. However, there are many exceptions to these general patterns. For instance, non-positive (and even negative) happiness outcomes have been observed for various immigrant streams to more developed countries, such as for Tongans moving to New Zealand[8] and for certain groups of Eastern Europeans moving to Western Europe[9]. Hence, the majority of immigrants become happier through migration, but a significant proportion of immigrants do not, even though they voluntarily chose to migrate. These negative happiness outcomes raise the question why such immigrants moved in the first place.
The ‘New Economics of (Labour) Migration’ theory[10] posits that migration is a family decision, so perhaps such immigrants move to improve the happiness of family members left behind in the home country via remittances. However, two small-scale studies observe non-positive happiness outcomes among families remaining in Ecuador and Bolivia, as the negative consequences of family separation outweigh the economic welfare gains from remittances[11,12]. Alternatively, straight-line assimilation theory[13] suggests that migration is an investment that only pays off in the long run and/or for one’s (future) children. However, empirical research shows that immigrants do not become happier over time during their stay in the host country, and the second generation is not happier than their immigrant parents[14]. The above considerations
International migrants typically achieve
substantial happiness gains when migrating
to a more developed country. In contrast,
negative happiness outcomes are generally
observed for people moving to a less
developed country.
“
“
85
Policy Brief Polis N° 19 | CaliBRANDO
suggest that a great many voluntary immigrants had excessive expectations about the benefits of migration. This explanation for negative migration outcomes is plausible for two reasons. First, prospective immigrants typically face much uncertainty about the consequences of migration because they have never lived in or travelled to the intended destination country. Second, prospective immigrants typically receive overly positive information from immigrants in the destination country who are reluctant to reveal their disappointing outcomes to people in their home country[15]. The following quote (posted in the Ellis Island Museum) from an anonymous Italian immigrant in the early 1900s has become emblematic of the way misinformation can result in disillusionment:
“I came to America because I heard the streets were paved with gold. When I got here, I found out three things: First, the streets weren’t paved with gold; second, they weren’t paved at all: and third, I was expected to pave them.”
Despite concerns in many host societies about the negative impact of immigrants on society, initial evidence from various European countries suggests that immigration in general has a positive—though marginal—impact on the well-being of the native population. Based on the above considerations, it can be tentatively concluded that human migration contributes to greater happiness for most immigrants and most host societies. Yet, most researchers and policy makers concur that the world is a long way from reaching the full potential of international migration in improving human happiness. A major reason for this is low societal investments in immigrant well-being caused by the prevalent political and societal view that investing in immigrant well-being comes at the cost of natives, particularly because it may lead to larger immigrant inflows and less public money allocated to ‘natives’. However, happiness literature suggests that immigrant happiness is a potentially fruitful way to improve the benefits of immigration for the host society, because high happiness levels generally bring many social, economic, and health benefits, possibly ranging from greater productivity of immigrant workers to reduced social tensions and polarization in society. Accordingly, migration policies that contribute to immigrant happiness are likely to create a win-win situation for both immigrants and host societies. Some important determinants of immigrant happiness
Economic gain is typically an important argument in the immigration decisions of voluntary immi-grants, who are therefore often called “economic migrants”. However, immigrants’ happiness is only weakly related to their individual incomes and the broader macroeconomic environment. These
“
“
The finding that current migration policies do not contribute to immigrant happiness reinforces the frequently expressed belief that current integration polices are ineffective.
86
Martijn Hendriks | CaliBRANDO

observations concur with broader notions in the happiness literature that suggest people tend to overestimate the role of economic factors in their own happiness. Economic migrants may thus be mistaken in believing that improving their finan-cial situation via migration will be an effective path to a happier life.
Two other findings from Hendriks and Bartram[16] concerning the role of the host country’s macro environment for happiness are alarming as well. First, the strong association they identify between immigrants’ happiness and attitudes towards immigrants in host countries makes the growing polarization and social tension between immigrants and natives particularly worrisome. Second, the finding that current migration policies do not contribute to immigrant happiness reinforces the frequently expressed belief that current integration polices are ineffective.
Happiness does not only depend on one’s objective living conditions; a person’s happiness depends strongly on the extent to which a person’s reality (objective living conditions) differs from his or her aspirations (what one expects from life). This ‘relative’ component of happiness is not only vital in explaining the weak relationship between economic conditions and happiness but can also explain why immigrants do not become happier with increased length of stay in the host country despite their objectively improving life (e.g., the rebuilding of a career and social network in the host society). That is, immigrants’ happiness is impaired by their gradual development of less positive perceptions about the host country’s economic, political, and social conditions. Faltering enthusiasm about the host society follows from a shifting frame of reference (increasing aspirations), meaning that immigrants from less developed countries gradually evaluate the societal conditions in the host country through a more critical lens because they grow accustomed to these typically better conditions and compare those conditions less to the inferior conditions in their country of origin. These findings suggest that
prospective immigrants who consider moving to a more developed country must consider that they will adapt to some extent to the better conditions in the host country and that their subjective gains (feelings of happiness) will lag behind their objective gains. Another issue that immigrants must be aware of is that their preferences shift after migration. For instance, people who move to escape economic deprivation base their expectations about well-being outcomes—and hence their migration decision—mostly on the satisfaction of economic needs. After migration, however, their main concerns typically come to include social factors such as social exclusion, cultural/identity issues, and status, especially when they reach their economic goals. Consequently, economic migrants may not be happier after migration despite obtaining their economic goals in the host country, because, for instance, the social costs of migration (e.g., loneliness) increasingly hurt their happiness.
Some policy recommendations
• The generally positive happiness consequences of migration for both immigrants and host societies imply that more lenient national admission policies could potentially provide a major opportunity to improve happiness across the globe.
• There is, nevertheless, a significant group of immigrants who do not become happier (or even become unhappier) through migration. Prospective immigrants could benefit from support in developing realistic expectations of migration to avoid such negative outcomes. For instance, policy makers could work closely together with immigrant communities to communicate information to immigrants about life in the host country.
• The observations that immigrants do not become happier with increased length of stay in the host country and that current integration
87
Policy Brief Polis N° 19 | CaliBRANDO

policies do not contribute to immigrant happiness signal the inefficiency of current integration policies and emphasize the need for the development of a new integration framework containing the features of integration policy that are important for immigrant happiness.
• Insights regarding the determinants of immigrant happiness help identify the most fruitful domains to target for policies designed to foster immigrant happiness. For instance, empirical evidence that hostility towards immigrants in the host country strongly impairs immigrants’ happiness emphasizes the need for policies aimed at improving attitudes towards immigrants and social cohesion between immigrants and natives.
References
[1] UN (United Nations), Department of Economic and Social Affairs. Trends in international migrant stock: migrants by destination and origin; 2015. (United Nations database, POP/DB/MIG/Stock/Rev.2015)
[2] Legrain P. Immigrants: your country needs them. Princeton, NJ: Princeton University Press; 2014.
[3] Portes A & Zhou M. The new second generation: segmented assimilation and its variants. The ANNALS of the American academy of political and social science. 1993; 530(1): 74-96.
[4] International Organization for Migration (IOM). The other migrant crisis - protecting migrant workers against exploitation in the middle east and north Africa. Geneva: IOM; 2015.
[5] International Organization for Migration (IOM). World migration report 2013: migrant well-being and development. Geneva: IOM; 2013.
[6] Hendriks M. The happiness of international migrants: a review of research findings. Migration Studies. 2015; 3(3): 343-369.
[7] Bartram D. Inverting the logic of economic migration: happiness among migrants moving from wealthier to poorer countries in Europe. Journal of Happiness Studies. 2015; 16(5): 1211-1230.
[8] Stillman S, Gibson J, McKenzie J & Rohorua J. Miserable migrants? Natural experiment evidence on international migration and objective and subjective well-being. World Development. 2015; 65: 79-93.
[9] Bartram D. Happiness and “economic migration”: a comparison of eastern European migrants and stayers. Migration Studies. 2013; 1(2): 156-175.
[10] Stark O & Bloom DE. The new economics of labour migration. American Economic Review. 1985; 75(2): 173-178.
[11] Borraz F, Pozo S & Rossi M. And what about the family back home? International migration and happiness in Cuenca, Ecuador. Journal of Business Strategies. 2010; 27(1): 7-27.
[12] Jones RC. Migration and family happiness in Bolivia: does social disintegration negate economic well‐being? International Migration. 2014; 52(3): 177-193.
[13] Alba R & Nee V. Rethinking assimilation theory for a new era of immigration. International Migration Review. 1997; 31(4): 826-874.
[14] Hendriks M, Burger M & De Vroome T. Unsuccessful subjective well-being assimilation among immigrants: The role ofzz shifting reference points and faltering perceptions of the host society; 2017. Working paper.
[15] Mahler SJ. American dreaming: Immigrant life on the margins. Princeton, NJ: Princeton University Press; 1995.
[16] Hendriks M & Bartram D. Macro-conditions and immigrants' happiness: is moving to a wealthy country all that matters? Social Science Research. 2016; 56: 90-107.
88
Martijn Hendriks | CaliBRANDO

89
Policy Brief N° 19 | CaliBRANDO
POLIS´ team thank to all invited authors for their time and outstanding contributions. We hope to count with you in future editions of this policy brief.
CaliBRANDO would not be possible without the dedicated, rigorous and passionate work of POLIS´ young researchers and academic assis-tants. Thanks to Marianella Ortiz, Daniela Estra-da, Isabella Franco, Natalia Serna, Sebastián Estrada, María Isabel Zafra and Hernán Duarte for their contribution in the conceptualization and permanent improvement of CaliBRANDO.
Laura Pineda, Juan Daniel Bustamante, Isabella Valencia, Camila Reyes, Marcela Ulloa, Diana Oquendo, Juan Tello, Danny Bello, Valeria Trofi-moff and Olmedo Varela, have been pivotal in the continuous implementation of this project. Our appreciation to Sandra Moreno for her work in the design of this policy brief.
We thank Universidad Icesi for providing the time and resources to conduct this project. CaliBRANDO is completely financed with academic funding.
Ackowledgements

Visítenos en:www.icesi.edu.co/polis
Polisicesi
Cerca del 64% de los caleños sienten que su ciudad no es segura. Buena parte de esta percepción puede estar explicada por la ocurrencia de actos delictivos efectivos en el municipio (13%). Sin embargo, las personas también atribuyen su percepción de inseguridad a otros factores como la ausencia de la fuerza pública (26%), la información en los medios de comunicación (14%) y la existencia de espacios públicos inseguros (12%).
En 2017, el Observatorio de Políticas Públicas – POLIS – de la Universidad Icesi realizó un estudio sobre el crimen urbano y sus implicaciones económicas en Cali, cuyo propósito fue capturar las distorsiones de los costos asumidos o dispuestos a asumir por los individuos como consecuencia de la inseguridad en la ciudad. Los hallazgos más importantes de la investigación son:
CRIMEN URBANO: ¿PERCEPCIÓN O REALIDAD?
BOLETÍN ONLINE
Policy Brief


POLIS is a research center dedicated at understanding and improving the quality of life in the Colombian Pacific region. We conduct applied research in urban, social and educational
issues to provide evidence to help policy makers to make better informed decisions.
Lina Martínez
Director Public Policy Observatory POLISUniversidad IcesiPh.D in Public Policiy, Maryland University
Maria Isabel Zafra
Young ResearcherEconomist - San Buenaventura UniversityMaster student in Economics - Universidad Icesi
Valeria Trofimoff Young ResearcherStudent of EconomicsUniversidad Icesi
Sandra Moreno
DesignerInteractive media designerUniversidad Icesi
Isabella Valencia
Research Assistant Student of Economics Universidad Icesi
Olmedo Varela
Research Assistant Student of Economics Universidad Icesi
WORKING GROUP
Francisco Piedrahita Plata. Rector, Universidad IcesiHéctor Ochoa. Dean of Facultad de Ciencias Administrativas y Económicas of Universidad Icesi
-Images were taken from: www.pexels.com/; www.pixebay.com
Send us your suggestions - Phone number: 5552334 ext 8400 - E-mail address: [email protected] view expressed in this policy brief only commit the authors not the entities involved.