Embed Size (px)
Citation preview
1
Life ScienceWorksheet
GRADE LEVEL: Eight
Topic: Cells
Grade Level Standard: 8-1 Apply an understanding of cells to the functions of
multicellular organisms.
Grade Level Benchmark: 1. Demonstrate evidence that all parts of living things
are made up of cells. (III.1.MS.1)
Learning Activity(s)/Facts/Information
Central Question:What are cells?
1. Compare and contrast cell structure and processes.
2. “Looking At Yeast Cells” - Note how rapidly yeast cellsincrease in number.
3. “Cellebration”
Activity is attached
Resources
Saginaw/Midland CountyScience Curriculum pages1483-1490.
Process Skills:
New Vocabulary: plants, animals, tissues, organs, organ system, paramecium,
elodea leaf cells, onion skin cells, human cheek cells

2
LOOKING AT YEAST CELLS
OBJECTIVEStudents will identify the basic functions of a cell.
SCIENCE PROCESSESObservingMeasuringCommunicating
TEACHER SUGGESTIONSIntroduction of cell division and growth. Experiment may be extended for severallessons.
DESCRIPTIONLooking at yeast cells and observing their growth.
GROUP SIZEDependent on number of microscopes
EQUIPMENT AND MATERIALSCovered glass container (quart jars)MicroscopesSlides and cover slides1/4 teaspoon yeast, powdered-dryEye droppers1 pint warm waterTable sugar
PROCEDUREAt least 12 hours before class, make up the following two solutions:
Mixture # 11/4 teaspoon powdered yeast1 pint warm water
1. Place mixture in a quart jar with a cover and let stand until dissolved.2. Mix thoroughly each time before using.3. Mixture should last one week, then a new solution should be made.
3
Mixture # 21 cup water1 tablespoon table sugar1 tablespoon mixture # 1 (yeast and water)
1. Place in a jar and mix.2. Cover loosely.3. Allow to stand for 12 hours so that the yeast cells will begin to divide.
NOTE: At the start the yeast cells will divide rapidly in this mixture, but will stopdividing about four days later.
EVALUATIONDiscussion of questions on the following pages. These pages are to be duplicatedfor the students.
ADDITIONAL RESOURCEA Resource Book for the Biological Science, Harcourt, Brace, and World, Inc.
TAKEN FROMScience in a Sack
4
LOOKING AT YEAST CELLS
Make a slide using a small drop of yeast and table sugar mixture and a cover slip.
1. What does a yeast cell look like?
2. Draw a picture of several cells.
3. Can you tell the difference between a yeast cell and a small air bubble?
4. How big is a yeast cell?

5
EXAMINING YEAST CELLS THE NEXT DAY
The next day make another slide of the yeast and table sugar mixture and examine it.
1. Do you notice any differences in the size of the cells?
2. If so, are the cells larger or smaller than before?
3. Is there any difference in the number of cells in the area you can see?
4. If you think there is a change in the number of cells, how can you be sure?

6
HOW RAPIDLY DO YEAST CELLSINCREASE IN NUMBER?
1. Why is it important to shake or stir the mixture of yeast and table sugar beforetaking a sample?
Examine the slide you made using a microscope:
2. How many yeast cells did you count in the area you can see?
3. What time was it when you made the count?
4. If your microscope has more than one eyepiece, which one did you use?
5. Which objective lens did you use?
6. Why must you use the same lenses each time you make a count?
Now move the slide and count another group of cells:
7. How many cells did you count this time?
8. Why is it important to count more than one area of your sample?
9. What is the average of the counts you have made?

7
(1)
(2)
(3)
(4) (5)
CELLEBRATION
You are going to examine a variety of cells under the microscope. Remember that the thinnerthe specimens are, the clearer the cells will appear. All of the specimens must be wet mounted.This means that you must be sure that the specimen is wet, and then you must press it flatagainst the slide. Add the appropriate dye, spread it evenly over the specimen, and set a coverslip on top. Tap the cover slip gently to remove any bubbles. Examine the specimen underLOW POWER ONLY.
1. ELODEA LEAF. Elodea is a pond plant. No stain is necessary. Notice the brick-shapedcells. The green dots are chloroplasts, which make and store chlorophyll (a chemical thatenables plants to manufacture food). Draw several cells showing all of the detail.
2. ONION EPIDERMIS. Break a piece of onion and peel it back toremove the thin, transparent outer layer. Stain with two drops ofiodine. Notice the large, narrow cell. The nuclei appear as tinybrown dots. Draw the entire field of view.
3. POTATO CELLS. Use a razor blade to shave off a paper-thin slice ofpotato. Stain with one drop of iodine. After about 15 seconds,rinse it carefully, being sure not to lose the potato slice. Drawseveral of the large potato cells, showing the starch grains (whichlook like bunches of purple grapes).
4. CELERY STALK. Use a razor blade to cut a paper-thin slice across thestem. Add a drop of methylene blue stain. Notice that each vein isactually composed of a bundle of tubes. Draw a vascular bundle(vein) and the cells surrounding it.
5. ICE PLANT EPIDERMIS. Break an ice plant “leaf” and peel off a piece ofthin outer skin. Stain with one drop of methylene blue. Notice thestoma with their two guard cells. These look much like cat’s eyes. Draw afew stomata, their guard cells, and the cells surrounding them.
6. CHEEK EPITHELIUM. Gently scrape the inside of your cheek with aclean applicator. Smear the stuff on the end of a stick on the slide.Add one drop of methylene blue. Draw the tiny epithelium cellswhich look like irregularly shaped pancakes with a blueberry (thenucleus) in the center. You might have to look around for quite awhile to find a good group of cells.
(6)
8
AssessmentGrade 8
CELLS
Classroom Assessment Example SCI.III.1.MS.1
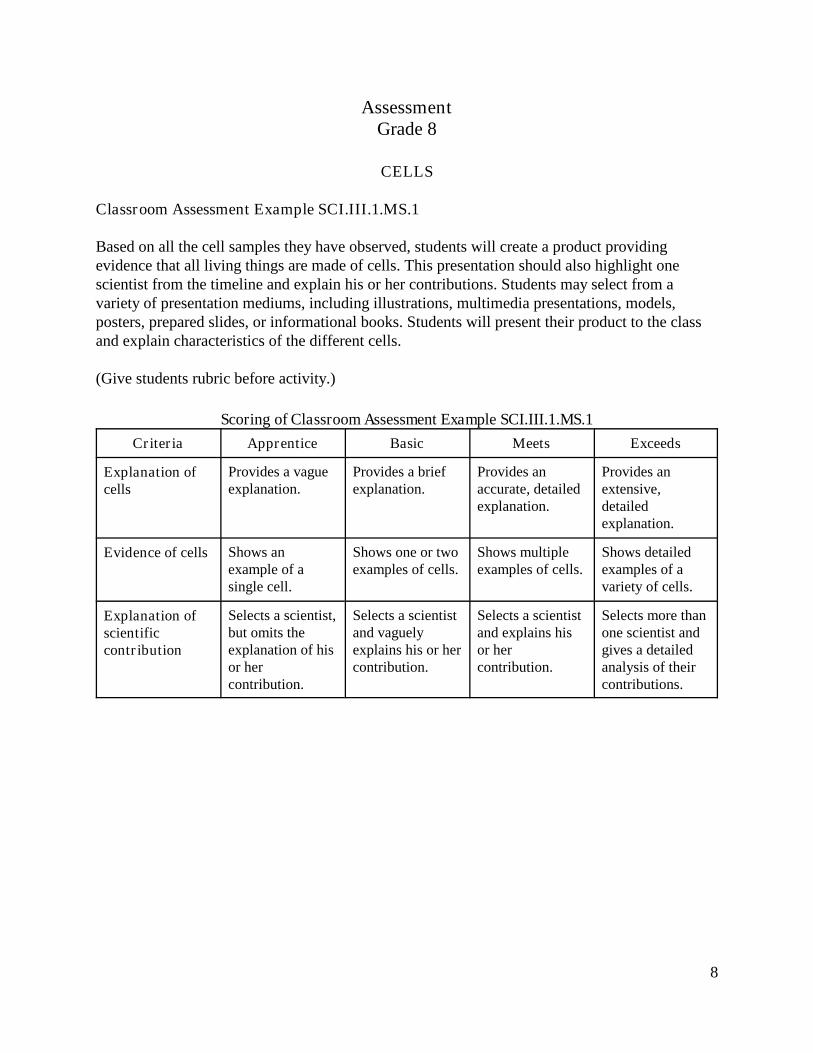
Based on all the cell samples they have observed, students will create a product providingevidence that all living things are made of cells. This presentation should also highlight onescientist from the timeline and explain his or her contributions. Students may select from avariety of presentation mediums, including illustrations, multimedia presentations, models,posters, prepared slides, or informational books. Students will present their product to the classand explain characteristics of the different cells.
(Give students rubric before activity.)
Scoring of Classroom Assessment Example SCI.III.1.MS.1
Criteria Apprentice Basic Meets Exceeds
Explanation ofcells
Provides a vagueexplanation.
Provides a briefexplanation.
Provides anaccurate, detailedexplanation.
Provides anextensive,detailedexplanation.
Evidence of cells Shows anexample of asingle cell.
Shows one or twoexamples of cells.
Shows multipleexamples of cells.
Shows detailedexamples of avariety of cells.
Explanation ofscientificcontribution
Selects a scientist,but omits theexplanation of hisor hercontribution.
Selects a scientistand vaguelyexplains his or hercontribution.
Selects a scientistand explains hisor hercontribution.
Selects more thanone scientist andgives a detailedanalysis of theircontributions.
9
Life ScienceWorksheet
GRADE LEVEL: Eight
Topic: Cells
Grade Level Standard: 8-1 Apply an understanding of cells to the functions of
multicellular organisms.
Grade Level Benchmark: 2. Explain why and how selected specialized cells are
needed by plants and animals. (III.1.MS.2)
Learning Activity(s)/Facts/Information
Central Question:Why are specialized cells needed in plants andanimals?
1. “Respiration—Photosynthesis”
2. “What Do Green Leaves Breathe Out”/“How is theGreen Produced?”
3. “The Water Sucking Roots”
Activity is attached
Resources
Saginaw/Midland CountyScience Curriculum. Pages1525-1526, 1534-1535, 1537-1541.
Process Skills:
New Vocabulary: reproduction, photosynthesis, transport, movement, disease
fighting, red blood cells, white blood cells, muscle cells, bone cells, nerve cells,
egg/sperm cells, root cells, leaf cells, stem cells

10
RESPIRATION PHOTOSYNTHESISPresence of CO² Presence of O
OBJECTIVEThis activity is appropriate for all ages. It works well as a demonstration or ahands on activity. It shows the presence of carbon dioxide in our breath and thepresence of oxygen in plant respiration.
TERMSPhotosynthesis — the process in which the energy of sunlight is trapped bychlorophyll an used to make food. Respiration — the process by which food isbroken down and energy is released.
TIMEPart one - 15 minutesPart two - 1 to 2 hours
BACKGROUNDPhotosynthesis is the process by which green organisms make food. An organismthat makes food is a producer. Green plants are producers. Photosynthesis is thesource of food for almost every other organism. In photosynthesis, carbon dioxideand water are combined with the aid of energy from light. The products ofphotosynthesis are sugars and oxygen.
Respiration is another plant process. The cell process of respiration results in arelease of energy from food. The energy from respiration is used for all theactivities of the cells metabolism. Carbon dioxide and water are products ofrespiration.
MATERIALSH2OPhenol red indicator (purchase at pool supply store)Aquatic plants work best, however, carrot tops, grass, and other plants do workLight sourceTest tubeCorkStraw
PROCEDURE # 11. Half fill a test tube with water.2. Add phenol red, about two drops, and mix.3. Take straw and place in test tube.4. Gently blow in straw.
11
5. When the liquid goes from pink to yellow, it shows the presence of carbondioxide, CO2.
PROCEDURE # 21. Take the test tube with the CO2 rich water. Put a good size piece of an aquatic
plant into the tube.2. Lightly cork the tube.3. Shine a light source on the tube or place in a sunny window.4. In one to two hours the CO2 rich water will have turned pink again, showing the
presence of oxygen in plant respiration and the use of carbon dioxide inphotosynthesis.
RESPIRATIONC6H12O6 +6O2 6CO2 +6H2O + energy
PHOTOSYNTHESIS
6CO2 +6H2O + energy C6H12O6 + 6O2
TAKEN FROMJudy Meier, Teacher Specialist
12
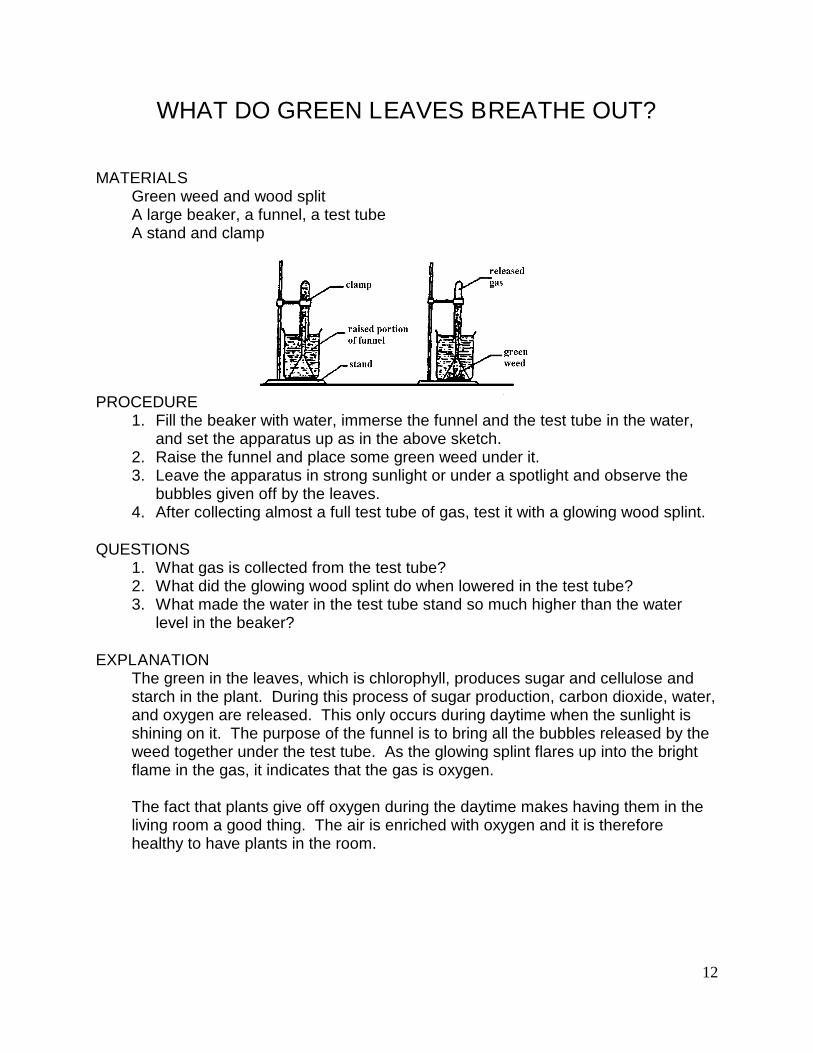
WHAT DO GREEN LEAVES BREATHE OUT?
MATERIALSGreen weed and wood splitA large beaker, a funnel, a test tubeA stand and clamp
PROCEDURE1. Fill the beaker with water, immerse the funnel and the test tube in the water,
and set the apparatus up as in the above sketch.2. Raise the funnel and place some green weed under it.3. Leave the apparatus in strong sunlight or under a spotlight and observe the
bubbles given off by the leaves.4. After collecting almost a full test tube of gas, test it with a glowing wood splint.
QUESTIONS1. What gas is collected from the test tube?2. What did the glowing wood splint do when lowered in the test tube?3. What made the water in the test tube stand so much higher than the water
level in the beaker?
EXPLANATIONThe green in the leaves, which is chlorophyll, produces sugar and cellulose andstarch in the plant. During this process of sugar production, carbon dioxide, water,and oxygen are released. This only occurs during daytime when the sunlight isshining on it. The purpose of the funnel is to bring all the bubbles released by theweed together under the test tube. As the glowing splint flares up into the brightflame in the gas, it indicates that the gas is oxygen.
The fact that plants give off oxygen during the daytime makes having them in theliving room a good thing. The air is enriched with oxygen and it is thereforehealthy to have plants in the room.
13
HOW IS THE GREEN IN THE LEAVES PRODUCED?
MATERIALSA plant with large wide leavesCarbon paper or black construction paperPaper clips or masking tape
PROCEDURE1. Cut out several patterns (circle, square, triangle) in several pieces of carbon
paper.
2. Cover three or more leaves as much as possible with the cut out carbon paperby attracting it to the leaves with the paper clip or masking tape.
3. Cover some leaves halfway with carbon paper close to the stem (or any otherpattern of covering) and leave it attached for two or three days.
4. After leaving the black paper against the leaves for several days, remove theattached paper and observe the leaves.
QUESTIONS1. How did the covered areas of the leaves compare to the uncovered ones?
2. Do plants need sunshine to produce the green color?
3. What is the green color in the plant leaves called?
4. What is the process of production of the green color called?
5. What is the function of the chlorophyll in plant leaves?
EXPLANATIONThe covered areas of the leaves will become much paler. The longer it stayscovered, the paler the color, because no sunshine is penetrating the greenpigment that enables every plant that possesses it to combine water and carbondioxide from the air to form sugar. This process in which sunshine is an essentialingredient is called photosynthesis. It is the sugar in the plants that gives animalsand man the energy when it is consumed by them.
The chlorophyll also produces cellulose, a much larger molecule than sugar whichis the basic building material in plants. Thus, without sunshine the leaves do notproduce chlorophyll, no cellulose, and therefore, plants do not grow.

14
THE WATER SUCKING ROOTS
MATERIALSA beaker (250 mL), a one-hole stopper, a glass tubeA carrot or a cylinder shaped potato, syrup (sugar), candle waxA coring knife (apple corer), a stand and clamp
PROCEDURE1. With the coring knife, cut a hole in the carrot or potato about three-quarters
down its length, such that the one-hole stopper will fit in it and close it tightly.See sketch.
2. Insert a 20 cm long glass tube in the one-hole stopper.
3. Fill the hole in the carrot or potato with syrup or a concentrated solution ofsugar in the water.
4. Push the stopper with the glass tube in the hole (liquid level should rise in thetube) and seal any openings between the stopper and the carrot or potato withcandle wax (light a candle and let the melted wax drop on the places that youwant sealed).
5. Mark the liquid level in the glass tube with a piece of masking tape, a greasepencil, or a rubber band.
6. Clamp the carrot or potato and immerse it in water. Observe the water level inthe glass tube at the end of the period.
QUESTIONS1. What made the water level in the glass tube rise?
2. Would this water level also rise if the tube were filled with plain water? With saltwater?
3. Why did the stopper have to be sealed with wax?
4. What would happen if the carrot and tube were filled with plain water and thebeaker with sugar solution?
15
EXPLANATIONThe skin, tissue, and fibers of the carrot or potato act like a semi-permeablemembrane, letting only the small water molecules through, but not the larger sugarmolecules. This makes the water move from the beaker into the carrot and up thetube. If the concentration of sugar is higher in the beaker compared to that insidethe carrot, the water will move out of the carrot and thus the water level in the tubewill go down.
This action and migration of water molecules through a semi-permeablemembrane is called osmosis.
16
AssessmentGrade 8
CELLS
Classroom Assessment Example SCI.III.1.MS.2
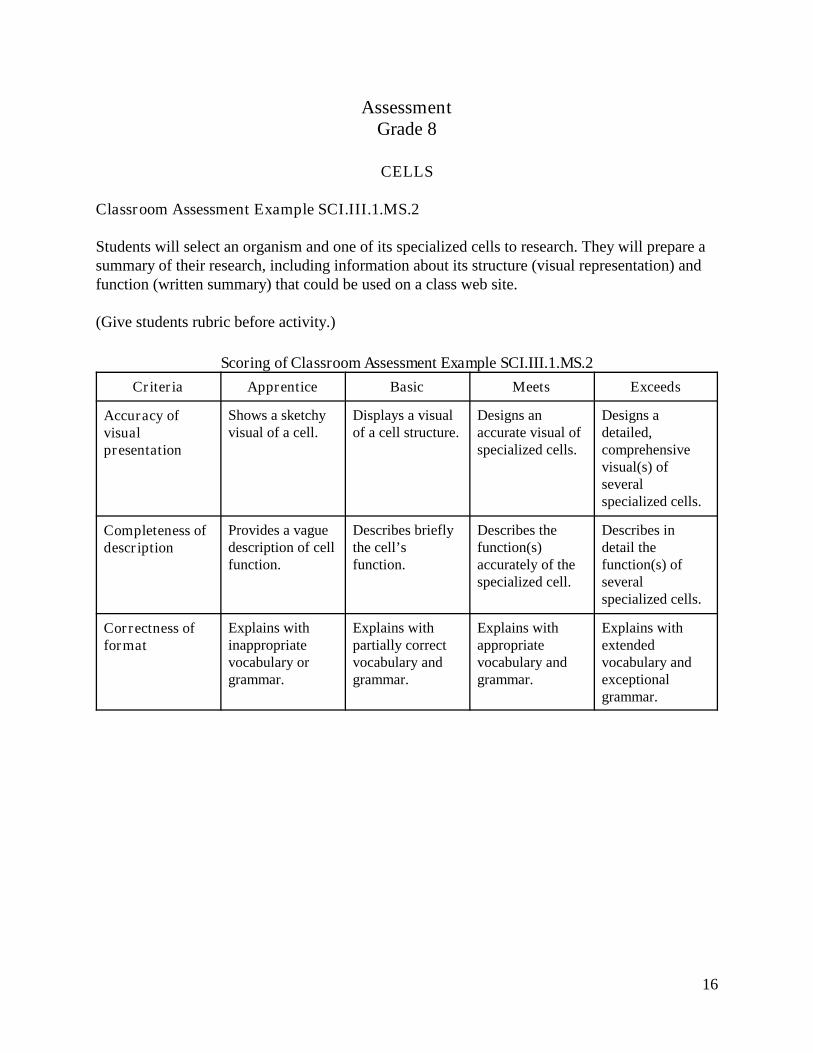
Students will select an organism and one of its specialized cells to research. They will prepare asummary of their research, including information about its structure (visual representation) andfunction (written summary) that could be used on a class web site.
(Give students rubric before activity.)
Scoring of Classroom Assessment Example SCI.III.1.MS.2
Criteria Apprentice Basic Meets Exceeds
Accuracy ofvisualpresentation
Shows a sketchyvisual of a cell.
Displays a visualof a cell structure.
Designs anaccurate visual ofspecialized cells.
Designs adetailed,comprehensivevisual(s) ofseveralspecialized cells.
Completeness ofdescription
Provides a vaguedescription of cellfunction.
Describes brieflythe cell’sfunction.
Describes thefunction(s)accurately of thespecialized cell.
Describes indetail thefunction(s) ofseveralspecialized cells.
Correctness offormat
Explains withinappropriatevocabulary orgrammar.
Explains withpartially correctvocabulary andgrammar.
Explains withappropriatevocabulary andgrammar.
Explains withextendedvocabulary andexceptionalgrammar.
17
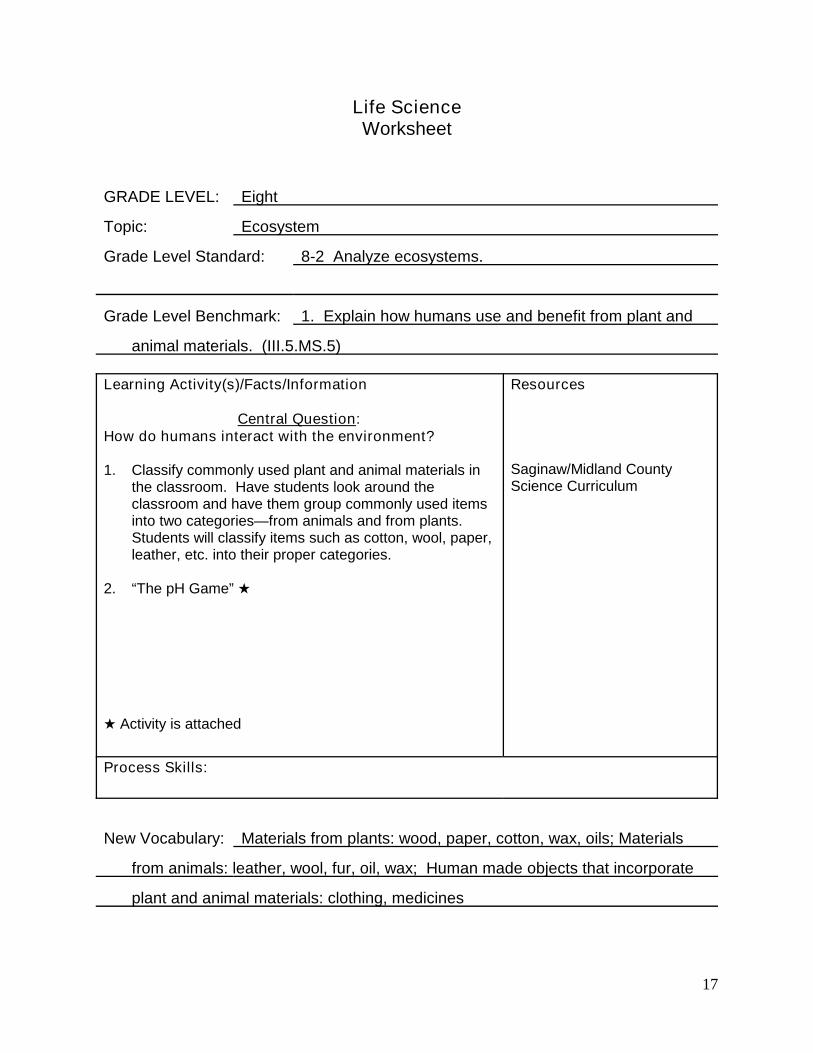
Life ScienceWorksheet
GRADE LEVEL: Eight
Topic: Ecosystem
Grade Level Standard: 8-2 Analyze ecosystems.
Grade Level Benchmark: 1. Explain how humans use and benefit from plant and
animal materials. (III.5.MS.5)
Learning Activity(s)/Facts/Information
Central Question:How do humans interact with the environment?
1. Classify commonly used plant and animal materials inthe classroom. Have students look around theclassroom and have them group commonly used itemsinto two categories—from animals and from plants.Students will classify items such as cotton, wool, paper,leather, etc. into their proper categories.
2. “The pH Game”
Activity is attached
Resources
Saginaw/Midland CountyScience Curriculum
Process Skills:
New Vocabulary: Materials from plants: wood, paper, cotton, wax, oils; Materials
from animals: leather, wool, fur, oil, wax; Human made objects that incorporate
plant and animal materials: clothing, medicines
18
The pH Game
PURPOSETo teach students about the acidity levels of liquids and other substances aroundtheir school so that they understand what pH levels tell us about the environment.
OVERVIEWThe pH game will engage students in the measurement of the pH of watersamples, soil samples, plants, and other natural materials from different places.Students will create mixtures of materials in order to collect different pHmeasurements.
TIMEOne class period for preparationOne class period for game
LEVELAll
KEY CONCEPTS pH measurements
SKILLS Taking measurements Conducting analysis Interpreting findings Understanding interrelations in nature
MATERIALS AND TOOLSFor each team (about 4 students)
20 pH strips 3 or 5 small cups Paper and pencil Labels with which to attach results to the results board
For the whole classroom: Results board for all teams (one line of pH levels from 2 to 9 for each team) Flip chart with rules Additional pH strips

19
PREPARATIONThe teacher should prepare various acidic and alkaline mixtures/solutions ofnatural and processed materials. These solutions should be labeled with theingredients and a letter, but not their acidic or alkaline characteristics. Examplesof acidic solutions include fermented grass, diluted and concentrated lemon juice,black coffee, vinegar, orange juice, and soft drinks. Alkaline solutions include saltwater, shampoo, baking soda, chlorine bleach, household ammonia, and ovencleaner. Soil solutions produced by mixing water and local soil samples should beused as well as local water samples. The teacher can also produce solutions frommaterials found around the local school area, such as oil drippings from a vehicle,liquid in a discarded bottle, etc.
PREREQUISITESNone
BACKGROUNDThe level of acidity (pH) significantly influences the vegetation and wildlife in anenvironment. The pH can be influenced by different factors. The main influencesare the alkaline contributions from rocks and soils, the amount of water in thelandscape, and also human activities (traffic, buildings, paved surfaces, etc.) Acidrain may also have an important impact on water pH. It is important to understandthese relationships. This simple activity will help your students to understand theinterdependence of nature and human activities.
Note: Remind students of the difference between hypothesis and results.Encourage them to develop their hypothesis and find a way to test it with results(prepare some literature for them, invite an expert to the class, examine pastmeasurements, etc.)
THE RULES1. Explain to students the objective of the game is that each team identifies
solutions which have a pH range of 2-9.
The students should draw a horizontal pH scale from 0-14, marking pH 7 asthe neutral point. Each unit should be spaced at least 1 cm apart. They shouldthen draw a box underneath each pH unit from 2 to 9.
Each team finds substances that have a pH corresponding to a box in the pHscale.
2. The teacher draws the following matrix on the board. See Matrix HYD-L-1.
3. One point is awarded for each box filled, even if the team finds two sampleswith the same pH.
20
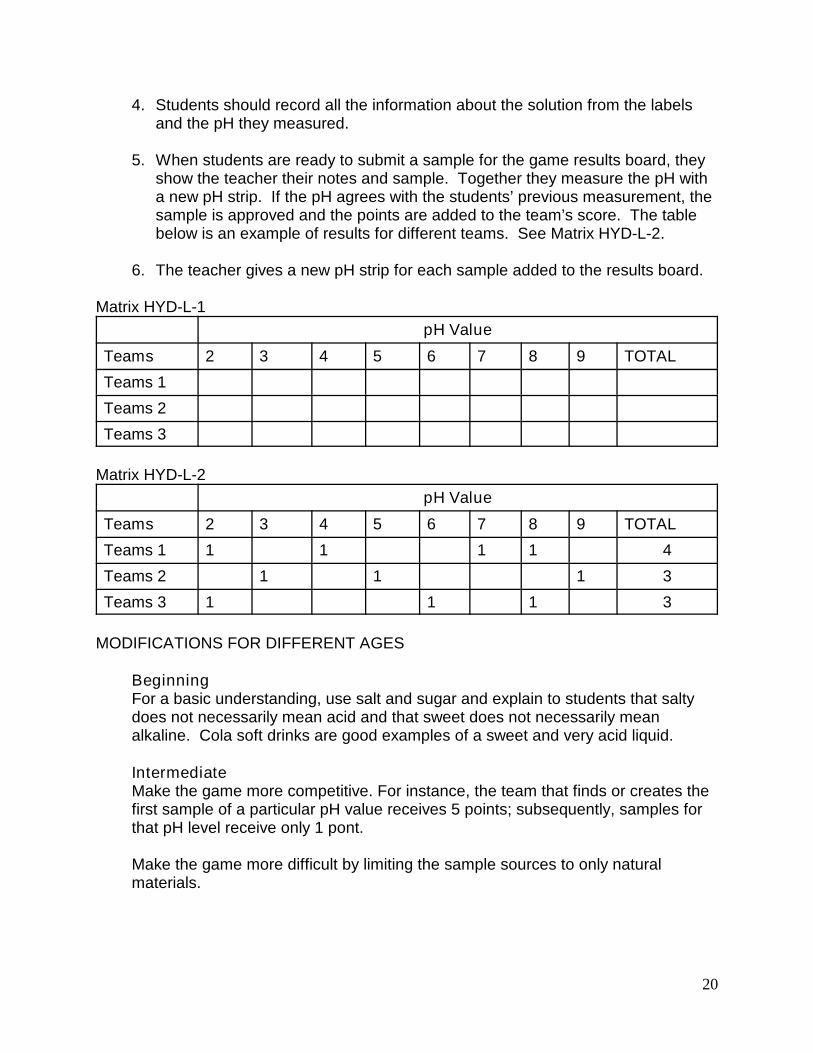
4. Students should record all the information about the solution from the labelsand the pH they measured.
5. When students are ready to submit a sample for the game results board, theyshow the teacher their notes and sample. Together they measure the pH witha new pH strip. If the pH agrees with the students’ previous measurement, thesample is approved and the points are added to the team’s score. The tablebelow is an example of results for different teams. See Matrix HYD-L-2.
6. The teacher gives a new pH strip for each sample added to the results board.
Matrix HYD-L-1
pH Value
Teams 2 3 4 5 6 7 8 9 TOTAL
Teams 1
Teams 2
Teams 3
Matrix HYD-L-2
pH Value
Teams 2 3 4 5 6 7 8 9 TOTAL
Teams 1 1 1 1 1 4
Teams 2 1 1 1 3
Teams 3 1 1 1 3
MODIFICATIONS FOR DIFFERENT AGES
BeginningFor a basic understanding, use salt and sugar and explain to students that saltydoes not necessarily mean acid and that sweet does not necessarily meanalkaline. Cola soft drinks are good examples of a sweet and very acid liquid.
IntermediateMake the game more competitive. For instance, the team that finds or creates thefirst sample of a particular pH value receives 5 points; subsequently, samples forthat pH level receive only 1 pont.
Make the game more difficult by limiting the sample sources to only naturalmaterials.
21
Limit the number of pH strips given to each group and set up a rule for buying anew one with game points.
AdvancedAsk the students which solutions should be added together to produce a neutralsolution. Have them test their hypothesis by adding some of the labeled solutionstogether and recording the pH. Have students quantify the neutralization capacityof different solutions. Relate this to buffering capacity (alkalinity) of hydrologysites.
Provide students with samples of solutions from other parts of your country (or ofthe world) and ask them to characterize how they influence pH differently.
Conduct a similar analysis of samples from different geological layers or differentareas of the community or study site.
Note: For older students we recommend inviting an expert to answer theirquestions.
FURTHER INVESTIGATIONSExamine the Hydrology Study Site for materials in soil, rocks, and vegetation thatinfluence the pH of the water.
Try to identify and quantify influences that are not always present at the study site,such as precipitation or some event upstream of your sampling site.
STUDENT ASSESSMENTAfter the game, sit with students around the results board and identify whatsamples they have found, where the samples were found, and the pH of thesamples. Encourage students to present their own ideas about why differentsamples have different pH values. Emphasize differences among water samplesfrom soils, rocks, artificial surfaces, lakes, rivers, etc. Mention the acidneutralization capacities (alkalinity) of some rocks and the acidic influences ofdifferent materials. Ask them why it was difficult to find samples for some pHlevels and easy to find others.
ACKNOWLEDGMENTSThe pH game was created and tested by the leaders team of TEREZA, theAssociation for Environmental Education, Czech Republic.NOAA National Geophyiscal Data Center, Boulder, Colorado, USAQuestions/Comments regarding the GLOBE Program
http://archive.globe.gov/sda-bin/wt/ghp/tg+L(en)+P(hydrology/pHGame)
22
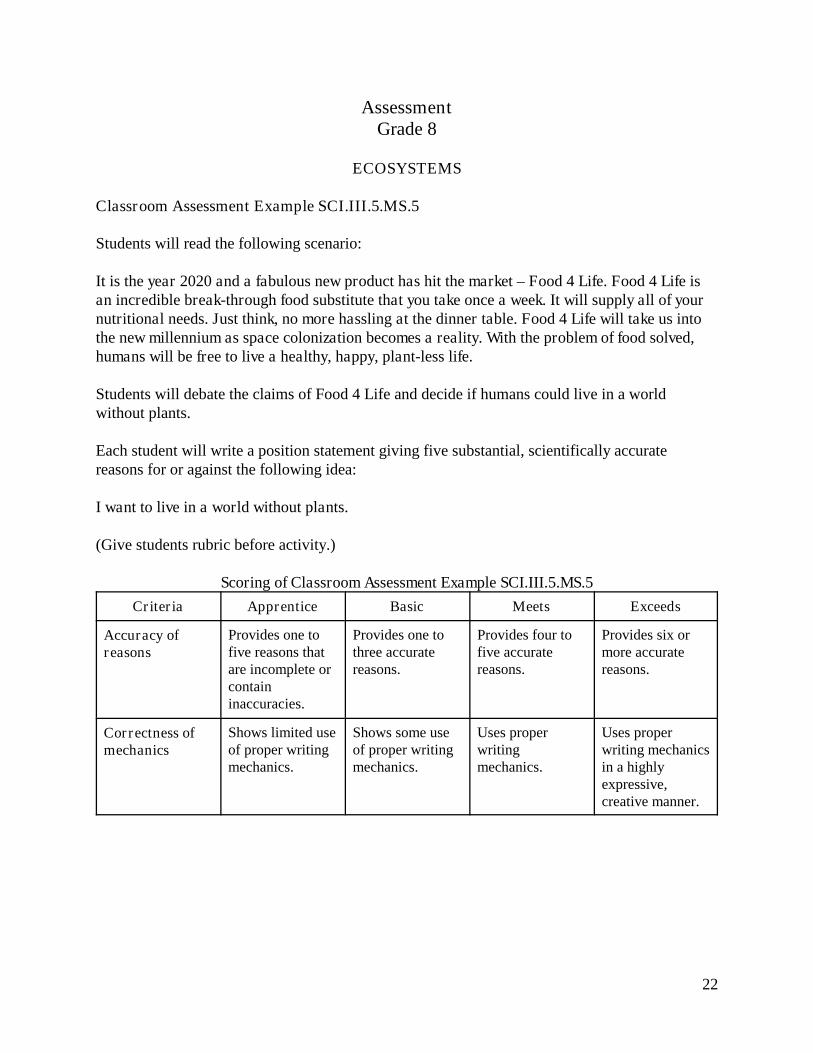
AssessmentGrade 8
ECOSYSTEMS
Classroom Assessment Example SCI.III.5.MS.5
Students will read the following scenario:
It is the year 2020 and a fabulous new product has hit the market – Food 4 Life. Food 4 Life isan incredible break-through food substitute that you take once a week. It will supply all of yournutritional needs. Just think, no more hassling at the dinner table. Food 4 Life will take us intothe new millennium as space colonization becomes a reality. With the problem of food solved,humans will be free to live a healthy, happy, plant-less life.
Students will debate the claims of Food 4 Life and decide if humans could live in a worldwithout plants.
Each student will write a position statement giving five substantial, scientifically accuratereasons for or against the following idea:
I want to live in a world without plants.
(Give students rubric before activity.)
Scoring of Classroom Assessment Example SCI.III.5.MS.5
Criteria Apprentice Basic Meets Exceeds
Accuracy ofreasons
Provides one tofive reasons thatare incomplete orcontaininaccuracies.
Provides one tothree accuratereasons.
Provides four tofive accuratereasons.
Provides six ormore accuratereasons.
Correctness ofmechanics
Shows limited useof proper writingmechanics.
Shows some useof proper writingmechanics.
Uses properwritingmechanics.
Uses properwriting mechanicsin a highlyexpressive,creative manner.
23
Life ScienceWorksheet
GRADE LEVEL: Eight
Topic: Ecosystems
Grade Level Standard: 8-2 Analyze ecosystems.
Grade Level Benchmark: 2. Describe ways in which humans alter the
environment. (III.5.MS.6)
Learning Activity(s)/Facts/Information
Central Question:How do humans alter the environment?
1. Explain how humans bring animals and organisms fromother places to new places and offset the ecosystem.(Zebra muscle epidemic in Great Lakes Region).
2. Have children count how many smokers they see inone day. As well as all transportation sources emittingexcessive emissions.
3. Have students bring in recyclable items they wouldnormally throw away.
Resources
Librarywww.biology.com
Process Skills:
New Vocabulary: agriculture, land use, renewable and non-renewable resources,
resource use, solid waste, toxic waste, biodiversity, species, reintroduction,
reforestation, pollution

24
Research Findings News & Announcements
Calendar Job Board
Discussion Board
Current Journal Contents
Research FindingsShare a research finding!
June 14, 2000Filtration capabilities of quagga and zebra musselsSeasonal filtration rates of Dreissena bugensis (quagga mussels) and D. polymorpha (zebramussels) from Oak Orchard Creek, NY, have been measured in Niagara River water (1 L statictests, 1 h duration, clearance of added natural sediment [< 63 ], 2 - 10 mg/l). twenty mmquagga mussels filtered ~1/3 more than zebra mussels in fall and spring tests (both at 14 c).means (ml/h): nov. 1999- quagga 270, zebra 203; may 2000- quagga 309, zebra 226 (samplesizes of 17 - 20 mussels, p [t-tests] < 0.05). rates were generally higher at the lower particleconcentrations. interspecific differences were non-significant among 15 mm mussels. theinfluence of shell-free tissue mass is currently being evaluated. the modest differences infiltration shown thus far seem insufficient to solely explain the profound displacement of d.polymorpha in the lower great lakes. this suggests the continuing need to investigate alsogrowth rates, fecundities, and recruitment success. Sponsoring Organization:Industry/University Center for Biosurfaces-SUNY at Buffalo, Great Lakes Center forEnvironmental Research and Education, Buffalo State College.Contact: Thomas P. Diggins, [email protected].
June 1, 2000Algal development and production in Lake BaikalRemarkable water blooms of phytoplankton develop in Lake Baikal during the period of lakewater stratification; diatoms bloom under the ice in spring, picocyanobacteria colonize thepelagic zone and large colonial cyanobacteria are found at bay areas in summer. In addition,massive increase of periphytic algae turns the lakeshore rocks green. These blooms indicate
25
that Lake Baikal is potentially eutrophic. Since Lake Baikal contains a huge volume of coldhypolimnetic water, symptoms of excessive eutrophication do not appear throughout the year,at present. To protect Lake Baikal, as an invaluable water resource for Siberian residents andas a natural heritage in the world, research and monitoring on the eutrophication process arestrongly needed.Contact: Yasunori Watanabe, Department of Biology, Tokyo Metropolitan University, 1-1,Minamiosawa, Hachioji, Tokyo 192-0397, JAPAN. Phone & Fax: (81)-426-77-2580;[email protected].
May 29, 2000A multi-agency effort to address declines in the abundance of Lake Michigan yellowperchCatch of adult yellow perch in Lake Michigan declined dramatically between 1988 and 1998,and the population age structure shifted toward older fish with an almost complete lack ofreproductive success in recent years. Steps taken to address this decline included coordinatedregulation of commercial and recreational yellow perch harvest, and formation of a multi-agencyYellow Perch Task Group to expand research aimed at identifying likely causes for the lack ofperch recruitment.
Three hypotheses currently being addressed by activities of the yellow perch task group are1. mortality at the egg stage influences yellow perch recruitment,2. inappropriate diet limits survival, and3. alewife predation limits recruitment.
There appears to be little evidence to support the idea that factors at the egg stage directlyinfluence perch population survival, but experiments have shown a relationship between adultfemale yellow perch size and larval perch length and yolk volume. This relationship suggeststhat building spawning stock diversity will produce offspring with enhanced probability ofsuccessful recruitment in a variable environment.
Lake Michigan zooplankton populations have changed considerably between the 1980s and1990s, and evidence collected to date shows a significant positive relationship betweenzooplankton density and yellow perch survival. Additionally, long-term data collections insouthern Lake Michigan continue to show a negative effect on yellow perch as alewifeabundance increases. Maternal factors, diet, and predation probably act in concert, along withharvest and "natural" density-dependent functions, to regulate yellow perch abundance.Successful management of perch populations will require ongoing research to understand theinterrelationships among all of these factors. Sponsoring Organization: GLFC - Lake MichiganTechnical Committee and LMC.Contact: Dave Clapp, (231) 547-2914, [email protected].
March 24, 2000Identification of the Polychlorinated Terphenyl FormulationPolychlorinated terphenyls (PCT) have been identified in the sediment and tissues of thecommon snapping turtle (Chelydra serpentina serpentina) within the St. Lawrence River Area ofConcern (AOC) adjacent to the United States Environmental Protection Agency (USEPA)Superfund Site near Massena, NY. To our knowledge, PCT have not been previously reportedin the St. Lawrence River AOC. PCT were identified as Aroclor 5432 in the surficial sediment at0.8 mg/kg (dry weight), approximately 6.5% of the sediment-bound PCBs. The most probablesource of the PCT to the AOC being the hydraulic fluid Pydraul® 312A utilized by many heavy
26
industrial users for high-temperature applications. The sediment-bound PCT showed nobiological or physico-chemical alterations, chromatographically matching an Aroclor 5432technical standard. Concentrations of PCT in the snapping turtle adipose, liver and eggs, were42.2, 20.2, and 6.5 mg/kg - lipid basis, respectively. Analysis of the gas chromatographicpattern indicates that PCT were selectively metabolized and bioaccumulated by the snappingturtle. Concentrations of PCT found in the snapping turtle tissues and eggs ranged between2-5% of the PCB measured in the turtle tissues. Sponsoring Organization: EnvironmentalResearch Center, State University of New York at Oswego.Contact: James J. Pagano, [email protected]
February 22, 2000Physical and Biological Processes Influencing Walleye Early Life History in WesternLake ErieOur research focuses on quantifying the effects of physical and biological processes on walleyeearly life history vital rates in western Lake Erie. Our results indicate that egg abundance, eggsurvival, and larval abundance are highest in years when lake waters warm quickly and fewstrong wind events occur. In April 1998, we documented the effect of a gale force storm on eggabundance on reefs. Over 80% of spawned eggs were removed from reefs by the storm, andlarval densities adjacent to the reefs were the lowest observed during the six years of our study.We also examined the potential for egg predation on reefs in April and found that eggs werecommon in stomachs of white perch, yellow perch, and trout perch but rare in stomachs ofround gobies. These findings enable us to better predict the response of walleye to variability intheir habitat and respond with appropriate management strategies. Further, they provide insightinto the effects of global climate change and exotic species introductions on the walleyepopulation. Sponsoring Organizations: Michigan Sea Grant, Michigan State University,Michigan DNR, Ohio DNR.Contact: Ed Roseman, [email protected]
Role of Lipids in Low Temperature Tolerance of AlewivesAlthough massive winter die-offs of alewives in the Great Lakes are well known, thephysiological basis for these mass mortalities remains unclear. Our research focuses on therole of dietary lipids in cold tolerance of alewives. We conducted laboratory studies to comparethe survival rates of alewives that were fed different diets and then subjected to a coldchallenge. Alewives fed frozen brine shrimp survived better than alewives fed frozen Daphnia,and alewives that died during the cold challenge showed significant decreases in membranepolyunsaturated fatty acids. Survival during the cold challenge was not correlated with percentbody lipid. These results suggest that dietary factors can influence cold tolerance of alewives,and death at cold temperatures may be due in part to changes in membrane fatty acids thatimpair proper membrane function. The long-term goal of this research is to develop a model topredict alewife die-offs. This in turn would lead to better management of Great Lakessalmonids, which rely heavily on alewives for food. Sponsoring Organizations: Great LakesResearch Consortium and the University at Buffalo Multidisciplinary Research Pilot ProjectProgram.Contact: Randal J. Snyder, [email protected]
December 29, 1999Possible Meteorite Impact Site in Lake OntarioUSGS scientists Thomas Edsall and Gregory Kennedy have identified a prominent lakebedfeature in the Charity Shoal Complex in eastern end of Lake Ontario that appears to be a majorsolution pit or perhaps a meteorite impact site (see map). A side-scan sonar survey of about
27
1,000 hectares of lakebed on the U.S. Canadian border surrounding the site revealed an ovalcrater covering about 70 hectares and surrounded by solid bedrock, which in eastern LakeOntario is Ordivician limestone. The inside edges of the crater are broken bedrock lying on solidbedrock. The floor of the crater is about 12 m deeper than the surrounding rim. A sedimentsample collected from the crater floor was stiff, varved lake clays covered with a thin layer ofcoarse sand. Edsall and Kennedy are searching for magnetometer data collected in the vicinityof the crater to see if they reveal a magnetic anomaly suggesting the crater is a meteoriteimpact site.Contact: Thomas Edsall, [email protected]
December 3, 1999Separating Stressors via In Situ TestingWe have had great success in detecting and separating stressors using various types of in situStressor Identification Evaluation chambers. Stressors can be separated into compartments:surface water (low or high flow), pore water, surficial sediment, and upwelling or downwelling.Specific stressors separated were: suspended solids, flow, photo induced toxicity, ammonia,metals, nonpolar organics, and bioaccumulative cmpds. Exposures range from 1 d to 2 wkswith multiple species and supported with traditional physicochem. profiles, benthic communitycharacterization, and lab toxicity testing. Sponsoring Organization: U.S. EnvironmentalProtection Agency, primarily.Contact: Dr. G. Allen Burton; (937) 775-2201, [email protected]
Cercopagis in North AmericaThe predatory cladoceran Cercopagis pengoi invaded the Great Lakes basin, initially in LakeOntario (1998), but also in six Finger Lakes and Lake Michigan (1999). Our research group isattempting to track invasions by Cercopagis, Bythotrephes, Daphnia lumholtzi, and otherinvertebrate invaders, and would appreciate correspondence with investigators who find any ofthese species in new localities. Sponsoring Organization: New York Sea Grant.Contact: Hugh MacIsaac, [email protected]
November 23, 1999Zebra Mussels in the Erie CanalBased on sediment surveys at locations in eastern Lake Erie and along the NY State ErieCanal, D. bugensis seems to be out competing D. polymorpha. The consequence is that thepercentage of the total number of combined dreissenids shifts in favor of D. bugensis over time.One can speculate as to how or why one species has a slight competitive advantage over theother. However, without further long-term studies of the abundance and population dynamics ofnatural populations, or detailed experimental studies, we are left to speculate about the natureof the ecological interactions, which seems to provide a slight advantage to D. bugensis.Because both animals are still species of zebra mussels, and both species are knownbio-foulers, at this stage it is difficult to ascribe a greater or lessor economic impact to onespecies more than another; nevertheless, the economic impacts of these species arenotoriously clear, particularly in costs associated with preventing the clogging of, or having tounclog water intake pipes.Contact: Kenton M. Stewart, Dept. of Biological Sci., State University of New York, Buffalo, NY;(716) 645-2898, [email protected]

28
November 15, 1999Ecosystem Modeling in Saginaw BayJoe DePinto, University at Buffalo, and Vic Bierman, Limno-Tech, Inc., are collaborating todevelop an ecosystem model for Saginaw Bay that includes nutrients, five phytoplanktonclasses, two zooplankton functional groups, PCBs, three age classes of zebra mussels, andsoon to include two type of benthic primary producers (benthic algae and macrophytes).Sponsoring Organization: U.S. Environmental Protection Agency, Great Lakes NationalProgram Office.Contact: Joe DePinto, [email protected]
Share a research finding!
©© Copyright 1999-2002International Association for Great Lakes Research
Site Design by Loracs Creations, Inc.
http://www.iaglr.org/hot/findings.html
29
AssessmentGrade 8
ECOSYSTEMS
Classroom Assessment Example SCI.III.5.MS.6
If possible, have students read In the Next Three Seconds by Morgan. This book takes a look at commonhuman activities and their impacts on our world. Students then should read the following statement:
In the next three seconds, 93 trees will be cut down to make the liners for disposable diapers.
Students should brainstorm ways that the use of disposable diapers has impacted our world. Next, presentthe following scenario to the students:
In light of this statement, a new law has been proposed in Lansing banning the use of disposable diapers.
Students will receive a card from the teacher indicating the role of a community member they will take,such as:
• Aileen, diaper manufacturer • Samantha, K-Mart manager• Juan, Peter Pan Nursery School director • Hitoshi, hospital nurse• Sam, owner of Sam’s Septic Service • Maria and Jose, parents of newborn triplets• Jamal, Green Peace member • Bonnie, XYZ Waste Disposal worker• Dee-Dee, owner of Dee-Dee’s Diaper Delivery Service
Students must prepare a two-minute speech reflecting their character’s point of view, either supporting oropposing this law. Students will present their speeches to the legislative body in Lansing (or a socialstudies class).
(Give students rubric before activity.)
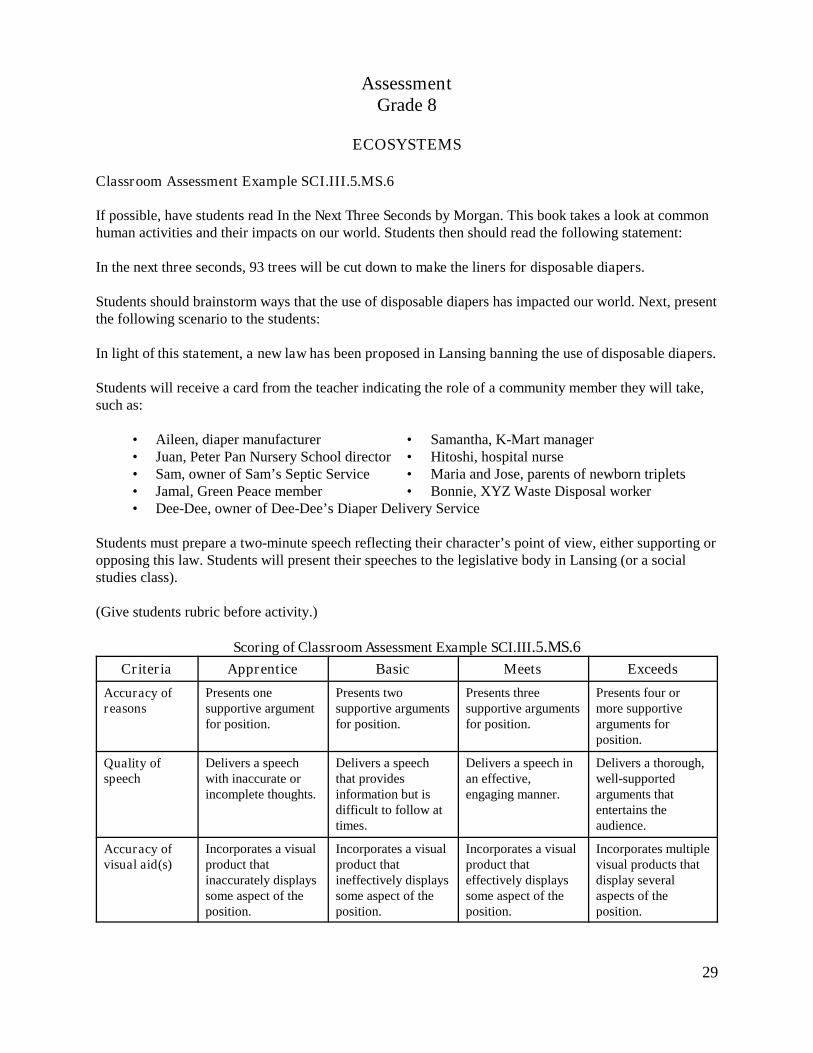
Scoring of Classroom Assessment Example SCI.III.5.MS.6
Criteria Apprentice Basic Meets Exceeds
Accuracy ofreasons
Presents onesupportive argumentfor position.
Presents twosupportive argumentsfor position.
Presents threesupportive argumentsfor position.
Presents four ormore supportivearguments forposition.
Quality ofspeech
Delivers a speechwith inaccurate orincomplete thoughts.
Delivers a speechthat providesinformation but isdifficult to follow attimes.
Delivers a speech inan effective,engaging manner.
Delivers a thorough,well-supportedarguments thatentertains theaudience.
Accuracy ofvisual aid(s)
Incorporates a visualproduct thatinaccurately displayssome aspect of theposition.
Incorporates a visualproduct thatineffectively displayssome aspect of theposition.
Incorporates a visualproduct thateffectively displayssome aspect of theposition.
Incorporates multiplevisual products thatdisplay severalaspects of theposition.
30
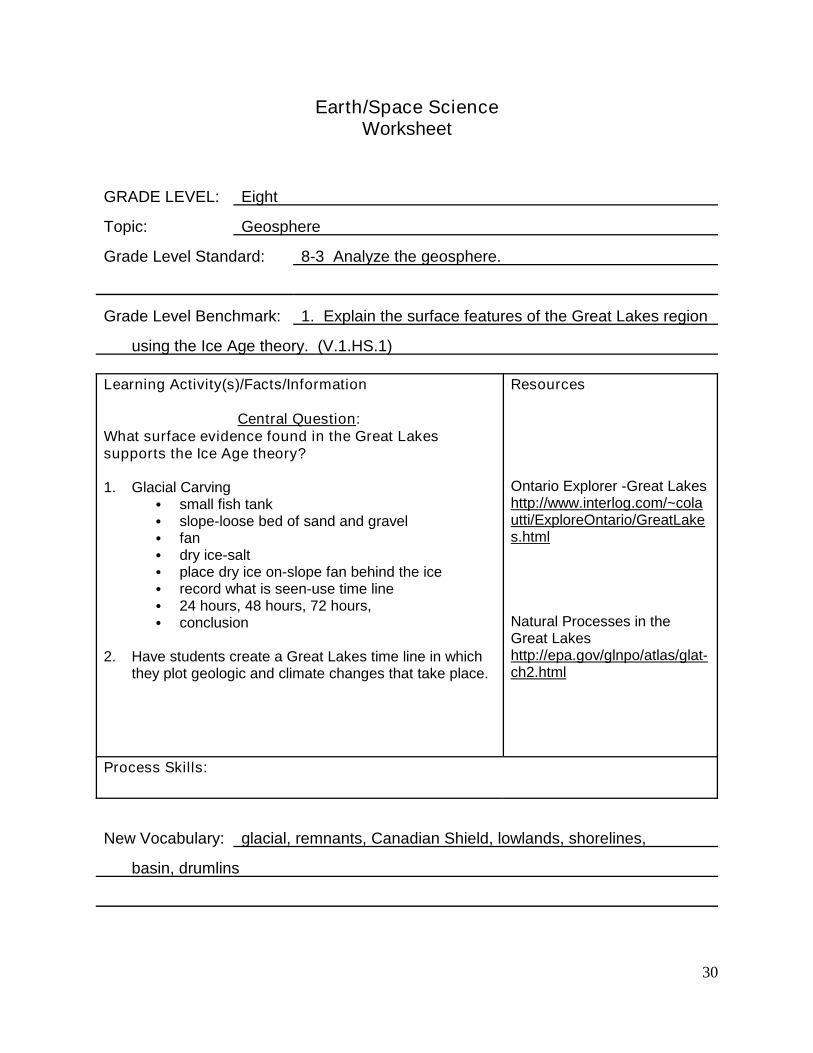
Earth/Space ScienceWorksheet
GRADE LEVEL: Eight
Topic: Geosphere
Grade Level Standard: 8-3 Analyze the geosphere.
Grade Level Benchmark: 1. Explain the surface features of the Great Lakes region
using the Ice Age theory. (V.1.HS.1)
Learning Activity(s)/Facts/Information
Central Question:What surface evidence found in the Great Lakessupports the Ice Age theory?
1. Glacial Carving small fish tank slope-loose bed of sand and gravel fan dry ice-salt place dry ice on-slope fan behind the ice record what is seen-use time line 24 hours, 48 hours, 72 hours, conclusion
2. Have students create a Great Lakes time line in whichthey plot geologic and climate changes that take place.
Resources
Ontario Explorer -Great Lakeshttp://www.interlog.com/~colautti/ExploreOntario/GreatLakes.html
Natural Processes in theGreat Lakeshttp://epa.gov/glnpo/atlas/glat-ch2.html
Process Skills:
New Vocabulary: glacial, remnants, Canadian Shield, lowlands, shorelines,
basin, drumlins
31
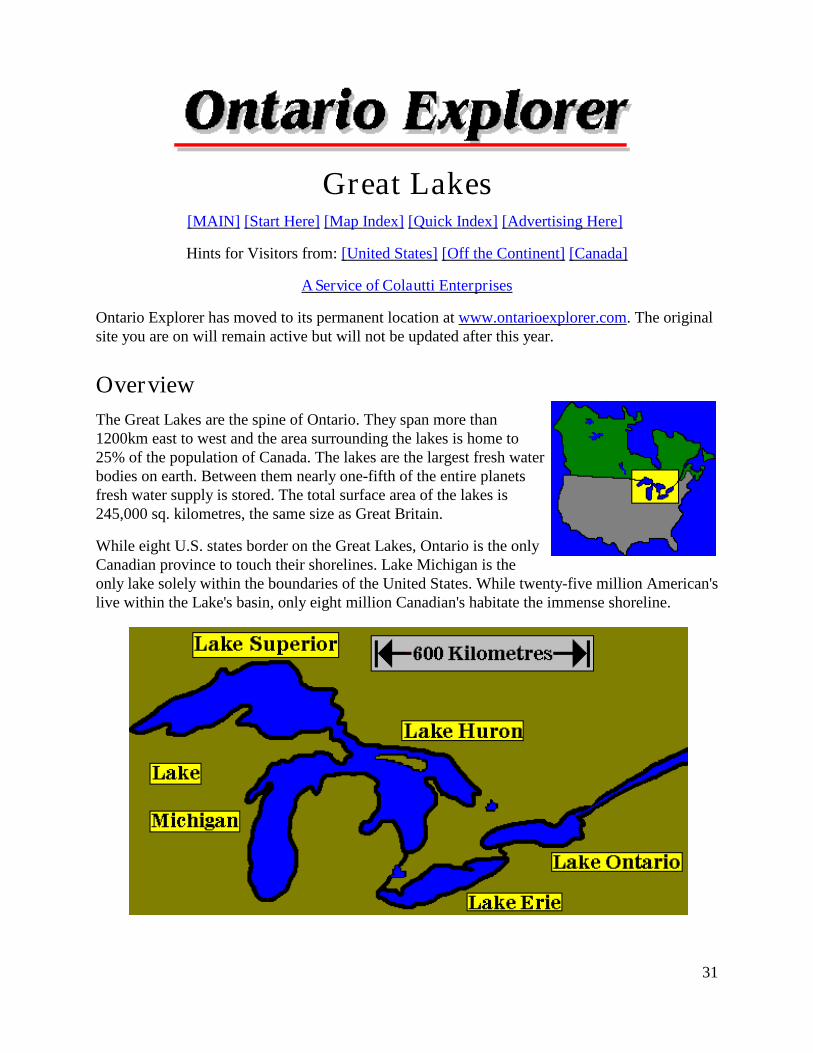
Great Lakes[MAIN] [Start Here] [Map Index] [Quick Index] [Advertising Here]
Hints for Visitors from: [United States] [Off the Continent] [Canada]
A Service of Colautti Enterprises
Ontario Explorer has moved to its permanent location at www.ontarioexplorer.com. The originalsite you are on will remain active but will not be updated after this year.
Overview
The Great Lakes are the spine of Ontario. They span more than1200km east to west and the area surrounding the lakes is home to25% of the population of Canada. The lakes are the largest fresh waterbodies on earth. Between them nearly one-fifth of the entire planetsfresh water supply is stored. The total surface area of the lakes is245,000 sq. kilometres, the same size as Great Britain.
While eight U.S. states border on the Great Lakes, Ontario is the onlyCanadian province to touch their shorelines. Lake Michigan is theonly lake solely within the boundaries of the United States. While twenty-five million American'slive within the Lake's basin, only eight million Canadian's habitate the immense shoreline.
32
The lakes are truly immense. The largest, Superior is at the head of the system. From here it'swaters and Michigans mingle at Michilimackinac. Lake Huron and Georgian Bay dischargethrough Lake St. Clair into Erie. Erie's shallow waters pour over Niagara Falls, emptying intoLake Ontario, which empties into the St. Lawrence seaway.
Formation of the Lakes
The lakes were formed when the last ice ageended. Immense lakes of water pooled at theedge of the Canadian shield and collected in agigantic lake system that marks the boundaryof the granite of the shield and the surroundingterrain. The lakes in order from the furthestnorth are: Great Bear Lake, Great Slave Lake,Lake Athabaska, Lake Winnipeg, The GreatLakes.
The Canadian Shield is the central core of thecontinent. An ancient outcropping of granite itis an eerie landscape of rolling rugged hills.The shield touches the coastline of LakeSuperior, Lake Huron, and the outlet of LakeOntario. South of the shield is the lowlands of
the Great Lakes and St. Lawrence valleys. Rolling or flat terrain; there is a distinct contrastbetween the topography of the southern and northern half of the province.
Each lake has a distinct character to it. Superior being the largest and most northern is very cold.Swimming in the lake is an invigorating experience even in the hottest summers. Lake Huron'stemperature is more moderate especially near shore, but again is generally chilly. Lake Erie offersthe warmest waters of all the lakes, but can become very tempestuous very rapidly. Drowningshave been common off the sand spit parks in the lake due to complacency.
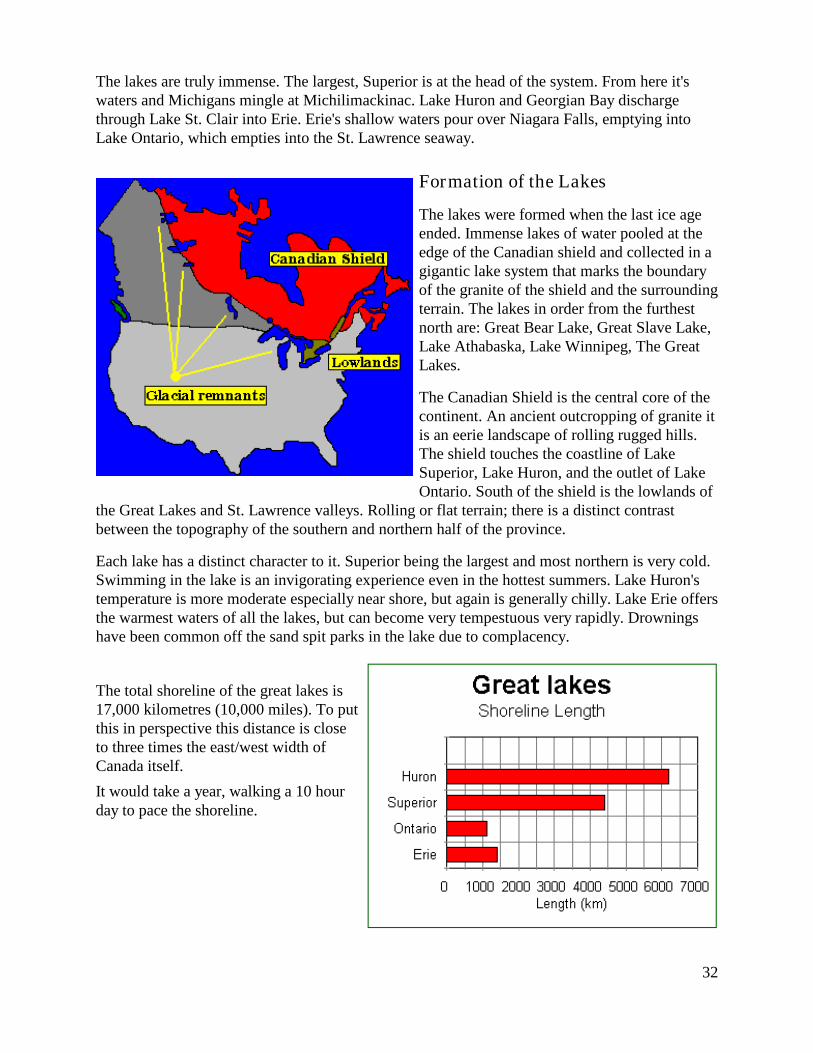
The total shoreline of the great lakes is17,000 kilometres (10,000 miles). To putthis in perspective this distance is closeto three times the east/west width ofCanada itself.
It would take a year, walking a 10 hourday to pace the shoreline.
33
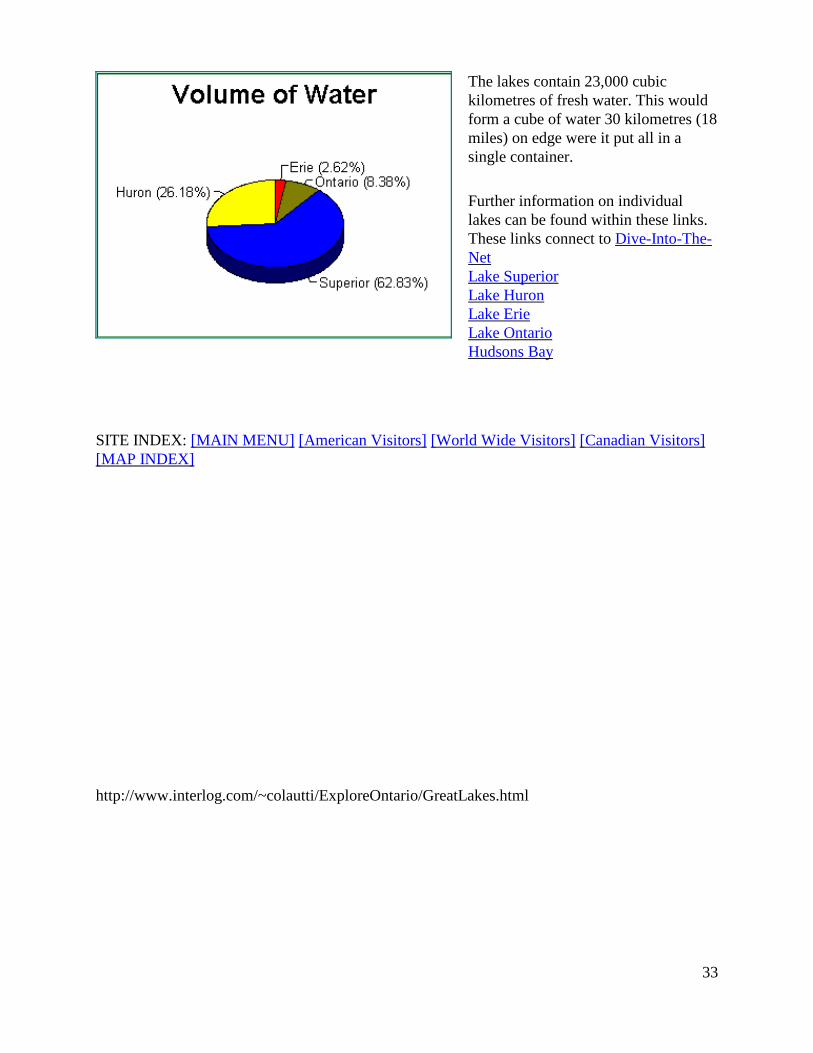
The lakes contain 23,000 cubickilometres of fresh water. This wouldform a cube of water 30 kilometres (18miles) on edge were it put all in asingle container.
Further information on individuallakes can be found within these links.These links connect to Dive-Into-The-NetLake SuperiorLake HuronLake ErieLake OntarioHudsons Bay
SITE INDEX: [MAIN MENU] [American Visitors] [World Wide Visitors] [Canadian Visitors][MAP INDEX]
http://www.interlog.com/~colautti/ExploreOntario/GreatLakes.html
34
T W O
Geology
The foundation for the present Great Lakes basin was set about 3 billion years ago, during thePrecambrian Era. This era occupies about five-sixths of all geological time and was a period of greatvolcanic activity and tremendous stresses, which formed great mountain systems. Early sedimentary andvolcanic rocks were folded and heated into complex structures. These were later eroded and, today,appear as the gently rolling hills and small mountain remnants of the Canadian Shield, which forms thenorthern and northwestern portions of the Great Lakes basin. Granitic rocks of the shield extendsouthward beneath the Paleozoic, sedimentary rocks where they form the 'basement' structure of thesouthern and eastern portions of the basin.
35
With the coming of the Paleozoic Era, most of central North Americawas flooded again and again by marine seas, which were inhabitedby a multitude of life forms, including corals, crinoids, brachiopodsand mollusks. The seas deposited lime silts, clays, sand and salts,which eventually consolidated into limestone, shales, sandstone,halite and gypsum.
During the Pleistocene Epoch, the continental glaciers repeatedlyadvanced over the Great Lakes region from the north. The firstglacier began to advance more than a million years ago. As theyinched forward, the glaciers, up to 2,000 metres (6,500 feet) thick,scoured the surface of the earth, leveled hills, and altered forever theprevious ecosystem. Valleys created by the river systems of theprevious era were deepened and enlarged to form the basins for theGreat Lakes. Thousands of years later, the climate began to warm,melting and slowly shrinking the glacier. This was followed by aninterglacial period during which vegetation and wildlife returned.The whole cycle was repeated several times.
Sand, silt, clay and boulders deposited by the glaciers occur invarious mixtures and forms. These deposits are collectively referredto as 'glacial drift' and include features such as moraines, which arelinear mounds of poorly sorted material or 'till', flat till plains, tilldrumlins, and eskers formed of well-sorted sands and gravelsdeposited from meltwater. Areas having substantial deposits of well-sorted sands and gravels (eskers, kames and outwash) are usuallysignificant groundwater storage and transmission areas called'aquifers'. These also serve as excellent sources of sand and gravelfor commercial extraction.
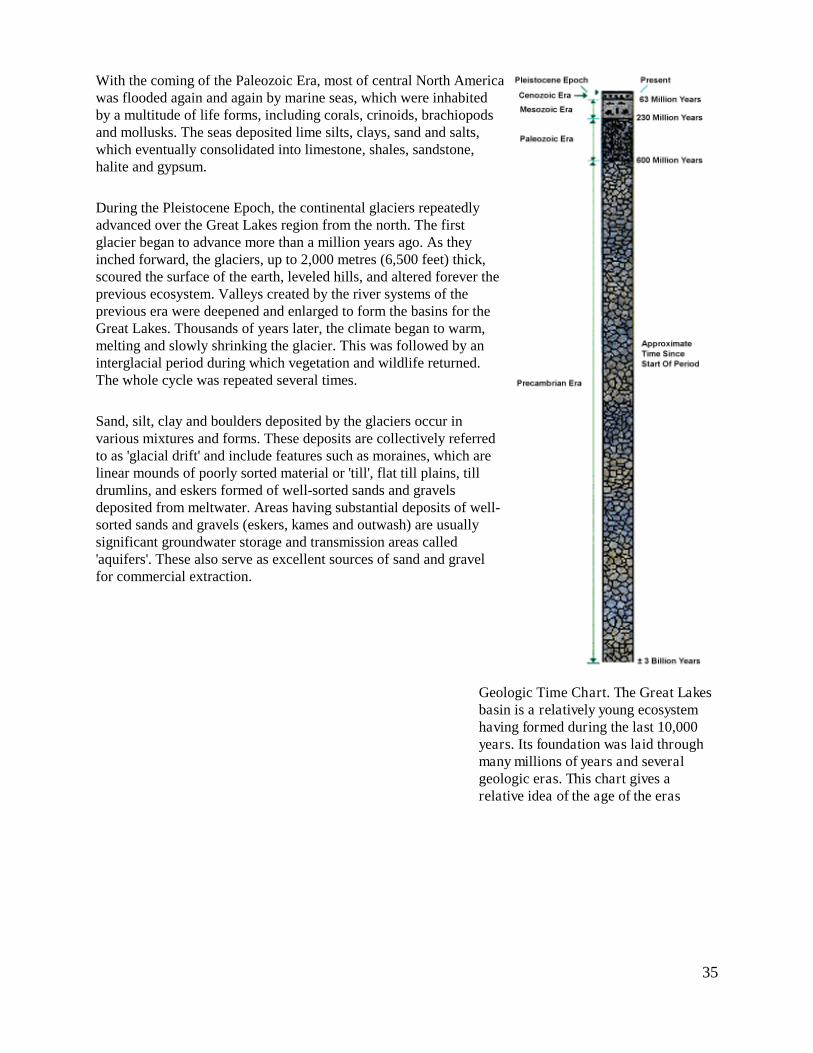
Geologic Time Chart. The Great Lakesbasin is a relatively young ecosystemhaving formed during the last 10,000years. Its foundation was laid throughmany millions of years and severalgeologic eras. This chart gives arelative idea of the age of the eras
36
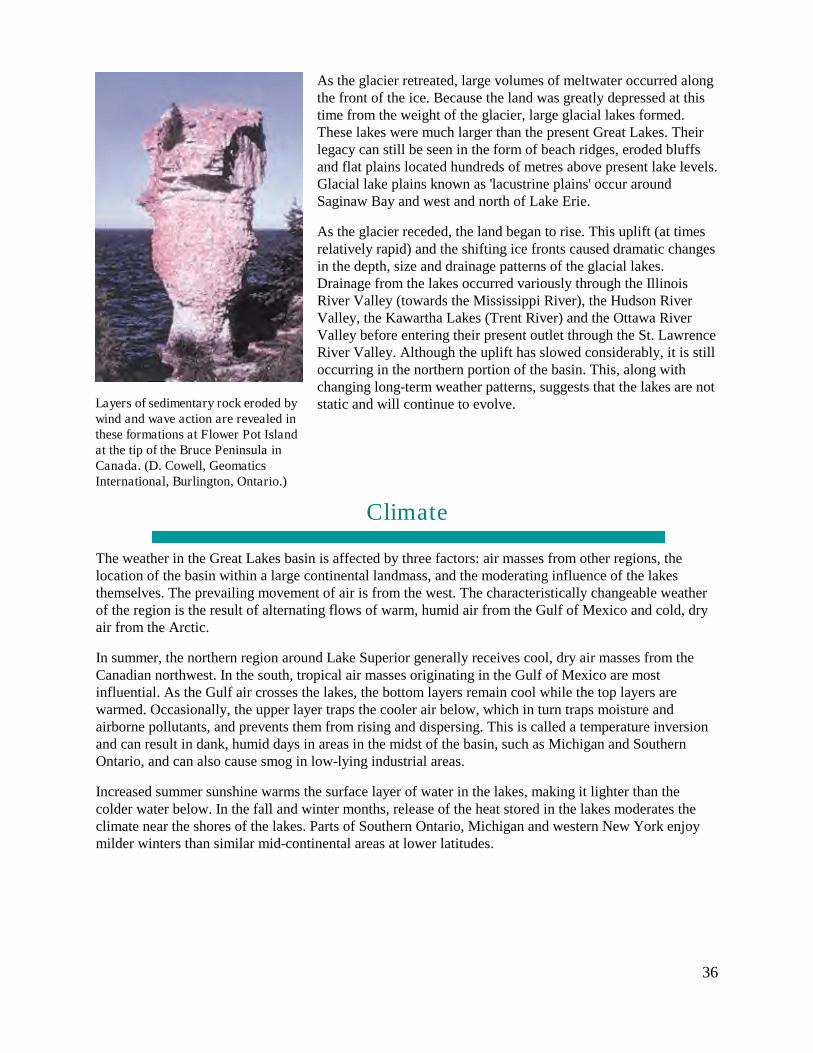
Layers of sedimentary rock eroded bywind and wave action are revealed inthese formations at Flower Pot Islandat the tip of the Bruce Peninsula inCanada. (D. Cowell, GeomaticsInternational, Burlington, Ontario.)
As the glacier retreated, large volumes of meltwater occurred alongthe front of the ice. Because the land was greatly depressed at thistime from the weight of the glacier, large glacial lakes formed.These lakes were much larger than the present Great Lakes. Theirlegacy can still be seen in the form of beach ridges, eroded bluffsand flat plains located hundreds of metres above present lake levels.Glacial lake plains known as 'lacustrine plains' occur aroundSaginaw Bay and west and north of Lake Erie.
As the glacier receded, the land began to rise. This uplift (at timesrelatively rapid) and the shifting ice fronts caused dramatic changesin the depth, size and drainage patterns of the glacial lakes.Drainage from the lakes occurred variously through the IllinoisRiver Valley (towards the Mississippi River), the Hudson RiverValley, the Kawartha Lakes (Trent River) and the Ottawa RiverValley before entering their present outlet through the St. LawrenceRiver Valley. Although the uplift has slowed considerably, it is stilloccurring in the northern portion of the basin. This, along withchanging long-term weather patterns, suggests that the lakes are notstatic and will continue to evolve.
Climate
The weather in the Great Lakes basin is affected by three factors: air masses from other regions, thelocation of the basin within a large continental landmass, and the moderating influence of the lakesthemselves. The prevailing movement of air is from the west. The characteristically changeable weatherof the region is the result of alternating flows of warm, humid air from the Gulf of Mexico and cold, dryair from the Arctic.
In summer, the northern region around Lake Superior generally receives cool, dry air masses from theCanadian northwest. In the south, tropical air masses originating in the Gulf of Mexico are mostinfluential. As the Gulf air crosses the lakes, the bottom layers remain cool while the top layers arewarmed. Occasionally, the upper layer traps the cooler air below, which in turn traps moisture andairborne pollutants, and prevents them from rising and dispersing. This is called a temperature inversionand can result in dank, humid days in areas in the midst of the basin, such as Michigan and SouthernOntario, and can also cause smog in low-lying industrial areas.
Increased summer sunshine warms the surface layer of water in the lakes, making it lighter than thecolder water below. In the fall and winter months, release of the heat stored in the lakes moderates theclimate near the shores of the lakes. Parts of Southern Ontario, Michigan and western New York enjoymilder winters than similar mid-continental areas at lower latitudes.

37
Winter on the lakes is characterized by alternatingflows of frigid arctic air and moderating air massesfrom the Gulf of Mexico. Heavy snowfallsfrequently occur on the lee side of the lakes. (D.Cowell, Geomatics International, Burlington,Ontario.)
In the autumn, the rapid movement and occasional clash of warm and cold air masses through the regionproduce strong winds. Air temperatures begin to drop gradually and less sunlight, combined withincreased cloudiness, signal more storms and precipitation. Late autumn storms are often the mostperilous for navigation and shipping on the lakes.
In winter, the Great Lakes region is affected by twomajor air masses. Arctic air from the northwest is verycold and dry when it enters the basin, but is warmed andpicks up moisture traveling over the comparativelywarmer lakes. When it reaches the land, the moisturecondenses as snow, creating heavy snowfalls on the leeside of the lakes in areas frequently referred to assnowbelts. For part of the winter, the region is affectedby Pacific air masses that have lost much of theirmoisture crossing the western mountains. Lessfrequently, air masses enter the basin from thesouthwest, bringing in moisture from the Gulf ofMexico. This air is slightly warmer and more humid.During the winter, the temperature of the lakescontinues to drop. Ice frequently covers Lake Erie butseldom fully covers the other lakes.
Spring in the Great Lakes region, like autumn, ischaracterized by variable weather. Alternating airmasses move through rapidly, resulting in frequentcloud cover and thunderstorms. By early spring, thewarmer air and increased sunshine begin to melt thesnow and lake ice, starting again the thermal layering ofthe lakes. The lakes are slower to warm than the landand tend to keep adjacent land areas cool, thusprolonging cool conditions sometimes well into April.Most years, this delays the leafing and blossoming ofplants, protecting tender plants, such as fruit trees, fromlate frosts. This extended state of dormancy allowsplants from somewhat warmer climates to survive in thewestern shadow of the lakes. It is also the reason for thepresence of vineyards in those areas.
Climate Change And The Great Lakes
At various times throughout its history, the Great Lakes basin has been covered by thick glaciers andtropical forests, but these changes occurred before humans occupied the basin. Present-day concern aboutthe atmosphere is premised on the belief that society at large, through its means of production and modesof daily activity, especially by ever increasing carbon dioxide emissions, may be modifying the climate ata rate unprecedented in history.
The very prevalent 'greenhouse effect' is actually a natural phenomenon. It is a process by which watervapor and carbon dioxide in the atmosphere absorb heat given off by the earth and radiate it back to thesurface. Consequently the earth remains warm and habitable (16°C average world temperature ratherthan -18°C without the greenhouse effect). However, humans have increased the carbon dioxide present
38
in the atmosphere since the industrial revolution from 280 parts per million to the present 350 ppm, andsome predict that the concentration will reach twice its pre-industrial levels by the middle of the nextcentury.
Climatologists, using the General Circulation Model (GCM), have been able to determine the manner inwhich the increase of carbon dioxide emissions will affect the climate in the Great Lakes basin. Severalof these models exist and show that at twice the carbon dioxide level, the climate of the basin will bewarmer by 2-4°C and slightly damper than at present. For example, Toronto's climate would resemblethe present climate of southern Ohio. Warmer climates mean increased evaporation from the lakesurfaces and evapotranspiration from the land surface of the basin. This in turn will augment thepercentage of precipitation that is returned to the atmosphere. Studies have shown that the resulting netbasin supply, the amount of water contributed by each lake basin to the overall hydrologic system, will bedecreased by 23 to 50 percent. The resulting decreases in average lake levels will be from half a metre totwo metres, depending on the GCM used.
Large declines in lake levels would create large-scale economic concern for the commercial users of thewater system. Shipping companies and hydroelectric power companies would suffer economicrepercussions, and harbors and marinas would be adversely affected. While the precision of suchprojections remains uncertain, the possibility of their accuracy embraces important long-termimplications for the Great Lakes.
The potential effects of climate change on human health in the Great Lakes region are also of concern,and researchers can only speculate as to what might occur. For example, weather disturbances, drought,and changes in temperature and growing season could affect crops and food production in the basin.Changes in air pollution patterns as a result of climate change could affect respiratory health, causingasthma, and new disease vectors and agents could migrate into the region.
The Hydrologic Cycle
Water is a renewable resource. It is continually replenished in ecosystems through the hydrologic cycle.Water evaporates in contact with dry air, forming water vapor. The vapor can remain as a gas,contributing to the humidity of the atmosphere; or it can condense and form water droplets, which, if theyremain in the air, form fog and clouds. In the Great Lakes basin, much of the moisture in the regionevaporates from the surface of the lakes. Other sources of moisture include the surface of small lakes andtributaries, moisture on the land mass and water released by plants. Global movements of air also carrymoisture into the basin, especially from the tropics.
Moisture-bearing air masses move through the basin and deposit their moisture as rain, snow, hail orsleet. Some of this precipitation returns to the atmosphere and some falls on the surfaces of the GreatLakes to become part of the vast quantity of stored fresh water once again. Precipitation that falls on theland returns to the lakes as surface runoff or infiltrates the soil and becomes groundwater.
Whether it becomes surface runoff or groundwater depends upon a number of factors. Sandy soils,gravels and some rock types contribute to groundwater flows, whereas clays and impermeable rockscontribute to surface runoff. Water falling on sloped areas tends to run off rapidly, while water falling onflat areas tends to be absorbed or stored on the surface. Vegetation also tends to decrease surface runoff;root systems hold moisture-laden soil readily, and water remains on plants.
39
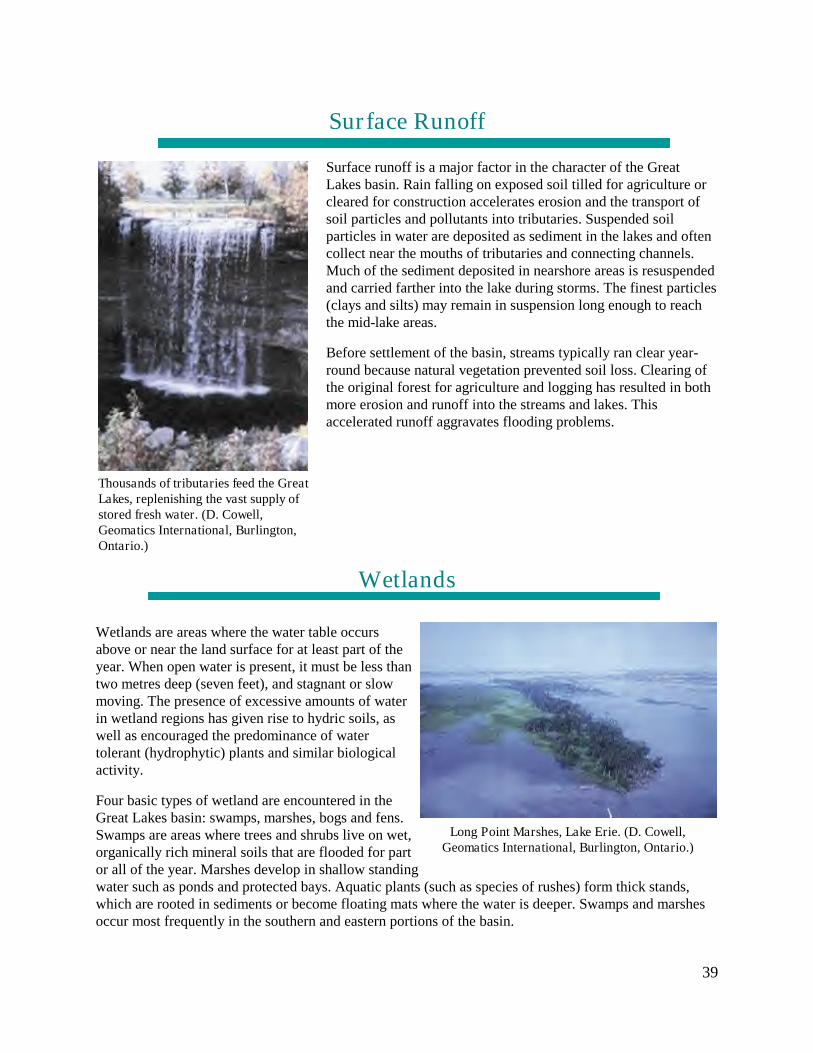
Long Point Marshes, Lake Erie. (D. Cowell,Geomatics International, Burlington, Ontario.)
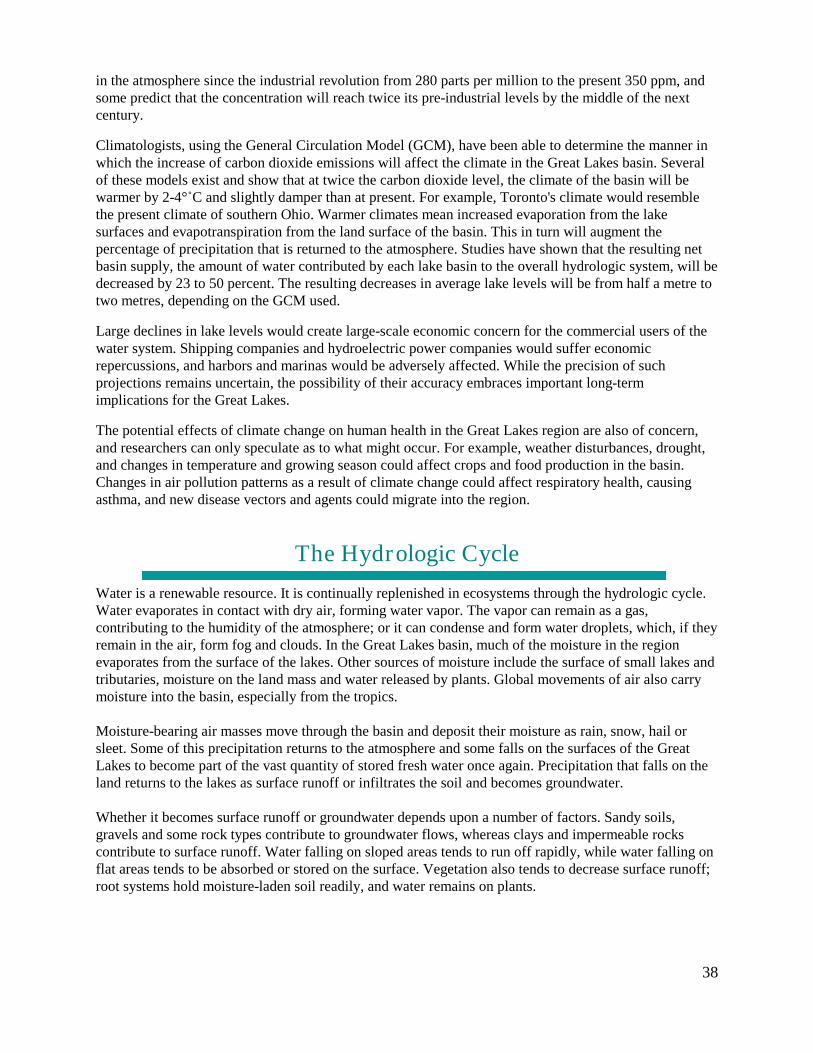
Thousands of tributaries feed the GreatLakes, replenishing the vast supply ofstored fresh water. (D. Cowell,Geomatics International, Burlington,Ontario.)
Surface Runoff
Surface runoff is a major factor in the character of the GreatLakes basin. Rain falling on exposed soil tilled for agriculture orcleared for construction accelerates erosion and the transport ofsoil particles and pollutants into tributaries. Suspended soilparticles in water are deposited as sediment in the lakes and oftencollect near the mouths of tributaries and connecting channels.Much of the sediment deposited in nearshore areas is resuspendedand carried farther into the lake during storms. The finest particles(clays and silts) may remain in suspension long enough to reachthe mid-lake areas.
Before settlement of the basin, streams typically ran clear year-round because natural vegetation prevented soil loss. Clearing ofthe original forest for agriculture and logging has resulted in bothmore erosion and runoff into the streams and lakes. Thisaccelerated runoff aggravates flooding problems.
Wetlands
Wetlands are areas where the water table occursabove or near the land surface for at least part of theyear. When open water is present, it must be less thantwo metres deep (seven feet), and stagnant or slowmoving. The presence of excessive amounts of waterin wetland regions has given rise to hydric soils, aswell as encouraged the predominance of watertolerant (hydrophytic) plants and similar biologicalactivity.
Four basic types of wetland are encountered in theGreat Lakes basin: swamps, marshes, bogs and fens.Swamps are areas where trees and shrubs live on wet,organically rich mineral soils that are flooded for partor all of the year. Marshes develop in shallow standingwater such as ponds and protected bays. Aquatic plants (such as species of rushes) form thick stands,which are rooted in sediments or become floating mats where the water is deeper. Swamps and marshesoccur most frequently in the southern and eastern portions of the basin.
40
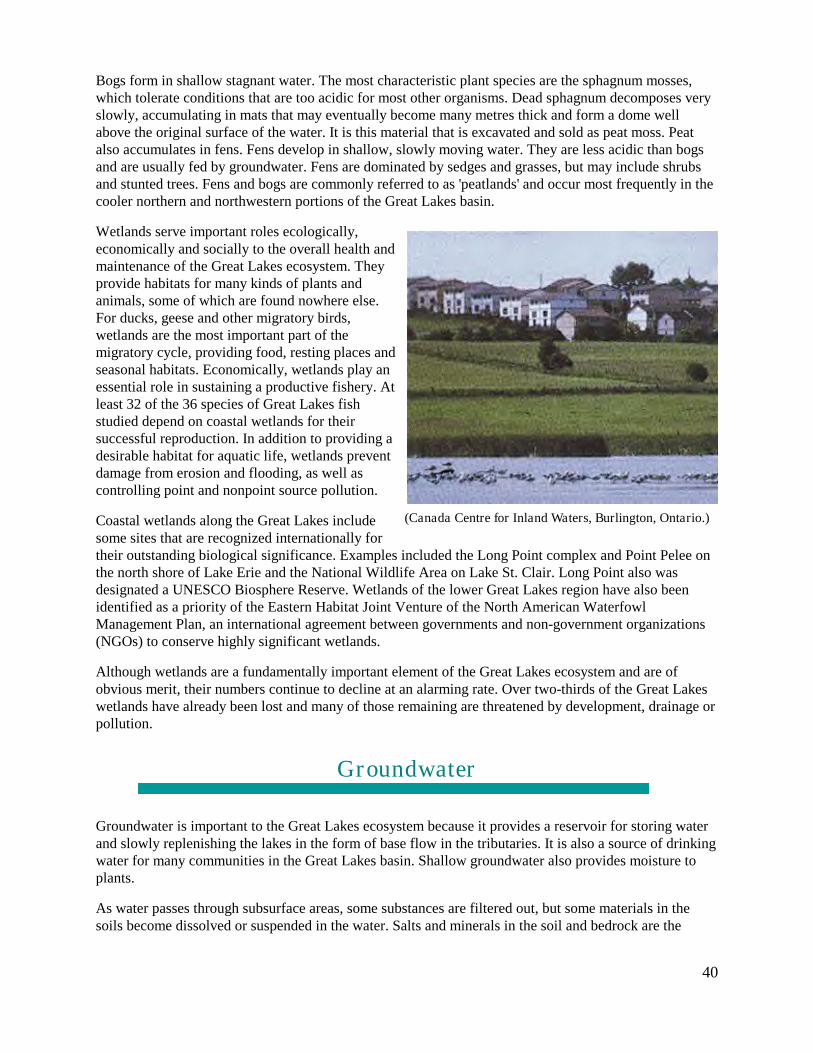
(Canada Centre for Inland Waters, Burlington, Ontario.)
Bogs form in shallow stagnant water. The most characteristic plant species are the sphagnum mosses,which tolerate conditions that are too acidic for most other organisms. Dead sphagnum decomposes veryslowly, accumulating in mats that may eventually become many metres thick and form a dome wellabove the original surface of the water. It is this material that is excavated and sold as peat moss. Peatalso accumulates in fens. Fens develop in shallow, slowly moving water. They are less acidic than bogsand are usually fed by groundwater. Fens are dominated by sedges and grasses, but may include shrubsand stunted trees. Fens and bogs are commonly referred to as 'peatlands' and occur most frequently in thecooler northern and northwestern portions of the Great Lakes basin.
Wetlands serve important roles ecologically,economically and socially to the overall health andmaintenance of the Great Lakes ecosystem. Theyprovide habitats for many kinds of plants andanimals, some of which are found nowhere else.For ducks, geese and other migratory birds,wetlands are the most important part of themigratory cycle, providing food, resting places andseasonal habitats. Economically, wetlands play anessential role in sustaining a productive fishery. Atleast 32 of the 36 species of Great Lakes fishstudied depend on coastal wetlands for theirsuccessful reproduction. In addition to providing adesirable habitat for aquatic life, wetlands preventdamage from erosion and flooding, as well ascontrolling point and nonpoint source pollution.
Coastal wetlands along the Great Lakes includesome sites that are recognized internationally fortheir outstanding biological significance. Examples included the Long Point complex and Point Pelee onthe north shore of Lake Erie and the National Wildlife Area on Lake St. Clair. Long Point also wasdesignated a UNESCO Biosphere Reserve. Wetlands of the lower Great Lakes region have also beenidentified as a priority of the Eastern Habitat Joint Venture of the North American WaterfowlManagement Plan, an international agreement between governments and non-government organizations(NGOs) to conserve highly significant wetlands.
Although wetlands are a fundamentally important element of the Great Lakes ecosystem and are ofobvious merit, their numbers continue to decline at an alarming rate. Over two-thirds of the Great Lakeswetlands have already been lost and many of those remaining are threatened by development, drainage orpollution.
Groundwater
Groundwater is important to the Great Lakes ecosystem because it provides a reservoir for storing waterand slowly replenishing the lakes in the form of base flow in the tributaries. It is also a source of drinkingwater for many communities in the Great Lakes basin. Shallow groundwater also provides moisture toplants.
As water passes through subsurface areas, some substances are filtered out, but some materials in thesoils become dissolved or suspended in the water. Salts and minerals in the soil and bedrock are the

41
During storms, high winds and rapid changes inbarometric pressure cause severe wave conditions atshorelines. (D. Cowell, Geomatics International,Burlington, Ontario.)
source of what is referred to as 'hard' water, a common feature of well water in the lower Great Lakesbasin.
Groundwater can also pick up materials of human origin that have been buried in dumps and landfillsites. Groundwater contamination problems can occur in both urban-industrial and agricultural areas.Protection and inspection of groundwater is essential to protect the quality of the entire water supplyconsumed by basin populations, because the underground movement of water is believed to be a majorpathway for the transport of pollution to the Great Lakes. Groundwater may discharge directly to thelakes or indirectly as base flow to the tributaries.
Lake Levels
The Great Lakes are part of the global hydrologicsystem. Prevailing westerly winds continuouslycarry moisture into the basin in air masses fromother parts of the continent. At the same time, thebasin loses moisture in departing air masses byevaporation and transpiration, and through theoutflow of the St. Lawrence River. Over time, thequantity lost equals what is gained, but lake levelscan vary substantially over short-term, seasonaland long-term periods.
Day-to-day changes are caused by winds that pushwater on shore. This is called 'wind set-up' and isusually associated with a major lake storm, whichmay last for hours or days. Another extreme formof oscillation, known as a 'seiche', occurs with rapid changes in winds and barometric pressure.
Annual or seasonal variations in water levels are based mainly on changes in precipitation and runoff tothe Great Lakes. Generally, the lowest levels occur in winter when much of the precipitation is locked upin ice and snow on land, and dry winter air masses pass over the lakes enhancing evaporation. Levels arehighest in summer after the spring thaw when runoff increases.
The irregular long-term cycles correspond to long-term trends in precipitation and temperature, thecauses of which have yet to be adequately explained. Highest levels occur during periods of abundantprecipitation and lower temperatures that decrease evaporation. During periods of high lake levels,storms cause considerable flooding and shoreline erosion, which often result in property damage. Muchof the damage is attributable to intensive shore development, which alters protective dunes and wetlands,removes stabilizing vegetation, and generally reduces the ability of the shoreline to withstand thedamaging effects of wind and waves.

42
Wind Set-up is a local rise in water caused bywinds pushing water to one side of a lake.
High lake levels and severe weatherconditions can cause damage tounprotected properties. Above,shoreline damage to the southernshore of Lake Michigan. (U.S.National Parks Service, IndianaDunes National Lakeshore.)
Great Lakes Hydrograph. The Hydrograph for the Great Lakes shows the variations in water levels andthe relationship of precipitation to water levels.
The International Joint Commission, the binationalagency established under the Boundary Waters Treaty of1909 between Canada and the U.S., has theresponsibility for regulation of flows on the St. Marysand the St. Lawrence Rivers. These channels have beenaltered byenlargement andplacement of controlworks associated withdeep-draft shipping.
Agreements between the U.S. and Canada govern the flow through thecontrol works on these connecting channels.
The water from Lake Michigan flows to Lake Huron through theStraits of Mackinac. These straits are deep and wide, resulting in LakesMichigan and Huron standing at the same elevation. There are noartificial controls on the St. Clair and Detroit Rivers that could changethe flow from the Michigan-Huron Lakes system into Lake Erie. Theoutflow of Lake Erie via the Niagara River is also uncontrolled, exceptfor some diversion of water through the Welland Canal. A largepercentage of the Niagara River flow is diverted through hydroelectricpower plants at Niagara Falls, but this diversion has no effect on lakelevels.
Studies of possible further regulation of flows and lake levels haveconcluded that natural fluctuation is huge compared with the influenceof existing control works. Further regulation by engineering systemscould not be justified in light of the cost and other impacts. Just oneinch (two and a half centimetres) of water on the surface of LakesMichigan and Huron amounts to more than 36 billion cubic metres ofwater (about 1,260 billion cubic feet).
43
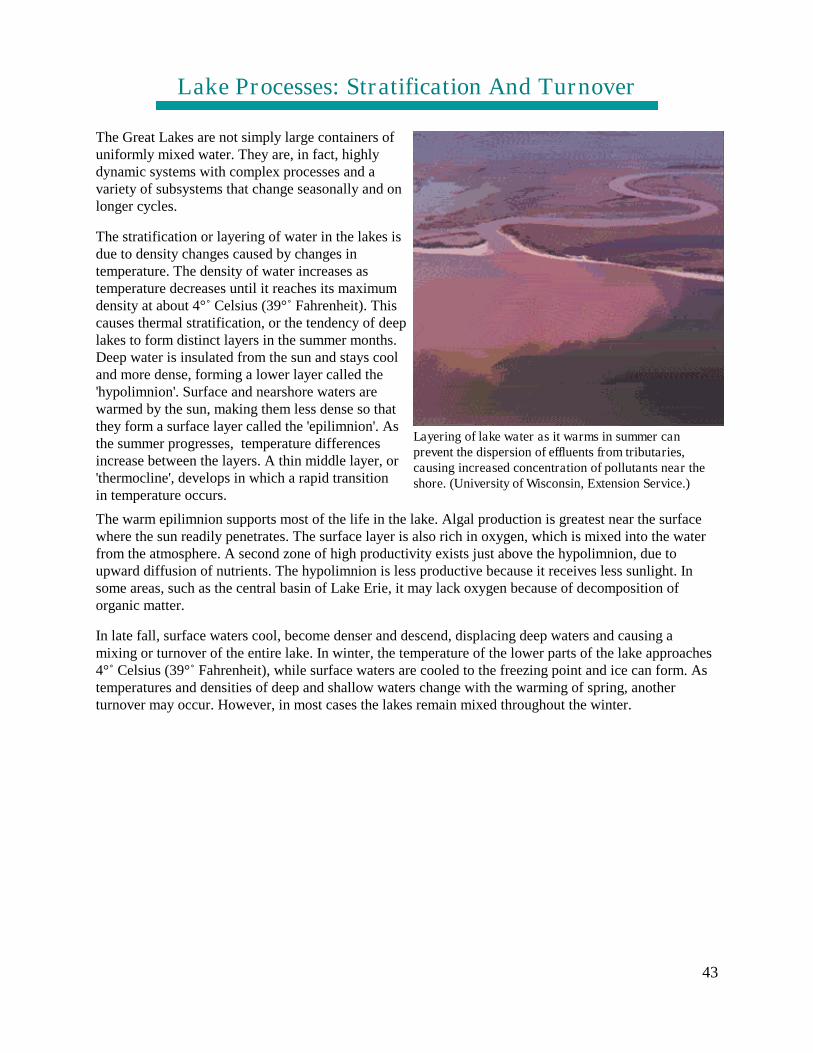
Layering of lake water as it warms in summer canprevent the dispersion of effluents from tributaries,causing increased concentration of pollutants near theshore. (University of Wisconsin, Extension Service.)
Lake Processes: Stratification And Turnover
The Great Lakes are not simply large containers ofuniformly mixed water. They are, in fact, highlydynamic systems with complex processes and avariety of subsystems that change seasonally and onlonger cycles.
The stratification or layering of water in the lakes isdue to density changes caused by changes intemperature. The density of water increases astemperature decreases until it reaches its maximumdensity at about 4° Celsius (39° Fahrenheit). Thiscauses thermal stratification, or the tendency of deeplakes to form distinct layers in the summer months.Deep water is insulated from the sun and stays cooland more dense, forming a lower layer called the'hypolimnion'. Surface and nearshore waters arewarmed by the sun, making them less dense so thatthey form a surface layer called the 'epilimnion'. Asthe summer progresses, temperature differencesincrease between the layers. A thin middle layer, or'thermocline', develops in which a rapid transitionin temperature occurs.
The warm epilimnion supports most of the life in the lake. Algal production is greatest near the surfacewhere the sun readily penetrates. The surface layer is also rich in oxygen, which is mixed into the waterfrom the atmosphere. A second zone of high productivity exists just above the hypolimnion, due toupward diffusion of nutrients. The hypolimnion is less productive because it receives less sunlight. Insome areas, such as the central basin of Lake Erie, it may lack oxygen because of decomposition oforganic matter.
In late fall, surface waters cool, become denser and descend, displacing deep waters and causing amixing or turnover of the entire lake. In winter, the temperature of the lower parts of the lake approaches4° Celsius (39° Fahrenheit), while surface waters are cooled to the freezing point and ice can form. Astemperatures and densities of deep and shallow waters change with the warming of spring, anotherturnover may occur. However, in most cases the lakes remain mixed throughout the winter.
44
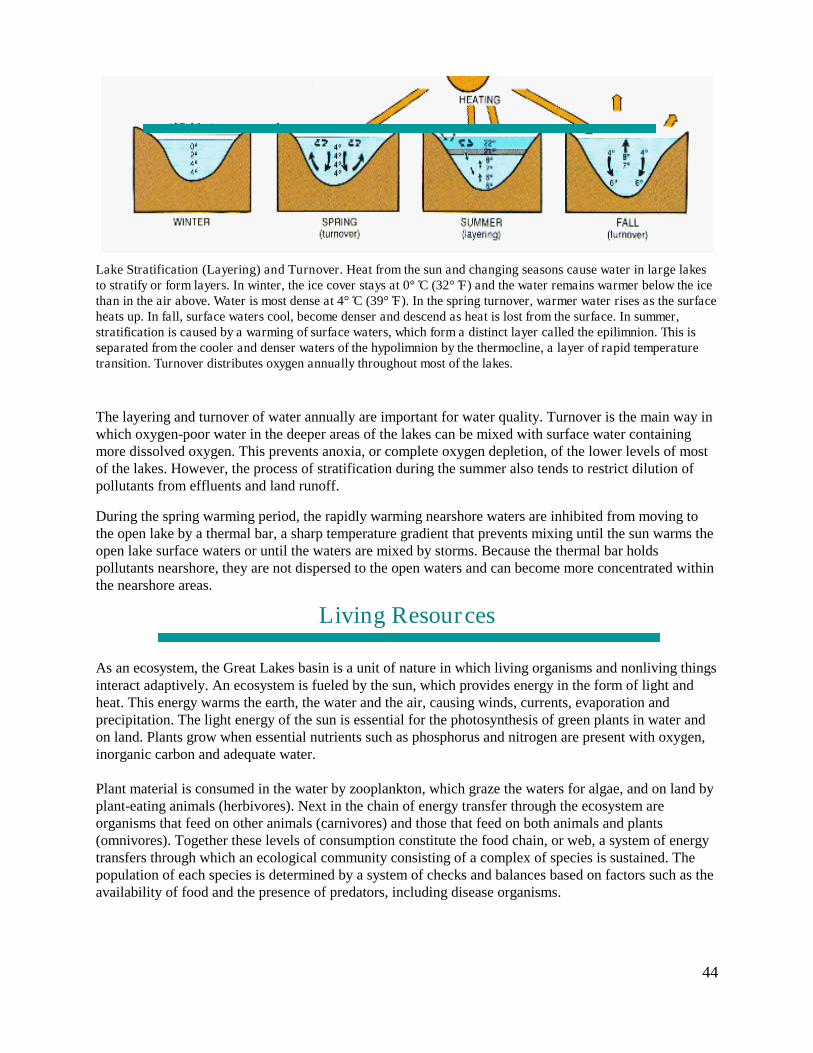
Lake Stratification (Layering) and Turnover. Heat from the sun and changing seasons cause water in large lakesto stratify or form layers. In winter, the ice cover stays at 0°C (32°F) and the water remains warmer below the icethan in the air above. Water is most dense at 4°C (39°F). In the spring turnover, warmer water rises as the surfaceheats up. In fall, surface waters cool, become denser and descend as heat is lost from the surface. In summer,stratification is caused by a warming of surface waters, which form a distinct layer called the epilimnion. This isseparated from the cooler and denser waters of the hypolimnion by the thermocline, a layer of rapid temperaturetransition. Turnover distributes oxygen annually throughout most of the lakes.
The layering and turnover of water annually are important for water quality. Turnover is the main way inwhich oxygen-poor water in the deeper areas of the lakes can be mixed with surface water containingmore dissolved oxygen. This prevents anoxia, or complete oxygen depletion, of the lower levels of mostof the lakes. However, the process of stratification during the summer also tends to restrict dilution ofpollutants from effluents and land runoff.
During the spring warming period, the rapidly warming nearshore waters are inhibited from moving tothe open lake by a thermal bar, a sharp temperature gradient that prevents mixing until the sun warms theopen lake surface waters or until the waters are mixed by storms. Because the thermal bar holdspollutants nearshore, they are not dispersed to the open waters and can become more concentrated withinthe nearshore areas.
Living Resources
As an ecosystem, the Great Lakes basin is a unit of nature in which living organisms and nonliving thingsinteract adaptively. An ecosystem is fueled by the sun, which provides energy in the form of light andheat. This energy warms the earth, the water and the air, causing winds, currents, evaporation andprecipitation. The light energy of the sun is essential for the photosynthesis of green plants in water andon land. Plants grow when essential nutrients such as phosphorus and nitrogen are present with oxygen,inorganic carbon and adequate water.
Plant material is consumed in the water by zooplankton, which graze the waters for algae, and on land byplant-eating animals (herbivores). Next in the chain of energy transfer through the ecosystem areorganisms that feed on other animals (carnivores) and those that feed on both animals and plants(omnivores). Together these levels of consumption constitute the food chain, or web, a system of energytransfers through which an ecological community consisting of a complex of species is sustained. Thepopulation of each species is determined by a system of checks and balances based on factors such as theavailability of food and the presence of predators, including disease organisms.
45
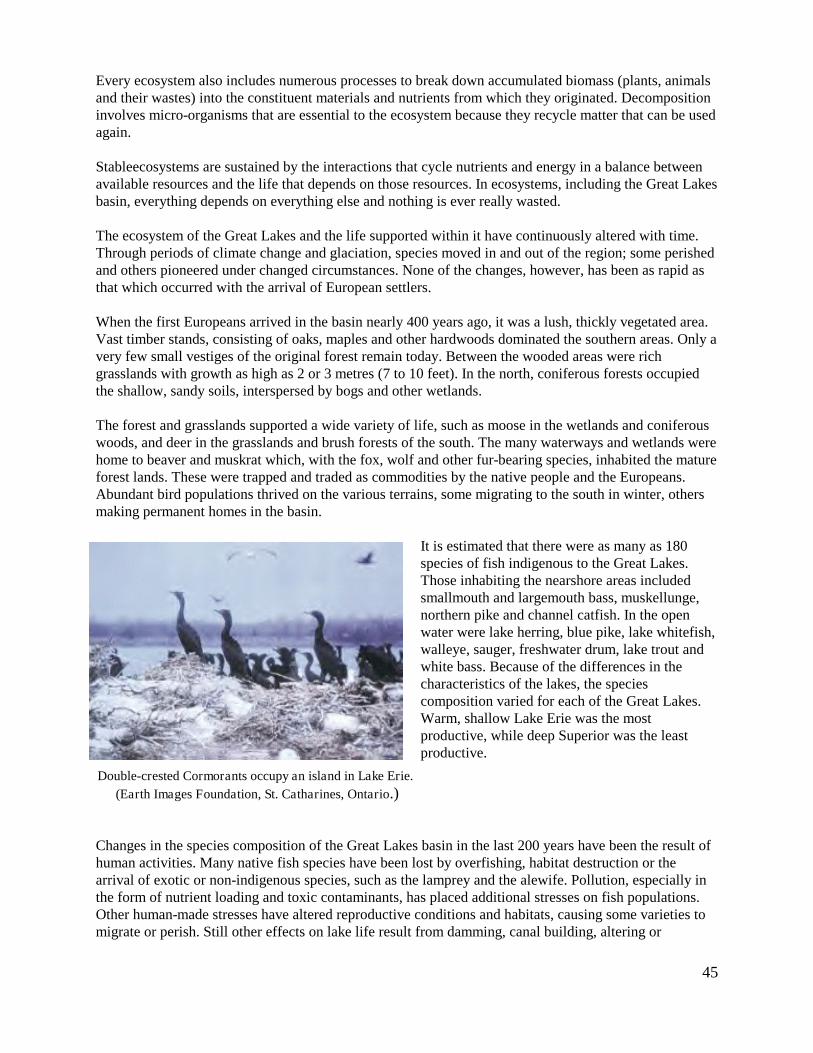
Double-crested Cormorants occupy an island in Lake Erie.
(Earth Images Foundation, St. Catharines, Ontario.)
Every ecosystem also includes numerous processes to break down accumulated biomass (plants, animalsand their wastes) into the constituent materials and nutrients from which they originated. Decompositioninvolves micro-organisms that are essential to the ecosystem because they recycle matter that can be usedagain.
Stableecosystems are sustained by the interactions that cycle nutrients and energy in a balance betweenavailable resources and the life that depends on those resources. In ecosystems, including the Great Lakesbasin, everything depends on everything else and nothing is ever really wasted.
The ecosystem of the Great Lakes and the life supported within it have continuously altered with time.Through periods of climate change and glaciation, species moved in and out of the region; some perishedand others pioneered under changed circumstances. None of the changes, however, has been as rapid asthat which occurred with the arrival of European settlers.
When the first Europeans arrived in the basin nearly 400 years ago, it was a lush, thickly vegetated area.Vast timber stands, consisting of oaks, maples and other hardwoods dominated the southern areas. Only avery few small vestiges of the original forest remain today. Between the wooded areas were richgrasslands with growth as high as 2 or 3 metres (7 to 10 feet). In the north, coniferous forests occupiedthe shallow, sandy soils, interspersed by bogs and other wetlands.
The forest and grasslands supported a wide variety of life, such as moose in the wetlands and coniferouswoods, and deer in the grasslands and brush forests of the south. The many waterways and wetlands werehome to beaver and muskrat which, with the fox, wolf and other fur-bearing species, inhabited the matureforest lands. These were trapped and traded as commodities by the native people and the Europeans.Abundant bird populations thrived on the various terrains, some migrating to the south in winter, othersmaking permanent homes in the basin.
It is estimated that there were as many as 180species of fish indigenous to the Great Lakes.Those inhabiting the nearshore areas includedsmallmouth and largemouth bass, muskellunge,northern pike and channel catfish. In the openwater were lake herring, blue pike, lake whitefish,walleye, sauger, freshwater drum, lake trout andwhite bass. Because of the differences in thecharacteristics of the lakes, the speciescomposition varied for each of the Great Lakes.Warm, shallow Lake Erie was the mostproductive, while deep Superior was the leastproductive.
Changes in the species composition of the Great Lakes basin in the last 200 years have been the result ofhuman activities. Many native fish species have been lost by overfishing, habitat destruction or thearrival of exotic or non-indigenous species, such as the lamprey and the alewife. Pollution, especially inthe form of nutrient loading and toxic contaminants, has placed additional stresses on fish populations.Other human-made stresses have altered reproductive conditions and habitats, causing some varieties tomigrate or perish. Still other effects on lake life result from damming, canal building, altering or

46
polluting tributaries to the lakes in which spawning takes place and where distinct ecosystems oncethrived and contributed to the larger basin ecosystem.
Information herein is provided by the U.S. EPA Great Lakes National Program Office. Its use andreference is unlimited, upon condition that the source is correctly attributed. Thank you. The Great LakesAtlas is also available on line.
http://epa.gov/glnpo/atlas/glat-ch2.html

47
AssessmentGrade 8
GEOSPHERE
Classroom Assessment Example SCI.V.1.HS.1
Using as many examples as possible, each student will prepare and deliver a speech to convincean interested friend, who hasn’t had Earth Science, that continental glaciers once coveredMichigan.
Students may include a well-labeled illustration.
Five examples of evidence supporting Ice Age theory:
The deposit of unsorted sediments (till) all over Michigan could only have been leftbehind by glaciers, since mass wasting cannot operate near hilltops.
Parallel scratches on bedrock were created when glaciers dragged rock against rock. Kettle lakes are depressions formed in glacial deposits created by melting ice blocks. Moraine ridges are generally parallel to Great Lakes shorelines, suggesting that ice
advanced out of lake basins. Large boulders of igneous or metamorphic origin left in sedimentary regions (erratics)
are too large and widespread to have been moved any other way.
(Give students rubric before activity.)
Scoring of Classroom Assessment Example SCI.V.1.HS.1
Criteria Apprentice Basic Meets Exceeds
Explanation ofrelationshipsbetween surfacefeature andglaciation
Explains therelationship forone to threeexamples ofevidence.
Explains therelationship forfour examples ofevidence.
Explains therelationship forfive examples ofevidence.
Explains andillustrates therelationship forfive examples ofevidence.
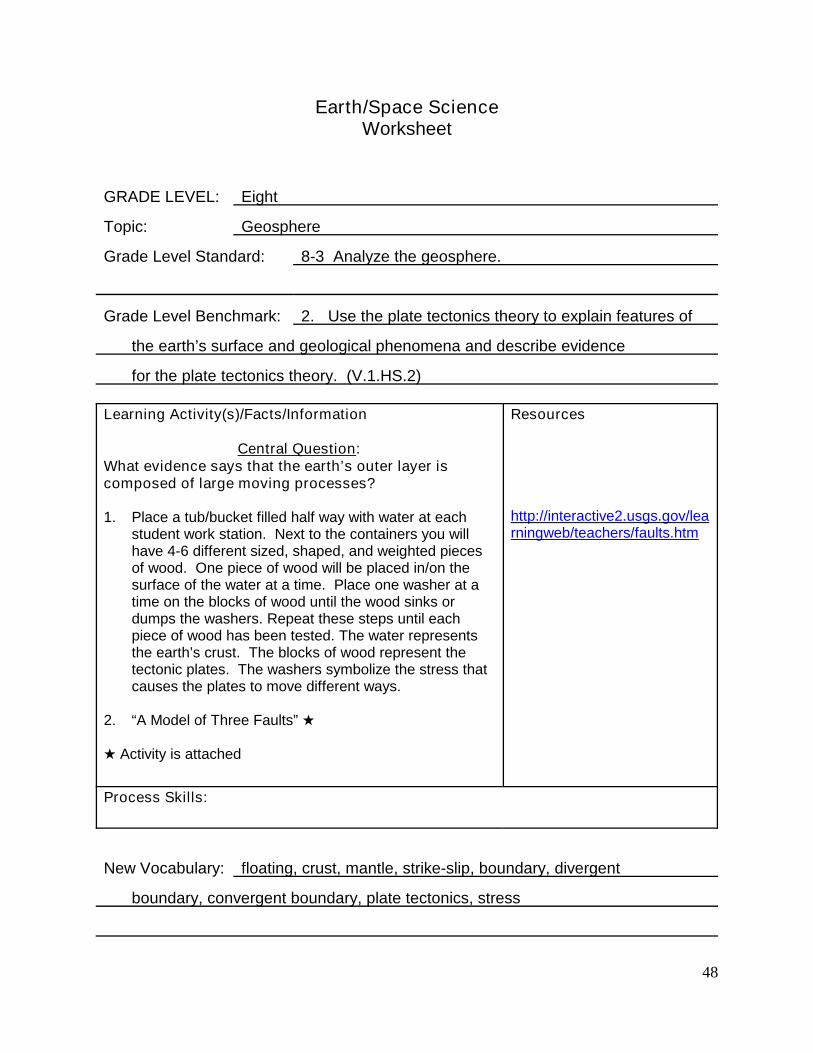
48
Earth/Space ScienceWorksheet
GRADE LEVEL: Eight
Topic: Geosphere
Grade Level Standard: 8-3 Analyze the geosphere.
Grade Level Benchmark: 2. Use the plate tectonics theory to explain features of
the earth’s surface and geological phenomena and describe evidence
for the plate tectonics theory. (V.1.HS.2)
Learning Activity(s)/Facts/Information
Central Question:What evidence says that the earth’s outer layer iscomposed of large moving processes?
1. Place a tub/bucket filled half way with water at eachstudent work station. Next to the containers you willhave 4-6 different sized, shaped, and weighted piecesof wood. One piece of wood will be placed in/on thesurface of the water at a time. Place one washer at atime on the blocks of wood until the wood sinks ordumps the washers. Repeat these steps until eachpiece of wood has been tested. The water representsthe earth’s crust. The blocks of wood represent thetectonic plates. The washers symbolize the stress thatcauses the plates to move different ways.
2. “A Model of Three Faults”
Activity is attached
Resources
http://interactive2.usgs.gov/learningweb/teachers/faults.htm
Process Skills:
New Vocabulary: floating, crust, mantle, strike-slip, boundary, divergent
boundary, convergent boundary, plate tectonics, stress
49
A MODEL OF THREE FAULTS
BACKGROUNDOne of the most frightening and destructive phenomena of nature is a severeearthquake and its terrible aftereffects. An earthquake is a sudden movement ofthe Earth, caused by the abrupt release of strain that has accumulated over a longtime. For hundreds of millions of years, the forces of plate tectonics have shapedthe Earth as the huge plates that form the Earth's surface slowly move over, underand past each other. Sometimes the movement is gradual. At other times, theplates are locked together, unable to release the accumulating energy. When theaccumulated energy grows strong enough, the plates break free. If the earthquakeoccurs in a populated area, it may cause many deaths and injuries and extensiveproperty damage.
Today we are challenging the assumption that earthquakes must present anuncontrollable and unforecastable hazard to life and property. Scientists havebegun to estimate the locations and likelihoods of future damaging earthquakes.Sites of greatest hazard are being identified, and designing structures that willwithstand the effects of earthquakes.
OBJECTIVEStudents will observe fault movements on a model of the earth's surface.
TIME NEEDED1 or 2 Class periods
MATERIALS NEEDED• Physiographic map of the world (per group)• Crayons or colored pens• Scissors• Tape or glue• Metric ruler• Construction paper• Fault Model Sheet (included)
INSTRUCTIONS1. Have students work in pairs or small groups.2. Display the fault models in the classroom after the activity.3. An excellent world physiographic map showing the ocean floor, can be
obtained from the National Geographic Society.
50
EXPLORATION PHASE – PART 1
1. You may wish to introduce this activity by asking students:a. Can you name a famous fault?b. What happens when giant fractures develop on the Earth and the pieces
move relative to one another?
2. Illustrate compressive earth movements using a large sponge by squeezingfrom both sides, causing uplift. Using a piece of latex rubber with a wide markdrawn on it, illustrate earth tension, by pulling the ends of the latex to showstretching and thinning.
3. Have students construct a fault model using the Fault Model Sheet.Instructions to students:a. Color the fault model that is included according to the color key provided.b. Paste or glue the fault model onto a piece of construction paper.c. Cut out the fault model and fold each side down to form a box with the
drawn features on top.d. Tape or glue the corners together. This box is a three dimensional model
or the top layers of the Earth’s crust.e. The dashed lines on your model represent a fault. Carefully cut along the
dashed lines. You will end up with two pieces. You may wish to have yourstudents tape or glue a piece of construction paper on the side of two faultblocks along the fault face. This will help with the demonstration. Note thatan enlarged version of the fault block model can be made for classroomdemonstrations.
4. Have students develop a model of a normal fault.a. Instructions to students: Locate points A and B on your model. Move point
B so that it is next to Point A. Observe your model from the side (its cross-section). Have students draw the normal fault as represented by the modelthey have just constructed.
CONCEPT DEVELOPMENT – PART 11. Ask the following questions:
a. Which way did point B move relative to point A?b. What happened to rock layers X, Y, and Z?c. Are the rock layers still continuous?d. What likely happened to the river? the road? the railroad tracks?e. Is this type of fault caused by tension, compression, or shearing?
2. Explain that this type of fault is known as a normal fault.
3. Have students label their drawing “normal fault”.

51
4. Many normal faults are found in Nevada. This is because Nevada is located ina region called the Basin and Range Province where the lithosphere isstretching.
EXPLORATION PHASE – PART 21. Have students develop a model of a thrust fault. Instructions to students:
a. Locate points C and D on your model. Move Point C next to point D.Observe the cross-section of your model.
b. Have students draw the thrust fault as represented by the model they havejust constructed.
CONCEPT DEVELOPMENT – PART 21. Ask the following questions:
a. Which way did point D move relative to point C?b. What happened to rock layers X, Y, and Z?c. Are the rock layers still continuous?d. What likely happened to the river? the road? the railroad tracks?e. Is this type of fault caused by tension, compression, or shearing?
2. Explain that this type of fault is known as a thrust fault.
3. Have students label their drawing “thrust fault”.
4. An example of a thrust fault is the fault in which the Northridge earthquakeoccurred. The thrusting movement raised the mountains in the area by asmuch as 70 cm.
EXPLORATION PHASE – PART 31. Have students develop a model of a strike-slip fault. Instructions to students:
a. Locate points F and G on your model. Move the pieces of the model sothat point F is next to point G.
b. Have students draw an overhead view of the surface as it looks aftermovement along the fault.
CONCEPT DEVELOPMENT – PART 31. Ask the following questions:
a. If you were standing at point F and looking across the fault, which way didthe block on the opposite side move?
b. What happened to rock layers X, Y, and Z?c. Are the rock layers still continuous?d. What likely happened to the river? the road? the railroad tracks?
52
e. If the scale used in this model is 1 mm = 2m, how many meters did theearth move when the strike-slip fault caused point F to move alongsidepoint G? (Note that this scale would make an unlikely size for the railroadtrack!) If there were a sudden horizontal shift of this magnitude it would beabout five times the shift that occurred in the 1906 San Andres fault as aresult of the San Francisco earthquake.
f. If this type of fault is known as a strike-slip fault.
2. Explain that this type of fault is known as a strike-slip fault.
3. Have students label their drawing “strike-slip fault”.
4. Explain to students that a strike-slip fault can be described as having right orleft-lateral movement. If you look directly across the fault, the direction that theopposite side moved defines whether the movement is left-lateral movement.If you look directly across the fault, the direction that the opposite side moveddefines whether the movement is left-lateral or right-lateral. The San Andreasfault in California is a right-lateral strike-slip fault.
APPLICATION PHASE1. Explain that faults are often (but not always) found near plate boundaries and
that each type of fault is frequently associated with specific types of platemovements. However, you can probably find all types of fault movementassociated with each type of plate boundary.a. Normal faults are often associated with divergent (tensional) boundaries.b. Thrust faults are often associated with convergent (compressional)
boundaries.c. Strike-slip faults are often associated with transform (sliding) boundaries.
2. Ask the following questions:a. What kind of faults would you expect to find in the Himalaya Mountains?b. What kind of faults would you expect to find along the Mid-Atlantic Ridge?
Why?c. What kind of fault is the San Andreas Fault? Is California likely to “fall off in
the Pacific Ocean”? Why?
3. Explain that not all faults are associated with plate boundaries. Explain thatthere is a broad range of faults based on type, linear extension, displacement,age, current or historical activity and location on continental or oceanic crust.Have students research examples of non-plate boundary faults.
4. Explain to students that the stresses and strains in the earth’s upper layers areinduced by many causes: thermal expansion and contraction, gravitationalforces, solid-earth tidal forces, specific volume changes because of mineralphase transitions, etc. Faulting is one of the various manners of mechanicaladjustment or release of such stress and strain.
5. Have students research and report on the types of faults found in your state?
53
EXTENSION1. Have students identify the fault movements in the recent Loma Prieta,
California earthquake.
2. Have students research the fault histories and recent theories concerning theNorthridge, California Earthquake, the New Madrid, Missouri, and theAnchorage, Alaska fault zones.
COLORING KEY• Rock Layer X - green• Rock Layer Y - yellow• Rock Layer Z - red• River -blue• Road -black• Railroad tracks - brown• Grass -green
U.S. Department of the Interior, U.S. Geological Survey, Reston, VA, USAURL http://interactive2.usgs.gov/learningweb/teachers/faults.htmEarth science questions: Earth Science Information CenterPage contact: Learning Web TeamUSGS Privacy StatementUSGS Child Privacy PolicyLast modification: 22 March 2001
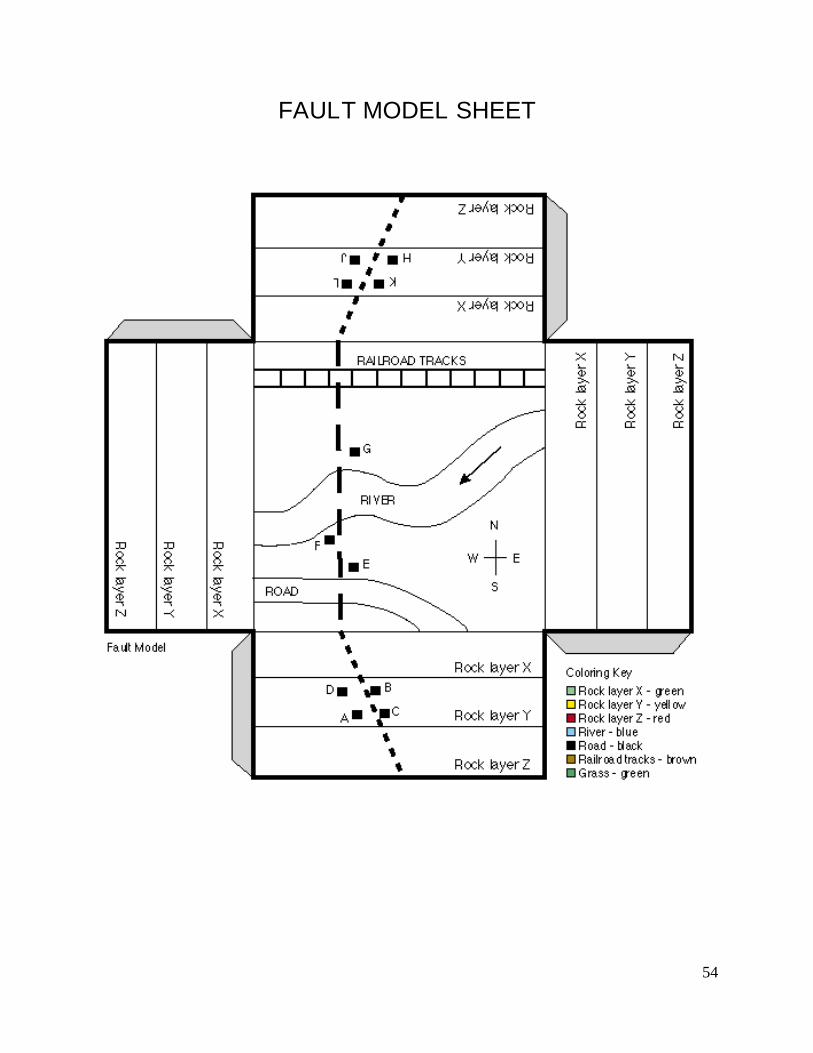
54
FAULT MODEL SHEET
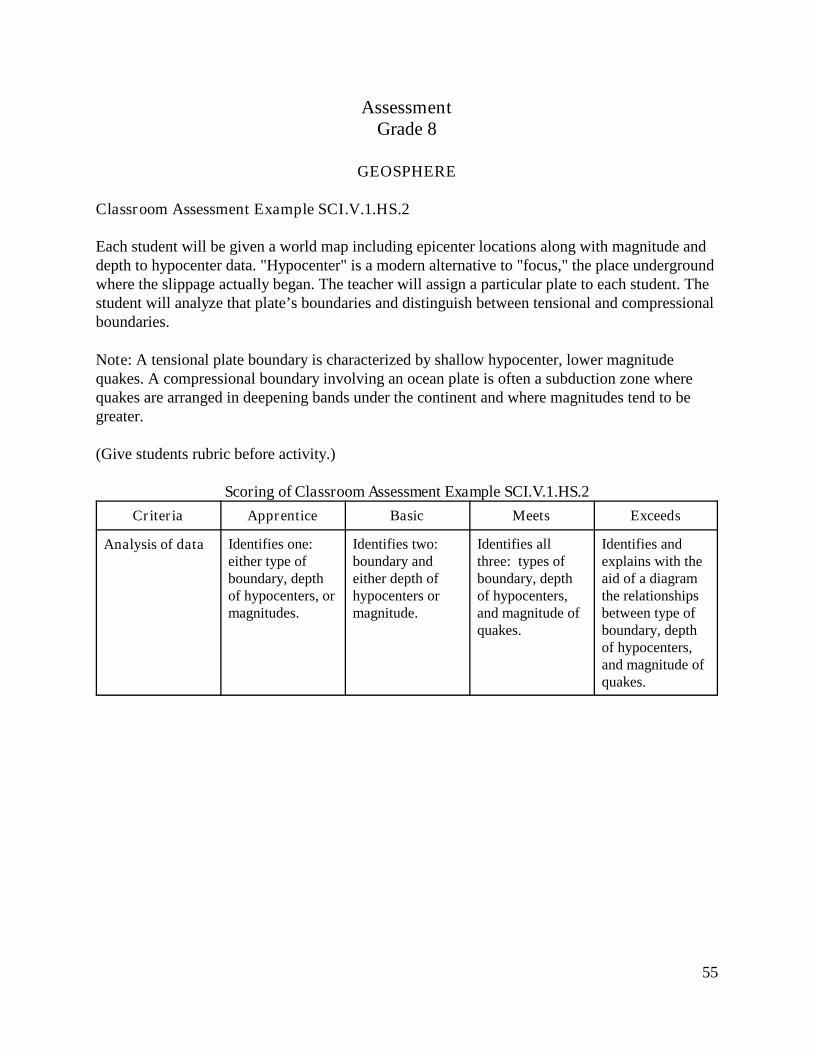
55
AssessmentGrade 8
GEOSPHERE
Classroom Assessment Example SCI.V.1.HS.2
Each student will be given a world map including epicenter locations along with magnitude anddepth to hypocenter data. "Hypocenter" is a modern alternative to "focus," the place undergroundwhere the slippage actually began. The teacher will assign a particular plate to each student. Thestudent will analyze that plate’s boundaries and distinguish between tensional and compressionalboundaries.
Note: A tensional plate boundary is characterized by shallow hypocenter, lower magnitudequakes. A compressional boundary involving an ocean plate is often a subduction zone wherequakes are arranged in deepening bands under the continent and where magnitudes tend to begreater.
(Give students rubric before activity.)
Scoring of Classroom Assessment Example SCI.V.1.HS.2
Criteria Apprentice Basic Meets Exceeds
Analysis of data Identifies one:either type ofboundary, depthof hypocenters, ormagnitudes.
Identifies two:boundary andeither depth ofhypocenters ormagnitude.
Identifies allthree: types ofboundary, depthof hypocenters,and magnitude ofquakes.
Identifies andexplains with theaid of a diagramthe relationshipsbetween type ofboundary, depthof hypocenters,and magnitude ofquakes.

56
Earth/Space ScienceWorksheet
GRADE LEVEL: Eight
Topic: Geosphere
Grade Level Standard: 8-3 Analyze the geosphere.
Grade Level Benchmark: 3. Explain how common objects are made from earth
materials and why earth materials are conserved and recycled. (V.I.HS.3)
Learning Activity(s)/Facts/Information
Central Question:Is recycling necessary for naturally occurringmaterials?
1. Make a list of 10 items the students use everyday andgroup them into man made vs. naturally occurring.
2. Compare and contrast the prices and costs of newversus recycled products.
3. Paper—Is recycling necessary/beneficial for the year“20_ _”?
Resources
Process Skills:
New Vocabulary: land development, renewable and non-renewable resources
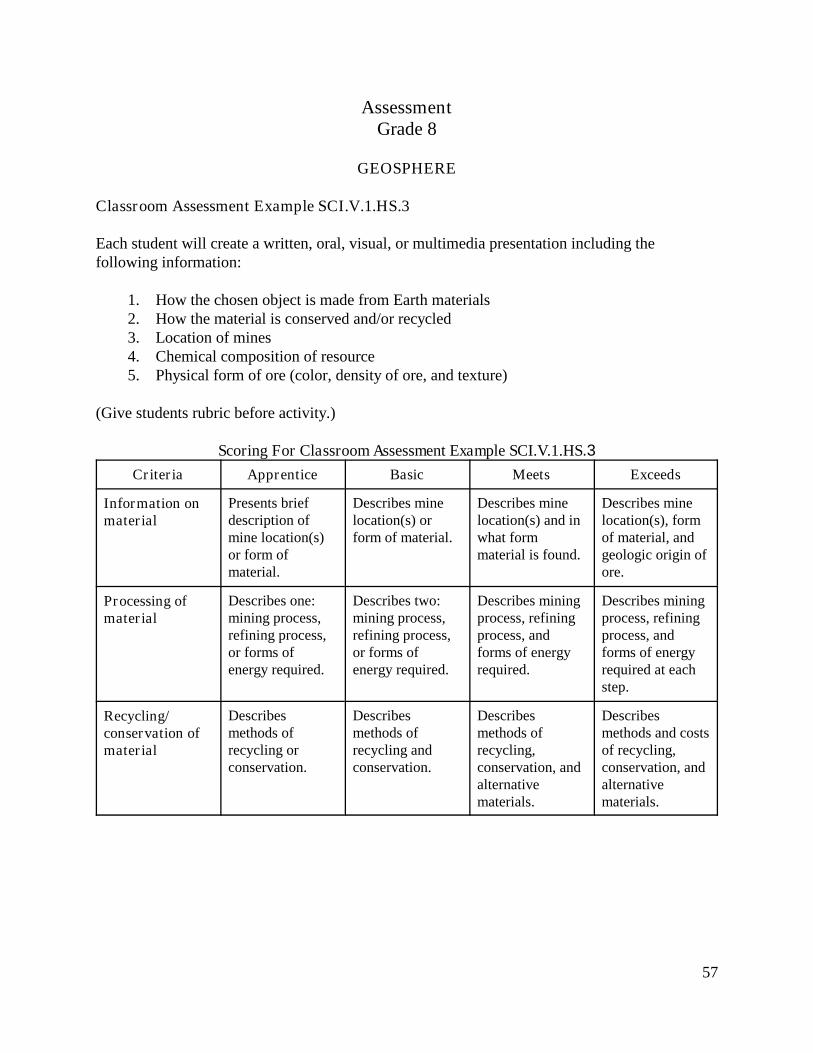
57
AssessmentGrade 8
GEOSPHERE
Classroom Assessment Example SCI.V.1.HS.3
Each student will create a written, oral, visual, or multimedia presentation including thefollowing information:
1. How the chosen object is made from Earth materials2. How the material is conserved and/or recycled3. Location of mines4. Chemical composition of resource5. Physical form of ore (color, density of ore, and texture)
(Give students rubric before activity.)
Scoring For Classroom Assessment Example SCI.V.1.HS.3
Criteria Apprentice Basic Meets Exceeds
Information onmaterial
Presents briefdescription ofmine location(s)or form ofmaterial.
Describes minelocation(s) orform of material.
Describes minelocation(s) and inwhat formmaterial is found.
Describes minelocation(s), formof material, andgeologic origin ofore.
Processing ofmaterial
Describes one:mining process,refining process,or forms ofenergy required.
Describes two:mining process,refining process,or forms ofenergy required.
Describes miningprocess, refiningprocess, andforms of energyrequired.
Describes miningprocess, refiningprocess, andforms of energyrequired at eachstep.
Recycling/conservation ofmaterial
Describesmethods ofrecycling orconservation.
Describesmethods ofrecycling andconservation.
Describesmethods ofrecycling,conservation, andalternativematerials.
Describesmethods and costsof recycling,conservation, andalternativematerials.
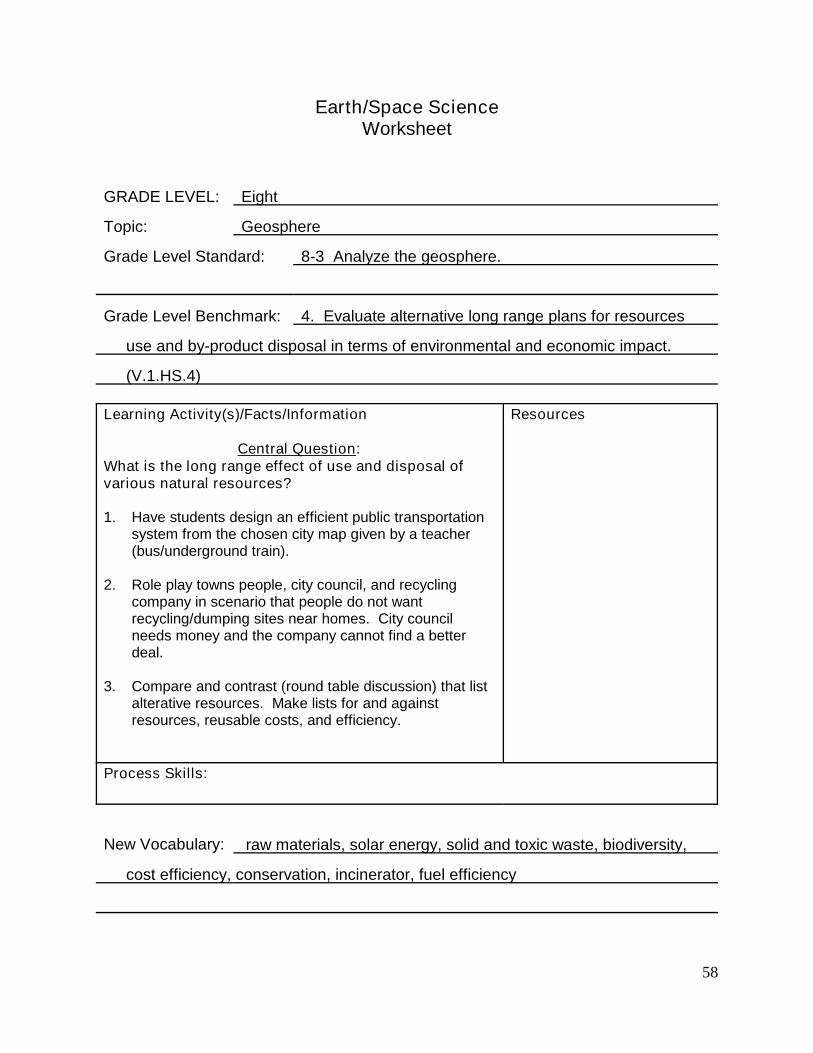
58
Earth/Space ScienceWorksheet
GRADE LEVEL: Eight
Topic: Geosphere
Grade Level Standard: 8-3 Analyze the geosphere.
Grade Level Benchmark: 4. Evaluate alternative long range plans for resources
use and by-product disposal in terms of environmental and economic impact.
(V.1.HS.4)
Learning Activity(s)/Facts/Information
Central Question:What is the long range effect of use and disposal ofvarious natural resources?
1. Have students design an efficient public transportationsystem from the chosen city map given by a teacher(bus/underground train).
2. Role play towns people, city council, and recyclingcompany in scenario that people do not wantrecycling/dumping sites near homes. City councilneeds money and the company cannot find a betterdeal.
3. Compare and contrast (round table discussion) that listalterative resources. Make lists for and againstresources, reusable costs, and efficiency.
Resources
Process Skills:
New Vocabulary: raw materials, solar energy, solid and toxic waste, biodiversity,
cost efficiency, conservation, incinerator, fuel efficiency
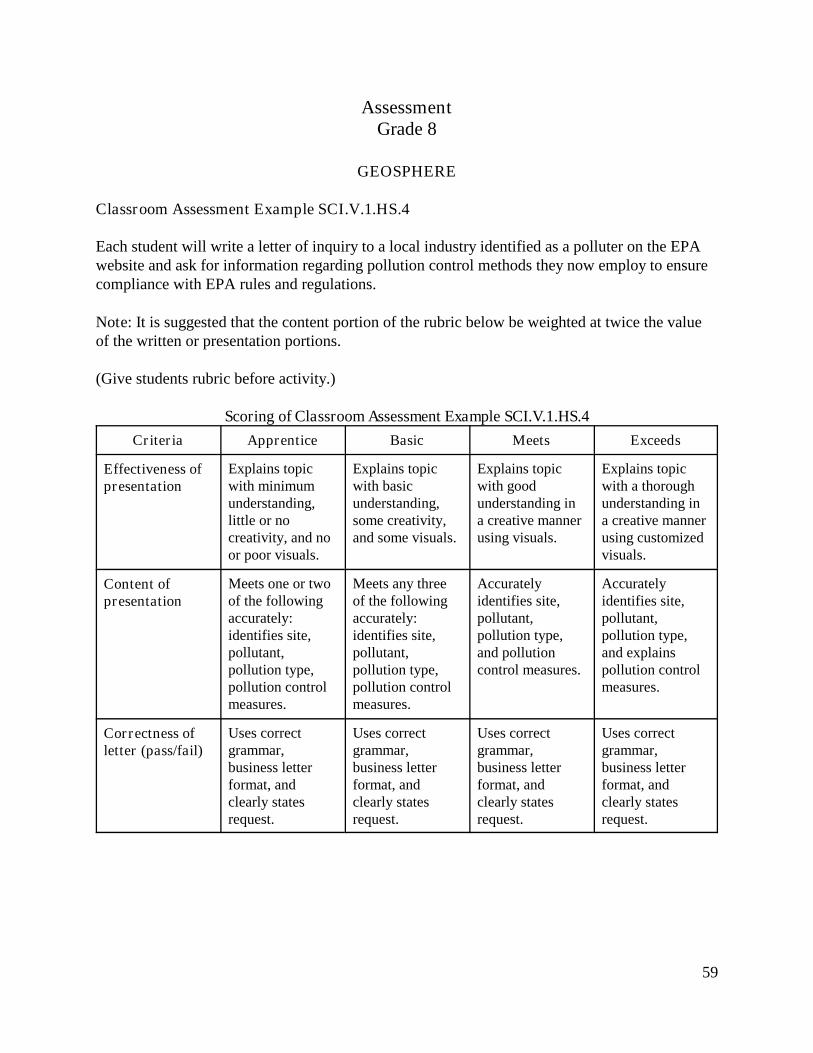
59
AssessmentGrade 8
GEOSPHERE
Classroom Assessment Example SCI.V.1.HS.4
Each student will write a letter of inquiry to a local industry identified as a polluter on the EPAwebsite and ask for information regarding pollution control methods they now employ to ensurecompliance with EPA rules and regulations.
Note: It is suggested that the content portion of the rubric below be weighted at twice the valueof the written or presentation portions.
(Give students rubric before activity.)
Scoring of Classroom Assessment Example SCI.V.1.HS.4
Criteria Apprentice Basic Meets Exceeds
Effectiveness ofpresentation
Explains topicwith minimumunderstanding,little or nocreativity, and noor poor visuals.
Explains topicwith basicunderstanding,some creativity,and some visuals.
Explains topicwith goodunderstanding ina creative mannerusing visuals.
Explains topicwith a thoroughunderstanding ina creative mannerusing customizedvisuals.
Content ofpresentation
Meets one or twoof the followingaccurately:identifies site,pollutant,pollution type,pollution controlmeasures.
Meets any threeof the followingaccurately:identifies site,pollutant,pollution type,pollution controlmeasures.
Accuratelyidentifies site,pollutant,pollution type,and pollutioncontrol measures.
Accuratelyidentifies site,pollutant,pollution type,and explainspollution controlmeasures.
Correctness ofletter (pass/fail)
Uses correctgrammar,business letterformat, andclearly statesrequest.
Uses correctgrammar,business letterformat, andclearly statesrequest.
Uses correctgrammar,business letterformat, andclearly statesrequest.
Uses correctgrammar,business letterformat, andclearly statesrequest.

60
Earth/Space ScienceWorksheet
GRADE LEVEL: Eight
Topic: Hydrosphere
Grade Level Standard: 8-4 Analyze the hydrosphere.
Grade Level Benchmark: 1. Identify and describe regional watersheds. (V.2.HS.1)
Learning Activity(s)/Facts/Information
Central Question:What are the characteristics of the watershed in whichyou live?
1. H.O.M.E.S. stands for (Huron, Ontario, Michigan, Erie,Superior) Great Lakes exercise on a map.
2. Create graphs and charts of toxic and pollution levels ineach of the Great Lakes in the past; 50, 100, and 150years.
Resources
Process Skills:
New Vocabulary: Great Lakes Region, basins, reservoir, dam, drainage basin,
tributary, runoff
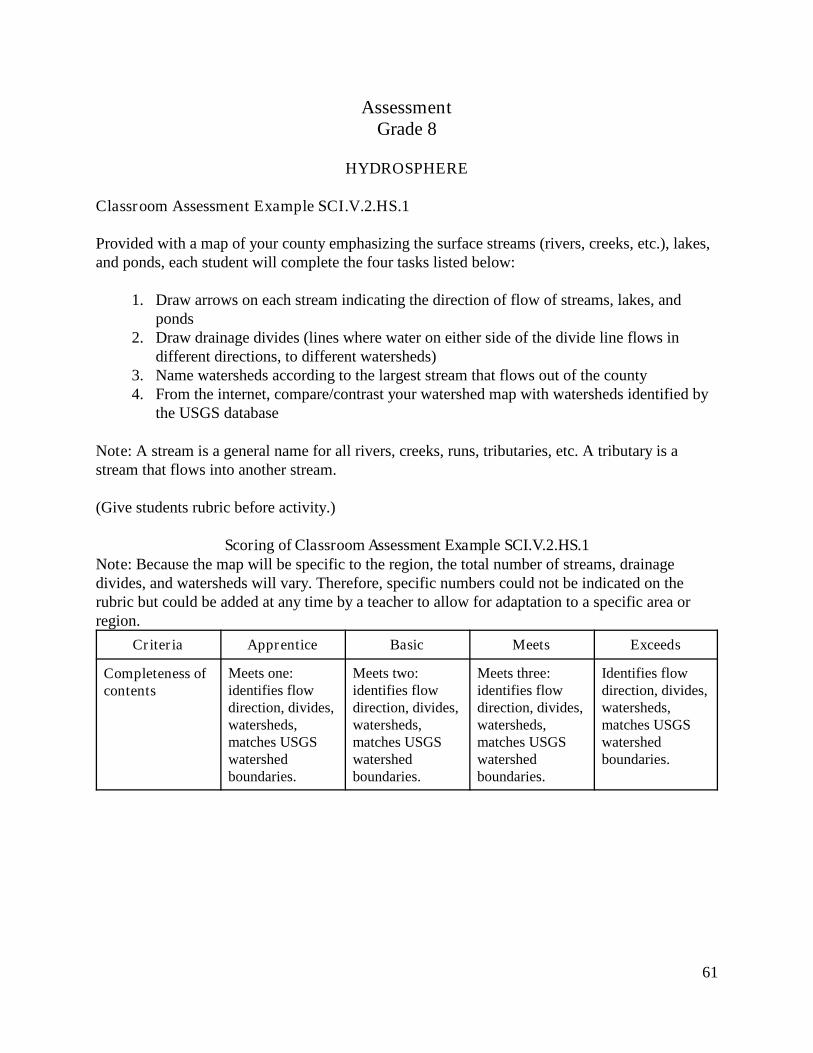
61
AssessmentGrade 8
HYDROSPHERE
Classroom Assessment Example SCI.V.2.HS.1
Provided with a map of your county emphasizing the surface streams (rivers, creeks, etc.), lakes,and ponds, each student will complete the four tasks listed below:
1. Draw arrows on each stream indicating the direction of flow of streams, lakes, andponds
2. Draw drainage divides (lines where water on either side of the divide line flows indifferent directions, to different watersheds)
3. Name watersheds according to the largest stream that flows out of the county4. From the internet, compare/contrast your watershed map with watersheds identified by
the USGS database
Note: A stream is a general name for all rivers, creeks, runs, tributaries, etc. A tributary is astream that flows into another stream.
(Give students rubric before activity.)
Scoring of Classroom Assessment Example SCI.V.2.HS.1Note: Because the map will be specific to the region, the total number of streams, drainagedivides, and watersheds will vary. Therefore, specific numbers could not be indicated on therubric but could be added at any time by a teacher to allow for adaptation to a specific area orregion.
Criteria Apprentice Basic Meets Exceeds
Completeness ofcontents
Meets one:identifies flowdirection, divides,watersheds,matches USGSwatershedboundaries.
Meets two:identifies flowdirection, divides,watersheds,matches USGSwatershedboundaries.
Meets three:identifies flowdirection, divides,watersheds,matches USGSwatershedboundaries.
Identifies flowdirection, divides,watersheds,matches USGSwatershedboundaries.
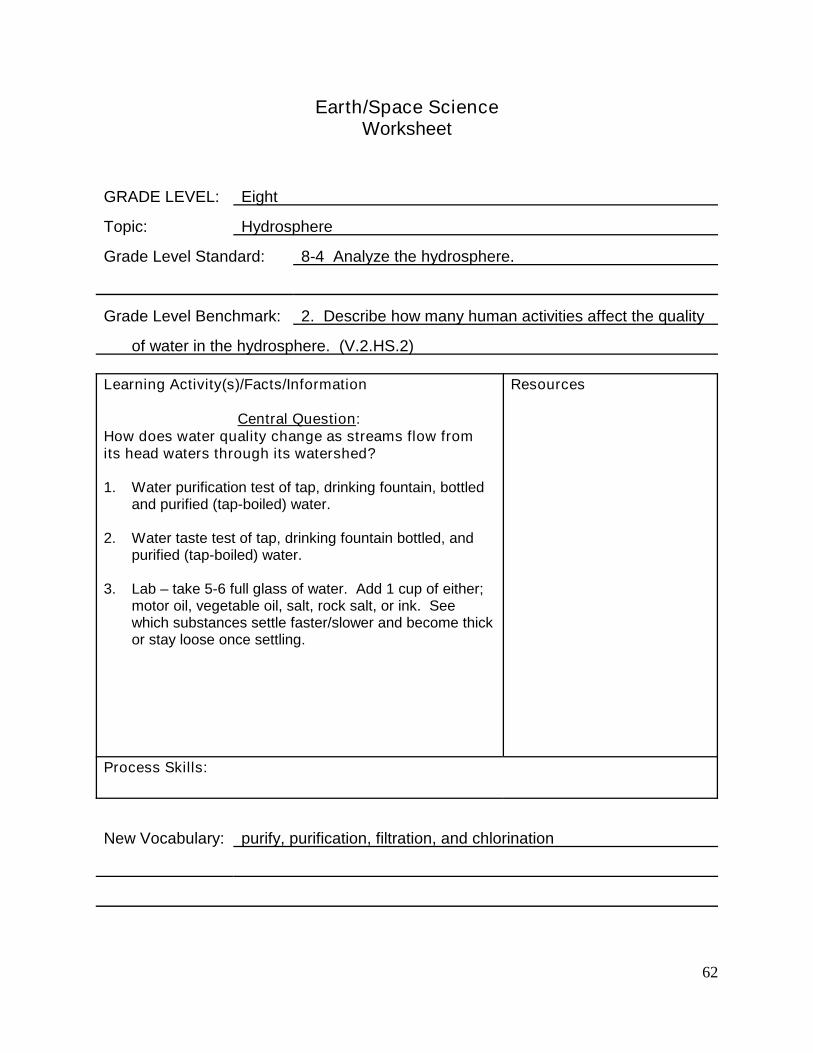
62
Earth/Space ScienceWorksheet
GRADE LEVEL: Eight
Topic: Hydrosphere
Grade Level Standard: 8-4 Analyze the hydrosphere.
Grade Level Benchmark: 2. Describe how many human activities affect the quality
of water in the hydrosphere. (V.2.HS.2)
Learning Activity(s)/Facts/Information
Central Question:How does water quality change as streams flow fromits head waters through its watershed?
1. Water purification test of tap, drinking fountain, bottledand purified (tap-boiled) water.
2. Water taste test of tap, drinking fountain bottled, andpurified (tap-boiled) water.
3. Lab – take 5-6 full glass of water. Add 1 cup of either;motor oil, vegetable oil, salt, rock salt, or ink. Seewhich substances settle faster/slower and become thickor stay loose once settling.
Resources
Process Skills:
New Vocabulary: purify, purification, filtration, and chlorination
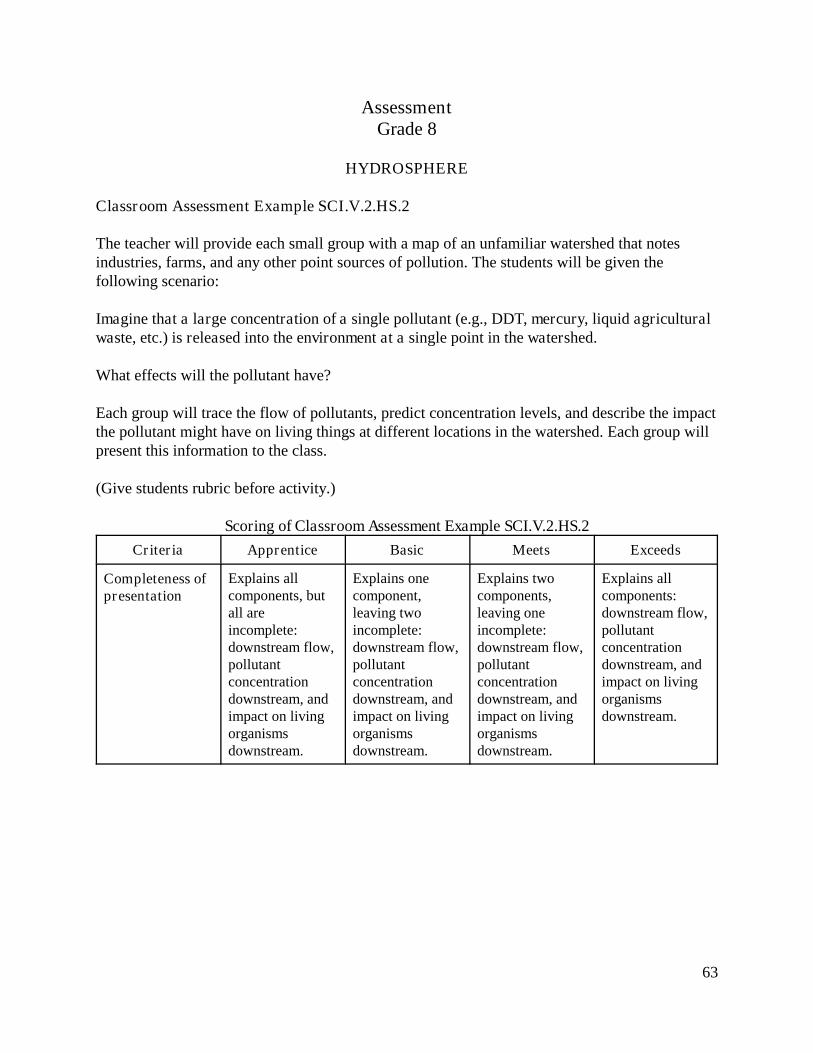
63
AssessmentGrade 8
HYDROSPHERE
Classroom Assessment Example SCI.V.2.HS.2
The teacher will provide each small group with a map of an unfamiliar watershed that notesindustries, farms, and any other point sources of pollution. The students will be given thefollowing scenario:
Imagine that a large concentration of a single pollutant (e.g., DDT, mercury, liquid agriculturalwaste, etc.) is released into the environment at a single point in the watershed.
What effects will the pollutant have?
Each group will trace the flow of pollutants, predict concentration levels, and describe the impactthe pollutant might have on living things at different locations in the watershed. Each group willpresent this information to the class.
(Give students rubric before activity.)
Scoring of Classroom Assessment Example SCI.V.2.HS.2
Criteria Apprentice Basic Meets Exceeds
Completeness ofpresentation
Explains allcomponents, butall areincomplete:downstream flow,pollutantconcentrationdownstream, andimpact on livingorganismsdownstream.
Explains onecomponent,leaving twoincomplete:downstream flow,pollutantconcentrationdownstream, andimpact on livingorganismsdownstream.
Explains twocomponents,leaving oneincomplete:downstream flow,pollutantconcentrationdownstream, andimpact on livingorganismsdownstream.
Explains allcomponents:downstream flow,pollutantconcentrationdownstream, andimpact on livingorganismsdownstream.
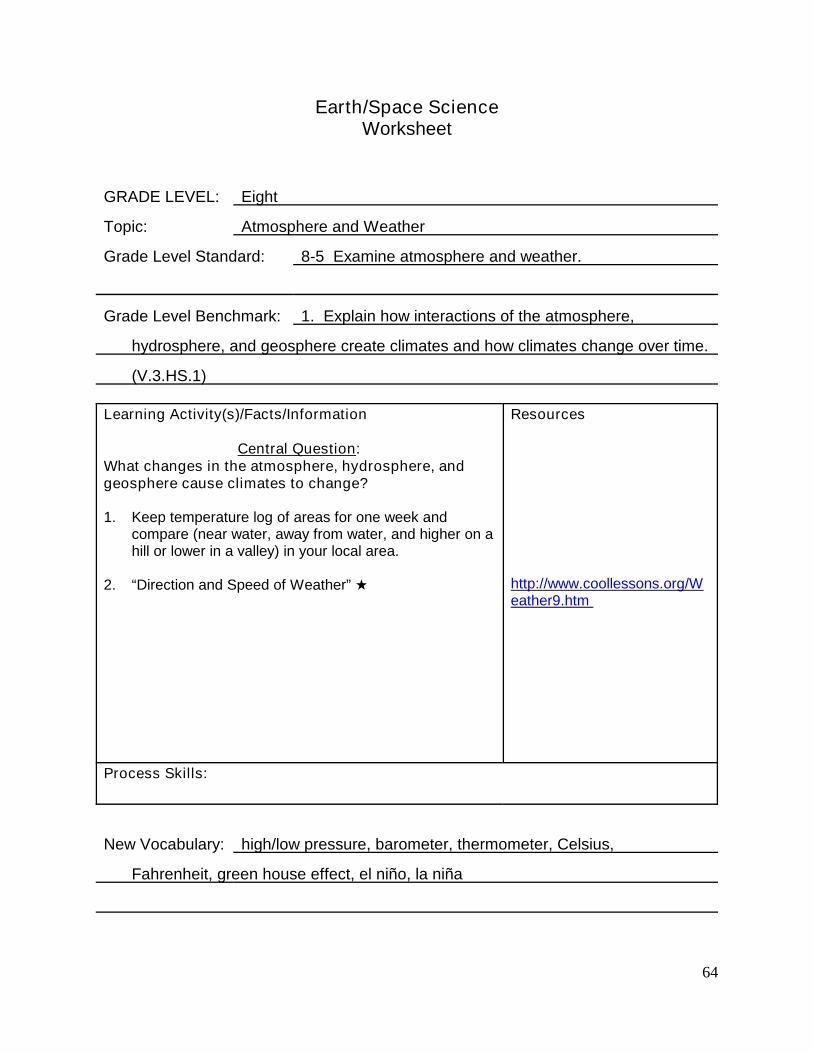
64
Earth/Space ScienceWorksheet
GRADE LEVEL: Eight
Topic: Atmosphere and Weather
Grade Level Standard: 8-5 Examine atmosphere and weather.
Grade Level Benchmark: 1. Explain how interactions of the atmosphere,
hydrosphere, and geosphere create climates and how climates change over time.
(V.3.HS.1)
Learning Activity(s)/Facts/Information
Central Question:What changes in the atmosphere, hydrosphere, andgeosphere cause climates to change?
1. Keep temperature log of areas for one week andcompare (near water, away from water, and higher on ahill or lower in a valley) in your local area.
2. “Direction and Speed of Weather”
Resources
http://www.coollessons.org/Weather9.htm
Process Skills:
New Vocabulary: high/low pressure, barometer, thermometer, Celsius,
Fahrenheit, green house effect, el niño, la niña
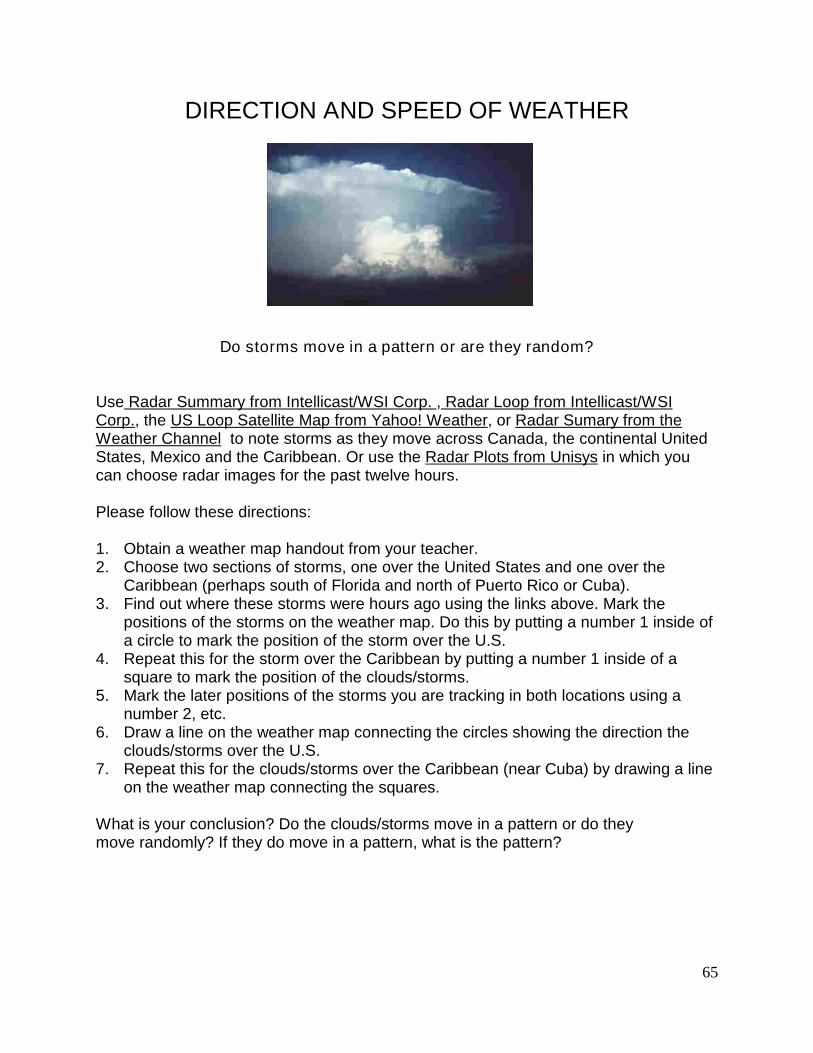
65
DIRECTION AND SPEED OF WEATHER
Do storms move in a pattern or are they random?
Use Radar Summary from Intellicast/WSI Corp. , Radar Loop from Intellicast/WSICorp., the US Loop Satellite Map from Yahoo! Weather, or Radar Sumary from theWeather Channel to note storms as they move across Canada, the continental UnitedStates, Mexico and the Caribbean. Or use the Radar Plots from Unisys in which youcan choose radar images for the past twelve hours.
Please follow these directions:
1. Obtain a weather map handout from your teacher.2. Choose two sections of storms, one over the United States and one over the
Caribbean (perhaps south of Florida and north of Puerto Rico or Cuba).3. Find out where these storms were hours ago using the links above. Mark the
positions of the storms on the weather map. Do this by putting a number 1 inside ofa circle to mark the position of the storm over the U.S.
4. Repeat this for the storm over the Caribbean by putting a number 1 inside of asquare to mark the position of the clouds/storms.
5. Mark the later positions of the storms you are tracking in both locations using anumber 2, etc.
6. Draw a line on the weather map connecting the circles showing the direction theclouds/storms over the U.S.
7. Repeat this for the clouds/storms over the Caribbean (near Cuba) by drawing a lineon the weather map connecting the squares.
What is your conclusion? Do the clouds/storms move in a pattern or do theymove randomly? If they do move in a pattern, what is the pattern?

66
How fast does weather move?
Use the lesson for "Watch out radar! Here comes a speeder!" to find out how fastweather moves.
This unit was developed by Bill Byles, Staff Development Coordinator, Teaching &Learning Academy, Memphis City Schools and a co-founder ofinternet4classrooms.com It is used here with permission.
Copyright © 1997, 1998, 1999, 2000, 2001 Richard Levine
This site is for non-profit, educational use only. If you have any comments, questions orresources you would like to see added to these pages, contact Richard Levine, CoolLessons, Educational Technology Consultant, [email protected]
http://www.coollessons.org/Weather9.htm
67
WebGuideAn Internet based lesson
A lesson built around a single Internet Site
Subject: Earth Science or MathGrade Level(s): 6-8Lesson Title: "Watch out radar! Here comes a speeder!"Internet Site Title: United States RadarLoop by Intellicast.comInternet Site URL: http://www.intellicast.com/LocalWeather/World/UnitedStates/RadarLoop/
Site Description: This site as a loop of seven images which cover a span of six hours.Each time the image changes, an hour has passed. When you first get to the site youwill have to scroll down so you can see the entire contiguous US map. Notice the topleft corner of the map has the time and date in GMT (Greenwich Mean Time). Eachtime that the image changes you will see the time increase one hour. During monthsduring which Daylight Saving Time is in effect, the Central time zone is five hours earlieron a clock (six during Standard Time). Colors are explained on the bottom left corner ofthe map. You will occasionally see weather events develop and spread across an area.Usually you will be able to see some line of weather that moves across an area duringthe six hour time span.
Site Purpose: You are looking for a weather pattern that moves across the map. Mostmovement will be from west to east. Watch several loops of the map until you canlocate some line of clouds that moves across an area. Look for areas with yellow or red.Mark a clear starting point for that line and a clear finish point. If the event breaks up orstops before the entire six hours pass, use only a portion of the six hour span. Countthe number of times the image shifts. That will be how many hours pass. Your startingand finish points will allow you to calculate distance. Knowing what distance an objectmoved in what time period will allow you to calculate the speed of the object.
Lesson Introduction: You will work in groups of three. Someone in your group shouldhave an outline map of the US before going to this site.
Final Product or Task: You will use an Excel spreadsheet, or pocket calculator, tocalculate the speed with which a line of thunderstorms moved across a given state.Your results and to be reported with a one-page Word document on which you haveinserted an image from the Internet. Your group will present a report of the area youchose to the class, using the saved image of your radar loop. Make a prediction wherethe weather feature you were watching will be in six hours, and defend your predictionto the class.
68
Lesson Description: Open the US Radar Loop site using the URL given above. Assigna different portion of the map on your computer screen to each group member. Watchseveral loops of the Doppler Radar map until you identify a place where a clear patternemerges. If more than one looks promising, your group should come to an agreementabout which one will be used. Mark the map while watching the film loop. Do not trustmemory to mark the map later. Also make a notation of the colors involved in the line ofweather that you were watching. Save the image of the loop you are watching. This cannot be saved to a disk, it is too large. Save the file to the shared folder, remember torename the film loop. When your group has marked the two map points, move to thecenter where larger maps are located.
As exactly as possible, determine the number of miles between the starting and finishpoints. Use the smaller map to pinpoint two spots on a larger map. Measure thenumber of centimeters (to the nearest tenth) between the two map points. Using thescale of the map, determine distance between the two points. As an example; if onecentimeter equals 20 miles, a distance of 15 centimeters on the map is equal to 300miles.
Calculate the speed of the line of weather.
Move back to a computer and report the results of your calculations. Include the part ofthe country where this happened, report the speed of the weather and indicate howsevere the weather was (remember the colors?). Make a prediction as to where the linewill be in six more hours. Include an image with your report. Be sure all three groupmembers names are on the report, then save it to the shared folder for evaluation.
Open your radar loop from the shared folder before starting your report to the class.
Conclusion: In a previous lesson we learned that fast moving cold fronts push warm airup rapidly producing turbulent air, large powerful thunderstorm, and sometimes eventornadoes. Knowing the speed with which a front is approaching, you may be able towarn family members about approaching weather problems. Even slow moving eventscan be used. If you know how far the event moved in six hours, you can predict when itwill arrive at your location. In the winter you might even predict if snow will arrive earlyenough to close school before it starts. Consult this site from time to time, and noticethe kind of patterns that develop.
WebGuide template provided by Internet4Classrooms
http://www.internet4classrooms.com/webguide_template_example.htm
69
AssessmentGrade 8
ATMOSPHERE AND WEATHER
Classroom Assessment Example SCI.V.3.HS.1
The teacher will present the following scenario to the class:
Assume that the Earth’s rotational axis is tilted so that the North Pole always directly faces theSun.
Each student will write a list of predictions that describe the altitude of the Sun, the length of theday, seasonal changes, and temperature conditions that would result on such an Earth.
(Give students rubric before activity.)
Scoring of Classroom Assessment Example SCI.V.3.HS.1
Criteria Apprentice Basic Meets Exceeds
Predictions ofchanges
Predicts onecomponent:altitude of theSun, length of theday, seasonalchanges, andtemperatureconditions.
Predicts twocomponents butleaves twoincomplete:altitude of theSun, length of theday, seasonalchanges, andtemperatureconditions.
Predicts threecomponents butleaves oneincomplete:altitude of theSun, length of theday, seasonalchanges, andtemperatureconditions.
Predicts all fourcomponents:altitude of theSun, length of theday, seasonalchanges, andtemperatureconditions.
70
Earth/Space ScienceWorksheet
GRADE LEVEL: Eight
Topic: Atmosphere and Weather
Grade Level Standard: 8-5 Examine atmosphere and weather.
Grade Level Benchmark: 2. Describe patterns of air movement in the atmosphere
and how they affect weather conditions. (V.3.HS.2)
Learning Activity(s)/Facts/Information
Central Question:How do horizontal motions of the air vary andcontribute to the type of weather?
1. Use resource to track high and low pressure systemsas well as fronts for one week.
2. Make weather vane to track the wind patterns aroundstudent’s home throughout the course of the day.Check the weather vane before school, after school,and before bed.
Resources
USA Today Newspaper
Process Skills:
New Vocabulary: fronts, jet stream, air masses, prevailing winds, anemometer,
weather/wind vane, weather map
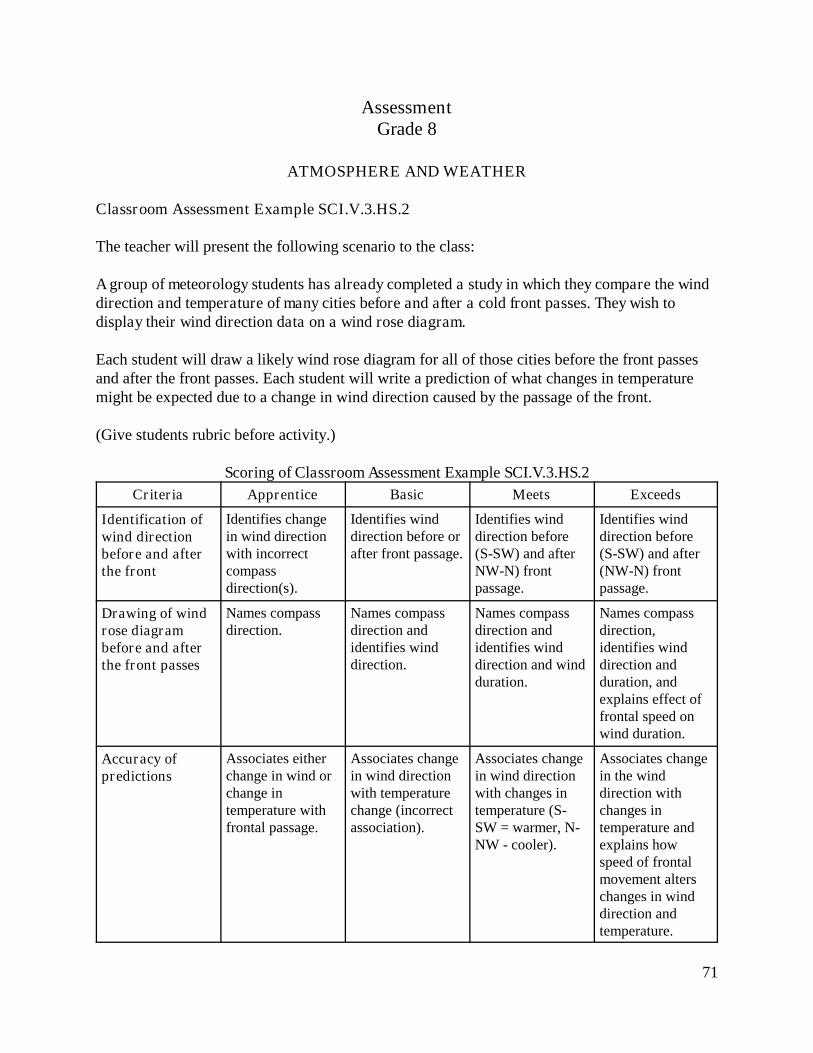
71
AssessmentGrade 8
ATMOSPHERE AND WEATHER
Classroom Assessment Example SCI.V.3.HS.2
The teacher will present the following scenario to the class:
A group of meteorology students has already completed a study in which they compare the winddirection and temperature of many cities before and after a cold front passes. They wish todisplay their wind direction data on a wind rose diagram.
Each student will draw a likely wind rose diagram for all of those cities before the front passesand after the front passes. Each student will write a prediction of what changes in temperaturemight be expected due to a change in wind direction caused by the passage of the front.
(Give students rubric before activity.)
Scoring of Classroom Assessment Example SCI.V.3.HS.2
Criteria Apprentice Basic Meets Exceeds
Identification ofwind directionbefore and afterthe front
Identifies changein wind directionwith incorrectcompassdirection(s).
Identifies winddirection before orafter front passage.
Identifies winddirection before(S-SW) and afterNW-N) frontpassage.
Identifies winddirection before(S-SW) and after(NW-N) frontpassage.
Drawing of windrose diagrambefore and afterthe front passes
Names compassdirection.
Names compassdirection andidentifies winddirection.
Names compassdirection andidentifies winddirection and windduration.
Names compassdirection,identifies winddirection andduration, andexplains effect offrontal speed onwind duration.
Accuracy ofpredictions
Associates eitherchange in wind orchange intemperature withfrontal passage.
Associates changein wind directionwith temperaturechange (incorrectassociation).
Associates changein wind directionwith changes intemperature (S-SW = warmer, N-NW - cooler).
Associates changein the winddirection withchanges intemperature andexplains howspeed of frontalmovement alterschanges in winddirection andtemperature.
72
Earth/Space ScienceWorksheet
GRADE LEVEL: Eight
Topic: Atmosphere and Weather
Grade Level Standard: 8-5 Examine atmosphere and weather.
Grade Level Benchmark: 3. Explain and predict general weather patterns and
storms. (V.3.HS.3)
Learning Activity(s)/Facts/Information
Central Question:How can weather and storms be explained usingcommon features found on a weather map?
1. Have students look at one weeks worth of weather,past occurrences on Monday. Have them try andpredict the weather forecast for the week to comeknowing what has already happened.
2. What is the relationship between altitude andweather?
3. What is the relationship between latitude andweather?
Activity is attached
Resources
USA Today
Altitude and Temperaturehttp://www.coollessons.org/Weather1.htm
Latitude and Temperaturehttp://www.coollessons.org/Weather2.htm
Process Skills:
New Vocabulary: hypothesis, infer, theory
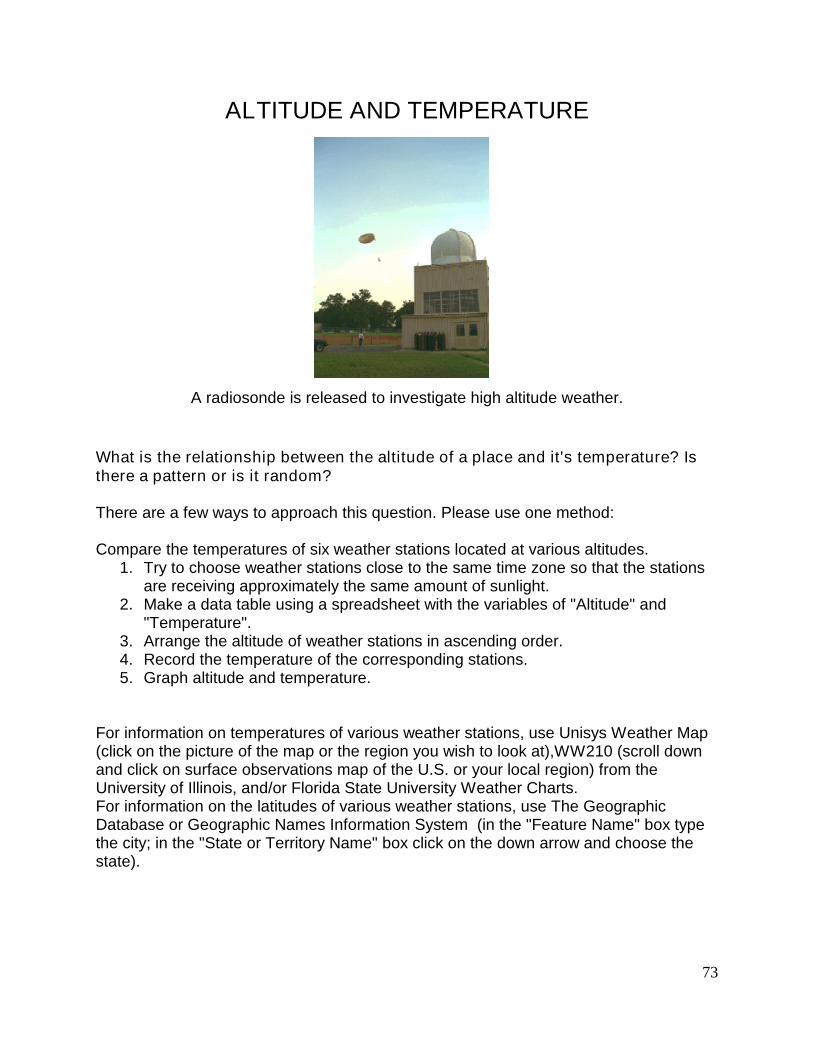
73
ALTITUDE AND TEMPERATURE
A radiosonde is released to investigate high altitude weather.
What is the relationship between the altitude of a place and it's temperature? Isthere a pattern or is it random?
There are a few ways to approach this question. Please use one method:
Compare the temperatures of six weather stations located at various altitudes.1. Try to choose weather stations close to the same time zone so that the stations
are receiving approximately the same amount of sunlight.2. Make a data table using a spreadsheet with the variables of "Altitude" and
"Temperature".3. Arrange the altitude of weather stations in ascending order.4. Record the temperature of the corresponding stations.5. Graph altitude and temperature.
For information on temperatures of various weather stations, use Unisys Weather Map(click on the picture of the map or the region you wish to look at),WW210 (scroll downand click on surface observations map of the U.S. or your local region) from theUniversity of Illinois, and/or Florida State University Weather Charts.For information on the latitudes of various weather stations, use The GeographicDatabase or Geographic Names Information System (in the "Feature Name" box typethe city; in the "State or Territory Name" box click on the down arrow and choose thestate).
74
Compare the temperature on the ground to the temperature above the ground.1. Make a data table using a spreadsheet with the variables of "Altitude (ft.)",
"Upper Air Temperatures (F)".2. Go to Unisys Weather Upper Air Plots.3. On the right side, under "PLOTS",you will find 3000, 6000, 9000, etc.4. Click on the plot 3000 ft. Find a weather station. Record the temperature.5. Repeat for readings that are at 6,000 feet, 9000 ft., etc. above the surface
stations you chose. Record the corresponding upper air temperatures.6. Graph the altitudes and the temperatures.
What is your conclusion? Does the altitude of a place and it's temperature have apattern or are they random? If there is a pattern, what is the relationship?
Copyright © 1998, 1999, 2000, 2001 Richard Levine
This site is for non-profit, educational use only. If you have any comments, questions orresources you would like to see added to these pages, contact Richard Levine, CoolLessons, Educational Technology Consultant, [email protected]
Disclaimer: This site provides teachers, students and parents with these links simplyas a starting point for them to explore the vast resources of the Internet. The sites thatare listed within this page are individually responsible for the content and accuracy ofthe information found in their site.
http://www.coollessons.org/Weather1.htm
75
LATITUDE AND TEMPERATURE
What is the relationship between the latitude of a place and its temperature?
Compare the latitude of five weather stations and the present temperatures of thosestations. Try to choose weather stations close to the same longitude line so that thestations are receiving approximately the same amount of sunlight.
Make a data table using a spreadsheet with the variables of "Latitude" and"Temperature". Round off the latitude to the nearest degree and arrange the latitude ofweather stations in ascending order. Record the temperature of the correspondingstations. Graph latitude and temperature.
For information on temperatures of various weather stations, use Unisys Weather Map(click on the picture of the map or the region you wish to look at), WW210 (scroll downand click on surface observations map of the U.S. or your local region) from theUniversity of Illinois, and/or Florida State University Weather Charts.
For information on the latitudes of various weather stations, use The GeographicDatabase or Geographic Names Information System (in the "Feature Name" box typethe city; in the "State or Territory Name" box click on the down arrow and choose thestate).
What is your conclusion? Does the latitude of a place and its temperature have apattern or are they random? If there is a pattern, what is the relationship?
Copyright © 1997, 1998, 1999, 2000, 2001 Richard Levine
This site is for non-profit, educational use only. If you have any comments, questions orresources you would like to see added to these pages, contact Richard Levine, CoolLessons, Educational Technology Consultant, [email protected]
Disclaimer: This site provides teachers, students and parents with these links simplyas a starting point for them to explore the vast resources of the Internet. The sites thatare listed within this page are individually responsible for the content and accuracy ofthe information found in their site.
http://www.coollessons.org/Weather2.htm
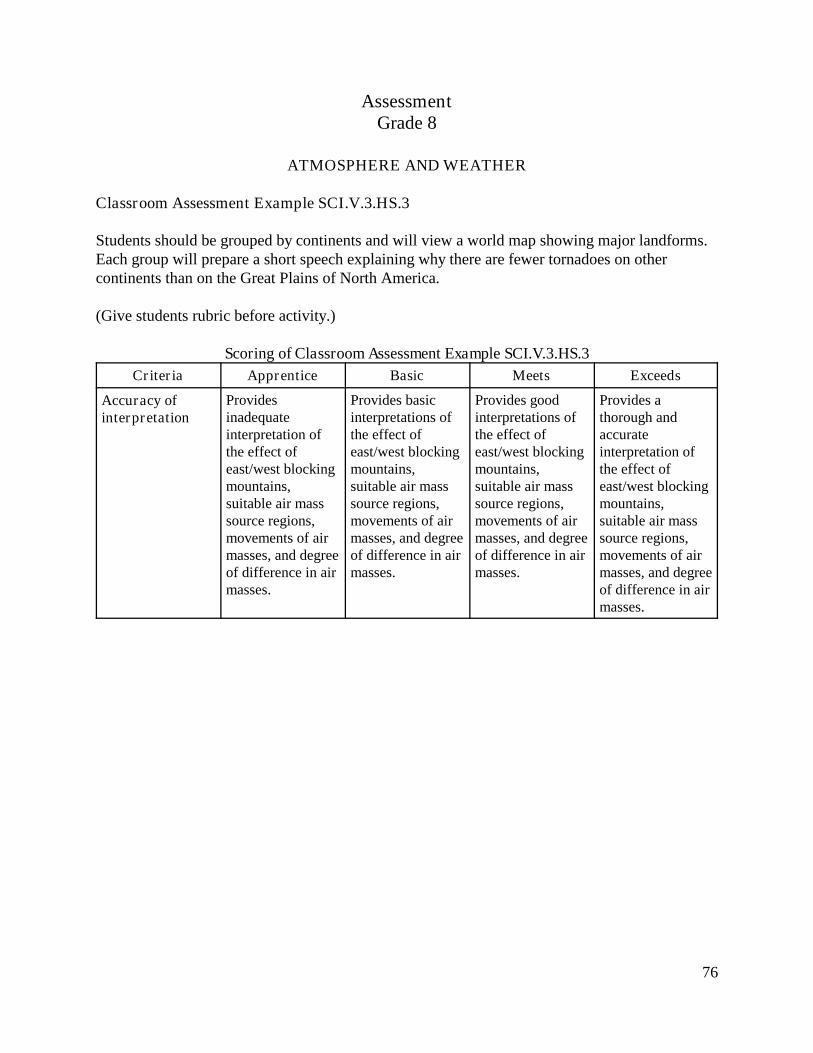
76
AssessmentGrade 8
ATMOSPHERE AND WEATHER
Classroom Assessment Example SCI.V.3.HS.3
Students should be grouped by continents and will view a world map showing major landforms.Each group will prepare a short speech explaining why there are fewer tornadoes on othercontinents than on the Great Plains of North America.
(Give students rubric before activity.)
Scoring of Classroom Assessment Example SCI.V.3.HS.3
Criteria Apprentice Basic Meets Exceeds
Accuracy ofinterpretation
Providesinadequateinterpretation ofthe effect ofeast/west blockingmountains,suitable air masssource regions,movements of airmasses, and degreeof difference in airmasses.
Provides basicinterpretations ofthe effect ofeast/west blockingmountains,suitable air masssource regions,movements of airmasses, and degreeof difference in airmasses.
Provides goodinterpretations ofthe effect ofeast/west blockingmountains,suitable air masssource regions,movements of airmasses, and degreeof difference in airmasses.
Provides athorough andaccurateinterpretation ofthe effect ofeast/west blockingmountains,suitable air masssource regions,movements of airmasses, and degreeof difference in airmasses.
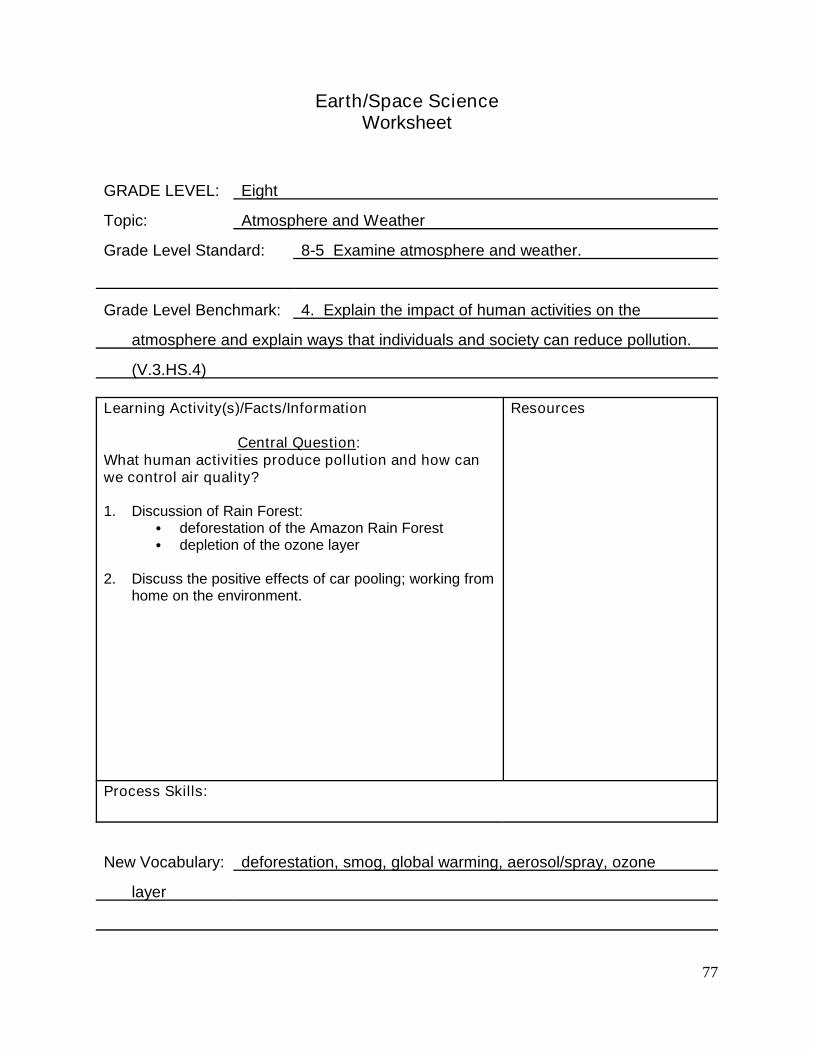
77
Earth/Space ScienceWorksheet
GRADE LEVEL: Eight
Topic: Atmosphere and Weather
Grade Level Standard: 8-5 Examine atmosphere and weather.
Grade Level Benchmark: 4. Explain the impact of human activities on the
atmosphere and explain ways that individuals and society can reduce pollution.
(V.3.HS.4)
Learning Activity(s)/Facts/Information
Central Question:What human activities produce pollution and how canwe control air quality?
1. Discussion of Rain Forest: deforestation of the Amazon Rain Forest depletion of the ozone layer
2. Discuss the positive effects of car pooling; working fromhome on the environment.
Resources
Process Skills:
New Vocabulary: deforestation, smog, global warming, aerosol/spray, ozone
layer
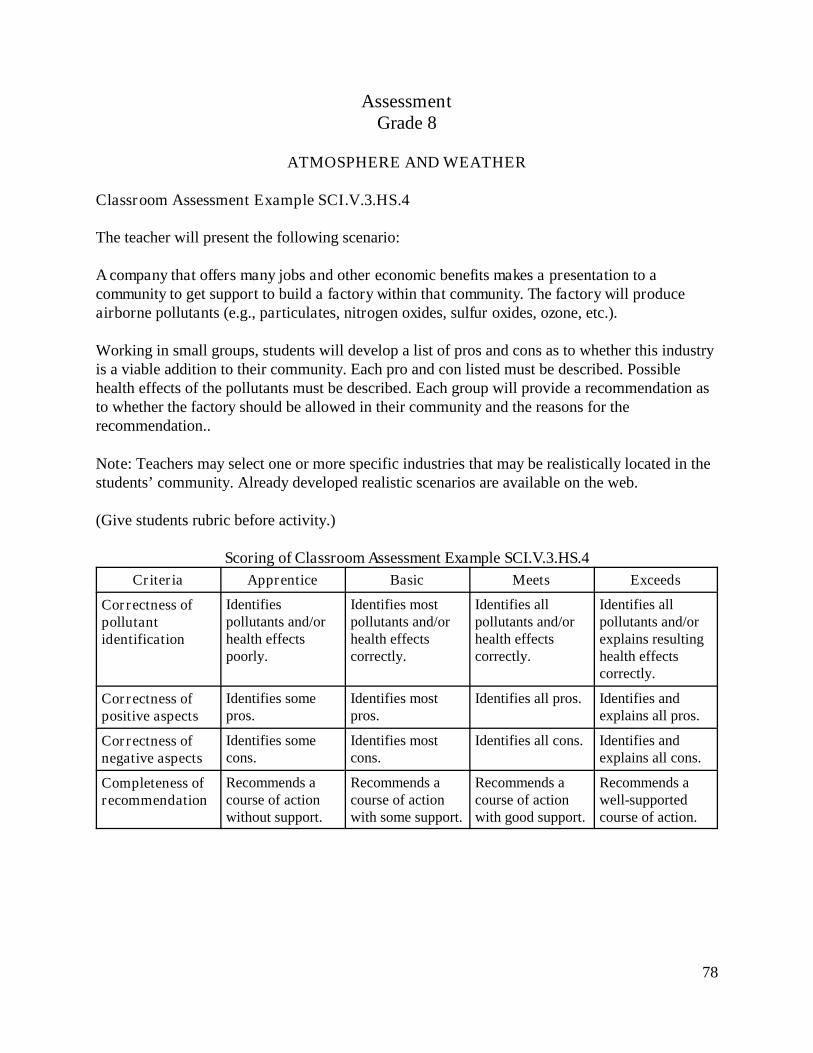
78
AssessmentGrade 8
ATMOSPHERE AND WEATHER
Classroom Assessment Example SCI.V.3.HS.4
The teacher will present the following scenario:
A company that offers many jobs and other economic benefits makes a presentation to acommunity to get support to build a factory within that community. The factory will produceairborne pollutants (e.g., particulates, nitrogen oxides, sulfur oxides, ozone, etc.).
Working in small groups, students will develop a list of pros and cons as to whether this industryis a viable addition to their community. Each pro and con listed must be described. Possiblehealth effects of the pollutants must be described. Each group will provide a recommendation asto whether the factory should be allowed in their community and the reasons for therecommendation..
Note: Teachers may select one or more specific industries that may be realistically located in thestudents’ community. Already developed realistic scenarios are available on the web.
(Give students rubric before activity.)
Scoring of Classroom Assessment Example SCI.V.3.HS.4
Criteria Apprentice Basic Meets Exceeds
Correctness ofpollutantidentification
Identifiespollutants and/orhealth effectspoorly.
Identifies mostpollutants and/orhealth effectscorrectly.
Identifies allpollutants and/orhealth effectscorrectly.
Identifies allpollutants and/orexplains resultinghealth effectscorrectly.
Correctness ofpositive aspects
Identifies somepros.
Identifies mostpros.
Identifies all pros. Identifies andexplains all pros.
Correctness ofnegative aspects
Identifies somecons.
Identifies mostcons.
Identifies all cons. Identifies andexplains all cons.
Completeness ofrecommendation
Recommends acourse of actionwithout support.
Recommends acourse of actionwith some support.
Recommends acourse of actionwith good support.
Recommends awell-supportedcourse of action.
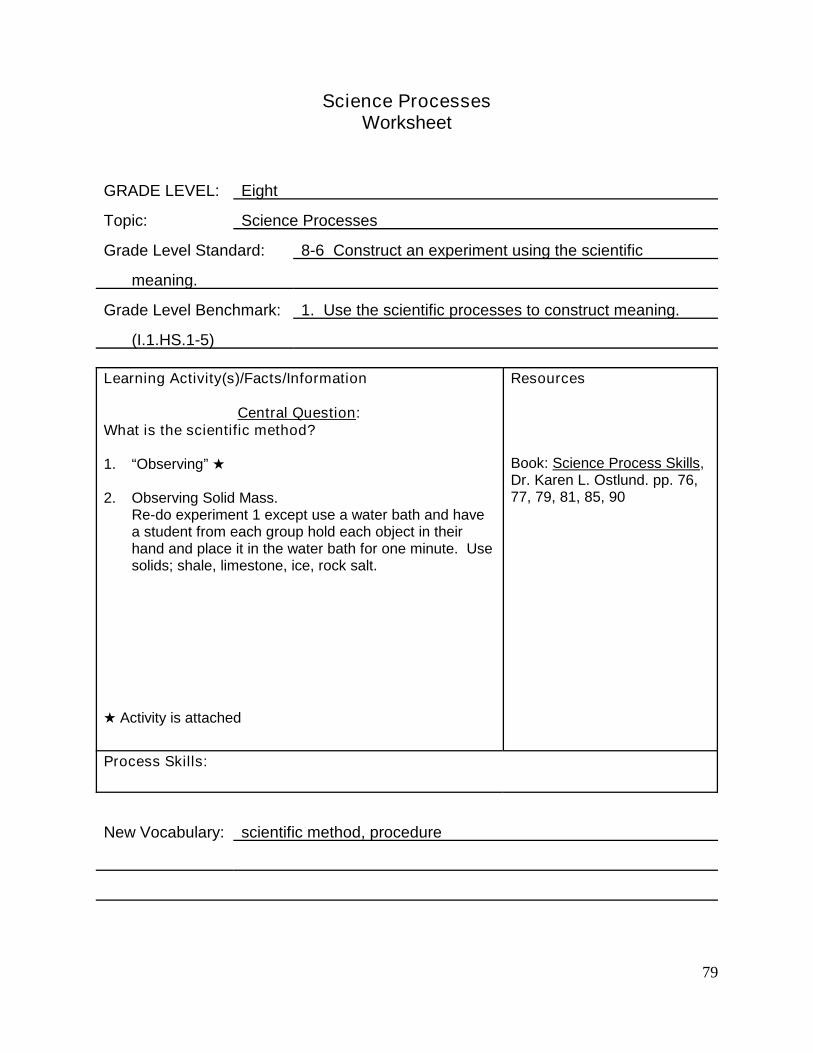
79
Science ProcessesWorksheet
GRADE LEVEL: Eight
Topic: Science Processes
Grade Level Standard: 8-6 Construct an experiment using the scientific
meaning.
Grade Level Benchmark: 1. Use the scientific processes to construct meaning.
(I.1.HS.1-5)
Learning Activity(s)/Facts/Information
Central Question:What is the scientific method?
1. “Observing”
2. Observing Solid Mass.Re-do experiment 1 except use a water bath and havea student from each group hold each object in theirhand and place it in the water bath for one minute. Usesolids; shale, limestone, ice, rock salt.
Activity is attached
Resources
Book: Science Process Skills,Dr. Karen L. Ostlund. pp. 76,77, 79, 81, 85, 90
Process Skills:
New Vocabulary: scientific method, procedure
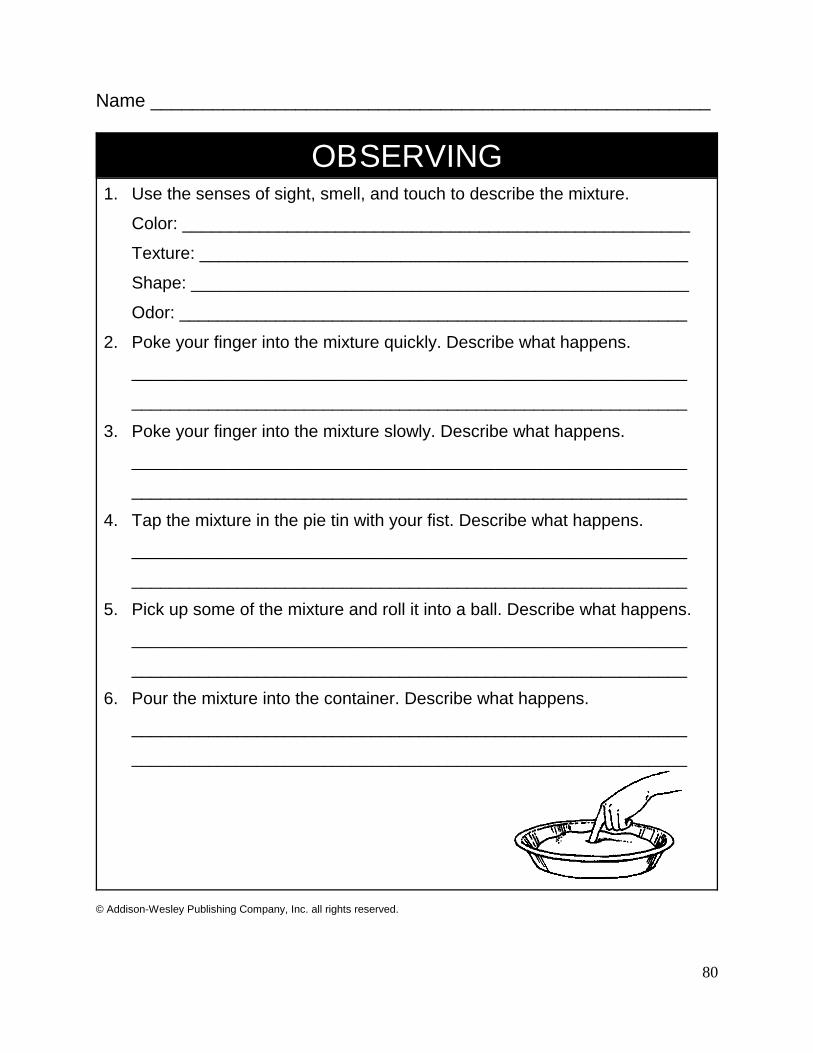
80
Name ______________________________________________________
OBSERVING1. Use the senses of sight, smell, and touch to describe the mixture.
Color: _____________________________________________________
Texture: ___________________________________________________
Shape: ____________________________________________________
Odor: _____________________________________________________
2. Poke your finger into the mixture quickly. Describe what happens.
__________________________________________________________
__________________________________________________________
3. Poke your finger into the mixture slowly. Describe what happens.
__________________________________________________________
__________________________________________________________
4. Tap the mixture in the pie tin with your fist. Describe what happens.
__________________________________________________________
__________________________________________________________
5. Pick up some of the mixture and roll it into a ball. Describe what happens.
__________________________________________________________
__________________________________________________________
6. Pour the mixture into the container. Describe what happens.
__________________________________________________________
__________________________________________________________
© Addison-Wesley Publishing Company, Inc. all rights reserved.
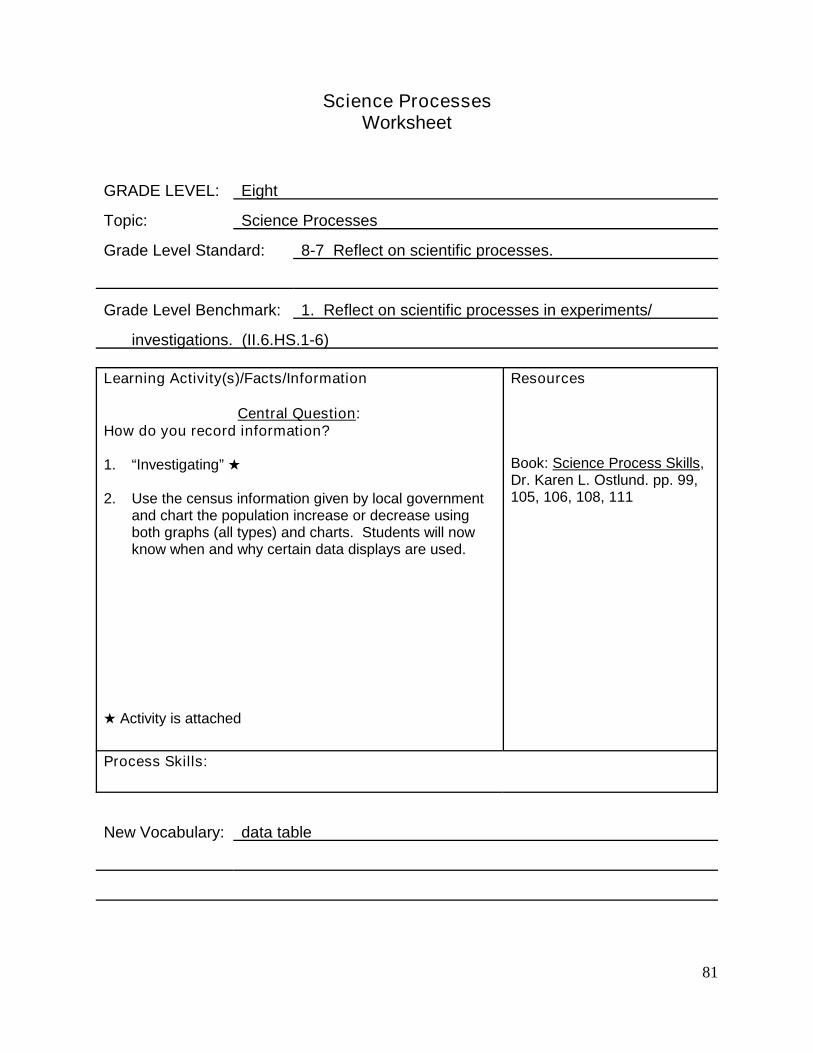
81
Science ProcessesWorksheet
GRADE LEVEL: Eight
Topic: Science Processes
Grade Level Standard: 8-7 Reflect on scientific processes.
Grade Level Benchmark: 1. Reflect on scientific processes in experiments/
investigations. (II.6.HS.1-6)
Learning Activity(s)/Facts/Information
Central Question:How do you record information?
1. “Investigating”
2. Use the census information given by local governmentand chart the population increase or decrease usingboth graphs (all types) and charts. Students will nowknow when and why certain data displays are used.
Activity is attached
Resources
Book: Science Process Skills,Dr. Karen L. Ostlund. pp. 99,105, 106, 108, 111
Process Skills:
New Vocabulary: data table
82
Name ______________________________________________________
INVESTIGATING1. Problem: Which rubber band will stretch the most when 500 grams of
weight are added? Design and conduct an investigation to help you find out.
2. Describe what you will do to find out which rubber band stretches the mostwhen 500 grams of weight are added.
__________________________________________________________
__________________________________________________________
__________________________________________________________
__________________________________________________________
__________________________________________________________
3. Construct a chart to show your results.
Rubber BandWidth
Length beforeWeight
Length afterWeight
Difference
© Addison-Wesley Publishing Company, Inc. all rights reserved.
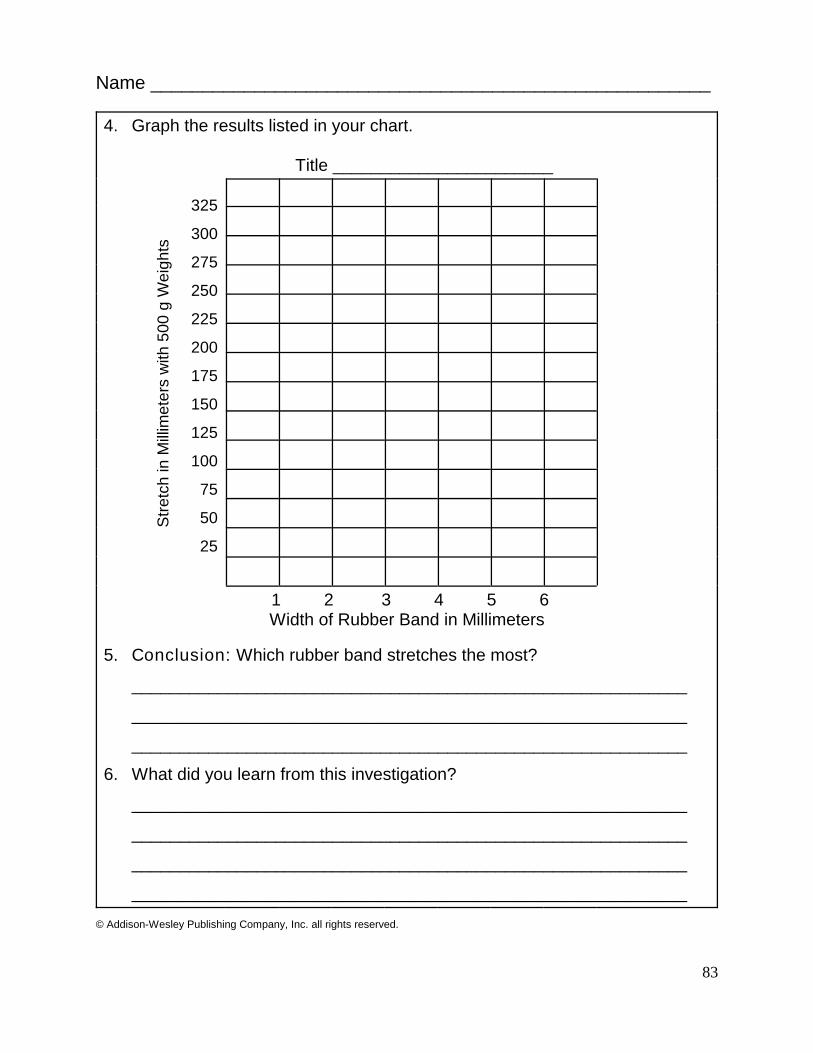
83
325
300
275
250
225
200
175
150
125
100
75
50
25
Str
etc
hin
Mill
ime
ters
with
50
0g
We
igh
ts
Name ______________________________________________________
4. Graph the results listed in your chart.
Title _______________________
1 2 3 4 5 6Width of Rubber Band in Millimeters
5. Conclusion: Which rubber band stretches the most?
__________________________________________________________
__________________________________________________________
__________________________________________________________
6. What did you learn from this investigation?
__________________________________________________________
__________________________________________________________
__________________________________________________________
__________________________________________________________
© Addison-Wesley Publishing Company, Inc. all rights reserved.
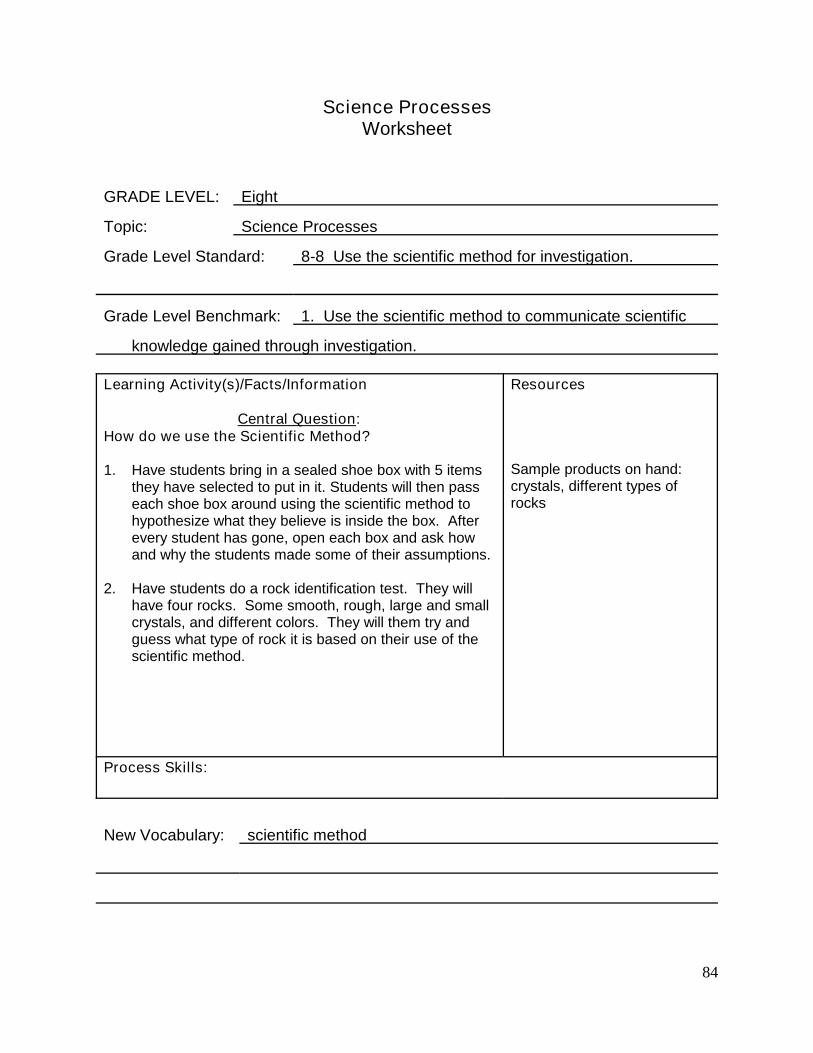
84
Science ProcessesWorksheet
GRADE LEVEL: Eight
Topic: Science Processes
Grade Level Standard: 8-8 Use the scientific method for investigation.
Grade Level Benchmark: 1. Use the scientific method to communicate scientific
knowledge gained through investigation.
Learning Activity(s)/Facts/Information
Central Question:How do we use the Scientific Method?
1. Have students bring in a sealed shoe box with 5 itemsthey have selected to put in it. Students will then passeach shoe box around using the scientific method tohypothesize what they believe is inside the box. Afterevery student has gone, open each box and ask howand why the students made some of their assumptions.
2. Have students do a rock identification test. They willhave four rocks. Some smooth, rough, large and smallcrystals, and different colors. They will them try andguess what type of rock it is based on their use of thescientific method.
Resources
Sample products on hand:crystals, different types ofrocks
Process Skills:
New Vocabulary: scientific method
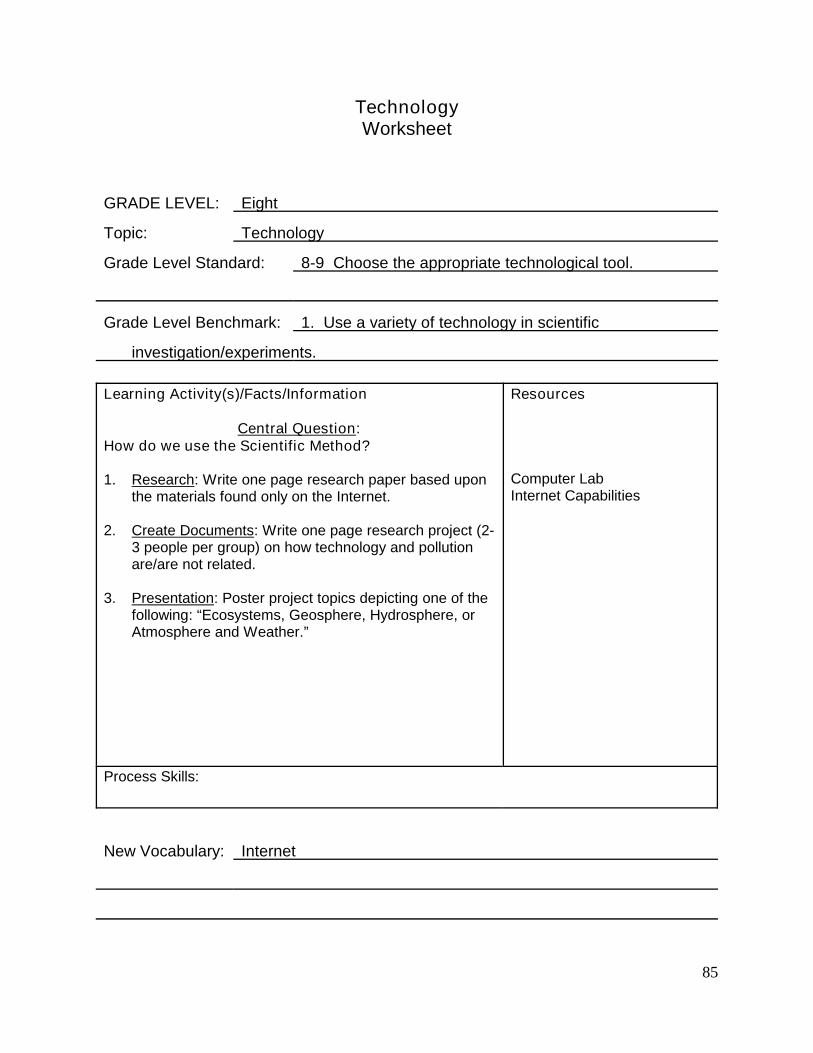
85
TechnologyWorksheet
GRADE LEVEL: Eight
Topic: Technology
Grade Level Standard: 8-9 Choose the appropriate technological tool.
Grade Level Benchmark: 1. Use a variety of technology in scientific
investigation/experiments.
Learning Activity(s)/Facts/Information
Central Question:How do we use the Scientific Method?
1. Research: Write one page research paper based uponthe materials found only on the Internet.
2. Create Documents: Write one page research project (2-3 people per group) on how technology and pollutionare/are not related.
3. Presentation: Poster project topics depicting one of thefollowing: “Ecosystems, Geosphere, Hydrosphere, orAtmosphere and Weather.”
Resources
Computer LabInternet Capabilities
Process Skills:
New Vocabulary: Internet
86
Gender/EquityWorksheet
GRADE LEVEL: Eight
Topic: Gender/Equity
Grade Level Standard: 8-10 Describe the contributions made in science by
cultures and individuals of diverse backgrounds.
Grade Level Benchmark: 1. Recognize the contributions made in science by
cultures and individuals of diverse backgrounds. (II.1.MS.6)
Learning Activity(s)/Facts/Information
Central Question:Who are some important scientist? Why?
Cells HydrosphereKatherine Esau Eugenie ClarkErnest E. Just Sylvia Earle
Ecosystem Matthew Fontaine MauryRachel Louise Carson Atmosphere and WeatherGrace Chow Margaret LemoneAldo Leopold Warren Washington
GeosphereLouise Arner BoydMatthew HensonRobert Peary
Resources
Process Skills:
New Vocabulary:
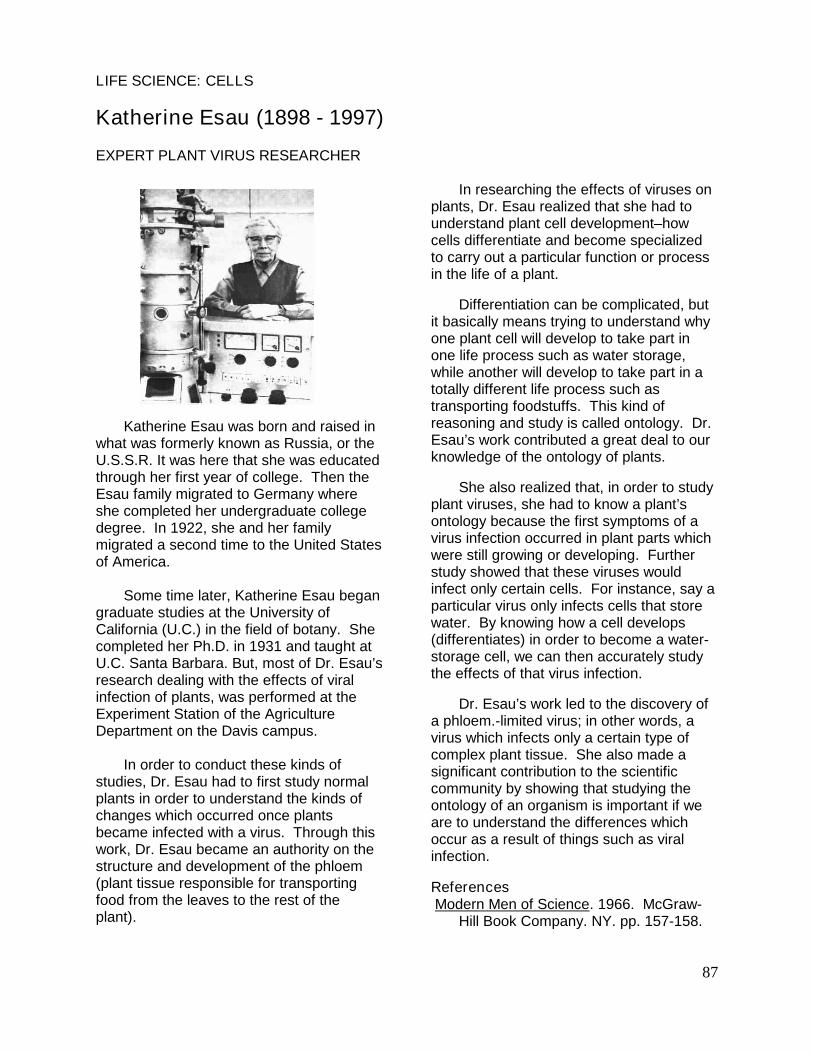
87
LIFE SCIENCE: CELLS
Katherine Esau (1898 - 1997)
EXPERT PLANT VIRUS RESEARCHER
Katherine Esau was born and raised inwhat was formerly known as Russia, or theU.S.S.R. It was here that she was educatedthrough her first year of college. Then theEsau family migrated to Germany whereshe completed her undergraduate collegedegree. In 1922, she and her familymigrated a second time to the United Statesof America.
Some time later, Katherine Esau begangraduate studies at the University ofCalifornia (U.C.) in the field of botany. Shecompleted her Ph.D. in 1931 and taught atU.C. Santa Barbara. But, most of Dr. Esau’sresearch dealing with the effects of viralinfection of plants, was performed at theExperiment Station of the AgricultureDepartment on the Davis campus.
In order to conduct these kinds ofstudies, Dr. Esau had to first study normalplants in order to understand the kinds ofchanges which occurred once plantsbecame infected with a virus. Through thiswork, Dr. Esau became an authority on thestructure and development of the phloem(plant tissue responsible for transportingfood from the leaves to the rest of theplant).
In researching the effects of viruses onplants, Dr. Esau realized that she had tounderstand plant cell development–howcells differentiate and become specializedto carry out a particular function or processin the life of a plant.
Differentiation can be complicated, butit basically means trying to understand whyone plant cell will develop to take part inone life process such as water storage,while another will develop to take part in atotally different life process such astransporting foodstuffs. This kind ofreasoning and study is called ontology. Dr.Esau’s work contributed a great deal to ourknowledge of the ontology of plants.
She also realized that, in order to studyplant viruses, she had to know a plant’sontology because the first symptoms of avirus infection occurred in plant parts whichwere still growing or developing. Furtherstudy showed that these viruses wouldinfect only certain cells. For instance, say aparticular virus only infects cells that storewater. By knowing how a cell develops(differentiates) in order to become a water-storage cell, we can then accurately studythe effects of that virus infection.
Dr. Esau’s work led to the discovery ofa phloem.-limited virus; in other words, avirus which infects only a certain type ofcomplex plant tissue. She also made asignificant contribution to the scientificcommunity by showing that studying theontology of an organism is important if weare to understand the differences whichoccur as a result of things such as viralinfection.
ReferencesModern Men of Science. 1966. McGraw-
Hill Book Company. NY. pp. 157-158.
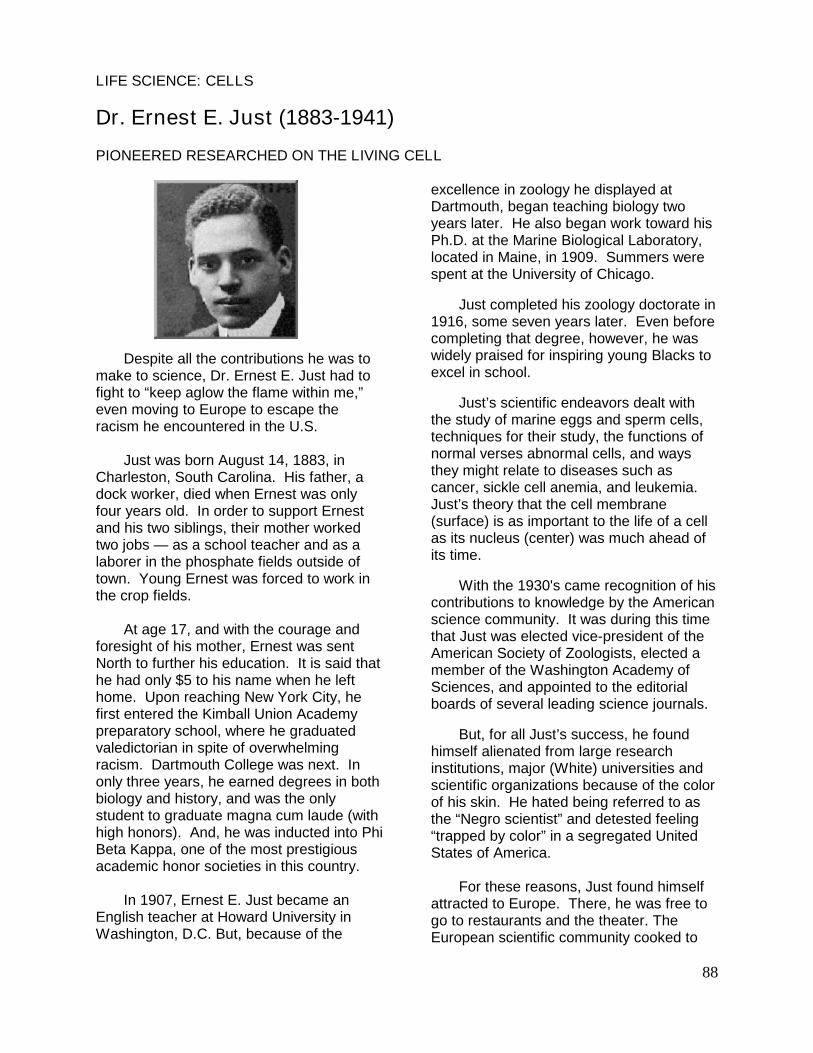
88
LIFE SCIENCE: CELLS
Dr. Ernest E. Just (1883-1941)
PIONEERED RESEARCHED ON THE LIVING CELL
Despite all the contributions he was tomake to science, Dr. Ernest E. Just had tofight to “keep aglow the flame within me,”even moving to Europe to escape theracism he encountered in the U.S.
Just was born August 14, 1883, inCharleston, South Carolina. His father, adock worker, died when Ernest was onlyfour years old. In order to support Ernestand his two siblings, their mother workedtwo jobs — as a school teacher and as alaborer in the phosphate fields outside oftown. Young Ernest was forced to work inthe crop fields.
At age 17, and with the courage andforesight of his mother, Ernest was sentNorth to further his education. It is said thathe had only $5 to his name when he lefthome. Upon reaching New York City, hefirst entered the Kimball Union Academypreparatory school, where he graduatedvaledictorian in spite of overwhelmingracism. Dartmouth College was next. Inonly three years, he earned degrees in bothbiology and history, and was the onlystudent to graduate magna cum laude (withhigh honors). And, he was inducted into PhiBeta Kappa, one of the most prestigiousacademic honor societies in this country.
In 1907, Ernest E. Just became anEnglish teacher at Howard University inWashington, D.C. But, because of the
excellence in zoology he displayed atDartmouth, began teaching biology twoyears later. He also began work toward hisPh.D. at the Marine Biological Laboratory,located in Maine, in 1909. Summers werespent at the University of Chicago.
Just completed his zoology doctorate in1916, some seven years later. Even beforecompleting that degree, however, he waswidely praised for inspiring young Blacks toexcel in school.
Just’s scientific endeavors dealt withthe study of marine eggs and sperm cells,techniques for their study, the functions ofnormal verses abnormal cells, and waysthey might relate to diseases such ascancer, sickle cell anemia, and leukemia.Just’s theory that the cell membrane(surface) is as important to the life of a cellas its nucleus (center) was much ahead ofits time.
With the 1930's came recognition of hiscontributions to knowledge by the Americanscience community. It was during this timethat Just was elected vice-president of theAmerican Society of Zoologists, elected amember of the Washington Academy ofSciences, and appointed to the editorialboards of several leading science journals.
But, for all Just’s success, he foundhimself alienated from large researchinstitutions, major (White) universities andscientific organizations because of the colorof his skin. He hated being referred to asthe “Negro scientist” and detested feeling“trapped by color” in a segregated UnitedStates of America.
For these reasons, Just found himselfattracted to Europe. There, he was free togo to restaurants and the theater. TheEuropean scientific community cooked to
89
his research, and not to his color, so Justspent much of his career at top laboratoriesin Germany and France.
Sadly, Ernest E. Just died of cancer in1941, two years after returning to the UnitedStates.
Frank R. Lillie, a well-known scientistand friend of Just, described his life thisway: “...despite his achievements, anelement of tragedy ran through all Just’sscientific career due to the limitationsimposed by being a Negro in America...That a man of his ability, scientific devotion,and of such strong personal loyalties as hegave and received, should have beenwarped in the land of his birth much remaina matter for regret.”
Books by Dr. E. E. Just
The Biology of the Cell Surface.Blakiston’s Publishing. Philadelphia,1939.
Basic Methods for Experiments in Eggs ofMarine Animals. Blakiston’s Publishing.Philadelphia, 1939.
References
“Scientific Ingenuity in the Bind of RacialInjustice.” J. Natl. Soc. Black Eng. vol4. no. 3, February. 1989.
Dictionary of American Negro Biologist.eds. Rayford Logan and MichaelWinston. W.W. Norton & Co., NY.1982.
The Philadelphia Tribune. Dartmouth StartsE.E. Just Professorship. January 5,1982.
Black Apollo of Science: The Life of ErnestEverett Just. Kenneth R. Manning.Oxford Univ. Press., NY. 1983.
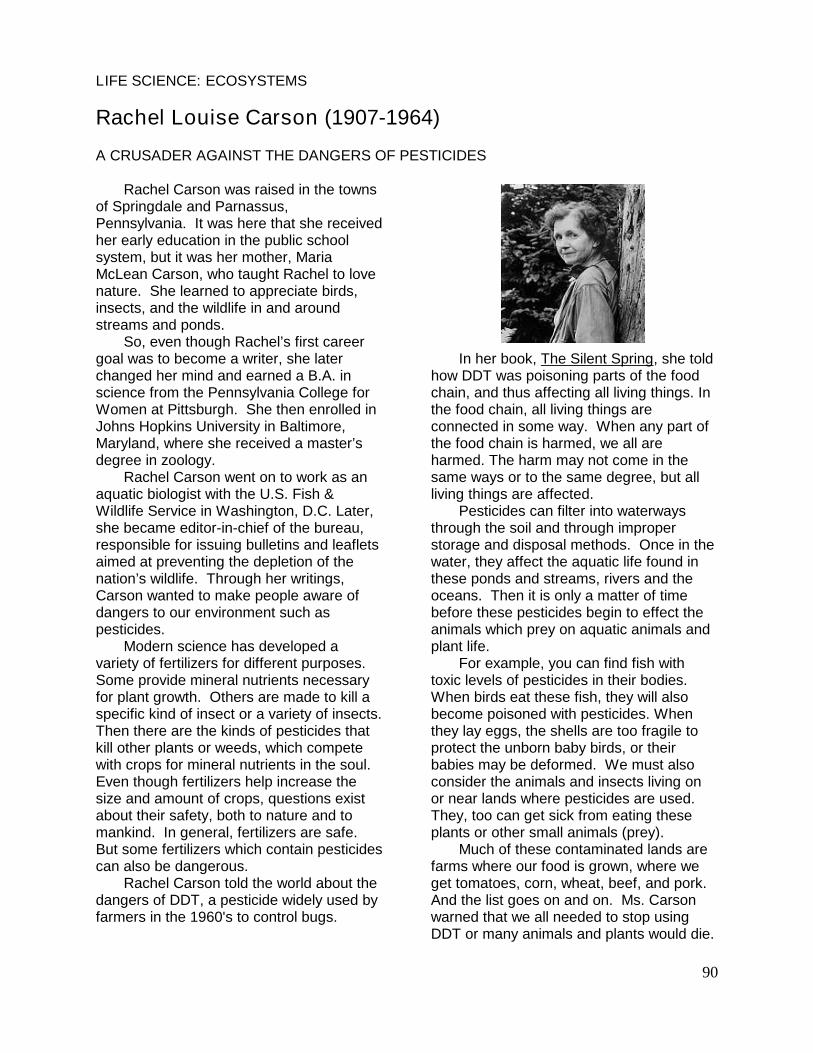
90
LIFE SCIENCE: ECOSYSTEMS
Rachel Louise Carson (1907-1964)
A CRUSADER AGAINST THE DANGERS OF PESTICIDES
Rachel Carson was raised in the townsof Springdale and Parnassus,Pennsylvania. It was here that she receivedher early education in the public schoolsystem, but it was her mother, MariaMcLean Carson, who taught Rachel to lovenature. She learned to appreciate birds,insects, and the wildlife in and aroundstreams and ponds.
So, even though Rachel’s first careergoal was to become a writer, she laterchanged her mind and earned a B.A. inscience from the Pennsylvania College forWomen at Pittsburgh. She then enrolled inJohns Hopkins University in Baltimore,Maryland, where she received a master’sdegree in zoology.
Rachel Carson went on to work as anaquatic biologist with the U.S. Fish &Wildlife Service in Washington, D.C. Later,she became editor-in-chief of the bureau,responsible for issuing bulletins and leafletsaimed at preventing the depletion of thenation’s wildlife. Through her writings,Carson wanted to make people aware ofdangers to our environment such aspesticides.
Modern science has developed avariety of fertilizers for different purposes.Some provide mineral nutrients necessaryfor plant growth. Others are made to kill aspecific kind of insect or a variety of insects.Then there are the kinds of pesticides thatkill other plants or weeds, which competewith crops for mineral nutrients in the soul.Even though fertilizers help increase thesize and amount of crops, questions existabout their safety, both to nature and tomankind. In general, fertilizers are safe.But some fertilizers which contain pesticidescan also be dangerous.
Rachel Carson told the world about thedangers of DDT, a pesticide widely used byfarmers in the 1960's to control bugs.
In her book, The Silent Spring, she toldhow DDT was poisoning parts of the foodchain, and thus affecting all living things. Inthe food chain, all living things areconnected in some way. When any part ofthe food chain is harmed, we all areharmed. The harm may not come in thesame ways or to the same degree, but allliving things are affected.
Pesticides can filter into waterwaysthrough the soil and through improperstorage and disposal methods. Once in thewater, they affect the aquatic life found inthese ponds and streams, rivers and theoceans. Then it is only a matter of timebefore these pesticides begin to effect theanimals which prey on aquatic animals andplant life.
For example, you can find fish withtoxic levels of pesticides in their bodies.When birds eat these fish, they will alsobecome poisoned with pesticides. Whenthey lay eggs, the shells are too fragile toprotect the unborn baby birds, or theirbabies may be deformed. We must alsoconsider the animals and insects living onor near lands where pesticides are used.They, too can get sick from eating theseplants or other small animals (prey).
Much of these contaminated lands arefarms where our food is grown, where weget tomatoes, corn, wheat, beef, and pork.And the list goes on and on. Ms. Carsonwarned that we all needed to stop usingDDT or many animals and plants would die.
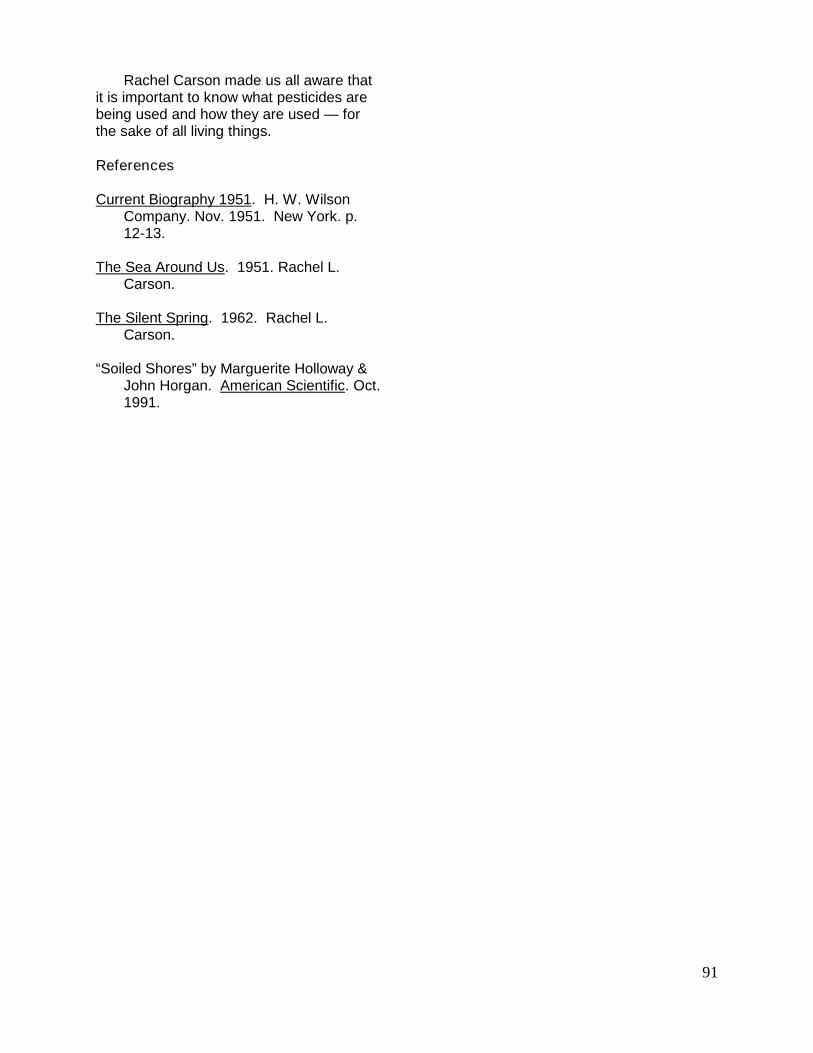
91
Rachel Carson made us all aware thatit is important to know what pesticides arebeing used and how they are used — forthe sake of all living things.
References
Current Biography 1951. H. W. WilsonCompany. Nov. 1951. New York. p.12-13.
The Sea Around Us. 1951. Rachel L.Carson.
The Silent Spring. 1962. Rachel L.Carson.
“Soiled Shores” by Marguerite Holloway &John Horgan. American Scientific. Oct.1991.
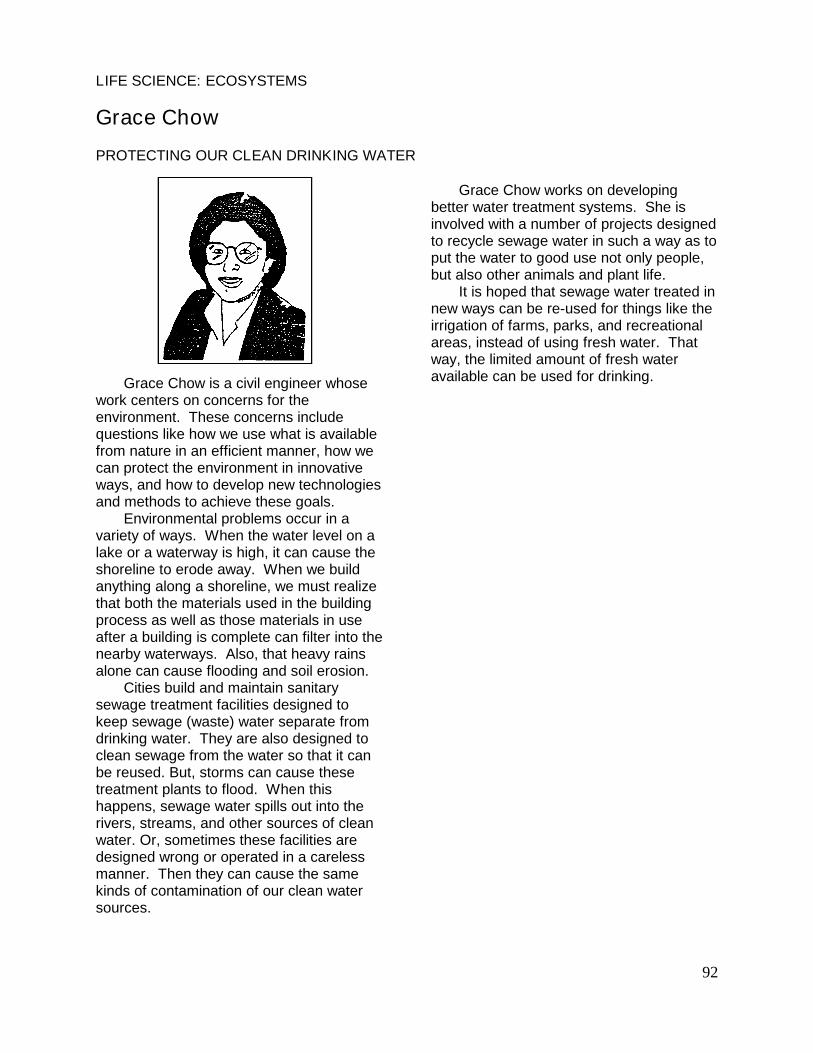
92
LIFE SCIENCE: ECOSYSTEMS
Grace Chow
PROTECTING OUR CLEAN DRINKING WATER
Grace Chow is a civil engineer whosework centers on concerns for theenvironment. These concerns includequestions like how we use what is availablefrom nature in an efficient manner, how wecan protect the environment in innovativeways, and how to develop new technologiesand methods to achieve these goals.
Environmental problems occur in avariety of ways. When the water level on alake or a waterway is high, it can cause theshoreline to erode away. When we buildanything along a shoreline, we must realizethat both the materials used in the buildingprocess as well as those materials in useafter a building is complete can filter into thenearby waterways. Also, that heavy rainsalone can cause flooding and soil erosion.
Cities build and maintain sanitarysewage treatment facilities designed tokeep sewage (waste) water separate fromdrinking water. They are also designed toclean sewage from the water so that it canbe reused. But, storms can cause thesetreatment plants to flood. When thishappens, sewage water spills out into therivers, streams, and other sources of cleanwater. Or, sometimes these facilities aredesigned wrong or operated in a carelessmanner. Then they can cause the samekinds of contamination of our clean watersources.
Grace Chow works on developingbetter water treatment systems. She isinvolved with a number of projects designedto recycle sewage water in such a way as toput the water to good use not only people,but also other animals and plant life.
It is hoped that sewage water treated innew ways can be re-used for things like theirrigation of farms, parks, and recreationalareas, instead of using fresh water. Thatway, the limited amount of fresh wateravailable can be used for drinking.
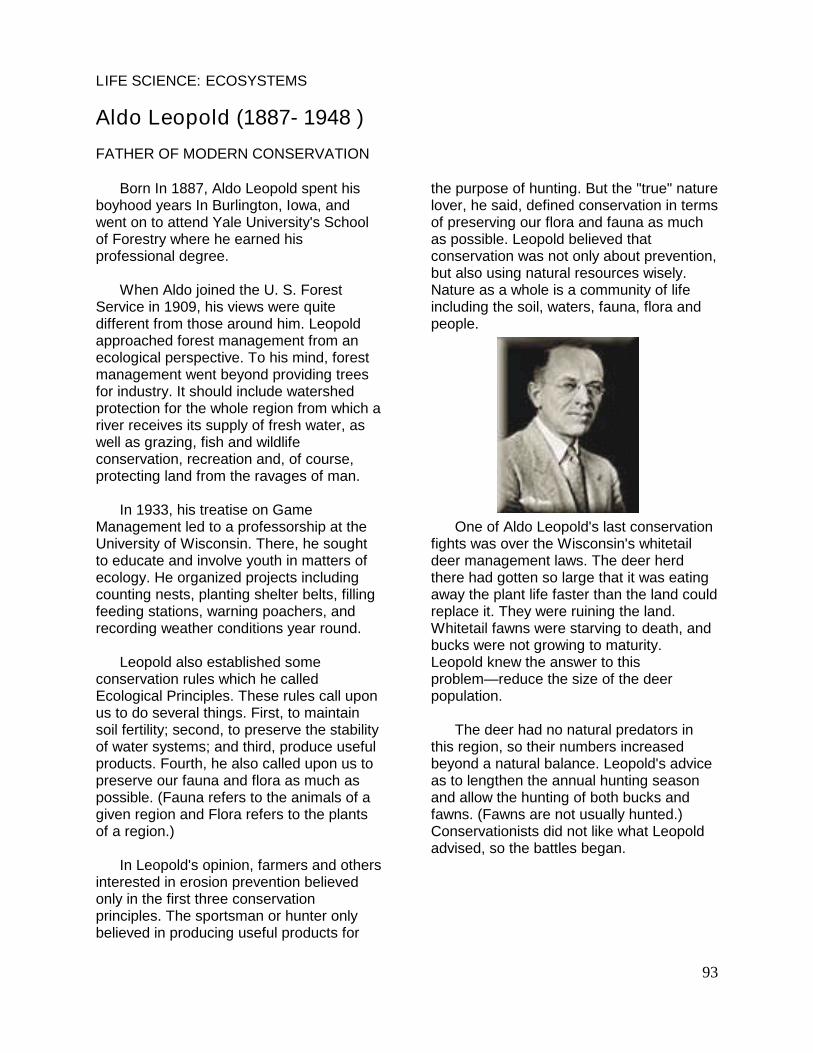
93
LIFE SCIENCE: ECOSYSTEMS
Aldo Leopold (1887- 1948 )
FATHER OF MODERN CONSERVATION
Born In 1887, Aldo Leopold spent hisboyhood years In Burlington, Iowa, andwent on to attend Yale University's Schoolof Forestry where he earned hisprofessional degree.
When Aldo joined the U. S. ForestService in 1909, his views were quitedifferent from those around him. Leopoldapproached forest management from anecological perspective. To his mind, forestmanagement went beyond providing treesfor industry. It should include watershedprotection for the whole region from which ariver receives its supply of fresh water, aswell as grazing, fish and wildlifeconservation, recreation and, of course,protecting land from the ravages of man.
In 1933, his treatise on GameManagement led to a professorship at theUniversity of Wisconsin. There, he soughtto educate and involve youth in matters ofecology. He organized projects includingcounting nests, planting shelter belts, fillingfeeding stations, warning poachers, andrecording weather conditions year round.
Leopold also established someconservation rules which he calledEcological Principles. These rules call uponus to do several things. First, to maintainsoil fertility; second, to preserve the stabilityof water systems; and third, produce usefulproducts. Fourth, he also called upon us topreserve our fauna and flora as much aspossible. (Fauna refers to the animals of agiven region and Flora refers to the plantsof a region.)
In Leopold's opinion, farmers and othersinterested in erosion prevention believedonly in the first three conservationprinciples. The sportsman or hunter onlybelieved in producing useful products for
the purpose of hunting. But the "true" naturelover, he said, defined conservation in termsof preserving our flora and fauna as muchas possible. Leopold believed thatconservation was not only about prevention,but also using natural resources wisely.Nature as a whole is a community of lifeincluding the soil, waters, fauna, flora andpeople.
One of Aldo Leopold's last conservationfights was over the Wisconsin's whitetaildeer management laws. The deer herdthere had gotten so large that it was eatingaway the plant life faster than the land couldreplace it. They were ruining the land.Whitetail fawns were starving to death, andbucks were not growing to maturity.Leopold knew the answer to thisproblem—reduce the size of the deerpopulation.
The deer had no natural predators inthis region, so their numbers increasedbeyond a natural balance. Leopold's adviceas to lengthen the annual hunting seasonand allow the hunting of both bucks andfawns. (Fawns are not usually hunted.)Conservationists did not like what Leopoldadvised, so the battles began.
94
Today, arguments are still being wagedover what role people should take inpreserving nature and the balance ofnature. Is It our responsibility only tooversee and protect the lands and animals,or is it our duty to keep animal populationsat controlled levels by allowing hunting?What should our role be when an animalpopulation gets too large to be supported bythe vegetation of the region? How muchhuman intervention is too much?
Because he knew more about landecology than any other person of his time,many principles of wildlife management inpractice today were developed by AldoLeopold and his co-workers. He had a rareunderstanding of the way biotic (life) forcesinteract, and the ways in which theseinteractions occur, affecting the life andlandscape of America.
References
A Sand County Almanac and SketchesHere and There. Aldo Leopold. OxfordUniversity Press. 1949, 1980.
A Sand County Almanac with other Essayson Conservation from Round River. AldoLeopold. Oxford University Press. 1949,1966.
Game Management. Aldo Leopold.Charles Scribner & Sons. 1933.1961.
"Leopold Helped Set the Course of ModemConservation." Wisconsin ConservationBulletin. Dec. 1954.
"Aldo Leopold Remembered." by ClaySchoenefeld. Audubon. May 1978.
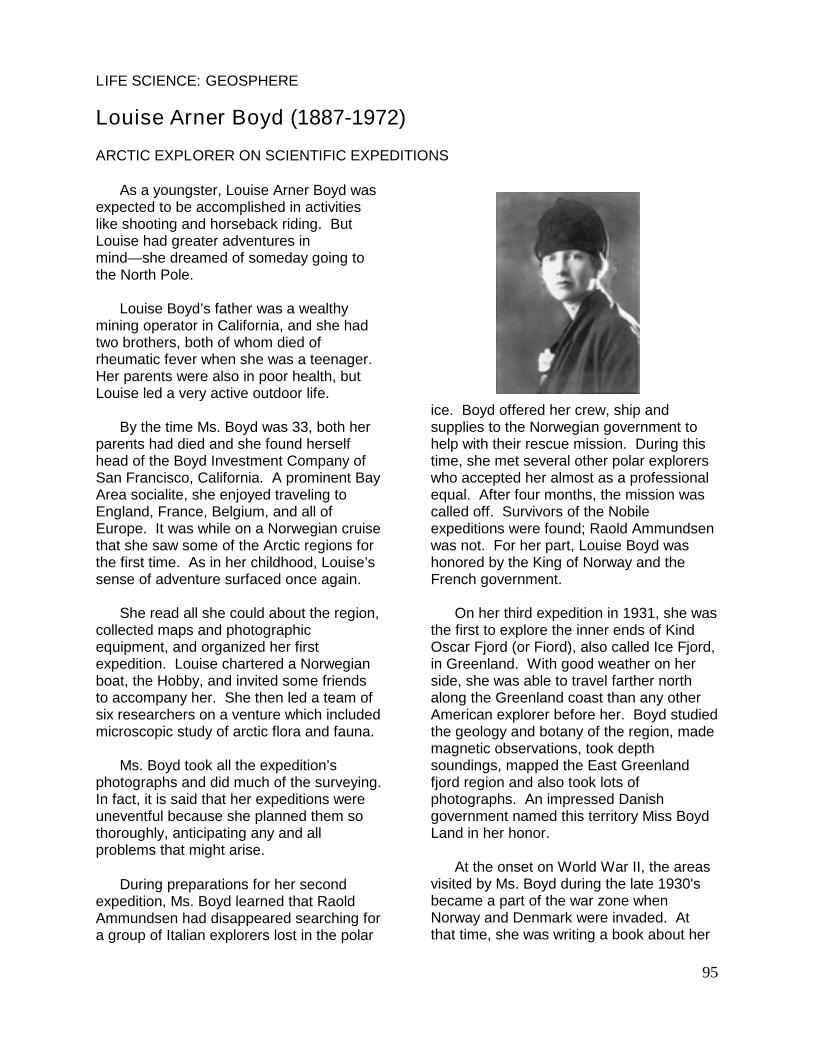
95
LIFE SCIENCE: GEOSPHERE
Louise Arner Boyd (1887-1972)
ARCTIC EXPLORER ON SCIENTIFIC EXPEDITIONS
As a youngster, Louise Arner Boyd wasexpected to be accomplished in activitieslike shooting and horseback riding. ButLouise had greater adventures inmind—she dreamed of someday going tothe North Pole.
Louise Boyd’s father was a wealthymining operator in California, and she hadtwo brothers, both of whom died ofrheumatic fever when she was a teenager.Her parents were also in poor health, butLouise led a very active outdoor life.
By the time Ms. Boyd was 33, both herparents had died and she found herselfhead of the Boyd Investment Company ofSan Francisco, California. A prominent BayArea socialite, she enjoyed traveling toEngland, France, Belgium, and all ofEurope. It was while on a Norwegian cruisethat she saw some of the Arctic regions forthe first time. As in her childhood, Louise’ssense of adventure surfaced once again.
She read all she could about the region,collected maps and photographicequipment, and organized her firstexpedition. Louise chartered a Norwegianboat, the Hobby, and invited some friendsto accompany her. She then led a team ofsix researchers on a venture which includedmicroscopic study of arctic flora and fauna.
Ms. Boyd took all the expedition’sphotographs and did much of the surveying.In fact, it is said that her expeditions wereuneventful because she planned them sothoroughly, anticipating any and allproblems that might arise.
During preparations for her secondexpedition, Ms. Boyd learned that RaoldAmmundsen had disappeared searching fora group of Italian explorers lost in the polar
ice. Boyd offered her crew, ship andsupplies to the Norwegian government tohelp with their rescue mission. During thistime, she met several other polar explorerswho accepted her almost as a professionalequal. After four months, the mission wascalled off. Survivors of the Nobileexpeditions were found; Raold Ammundsenwas not. For her part, Louise Boyd washonored by the King of Norway and theFrench government.
On her third expedition in 1931, she wasthe first to explore the inner ends of KindOscar Fjord (or Fiord), also called Ice Fjord,in Greenland. With good weather on herside, she was able to travel farther northalong the Greenland coast than any otherAmerican explorer before her. Boyd studiedthe geology and botany of the region, mademagnetic observations, took depthsoundings, mapped the East Greenlandfjord region and also took lots ofphotographs. An impressed Danishgovernment named this territory Miss BoydLand in her honor.
At the onset on World War II, the areasvisited by Ms. Boyd during the late 1930'sbecame a part of the war zone whenNorway and Denmark were invaded. Atthat time, she was writing a book about her

96
findings in these regions, and the UnitedStates government told her how valuablethese reports and photographs would be tothe war effort — hers were the few accuratematerials the government could use fordefense purposes.
The U.S. War Department enlisted Ms.Boyd as a technical adviser and selectedher to lead an investigation of magnetic andradio phenomena in the Arctic waters. (Allof her activities during the war were keptsecret.) The Department of the Armyrewarded her with a Certificate ofAppreciation for “outstanding patrioticservice to the Army as a contributor ofgeographic knowledge.” After the warended, she was free to publish her book ofthe Denmark and Norway regions, and TheCoast of Northwest Greenland was finallypublished in 1948.
In her sixties, Louise Boyd had onemore dream: she wanted to fly over theNorth Pole. So, she chartered a plane anddid it — the first privately funded flight overthe region and the first such flight by awoman.
By the time she died in 1972, Ms. Boydhad spent almost every penny of herinherited fortune on explorations andscientific expeditions. But, Louise Boydviewed these contributions to the welfare ofthe world as part of a great personal rewardfor reaching her goals, and a pleasurewhich she had thoroughly enjoyed.
ReferencesChristian Science Monitor. p. 15, June 19,1959.
National Cyclopedia of American Biographycurrent, vol. G (1943-46).
The Fiord Region of East Greenland.Louise Boyd. American GeographicalSociety, 1935.
The Coast of Northeast Greenland. LouiseBoyd. American Geographical Society,1949.
Further Explorations of East Greenland.Louise Boyd, in Geographical Review, July1934.

97
EARTH SCIENCE: GEOSPHERE
Matthew A. Henson (1866-1955)
and Robert E. Peary (1856-1920)
CO-DISCOVERERS OF THE NORTH POLE
Of the many adventures in the Arctic,there is a story which is perhaps mostfamous of all. And, it forever intertwined thelives of two men – Matthew A. Henson andRobert E. Peary. These two joined forcesin 1887 and spent some 20 years learningabout travel and survival in the Arctic beforethey eventually reached the North Pole.
Earlier expeditions were designed toexplore the untouched Northern region ofGreenland, and these trips ultimatelypenetrated deeper inland than any beforethem. In 1891, Peary organized anexpedition for the push north to proveGreenland was an island. During this trek,he also discovered what may still be thelargest known meteorite, weighing some 90tons. In his honor, the northern mostsection – free of the ice cap which coversmost of Greenland – was named PearyLand.
During the next 12 years, Peary andMatthew Henson’s North Pole expeditioncrew made several trips to Greenland. Indoing so, they fine-tuned their survival skills,learning to live like the Eskimos. And, theymanaged to get closer and closer to theNorth Pole, their ultimate goal.
It was 1909 when an extensive crewwas organized to make the journey of alljourneys. This group included AdmiralPeary, explorer; Matthew Henson, explorerand weather meteorologist; Ross Marvin,secretary and assistant; Dr. J.W. Goodsell,expedition surgeon; George Borup; Captainbegan the drive to the Pole, some 413 milesthrough what has been termed “a whitehell.”
Matthew Henson
Robert Peary
As a part of the expedition’s strategy,Borup and Marvin were sent back early onfor additional supplies and fuel. Bartlettwas sent ahead to set the trial north. Theweather, a major concern for a successfulmission, was good, with temperaturesranging from 5 degrees Fahrenheit to 32degrees Fahrenheit below zero. However,Borup and Marvin failed to return with theneeded fuel. After a week’s delay, thegroup pushed ahead anyway. Three dayslater, Henson was sent ahead to blaze atrail for five marches (each march wasdesigned to be equivalent to 12 hours oftravel), and Marvin and Borup finally arrivedwith the fuel.
98
At the end of each march, igloos were built,men and dogs ate, and, of course, theyslept. This plan worked well because whencrew members reached one of the camps atthe end of a march, fewer igloos wouldneed to be built because some werealready there. Along the way, the crewmade soundings of the arctic waters tomeasure their depth using piano wire with alead weight tied to the end. Unfortunately,Macmillan developed a bad case of frostbiteon his foot and was sent back to CapeColumbia.
After two marches or so, the core groupcaught up with Henson’s division which hadmade camp to repair their sledges. Then,after two more marches, Borup turned backwith his division – his job was done. He hadcarried his heavy sledge through the icefloes, but he lacked experience. And he,too, had a case of frostbite.
One of the strategies for the longjourney was to allow some crew membersto turn back so the core group could carryon with fewer worries about losing people,time, and running out of food.
This left a total of 12 men. Henson andBartlett were sent forward to make theirmarch and camp. Peary and the rest of thecore group would follow 12 hours later.When the core group arrived at camp,Henson and Bartlett started out on the nextmarch. Marvin was next to be sent backafter the expedition had reached a positionof 86 degrees and 38 minutes. The NorthPole was at 90 degrees.
Here, the ice was level but treacherous.It surged together, opened up, and groundagainst the open waters. After making itbeyond some bad ice floes, it was time forBartlett to turn back. He had hoped tomake it as far as 88 degrees but at 87degrees and 48 minutes there were notenough supplies for his division to remain.At this point, the crew was 133 nauticalmiles from the Pole and had 40 days offood left (50 if they used the dogs for meat).But, they not only had to make it to thePole; they also had a return trip to thinkabout.
They decided to make five marches of25 miles each. Barring bad weather, theywould be able to make it to their goal withone final push forward at the end of the fifthmarch. The crew moved ahead, oftenpushing beyond their limits and receivingminimal rest before starting out again. Theymade the five marches in about four days.Measurements showed them to be at 89degrees and 57 minutes, only three nauticalmiles from the North Pole, and Peary wasshowing the wear from the journey.Matthew Henson and his crew of Eskimoscontinued the lead, allowing Peary sometime to recover. Not only did they reach thePole, but Peary’s division went beyond it byabout 10 miles.
Unfortunately, there has been a lot ofdebate over the role Henson played duringthe journey, not to mention who actuallyarrived at the North Pole first. Much of thetrip’s documentation indicates that MatthewHenson played a pivotal role in the survivaland success of the expedition team. Crewmembers were very dependent on weatherdata because the ability to predict stormswas crucial to their survival. But, Hensonwas not only the weather metrologist, hewas also fluent in the language of theEskimos, was a master sledge and doghandler, and a craftsman who, along withthe Eskimos, built and repaired many oftheir igloos.
A well-known story says that AdmiralPeary, when telling the rest of the worldabout their journey, left out Henson’scontributions and those of the Eskimos –indicating that he (Peary) was the “one” whoreached the North Pole first.
Needless to say, this caused problemsbetween Henson and Peary whichcontinued until their deaths. The saddestpart, perhaps, is that they likely admiredone another and considered each other afriend. But, this lack of recognition by Pearyhurt Henson deeply, especially coming froma friend.
The National Geographical Societyrecognized Peary as an explorer anddubbed him founder of the North Pole. ButHenson was never recognized by the
99
society, even in light of all the evidence ofhis critical role.
Today, however, after lengthy debate,both are recognized as co-founders of theNorth Pole. Matthew Henson and AdmiralRobert Peary are buried side-by-side inArlington National Cemetery, with plaquescommemorating their remarkableachievements.
References
A Negro Explorer at the North Pole.Matthew Henson. Arno press, New York,1969.
To Stand at the North Pole: the Dr. Cook —Adm. Peary North Pole Controversy.William R. Hunt. Stein and Day, New York,1981.
Peary, the Explorer and the Man. JohnWeems. Houghton Mifflin, 1967.
To the Top of the World: the Story of Pearyand Henson. Pauline K. Angell. RandMcNally, Chicago, 1964.
Across Greenland’s Ice-field. MaryDouglas. Nelson, New York, 1897.
Discovery of the North Pole: Dr. FrederickA. Cook’s Own Story of How He Reachedthe North Pole Before Commander RobertE. Peary. James Miller ed.. Chicago 1901.
The Life of Matthew Henson. JoanBacchus, Baylor Publishing Co. andCommunity Enterprises, Seattle, WA.,1986.
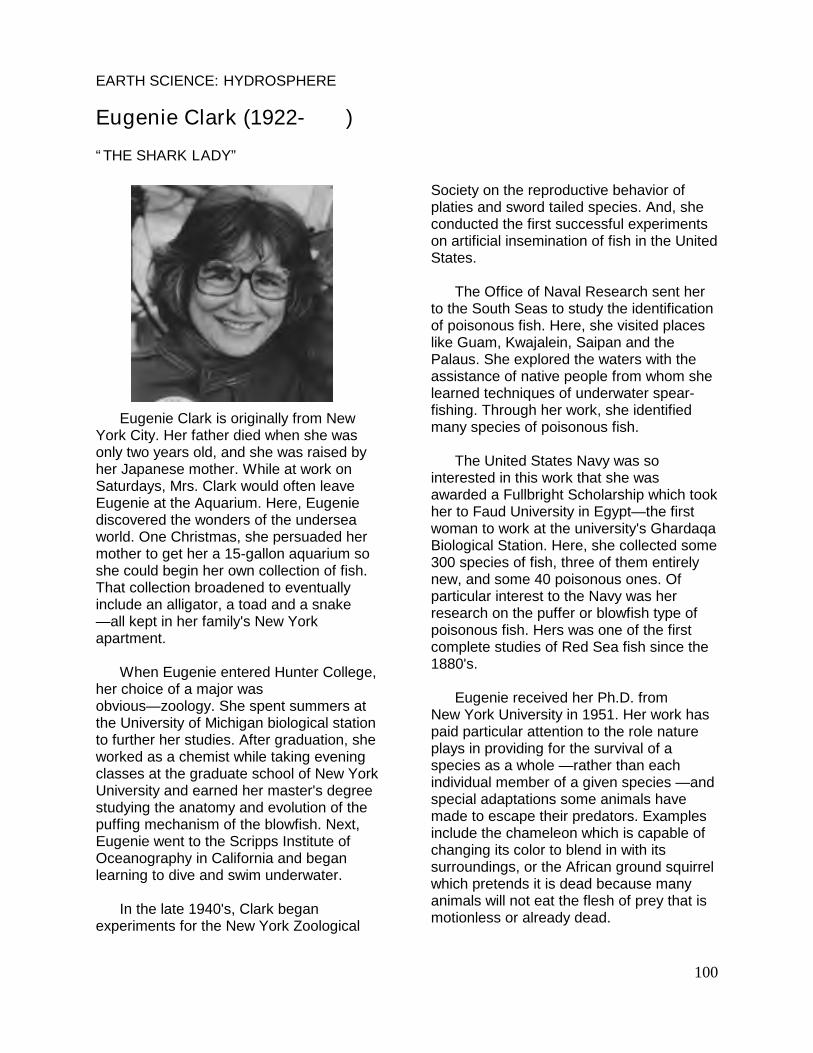
100
EARTH SCIENCE: HYDROSPHERE
Eugenie Clark (1922- )
“THE SHARK LADY”
Eugenie Clark is originally from NewYork City. Her father died when she wasonly two years old, and she was raised byher Japanese mother. While at work onSaturdays, Mrs. Clark would often leaveEugenie at the Aquarium. Here, Eugeniediscovered the wonders of the underseaworld. One Christmas, she persuaded hermother to get her a 15-gallon aquarium soshe could begin her own collection of fish.That collection broadened to eventuallyinclude an alligator, a toad and a snake—all kept in her family's New Yorkapartment.
When Eugenie entered Hunter College,her choice of a major wasobvious—zoology. She spent summers atthe University of Michigan biological stationto further her studies. After graduation, sheworked as a chemist while taking eveningclasses at the graduate school of New YorkUniversity and earned her master's degreestudying the anatomy and evolution of thepuffing mechanism of the blowfish. Next,Eugenie went to the Scripps Institute ofOceanography in California and beganlearning to dive and swim underwater.
In the late 1940's, Clark beganexperiments for the New York Zoological
Society on the reproductive behavior ofplaties and sword tailed species. And, sheconducted the first successful experimentson artificial insemination of fish in the UnitedStates.
The Office of Naval Research sent herto the South Seas to study the identificationof poisonous fish. Here, she visited placeslike Guam, Kwajalein, Saipan and thePalaus. She explored the waters with theassistance of native people from whom shelearned techniques of underwater spear-fishing. Through her work, she identifiedmany species of poisonous fish.
The United States Navy was sointerested in this work that she wasawarded a Fullbright Scholarship which tookher to Faud University in Egypt—the firstwoman to work at the university's GhardaqaBiological Station. Here, she collected some300 species of fish, three of them entirelynew, and some 40 poisonous ones. Ofparticular interest to the Navy was herresearch on the puffer or blowfish type ofpoisonous fish. Hers was one of the firstcomplete studies of Red Sea fish since the1880's.
Eugenie received her Ph.D. fromNew York University in 1951. Her work haspaid particular attention to the role natureplays in providing for the survival of aspecies as a whole —rather than eachindividual member of a given species —andspecial adaptations some animals havemade to escape their predators. Examplesinclude the chameleon which is capable ofchanging its color to blend in with itssurroundings, or the African ground squirrelwhich pretends it is dead because manyanimals will not eat the flesh of prey that ismotionless or already dead.

101
Eugenie Clark's most renownedwork studied the shark, hence hernickname "The Shark Lady." And she hasspent a lot of time speaking to groups abouthow sharks live in an attempt to lessen ourfear of this creature.
References
The Lady and the Sharks. Eugenie Clark.Harper & Row, New York, 1969.
Lady With a Spear. Eugenie Clark. Harper,New York, 1953.
Artificial Insemination in Viviparous Fishes.Science. December 15, 1950.
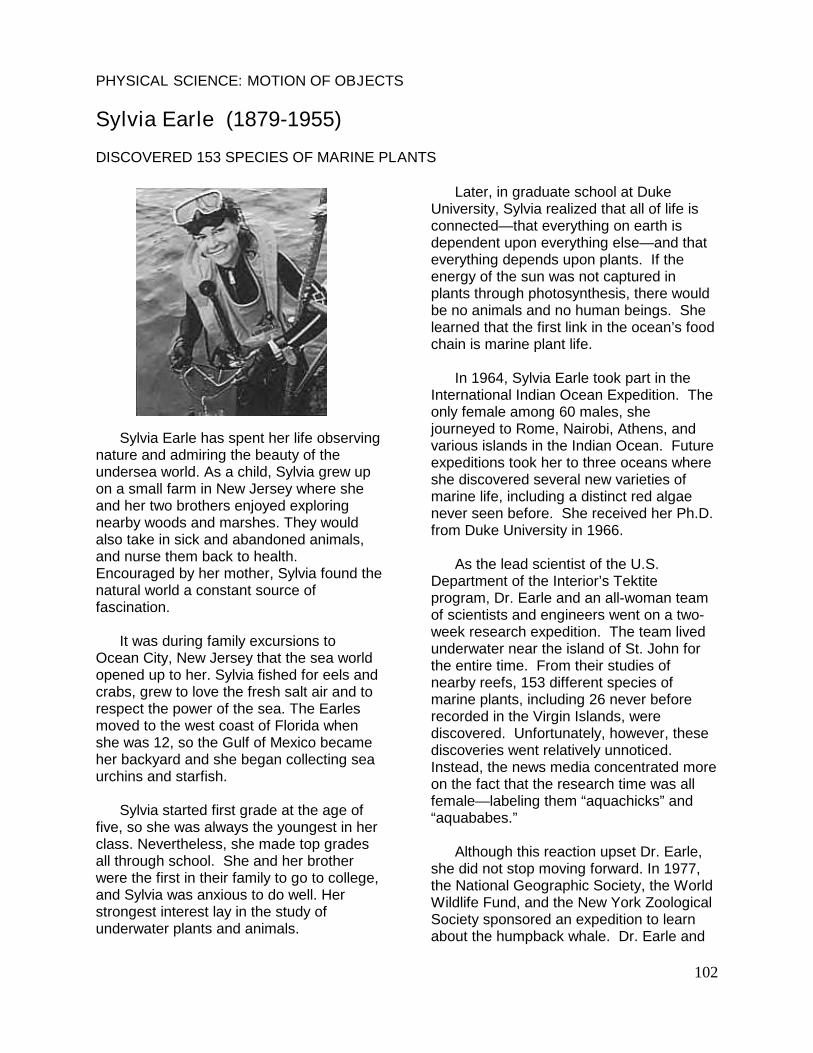
102
PHYSICAL SCIENCE: MOTION OF OBJECTS
Sylvia Earle (1879-1955)
DISCOVERED 153 SPECIES OF MARINE PLANTS
Sylvia Earle has spent her life observingnature and admiring the beauty of theundersea world. As a child, Sylvia grew upon a small farm in New Jersey where sheand her two brothers enjoyed exploringnearby woods and marshes. They wouldalso take in sick and abandoned animals,and nurse them back to health.Encouraged by her mother, Sylvia found thenatural world a constant source offascination.
It was during family excursions toOcean City, New Jersey that the sea worldopened up to her. Sylvia fished for eels andcrabs, grew to love the fresh salt air and torespect the power of the sea. The Earlesmoved to the west coast of Florida whenshe was 12, so the Gulf of Mexico becameher backyard and she began collecting seaurchins and starfish.
Sylvia started first grade at the age offive, so she was always the youngest in herclass. Nevertheless, she made top gradesall through school. She and her brotherwere the first in their family to go to college,and Sylvia was anxious to do well. Herstrongest interest lay in the study ofunderwater plants and animals.
Later, in graduate school at DukeUniversity, Sylvia realized that all of life isconnected—that everything on earth isdependent upon everything else—and thateverything depends upon plants. If theenergy of the sun was not captured inplants through photosynthesis, there wouldbe no animals and no human beings. Shelearned that the first link in the ocean’s foodchain is marine plant life.
In 1964, Sylvia Earle took part in theInternational Indian Ocean Expedition. Theonly female among 60 males, shejourneyed to Rome, Nairobi, Athens, andvarious islands in the Indian Ocean. Futureexpeditions took her to three oceans whereshe discovered several new varieties ofmarine life, including a distinct red algaenever seen before. She received her Ph.D.from Duke University in 1966.
As the lead scientist of the U.S.Department of the Interior’s Tektiteprogram, Dr. Earle and an all-woman teamof scientists and engineers went on a two-week research expedition. The team livedunderwater near the island of St. John forthe entire time. From their studies ofnearby reefs, 153 different species ofmarine plants, including 26 never beforerecorded in the Virgin Islands, werediscovered. Unfortunately, however, thesediscoveries went relatively unnoticed.Instead, the news media concentrated moreon the fact that the research time was allfemale—labeling them “aquachicks” and“aquababes.”
Although this reaction upset Dr. Earle,she did not stop moving forward. In 1977,the National Geographic Society, the WorldWildlife Fund, and the New York ZoologicalSociety sponsored an expedition to learnabout the humpback whale. Dr. Earle and
103
other scientists studied the whale’smysterious and intensely resonant songs aswell as their behavior. They also studiedthe barnacles, algae and parasites whichlive on the whale’s hide. Earle swam, sideby side with these gentle giants.
Dr. Earle strongly believed that the morewe know about the ocean, the more we willtake care and preserve it. As for thewhales, she says we must do more thanjust stop killing them; we must also protectthe places in which they live.
While participating in the ScientificCooperative Ocean Research Expedition,Dr. Earle not only made the longest anddeepest dives ever recorded by a woman,but she also discovered a new genus ofplants living at 250 feet below the surface.Another record-setting dive took place in1979 when she was lowered 1,250 feet tothe bottom of the Pacific Ocean off Oahu,Hawaii. This time she wore a suit ofexperimental design that resembled thoseused by astronauts. Here, she observed asmall, green-eyed shark, a sea fan with pinkpolyps, and giant spirals of bamboo coralthat looked like a field of bedsprings.These emitted a luminous blue light whenshe touched them.
Dr. Sylvia Earle is convinced that, ifpeople could see what is happening to ouroceans, they would not like it. She wantsus to understand that what we do in oneplace ultimately affects everybody becausethe health of the whole world depends uponthe health of our oceans.
References
Exploring the Deep Frontier the Adventureof Man in the Sea. Sylvia Earle. TheSociety, Washington, D.C., 1980.
Life with the Dutch Touch. Sylvia Earle.The Hague, Government PublishingOffice, 1960.
Breakthrough: Women in Science. DianaGleasner. Walker and Company, NewYork, 1983.

104
EARTH SCIENCE: HYDROSPHERE
Matthew Fontaine Maury (1806 - 1873)
PAVED WAY FOR SCIENTIFIC APPROACH
Matthew F. Maury was the seventh childof a family in Virginia which originally cameto the U.S. from Ireland. In 1825, he joinedthe U.S. Navy and served at sea until 1839when a stagecoach accident left him unableto return to sea duty. Maury was reassignedto a post in Washington, D.C., where hebecame an advocate for naval reforms.Southern expansionism and increasingscientific study which could improve seatravel. He joined the Confederacy in 1861,and served in England for the ConfederateNavy during the Civil War.
Upon his return to the United States,Maury went to work for the new NationalObservatory. But, he was not anaccomplished astronomer and hisshortcomings in the area caused problems.Even though Maury was in charge of theobservatory for 17 years, his contributionsto astronomy were considered small. Hisfailures in astronomy may have been due,in part, to the fact that he was mainlyinterested in improving navigationtechnology, so he was more concerned withthe earth and less with the heavens.
Maury used ships’ logs, which notedwinds an currents, to chart generalcirculation patterns of atmosphere andoceans. He began publishing these Wind
and Current Charts, and gave them tomariners free of charge in return for similarinformation from their own ships’ logs. As aresult, he was able to develop a series ofcharts and sailing directions which gave aclimatic picture of surface winds andcurrents for all the oceans.
As it turns out, Maury was interested inimproving sea technology in order to showthat sailing was superior to the steampropulsion engines being invented in themid 1800's. He claimed that his chartsshortened sailing routes around Cape Hornat the southern tip of South America, thusmaking steamer-railroad routes to the westuseless.
He was also involved in the field ofmarine micropaleontology. Around thistime, U.S. Navy vessels were beginning tomake use of submarine telegraphy. Theysounded (measured depth of) the NorthAtlantic under Maury’s direction from 1849to 1853. Using these findings, Mauryprepared the first bathymetrical (deep seasound) chart of contours located 1,000fathoms under the surface.
Maury organized the BrusselsConference in 1853, but his efforts to unifyinternational weather reporting for both landand sea ran into opposition from a group hehad helped found — The AmericanAssociation for the Advancement ofScience (A.A.A.S)
As happened before, Maury’s style ofpromoting ideas as being more worthy andimportant than others caused a problem.The A.A.A.S. felt that, just because Maurywas qualified at sea observations, this didnot make him a qualified meteorologist. So,he was only able to organize uniformweather reporting of sea conditions. Maury
105
meant well, but he had made errors andwas unwilling to revise some of his theories.After his death, however, the system wasextended to include both land and seameteorology.
Matthew Maury’s most significantcontributions may have come in the form ofstimulating other researchers to improvetheir own theories and research. That’sbecause he was inflexible and refused torevise his own findings, even when otherevidence proved contrary to his statedtheories.
References
Ocean Pathfinder: A Biography of MatthewF. Maury. Frances Williams. Harcourt,Brace and World, New York, 1966.
The Physical Geography of the Sea.Matthew Maury. T. Nelson, New York,1863.
The Physical Geography of the Sea and itsMeteorology. Matthew Maury. BelknapPress of Harvard University Press,Cambridge, 1963.
106
EARTH SCIENCE: ATMOSPHERE AND WEATHER
Margaret Lemone (1946 - )
INVESTIGATING THUNDERSTORMS AND SQUALLS
Dr. Margaret Lemone is a meteorologistwho investigates how thunderstormsbecome organized into lines, also calledsquall lines. At the National Center forAtmospheric Research, she also studiesways in which these squall lines effect airmovement in the lowest part of the earth’satmosphere.
How do thunderstorms happen?Certain atmospheric conditions must existfor them to form. First, a fairly deep layer ofair in the atmosphere, about 10,000 feet ormore, must be moist. Second, theatmosphere should be “unstable.” And,third, there should be few clouds in thedaylight sky, so the sun’s rays can heat theground and air near the ground (the lowatmosphere).
As the ground and lower layers of theatmosphere are heated by radiation fromthe sun, solar energy is absorbed by theground and moist air near its surface. Thenthe temperature rises. Upper layers of theatmosphere do not absorb as much of the
sun’s radiation – they are cooler, therefore itis warmer near the ground, and coolerhigher up in the atmosphere.Thunderstorms help spread out this heatenergy to all layers of the atmosphere, thuscooling off the surface of the earth – sort oflike nature’s air conditioner during thesummer months.
Lemone is also interested in a processcalled molecular conduction. Here, thewarmer air near the earth’s surface movesupward toward the cooler air in such a waythat heat is transferred upward. During thisprocess, faster moving molecules ofwarmer air bump into the colder air’s slowermolecules. This bumping causes theslower molecules to move a little faster,thus warming the colder air. But, thisprocess of molecular conduction is slow–far too slow to prevent air temperaturesfrom getting so high as to cause damage tolife forms like plants and people.
In order to cool off properly andmaintain reasonable temperatures, warm airmust be able to rise far up into the cooleratmospheric regions. This is calledconvection, and is where the conditionknown as an unstable atmosphere entersthe picture. “Unstable” simply means that asmall section of air is ready to rise high, if itis given a little push to get it moving — likestarting a rock slide by tossing a singlestone onto the side of a rocky hill. All thoseother rocks begin to tumble because therocky hill is unstable.
An unstable atmosphere occurs whenthe difference between warm surface airand the cold upper atmosphere is great.This is the same as saying that the rate oftemperature decrease is large. In order fora parcel of this warmer air to rise, its densitymust be less than the air surrounding it.Warmer air tends to be less dense thancooler air. So it starts to rise in the samemanner as an elevator.
107
To keep rising and increasing speed(acceleration), then it must remain warmerand less dense than the air surrounding it.Once it meets air that is the sametemperature and density, it stops rising.(The elevator stops.)
The greater the rate of temperaturedecrease, the faster it moves upward(acceleration). As the air rises, heat istransferred upward and the temperaturedifference is reduced. When upwardconvection is powerful enough to reachheights of about 10 miles or so in the formof columns of air, we get very largeconvection clouds known as thunderstorms.
In squall lines, we still have air that ismoist and unstable. In this particular casethough, the unstable moist air isconcentrated along a narrow corridor. Thisatmospheric concentration is usually due towhat is called a cold front. In a cold front, alarge mass of cold air from the north movessouthward, pushing aside the warmer air inits path. The cold air “wedge” forces warmair to rise.
Because this warmer air meets theconditions of being moist and unstable, itcan lead to the formation of thunderstorms.And, since the cold air is heavier than warmair and it is also stable, the “walls” of thecorridor are maintained. Thunderstormswhich form are confined to this corridor.The corridor and thunderstorms will moveas the cold front wedge continues to movefrom north to south.
Dr. Margaret Lemone’s research hastaken her on airplane trips throughnumerous cloud systems, includingthunderstorms and hurricanes, to helpbroaden our knowledge. Because of herwork, we more clearly understand howthunderstorms are organized in lines, andhow these clouds lines affect the air’smotion in the lowest part of the atmosphere.
References
Thunderstorm Morphology and Dynamics.2nd ed. Norman: University of OklahomaPress, 1986.
The Thunderstorms. Louis J. Battan. NewAmerican Library, New York, 1964.
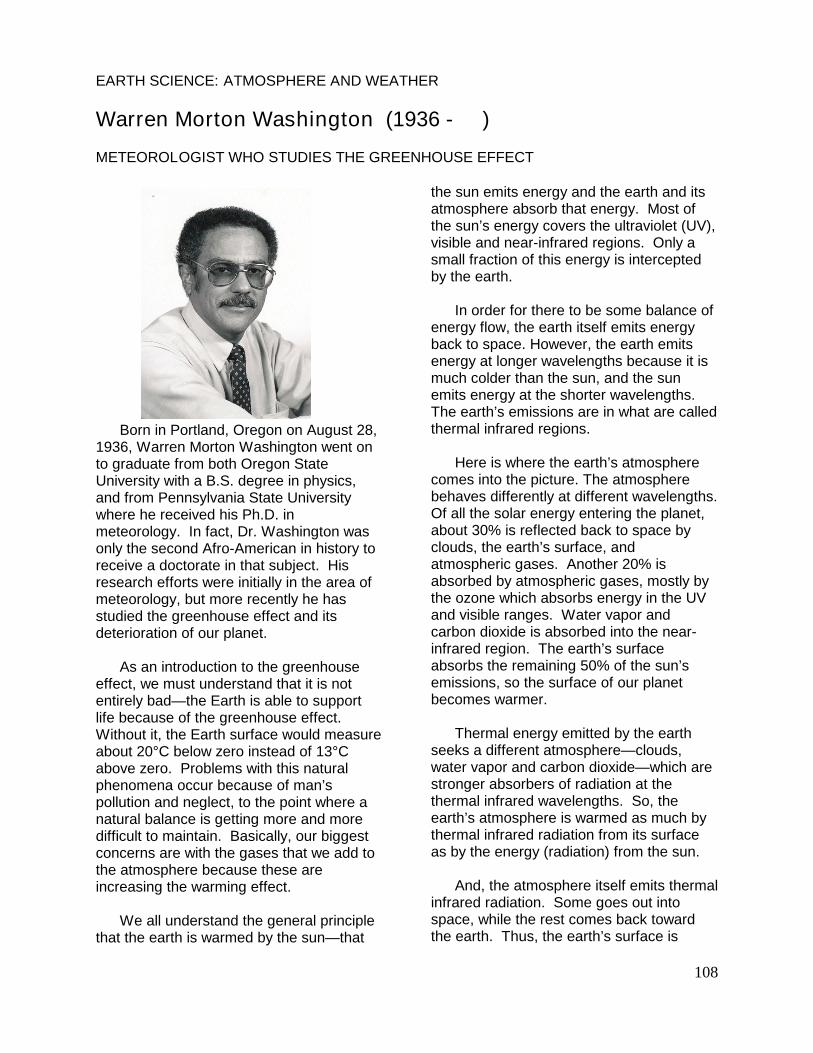
108
EARTH SCIENCE: ATMOSPHERE AND WEATHER
Warren Morton Washington (1936 - )
METEOROLOGIST WHO STUDIES THE GREENHOUSE EFFECT
Born in Portland, Oregon on August 28,1936, Warren Morton Washington went onto graduate from both Oregon StateUniversity with a B.S. degree in physics,and from Pennsylvania State Universitywhere he received his Ph.D. inmeteorology. In fact, Dr. Washington wasonly the second Afro-American in history toreceive a doctorate in that subject. Hisresearch efforts were initially in the area ofmeteorology, but more recently he hasstudied the greenhouse effect and itsdeterioration of our planet.
As an introduction to the greenhouseeffect, we must understand that it is notentirely bad—the Earth is able to supportlife because of the greenhouse effect.Without it, the Earth surface would measureabout 20°C below zero instead of 13°Cabove zero. Problems with this naturalphenomena occur because of man’spollution and neglect, to the point where anatural balance is getting more and moredifficult to maintain. Basically, our biggestconcerns are with the gases that we add tothe atmosphere because these areincreasing the warming effect.
We all understand the general principlethat the earth is warmed by the sun—that
the sun emits energy and the earth and itsatmosphere absorb that energy. Most ofthe sun’s energy covers the ultraviolet (UV),visible and near-infrared regions. Only asmall fraction of this energy is interceptedby the earth.
In order for there to be some balance ofenergy flow, the earth itself emits energyback to space. However, the earth emitsenergy at longer wavelengths because it ismuch colder than the sun, and the sunemits energy at the shorter wavelengths.The earth’s emissions are in what are calledthermal infrared regions.
Here is where the earth’s atmospherecomes into the picture. The atmospherebehaves differently at different wavelengths.Of all the solar energy entering the planet,about 30% is reflected back to space byclouds, the earth’s surface, andatmospheric gases. Another 20% isabsorbed by atmospheric gases, mostly bythe ozone which absorbs energy in the UVand visible ranges. Water vapor andcarbon dioxide is absorbed into the near-infrared region. The earth’s surfaceabsorbs the remaining 50% of the sun’semissions, so the surface of our planetbecomes warmer.
Thermal energy emitted by the earthseeks a different atmosphere—clouds,water vapor and carbon dioxide—which arestronger absorbers of radiation at thethermal infrared wavelengths. So, theearth’s atmosphere is warmed as much bythermal infrared radiation from its surfaceas by the energy (radiation) from the sun.
And, the atmosphere itself emits thermalinfrared radiation. Some goes out intospace, while the rest comes back towardthe earth. Thus, the earth’s surface is
109
warmed not only by the sun, but also by theearth’s own atmosphere in the form ofthermal infrared radiation. This is thenaturally-occurring greenhouse effect.
The dangers to our atmosphere comewith the many gases we emit during oureveryday activities. These gases are verystrong absorbers of thermal infraredradiation. And, as they accumulate in ouratmosphere, the atmosphere is better ableto absorb and emit them, so more energy isemitted downward to the earth’s surfacethan normal. The result is that the earth’ssurface is warmed beyond what wouldnormally occur, and its natural balance isdisturbed.
This can lead to an atmosphere whichholds more water vapor, which is itself agreenhouse gas, thus adding to thewarming greenhouse effect. Snow and iceare good reflectors of solar radiation, sothey help cool the planet. But, with awarmer earth, there is less snow and ice,and less reflection of solar radiation back tospace. These, along with otherenvironmental and climatic changes due tothe build-up of greenhouse gases, add towarming effect of our planet and furtherupset the balance of nature.
Dr. Warren Washington is currentlydirector of a division of the National Centerfor Atmospheric Research.
References
Greenhouse Effect and its Impact onAfrica. London: Institute for AfricanAlternatives, 1990.
Policy Options for Stabilizing GlobalClimate. Hemisphere Pub. Corp., NewYork, 1990.
Our Drowning World: Population, Pollution,and Future Weather. Antony Milne.Prism Press, Dorset, England; AveryPub. Group, New York, 1988.

110
EARTH SCIENCE: ATMOSPHERE AND WEATHER
Donald Glaser (1926- )
INVENTOR OF THE BUBBLE CHAMBER
Born in Cleveland, Ohio, in 1926,Donald Glaser took up the study of bothmathematics and physics while in college.After completing his bachelor’s degree inthese subjects at the Case Institute ofTechnology, he earned a Ph.D. inmathematics and physics at the CaliforniaInstitute of Technology in 1950.
During the decade that followed, thescientific community was developing a giantparticle accelerator, forerunner of today’smodern supercolliders. Scientists usingthese accelerators were generating highenergy particles, but they had no clear orreasonable way to study them. So, Dr.Glaser set about studying the properties ofvarious liquids and solids which he thoughtmight make the observation of high energyparticles more practical.
Glaser was fascinated with the instabilityof superheated liquids. He reasoned that, ifwe greatly reduced the surface tension of asuperheated liquid —increasing vaporpressure at the same time—we should beable to see ionizing radiation passingthrough the liquid in the form of bubbles.High energy particles (ionizing particles)produced by colliders are too small to beseen by the human eye, and too fast to beeffectively detected. So, using thesuperheated liquid, scientists would be ableto observe them and follow the particles’paths.
In 1960, Dr. Donald Glaser wasawarded the Nobel Prize in Physics for hisinvention of the bubble chamber—a deviceto detect the paths of high energy atomicparticles. As these ionizing particles weregenerated by particle accelerators, theytraveled into the bubble chamber through asuperheated liquid such as liquid hydrogen,deuterium, or helium. As these high energyparticles passed near the nuclei of theliquid’s atoms, there could be manydifferent reactions.
In the simplest case, a high energyparticle increased in energy and extraparticles were produced. Bubbles thatformed in the chamber showed the paththat particles traveled through the liquid.Photographs could then be taken, showingthese paths from many angles.
Dr. Donald Glaser’s work has providedprecise information about high energyparticles including masses, lifetimes, anddecay modes never before available toscience.
References
The Principles of Cloud-ChamberTechnique. J. G. Wilson. CambridgeUniversity Press. 1951.