Embed Size (px)
DESCRIPTION
Lifelong Learning Statistics User Day Widening Participation Workshop 26 th March 2010. Jeanette Hagerstrom Carolyn Fishman Andrew Walker. General The link between educational attainment and poverty in the UK and elsewhere has been clearly demonstrated - PowerPoint PPT Presentation
Citation preview

Lifelong Learning Statistics User DayWidening Participation Workshop
26th March 2010
Jeanette Hagerstrom Carolyn Fishman Andrew Walker

General• The link between educational attainment and
poverty in the UK and elsewhere has been clearly demonstrated
• There is a disproportionately small participation by lower socio-economic groups in all OECD countries who attend HE
• Access to HE continues to be divided on socio economic grounds. Universities are both receivers and creators of social advantage.

Prior attainment• when controlling for prior attainment in school
students from advantaged and disadvantaged backgrounds have very similar participation rates in HE
• the main obstacle for pupils from disadvantaged backgrounds is that they do not get the same school results to the same extent as their more advantaged peers.

Early years, attitudes, motivation, and age• the more positive the attitude towards school, the more
likely it is that a young person intends to apply to university
• for many young people the curriculum, qualifications system and associated teaching styles are not suitable
• students/ young people from more disadvantaged backgrounds also tend to express concerns about their self confidence/ esteem and ability to ‘fit in’ in HE
• those taking alternative routs into and through HE are more likely to be older and come from more deprived areas.

Other issues• generally young people have positive attitudes
to debt in the context of HE. Those less willing to participate in HE have more negative attitudes to debt
• SIED data shows that part time students and mature students have higher debts and expenditure than other students
• while there are benefits of HE for women in the labour market, women are still disadvantaged in terms of pay and career opportunities.

Policy
• The Scottish Government and Scottish Funding Council have a number of policies aimed at widening access and at encouraging non-traditional learners to participate in higher education.
• We currently use the API and those young people entering full-time higher education from deprived areas as a measure of participation from this group.

Policy (2)
• We recognise that many non-traditional learners return to higher education at an older age and many choose part-time study as an alternative mode of participation in higher education.
• We continue to be interested in the movement of young people from deprived areas into higher education but we also need a clear and reliable indicator that gives a more rounded picture of all participation in all modes of higher education

Participation in Higher Education and Widening Access
• Methods behind our published participation analysis and headline results
• Update on our review of participation• Methods and explanation of results of
widening access statistics• Extra analysis linking API to SIMD• Group exercise to let us know what you
think

Current Measures of Participation
• Gross Enrolment
• Age Participation Index (API)
• Alternatives:– OECD Comparison– All Ages All Modes
• Review of Participation Measures
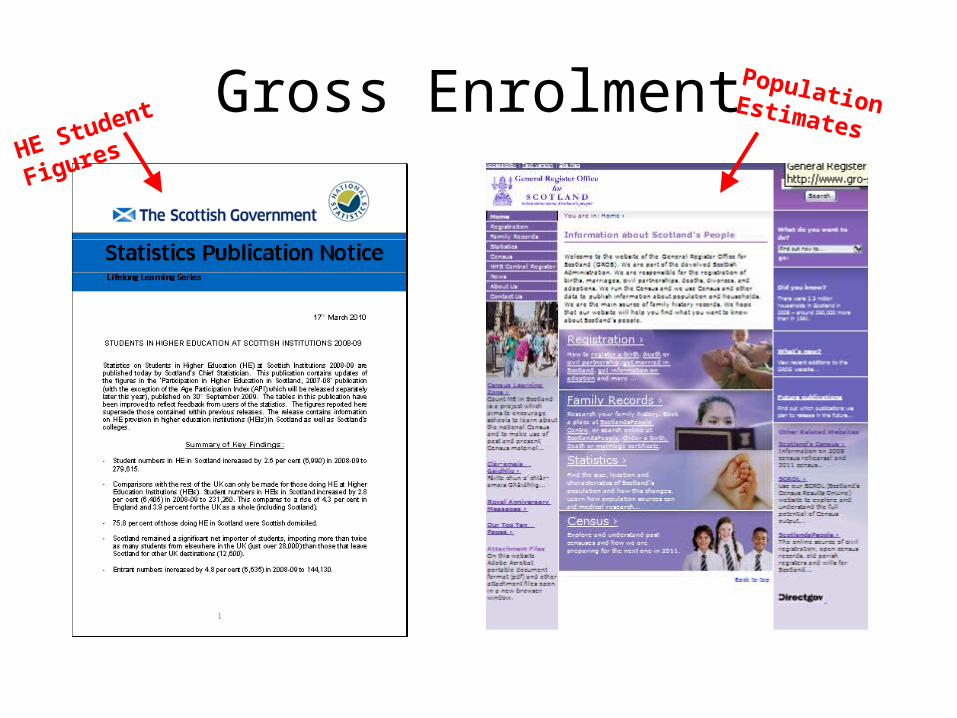
Gross EnrolmentHE Student Figures Population Estimates
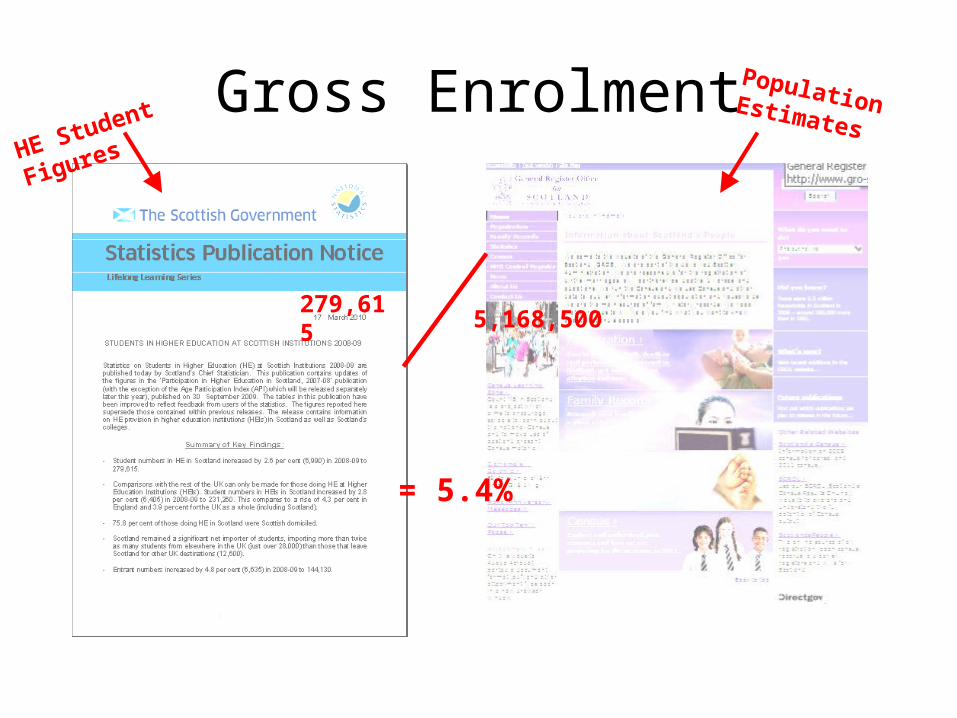
Gross EnrolmentHE Student Figures Population Estimates
279,6155,168,500
= 5.4%
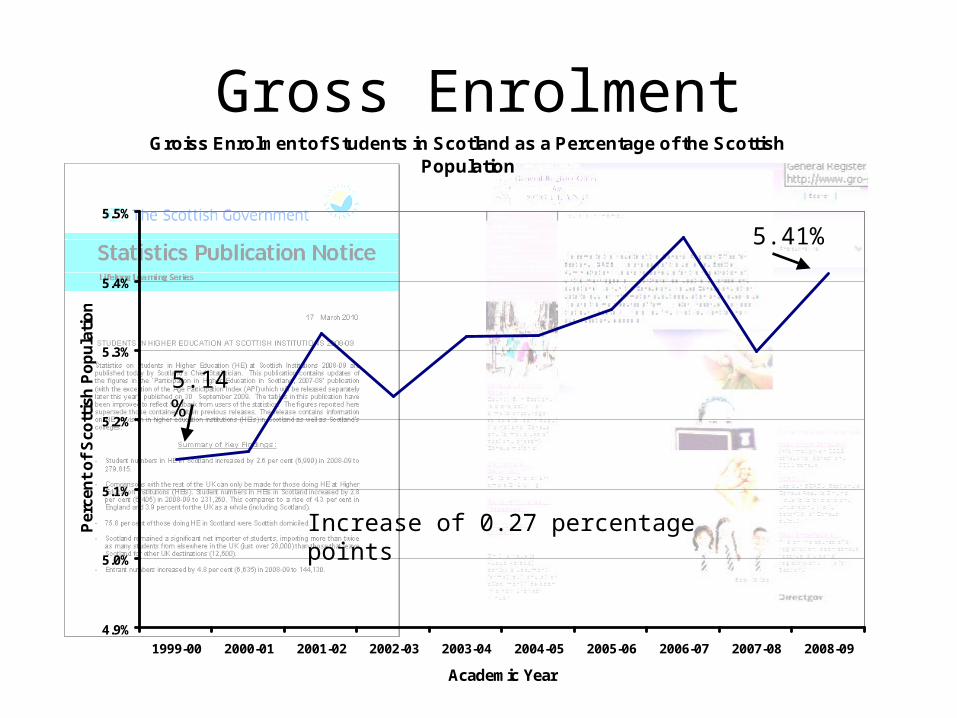
Gross EnrolmentGroiss Enrolment of Students in Scotland as a Percentage of the Scottish
Population
4.9%
5.0%
5.1%
5.2%
5.3%
5.4%
5.5%
1999-00 2000-01 2001-02 2002-03 2003-04 2004-05 2005-06 2006-07 2007-08 2008-09
Academic Year
Per
cen
t o
f S
cott
ish
Po
pu
lati
on
5.14%
5.41%
Increase of 0.27 percentage points
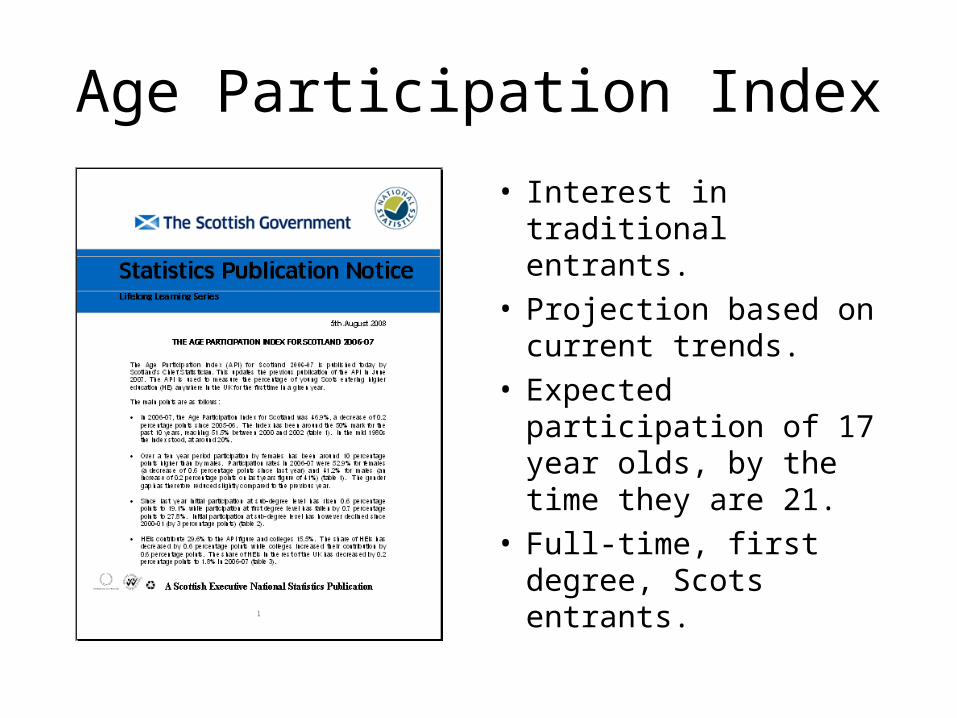
Age Participation Index
• Interest in traditional entrants.
• Projection based on current trends.
• Expected participation of 17 year olds, by the time they are 21.
• Full-time, first degree, Scots entrants.
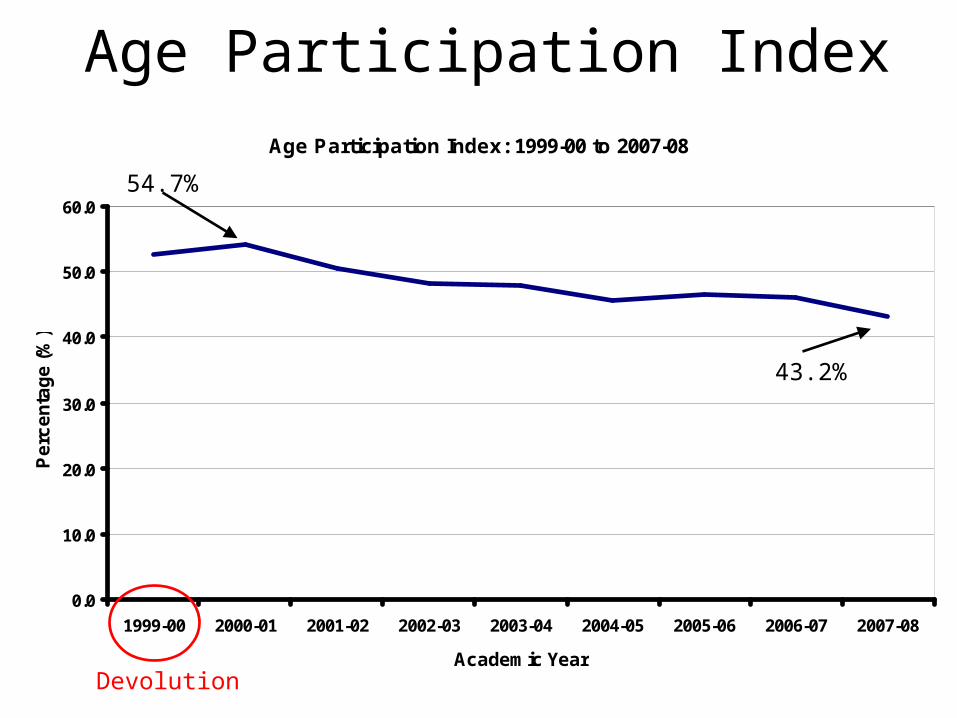
Age Participation IndexAge Participation Index: 1999-00 to 2007-08
0.0
10.0
20.0
30.0
40.0
50.0
60.0
1999-00 2000-01 2001-02 2002-03 2003-04 2004-05 2005-06 2006-07 2007-08
Academic Year
Pe
rce
nta
ge
(%
)
Devolution
54.7%
43.2%
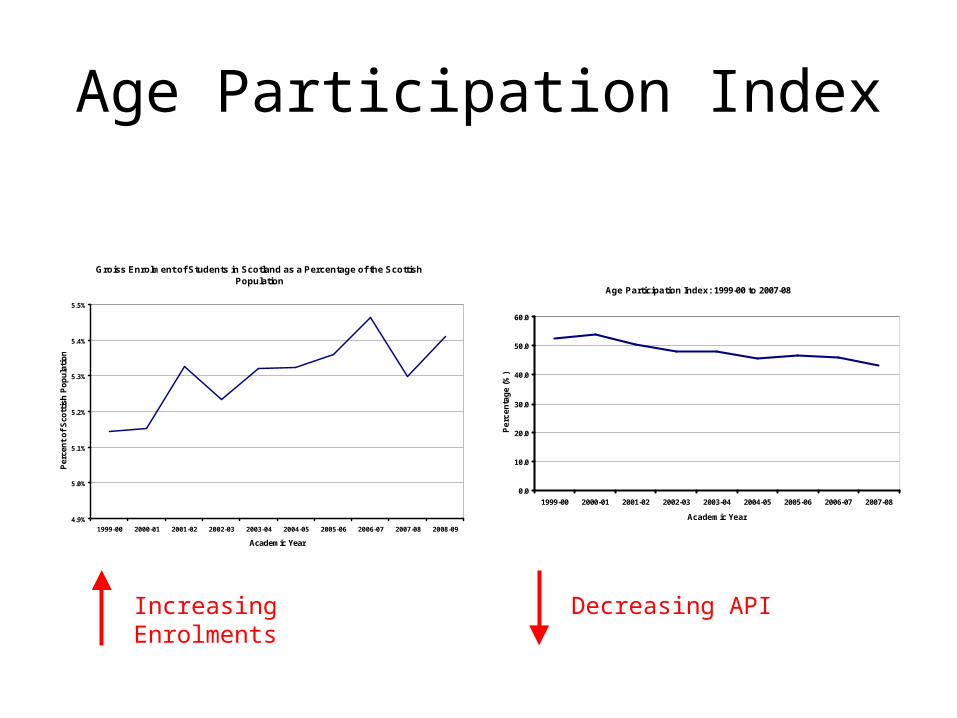
Age Participation Index
Groiss Enrolment of Students in Scotland as a Percentage of the Scottish Population
4.9%
5.0%
5.1%
5.2%
5.3%
5.4%
5.5%
1999-00 2000-01 2001-02 2002-03 2003-04 2004-05 2005-06 2006-07 2007-08 2008-09
Academic Year
Per
cen
t o
f S
cott
ish
Po
pu
lati
on
Age Participation Index: 1999-00 to 2007-08
0.0
10.0
20.0
30.0
40.0
50.0
60.0
1999-00 2000-01 2001-02 2002-03 2003-04 2004-05 2005-06 2006-07 2007-08
Academic YearP
erc
en
tag
e (
%)
Increasing Enrolments Decreasing API
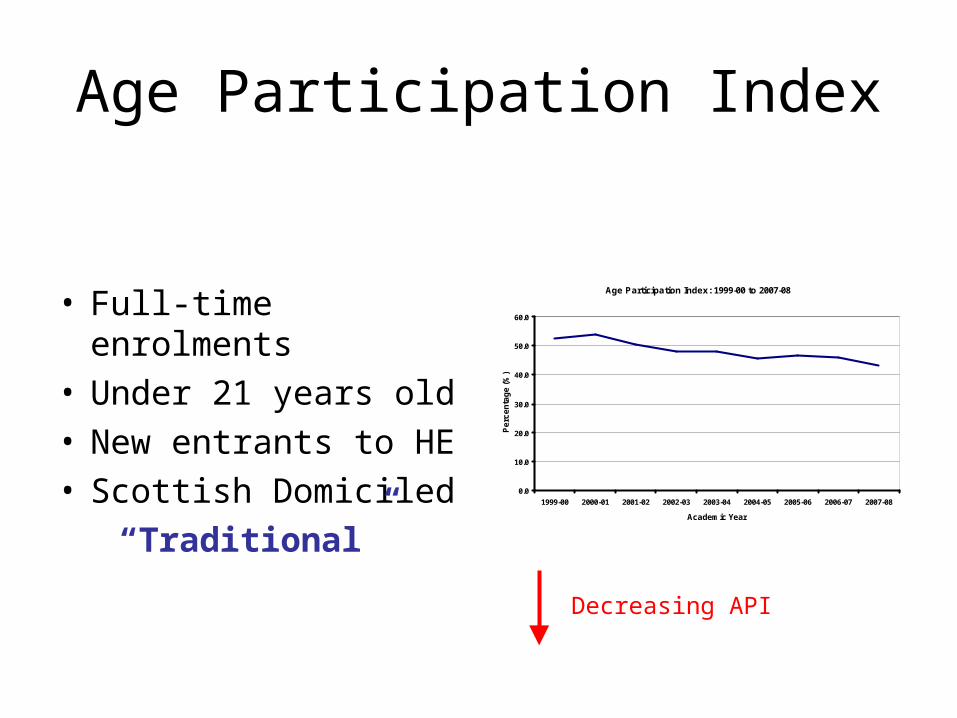
Age Participation Index
• Full-time enrolments• Under 21 years old• New entrants to HE• Scottish Domiciled
“Traditional”
Age Participation Index: 1999-00 to 2007-08
0.0
10.0
20.0
30.0
40.0
50.0
60.0
1999-00 2000-01 2001-02 2002-03 2003-04 2004-05 2005-06 2006-07 2007-08
Academic YearP
erc
en
tag
e (
%)
Decreasing API
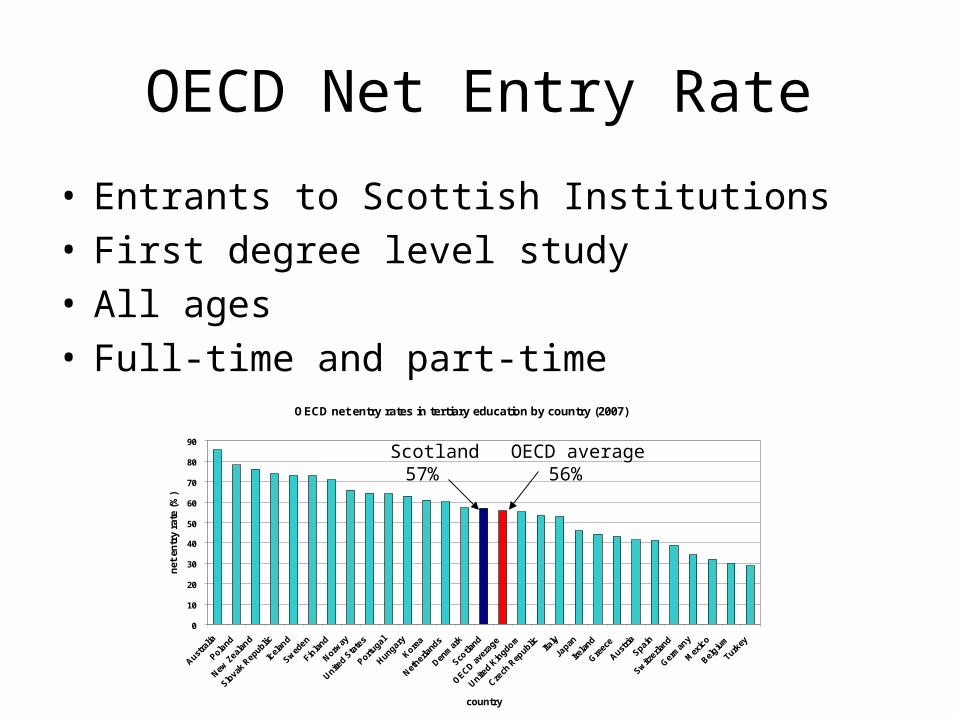
OECD Net Entry Rate
• Entrants to Scottish Institutions• First degree level study• All ages• Full-time and part-time
OECD net entry rates in tertiary education by country (2007)
0
10
20
30
40
50
60
70
80
90
Austra
lia
Poland
New Z
ealan
d
Slovak
Republic
Icel
and
Swed
en
Finla
nd
Norway
United S
tate
s
Portugal
Hungary
Korea
Netherla
nds
Denm
ark
Scotla
nd
OECD a
vera
ge
United K
ingdom
Czech
Rep
ublic Italy
Japan
Irela
nd
Gre
ece
Austria
Spain
Switz
erland
Ger
man
y
Mex
ico
Belgiu
m
Turkey
country
net
en
try
rate
(%
)
56%57%OECD averageScotland
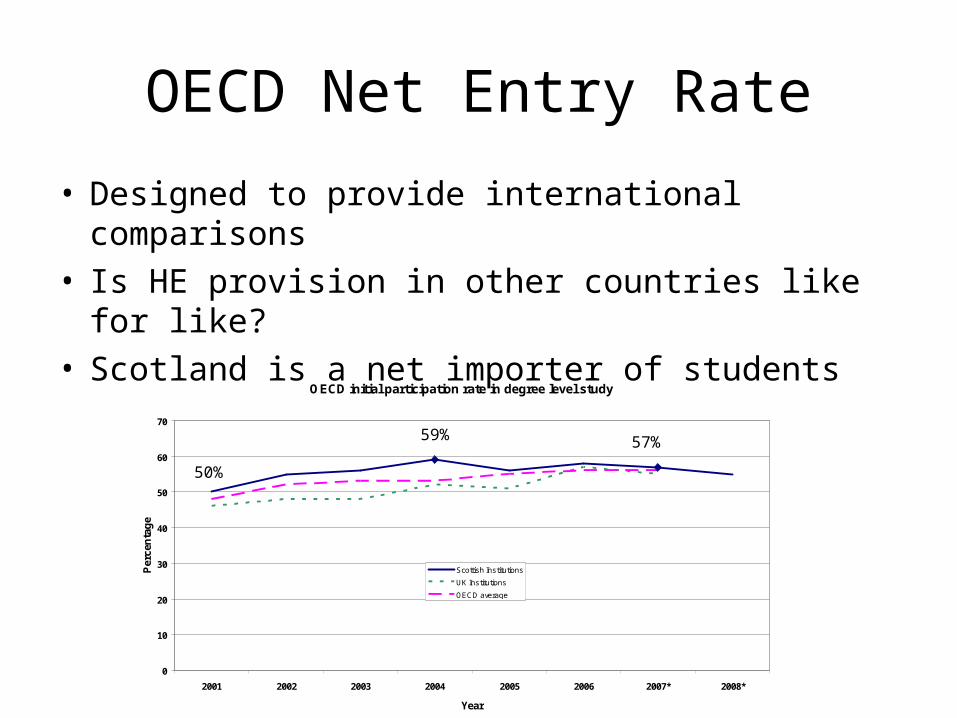
OECD Net Entry Rate
OECD initial participation rate in degree level study
0
10
20
30
40
50
60
70
2001 2002 2003 2004 2005 2006 2007* 2008*
Year
Per
cen
tag
e
Scottish Institutions
UK Institutions
OECD average
* UK and OECD to be published in Sep 2010
50%
59% 57%
• Designed to provide international comparisons• Is HE provision in other countries like for like?• Scotland is a net importer of students
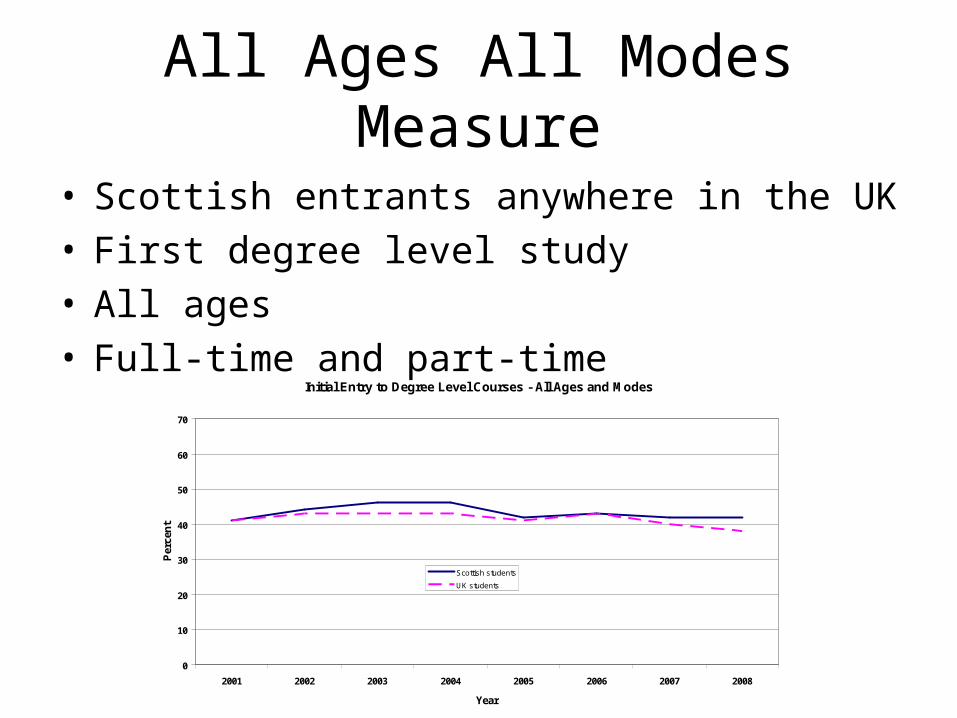
All Ages All Modes Measure
• Scottish entrants anywhere in the UK• First degree level study• All ages• Full-time and part-time
Initial Entry to Degree Level Courses - All Ages and Modes
0
10
20
30
40
50
60
70
2001 2002 2003 2004 2005 2006 2007 2008
Year
Per
cen
t
Scottish students
UK students
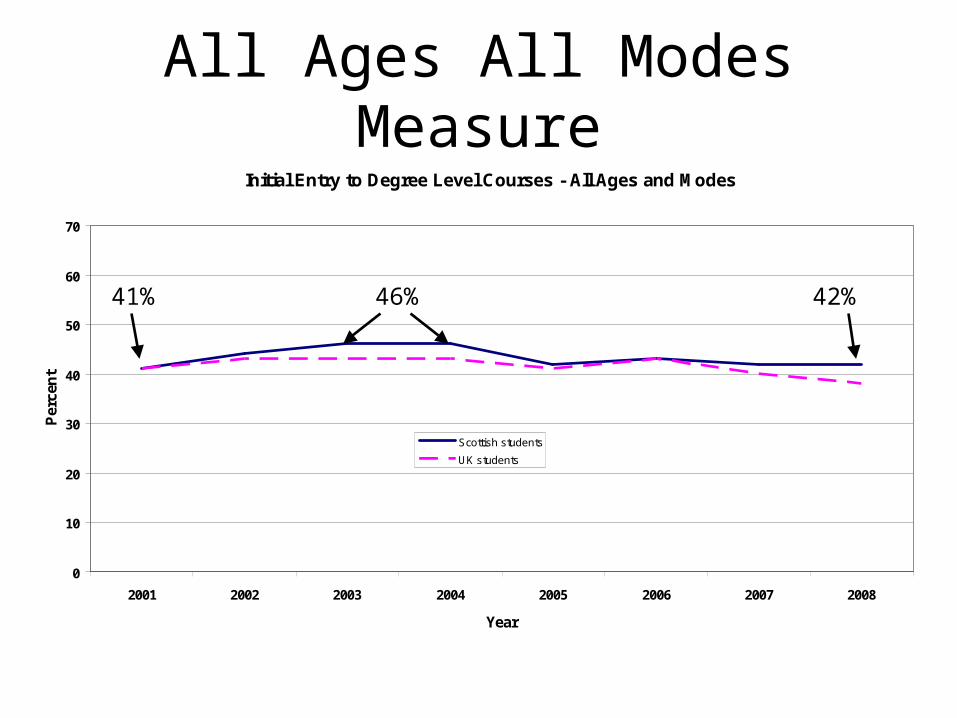
All Ages All Modes MeasureInitial Entry to Degree Level Courses - All Ages and Modes
0
10
20
30
40
50
60
70
2001 2002 2003 2004 2005 2006 2007 2008
Year
Per
cen
t
Scottish students
UK students
41% 46% 42%
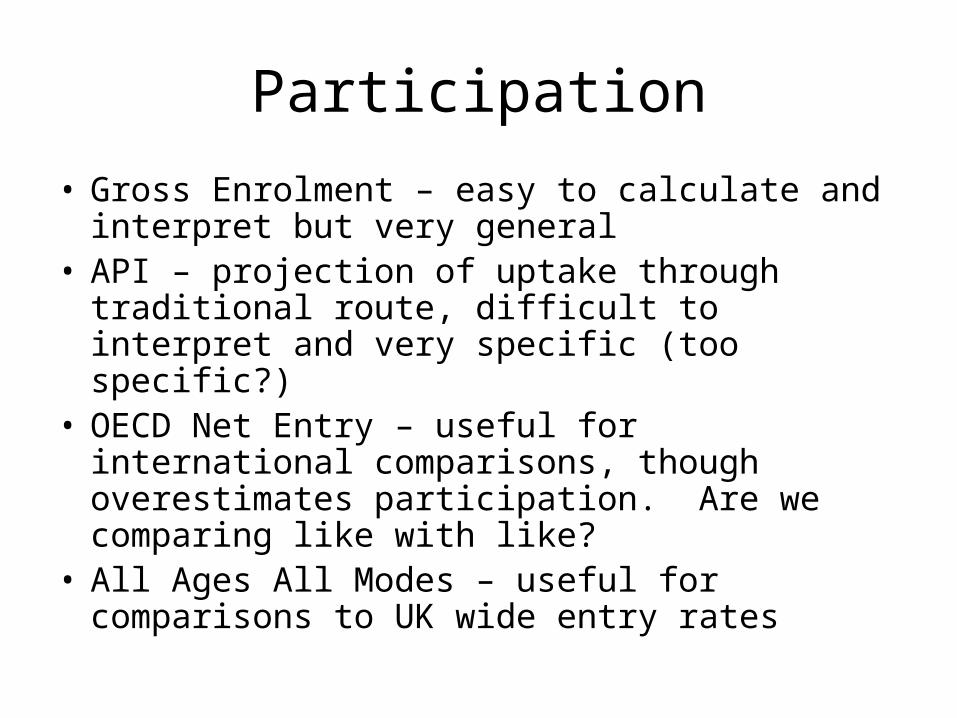
Participation
• Gross Enrolment – easy to calculate and interpret but very general
• API – projection of uptake through traditional route, difficult to interpret and very specific (too specific?)
• OECD Net Entry – useful for international comparisons, though overestimates participation. Are we comparing like with like?
• All Ages All Modes – useful for comparisons to UK wide entry rates
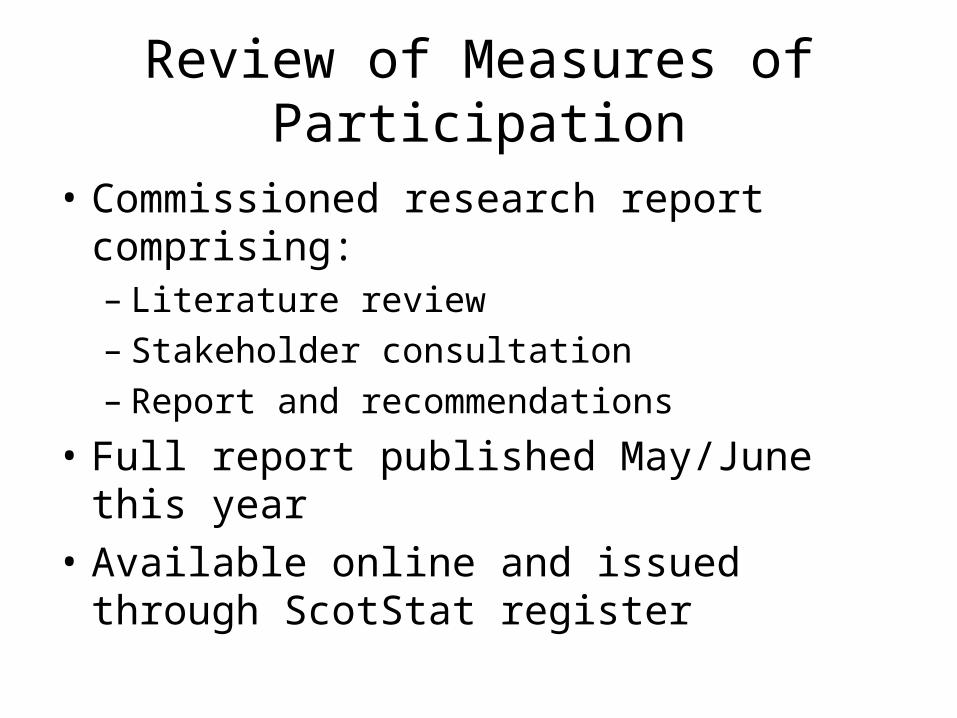
Review of Measures of Participation
• Commissioned research report comprising:– Literature review– Stakeholder consultation– Report and recommendations
• Full report published May/June this year
• Available online and issued through ScotStat register
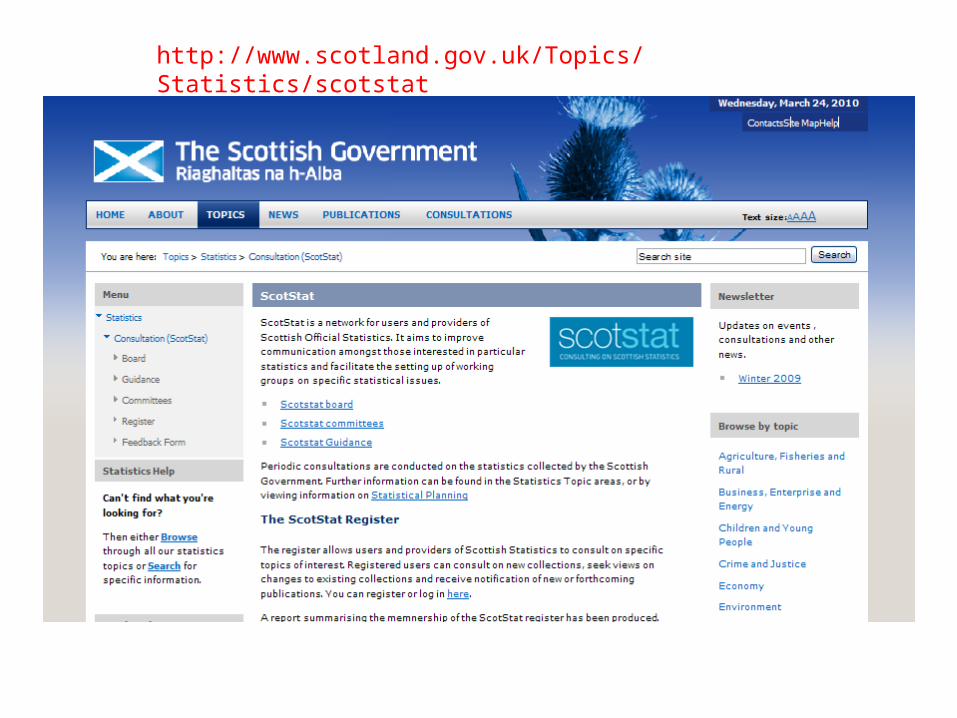
http://www.scotland.gov.uk/Topics/Statistics/scotstat
Widening Access
• Method behind comparisons of entrants from deprived areas.
• Explanation of published results.
• And a treat! – unpublished results looking at which entrant groups are least represented in higher education.
Widening Access
• Generally entrants from disadvantaged backgrounds
• For SG this means 20% most deprived areas of Scotland
• Deprivation levels determined by SIMD

Scottish Index of Multiple Deprivation (SIMD)
• Splits Scotland into 6,505 datazones• Datazone median population of 767• Deprivation index based on employment, income, health,
education, access to services and crime.• Employment and income have greatest weight
www.sns.gov.uk
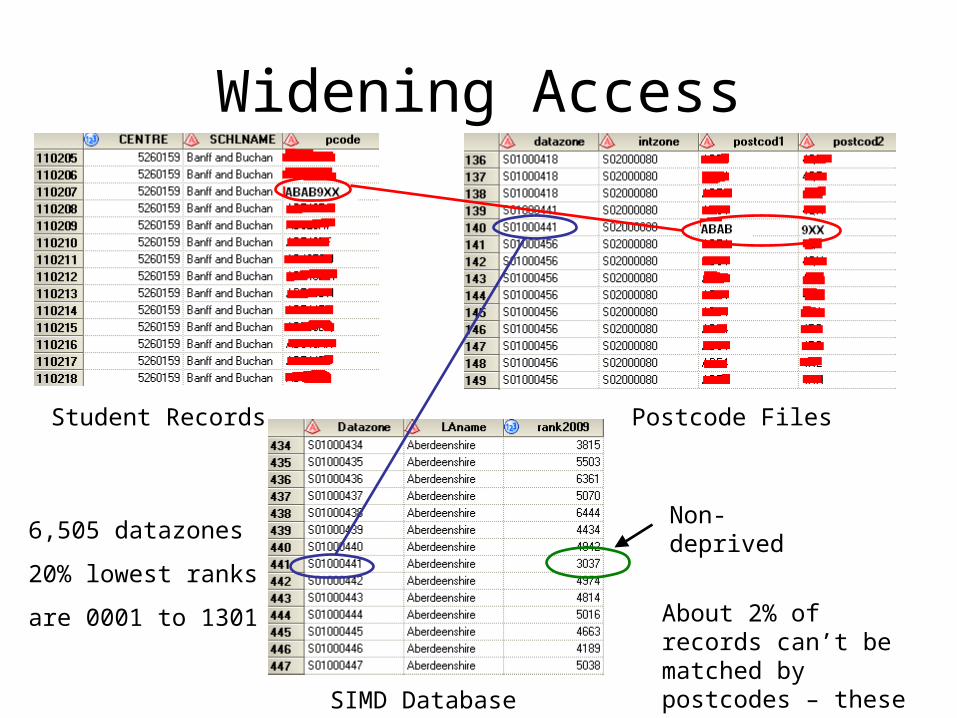
Widening Access
Non-deprived6,505 datazones
20% lowest ranks
are 0001 to 1301
Student Records Postcode Files
SIMD Database
About 2% of records can’t be matched by postcodes – these are excluded
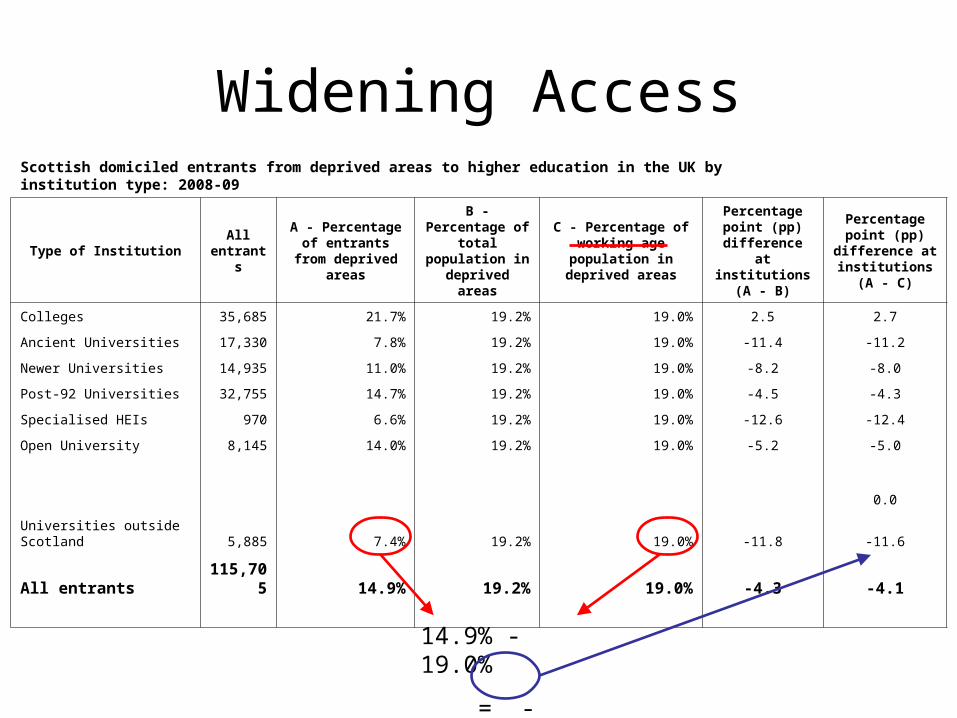
Widening AccessScottish domiciled entrants from deprived areas to higher education in the UK by institution type: 2008-09
Type of InstitutionAll
entrants
A - Percentage of entrants from
deprived areas
B - Percentage of total
population in deprived areas
C - Percentage of working age
population in deprived areas
Percentage point (pp)
difference at institutions (A -
B)
Percentage point (pp)
difference at institutions (A -
C)
Colleges 35,685 21.7% 19.2% 19.0% 2.5 2.7
Ancient Universities 17,330 7.8% 19.2% 19.0% -11.4 -11.2
Newer Universities 14,935 11.0% 19.2% 19.0% -8.2 -8.0
Post-92 Universities 32,755 14.7% 19.2% 19.0% -4.5 -4.3
Specialised HEIs 970 6.6% 19.2% 19.0% -12.6 -12.4
Open University 8,145 14.0% 19.2% 19.0% -5.2 -5.0
0.0
Universities outside Scotland 5,885 7.4% 19.2% 19.0% -11.8 -11.6
All entrants115,70
5 14.9% 19.2% 19.0% -4.3 -4.1
14.9% - 19.0%
= - 4.1
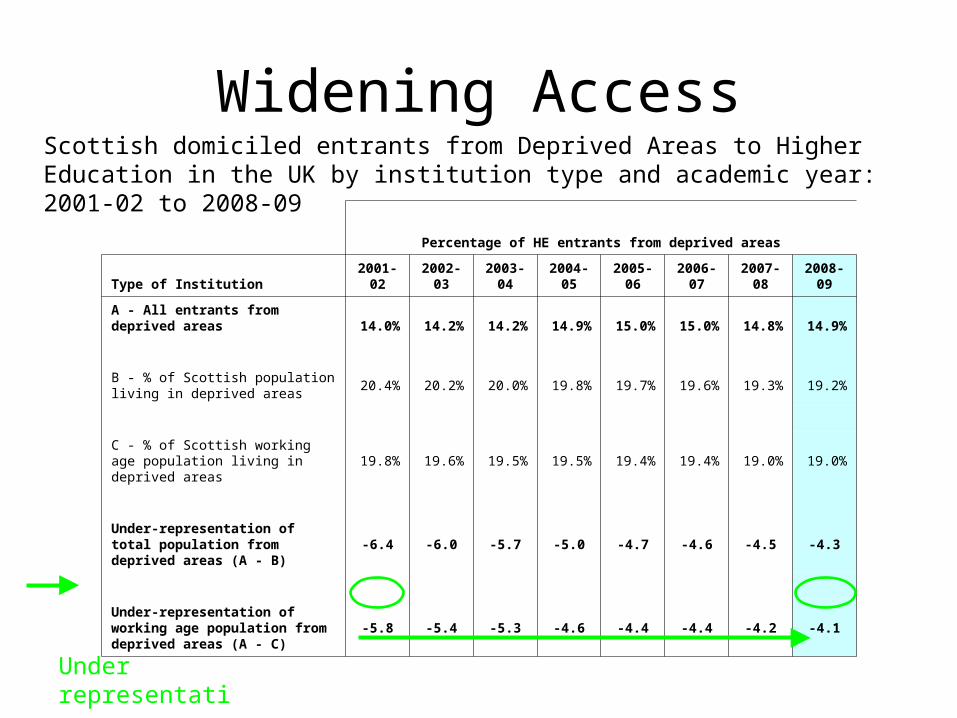
Widening AccessScottish domiciled entrants from Deprived Areas to Higher Education in the UK by institution type and academic year: 2001-02 to 2008-09
Percentage of HE entrants from deprived areas
Type of Institution2001-
022002-
032003-
042004-
052005-
062006-
072007-
082008-
09
A - All entrants from deprived areas 14.0% 14.2% 14.2% 14.9% 15.0% 15.0% 14.8% 14.9%
B - % of Scottish population living in deprived areas
20.4% 20.2% 20.0% 19.8% 19.7% 19.6% 19.3% 19.2%
C - % of Scottish working age population living in deprived areas
19.8% 19.6% 19.5% 19.5% 19.4% 19.4% 19.0% 19.0%
Under-representation of total population from deprived areas (A - B)
-6.4 -6.0 -5.7 -5.0 -4.7 -4.6 -4.5 -4.3
Under-representation of working age population from deprived areas (A - C)
-5.8 -5.4 -5.3 -4.6 -4.4 -4.4 -4.2 -4.1
Under representation
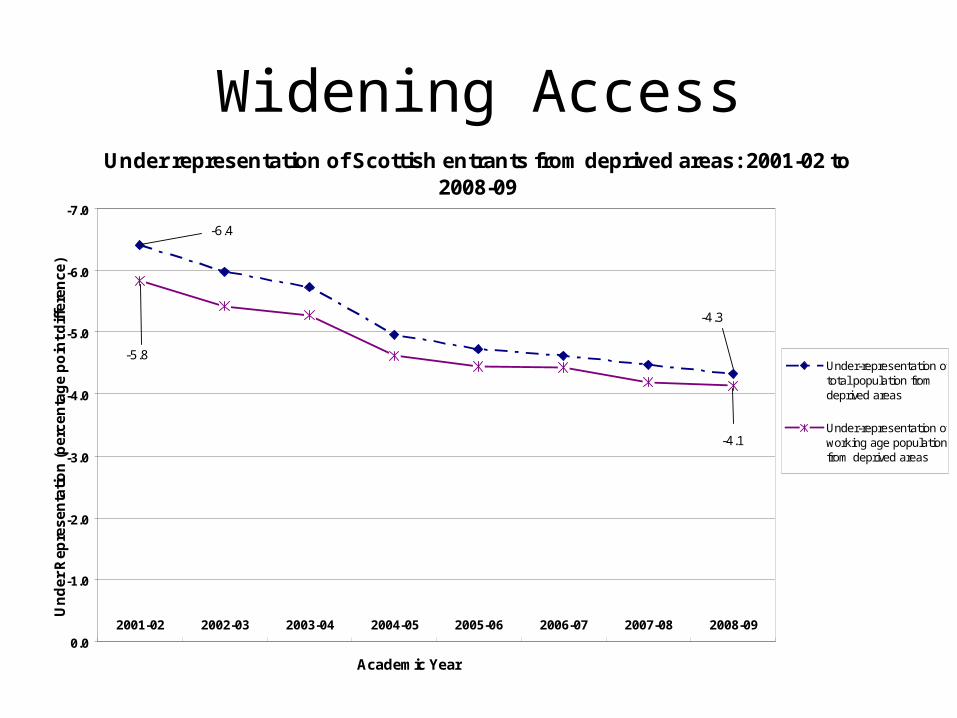
Widening AccessUnder representation of Scottish entrants from deprived areas: 2001-02 to
2008-09
-4.3
-6.4
-4.1
-5.8
-7.0
-6.0
-5.0
-4.0
-3.0
-2.0
-1.0
0.0
2001-02 2002-03 2003-04 2004-05 2005-06 2006-07 2007-08 2008-09
Academic Year
Un
de
r R
ep
res
en
tati
on
(p
erc
en
tag
e p
oin
t d
iffe
ren
ce
)
Under-representation oftotal population fromdeprived areas
Under-representation ofworking age populationfrom deprived areas
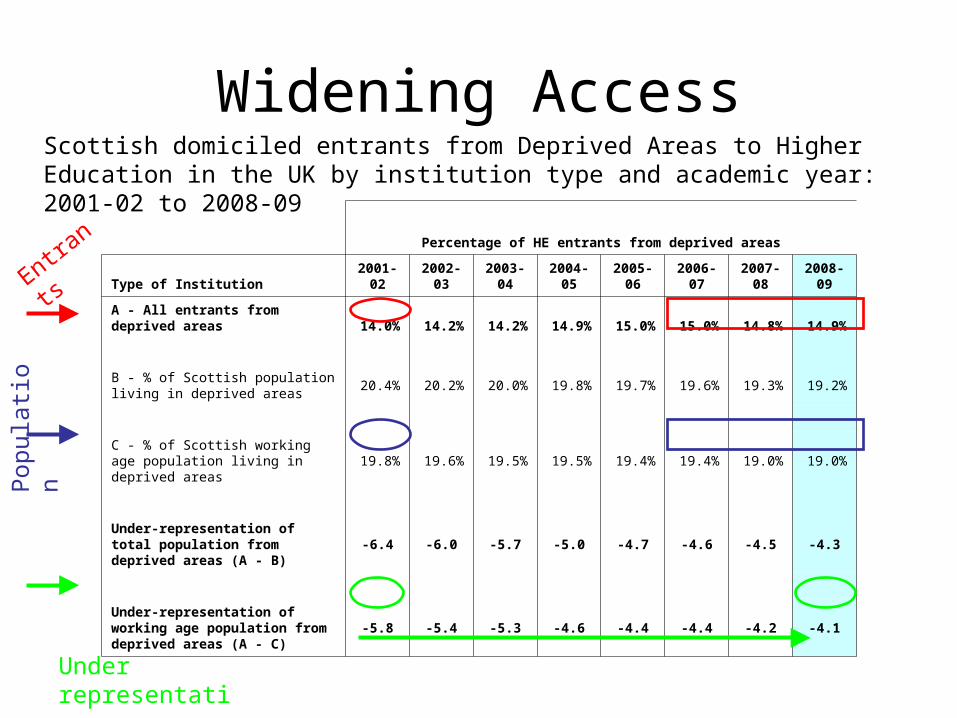
Widening AccessScottish domiciled entrants from Deprived Areas to Higher Education in the UK by institution type and academic year: 2001-02 to 2008-09
Percentage of HE entrants from deprived areas
Type of Institution2001-
022002-
032003-
042004-
052005-
062006-
072007-
082008-
09
A - All entrants from deprived areas 14.0% 14.2% 14.2% 14.9% 15.0% 15.0% 14.8% 14.9%
B - % of Scottish population living in deprived areas
20.4% 20.2% 20.0% 19.8% 19.7% 19.6% 19.3% 19.2%
C - % of Scottish working age population living in deprived areas
19.8% 19.6% 19.5% 19.5% 19.4% 19.4% 19.0% 19.0%
Under-representation of total population from deprived areas (A - B)
-6.4 -6.0 -5.7 -5.0 -4.7 -4.6 -4.5 -4.3
Under-representation of working age population from deprived areas (A - C)
-5.8 -5.4 -5.3 -4.6 -4.4 -4.4 -4.2 -4.1
Under representation
Pop
ulat
ion
Entrants
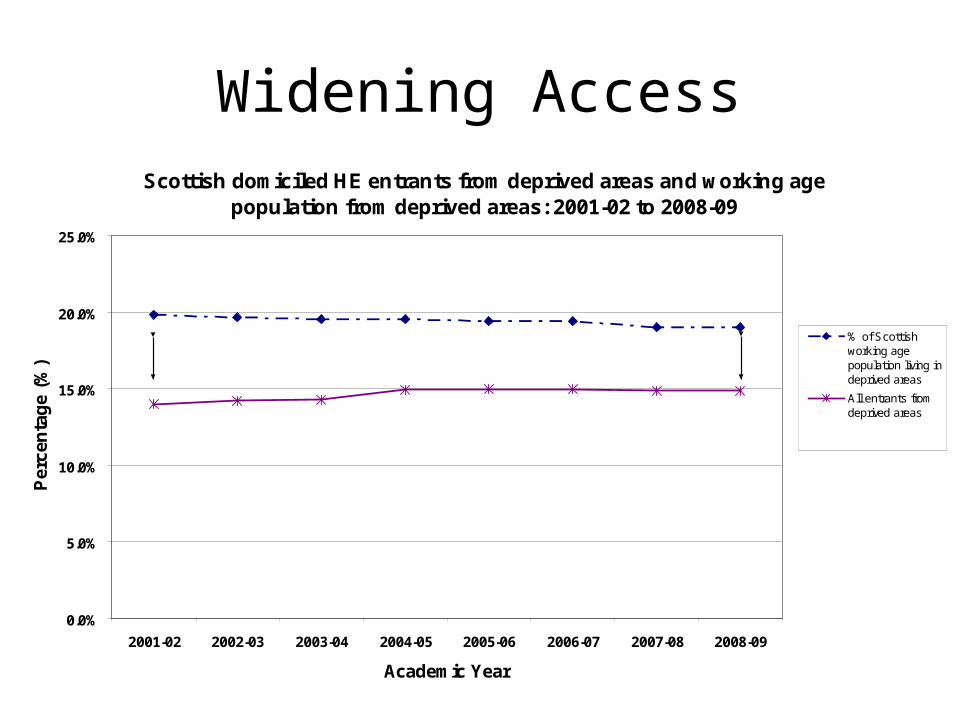
Widening AccessScottish domiciled HE entrants from deprived areas and working age
population from deprived areas: 2001-02 to 2008-09
0.0%
5.0%
10.0%
15.0%
20.0%
25.0%
2001-02 2002-03 2003-04 2004-05 2005-06 2006-07 2007-08 2008-09
Academic Year
Per
cen
tag
e (%
)
% of Scottishworking agepopulation living indeprived areas
All entrants fromdeprived areas
gap = 5.8 percentage points
gap = 4.1 percentage points
Widening Access
• Are entrants from deprived areas under represented equally across all learner types?
• Are all deprived areas equal?
• Initially looked at entrants from the traditional group – using API and SIMD…
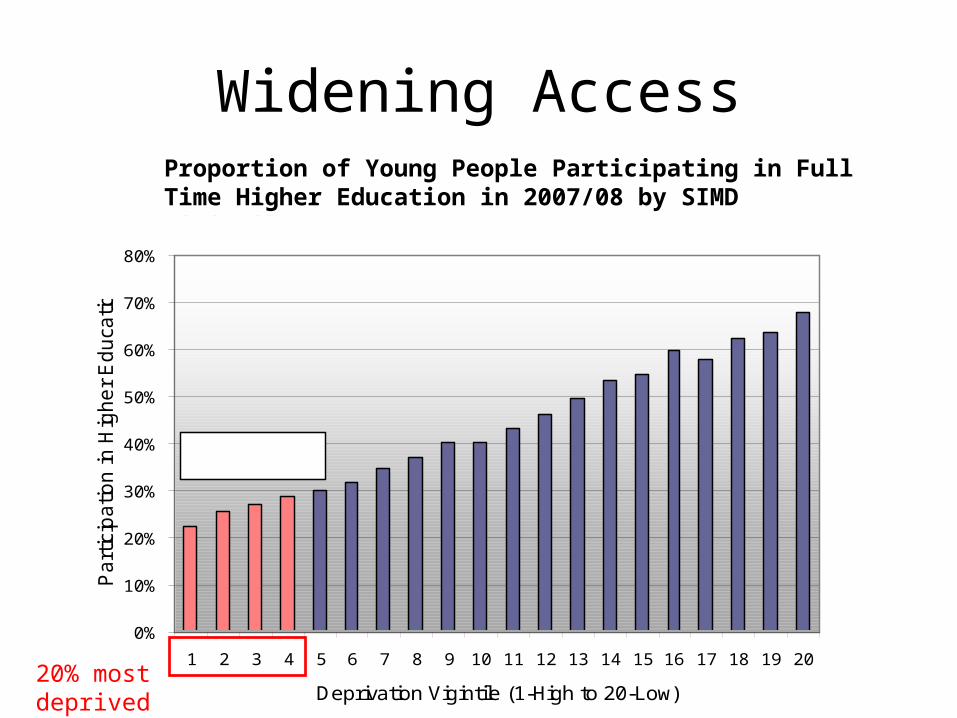
Widening AccessProportion of Young People Participating in Full Time Higher Education in 2007/08 by SIMD Vigintile
0%
10%
20%
30%
40%
50%
60%
70%
80%
1 2 3 4 5 6 7 8 9 10 11 12 13 14 15 16 17 18 19 20
Deprivation Vigintile (1-High to 20-Low)
Pa
rtic
ipa
tion
in H
igh
er
Ed
uca
tion
Widening Access Group
20% most deprived areas
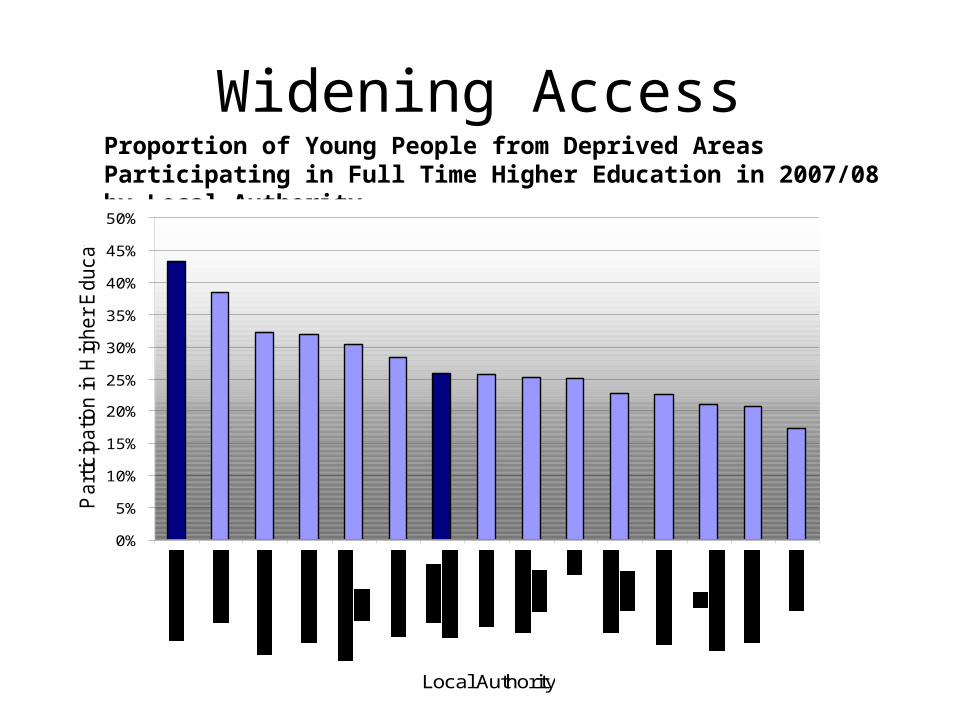
Widening AccessProportion of Young People from Deprived Areas Participating in Full Time Higher Education in 2007/08 by Local Authority
0%
5%
10%
15%
20%
25%
30%
35%
40%
45%
50%
Local Authority
Part
icip
atio
n in
Hig
her
Educatio
n
Widening Access
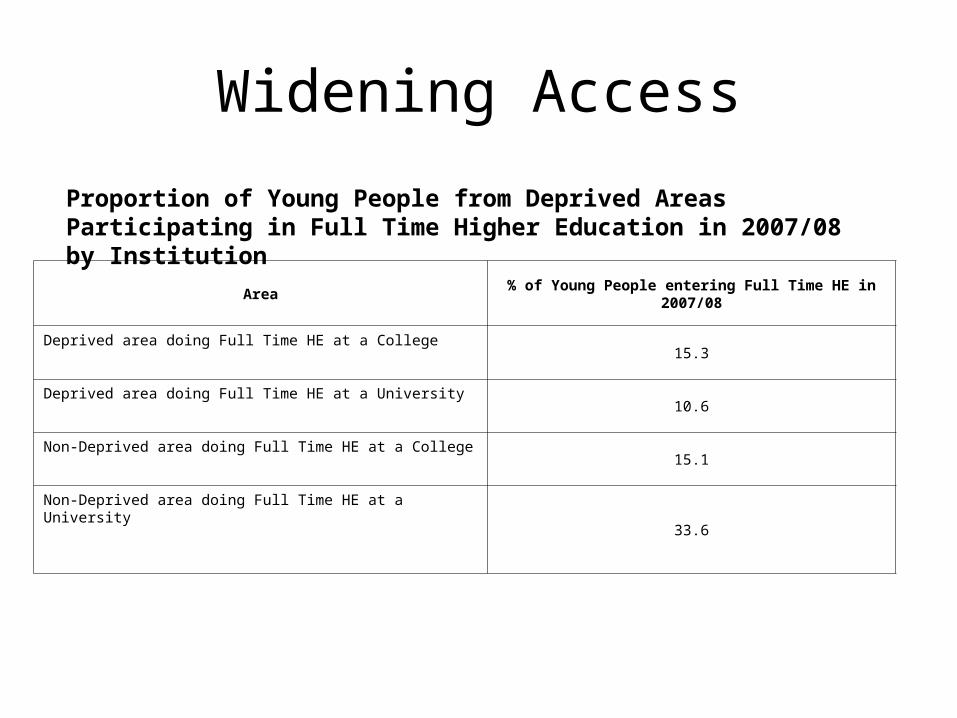
Proportion of Young People from Deprived Areas Participating in Full Time Higher Education in 2007/08 by Institution
Area % of Young People entering Full Time HE in 2007/08
Deprived area doing Full Time HE at a College15.3
Deprived area doing Full Time HE at a University10.6
Non-Deprived area doing Full Time HE at a College15.1
Non-Deprived area doing Full Time HE at a University
33.6
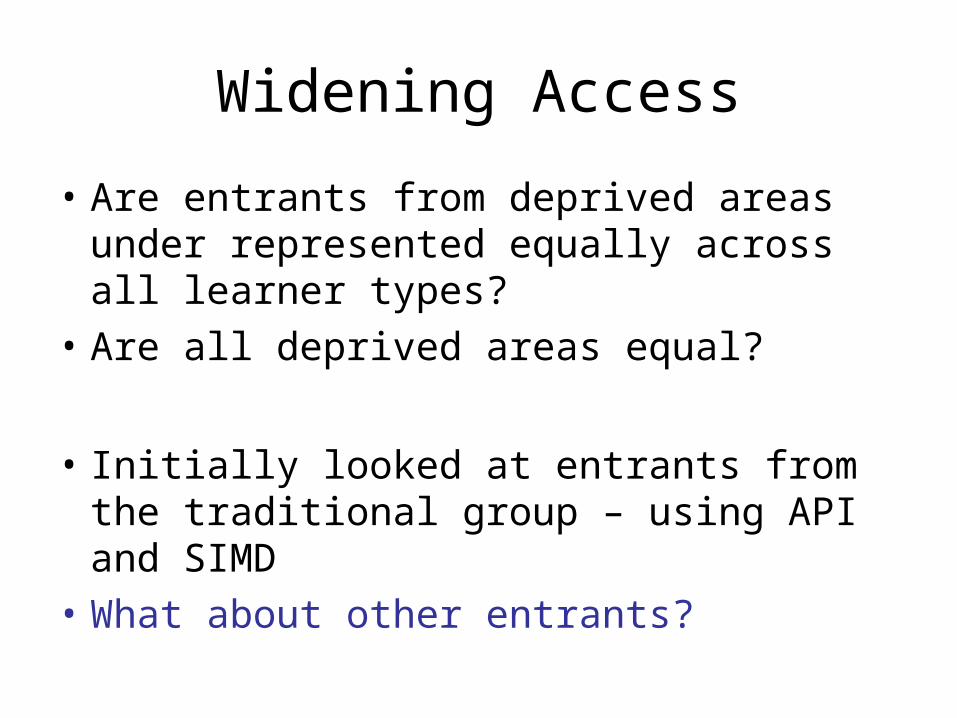
Widening Access
• Are entrants from deprived areas under represented equally across all learner types?
• Are all deprived areas equal?
• Initially looked at entrants from the traditional group – using API and SIMD
• What about other entrants?
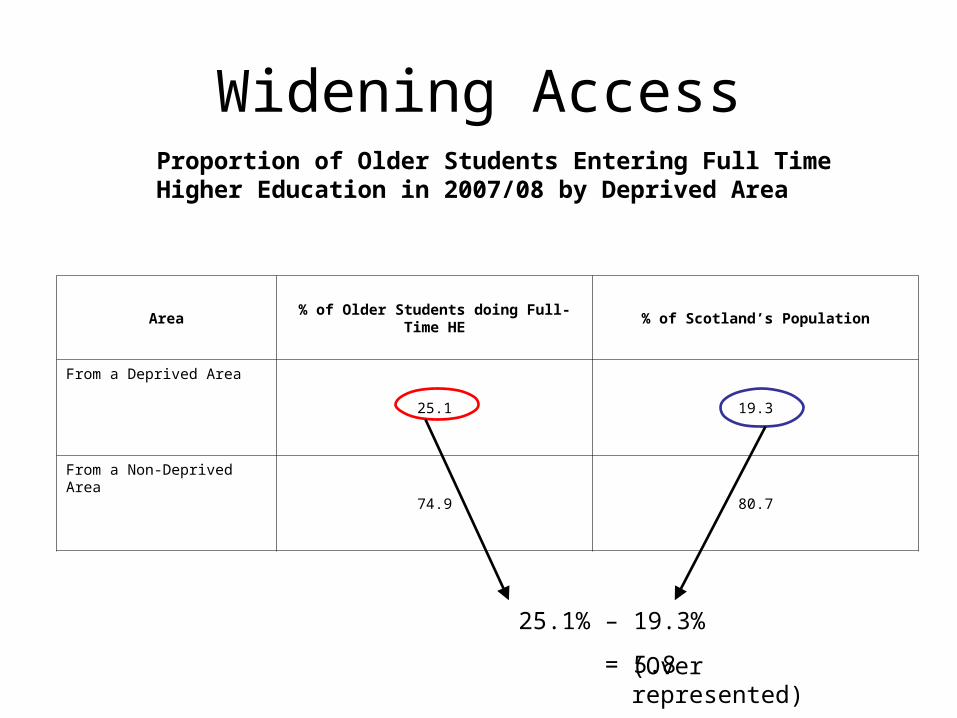
Widening AccessProportion of Older Students Entering Full Time Higher Education in 2007/08 by Deprived Area
Area % of Older Students doing Full-Time HE % of Scotland’s Population
From a Deprived Area
25.1 19.3
From a Non-Deprived Area
74.9 80.7
25.1% – 19.3%
= 5.8 (Over represented)
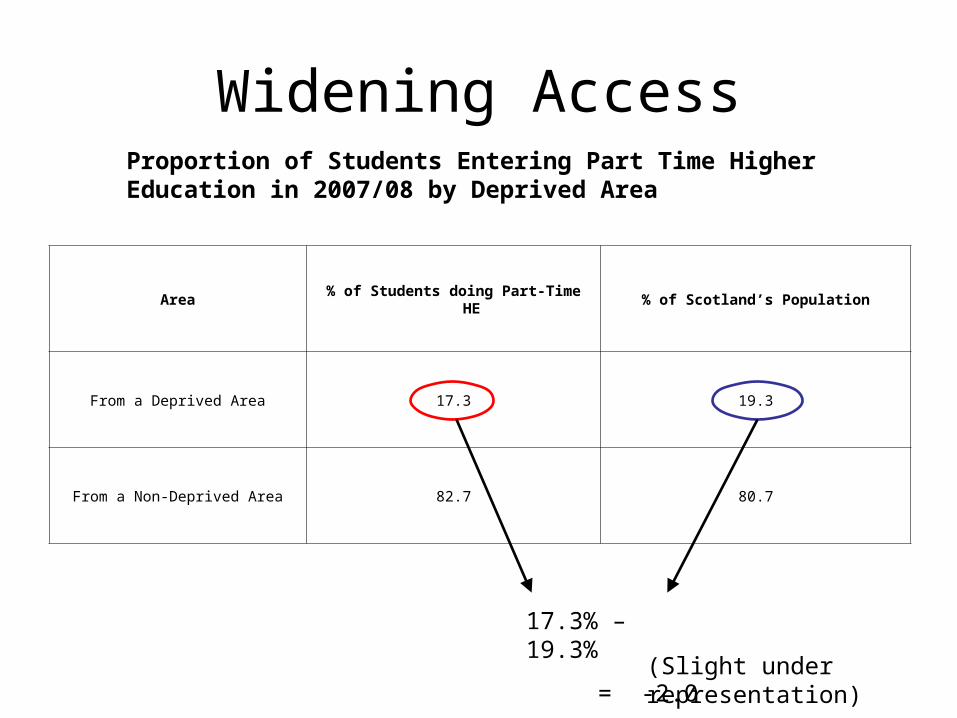
Widening AccessProportion of Students Entering Part Time Higher Education in 2007/08 by Deprived Area
Area % of Students doing Part-Time HE % of Scotland’s Population
From a Deprived Area 17.3 19.3
From a Non-Deprived Area 82.7 80.7
17.3% – 19.3%
= -2.0 (Slight under representation)
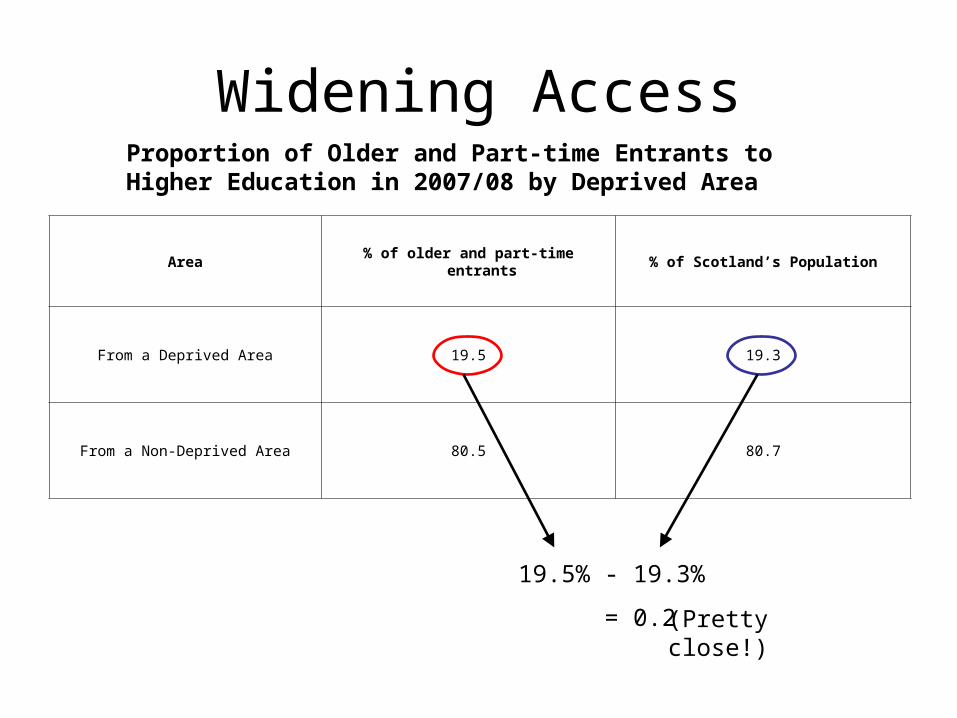
Widening AccessProportion of Older and Part-time Entrants to Higher Education in 2007/08 by Deprived Area
Area % of older and part-time entrants % of Scotland’s Population
From a Deprived Area 19.5 19.3
From a Non-Deprived Area 80.5 80.7
19.5% - 19.3%
= 0.2 (Pretty close!)
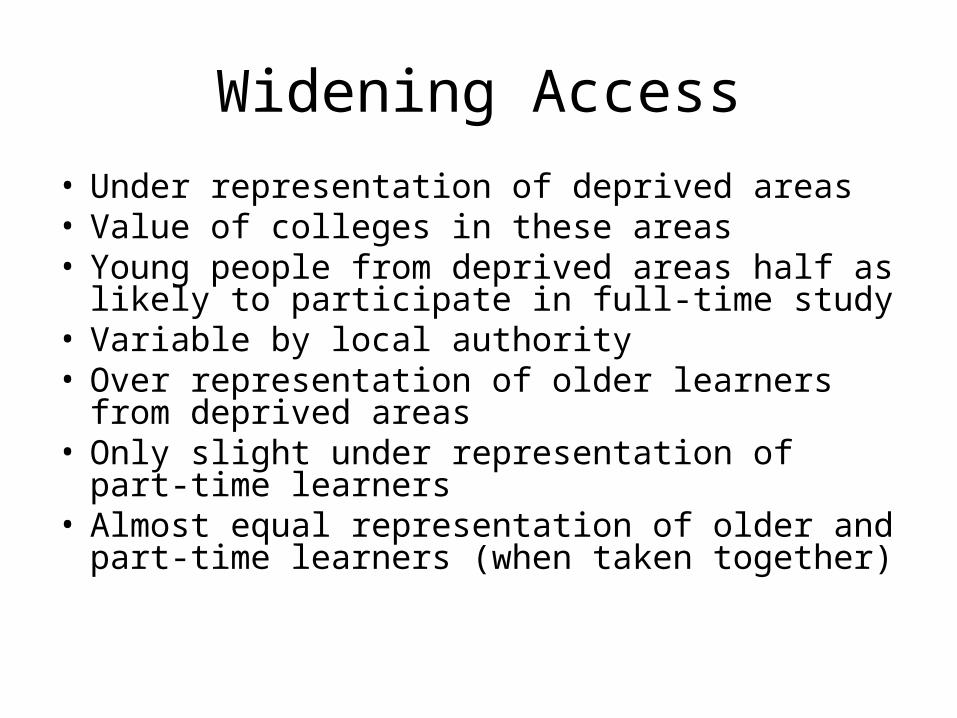
Widening Access
• Under representation of deprived areas• Value of colleges in these areas• Young people from deprived areas half as likely
to participate in full-time study• Variable by local authority• Over representation of older learners from
deprived areas• Only slight under representation of part-time
learners• Almost equal representation of older and part-
time learners (when taken together)

Questions?
Contacts:
Jeanette Hagerstrom, Lifelong Learning [email protected]
Carolyn Fishman, Higher Education and LearnerSupport Policy [email protected]
Andrew Walker, Lifelong Learning Statistics,[email protected] Telephone: 0300 244 6774

Group Discussion
• What does Participation/Widening Access mean to you?
• What do you want from measures of participation? (are you interested in the widening access group?)
• How would you assess our current statistics?
• Suggestions on how we can meet your needs for reporting on participation.
Useful LinksLifelong Learning topic page:www.scotland.gov.uk/Topics/Education/Life-Long-Learning
Lifelong Learning Research:www.scotland.gov.uk/Topics/Research/by-topic/education-and-training
Lifelong Learning Statisticswww.scotland.gov.uk/llstatistics
Scottish Neighbourhood Statistics (SNS)www.sns.gov.uk
Scottish Index of Multiple Deprivationwww.scotland.gov.uk/Topics/Statistics/SIMD
ScotStatwww.scotland.gov.uk/Topics/Statistics/scotstat