Embed Size (px)
DESCRIPTION
LiFePO4 efficence
Citation preview
C
Ya
Tb
a
ARRAA
KLLCEE
1
aLl[pldai1mcslIaraect(
0d
Journal of Power Sources 196 (2011) 1513–1520
Contents lists available at ScienceDirect
Journal of Power Sources
journa l homepage: www.e lsev ier .com/ locate / jpowsour
ycling degradation of an automotive LiFePO4 lithium-ion battery
ancheng Zhanga, Chao-Yang Wanga,∗, Xidong Tangb
Electrochemical Engine Center (ECEC), Department of Materials Science and Engineering, and Department of Mechanical and Nuclear Engineering,he Pennsylvania State University, University Park, PA 16802, USAGM R&D and Planning, General Motors, Mail Code: 480-106-390, 30500 Mound Road, Warren, MI 48090-9055, USA
r t i c l e i n f o
rticle history:eceived 9 July 2010eceived in revised form 20 August 2010ccepted 23 August 2010
a b s t r a c t
Degradation of a high capacity prismatic LiFePO4 cell with deep cycling at elevated temperature of 50 ◦Cis studied by electrochemical impedance spectroscopy as well as capacity and power fading characteri-zation at different test temperatures (45, 25, 0 and −10 ◦C). Capacity fade after 600 cycles is 14.3% at 45 ◦Cand 25.8% at −10 ◦C. There is little power fade at 45 ◦C after 600 cycles, whereas the power fade after 600
vailable online 22 September 2010
eywords:iFePO4
ithium-ion batteryycling degradation
cycles is 61.6% and 77.2%, respectively, at 0 and −10 ◦C. The capacity and power fade evidently becomesmore severe at lower temperature. In particular, the power fade at low temperatures (e.g., 0 and −10 ◦C)rather than capacity loss is a major limitation of the LiFePO4 cell. The primary mechanism for capacity fadeis loss of cyclable lithium in the cell resulting from lithium-consuming solid electrolyte interphase (SEI)layer growth and side reactions. The increased interfacial resistance (Rw) due to the catalytic growth of
node
lectrochemical impedance spectroscopylectric-only rangeSEI layer on the graphite a
. Introduction
Lithium insertion and extraction in a LiFePO4 cathode involvefirst-order phase transition between two phases (FePO4 and
iFePO4) [1], even though the two-phase reaction theory was chal-enged at high temperatures (for instance, heating up to 200 ◦C2]) and for nano-particles (<50 nm [3]). Both FePO4 and LiFePO4hases have low electronic conductivity [4,5], and slow diffusion of
ithium ions through the two-phase interface limits the charge andischarge current density [1]. These cause poor power capabilitynd low capacity of LiFePO4 batteries. The electronic conductiv-ty has been significantly increased from 10−9–10−10 S cm−1 to0−2 S cm−1 since 2002 [5] but the mechanism for the enhance-ent is under debate [6–8]. Extensive literature demonstrates that
arbon-coating and decreasing particle size (or increasing specificurface area) are effective approaches to overcome the problem ofow electronic and ionic conductivities in LiFePO4 cathode [9–20].n particular, carbon-coated LiFePO4 (C-LiFePO4) was claimed tochieve high capacity (e.g., 90% or above of the 170 mAh g−1 theo-etical capacity) and excellent cycling performance [10–12]. Thettractive properties of C-LiFePO4 as a cathode material have
nabled a high-power lithium-ion battery with high safety, lowost and long life, and its commercialization can offer wide applica-ions especially to hybrid electric vehicles (HEVs) and plug-in HEVsPHEVs).∗ Corresponding author. Tel.: +1 814 863 4762; fax: +1 814 863 4848.E-mail address: [email protected] (C.-Y. Wang).
378-7753/$ – see front matter © 2010 Elsevier B.V. All rights reserved.oi:10.1016/j.jpowsour.2010.08.070
and increased electrolyte resistance are the main sources for power fade.© 2010 Elsevier B.V. All rights reserved.
Excellent long-term cycling stability was demonstrated for C-LiFePO4/graphite prismatic cells with capacity loss of only 14% after6000 charge–discharge cycles [21], where the cells were cycled at20 ◦C and around 1C rate. However, high-temperature cycling sig-nificantly accelerated capacity fading [22]. Amine et al. reportedthat there was little capacity fade at 25 ◦C, but approximately 70%capacity loss at 55 ◦C after 100 charge–discharge cycles at C/3 rate[22]. The fast fading at high temperatures was found to result fromformation and growth of thick interfacial film and concomitantlarge impedance rise on the graphite anode which was catalyzedby iron deposition on the graphite anode subsequent to iron disso-lution from the LiFePO4 cathode [22–24]. As per this mechanism,using Li4Ti5O12 anode instead of graphite anode slowed downiron deposition on the anode with a high potential of ca. 1.5 Vversus Li+/Li [22], and ion-sieving metal coating (30–50 nm Auor Cu coating) on graphite anode reduced solid electrolyte inter-phase (SEI) formation on the graphite surface [24]. Both approachesgreatly improved the cycling performance of LiFePO4 cells at 55 ◦C.Another solution was to significantly suppress the iron dissolu-tion from the LiFePO4 cathode, for example, by substituting lithiumbis(oxalato)borate (LiBOB) for LiPF6 salt [22,25], or introducing anadditive of vinylene carbonate (VC) (2 wt%) into the electrolyte [23].
In the present work, a prismatic LiFePO4-based cell with highcapacity (16.4 Ah) is explored to study cell degradation through
accelerated cycling under a typical PHEV condition (high currentrate and deep depth of discharge at elevated temperature). Thisresearch provides an improved understanding of the degradationand cycle life of high capacity battery in automotive applications.The cycling degradation was examined through characterization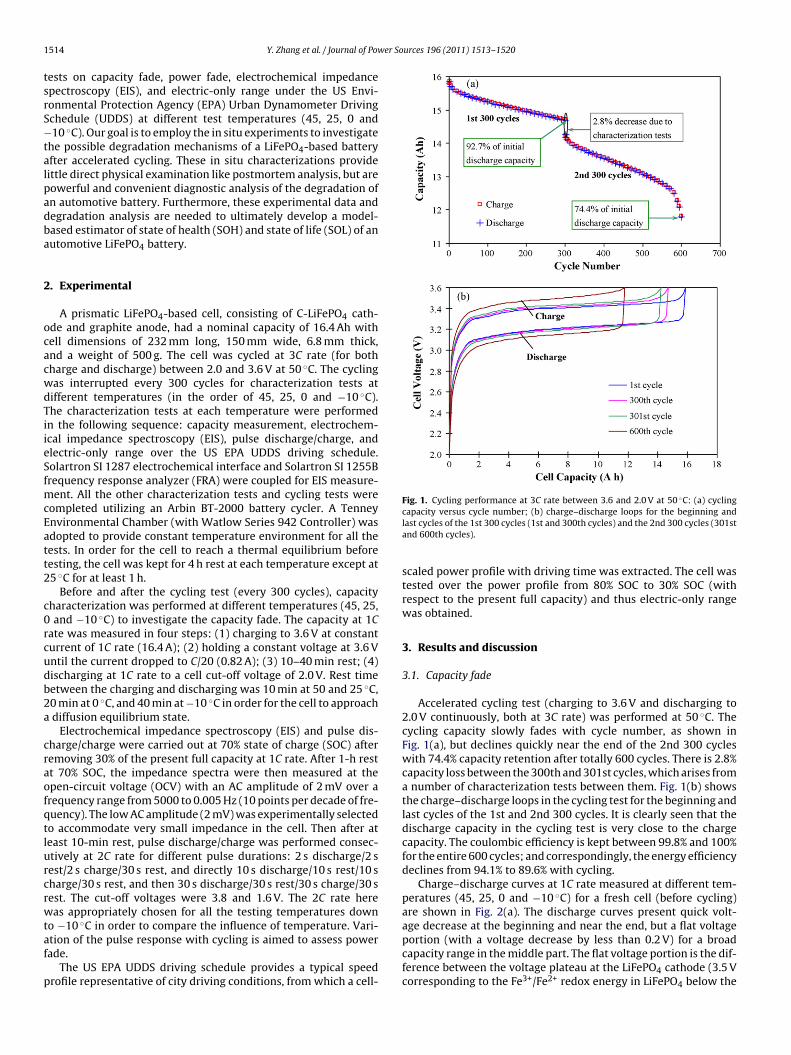
1 er Sources 196 (2011) 1513–1520
tsrS−talpadba
2
ocacwdTiieSfmcEatt2
c0rcudb2a
craofqtlurcrwtaf
p
Fig. 1. Cycling performance at 3C rate between 3.6 and 2.0 V at 50 ◦C: (a) cycling
514 Y. Zhang et al. / Journal of Pow
ests on capacity fade, power fade, electrochemical impedancepectroscopy (EIS), and electric-only range under the US Envi-onmental Protection Agency (EPA) Urban Dynamometer Drivingchedule (UDDS) at different test temperatures (45, 25, 0 and10 ◦C). Our goal is to employ the in situ experiments to investigate
he possible degradation mechanisms of a LiFePO4-based batteryfter accelerated cycling. These in situ characterizations provideittle direct physical examination like postmortem analysis, but areowerful and convenient diagnostic analysis of the degradation ofn automotive battery. Furthermore, these experimental data andegradation analysis are needed to ultimately develop a model-ased estimator of state of health (SOH) and state of life (SOL) of anutomotive LiFePO4 battery.
. Experimental
A prismatic LiFePO4-based cell, consisting of C-LiFePO4 cath-de and graphite anode, had a nominal capacity of 16.4 Ah withell dimensions of 232 mm long, 150 mm wide, 6.8 mm thick,nd a weight of 500 g. The cell was cycled at 3C rate (for bothharge and discharge) between 2.0 and 3.6 V at 50 ◦C. The cyclingas interrupted every 300 cycles for characterization tests atifferent temperatures (in the order of 45, 25, 0 and −10 ◦C).he characterization tests at each temperature were performedn the following sequence: capacity measurement, electrochem-cal impedance spectroscopy (EIS), pulse discharge/charge, andlectric-only range over the US EPA UDDS driving schedule.olartron SI 1287 electrochemical interface and Solartron SI 1255Brequency response analyzer (FRA) were coupled for EIS measure-
ent. All the other characterization tests and cycling tests wereompleted utilizing an Arbin BT-2000 battery cycler. A Tenneynvironmental Chamber (with Watlow Series 942 Controller) wasdopted to provide constant temperature environment for all theests. In order for the cell to reach a thermal equilibrium beforeesting, the cell was kept for 4 h rest at each temperature except at5 ◦C for at least 1 h.
Before and after the cycling test (every 300 cycles), capacityharacterization was performed at different temperatures (45, 25,and −10 ◦C) to investigate the capacity fade. The capacity at 1C
ate was measured in four steps: (1) charging to 3.6 V at constanturrent of 1C rate (16.4 A); (2) holding a constant voltage at 3.6 Vntil the current dropped to C/20 (0.82 A); (3) 10–40 min rest; (4)ischarging at 1C rate to a cell cut-off voltage of 2.0 V. Rest timeetween the charging and discharging was 10 min at 50 and 25 ◦C,0 min at 0 ◦C, and 40 min at −10 ◦C in order for the cell to approachdiffusion equilibrium state.
Electrochemical impedance spectroscopy (EIS) and pulse dis-harge/charge were carried out at 70% state of charge (SOC) afteremoving 30% of the present full capacity at 1C rate. After 1-h restt 70% SOC, the impedance spectra were then measured at thepen-circuit voltage (OCV) with an AC amplitude of 2 mV over arequency range from 5000 to 0.005 Hz (10 points per decade of fre-uency). The low AC amplitude (2 mV) was experimentally selectedo accommodate very small impedance in the cell. Then after ateast 10-min rest, pulse discharge/charge was performed consec-tively at 2C rate for different pulse durations: 2 s discharge/2 sest/2 s charge/30 s rest, and directly 10 s discharge/10 s rest/10 sharge/30 s rest, and then 30 s discharge/30 s rest/30 s charge/30 sest. The cut-off voltages were 3.8 and 1.6 V. The 2C rate hereas appropriately chosen for all the testing temperatures down
o −10 ◦C in order to compare the influence of temperature. Vari-tion of the pulse response with cycling is aimed to assess powerade.
The US EPA UDDS driving schedule provides a typical speedrofile representative of city driving conditions, from which a cell-
capacity versus cycle number; (b) charge–discharge loops for the beginning andlast cycles of the 1st 300 cycles (1st and 300th cycles) and the 2nd 300 cycles (301stand 600th cycles).
scaled power profile with driving time was extracted. The cell wastested over the power profile from 80% SOC to 30% SOC (withrespect to the present full capacity) and thus electric-only rangewas obtained.
3. Results and discussion
3.1. Capacity fade
Accelerated cycling test (charging to 3.6 V and discharging to2.0 V continuously, both at 3C rate) was performed at 50 ◦C. Thecycling capacity slowly fades with cycle number, as shown inFig. 1(a), but declines quickly near the end of the 2nd 300 cycleswith 74.4% capacity retention after totally 600 cycles. There is 2.8%capacity loss between the 300th and 301st cycles, which arises froma number of characterization tests between them. Fig. 1(b) showsthe charge–discharge loops in the cycling test for the beginning andlast cycles of the 1st and 2nd 300 cycles. It is clearly seen that thedischarge capacity in the cycling test is very close to the chargecapacity. The coulombic efficiency is kept between 99.8% and 100%for the entire 600 cycles; and correspondingly, the energy efficiencydeclines from 94.1% to 89.6% with cycling.
Charge–discharge curves at 1C rate measured at different tem-peratures (45, 25, 0 and −10 ◦C) for a fresh cell (before cycling)are shown in Fig. 2(a). The discharge curves present quick volt-age decrease at the beginning and near the end, but a flat voltage
portion (with a voltage decrease by less than 0.2 V) for a broadcapacity range in the middle part. The flat voltage portion is the dif-ference between the voltage plateau at the LiFePO4 cathode (3.5 Vcorresponding to the Fe3+/Fe2+ redox energy in LiFePO4 below the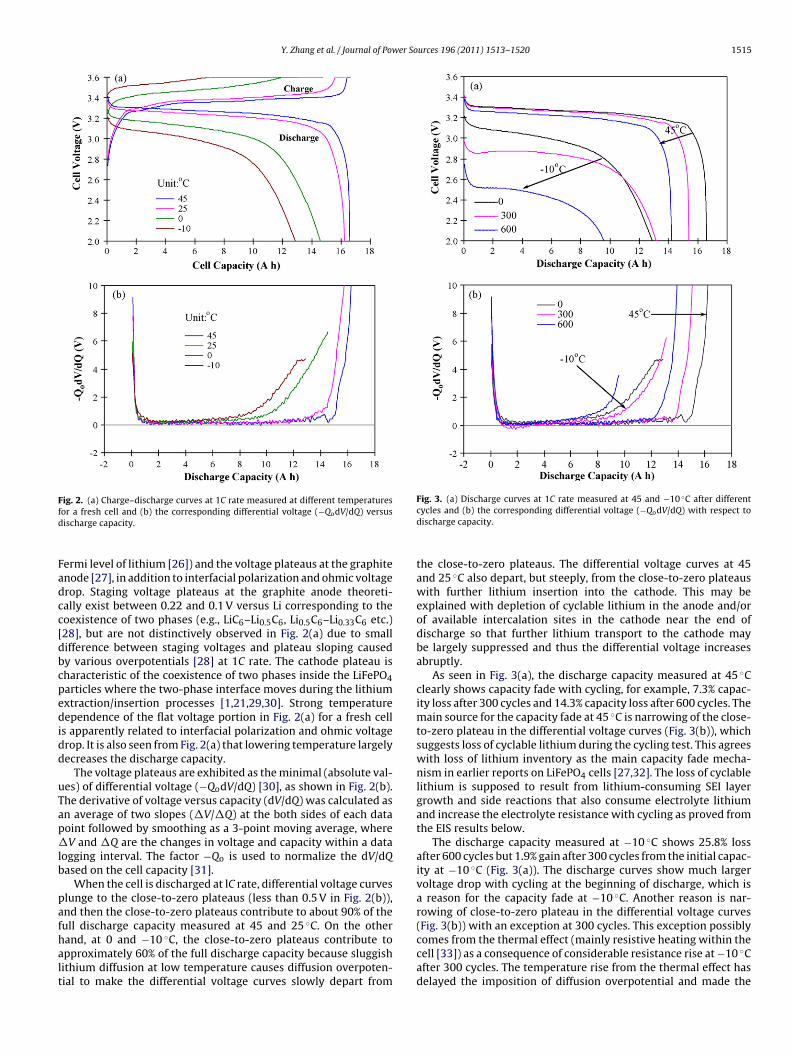
Y. Zhang et al. / Journal of Power Sources 196 (2011) 1513–1520 1515
Ffd
Fadcc[dbcpedidd
uTap�lb
pafhalt
ig. 2. (a) Charge–discharge curves at 1C rate measured at different temperaturesor a fresh cell and (b) the corresponding differential voltage (−QodV/dQ) versusischarge capacity.
ermi level of lithium [26]) and the voltage plateaus at the graphitenode [27], in addition to interfacial polarization and ohmic voltagerop. Staging voltage plateaus at the graphite anode theoreti-ally exist between 0.22 and 0.1 V versus Li corresponding to theoexistence of two phases (e.g., LiC6–Li0.5C6, Li0.5C6–Li0.33C6 etc.)28], but are not distinctively observed in Fig. 2(a) due to smallifference between staging voltages and plateau sloping causedy various overpotentials [28] at 1C rate. The cathode plateau isharacteristic of the coexistence of two phases inside the LiFePO4articles where the two-phase interface moves during the lithiumxtraction/insertion processes [1,21,29,30]. Strong temperatureependence of the flat voltage portion in Fig. 2(a) for a fresh cell
s apparently related to interfacial polarization and ohmic voltagerop. It is also seen from Fig. 2(a) that lowering temperature largelyecreases the discharge capacity.
The voltage plateaus are exhibited as the minimal (absolute val-es) of differential voltage (−QodV/dQ) [30], as shown in Fig. 2(b).he derivative of voltage versus capacity (dV/dQ) was calculated asn average of two slopes (�V/�Q) at the both sides of each dataoint followed by smoothing as a 3-point moving average, whereV and �Q are the changes in voltage and capacity within a data
ogging interval. The factor −Qo is used to normalize the dV/dQased on the cell capacity [31].
When the cell is discharged at lC rate, differential voltage curveslunge to the close-to-zero plateaus (less than 0.5 V in Fig. 2(b)),nd then the close-to-zero plateaus contribute to about 90% of theull discharge capacity measured at 45 and 25 ◦C. On the other
and, at 0 and −10 ◦C, the close-to-zero plateaus contribute topproximately 60% of the full discharge capacity because sluggishithium diffusion at low temperature causes diffusion overpoten-ial to make the differential voltage curves slowly depart fromFig. 3. (a) Discharge curves at 1C rate measured at 45 and −10 ◦C after differentcycles and (b) the corresponding differential voltage (−QodV/dQ) with respect todischarge capacity.
the close-to-zero plateaus. The differential voltage curves at 45and 25 ◦C also depart, but steeply, from the close-to-zero plateauswith further lithium insertion into the cathode. This may beexplained with depletion of cyclable lithium in the anode and/orof available intercalation sites in the cathode near the end ofdischarge so that further lithium transport to the cathode maybe largely suppressed and thus the differential voltage increasesabruptly.
As seen in Fig. 3(a), the discharge capacity measured at 45 ◦Cclearly shows capacity fade with cycling, for example, 7.3% capac-ity loss after 300 cycles and 14.3% capacity loss after 600 cycles. Themain source for the capacity fade at 45 ◦C is narrowing of the close-to-zero plateau in the differential voltage curves (Fig. 3(b)), whichsuggests loss of cyclable lithium during the cycling test. This agreeswith loss of lithium inventory as the main capacity fade mecha-nism in earlier reports on LiFePO4 cells [27,32]. The loss of cyclablelithium is supposed to result from lithium-consuming SEI layergrowth and side reactions that also consume electrolyte lithiumand increase the electrolyte resistance with cycling as proved fromthe EIS results below.
The discharge capacity measured at −10 ◦C shows 25.8% lossafter 600 cycles but 1.9% gain after 300 cycles from the initial capac-ity at −10 ◦C (Fig. 3(a)). The discharge curves show much largervoltage drop with cycling at the beginning of discharge, which isa reason for the capacity fade at −10 ◦C. Another reason is nar-rowing of close-to-zero plateau in the differential voltage curves(Fig. 3(b)) with an exception at 300 cycles. This exception possibly
comes from the thermal effect (mainly resistive heating within thecell [33]) as a consequence of considerable resistance rise at −10 ◦Cafter 300 cycles. The temperature rise from the thermal effect hasdelayed the imposition of diffusion overpotential and made the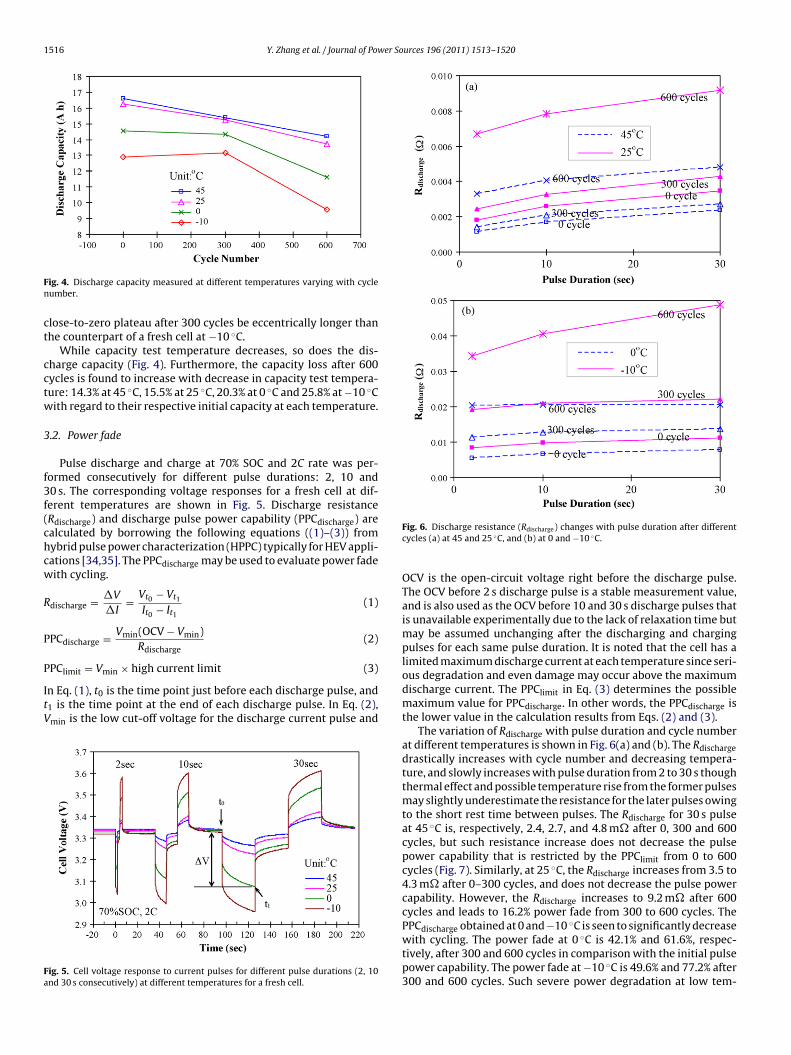
1516 Y. Zhang et al. / Journal of Power Sources 196 (2011) 1513–1520
Fn
ct
cctw
3
f3f(chcw
R
P
P
ItV
Fa
ig. 4. Discharge capacity measured at different temperatures varying with cycleumber.
lose-to-zero plateau after 300 cycles be eccentrically longer thanhe counterpart of a fresh cell at −10 ◦C.
While capacity test temperature decreases, so does the dis-harge capacity (Fig. 4). Furthermore, the capacity loss after 600ycles is found to increase with decrease in capacity test tempera-ure: 14.3% at 45 ◦C, 15.5% at 25 ◦C, 20.3% at 0 ◦C and 25.8% at −10 ◦Cith regard to their respective initial capacity at each temperature.
.2. Power fade
Pulse discharge and charge at 70% SOC and 2C rate was per-ormed consecutively for different pulse durations: 2, 10 and0 s. The corresponding voltage responses for a fresh cell at dif-erent temperatures are shown in Fig. 5. Discharge resistanceRdischarge) and discharge pulse power capability (PPCdischarge) arealculated by borrowing the following equations ((1)–(3)) fromybrid pulse power characterization (HPPC) typically for HEV appli-ations [34,35]. The PPCdischarge may be used to evaluate power fadeith cycling.
discharge = �V
�I= Vt0 − Vt1
It0 − It1
(1)
PCdischarge = Vmin(OCV − Vmin)Rdischarge
(2)
PClimit = Vmin × high current limit (3)
n Eq. (1), t0 is the time point just before each discharge pulse, and1 is the time point at the end of each discharge pulse. In Eq. (2),min is the low cut-off voltage for the discharge current pulse and
ig. 5. Cell voltage response to current pulses for different pulse durations (2, 10nd 30 s consecutively) at different temperatures for a fresh cell.
Fig. 6. Discharge resistance (Rdischarge) changes with pulse duration after differentcycles (a) at 45 and 25 ◦C, and (b) at 0 and −10 ◦C.
OCV is the open-circuit voltage right before the discharge pulse.The OCV before 2 s discharge pulse is a stable measurement value,and is also used as the OCV before 10 and 30 s discharge pulses thatis unavailable experimentally due to the lack of relaxation time butmay be assumed unchanging after the discharging and chargingpulses for each same pulse duration. It is noted that the cell has alimited maximum discharge current at each temperature since seri-ous degradation and even damage may occur above the maximumdischarge current. The PPClimit in Eq. (3) determines the possiblemaximum value for PPCdischarge. In other words, the PPCdischarge isthe lower value in the calculation results from Eqs. (2) and (3).
The variation of Rdischarge with pulse duration and cycle numberat different temperatures is shown in Fig. 6(a) and (b). The Rdischargedrastically increases with cycle number and decreasing tempera-ture, and slowly increases with pulse duration from 2 to 30 s thoughthermal effect and possible temperature rise from the former pulsesmay slightly underestimate the resistance for the later pulses owingto the short rest time between pulses. The Rdischarge for 30 s pulseat 45 ◦C is, respectively, 2.4, 2.7, and 4.8 m� after 0, 300 and 600cycles, but such resistance increase does not decrease the pulsepower capability that is restricted by the PPClimit from 0 to 600cycles (Fig. 7). Similarly, at 25 ◦C, the Rdischarge increases from 3.5 to4.3 m� after 0–300 cycles, and does not decrease the pulse powercapability. However, the Rdischarge increases to 9.2 m� after 600cycles and leads to 16.2% power fade from 300 to 600 cycles. ThePPCdischarge obtained at 0 and−10 ◦C is seen to significantly decrease
with cycling. The power fade at 0 ◦C is 42.1% and 61.6%, respec-tively, after 300 and 600 cycles in comparison with the initial pulsepower capability. The power fade at −10 ◦C is 49.6% and 77.2% after300 and 600 cycles. Such severe power degradation at low tem-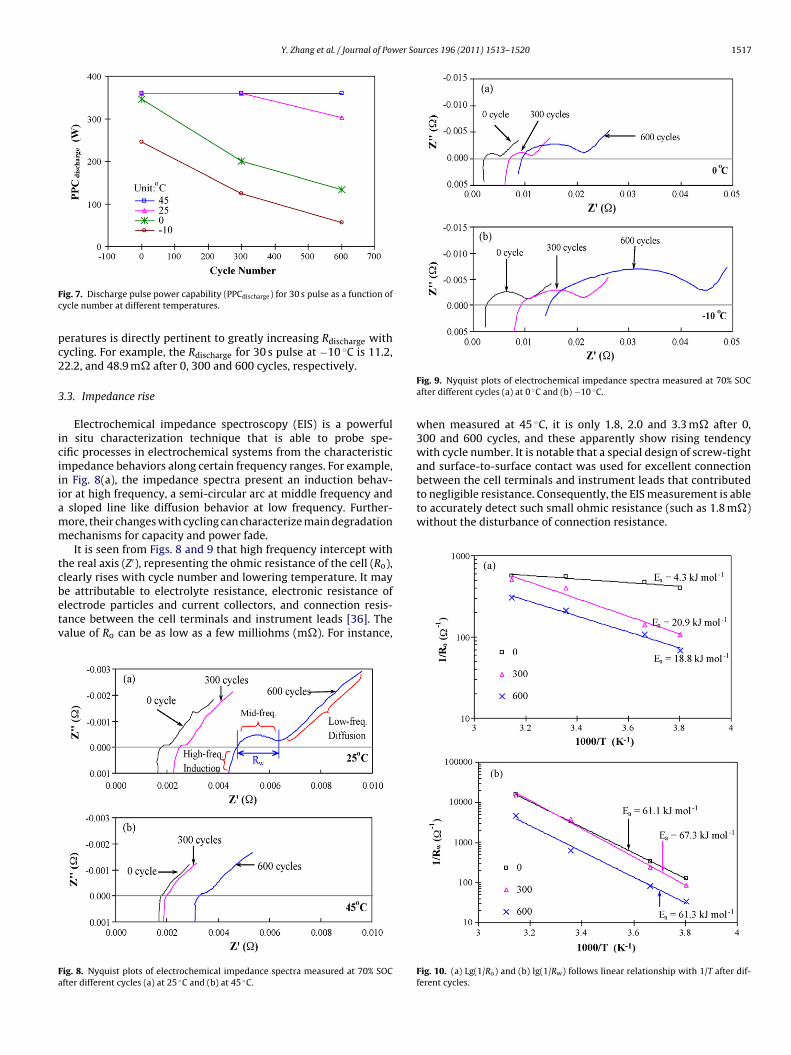
Y. Zhang et al. / Journal of Power Sources 196 (2011) 1513–1520 1517
Fc
pc2
3
iciiiamm
tcbetv
Fa
between the cell terminals and instrument leads that contributedto negligible resistance. Consequently, the EIS measurement is ableto accurately detect such small ohmic resistance (such as 1.8 m�)without the disturbance of connection resistance.
ig. 7. Discharge pulse power capability (PPCdischarge) for 30 s pulse as a function ofycle number at different temperatures.
eratures is directly pertinent to greatly increasing Rdischarge withycling. For example, the Rdischarge for 30 s pulse at −10 ◦C is 11.2,2.2, and 48.9 m� after 0, 300 and 600 cycles, respectively.
.3. Impedance rise
Electrochemical impedance spectroscopy (EIS) is a powerfuln situ characterization technique that is able to probe spe-ific processes in electrochemical systems from the characteristicmpedance behaviors along certain frequency ranges. For example,n Fig. 8(a), the impedance spectra present an induction behav-or at high frequency, a semi-circular arc at middle frequency and
sloped line like diffusion behavior at low frequency. Further-ore, their changes with cycling can characterize main degradationechanisms for capacity and power fade.It is seen from Figs. 8 and 9 that high frequency intercept with
he real axis (Z′), representing the ohmic resistance of the cell (Ro),learly rises with cycle number and lowering temperature. It may
e attributable to electrolyte resistance, electronic resistance oflectrode particles and current collectors, and connection resis-ance between the cell terminals and instrument leads [36]. Thealue of Ro can be as low as a few milliohms (m�). For instance,ig. 8. Nyquist plots of electrochemical impedance spectra measured at 70% SOCfter different cycles (a) at 25 ◦C and (b) at 45 ◦C.
Fig. 9. Nyquist plots of electrochemical impedance spectra measured at 70% SOCafter different cycles (a) at 0 ◦C and (b) −10 ◦C.
when measured at 45 ◦C, it is only 1.8, 2.0 and 3.3 m� after 0,300 and 600 cycles, and these apparently show rising tendencywith cycle number. It is notable that a special design of screw-tightand surface-to-surface contact was used for excellent connection
Fig. 10. (a) Lg(1/Ro) and (b) lg(1/Rw) follows linear relationship with 1/T after dif-ferent cycles.
1 er Sources 196 (2011) 1513–1520
natablwiatpfi0bwTid
retSacrtascn0t3rtaitel
isora0idp
3
a3pffiSsts
(0.84–0.87 Wh mile−1 in Table 1 except the early termination occa-sions) for different cycle numbers and at different temperatures.
The electric-only range is mainly dependent on the cell capac-ity since the electric-only range is directly proportional to the used
518 Y. Zhang et al. / Journal of Pow
The temperature dependence of 1/Ro is analyzed by the Arrhe-ius equation in the form of (1/Ro) ∝ exp(−Ea/T). Lg(1/Ro) followslinear relationship with 1/T (Fig. 10(a)) and from the linear slope
he activation energy (Ea) is obtained as 4.3 kJ mol−1 (or 45 meV) forfresh cell, and increases radically to 20.9 kJ mol−1 after 300 cyclesut decreases slightly to 18.8 kJ mol−1 after 600 cycles. The very
ow activation energy (45 meV) for a fresh cell is in close agreementith the activation energy of high conductivity of LiFePO4 particles
n the literature, such as 60–80 meV in [5] and 30–40 meV in [8],nd this may suggest that the electronic resistance of electrode par-icles (mainly LiFePO4 cathode particles since the anode graphitearticles have much higher electronic conductivity) is a dominantactor in the ohmic resistance (Ro) for a fresh cell. The remarkablencrease (from 4.3 to 20.9 kJ mol−1) of the activation energy from
to 300 cycles implies that increasing electrolyte resistance hasecome dominant in Ro due to lithium loss in the electrolyte thatas consumed in the SEI layer growth and other side reactions.
he implied high activation energy for the electrolyte resistance (oronic conductivity of the electrolyte) is consistent with the typicalata in the literature (∼15 or ∼20 kJ mol−1 [37,38]).
The depressed semi-circular arc at the middle frequency iselated to the capacitive behavior with a parallel resistance on thelectrode/electrolyte interface, for instance, double-layer capaci-ance with a parallel charge transfer resistance and capacitance ofEI layer in parallel with its resistance [36]. The middle frequencyrc width (Rw), as labeled in Fig. 8(a), significantly increases withycle number and lowering temperature (Figs. 8 and 9). Lg(1/Rw)educes linearly with 1/T, as shown in Fig. 10(b). Fitting withhe Arrhenius equation yields the activation energy of 61.1, 67.3nd 61.3 kJ mol−1 after 0, 300 and 600 cycles, respectively. Theirmall difference suggests that the nature of interfacial impedancehanges little with cycling. The mid-frequency arc width (Rw) doesot greatly increase (0.9–1.5 times at different temperatures) fromto 300 cycles, but evidently increases (2.5–6 times at different
emperatures) from 300 to 600 cycles. The large increase of Rw from00 to 600 cycles can be interpreted as the increase of interfacialesistance that is induced by the catalytic growth of SEI layer onhe graphite anode due to iron impurities that deposit on the anodefter chemical dissolution of iron from the LiFePO4 cathode react-ng with HF present in LiPF6 solutions [22–24,27,32,39]. In contrast,he small change of Rw from 0 to 300 cycles shows that the catalyticffect of iron deposition on the anode is not yet enforced on the SEIayer growth on the anode.
The low frequency 45◦-sloped line is characteristic of Warburgmpedance spectrum corresponding to semi-infinite diffusion. Theloped lines in Figs. 8 and 9 may deviate from 45◦ due to the effectf porous structure and particle size distribution on the diffusion-elated impedance in the active particles. The diffusion impedanceppears from the length of the sloped lines to slightly increase fromto 300 cycles and modestly increase from 300 to 600 cycles, which
s likely related to a decrease of diffusion active area rather than aecrease of diffusion coefficient due to bulk change in the activearticles [39].
.4. Electric-only range
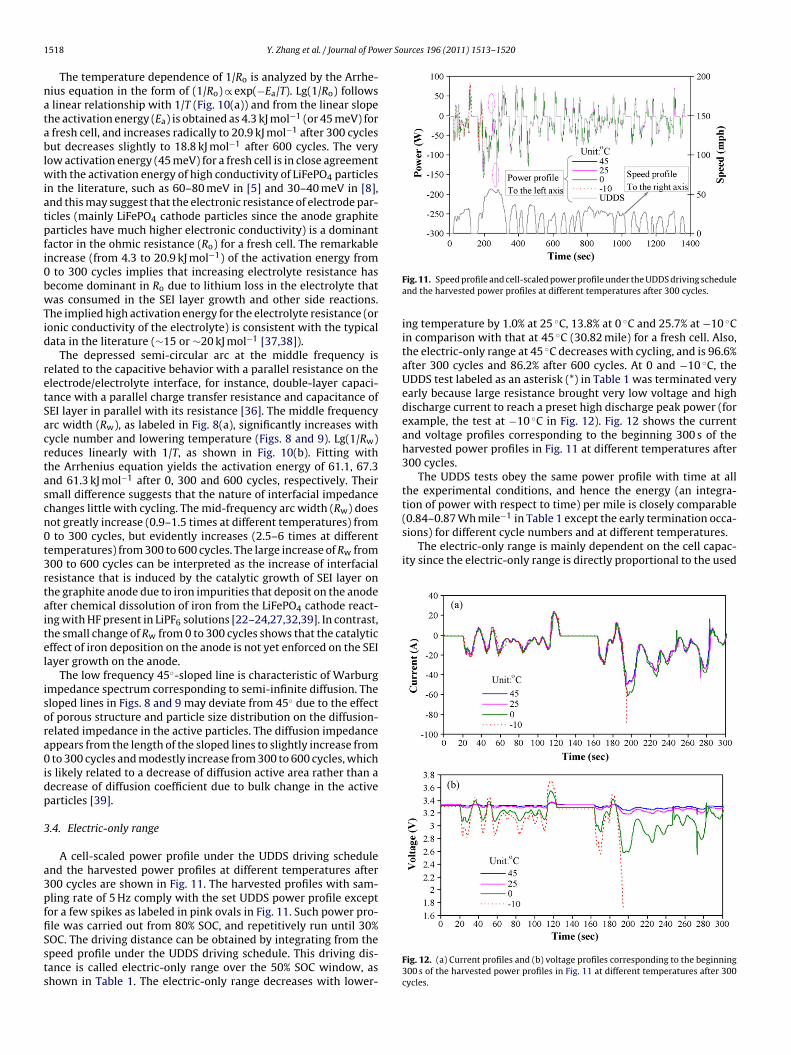
A cell-scaled power profile under the UDDS driving schedulend the harvested power profiles at different temperatures after00 cycles are shown in Fig. 11. The harvested profiles with sam-ling rate of 5 Hz comply with the set UDDS power profile exceptor a few spikes as labeled in pink ovals in Fig. 11. Such power pro-
le was carried out from 80% SOC, and repetitively run until 30%OC. The driving distance can be obtained by integrating from thepeed profile under the UDDS driving schedule. This driving dis-ance is called electric-only range over the 50% SOC window, ashown in Table 1. The electric-only range decreases with lower-Fig. 11. Speed profile and cell-scaled power profile under the UDDS driving scheduleand the harvested power profiles at different temperatures after 300 cycles.
ing temperature by 1.0% at 25 ◦C, 13.8% at 0 ◦C and 25.7% at −10 ◦Cin comparison with that at 45 ◦C (30.82 mile) for a fresh cell. Also,the electric-only range at 45 ◦C decreases with cycling, and is 96.6%after 300 cycles and 86.2% after 600 cycles. At 0 and −10 ◦C, theUDDS test labeled as an asterisk (*) in Table 1 was terminated veryearly because large resistance brought very low voltage and highdischarge current to reach a preset high discharge peak power (forexample, the test at −10 ◦C in Fig. 12). Fig. 12 shows the currentand voltage profiles corresponding to the beginning 300 s of theharvested power profiles in Fig. 11 at different temperatures after300 cycles.
The UDDS tests obey the same power profile with time at allthe experimental conditions, and hence the energy (an integra-tion of power with respect to time) per mile is closely comparable
Fig. 12. (a) Current profiles and (b) voltage profiles corresponding to the beginning300 s of the harvested power profiles in Fig. 11 at different temperatures after 300cycles.
Y. Zhang et al. / Journal of Power Sources 196 (2011) 1513–1520 1519
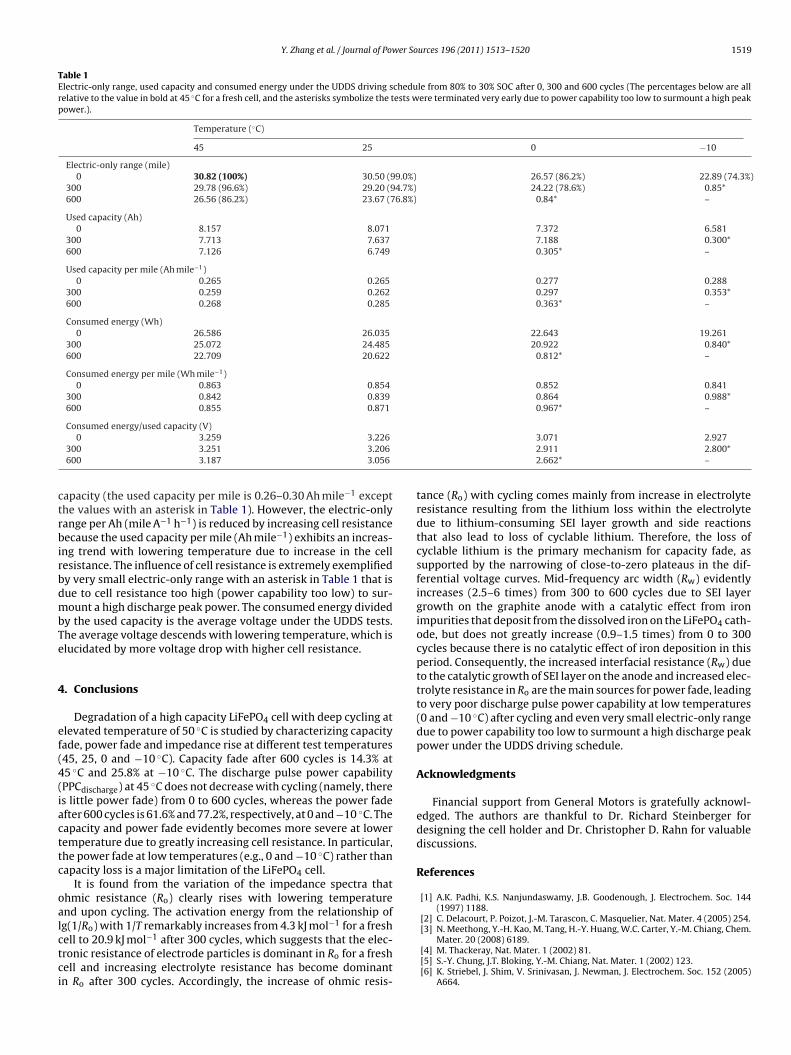
Table 1Electric-only range, used capacity and consumed energy under the UDDS driving schedule from 80% to 30% SOC after 0, 300 and 600 cycles (The percentages below are allrelative to the value in bold at 45 ◦C for a fresh cell, and the asterisks symbolize the tests were terminated very early due to power capability too low to surmount a high peakpower.).
Temperature (◦C)
45 25 0 −10
Electric-only range (mile)0 30.82 (100%) 30.50 (99.0%) 26.57 (86.2%) 22.89 (74.3%)
300 29.78 (96.6%) 29.20 (94.7%) 24.22 (78.6%) 0.85*600 26.56 (86.2%) 23.67 (76.8%) 0.84* –
Used capacity (Ah)0 8.157 8.071 7.372 6.581
300 7.713 7.637 7.188 0.300*600 7.126 6.749 0.305* –
Used capacity per mile (Ah mile−1)0 0.265 0.265 0.277 0.288
300 0.259 0.262 0.297 0.353*600 0.268 0.285 0.363* –
Consumed energy (Wh)0 26.586 26.035 22.643 19.261
300 25.072 24.485 20.922 0.840*600 22.709 20.622 0.812* –
Consumed energy per mile (Wh mile−1)0 0.863 0.854 0.852 0.841
300 0.842 0.839 0.864 0.988*600 0.855 0.871 0.967* –
ctrbirbdmbTe
4
ef(4(iacttc
oalctci
Consumed energy/used capacity (V)0 3.259 3.226
300 3.251 3.206600 3.187 3.056
apacity (the used capacity per mile is 0.26–0.30 Ah mile−1 excepthe values with an asterisk in Table 1). However, the electric-onlyange per Ah (mile A−1 h−1) is reduced by increasing cell resistanceecause the used capacity per mile (Ah mile−1) exhibits an increas-
ng trend with lowering temperature due to increase in the cellesistance. The influence of cell resistance is extremely exemplifiedy very small electric-only range with an asterisk in Table 1 that isue to cell resistance too high (power capability too low) to sur-ount a high discharge peak power. The consumed energy divided
y the used capacity is the average voltage under the UDDS tests.he average voltage descends with lowering temperature, which islucidated by more voltage drop with higher cell resistance.
. Conclusions
Degradation of a high capacity LiFePO4 cell with deep cycling atlevated temperature of 50 ◦C is studied by characterizing capacityade, power fade and impedance rise at different test temperatures45, 25, 0 and −10 ◦C). Capacity fade after 600 cycles is 14.3% at5 ◦C and 25.8% at −10 ◦C. The discharge pulse power capabilityPPCdischarge) at 45 ◦C does not decrease with cycling (namely, theres little power fade) from 0 to 600 cycles, whereas the power fadefter 600 cycles is 61.6% and 77.2%, respectively, at 0 and −10 ◦C. Theapacity and power fade evidently becomes more severe at loweremperature due to greatly increasing cell resistance. In particular,he power fade at low temperatures (e.g., 0 and −10 ◦C) rather thanapacity loss is a major limitation of the LiFePO4 cell.
It is found from the variation of the impedance spectra thathmic resistance (Ro) clearly rises with lowering temperaturend upon cycling. The activation energy from the relationship of
g(1/Ro) with 1/T remarkably increases from 4.3 kJ mol−1 for a freshell to 20.9 kJ mol−1 after 300 cycles, which suggests that the elec-ronic resistance of electrode particles is dominant in Ro for a freshell and increasing electrolyte resistance has become dominantn Ro after 300 cycles. Accordingly, the increase of ohmic resis-3.071 2.9272.911 2.800*2.662* –
tance (Ro) with cycling comes mainly from increase in electrolyteresistance resulting from the lithium loss within the electrolytedue to lithium-consuming SEI layer growth and side reactionsthat also lead to loss of cyclable lithium. Therefore, the loss ofcyclable lithium is the primary mechanism for capacity fade, assupported by the narrowing of close-to-zero plateaus in the dif-ferential voltage curves. Mid-frequency arc width (Rw) evidentlyincreases (2.5–6 times) from 300 to 600 cycles due to SEI layergrowth on the graphite anode with a catalytic effect from ironimpurities that deposit from the dissolved iron on the LiFePO4 cath-ode, but does not greatly increase (0.9–1.5 times) from 0 to 300cycles because there is no catalytic effect of iron deposition in thisperiod. Consequently, the increased interfacial resistance (Rw) dueto the catalytic growth of SEI layer on the anode and increased elec-trolyte resistance in Ro are the main sources for power fade, leadingto very poor discharge pulse power capability at low temperatures(0 and −10 ◦C) after cycling and even very small electric-only rangedue to power capability too low to surmount a high discharge peakpower under the UDDS driving schedule.
Acknowledgments
Financial support from General Motors is gratefully acknowl-edged. The authors are thankful to Dr. Richard Steinberger fordesigning the cell holder and Dr. Christopher D. Rahn for valuablediscussions.
References
[1] A.K. Padhi, K.S. Nanjundaswamy, J.B. Goodenough, J. Electrochem. Soc. 144(1997) 1188.
[2] C. Delacourt, P. Poizot, J.-M. Tarascon, C. Masquelier, Nat. Mater. 4 (2005) 254.
[3] N. Meethong, Y.-H. Kao, M. Tang, H.-Y. Huang, W.C. Carter, Y.-M. Chiang, Chem.Mater. 20 (2008) 6189.[4] M. Thackeray, Nat. Mater. 1 (2002) 81.[5] S.-Y. Chung, J.T. Bloking, Y.-M. Chiang, Nat. Mater. 1 (2002) 123.[6] K. Striebel, J. Shim, V. Srinivasan, J. Newman, J. Electrochem. Soc. 152 (2005)
A664.
1 er So
[[[[
[
[
[
[
[[
[[
[[
[[
[
[[[
[[
[
[
[[
Wright, C.D. Ho, J.R. Belt, C.G. Motloch, J. Power Sources 124 (2003) 538.
520 Y. Zhang et al. / Journal of Pow
[7] N. Ravet, A. Abouimrane, M. Armand, Nat. Mater. 2 (2003) 702.[8] P.S. Herle, B. Ellis, N. Coombs, L.F. Nazar, Nat. Mater. 3 (2004) 147.[9] Z. Chen, J.R. Dahn, J. Electrochem. Soc. 149 (2002) A1184.10] A. Yamada, S.C. Chung, K. Hinokuma, J. Electrochem. Soc. 148 (2001) A224.11] H. Huang, S.-C. Yin, L.F. Nazar, Electrochem. Solid-State Lett. 4 (2001) A170.12] A.D. Spong, G. Vitins, J.R. Owen, J. Electrochem. Soc. 152 (2005) A2376.13] M. Maccario, L. Croguennec, B. Desbat, M. Couzi, F. Le Cras, L. Servant, J. Elec-
trochem. Soc. 155 (2008) A879.14] A. Ait Salah, A. Mauger, K. Zaghib, J.B. Goodenough, N. Ravet, M. Gauthier, F.
Gendron, C.M. Julien, J. Electrochem. Soc. 153 (2006) A1692.15] A.V. Murugan, T. Muraliganth, A. Manthiram, J. Electrochem. Soc. 156 (2009)
A79.16] J.D. Wilcox, M.M. Doeff, M. Marcinek, R. Kostecki, J. Electrochem. Soc. 154 (2007)
A389.17] P.P. Prosini, M. Carewska, S. Scaccia, P. Wisniewski, M. Pasquali, Electrochim.
Acta 48 (2003) 4205.18] Y. Xia, M. Yoshio, H. Noguchi, Electrochim. Acta 52 (2006) 240.19] M. Maccario, L. Croguennec, F. Le Cras, C. Delmas, J. Power Sources 183 (2008)
411.
20] B. Wang, Y. Qiu, L. Yang, Electrochem. Commun. 8 (2006) 1801.21] M. Takahashi, H. Ohtsuka, K. Akuto, Y. Sakurai, J. Electrochem. Soc. 152 (2005)A899.22] K. Amine, J. Liu, I. Belharouak, Electrochem. Commun. 7 (2005) 669.23] H.-C. Wu, C.-Y. Su, D.-T. Shieh, M.-H. Yang, N.-L. Wu, Electrochem. Solid-State
Lett. 9 (2006) A537.
[[
[[
urces 196 (2011) 1513–1520
24] H.-H. Chang, H.-C. Wu, N.-L. Wu, Electrochem. Commun. 10 (2008) 1823.25] K. Xu, S. Zhang, T.R. Jow, W. Xu, C.A. Angell, Electrochem. Solid-State Lett. 5
(2002) A26.26] A.K. Padhi, K.S. Nanjundaswamy, C. Masquelier, S. Okada, J.B. Goodenough, J.
Electrochem. Soc. 144 (1997) 1609.27] M. Dubarry, B.Y. Liaw, J. Power Sources 194 (2009) 541.28] M. Winter, J.O. Besenhard, M.E. Spahr, P. Novak, Adv. Mater. 10 (1998) 725.29] C.V. Ramana, A. Mauger, F. Gendron, C.M. Julien, K. Zaghib, J. Power Sources 187
(2009) 555.30] M.A. Roscher, J. Vetter, D.U. Sauer, J. Power Sources 191 (2009) 582.31] I. Bloom, A.N. Jansen, D.P. Abraham, J. Knuth, S.A. Jones, V.S. Battaglia, G.L.
Henriksen, J. Power Sources 139 (2005) 295.32] K. Striebel, J. Shim, A. Sierra, H. Yang, X. Song, R. Kostecki, K. McCarthy, J. Power
Sources 146 (2005) 33.33] C. Forgez, D.V. Do, G. Friedrich, M. Morcrette, C. Delacourt, J. Power Sources 195
(2010) 2961.34] J. Shim, K.A. Striebel, J. Power Sources 122 (2003) 188.35] I. Bloom, S.A. Jones, V.S. Battaglia, G.L. Henriksen, J.P. Christophersen, R.B.
36] Y. Zhang, C.-Y. Wang, J. Electrochem. Soc. 156 (2009) A527.37] M. Morita, Y. Niida, N. Yoshimoto, K. Adachi, J. Power Sources 146 (2005)
427.38] W. Fang, O.J. Kwon, C.-Y. Wang, Int. J. Energy Res. 34 (2010) 107.39] M. Koltypin, D. Aurbach, L. Nazar, B. Ellis, J. Power Sources 174 (2007) 1241.


![310 › doc › dados-tecnicos-alke-ATX310E.pdf · Lítio (LiFePO4) 10 kWh [ horas ] ― Lítio (LiFePO4) 20 kWh [ horas ] ― Lítio (LiFePO4) 10 kWh com recarga rápida [ horas](https://img.pdfslide.net/doc/110x75/5f03abec7e708231d40a334d/310-a-doc-a-dados-tecnicos-alke-ltio-lifepo4-10-kwh-horas-a-ltio.jpg)


![ARTICLE · PEO-LiTFSI-Pyr14TFSI LiFePO4/Li 3.0-4.0 40 160 (After 100cycles) 2014 [1] PEO-LiTFSI-HMOP LiFePO4/Li 2.9-3.8 65 120 (After 100cycles) 2016 [2] PEO-LiClO4-SiO2 LiFePO4/Li](https://img.pdfslide.net/doc/110x75/5f6341156ada9244aa41afe9/peo-litfsi-pyr14tfsi-lifepo4li-30-40-40-160-after-100cycles-2014-1-peo-litfsi-hmop.jpg)