Embed Size (px)
Citation preview
Neil Cummins
Lifespans of the European elite, 800–1800 Article (Accepted version) (Refereed)
Original citation: Cummins, Neil (2017) Lifespans of the European elite, 800–1800. The Journal of Economic History, 77 (02). pp. 406-439. ISSN 0022-0507 DOI: 10.1017/S0022050717000468 © 2017 The Economic History Association This version available at: http://eprints.lse.ac.uk/83576/ Available in LSE Research Online: July 2017 LSE has developed LSE Research Online so that users may access research output of the School. Copyright © and Moral Rights for the papers on this site are retained by the individual authors and/or other copyright owners. Users may download and/or print one copy of any article(s) in LSE Research Online to facilitate their private study or for non-commercial research. You may not engage in further distribution of the material or use it for any profit-making activities or any commercial gain. You may freely distribute the URL (http://eprints.lse.ac.uk) of the LSE Research Online website. This document is the author’s final accepted version of the journal article. There may be differences between this version and the published version. You are advised to consult the publisher’s version if you wish to cite from it.
1
Lifespans of the European Elite, 800-1800
Neil Cummins
Dept. of Economic History, London School of Economics
Acknowledgments
I thank Greg Clark, Morgan Kelly, Alan Fernihough, Cormac Ó Gráda, five anonymous referees and Ann Carlos,
the editor of this Journal, for valuable suggestions. This research would have been impossible without the
incredible genealogical labors of the Church of Jesus Christ of the Latter Day Saints
2
Lifespans of the European Elite, 800-1800
Abstract
I analyze the adult age at death of 115,650 European nobles from 800 to 1800. Longevity began
increasing long before 1800 and the Industrial Revolution, with marked increases around 1400
and again around 1650. Declines in violent deaths from battle contributed to some of this
increase, but the majority must reflect other changes in individual behavior. There are historic
spatial contours to European elite mortality; North-West Europe achieved greater adult lifespans
than the rest of Europe even by 1000AD.
Introduction
Although individual level demographic data before 1538 is sparse we have abundant evidence of the lives of the
European nobility1. This analysis exploits recent mass digitization of family trees to examine trends in elite adult
lifespan over the millennium between 800 and 1800.2 The majority of the sample are from North-West Europe,
but there is substantial representation from all across Europe. Understanding that the sample is heavily skewed,
and that this skew changes over time, I have four principal findings.
First, plague, which afflicted Europe 1348-1700, killed nobles at a much lower rate than it did the general
population. Second there were significant declines in the proportion of male deaths from battle violence, mostly 1 In 1538, Thomas Cromwell orders all churches in England and Wales to keep a register of births, deaths and marriages. Similar rules come
into effect on the continent. These parish registers dominate our understanding of the preindustrial demographic world via the seminal
contributions of Wrigley and Schofield (1981), Wrigley et al. (1997), Henry (1972), Henry and Houdaille (1973), Henry (1978), Houdaille
(1976).
2 Existing demographic studies of Europe‟s aristocracy included Hollingsworth‟s‟ analysis of the British Ducal families and peerage, Peller‟s analysis of
Europe‟s ruling families and Levy and Henry‟s analysis of French nobility (Hollingsworth (1957, 1964, 1975, 1977), Peller (1965), Levy and Henry (1960)).
3
before 1550. I am able to estimate, from the timing of deaths within the year, the fraction of males who died
violently in each epoch. Before 1550, 30% of noble men died in battle. After 1550, it was less than 5%.
Third finding there was a common upwards trend in the adult lifespan of nobles even before 1800. But
this improvement was concentrated in two periods. Around 1400, and then again around 1650, there were
relatively sudden upwards movements in longevity. In England and Wales, for example, the average age at death
of noble adults increased from 48 for those born 800-1400, to 54 for 1400-1650, and then 56 for1650-1800. This
rise is independent of the fall in violent battle deaths. Finally, I find that there were regional differences in elite
adult lifespan favoring northwest Europe, that emerged around 1000 AD. While average lifespan in England in
1400 was 54, in Southern Europe, as well as in Central and Eastern Europe, it was only 50. The cause of this
geographic „effect‟ is unknown.
The paper is complimentary to recent work by David, Johansson and Pozzi (2010) and de la Croix and
Licandro (2012). 3 David, Johansson and Pozzi (2010) use Alison Weir‟s genealogy of the British Royal family to
explore the evolution of life expectancy between 1500 and 1799. de la Croix and Licandro (2012) use a data-set of
over 300,000 famous people from the Index Bio-bibliographicus Notorum Hominum examine the long time trend
in lifespan.4
3 Fire and Elovici (2013) is similar in terms of data collection strategy. (See online appendix for details.)
4 They argue that average age at death was stationary until the birth cohort of 1640. However, they omit any analysis of the time-trend in lifespan before the
15th century. They only estimate trends post-1430 (2012 figure 6, p.15). My analysis examines trends beginning over six centuries before either David,
Johansson and Pozzi (2010) or de la Croix and Licandro (2012).
4
Data
The Sample: The Family Trees of Europe’s Elites
The elites studied here are aristocrats and nobles. Aristocracies are a hierarchical hereditary ruling class,
hereditary monarchies have dominated European politics for most of the past millennium. Nobles are individuals
connected to „notable‟ families who may or may not be aristocrats but who held status that conferred economic
and legal privilege (Bush 1983).5 Of course, hereditary often determined the transmission of these privileges. The
family trees of Europe‟s elites connected members by blood and matrimonial lines. Entry into the sample studied
here consists of an individual being recorded in a noble family tree that has been digitized by the church of Jesus
Christ of the Latter Day Saints (LDS).
„Baptism for the dead‟ is a doctrine of the LDS church.6 The founder of the LDS church, Joseph Smith,
revived the practice in 1840 and ever since, church members have been collecting historical genealogical data.
The church has been at the frontier of the application of information technology to genealogy and has digitized a
multitude of historical records. Today they make their research available online at familysearch.org. The records
number in the billions. The source of the family trees used here are the online databases at
histfam.familysearch.org, a collaboration between the LDS church (familysearch) and individual genealogical
experts.
The individual data were originally transcribed from published works such as Burke and Burke‟s (1881a)
“A Genealogical and Heraldic Dictionary of the Peerage and Baronetage”, “An Official Genealogical and
Heraldic Baronage of England” Paget (1957) and Boyd‟s (1954) “Pedigrees with index of London citizens, abt.
5 In practice the terms aristocrat and noble are used interchangeably.
6 The practice is mentioned in the Bible (Corinthians chapter 15, verse 29, The Holy Bible King James Version (2014)).
5
1600-1800”, numerous other published genealogical works, guild records, census records, parish registers, wills
and other published family genealogies. Boyd and Burke and Burke are the leading sources providing 295,892
and 127,269 records respectively, followed by de Sainte-Marie and de Sainte-Rosalie (1728) with 73,723 records
and Schwennicke (2005) 70,835.7
Noble status was indicated by the presence of a suffix or title and each was assigned to one of 17 noble
ranks. Nobles are ranked in rough order of prestige: the ranking is inferred from general sources such as Doyle
(2010) and also Burke and Burke (1881b). The most elite title was Emperor (rank 1) of which there are 94 in the
final adult lifespan subsample analyzed in this paper. There are 843 Kings (rank 2) and 422 Grand/Archdukes
(rank 3). 1,598 dukes, 683 prince/prince-electors, 4,787 Earls and Counts, 2,262 Marquesses and Margraves, 986
Viscounts, 6,444 Barons and Lords, 5,968 Baronets and 3,321 Knights constitute ranks 4-11. Esquires and
Gentlemen along with other lesser noble titles, 1,795 persons, were assigned to group 12. A „Geographic‟ title
(rank 13) was one of the 699 cases where a person was listed as “of” a certain specific location. There were 69
military titles such as Captain and Colonel (rank 14) and 692 religious titles (rank 15, including 12 popes and 533
nuns). Occupational titles accounted for 1,343 (rank 16) and 83,644 had no suffix (rank 17). Those with no suffix
represented the non-titled family members of the elite family trees.
Reliability, Coverage and Representativeness
Family trees are an under-utilized resource for academic research, perhaps related to the difficulty of making the
records amenable for statistical analysis. The family tree records used here contain 402,204 unique date
descriptions. The entries are inconsistent, of varying quality, and sometimes refer to different calendars at
different points in time. I have standardized all of these dates to decimal values of years, using random attribution
7 The complete list of the 3,117 sources is available from the author. The ten family tree collections used here are summarized in appendix table 13.
6
for missing months and days. Each birth and death value was assigned a „quality‟ score from 1 (exact) to 4 (a 1-5
year range). This process is described in detail in the online appendix. Of the 1,329,466 individual records,
167,266 have a birth year with an age at death between 800 and 1800. Of those, 115,650 have an age at death over
20 and 76,403 have a specific day of death.
***Figure 1 about Here***
A variation on the widely used concept of age heaping can be applied to the final sample of 115,650 to
gauge the precision of the recorded birth and death years. Ten percent of years should end in any specified digit.
Where years are attributed we should expect to detect this by a higher proportion of years ending in “0” or “5”.
Figure 1 reports these proportions for the noble sample. Surprisingly, death years (and birth years ending in “5”)
exhibit no significant heaping over the 1,000 year sample period. Birth years exhibit severe heaping in the earlier
centuries evident in heaping solely around “0”. This declines consistently between 800 to 1800. If rounding is
non-random this will bias the age at death estimates. To help attenuate this possible bias I include a dummy for
birth years that end in “0” in the analysis.
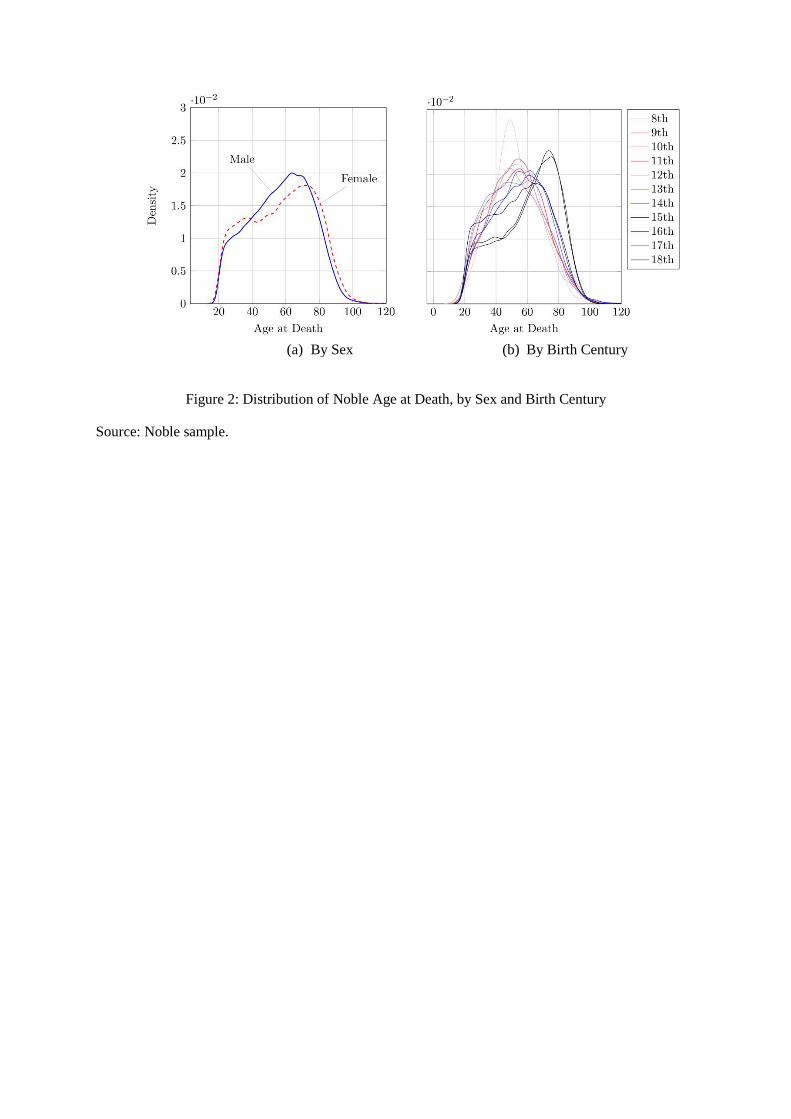
How reliable are these data? We can examine the distributions of age at death by period and see if
fantastical ages are being attributed or if some average is just blankly applied. This does not appear to be the case.
As shown in figure 2, the basic shapes of these distributions seem to reflect a fairly consistent underlying pattern.
It does not appear that some different process, for example, speculative guesswork is driving the pattern before
the 16th century, where we know the data are much better (and can be corroborated with parish records etc.).8 The
8 However, the unusual shape of male age at deaths (where the mean seems to cluster about 50) in the 8th century is perhaps suggestive of
some attribution, but the sample size is relatively small here and the pattern does not seem to be any different for women.
7
connection of each individual record to its source(s) is a sign that at least the digitization and collation is of a
tractable design.9
***Figure 2 about Here***
There are 117,975 variations of locations of birth, marriage and death attached to the full family tree data-
set. Each location has been Geo-coded for longitude and latitude, described in detail in the online appendix. Table
1 reports the geographic composition of the sample over time. The sample is heavily skewed towards later
centuries and England and Wales. The sample reflects the existence of noble family trees, their historical survival
and the interest of genealogists and LDS church members in the English speaking world. At the same time, there
are significant numbers of nobles in the sample from earlier centuries and the South and East of Europe, but from
1700 the sample is dominated by Great Britain, Ireland and France. Nevertheless, the sample is relatively unique
in terms of its temporal and spatial coverage.
***Table 1 about Here***
The composition of the data do not reflect the composition of Europe‟s population being an extremely
elite subsection. This paper thus makes no claims about the general population, just this elite sub- section. The
nature of the selection undoubtedly changed over time. We don‟t know how an individual born in 850 makes it in
to the data versus someone born in 1650? The family trees artificially select for „successful‟ offspring and
ancestors, neglecting the „failures‟. However, as the standing of each member of the family is recorded via a
suffix, selection based on success is directly observed. Thus I can control for the changing exclusivity of the
sample over time.
9 By making the underlying analytical data freely available via ICPSR I also invite other scholars to replicate my analysis here.
8
There are other selection issues. Omission is serious. For example, there are more men recorded than
women, and before 1500 there is under representation of infant and child deaths. I argue, however, that this
genealogical data is amenable for scientific analysis because, firstly, the variable of prime interest, age at death,
can be restricted to those dying at age 20 and over. Second, the nature of the changing composition of the sample
is directly observed and this can be controlled for in the analysis (e.g. sex, suffix, data type, family tree and
geographic composition).
Methodology
Here I detail the empirical strategy used to characterize trends in adult lifespan amongst European nobility from
800 to 1800. As a quasi-robustness check, I first examine the data as a detector for the well-known years of
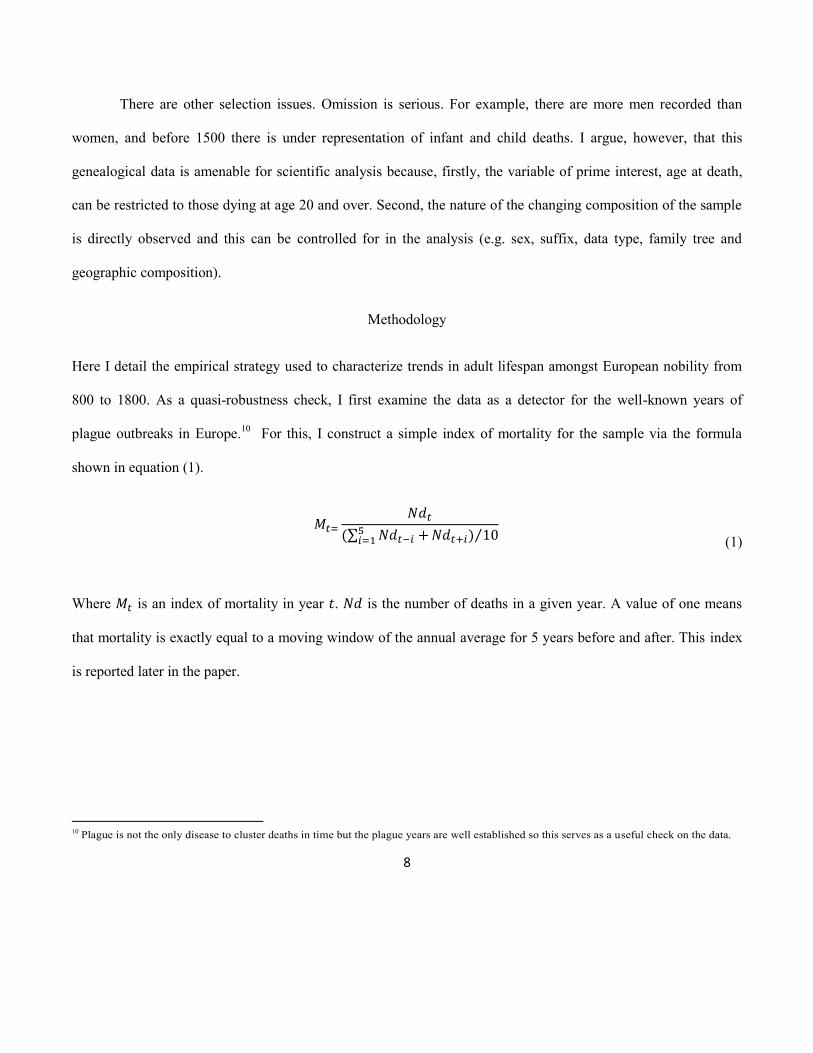
plague outbreaks in Europe.10 For this, I construct a simple index of mortality for the sample via the formula
shown in equation (1).
∑ ⁄
(1)
Where is an index of mortality in year . is the number of deaths in a given year. A value of one means
that mortality is exactly equal to a moving window of the annual average for 5 years before and after. This index
is reported later in the paper.
10 Plague is not the only disease to cluster deaths in time but the plague years are well established so this serves as a useful check on the data.
9
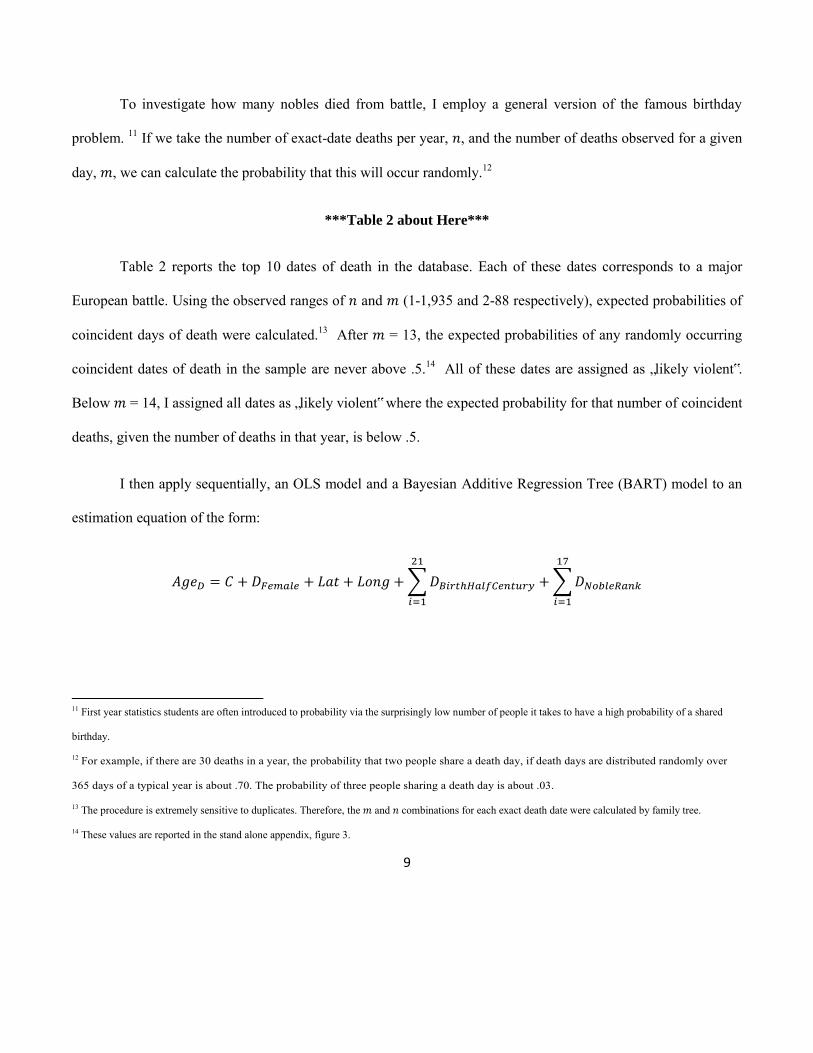
To investigate how many nobles died from battle, I employ a general version of the famous birthday
problem. 11 If we take the number of exact-date deaths per year, , and the number of deaths observed for a given
day, , we can calculate the probability that this will occur randomly.12
***Table 2 about Here***
Table 2 reports the top 10 dates of death in the database. Each of these dates corresponds to a major
European battle. Using the observed ranges of and (1-1,935 and 2-88 respectively), expected probabilities of
coincident days of death were calculated.13 After = 13, the expected probabilities of any randomly occurring
coincident dates of death in the sample are never above .5.14 All of these dates are assigned as „likely violent‟.
Below = 14, I assigned all dates as „likely violent‟ where the expected probability for that number of coincident
deaths, given the number of deaths in that year, is below .5.
I then apply sequentially, an OLS model and a Bayesian Additive Regression Tree (BART) model to an
estimation equation of the form:
∑ ∑
11 First year statistics students are often introduced to probability via the surprisingly low number of people it takes to have a high probability of a shared
birthday.
12 For example, if there are 30 deaths in a year, the probability that two people share a death day, if death days are distributed randomly over
365 days of a typical year is about .70. The probability of three people sharing a death day is about .03.
13 The procedure is extremely sensitive to duplicates. Therefore, the and combinations for each exact death date were calculated by family tree.
14 These values are reported in the stand alone appendix, figure 3.
10
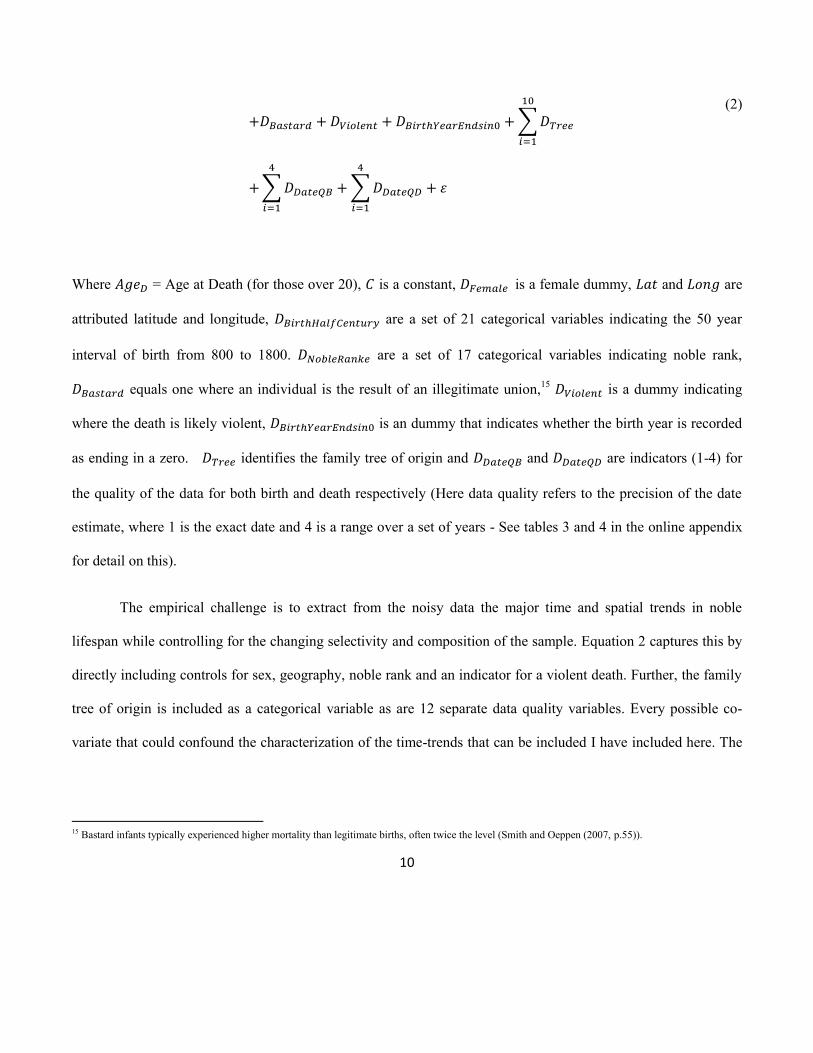
∑
(2)
∑
∑
Where = Age at Death (for those over 20), is a constant, is a female dummy, and are
attributed latitude and longitude, are a set of 21 categorical variables indicating the 50 year
interval of birth from 800 to 1800. are a set of 17 categorical variables indicating noble rank,
equals one where an individual is the result of an illegitimate union,15 is a dummy indicating
where the death is likely violent, is an dummy that indicates whether the birth year is recorded
as ending in a zero. identifies the family tree of origin and and are indicators (1-4) for
the quality of the data for both birth and death respectively (Here data quality refers to the precision of the date
estimate, where 1 is the exact date and 4 is a range over a set of years - See tables 3 and 4 in the online appendix
for detail on this).
The empirical challenge is to extract from the noisy data the major time and spatial trends in noble
lifespan while controlling for the changing selectivity and composition of the sample. Equation 2 captures this by
directly including controls for sex, geography, noble rank and an indicator for a violent death. Further, the family
tree of origin is included as a categorical variable as are 12 separate data quality variables. Every possible co-
variate that could confound the characterization of the time-trends that can be included I have included here. The
15 Bastard infants typically experienced higher mortality than legitimate births, often twice the level (Smith and Oeppen (2007, p.55)).
11
resulting coefficient estimates on the set of birth period dummies can, therefore, be interpreted as representing the
controlled time trend.
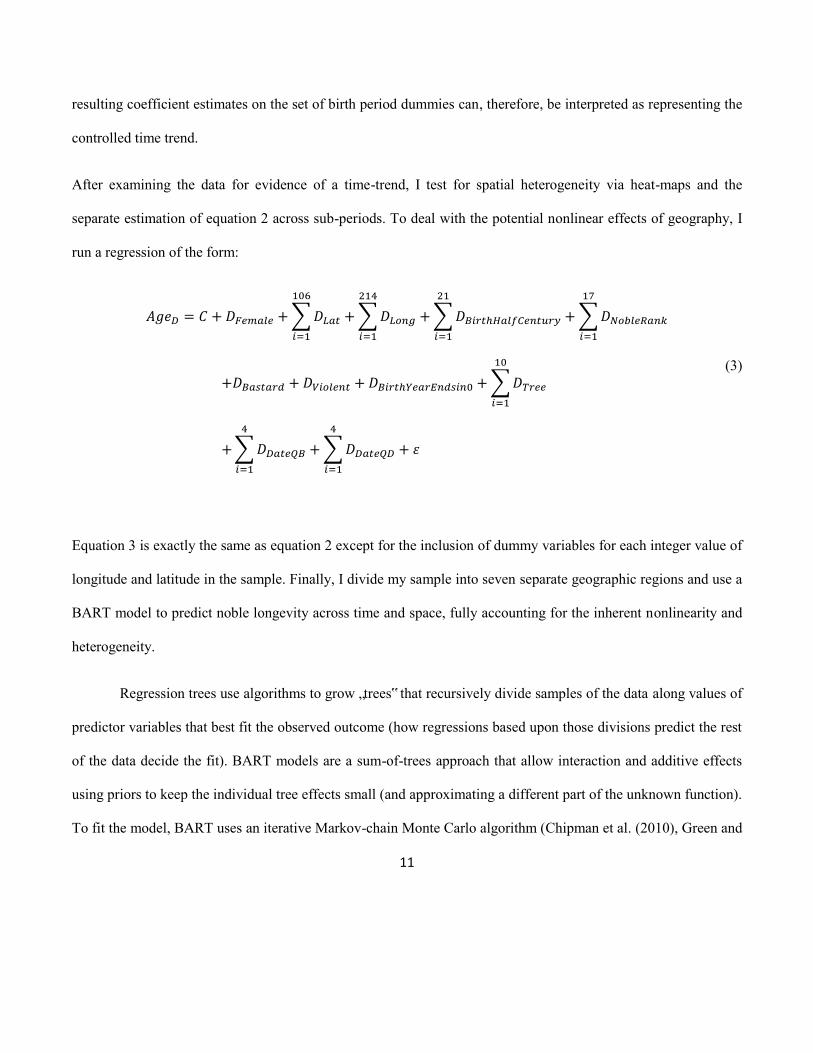
After examining the data for evidence of a time-trend, I test for spatial heterogeneity via heat-maps and the
separate estimation of equation 2 across sub-periods. To deal with the potential nonlinear effects of geography, I
run a regression of the form:
∑
∑
∑ ∑
∑
(3)
∑
∑
Equation 3 is exactly the same as equation 2 except for the inclusion of dummy variables for each integer value of
longitude and latitude in the sample. Finally, I divide my sample into seven separate geographic regions and use a
BART model to predict noble longevity across time and space, fully accounting for the inherent nonlinearity and
heterogeneity.
Regression trees use algorithms to grow „trees‟ that recursively divide samples of the data along values of
predictor variables that best fit the observed outcome (how regressions based upon those divisions predict the rest
of the data decide the fit). BART models are a sum-of-trees approach that allow interaction and additive effects
using priors to keep the individual tree effects small (and approximating a different part of the unknown function).
To fit the model, BART uses an iterative Markov-chain Monte Carlo algorithm (Chipman et al. (2010), Green and
12
Kern (2012)). Here age at death can be modeled as the outcome of the predictor variables listed in equations 2 and
3 (denoted as ). The unknown function is approximated by regression trees of structure with terminal node
parameters (leaves) :16
(4)
The advantages to using this methodology is that it allows for model free variable selection (each variable
can be assessed in terms of its predictive importance), no assumptions about functional form and the ability
to incorporate heterogeneous, interactive and additive effects. For the description of noble longevity across
one thousand years and ten million square kilometers, the choice of this approach seems appropriate.17
Table 3 presents the summary statistics for the empirical analysis conducted in the next section. The mean
observation in the sample is linked to two sources and was born half way through the year in 1610 and dies at age
57. The average longitude and latitude is a field 30 miles directly south of London. The sample is 65% male.
***Table 3 about Here***
Results
Dance of Death
Recent estimates of the lethality of the Black Death suggest a toll of 50 million, or about 60% of Europe‟s
population (Benedictow (2004, p.383)). Emerging from the East in 1346, plague remained in Europe until at least
16 See Kapelner and Bleich (2013, p.3). Birth year is included instead of period dummies.
17 The model was estimated in R using the bartmachine package Kapelner and Bleich (2013).
13
1815.18 Despite the vast difference in death rates between the Black Death and modern outbreaks of bubonic
plague, genetic and molecular testing has revealed that the cause of both is the bacillus Yersinia Pestis (Raoult et
al. (2000), Haensch et al. (2010), Schuenemann et al. (2011)).
***Figure 3 about Here***
Figure 3 plots the simple mortality index described by equation 1 from 1200-1800. The plague years are
immediately obvious. There are no years in the 13th century where , mortality expressed relative to an average
of mortality 5 years before and after a given year, exceeds 2. After the arrival of the Black Death, there are 8 years
when the number of deaths is more than double what we would expect: 1349, 1361, 1369, 1415, 1513, 1563, 1603
and 1625 and 5 years when is over 1.5: 1375, 1471, 1540, 1593 and 1665.19 Each year, apart from 1415,
correspond to well-known plague episodes (Biraben (1975)).20 The battle of Agincourt took place in October
1415.
The results suggest that plague mortality was lower for the elites – at least compared to existing studies on
urban populations. Testaments were 21 times normal in urban Tuscany and Umbria in 1438, burials were almost
30 times normal in Siena during the plague year of 1363 (Cohn (2002), p.201-2). The highest levels of crisis
mortality in figure 3 are significantly below those for 17th century London, where plague mortality has recently
been measured at 5-6 times normal mortality but never killed more than 20-25% of the city's population
18 According to Cohn (2008), the last Western European plague was at Noja (near Bari in Italy) in 1815. Plague may have persisted in Eastern Europe until
1897. See also Alfani and Murphy (2017) for a review of plague mortality.
19 There are three years in the 13th century where > 1.5; 1230, 1242 and 1265. It is not clear (by eyeballing the individual observations) why mortality
spikes in these years (it may be attributable to heaping and small numbers).
20 The plague of 1361 has a deadlier impact than the first outbreak of 1349 - a feature also reported for England by Nash (1980).
14
(Cummins , Kelly and Ó Gráda (2015))21. Further, the simple mortality index suggests that plague mortality was
consistent from the Black Death until its disappearance; shocking mortality to between 1.5 to 2 times normal for
this elite section of Europe's population.22 Nobles had the means and the resources to flee cities when plague
broke out.23 Indeed no English royal died from plague after 1500 (Johansson (2010), p.24). However, this pattern
can only represent a lower bound, because where complete lineages were wiped out, they would be less likely to
survive into family trees compiled centuries later.
.
***Figure 4 about Here***
In Figure 4, I report the frequency of month of death for those records where the month of death is
recorded (data quality codes 1 and 2). The impact of the global plague pandemic, starting with the Black Death in
1346 is again evident from the changing seasonality of deaths. In particular, the 1300s have a distinctive summer
peak. Over time, the trend is for a disappearance of this summer peak.
A stylized fact of the Black Death was its indiscriminate nature. Cohn (2002, p.213) quotes the chronicler
of Cologne, the monk Albert:
there was no disparity in sex or age, taking men, women, the old, the young, plebs and
nobles, paupers, the rich and powerful, priests and the laity
21 Nobles could be either urban or rural, or both and mobile.
22 The lighter impact of plague on nobility is consistent with Kelly and Ó Gráda (2014).
23 This is precisely the scenario of Boccaccio's The Decameron (completed in 1353).
15
The family tree data used here suggest otherwise: Black Death noble mortality was mild relative to that estimated
for the rest of the population. Yet, how could plague discriminate within the noble family tree data? Using the
distinctive summer peak of plague deaths and the fact that the plague years are well known, a dummy variable
( ) was coded for death during a plague period (June-September) in any one of the plague years listed
above. A logistic regression was run of the form;
∑
(5)
where the notation is as equation 2. The data is restricted to the boundaries of the significant plague years
recorded in the data, 1346-1666. Further, the model is run twice; once including a control for a violent death and
once for those deaths that were not violent.
***Table 4 about Here***
The results are detailed in table 4. There are no consistent geographic or noble rank effects. The Black
Death and subsequent plagues were discriminately indiscriminate. Surprisingly, it appears that noble women
faced an increased probability of a plague death. The result is significant and large in all model formulations. The
lowest estimated effect in model two suggest that noble women faced an odds ratio of 1.16 relative to noble men
for the risk of dying in one of the major plague seasons.24 The misattribution of some violent deaths at Agincourt
in 1415 to plague could only be expected to bias the analysis against this result. The regression also indicates that
older people were more likely to die during the summer plague season.
24 Odds ratios were calculated using Fernihough (2011). For , they are 1.18 (.05), 1.16 (.06) and 1.26 (.09) for columns 1-3 respectively in the results
table (standard errors in parentheses). For this subsample, the proportion female was .40.
16
A History of Violence
European nobility specialized in the execution of violence. We can expect that a large proportion, especially of
the men, died in battle. But can we know if an individual in the data dies from violence in this way? Where the
individual has a specific date of death (an exact day), we can link that date to a list of all known battles in
European history. However, many battles have been lost from history‟s memory. The genealogical records of
noble deaths themselves may be the only remnant of forgotten skirmishes.
***Figure 5 about Here***
Figure 5 reports the time-path of an index of violent deaths, calculated using the algorithm described in
the previous section, averaged over family tree and death half century.25
A useful, endogenous test of this procedure is to examine the ‟violent‟ deaths by sex. The assignment
algorithm does well because I find that women were far less likely to die in battle. Female violent deaths are much
lower than male violent deaths and exhibit no trend over time. However, they are also non-zero. 26 In order to
examine the determinants of a violent death from battle and to calculate a controlled time trend I run a logistic
regression of the form:
25 The index was calculated for each family tree, where possible. However, the family tree data set for Leicester, Long Clawson gave perverse results, e.g.
nearly 32% of females dying violently (based on this procedure). This was because Long Clawson was a relatively small parish and all the death dates were
actually burial dates. Therefore, the tendency for burials to be clumped in smaller parishes resulted in a misattribution of these deaths to violence. Long
Clawson, family tree id number 6 was therefore dropped from the analysis here.
26 Non-violent coincident death dates will also be captured by this exercise. For example, the sinking of the White Ship in the English channel on 25
November 1120. The ship sank after hitting a submerged rock and the tragedy ended the lives of 300 of the Anglo-Norman elite including William Ætheling,
the heir to the English throne (Vitalis (1856) p.34-5)
17
(6)
Where the notation is as equation 2 and is the year of death. In Table 5, I report the determinants of a violent
death for those who have an exact death date.27 Being a female and time reduce significantly the chances of a
violent death. Latitude but not longitude matters too. A violent battle death is more probable the further North a
noble originates. Figure 6 describes the time path of predicted violent battle deaths, there is a sharp decline from
1500 to 1600. The trend corresponds closely to that reported by Hollingsworth (1957, p.8) for the English Ducal
families.
***Table 5 about Here***
***Figure 6 about Here***
A confounding factor in calculating violent deaths in this way is the sudden return of plague to Europe in
the 14th century. However, the principal result that violent deaths from battle decline for the nobility is robust, as
this occurs during exactly the period when we would expect the wave of plagues to bias this violent death index
upwards.
27 Table 15 in the appendix reports the noble rank effects. It is notable that military suffixes are associated with a higher risk of dying from violence
(although the standard error is large), and religious occupations are significantly negative associated with a violent death.
18
Trends in Lifespan Over Time
In table 6 I report the results of an OLS regression of equation 2 on the noble sample.28 As a verification of the
violent battle death calculation in the previous section, the coefficient on has a strong negative effect of
about 7 years. Geography matters too, with a strong effect of latitude and longitude on noble adult age at death in
both models. The coefficients suggest a significant positive effect on years lived for nobles from the North-West
of Europe.
***Table 6 about Here***
***Figure 7 about Here***
Crucially all the data quality variables matter both in term of their economic and statistical significance
but also in their effect on the other variables in the regression. The positive effect of having a birth year end in
zero is possibly a result of downward assignment of unknown birth years to the known decade of birth, someone
born in 1216 was perhaps more likely to be assigned to born c.1210 than to c.1220. Any time trend conclusions
must account for this resulting positive upward bias in the age at death for those with birth years ending in zero.
The noble rank effects from the regression in table 6 are shown in figure 7. Individuals with a noble suffix
are more likely to die older (almost 4 years older for ranks 7, 9, 10-13, 15 and 16). Unsurprisingly, those with a
military suffix (rank 14) die younger (although the standard errors here are large). I also find that Emperors and
Kings die around 2-3 years younger than non-nobles.
***Figure 8 about Here***
28 Median regression was also performed but the trends were similar across the adult age at death distribution so the results are not presented here.
19
Figure 8 (a) reports the expected noble adult age at death for each 50-year birth period from 800 to 1800.
The 95% confidence intervals are too wide to allow over-interpretation of any trends in noble longevity before
1400 but from 1350 to 1500 there does appear to be a sudden and sharp uptick in noble longevity, from a mean of
around 50 to 55. From 1500, predicted lifespan declines until around 1650 where an uninterrupted rise begins. At
the same time, noble lifespan exhibits significant oscillations across the millennium 800-1800.
This estimate of adult noble lifespan „dummies‟ out the effect of a violent battle death. To incorporate the
contribution of the decline in violent battle deaths (figure 6) to noble longevity, I use the predicted age at death,
for men, from equation 2 and set to 0 and to 1. This allows us to bound predicted longevity between two
extremes, everyone dying in battle and no-one dying in battle. These bounds are reported in figure 8 (b), with the
difference between the two series being equal to the coefficient of from table 6, 7.2 years. Next I
calculate what average age at death would be without any decline in violence, a pre-decline average of 32% of
deaths from battle. This can be compared to the average age at death calculated in the same way but now using the
observed proportion of men dying from violence, as is done in figure 8 (b). The decline of battle violence is
responsible for an extra 2 years of average elite adult male lifespan after 1500. It is not however driving the uptick
in noble longevity around 1400 nor around 1650. Some other set of factors must be responsible for these two
breaks.
Table 6 reported a large and significant positive effect of birth-year heaping on elite adult longevity which
could be confounding the estimates presented here. Two considerations suggest that this is not the case. Firstly,
individuals with birth years ending in zero are directly observed and this effect is controlled for in the regression.
However, a simple categorical variable could fail to capture changes over time in this effect. For the purposes of
the time-trends estimated, this means that we are likely over-estimating longevity earlier, by failing to fully
20
control for the over-attribution of individuals to „zero‟ years. The bias this imparts is against the trends presented
meaning that increases in longevity after 1400 and 1650 are potentially even larger than estimated.
Trends in Adult Noble Lifespan across space and time
The geographic composition of the sample is heavily skewed towards North-West Europe, France and England.
However, there are large numbers of nobles from Southern and Eastern Europe. The results from table 6 suggest
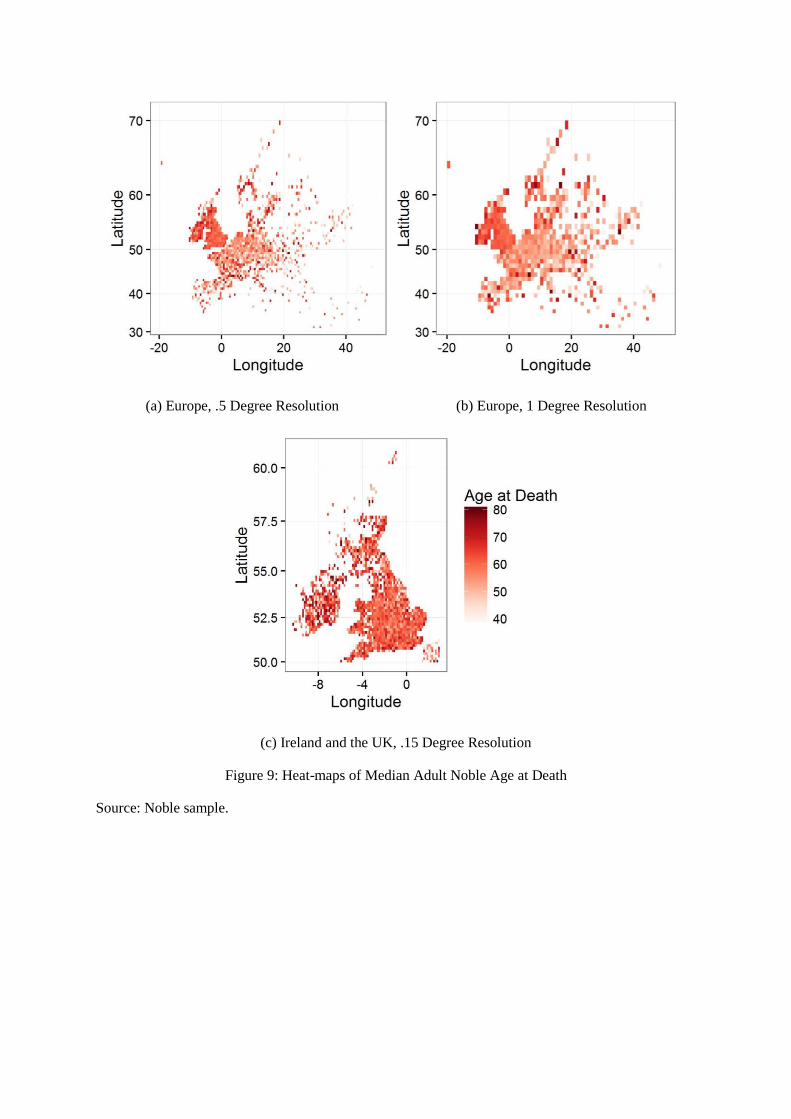
that geography had large and significant effects on adult noble lifespan. Figure 9 plots heat-maps of median
lifespan (over age 20) by geographic coordinates. The pattern is easiest to detect in panel (b) where the median is
calculated over integer longitude and latitude coordinates. Length of noble life follows a strong South-North,
East-West gradient with nobles in the North-West living longer lives than those in the South-East.
***Figure 9 about Here***
To examine whether this geographic „effect‟ is constant over time, I estimate equation 2 by sub- period.
See table 7. The standard errors on latitude and longitude are too large for us to be sure of any real „effect‟ before
the first millennium but the coefficient estimates are suggestive. Geography matters quantitatively and statistically
in all periods after 1000. The effects are strongest in the 1340-1500 period. It is notable that even in the pre-Black
Death era this correlation is present. Whilst the compositional bias of the sample and its elite nature rule out
conclusive findings on this geographic „effect‟, the observed correlations are interesting and unexpected.
***Table 7 about Here***
To determine how large these geographic „effects‟ are I estimated equation 3 (allowing dummy values for
each integer value of longitude and latitude in the data). This fully controlled „effect‟ of geography, along with
95% confidence intervals is reported in figure 10. The „effect‟ is broadly linear. However, the confidence intervals
21
are a lot tighter along South-North axis than East-West. The size of the „effects‟ are large - from around 2 years
(along latitude) and roughly 4 years (along longitude).
***Figure 10 about Here***
As the sample is heavily weighted towards the North-West of Europe, it is possible that this geographic
„effect‟ is a result of North-Western elites dying on the frontier in forgotten battles. As a test,I re-estimate table 7
but this time use latitude and longitude of birth only (this is reported in the online appendix). The scale and
direction of these coefficients reinforce the pattern described for the earlier centuries. However, the latitude
effects after 1700 are no longer statistically significant. Despite this, it is clear that pre 1700, and for all periods
for longitude, there are historic geographic contours to European elite mortality that are not explicable through
violence or death on the frontier.
Time Trends in Adult Noble Lifespan by Region
Finally, I ask if there are different time-trends in noble lifespan in different regions of Europe. A BART model is
estimated based on equation 4. Figures 11 and 12 report predictions of adult noble lifespan for each of the seven
European regions from table 1.29 Predicted lifespan is stationary everywhere before 1400 where, just as with the
OLS estimates (see figure 8), lifespan suddenly rises. There is heterogeneity within Europe after 1400; in
Scotland, Ireland and England and Wales, lifespan rises from under 50 almost 55. In Central, Southern and
Eastern Europe the post-1400 rise is present too but from a lower base: about 46 to just over 50 years. As a trend,
the post-1400 rise in elite lifespan appears to be a European-wide occurrence. Everywhere in Europe, the modern 29 The top three variables in the BART model (by average variable inclusion proportions across 100 models) are birth year, longitude and latitude. See figure
5 in the appendix.
22
sustained increase of longevity originates around 1650 for European nobility. The impact of the thirty years war is
evident in figure 12. The two time-series estimation strategies - OLS and BART - agree on the path of European
elite longevity between 800 and 1800.
***Figure 11 about Here***
Discussion
This study has characterized adult noble lifespans from 800 to 1800. The consistent and large association
uncovered between sex and plague mortality for nobles runs counter to the indiscriminate reputation of the Black
Death and counter to recent paleodemographic analysis on skeletons from 14th century London (DeWitte
(2009)).30 If plague killed more women than men, a simple supply-side effect increasing female agency in the
marriage market could explain the origin of the European Marriage Pattern (Hajnal (1965), De Moor and Van
Zanden (2010), Voigtländer and Voth (2013)). Of course this is a premature speculation, the patterns reported
here would have to be established convincingly for the population at large.
The sharp decline in the proportion of male nobles dying from battle, from over 600 years of a steady
30%, to less than 5% in the 16th century, predates the arrival of the Industrial Revolution by two centuries. The
long run decline in violence is cited as one of the principal correlates of the emergence of the modern World with
the „civilizing process‟ needed the transformation of warrior nobles into gentleman courtiers (Elias (1982)). 31
One can perhaps ask why did battle-field violence decline among European nobility. Nobility certainly
did not lose its taste for military life. The Wars of Religion following 1500 were aristocratic feuds at least as
30 However, the fact that older people faced a higher probability of death from plague is consistent with DeWitte (2010).
31 As evidenced by Gurr (1981), Eisner (2003), Clark (2007) and popularized recently by Pinker (2011).
23
much as earlier wars.32 However, the decline in battle-field death amongst nobles corresponds to the emergence
of modern warfare; artillery, standing armies and the replacement of privilege with merit.33 The power of
hereditary warrior status declined in battle as modern and larger standing armies, led by increasingly wealthy
princes, focused upon artillery and infantry (Keen (1984, p.1, 238-53)). The decline of cavalry meant that nobility
became officers, inherently a more administrative role than before (Keen (1984, p.240)). In war, nobility still led;
but from the safety of the rear guard, not the front lines.34
I estimate the time-trend of adult noble lifespan over the millennium between 800 and 1800. The findings
on the timing of the modern rise in age at death agree almost exactly with de la Croix and Licandro (2012) (the
birth cohort of 1640-9). The nobility are, in general, forerunners of Europe‟s mortality transition as David,
Johansson and Pozzi (2010, fig. 3(a) and 3(b), p.28) argue too. 35This may provide a clue for those who seek to
explain why mortality declined. There could be an important role for individual behavior and a demonstration
effect (e.g. hygiene and other behavioral traits) as this rise predates modern medicine or any public health
32 The „master generals‟ of the 30 years war – Gustavus Adolphus, Wallenstein and Tilly were all of noble descent.
33 Oliver Cromwell noted “I (would) rather have a plain russet-coated captain of horse that knows what he fights for and loves what he knows, than what you
call a gentleman” (Koch (1981, p.52)). After 1500, the “officers…commanding units. very usually men of coat-armour, but they were officers not because of
their coat-armour but because of their office”‟ (Keen (1984, p.243)).
34 The decline in noble battle-field violence correlates with changes noted by other scholars. For example, Dewald states “By the 1550s, litigation had begun
to replace violence in the settlements of local disputes” (1996, p.116). Further, Keen notes the decline of jousting and the disappearance of heraldic banners
from the battle-field - all during the 16th century (1984, p.243, 248). In the 1630s, Henri de Rohan writes “Most states today are founded rather on
administration than on war, and try to maintain themselves rather than to grow. As a result, we have seen letters flourish and arms decay” (as quoted by
Dewald (1996, p.66)).
35 However, the timing of the general rise of adult lifespan in England and Wales has been dated by others to the mid 17th century suggesting a roughly
simultaneous rise of elite and average longevity there (around about 1700 as reported by Smith and Oeppen (2007, figures 4.5 and 4.6, p.71)). This feature
would suggest a closer connection between aristocratic lifespan and that of the general population driven by mechanisms such as the overall disease climate -
driven by the improvements in nutrition (McKeown, 1976, p.139-42).
24
measures. It also predates the Industrial Revolution.36 Whilst modern evidence suggests that life expectancy does
not matter for economic growth (Acemoglu and Johnson (2007)), the case has not been proven for the
preindustrial era.
Unlike de la Croix and Licandro (2012), this study argues that lifespan was not a stationary trend before
1650. There are significant oscillations, most importantly the sharp Europe-wide rise in noble lifespan after 1400.
The rise is stronger over the 1400-1600 interval in Ireland, Scotland and in particular, England and Wales (figures
11 and 12). This pattern has remained hidden. Only long and deep time series of at least a millennium in length
could uncover it. For England, this result can be directly compared with existing estimates of adult mortality. The
dramatic rise from the 14th to the 15th and 16th centuries revealed in figure 12 (a) is in broad accordance with
Russell‟s estimates of life expectancy at age 25 (e25) for tenants-in-chief of the crown from the Inquisitions Post
Mortem (Smith (2012), figure 10, p.79). However, recent re-estimates of e25 for these same data (Poos et al.
(2012)) suggest a much higher level and a flat trend, at about 30 years, during the 14th century. Monastic
evidence from communities in Durham, Canterbury and Westminster points to a decline in e25 from 1450 to 1500
(Poos et al., 2012, figure 8.2, p. 162). This is not the pattern I find. Figure 12 (a) reports the opposite trend for the
English elite: a sharply rising trend in predicted average age at death, for those dying over 20, from 1450-1500.
The evidence I have assembled and analyzed in this paper strongly suggests a strong improvement in lifespan in
the 15th century for the English elite.
No conclusions can be drawn as to why adult noble lifespan increased so much after 1400. No known
medical innovations in Europe before 1500 could be responsible.37 Nutrition, in terms of calories consumed, also
cannot explain this rise. These elites could be expected to have always filled their bellies. For this reason, those
36 It is also striking how the post 1600 rise is weaker in Central and Eastern Europe, and Southern Europe (figures 11 and 12).
37 There are virtually none (see Johansson (2010, figure 3) based on Sebastian ed. (2000).
25
who argue that the „modern rise of population‟ was a result of nutrition, the equality of aristocratic and peasant
lifespans in the past has presented a paradox (see Fogel (1986, p.480-4) and McKeown (1976, p.139-42)). Robert
Fogel attributed this „peerage paradox‟ to the vast quantities of alcohol the English elite consumed (1986, p.483).
Perhaps diet changed in other ways. The late 14th century did witness an increase in the proportion of manuscripts
on health.38 Works such as the Tacuinum Sanitatis, incorporating Arabic and Ancient knowledge, recommended
moderation in food and alcohol, adequate rest and exercise and, similar to modern medicine, emphasized the
importance of vegetables and fruit to human health (Janick et al. (2010)). Of course, the actual effect of these
manuscripts is speculation at this point.
The rise in elite adult age at death for those born after 1400 could also be the result of a Darwinian
selection effect from the half century of recurring plague that returned in 1347. Plague killed those susceptible to
plague but would also have purged the population of other frailties that may have been correlated with plague
susceptibility.39 However, most people, even during the plague era, died from other causes.40 The real long-term
demographic effect of the Black Death could have been through its effect on the disease climate. Noble lifespan in
figure 8 corresponds closely to the trend in real wages in England (Clark (2005, fig. 4, p.1311))41 and to recent
estimates of GDP per capita (Broadberry et al. (2015, p.206). Improved nutrition amongst the general population,
38 This is based on a preliminary analysis of the Schoenberg manuscript database (Schoenberg (2015)), collecting all those manuscripts with „health‟,
„helthe‟, „sanitas‟, „medicine‟, and „medical‟ in the title. As this database only records manuscripts that have survived the raw numbers are perhaps not as
reliable as the proportions. Health-related manuscripts account for .3% of all manuscripts in 1100, .5% of manuscripts in 1200 and 1% in 1300 (the vast
majority of medieval manuscripts are religious such as the Book of Hours). The patterns are suggestive but conclusions will await a fuller analysis.
39 For example, the CCR5 mutation ∆32 that confers resistance against HIV has been theorized to be a result of selection during the Black Death. However,
smallpox is a more likely selective agent (Galvani and Novembre, 2005).
40 A recent estimate of Black Death mortality for England calculates a population drop of 48% (Broadberry et al. (2015, p.21)). In plague era London, 1560–
1665, the vast majority (80%) did not die of plague (Cummins et al. (2015)).
41 I thank an anonymous referee for pointing out the similarity of these series.
26
from higher real incomes via Malthusian dynamics, could have led to a reduction in the incidence of other
infectious diseases among plague survivors and their offspring.42 Nutritional status did little to diminish plague
lethality (see Fogel (1986, table 9.11, p.481) but together with a „purging‟ effect, the Black Death could have led
to an improved climate against infectious disease, especially in cities. The cause of the 1400 rise in adult noble
lifespan is unknown. Presently only speculations can be made. Future empirical work, perhaps linking estate
account books (to reconstruct diet) to specific time and location (rural/urban) effects and genealogies of the kind
analyzed here, will have great potential to answer this mystery.
This paper documents a geographic pattern to European elite lifespans. The mortality gradient runs South-
North and East-West, and has existed since before the Black Death. The long existence of such a geographic
„effect‟, and the factors which are causing it, may have implications for recent work which stresses the „little
divergence‟ between the North-West of Europe and the South-East (Voigtländer and Voth (2013), Broadberry
(2013) and de Pleijt and van Zanden (2013)). The Black Death is not the first turning point. There was something
about the North-West of Europe long before 1346 that led to nobles living longer lives.
References
Acemoglu, Daron and Simon Johnson, “Disease And Development: The Effect Of Life Expectancy On Economic
Growth,” Journal Of Political Economy, December 2007, 115 (6), 925–985.
Alfani, Guido and Tommy E. Murphy, "Plague and Other Lethal Epidemics of the Pre-Industrial World,” Journal
of Economic History, March 2017.
42 Using the same logic as McKeown employed for the later rise in noble lifespan “the lower prevalence of infectious diseases which resulted from improved
nutrition must have diminished the frequency of exposure” McKeown (1976, p.141).
27
Astarita, Tommaso, A Companion To Early Modern Naples, Brill, 2013.
Benedictow, Ole Jørgen, The Black Death, 1346-1353: The Complete History, Boydell & Brewer, 2004.
Biraben, Jean-Noël, Les Hommes Et La Peste En France Et Dans Les Pays Européens Et Méditerranéens, Vol. 2,
Mouton Paris-La Haye, 1975.
Boswell, Laird, Rural Communism In France: 1920-1939, Cornell University Press, 1998.
Boyd, Percival, Pedigrees With Index Of London Citizens, Abt. 1600-1800, Manuscript, Filmed By The
Genealogical Society Of Utah, 1954.
Broadberry, Stephen, “Accounting For The Great Divergence,” Economic History Working Papers 54573,
London School Of Economics And Political Science, Department Of Economic History November 2013.
_______ , Bruce Campbell, Alexander Klein, Mark Overton, And Bas Van Leeuwen, British Economic
Growth, 1270–1870, Cambridge University Press, 2015.
Burke, Bernard And John Bernard Burke, The Book Of Precedence: The Peers, Baronets, And Knights, And The
Companions Of The Several Orders Of Knighthood, Placed According To Their Relative Rank, Together
With A Scale Of General Or Social Precedence, Harrison, 1881.
_______ , And John Burke, A Genealogical And Heraldic Dictionary Of The Peerage And Baronetage:
Together With Memoirs Of The Privy Councilors And Knights, Harrison, 1881.
Bush, Michael L., Noble Privilege, Manchester University Press, 1983.
Chipman, Hugh A, Edward I George, Robert E Mcculloch Et Al., “BART: Bayesian Additive Regression Trees,”
The Annals Of Applied Statistics, 2010, 4 (1), 266–298.
Clark, Gregory, “The Condition Of The Working Class In England, 1209-2004,” Journal Of Political Economy,
2005, 113 (6), Pp. 1307–1340.
_______ , A Farewell To Alms: A Brief Economic History Of The World, Princeton, NJ:: Princeton University
Press, 2007.
28
Cohn, Samuel K, The Black Death Transformed: Disease And Culture In Early Renaissance Europe, Arnold,
2002. 11, 12
_______ , “4 Epidemiology Of The Black Death And Successive Waves Of Plague,” Medical History.
Supplement, 2008, (27), 74.
Cummins, Neil, Morgan Kelly, And Cormac Ó Gráda, “Living Standards And Plague In London, 1560–1665,”
The Economic History Review, 2015.
David, Paul, S. Ryan Johansson, And Andrea Pozzi, “The Demography Of An Early Mortality Transition: Life
Expectancy, Survival And Mortality Rates For Britain‟s Royals, 1500-1799,” Economics Series Working
Papers Number 83, University Of Oxford, Department Of Economics 2010.
De La Croix, David And Omar Licandro, “The Longevity Of Famous People From Hammurabi To Einstein,”
Working Papers 666, Barcelona Graduate School Of Economics October 2012.
De Moor, Tine, and Jan Luiten Van Zanden. "Girl power: the European marriage pattern and labour markets in
the North Sea region in the late medieval and early modern period1." Economic History Review 63.1:1-33.
2010
De Pleijt, Alexandra M. And Jan Luiten Van Zanden, “Accounting For The „Little Divergence‟ What Drove
Economic Growth In Preindustrial Europe, 1300-1800?” Working Papers 0046, Utrecht University, Centre
For Global Economic History 2013.
De Sainte-Marie, Anselme And Ange De Sainte-Rosalie, Histoire Généalogique Et Chronologique De La Maison
Royale De France, Des Pairs, Grands Officiers De La Couronne, De La Maison Du Roy Et Des Anciens
Barons Du Royaume. Paris, 1728.
Dewald, Jonathan, The European Nobility, 1400-1800, Vol. 9, Cambridge University Press, 1996.
Dewitte, Sharon N, “The Effect Of Sex On Risk Of Mortality During The Black Death In London, AD 1349–
1350,” American Journal Of Physical Anthropology, 2009, 139 (2), 222–234.
29
_______ , “Age Patterns Of Mortality During The Black Death In London, AD 1349–1350,” Journal Of
Archaeological Science, 2010, 37 (12), 3394–3400.
Doyle, William, Aristocracy: A Very Short Introduction, Oxford University Press, 2010.
Eisner, Manuel, “Long-Term Historical Trends In Violent Crime,” Crime And Justice, 2003, Pp. 83–142.
Elias, Norbert, The Civilizing Process, Vol. 2, Pantheon Books New York, 1982. Translated By Edmund Jephcott.
Fernihough, Alan, “Simple Logit And Probit Marginal Effects In R,” UCD Centre For Economic Research
Working Paper Series, WP11/22. University College Dublin, School Of Economics, 2011.
Fire, Michael And Yuval Elovici, “Data Mining Of Online Genealogy Datasets For Revealing Lifespan Patterns
In Human Population,” Arxiv Preprint Arxiv:1311.4276, 2013. 2
Fogel, Robert W, “Nutrition And The Decline In Mortality Since 1700: Some Preliminary Findings,” In Long-
Term Factors In American Economic Growth, University Of Chicago Press, 1986, Pp. 439–556.
Galvani, Alison P And John Novembre, “The Evolutionary History Of The CCR5-∆32 HIV-Resistance
Mutation,” Microbes And Infection, 2005, 7 (2), 302–309.
Gras, Pierre, Le Registre Paroissial De Givry (1334-1357) Et La Peste Noire En Bourgogne, Bibliothèque De
l'École Des Chartes, 1939, 100 (1), 295–308.
Green, Donald P And Holger L Kern, “Modeling Heterogeneous Treatment Effects In Survey Experiments With
Bayesian Additive Regression Trees,” Public Opinion Quarterly, 2012, P. Nfs036.
Gurr, Ted R., “Historical Trends In Violent Crime: A Critical Review Of The Evidence,” Crime And Justice,
1981, Pp. 295–353.
Haensch, Stephanie, Raffaella Bianucci, Michel Signoli, Minoarisoa Rajerison, Michael Schultz, Sacha Kacki,
Marco Vermunt, Darlene A Weston, Derek Hurst, Mark Achtman Et Al., “Distinct Clones Of Yersinia Pestis
Caused The Black Death,” Plos Pathogens, 2010, 6 (10), E1001134.
30
Hajnal, John, “European Marriage Patterns In Perspective,” In Eversley DE Glass DV, Ed., Population In
History: Essays In Historical Demography, 1965.
Henry, Louis, “Fécondité Des Mariages Dans Le Quart Sud-Ouest De La France, De 1720 `A 1829,” Annales.
Histoire, Sciences Sociales, 1972, 27 (3), Pp. 612–640.
_______ , “Fécondité Des Mariages Dans Le Quart Sud-Est De La France De 1670 A 1829,” Population (French
Edition), 1978, 33 (4/5), 855–883.
_______ , And Jacques Houdaille, “Fécondité Des Mariages Dans Le Quart Nord-Ouest De La France De 1670 A
1829,” Population (French Edition), 1973, 28 (4/5), 873–924.
Hollingsworth, Thomas H, “A Demographic Study Of The British Ducal Families,” Population Studies, 1957, 11
(1), 4–26.
_______ , The Demography Of The British Peerage, Population Investigation Committee, 1964.
_______ , “A Note On The Mediaeval Longevity Of The Secular Peerage 1350–1500,” Population Studies, 1975,
29 (1), 155–159.
_______ , “Mortality In The British Peerage Families Since 1600,” Population (French Edition), 1977, Pp. 323–
352.
Houdaille, Jacques, “Fécondité Des Mariages Dans Le Quart Nord-Est De La France De 1670 A 1829.,” In
Annales De Demographie Historique, 1976, Pp. 341–392.
Janick, Jules, Marie Christine Daunay, And Harry Paris, “Horticulture And Health In The Middle Ages: Images
From The Tacuinum Sanitatis,” Hortscience, 2010, 45 (11), 1592–1596.
Johansson, S Ryan, “Medics, Monarchs And Mortality, 1600-1800: Origins Of The Knowledge-Driven Health
Transition In Europe,” Available At SSRN 1661453, 2010.
Kapelner, Adam And Justin Bleich, “Bartmachine: A Powerful Tool For Machine Learning,” Arxiv Preprint
Arxiv:1312.2171, 2013.
31
Keen, Maurice, Chivalry, Yale University Press, 1984.
Kelly, Morgan And Cormac Ó Gráda, “Living Standards And Mortality Since The Middle Ages,” Economic
History Review, 2014, 67 (2), 358–381.
Koch, Hannsjoachim Wolfgang, The Rise Of Modern Warfare, 1618-1815, Prentice Hall, 1981.
Levy, Claude And Louis Henry, “Ducs Et Pairs Sous l'Ancien Régime. Caractéristiques Démographiques D'une
Caste,” Population (French Edition), 1960, Pp. 807–830.
Martensen, Robert Lawrence, The Brain Takes Shape: An Early History, Oxford University Press New York,
2004.
Mckeown, Thomas, The Modern Rise Of Population, Vol. 11, Edward Arnold London, 1976.
Nash, A.E., “The Mortality Pattern Of The Wiltshire Lords Of The Manor, 1242-1377,” Southern History, 1980,
2, 31–44.
Paget, Gerald, An Official, Genealogical, And Heraldic Baronage Of England. An Account Of The Ancient
Nobility Of This Realm From The Time Of The Norman Conquest Till The Close Of The Fifteenth Century,
1957.
Peller, Sigismund, “Births And Deaths Among Europe‟s Ruling Families Since 1500,” Population In History,
1965, Pp. 87–100.
Pinker, Steven, The Better Angels Of Our Nature: The Decline Of Violence In History And Its Causes, Penguin
UK, 2011.
Poos, Lawrence R., Jim Oeppen, And Richard Smith, “Re-Assessing Josiah Russell‟s Measurement Of Late
Medieval Mortality Using The Inquisitions Post Mortem,” In Michael Hicks, Ed., The Fifteenth-Century
Inquisitions Post Mortem: A Companion, 2012, Pp. 155–168.
32
Raoult, Didier, Gérard Aboudharam, Eric Crubézy, Georges Larrouy, Bertrand Ludes, And Michel Drancourt,
“Molecular Identification By “Suicide PCR” Of Yersinia Pestis As The Agent Of Medieval Black Death,”
Proceedings Of The National Academy Of Sciences, 2000, 97 (23), 12800–12803.
Schoenberg, Larry, “Schoenberg Database Of Manuscripts,” June 2015. Accessed 11 June 2015.
Schofield, Roger, “An Anatomy Of An Epidemic: Colyton November 1645 To November 1646,” Local
Population Studies, 1977, (Supplement 4), 95–126.
Schuenemann, Verena J, Kirsten Bos, Sharon Dewitte, Sarah Schmedes, Joslyn Jamieson, Alissa Mittnik, Stephen
Forrest, Brian K Coombes, James W Wood, David JD Earn Et Al., “Targeted Enrichment Of Ancient
Pathogens Yielding The Ppcp1 Plasmid Of Yersinia Pestis From Victims Of The Black Death,” Proceedings
Of The National Academy Of Sciences, 2011, 108 (38), E746–E752.
Schwennicke, Detlev, E., Europäische Stammtafeln. Neue Folge: Europäische Stammtafeln Bd.1/1: Die
Fränkischen Könige Und Die Könige Und Kaiser, Stammesherzoge, Kurfürsten Markgrafen Und Herzoge
Des Heiligen Römischen Reiches Deutscher Nation, Vol. 1, Vittorio Klostermann, 2005.
Sebastian, Anton, Ed., Dates In Medicine: A Chronological Record Of Medical Progress Over Three Millennia,
New York: The Parthenon Publishing Group, 2000.
Slack, Paul, “The Local Incidence Of Epidemic Disease: The Case Of Bristol 1540-1650,” Local Population
Studies, 1977, (Supplement 4), 49–62.
Smith, Richard M., “Measuring Adult Mortality In An Age Of Plague: England, 1349– 1540,” In Mark Bailey
And Stephen Rigby, Eds., Town And Countryside In The Age Of The Black Death: Essays In Honour Of
John Hatcher, 2012, Pp. 43–85.
_______ , And Jim Oeppen, “Place And Status As Determinants Of Infant Mortality In England C. 1550–1837,”
In Eilidh Garrett, Chris Galley, Nicola Shelton, And Robert Woods, Eds., Infant Mortality: A Continuing
Social Problem, 2007, Pp. 53–78.
33
Southall, Humphrey R. and Nick Burton. GIS Of The Ancient Parishes Of England And Wales, 1500-1850. (Data
Collection). UK Data Service. SN: 4828, Http://Dx.Doi.Org/10.5255/UKDA-SN-4828-1, 2004.
The Holy Bible King James Version, Online Version 2014.
Vitalis, Ordericus. The ecclesiastical history of England and Normandy London, H.G. Bohn. 1856. Available at
https://archive.org/details/bub_gb_M6oaAAAAYAAJ.
Voigtländer Nico And Hans-Joachim Voth, “How The West “Invented” Fertility Restriction,” American
Economic Review, 2013, 103 (6), 2227–64.
Whitney, Craig R., “Jeanne Calment, World‟s Elder, Dies At 122,” The New York Times, August 5 1997.
Wrigley, Edward. A. And Roger S. Schofield, The Population History Of England 1541-1871, Cambridge
University Press, 1981.
Wrigley, Edward A., Ros S. Davies, Oeppen James E., And Roger S. Schofield, English Population History From
Family Reconstitution, 1580-1837, Cambridge: Cambridge University Press, 1997.
Table 1: The Composition of the Noble Adult Age at Death Sample, by Birth Century and
European Region
Birth Outside N/NE C/E S England Century Europe Europe Europe Europe France Scotland Ireland and
Wales 800 5 51 60 75 105 4 89 49 900 11 91 101 127 201 9 116 93 1000 17 109 216 161 462 16 88 235 1100 42 309 338 239 629 64 96 655 1200 61 436 580 299 919 153 113 1,463 1300 64 676 901 344 1,383 224 76 2,302 1400 60 1,045 1,335 309 1,802 354 135 2,989 1500 138 2,602 2,741 173 3,345 750 228 10,349 1600 764 1,496 1,665 151 3,311 1,989 659 21,113 1700 1,108 89 61 133 860 2,799 1,496 19,667 1800 938 50 52 111 361 1,423 1,245 10,897
Source: Noble sample. The counts refer to the 115,650 observations with an age at death over 20. Regions are assigned based upon assigned place of birth (either observed or inferred - see the appendix for details). Bounding boxes of longitude and latitude were established for the following regions. N/NE Europe (2,52)-(50,75), C/E Europe (8,44)-(50,52) and S Europe (-11,36)-(50,44). France, Scotland, Ireland and England and Wales were assigned bounding boxes that match their modern territories.
Table 2: Ten most frequent exact death dates
Date Battle 88 9 Sep 1513 148 Battle of Flodden 83 25 Oct 1415 154 Battle of Agincourt 36 9 Jul 1386 80 Battle of Sempach 23 10 Sep 1547 112 Battle of Pinkie Cleugh 22 26 Aug 1346 77 Battle of Crécy 16 10 Aug 1557 151 Battle of St. Quentin 15 1 Jul 1690 144 Battle of the Boyne 15 19 Jul 333 58 Battle of Halidon Hill 15 11 Jul 1302 43 Battle of the Golden Spurs 14 29 Mar 1461 60 Battle of Towton
Notes: is the number of deaths on a specific day, is the number of deaths in a year where the exact death date is observed. Calculated for the “Europe: Royal and Noble Houses" family tree only (to ensure no duplicates skew the calculation). All of these battles had heavy noble casualties. Source: Noble sample.
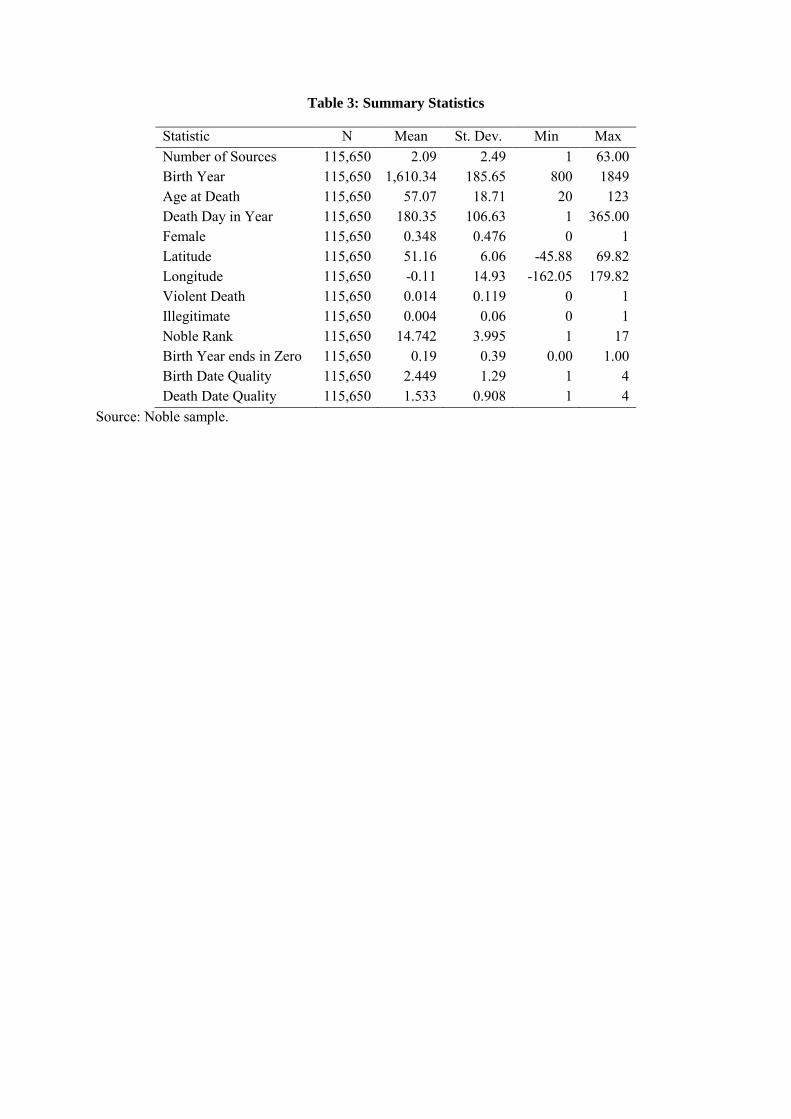
Table 3: Summary Statistics
Statistic N Mean St. Dev. Min Max Number of Sources 115,650 2.09 2.49 1 63.00 Birth Year 115,650 1,610.34 185.65 800 1849 Age at Death 115,650 57.07 18.71 20 123 Death Day in Year 115,650 180.35 106.63 1 365.00 Female 115,650 0.348 0.476 0 1 Latitude 115,650 51.16 6.06 -45.88 69.82 Longitude 115,650 -0.11 14.93 -162.05 179.82 Violent Death 115,650 0.014 0.119 0 1 Illegitimate 115,650 0.004 0.06 0 1 Noble Rank 115,650 14.742 3.995 1 17 Birth Year ends in Zero 115,650 0.19 0.39 0.00 1.00 Birth Date Quality 115,650 2.449 1.29 1 4 Death Date Quality 115,650 1.533 0.908 1 4
Source: Noble sample.
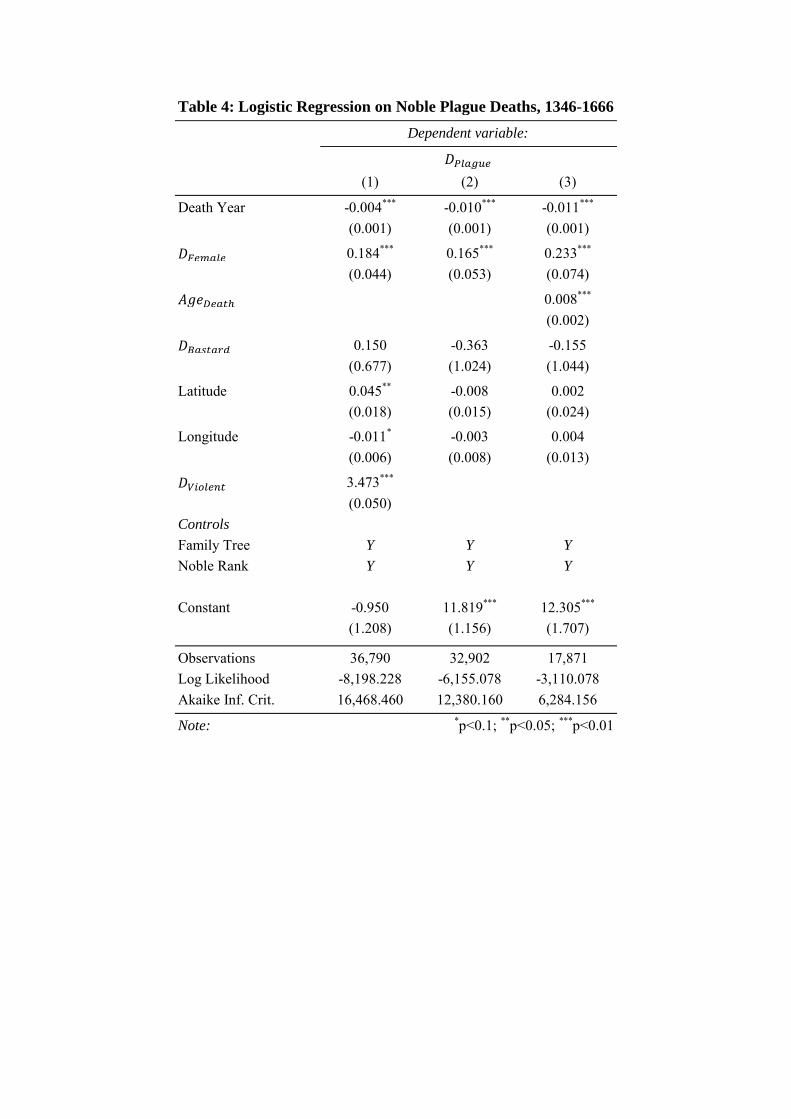
Table 4: Logistic Regression on Noble Plague Deaths, 1346-1666
Dependent variable:
(1) (2) (3)
Death Year -0.004*** -0.010*** -0.011***
(0.001) (0.001) (0.001)
0.184*** 0.165*** 0.233***
(0.044) (0.053) (0.074)
0.008***
(0.002)
0.150 -0.363 -0.155
(0.677) (1.024) (1.044)
Latitude 0.045** -0.008 0.002
(0.018) (0.015) (0.024)
Longitude -0.011* -0.003 0.004
(0.006) (0.008) (0.013)
3.473*** (0.050) Controls Family Tree Y Y Y
Noble Rank Y Y Y
Constant -0.950 11.819*** 12.305***
(1.208) (1.156) (1.707)
Observations 36,790 32,902 17,871 Log Likelihood -8,198.228 -6,155.078 -3,110.078 Akaike Inf. Crit. 16,468.460 12,380.160 6,284.156
Note: *p<0.1; **p<0.05; ***p<0.01
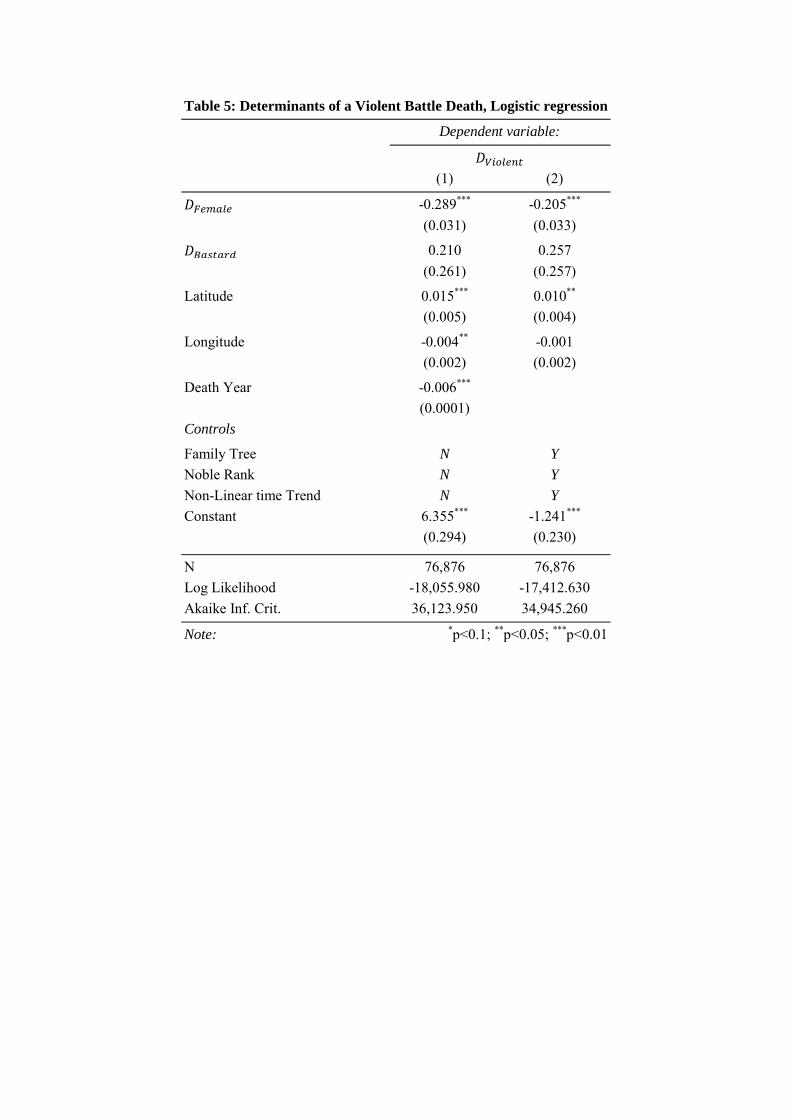
Table 5: Determinants of a Violent Battle Death, Logistic regression
Dependent variable:
(1) (2)
-0.289*** -0.205***
(0.031) (0.033)
0.210 0.257
(0.261) (0.257)
Latitude 0.015*** 0.010**
(0.005) (0.004)
Longitude -0.004** -0.001
(0.002) (0.002)
Death Year -0.006*** (0.0001) Controls Family Tree N Y
Noble Rank N Y
Non-Linear time Trend N Y
Constant 6.355*** -1.241***
(0.294) (0.230)
N 76,876 76,876 Log Likelihood -18,055.980 -17,412.630 Akaike Inf. Crit. 36,123.950 34,945.260
Note: *p<0.1; **p<0.05; ***p<0.01
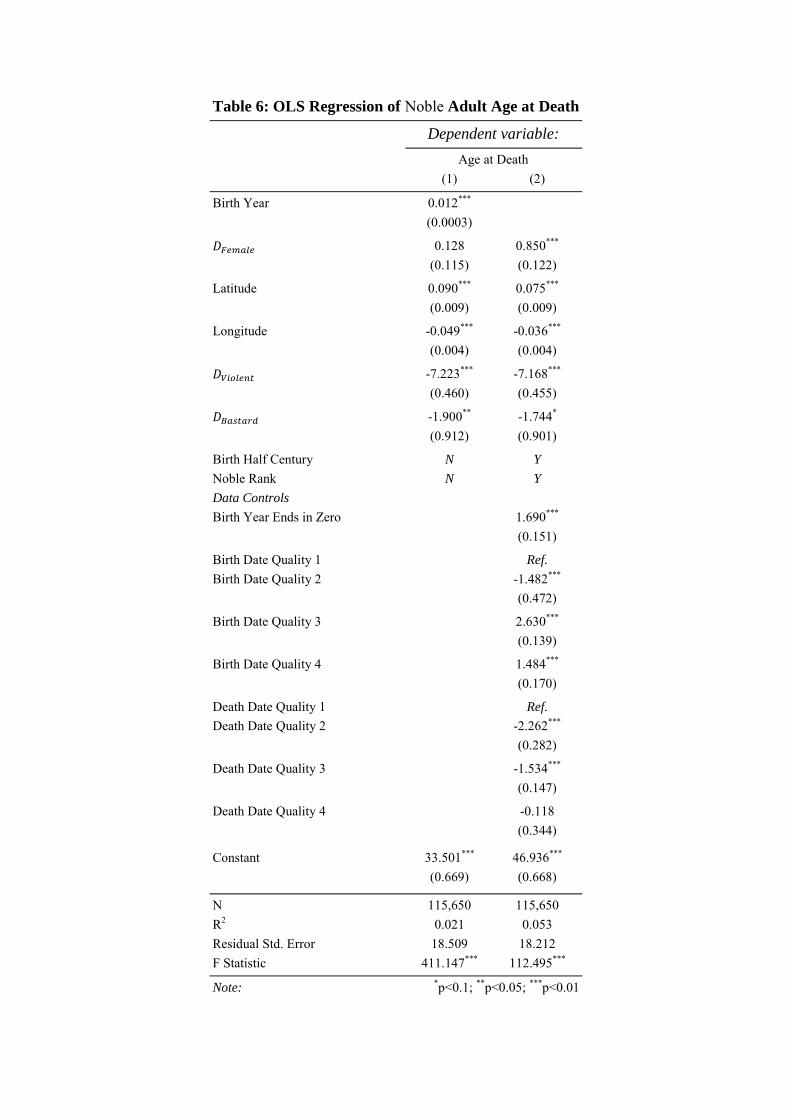
Table 6: OLS Regression of Noble Adult Age at Death
Dependent variable:
Age at Death
(1) (2)
Birth Year 0.012*** (0.0003) 0.128 0.850***
(0.115) (0.122)
Latitude 0.090*** 0.075***
(0.009) (0.009)
Longitude -0.049*** -0.036***
(0.004) (0.004)
-7.223*** -7.168***
(0.460) (0.455)
-1.900** -1.744*
(0.912) (0.901)
Birth Half Century N Y
Noble Rank N Y
Data Controls Birth Year Ends in Zero 1.690***
(0.151)
Birth Date Quality 1 Ref.
Birth Date Quality 2 -1.482***
(0.472)
Birth Date Quality 3 2.630***
(0.139)
Birth Date Quality 4 1.484***
(0.170)
Death Date Quality 1 Ref.
Death Date Quality 2 -2.262***
(0.282)
Death Date Quality 3 -1.534***
(0.147)
Death Date Quality 4 -0.118
(0.344)
Constant 33.501*** 46.936***
(0.669) (0.668)
N 115,650 115,650 R2 0.021 0.053 Residual Std. Error 18.509 18.212 F Statistic 411.147*** 112.495***
Note: *p<0.1; **p<0.05; ***p<0.01
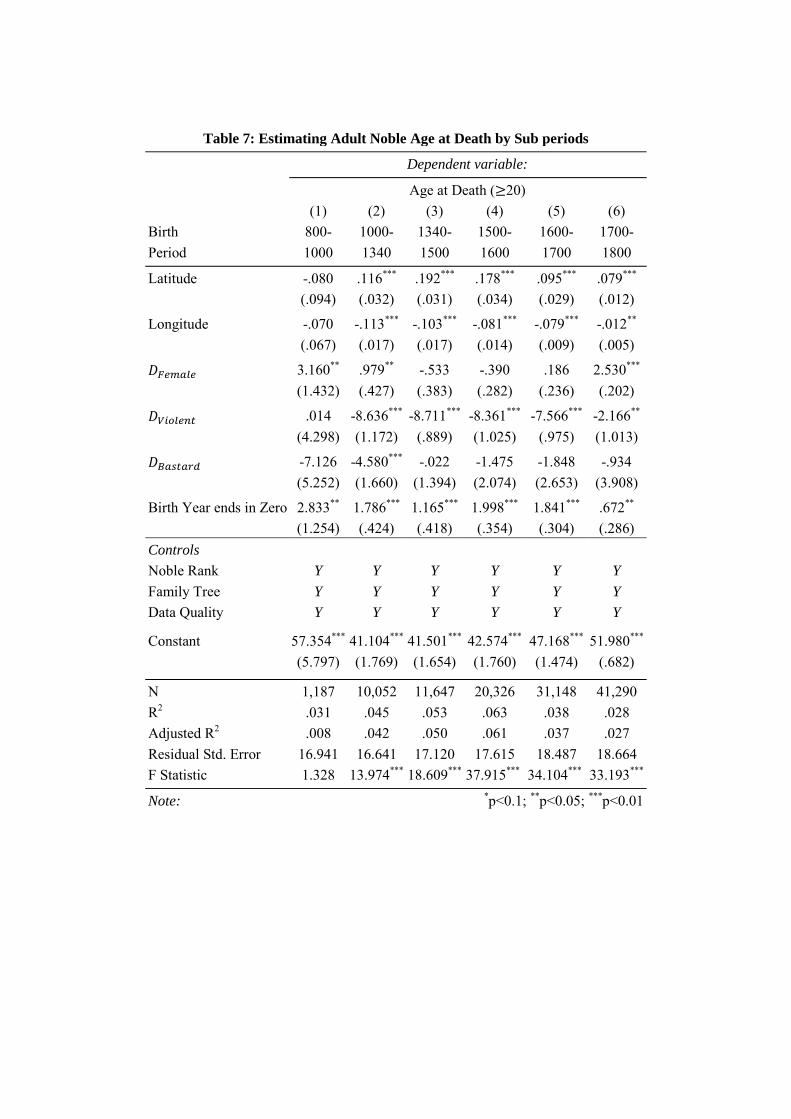
Table 7: Estimating Adult Noble Age at Death by Sub periods
Dependent variable:
Age at Death ( 20)
(1) (2) (3) (4) (5) (6) Birth 800- 1000- 1340- 1500- 1600- 1700- Period 1000 1340 1500 1600 1700 1800
Latitude -.080 .116*** .192*** .178*** .095*** .079***
(.094) (.032) (.031) (.034) (.029) (.012)
Longitude -.070 -.113*** -.103*** -.081*** -.079*** -.012**
(.067) (.017) (.017) (.014) (.009) (.005)
3.160** .979** -.533 -.390 .186 2.530***
(1.432) (.427) (.383) (.282) (.236) (.202)
.014 -8.636*** -8.711*** -8.361*** -7.566*** -2.166**
(4.298) (1.172) (.889) (1.025) (.975) (1.013)
-7.126 -4.580*** -.022 -1.475 -1.848 -.934
(5.252) (1.660) (1.394) (2.074) (2.653) (3.908)
Birth Year ends in Zero 2.833** 1.786*** 1.165*** 1.998*** 1.841*** .672**
(1.254) (.424) (.418) (.354) (.304) (.286) Controls Noble Rank Y Y Y Y Y Y
Family Tree Y Y Y Y Y Y
Data Quality Y Y Y Y Y Y
Constant 57.354*** 41.104*** 41.501*** 42.574*** 47.168*** 51.980***
(5.797) (1.769) (1.654) (1.760) (1.474) (.682)
N 1,187 10,052 11,647 20,326 31,148 41,290 R2 .031 .045 .053 .063 .038 .028 Adjusted R2 .008 .042 .050 .061 .037 .027 Residual Std. Error 16.941 16.641 17.120 17.615 18.487 18.664 F Statistic 1.328 13.974*** 18.609*** 37.915*** 34.104*** 33.193***
Note: *p<0.1; **p<0.05; ***p<0.01
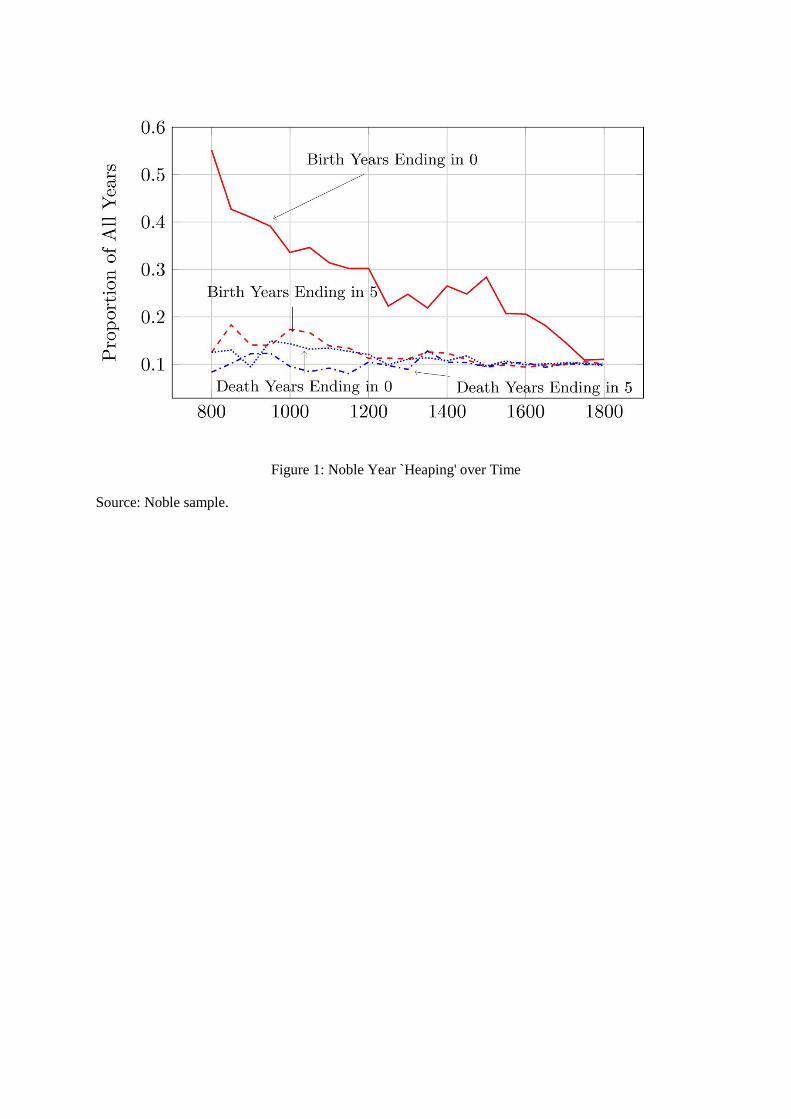
Figure 1: Noble Year `Heaping' over Time
Source: Noble sample.
(a) By Sex (b) By Birth Century
Figure 2: Distribution of Noble Age at Death, by Sex and Birth Century
Source: Noble sample.
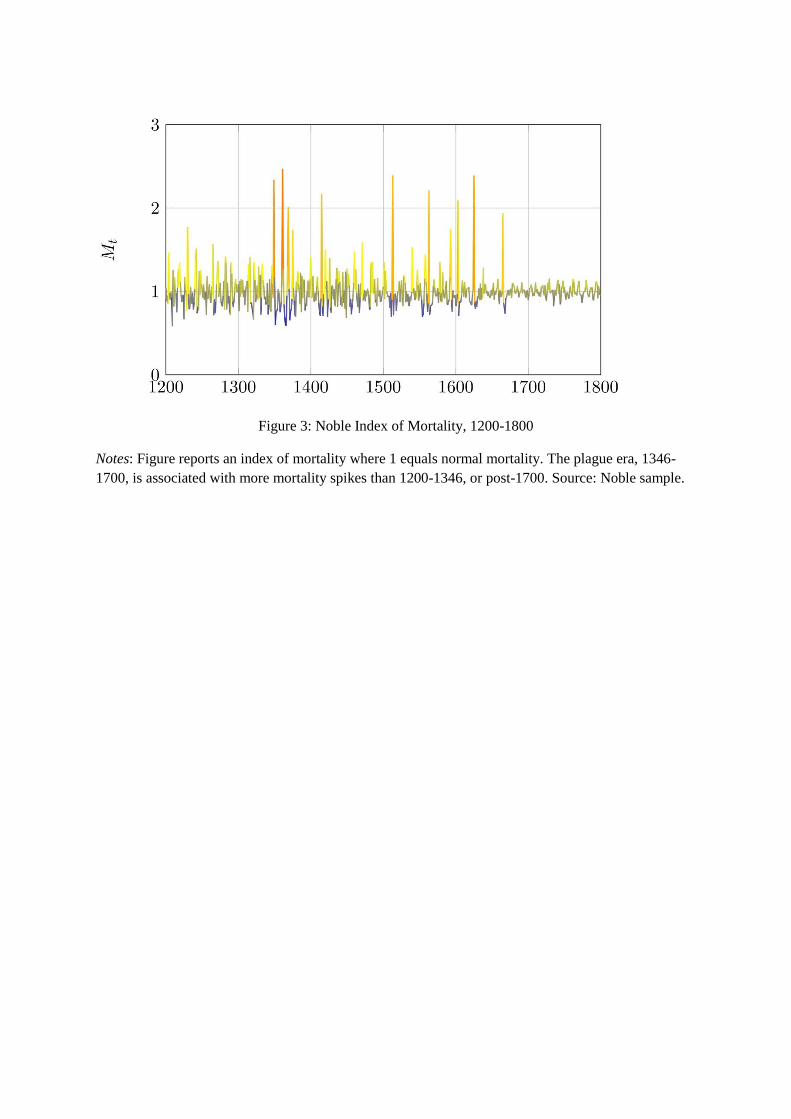
Figure 3: Noble Index of Mortality, 1200-1800
Notes: Figure reports an index of mortality where 1 equals normal mortality. The plague era, 1346-
1700, is associated with more mortality spikes than 1200-1346, or post-1700. Source: Noble sample.
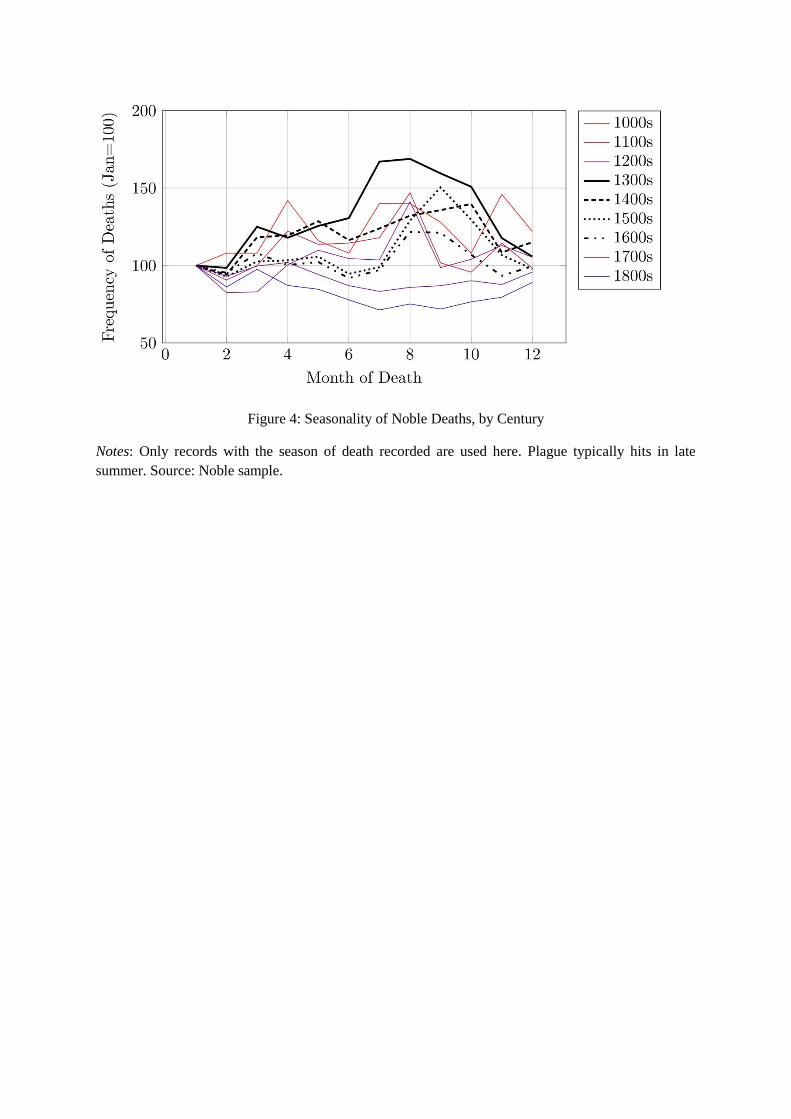
Figure 4: Seasonality of Noble Deaths, by Century
Notes: Only records with the season of death recorded are used here. Plague typically hits in late
summer. Source: Noble sample.
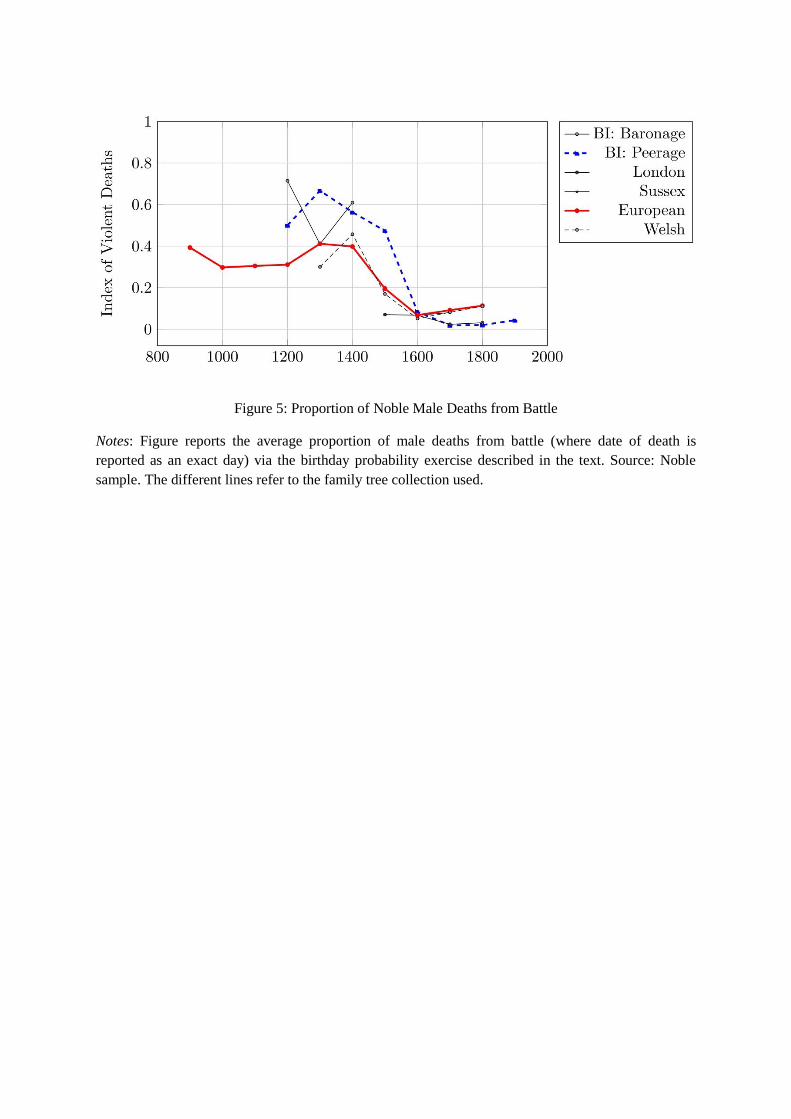
Figure 5: Proportion of Noble Male Deaths from Battle
Notes: Figure reports the average proportion of male deaths from battle (where date of death is
reported as an exact day) via the birthday probability exercise described in the text. Source: Noble
sample. The different lines refer to the family tree collection used.
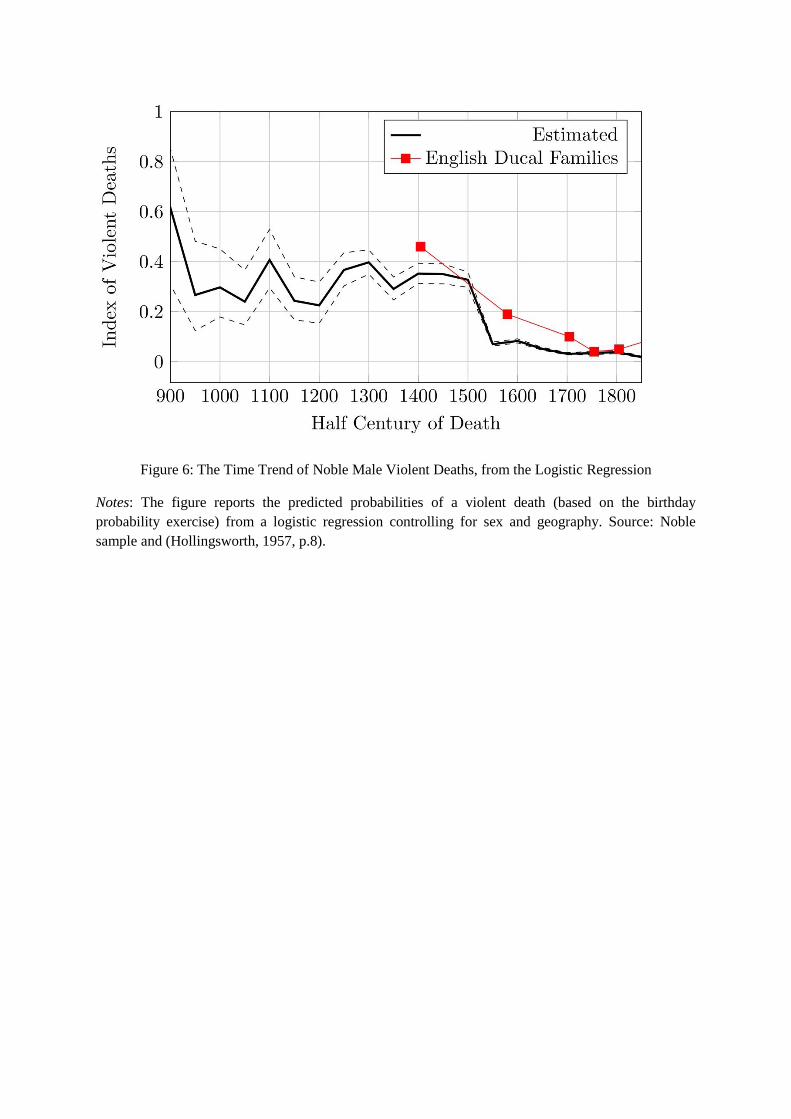
Figure 6: The Time Trend of Noble Male Violent Deaths, from the Logistic Regression
Notes: The figure reports the predicted probabilities of a violent death (based on the birthday
probability exercise) from a logistic regression controlling for sex and geography. Source: Noble
sample and (Hollingsworth, 1957, p.8).
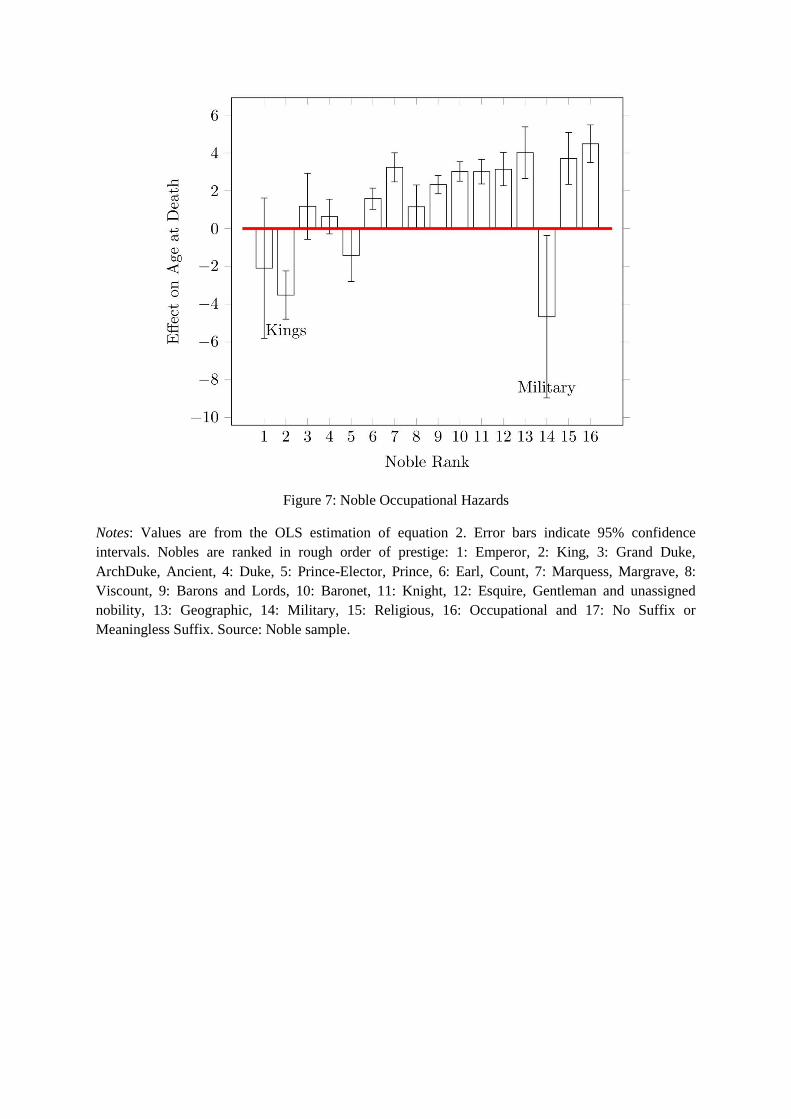
Figure 7: Noble Occupational Hazards
Notes: Values are from the OLS estimation of equation 2. Error bars indicate 95% confidence
intervals. Nobles are ranked in rough order of prestige: 1: Emperor, 2: King, 3: Grand Duke,
ArchDuke, Ancient, 4: Duke, 5: Prince-Elector, Prince, 6: Earl, Count, 7: Marquess, Margrave, 8:
Viscount, 9: Barons and Lords, 10: Baronet, 11: Knight, 12: Esquire, Gentleman and unassigned
nobility, 13: Geographic, 14: Military, 15: Religious, 16: Occupational and 17: No Suffix or
Meaningless Suffix. Source: Noble sample.
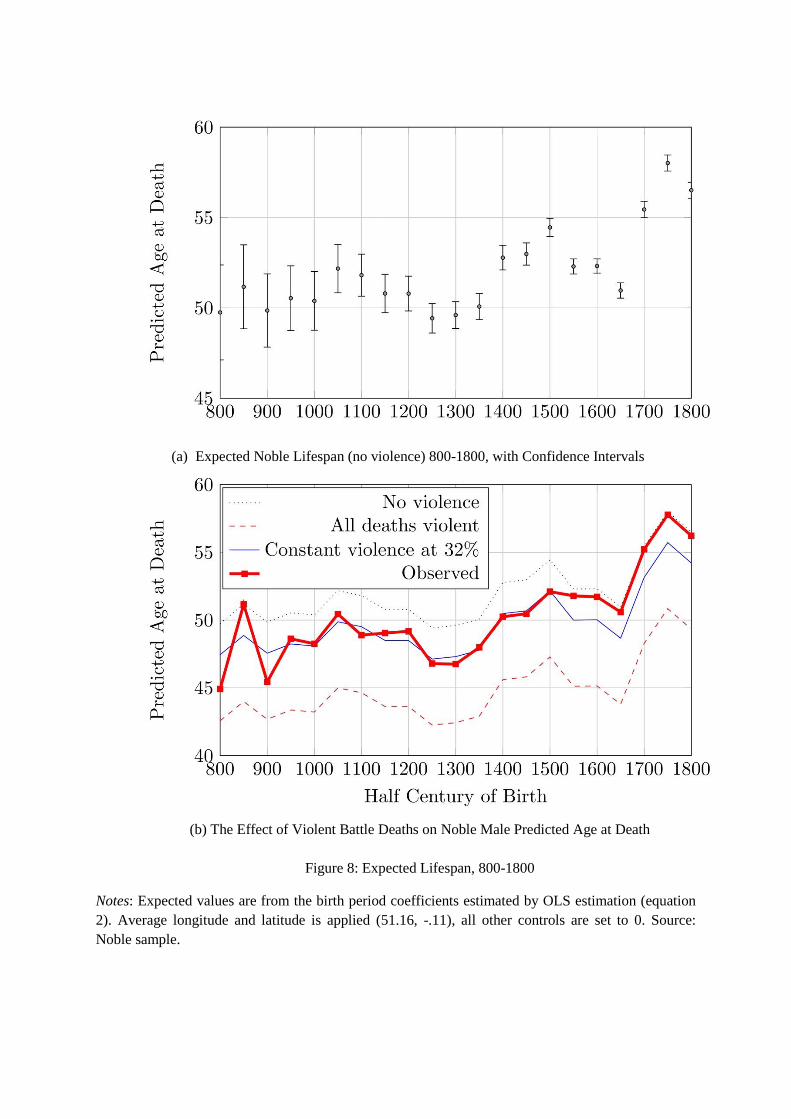
(a) Expected Noble Lifespan (no violence) 800-1800, with Confidence Intervals
(b) The Effect of Violent Battle Deaths on Noble Male Predicted Age at Death
Figure 8: Expected Lifespan, 800-1800
Notes: Expected values are from the birth period coefficients estimated by OLS estimation (equation
2). Average longitude and latitude is applied (51.16, -.11), all other controls are set to 0. Source:
Noble sample.
(a) Europe, .5 Degree Resolution (b) Europe, 1 Degree Resolution
(c) Ireland and the UK, .15 Degree Resolution
Figure 9: Heat-maps of Median Adult Noble Age at Death
Source: Noble sample.
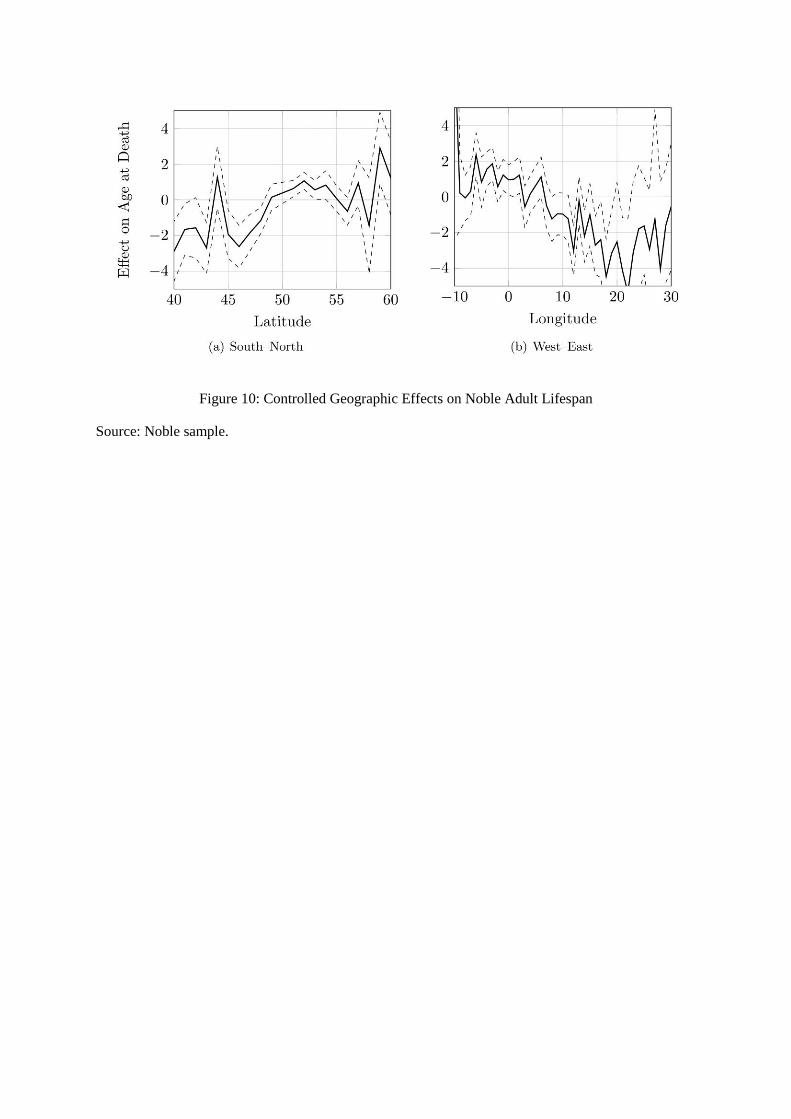
Figure 10: Controlled Geographic Effects on Noble Adult Lifespan
Source: Noble sample.
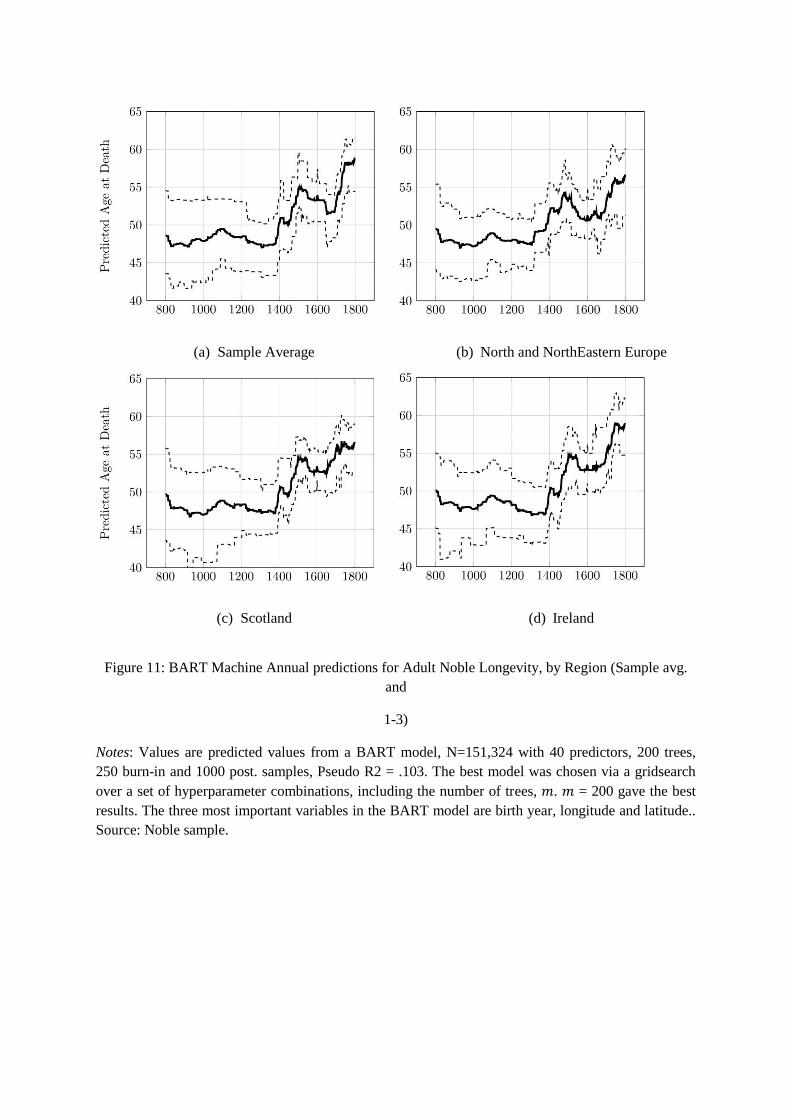
(a) Sample Average (b) North and NorthEastern Europe
(c) Scotland (d) Ireland
Figure 11: BART Machine Annual predictions for Adult Noble Longevity, by Region (Sample avg.
and
1-3)
Notes: Values are predicted values from a BART model, N=151,324 with 40 predictors, 200 trees,
250 burn-in and 1000 post. samples, Pseudo R2 = .103. The best model was chosen via a gridsearch
over a set of hyperparameter combinations, including the number of trees, . = 200 gave the best
results. The three most important variables in the BART model are birth year, longitude and latitude..
Source: Noble sample.
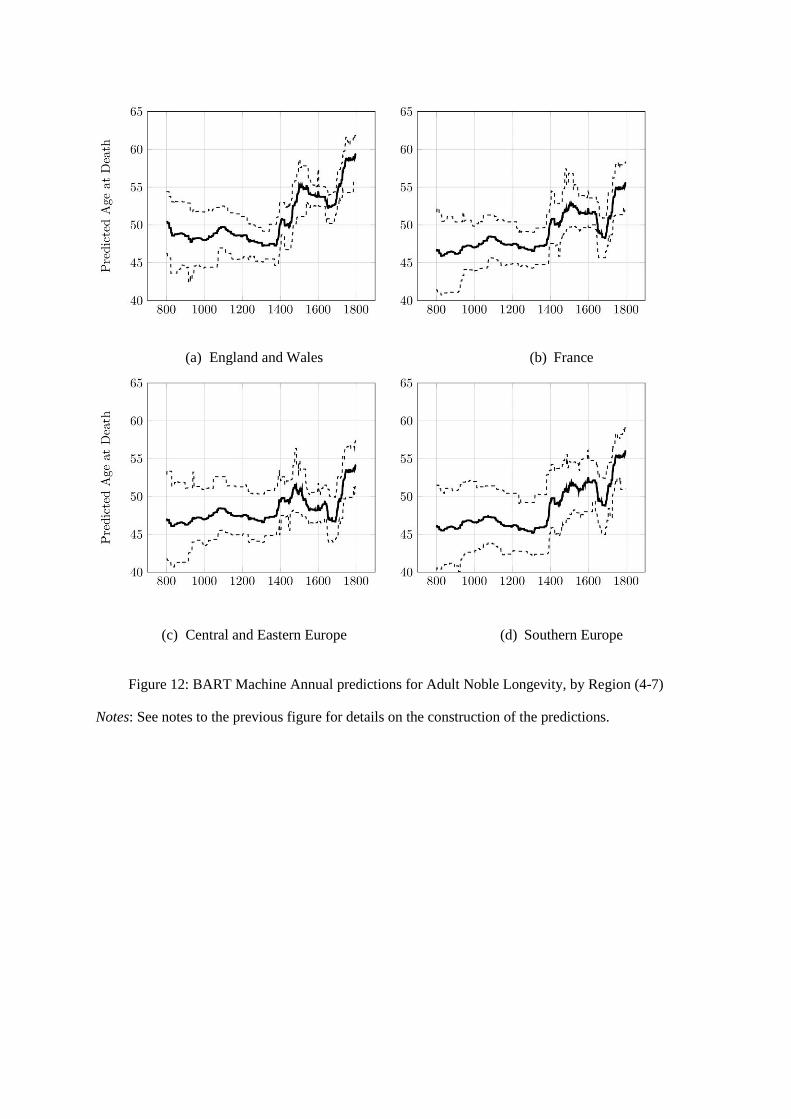
Figure 12: BART Machine Annual predictions for Adult Noble Longevity, by Region (4-7)
Notes: See notes to the previous figure for details on the construction of the predictions.
(a) England and Wales (b) France
(c) Central and Eastern Europe (d) Southern Europe


![Lifespans are long enoughWolpe. John Donvan: Ladies and gentlemen, Paul Root Wolpe. [applause] And, Paul, as Ian said, you are also arguing for the motion that lifespans are long enough](https://img.pdfslide.net/doc/110x75/60e6eb9dd7b913043e77f3a7/lifespans-are-long-enough-wolpe-john-donvan-ladies-and-gentlemen-paul-root-wolpe.jpg)