Embed Size (px)
Citation preview

ACADEMEUniversity of Bohol, Graduate School
and Professional Studies Journal
50
Lifestyle Status and the Risk ofDevelopment of Diabetes Mellitus Type II
LALAINE LAO DOMAPIAS ORCID No. 0000-0002-9676-6160
[email protected] of Bohol
ABSTRACT
Lifestyle status refers to the behaviors or habits or way of living of the UB employees in relation to their dietary practices, physical activities and personal habits. This study aims to determine the degree of relationship of lifestyle on the development of diabetes. The researcher(s) made use of descriptive, correlative design using a standardized tool for casual blood sugar testing, the glucometer and researcher-made questionnaire adopting based the health promotion model. Analysis and interpretation of data were based on percentages, mean scores and Pearson-Product Moment Coefficient and analysis of variance as the statistical treatment to determine the degree of difference on the health status of the respondents in terms of age. In terms of dietary practices, described as moderately unhealthy is eating food with high sweet or sugar and oil/fats content and in terms of physical activities considered as moderately unhealthy were lack of aerobic exercises or recreation activities and engagement to sedentary life. The UB employees are at moderate risk for the development of Diabetes Mellitus Type II. There is a great influence of the lifestyle among the employees and the risk of acquiring such disease.
KEYWORDS
Nursing, Lifestyle status, Dietary Practices, Pearson Product Moment Coefficient, Tagbilaran City, Philippines
Volume I, January 2012ACADEME University of Bohol, Graduate School
and Professional Studies JournalPrint ISSN 2362-9142

Peer Reviewed Journal
51
INTRODUCTION
As reported by Harvard of Public Health on The Global Economic Burden of Non-communicable Diseases (NCD) in 2011, 63% of all deaths worldwide were due to NCDs, and one of them is diabetes aside from cardiovascular diseases, cancers and chronic respiratory diseases. These deaths are distributed widely among the world’s population, from high income to low-income countries and from young to old. As reported by Velandria et al, 2003 in the Nutrition and Health Status of Filipino Adults, 2 out of 10 Filipinos above 20 years of age were hypertensive and 5.28 million Filipinos had abnormal blood sugar levels which were attributed to diabetes mellitus.
The Philippine statistics of 2002 showed that 7 out of 10 leading causes of mortality were associated lifestyle diseases such as cardiovascular system disease, cancer, chronic obstructive pulmonary disease, accident, diabetes mellitus and kidney disease. Moreover, the leading causes of morbidity were hypertension and diseases of the heart (Cuevas, 2007).
Leavell and Clark’s Theory in the late 1940s mentioned three levels of prevention, namely primary, secondary and tertiary prevention. Primary prevention seeks to prevent a disease or condition at a prepathologic state to stop something from ever happening. This focuses on health promotion, and specific protection. Health promotion include facilitating health education, counseling, genetic screening, standard nutrition attuned to the developmental phase of life. In terms of specific protection, individual person may utilize immunization as recommended by health authorities, practicing personal hygiene, environmental sanitation, and protection from carcinogens, protection against occupational hazards and even protection from accidents (Kozier, 2004).
The secondary prevention is made up of a set of measures used for early detection and immediate intervention to control a problem or disease, thus, minimizing the poor health consequences. Lastly, the tertiary prevention concentrates on the reduction of further complications of an existing disease or problem, through treatment and rehabilitation. Such intervention is of importance to limit disability and mortality (Spassof et al, 2001).
Similarly, the health promotion model which was formulated by Nola Pender weaves the nursing and behavioral and nursing points of view. This model presupposes that, every individual has distinct personal characteristics and experiences that affect their subsequent actions. The set of variables for behavioral specific knowledge and affect have important motivational significance. The management of these variables is possible through nursing

ACADEMEUniversity of Bohol, Graduate School
and Professional Studies Journal
52
interventions. However, health promoting behavior is the desired behavioral outcome and is the end point in the health promotion model of Pender (Jones et al, 2004).
On the other hand, the World Health Organization projected, that in year 2030, there will be a significant rise in the proportion of deaths among middle-age individuals and low income countries from NCD such as ischemic heart diseases, cerebrovascular accident, chronic obstructive pulmonary disorder, and diabetes. This increase is associated with unhealthy lifestyle like unhealthy diet, physical inactivity and personal habits such as smoking and alcohol abuse (WHO 2008).
The Lifestyle assessment of the employees focuses on their personal lifestyle and habits that affect their health. This is done in order to provide an opportunity for clients to assess the impact of their present lifestyle to their health status and make this a basis for decision making in terms of lifestyle modification and eventually promote optimum health.
Dunn 1961 developed a health-illness continuum that evaluated an individual not just a person’s relative health compared to others, but also in terms of how favorable the person’s environment for his or her health and wellness, favorable environment leads to high level of wellness to occur and vice-versa (Edelman et al, 2013).
The American Diabetes Association (2004) recommends criteria for the diagnosis of diabetes mellitus. The criteria includes (1) classical symptoms of diabetes plus casual plasma glucose concentration of 200mg/dl or higher, (2) fasting plasma glucose of 126mg/dl or higher, (3) two-hour post load glucose of 200mg/dl or higher during oral glucose tolerance test. American Diabetes Association (1997) also recommended that if the person has an increased blood glucose level of 200mg/dl or higher plus presence of suggestive signs and symptoms, these suggest the diagnosis of diabetes mellitus.
For a large impact and boosting healthcare outlays the researcher conducted this study among the university faculty members and employees. This would serve as basis for them to maintain a healthy lifestyle or health habits.
METHODOLOGY
The researcher made use of the descriptive-correlative design using a standardized tool for blood sugar testing, the glucometer and a researcher-made questionnaire which was based on the Food and Nutrition Research Institute’s eating plan for healthy living and the Filipino pyramid activity plan
Peer Reviewed Journal
53
by the Philippine Association for the Study of Overweight and Obesity. The questionnaire was checked and tested for refinement. It described the nature of the phenomenon under investigation particularly lifestyle and other variables, thus it is considered descriptive. On the other hand, by establishing the degree of relationship between lifestyle and the risk of developing diabetes mellitus, the research is considered correlative.
Aside from the descriptive-correlative design of the study, it can also be classified as an applied research since the study was undertaken for practical purposes. A Lifestyle Plan will be created based on the results of the study.
The subjects of the study were the regular employees of the University of Bohol, Tagbilaran City, Bohol, Philippines. Currently, the institution has 285 regular employees.
After securing permission from the concerned authorities of the University and from the participants themselves, data gathering was done. The researcher-made questionnaires were distributed to all regular employees of the school. After a week, retrieval of the questionnaires was done in order to finalize the list of qualified respondents. The study utilized purposive targeted sampling that set certain criteria for qualified participants namely: those who were not diagnosed as diabetes mellitus, those without direct family members who had diabetes mellitus to exclude hereditary factors, and lastly, those who were willing to submit themselves for casual blood sugar testing using the Glucometer. An interview was conducted to the respondents to ensure validity of their answers. Upon retrieval, the data were consolidated, tabulated and made ready for statistical treatment and interpretation. The privacy, anonymity, and confidentiality was strictly observed by the researchers, as well as, freedom from harm was exercised all throughout the research conduct.
RESULTS AND DISCUSSION
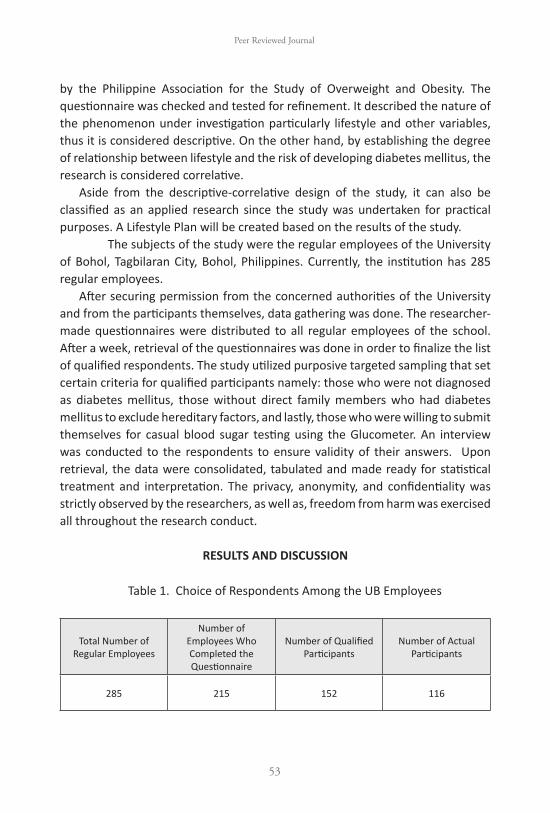
Table 1. Choice of Respondents Among the UB Employees
Total Number of Regular Employees
Number of Employees Who Completed the Questionnaire
Number of Qualified Participants
Number of Actual Participants
285 215 152 116

ACADEMEUniversity of Bohol, Graduate School
and Professional Studies Journal
54
Out of the 215 employees who completed the questionnaires, 116 of them qualified to become respondents of the study.
Profile of Respondents
Figure 1. Age Distribution of the Respondents
Figure 1 provides the age distribution of the respondents. Middle adults were the biggest group which comprised 73 (62.93%); this was followed by the Young Adults who composed more than a fourth (27.58%), and almost a tenth (9.48%) belonged to the late adult respondents.
Figure 2. Sex Distribution of UB Employees
Peer Reviewed Journal
55
As to the sex distribution, Figure 2 clearly illustrates that there were 38 male employees (32.75%) while 78 were female (67.24%) who participated in the study. The data showed that majority of the respondents were middle-aged, female and working as part of the teaching staff. It was noted on the Psychosocial Developmental Theory of Erikson, (Erikson, 1991) the person on stage strives to achieve generatively being characterized as the ability to show concern to others beyond the family, with the community, society and the world. The inability to cope with this stage leads to self-absorption (Elkind, 1970). Based on the facts stated on Erikson’s theory, the researchers infer that the respondents are prone to stresses and burn-out situation since this is the time individual strives hard to maintain their treasured family and career to encompass a better future.
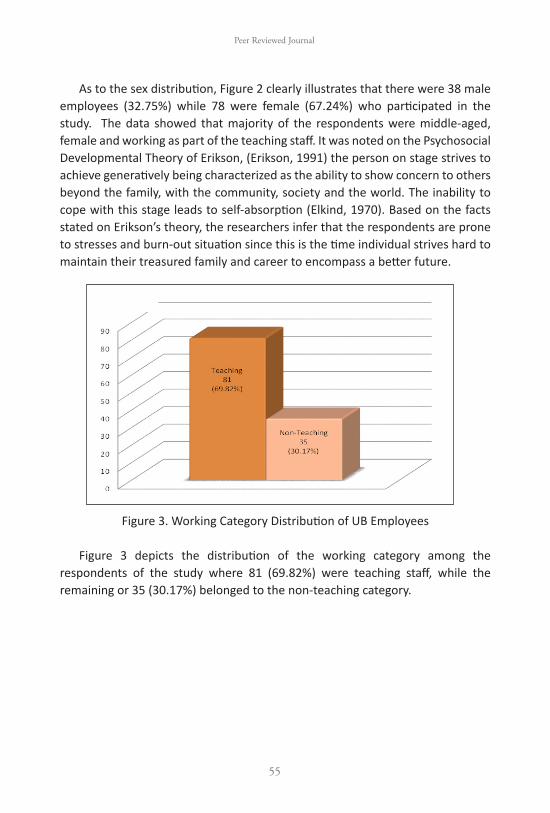
Figure 3. Working Category Distribution of UB Employees
Figure 3 depicts the distribution of the working category among the respondents of the study where 81 (69.82%) were teaching staff, while the remaining or 35 (30.17%) belonged to the non-teaching category.

ACADEMEUniversity of Bohol, Graduate School
and Professional Studies Journal
56
Table 2. Lifestyle Status of the Respondents
Item Weighted Mean Interpretation
Dietary Practices
Water 1.99 Moderately Healthy
Grains and Cereals 2.46 Moderately Healthy
Fruits 2.47 Moderately Healthy
Vegetables 2.44 Moderately Healthy
Fish, Meat, Poultry 2.46 Moderately Healthy
Milk 2.47 Moderately Healthy
Oils and Fats 3.43 Unhealthy
Sweets and Sugar 3.51 Unhealthy
Physical Activity
Day to Day Activities 2.44 Moderately Healthy
Lack of Aerobic Exercises 3.66 Unhealthy
Lack of Recreational Activities 3.75 Unhealthy
Leisure Activities 2.46 Moderately Healthy
Flexibility & Strength Exercises 2.48 Moderately Healthy
Sedentary Activities 3.85 Unhealthy
Personal Habits
Smoking 1.17 Healthy
Alcohol 1.55 Healthy
Caffeinated Drinks 2.53 Moderately Unhealthy
Total
General Lifestyle 2.50 Moderately Unhealthy
Legend:Healthy Lifestyle - 1.0 to 1.7Moderately Healthy Lifestyle - 1.8 to 2.4Moderately Unhealthy Lifestyle - 2.5 to 3.2Unhealthy Lifestyle - 3.3 to 4.0
Table 2 presented the pattern of lifestyle of UB employees for the past 4 months in terms of their dietary practice, physical activity and personal habits. Based on the results, the university employees have indicated the top two dietary

Peer Reviewed Journal
57
practices which were classified as Unhealthy Lifestyles namely Sweets and Sugar (3.51) and Oils and Fats (3.43). The two dietary practices which were classified as Moderately Healthy were Vegetables (2.44) and Water (1.99).
Pertaining to the category of activity and exercise section, the respondents rated the Sedentary Activities (3.85), Lack of Recreational Activities (3.75) and Lack of Aerobic Exercise (3.66) as Unhealthy. Found at the bottom were Flexibility and Strength Exercises (2.48), Leisure Activities (2.46) and Day to Day Activities (2.44) which were all considered Moderately Healthy.
As to Personal habits of the respondents, top rank was Caffeinated Drinks (2.53) which was considered Moderately Unhealthy. At the bottom of the ranking were Drinking Alcohol (1.55) and Smoking (1.17), which were classified as Healthy.
In general, the lifestyle status of the respondents garnered a mean score of 2.50 which is considered moderately unhealthy lifestyle. This can be attributed to the high sugar and fat intake, lack of aerobics and recreational activities and engaging more on sedentary activities. In addition, among the three aspects it was noted that physical activity is dominantly the cause of their unhealthy lifestyles. This affirmed the study conducted by Franco and Fusetti 2004 the damaging effect of sedentary activities and health consequences (Tremblay et al 2010).
Figure 4. Extent of Risk on the Development of Diabetes Mellitus Type II

ACADEMEUniversity of Bohol, Graduate School
and Professional Studies Journal
58
Figure 4 showed the extent of risk of the respondents of developing Diabetes Mellitus Type II. Extent of risk was based on the casual blood sugar obtained through the glucometer from the qualified respondents and presence of suggestive signs and symptoms. The suggestive signs and symptoms were frequent intake of water due to thirst or polydipsia, frequent intake of food due to hunger and urinating frequently. Other symptoms were blurring of vision; difficulty of healing wounds, loss of weight and easily get tired (DOH, 2000).
Among the 116 respondents, 20 (17.24%) obtained a casual blood sugar result of 80-10mg/dl which is considered at low risk for the development of diabetes mellitus, 91 (78.44%) respondents got blood glucose of 110 to 200mg/dl who were moderately at risk for the development of diabetes mellitus, while the remaining 5 (4.31%) had casual blood sugar result above 200 mg/dl who were considered high risk.
On the suggestive signs and symptoms, 81 (69.82%) had 3-4 suggestive signs and symptoms of diabetes. It was followed by 24 (20.68%) that had 0-2 suggestive signs and symptoms of the condition, and the remainder of 11 (9.48%) showed 5-7 suggestive signs and symptom which can be classified as high risks.
Table 3. Computed Weighted Mean of Casual Blood Sugar and Suggestive Signs and Symptoms of Diabetes Mellitus Type II
Factor Weighted Mean Interpretation
Casual Blood Sugar 2.23 Moderate Risk
Suggestive Signs and Symptoms 2.39 Moderate Risk
Legend: Low Risk - 1.0 to 1.6 Moderately Risk - 1.7 to 2.3 High Risk - 2.4 to 3.0
Table 3 gives a clear picture on the computed weighted mean of casual blood sugar and suggestive signs and symptoms of diabetes mellitus type II. In general, UB employees garnered a mean score of 2.23 for casual blood sugar and 2.39 for suggestive signs and symptoms, which is interpreted as moderate risk for the development of diabetes. With the above results, it is inferred that UB employees have potential risk on the development of diabetes mellitus. This is

Peer Reviewed Journal
59
in line with the American Diabetes Association (1997) recommendation that an increased blood glucose level of 200mg/dl or higher plus presence of signs and symptoms suggest the diagnosis of diabetes.
The Difference between Lifestyle Status and Demographic Profile of UB Employees
Figure 5. Age and Lifestyle Status of the Respondents
Figure 4 illustrates the age and lifestyle status of the respondents. Among the early adults, it was a split between moderately healthy (50%) and moderately unhealthy (50%). Majority (52%) among the middle adults and the late adults (55%) were moderately unhealthy.
Figure 6. Sex and Lifestyle Status of UB Employees Figure 5 shows the sex and lifestyle status of the respondents. The males were
equally represented by moderately healthy (50%) and moderately unhealthy (50%), meanwhile, majority of the women are moderately unhealthy.
ACADEMEUniversity of Bohol, Graduate School
and Professional Studies Journal
60
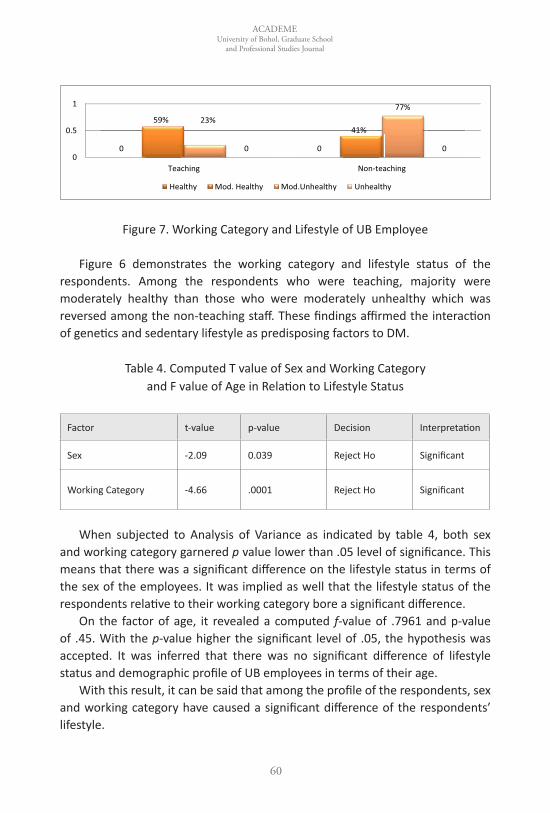
Figure 7. Working Category and Lifestyle of UB Employee
Figure 6 demonstrates the working category and lifestyle status of the respondents. Among the respondents who were teaching, majority were moderately healthy than those who were moderately unhealthy which was reversed among the non-teaching staff. These findings affirmed the interaction of genetics and sedentary lifestyle as predisposing factors to DM.
Table 4. Computed T value of Sex and Working Category and F value of Age in Relation to Lifestyle Status
Factor t-value p-value Decision Interpretation
Sex -2.09 0.039 Reject Ho Significant
Working Category -4.66 .0001 Reject Ho Significant
When subjected to Analysis of Variance as indicated by table 4, both sex
and working category garnered p value lower than .05 level of significance. This means that there was a significant difference on the lifestyle status in terms of the sex of the employees. It was implied as well that the lifestyle status of the respondents relative to their working category bore a significant difference.
On the factor of age, it revealed a computed f-value of .7961 and p-value of .45. With the p-value higher the significant level of .05, the hypothesis was accepted. It was inferred that there was no significant difference of lifestyle status and demographic profile of UB employees in terms of their age.
With this result, it can be said that among the profile of the respondents, sex and working category have caused a significant difference of the respondents’ lifestyle.

Peer Reviewed Journal
61
Moreover, the lifestyle status of UB employees differed more based on their working category. This could be related to the type of workload provided to the employees based on their category. Non-teaching employees have been cited to be more prone to acquire unhealthy lifestyle as they are more exposed to paper work/table work that bounded them to have more sedentary activities.Besides, the age factor did not cause a significant difference as to the lifestyle status of UB employees.
Table 5. Relationship of Lifestyle Status and Extent of Risk on the Development of Diabetes Mellitus Type II
Computed Pearson r p-value Decision Interpretation
.739 .000 Reject Ho Significant
Table 5 exemplified the relationship between the lifestyle status and extent of risk on the development of diabetes. When subjected to Pearson Product Moment Correlation, results showed that there was a significant relationship that existed between lifestyle status and extent of risk on the development of diabetes mellitus type II. This means that lifestyle has a degree of influence on the development of diabetes mellitus type II. Furthermore, this entails that the unhealthier the respondents lifestyle, the more risk they will have on the development of diabetes mellitus type II. This study confirms the stipulation of Wing et al, 2001 that lifestyle that is associated with obesity, eating behavior, activity have roles in preventing and treating diabetes mellitus, therefore, a need to modify these lifestyle behaviors.
CONCLUSION
Based on the above findings, the study revealed that lifestyle status of UB employees have great influence on the extent of risk on the development of diabetes. This findings can be inferred that the more unhealthy their lifestyle, the greater the possibility they will develop diabetes mellitus type II. Also, it has been observed that unhealthy lifestyle state could be linked to the type of activity and dietary practice the employees had.
Furthermore, only the sex and working category on the demographic profile can cause a difference of the lifestyle of the respondents, but not the age implying that to reduce the potential risk of development of diabetes, the lifestyle status of UB employees should be modified for better and brighter future. The result

ACADEMEUniversity of Bohol, Graduate School
and Professional Studies Journal
62
affirms the unhealthy lifestyle defined by WHO 2008 as unhealthy diet, physical inactivity and personal habits can cause diabetes.
RECOMMENDATIONS
1. There is a need to conduct diabetes prevention through Lifestyle Modification Awareness Campaign Program and Lifestyle Modification Plan within the university campus.
2. The conduct of Diabetes Screening Test pre-employment and those already employed annually. A monthly monitoring through Fasting Blood Sugar determination for early detection of diabetes mellitus. The activity is to be done in the university medical clinic for prompt management and interventions.
3. Prevention of complications like amputation, cardiovascular conditions, kidney problems and other complications will be eradicated through lifestyle modification of those identified to have diabetes mellitus.
LITERATURE CITED
Cuevas, Frances Prescilla L. 2007.Public Health Nursing in the Philippines 10th Ed., National League of Philippine Government of Nurses Inc.
Edelman, C. L., Mandle, C. L., &Kudzma, E. C. (Eds.).(2013). Health promotion throughout the life span.Elsevier Health Sciences. Retrieved from http://goo.gl/QNznkb, (Accessed last April 20, 2014).
Gatbonton, Patricia B., The Unfit Filipino. Retrieved from http://www.doh.com.ph
Elkind, D. (1970). Erik Erikson’s eight ages of man. New York Times magazine, April, 81-86.Retrieved from http://goo.gl/Vff10v (Accessed last April 20, 2014).
Guidelines/Criteria on the diagnosis of Diabetes Mellitus. Retrieved from http://www.diabetes.org
Jones, E. D., Kennedy-Malone, L., &Wideman, L. (2004).Early detection of type 2 diabetes among older African Americans. Geriatric Nursing, 25(1), 24-

Peer Reviewed Journal
63
28, Retrieved from http://goo.gl/4vMC8l, (Accessed last April 20, 2014).
Kozier, B., Erb, G., Berman, A., & Snyder, S. (2004). Fundamentals of Nursing, Concepts, Process and Practice 7th Ed., Pearson Prentice Hall Publisher, New Jersey.
Mag-Healthy Lifestyle(HL) Tayo Program. Retrieved from http://www.doh.com.ph
Philippine Health Statistics. Retrieved from http://www.doh.gov.ph
Spasoff, J. M., Harris, S. S., &Thuriaux, M. C. (Eds.). (2001). A dictionary of epidemiology (4th ed.). New York: Oxford University Press.
Statistics on Lifestyle Related Diseases Worldwide. Retrieved from http://www.who.org
Tremblay, M. S., Colley, R. C., Saunders, T. J., Healy, G. N., & Owen, N. (2010).Physiological and health implications of a sedentary lifestyle. Applied Physiology, Nutrition, and Metabolism, 35(6), 725-740. Retrieved from http://goo.gl/B6y5kT (accessed last April 20, 2014).
Tuomilehto, J., Lindström, J., Eriksson, J. G., Valle, T. T., Hämäläinen, H., Ilanne-
Parikka, P., ...&Uusitupa, M. (2001). Prevention of type 2 diabetes mellitus by changes in lifestyle among subjects with impaired glucose tolerance. New England Journal of Medicine, 344(18), 1343-1350. Retrieved from http://goo.gl/3wAJU6 (Accessed last April 22, 2014).
Velandria, F. V., Duante, C. A., Abille, E.T., Tangko, J. B., Nutrition and Health Status of Filipino Adults (Excerpts from the National Nutrition and Health Survey): 2003-2004 For the Multi-Sectoral Task Force on NNHeS: 2003-2004 http://goo.gl/TFkwVg (Accessed last April 21, 2014)
Wing, R. R., Goldstein, M. G., Acton, K. J., Birch, L. L., Jakicic, J. M., Sallis, J. F., ... &Surwit, R. S. (2001). Behavioral science research in diabetes lifestyle changes related to obesity, eating behavior, and physical activity. Diabetes care, 24(1), 117-123.Retrieved from http://goo.gl/1gf40Z (Accessed last April 20, 2014).