Embed Size (px)
Citation preview
Light Truck Frame Joint Stiffness Study
July 25, 2001
Altair Report No.: A/SP-005-1
Prepared By:
Katy Lewis, Project EngineerChristian Spencer, Project EngineerMichael White, Engineering Manager
Report: A/SP-005-1 Light Truck Frame Joint Stiffness Study 1
PREFACE
The Light Truck Frame Project Group entrusted Altair Engineering Inc. to conduct the Light Truck FrameJoint Stiffness Study. This report comprises the results of Phase 1, the modeling and testing of five jointstypically used in light truck frames. Subsequent, similar phases to study additional frame joints areplanned by the Light Truck Frame Project Group. The study results are presented in two documents. Thisdocument describes the study and its results. The other document, an Excel Spreadsheet, is aninteractive tool that frame designers may use to determine the stiffness for variations of the five joints inPhase 1. This tool will help designers reduce the weight of light truck frames.
Report: A/SP-005-1 Light Truck Frame Joint Stiffness Study 2
EXECUTIVE SUMMARY
Background
There is little published information available to frame designers on the relative stiffness of the joints in alight truck frame. A survey of current production frames found that most frames used joint styles from agroup of approximately 15 joints. Many joints had obvious packaging or manufacturing-driven constraints,but the relative merits of each joint type is not well documented or available in a form useful for framedesigners. The A/SP Light Truck Frame committee felt that a study to determine relative stiffness of thejoints, along with a tool to communicate the results of the study to frame designers, would allow betterdecisions to be made at the concept design phase and would facilitate lighter weight frame design.
Project Goals
The goal of this program is to provide the frame designers with data and tools to facilitate early conceptchoices for frame joints that promote more efficient, and lighter weight steel designs. The Frame JointToolbox resulting from this program takes the form of an interactive worksheet a designer can use toinvestigate the choices of different joint designs, and varying parameters within a design.
In order to achieve the goal, the scope of the project involves the following steps:
• Research and organize existing information available on joint stiffness• Develop methods to characterize joint stiffness and evaluate analytically using finite element analysis• Perform physical tests on multiple (three) samples of five joint types• Correlate the physical testing and finite element analysis• Evaluate the sensitivity of the joint stiffness to the various joint parameters• Create the Frame Joint Toolbox that incorporate design rules and the sensitivity analysis
Project Results
Based on the literature search, and newly developed methods, a process was developed to evaluate thestiffness of a side rail to crossmember joint, and an interactive Frame Joint Toolbox was developed todocument the program results, and provide a mechanism for frame designers to utilize the data in thedesign process. The joint stiffnesses varied from 0.116 KNm/deg to 50.429 KNm/deg and the mass of thejoints ranged from 4.68 kg to 7.01kg. The Toolbox is based on an interactive spreadsheet. Thespreadsheet allows the designer or engineer to modify the geometric and gage properties of the jointmembers, and calculates joint stiffness and relative mass based on the new properties.

Report: A/SP-005-1 Light Truck Frame Joint Stiffness Study 3
ACKNOWLEDGEMENTS
Altair would like to acknowledge the following members of the A/SP Light Truck Frame Project for theirvaluable assistance in establishing this study, and guiding it to a successful conclusion.
Gary Banasiak General Motors Corporation
Eric Batt Bethlehem Steel Corporation
Ravir Bhatnagar Ispat Inland Inc.
John Caito The Budd Company
Jim Cran Cran Associates Inc.
Eric Dowdle Formerly, Dofasco Inc.
Ted Diewald Auto/Steel Partnership
Tom Hedderly Ford Motor Company
Ed Law DaimlerChrysler Corporation
Marek Marchwica Stelco Inc.
Jim O’Connor Vehma International of America
Dan Partee Formerly, Ford Motor Company
David Ruhno U. S. Steel Group, a unit of USX Corporation
Michael Shih U. S. Steel Group, a unit of USX Corporation
James Starling National Steel Corporation
Vince Stashko Tower Automotive
Raj Thakkar Formerly, Tower Automotive
Altair would like to make special mention to the following who provided the test joints and CAD data usedin this study:
Gary Banasiak General Motors Corporation
John Caito The Budd Company
Tom Hedderly Ford Motor Company
Jim O’Connor Vehma International of America
Dan Partee Formerly, Ford Motor Company

Report: A/SP-005-1 Light Truck Frame Joint Stiffness Study 4
TABLE OF CONTENTS
Introduction ......................................................................................................................................... 5Literature Search................................................................................................................................. 6
Introduction ............................................................................................................................ 6Defining the Joint ................................................................................................................... 6Testing ................................................................................................................................... 7Finite Element Analysis.......................................................................................................... 7Joint Stiffness......................................................................................................................... 8Lessons Learned.................................................................................................................... 8Conclusions............................................................................................................................ 9
Finite Element Analysis..................................................................................................................... 10Introduction .......................................................................................................................... 10Defining the Joints................................................................................................................ 12Finite Element Analysis Model............................................................................................. 13Loading Conditions .............................................................................................................. 14Stiffness Calculations........................................................................................................... 15Table 1: Analysis Stiffness Summary .................................................................................. 18
Testing Procedure............................................................................................................................. 19Introduction .......................................................................................................................... 19Joint Preparation .................................................................................................................. 19Joint Fixturing....................................................................................................................... 19Deflection Measurement ...................................................................................................... 19Force Application ................................................................................................................. 19Test Repeatability ................................................................................................................ 20Joints 1-4 Joint Preparation and Fixturing ........................................................................... 21Joints 1-4 Pneumatic Cylinder Setup................................................................................... 22Joint 1 Joint Sample and Test Setup ................................................................................... 23Joint 2 Joint Sample and Test Setup ................................................................................... 27Joint 3 Joint Sample and Test Setup ................................................................................... 31Joint 4 Joint Sample and Test Setup ................................................................................... 35Joint 5 Joint Preparation and Fixturing ................................................................................ 39Joint 5 Hanging Weight Setup ............................................................................................. 40Joint 5 Joint Sample and Test Setup ................................................................................... 41Joint Stiffness Summary ...................................................................................................... 44Data...................................................................................................................................... 44Table 2: Test Joint Stiffness Summary ................................................................................ 46
Correlation......................................................................................................................................... 47Introduction .......................................................................................................................... 47Correlating the Test and Analysis Data ............................................................................... 47Table 3: Test and Analysis Joint Stiffness Correlation Summary........................................ 48
Sensitivity Study ................................................................................................................................ 49Introduction .......................................................................................................................... 49Joint Parameters .................................................................................................................. 49
Joint Stiffness Toolbox ...................................................................................................................... 58Introduction .......................................................................................................................... 58
References ........................................................................................................................................ 69Appendix A: Abstracts....................................................................................................................... 70Appendix B: Material Testing Report ................................................................................................ 86Appendix C: Test Results................................................................................................................ 110Appendix D: Diagram of Joint in Test Fixture ................................................................................. 118
Report: A/SP-005-1 Light Truck Frame Joint Stiffness Study 5
INTRODUCTION
Currently, there is no standardized reference manual or process for frame designers to employ whendeveloping new frame architecture. At the request of the Auto Steel Partnership, Altair Engineering Inc.has performed a literature search, finite element analysis, physical joint testing, and sensitivity analysis offive common crossmember to side rail joints in order to provide designers with a “Joint Stiffness Toolbox.”The purpose of this report is to present the results of Altair’s research and analysis and provide designrules and guidelines for joint stiffness, which will help designers implement robust, yet lightweight, framedesigns.

Report: A/SP-005-1 Light Truck Frame Joint Stiffness Study 6
LITERATURE SEARCH
Introduction
A literature search was performed to identify previous published papers on testing, finite element analysisand design guidelines for steel joints. The research is summarized below. Abstracts of the 43 articles thatwe identified as relevant and read, along with 12 additional articles that we judged not relevant and didnot pursue, are included in the appendix.
Two papers contained information on light truck frames and frame stiffness. The articles were written on avan frame structural evaluation (Hull, 1979) and an idealized truck frame design (Michejda, 1971). Botharticles mentioned joint stiffness but provided very little detailed information about joint design or analysis.Much of the available automotive research focused on body joint design. There were many papers onwelded joints used in construction trusses and offshore oil platforms (tube through tube joints) whichprovided valuable information on joint measurement and test fixtures.
Defining the Joint
Studies from civil engineering structures focused extensively on structural (non-automotive) frames andjoint stiffness and stress testing. These studies, however, included pertinent information regardingspecimen size, constraints, loading and instrumentation. The length of the structure surrounding the jointinterface should be sufficiently long to minimize the influence of the end conditions (Chiew, 1996), andsufficiently small to keep the surrounding structure from affecting the stiffness. The joint dimensions weused were based on the work of Rao et. al. 1983 and adhered to the following guidelines:
• The test joints contained a finite amount of surrounding structure• All unique characteristics of the joints were included (i.e. local reinforcements, extended flanges,
access and lighting holes)• Inclusion of surrounding structure was minimized to prevent joint stiffness value contamination• Standard dimensions containing identical amounts of structure were used, when possible, for
comparison across joint types• Joint samples were removed from the frame structure to isolate their performance. To facilitate
testing, joint boundaries were developed in the plane of the cross section of the crossmember and rail• Load and support plates were welded to the ends of the joint specimen for load application and
restraint
Our test samples adhered to the guidelines in the following manner:
• Joints were tested to evaluate the optimum length to incorporate the unique characteristics of the joint• We established boundaries 150mm from the joint interface to be used in all joint samples• The joints were removed from the surrounding frame structure at the established boundaries• ¾-inch end plates were welded to the joint for the constraining and load application fixture

Report: A/SP-005-1 Light Truck Frame Joint Stiffness Study 7
LITERATURE SEARCH
Testing
The joint testing literature we reviewed was composed of fixturing, setup, instrumentation and testmethods. Because we were looking to evaluate the stiffness of the joint type, for a comparison to othertypes, the fixturing and testing methods were critical to adequately evaluate the joint stiffness. In theliterature search, the following testing methods were noted:
• The test fixture (rig) is designed to ensure that the deflection of the rig is an order of magnitude lowerthan that of the specimen (Yeoh S-k et al., 1995)
• When setting up the joints for testing, the specimen should be first subjected to an incremental staticload (Yeoh, 1995). Shanmugam, 1995, specifies that pre-load should be 5% of the expected ultimateload to help remove residual stresses and ensure the rigidity of the test fixture.
• The end loading conditions, either bolted to a bedplate via an end plate welded to the flange beam(Korol et al, 1977) or simply supported (Shanmugam et al, 1995), were based on the jointconfiguration and loading
• The load should be applied “in increments of about 10% of the expected branch member’s workingcapacity” (Koral, 1979)
Different loading techniques were investigated due to the geometric variance of the structure surroundingthe joints. These geometric variations in the joints include height and section changes in the side rail andcrossmember. Superposition versus direct loading was considered as an option to remove unwantedadditional loads due to height variation inducing a moment in the joint. Yeoh et al., 1996, reported goodcorrelation between test and analysis with this comparison, where the two different loads were applied atthe same time and then individually and the results combined. Another method for removing the inducedmoment was found by applying the load at the shear center of the crossmember.
Instrumentation of the joint deflection was consistent throughout the researched papers, focusing onobtaining comprehensive information relating to joint deformation. Tests involved the use of dialindicators, including redundant measurement devices on the joint to evaluate non-linearity in thedeflection (Korol et al., 1977). Another measurement set-up allowed both the rotation of the crossmemberto side rail interface as a whole, and the contributions of the individual components to be obtained(Bernuzzi et al., 1996). Overall, although the experimentation reviewed in literature pertained mostly tolarge building type frame joints, the methods could still be applied in the evaluation of smaller-scale truckframes because the same static analysis principles are present.
Finite Element Analysis
The finite element modeling technique was researched based on model element types, constraints, andassumptions. Different modeling techniques have been applied with good success. Van Wingerde, 1992,modeled the weld with “solid elements to allow for a clear definition of the weld toe.” This was donebecause “simple FE models without modeling of the corner radii and weld that might be used for theanalysis of the static behavior of the joints will not be satisfactory for fatigue analysis”(van Wingerde,1992). In van Wingerde’s analysis, “all FE analyses carried out are linear elastic.”
Another area of focus in the analysis is spot weld modeling. Garro et al., 1986, “simulated spot welds bybeam elements having a section equal to the width of one of the spots and a length equal to the distancebetween the mean surfaces of the two welded plate edges.” In all of the research papers, the membersections were simulated with shell elements.

Report: A/SP-005-1 Light Truck Frame Joint Stiffness Study 8
LITERATURE SEARCH
Joint Stiffness
The research evaluation of joint stiffness and rotation focused on the definition of joint stiffness and whereto calculate it. Different methods of measuring stiffness were employed based on where and how tomeasure the deflection in order to calculate the rotation. Liew defined their method to measure therotation based on the “deformation of the connection elements, not deformation of the column and beammembers” (Liew et al. 1997). Some assumptions were made analyzing the joints and calculating stiffness:the material is linear elastic, in-plane deformations are negligible, and the deformations are small andmainly due to bending. With these assumptions, the stiffness is calculated as K=M/θ . The rotation θ andapplied moment M are based on the instantaneous center of rotation (Rao et. al, 1983).
For the sensitivity study of the joint, the joint parameters, member thickness and shape are varied tomeasure how sensitive the joint is to a particular parameter. Although actual stiffness predictionexperiments were not found in the literature, relevant information was found regarding stressconcentration factors (SCF). “From the raw SCF numerical values, parametric equations were obtained atthe six critical locations for the three load cases under consideration. The parametric equations wereobtained using MATLAB, which is capable of performing a non-linear data fitting by using different leastsquare methods” (Chiew et al.,1996). For the stiffness analysis, a similar technique of finding the criticallocations can be used for data fitting parametric equations to the joint stiffness. The parametric equationfor the joint sensitivity can also be calculated analytically through a design of experiments.
Lessons Learned
Joint Definition:
• The length of the structure surrounding the joint interface should be sufficiently long to minimize theinfluence of the end conditions (Chiew, 1996)
• Joints should contain all the unique characteristics (i.e. local reinforcements, extended flanges,access and lightening holes), minimize the inclusion of surround structure, and have boundariesdefined in plane of the crosssection of the beam member (Rao et al., 1983)
• The joint stiffness has a large effect on system dynamic performance (offshore platform) (Chen &Zhang, 1996). Joints must be well discretized to measure the stiffness using dynamic methods(Becker et al., 1999)
• Joint stiffness has a greater effect on system stiffness when the joint stiffness is decreased than whenit is increased, suggesting that current body joints are designed near a “threshold” value (Chen, 1998)
Fixture/Test Setup:
• Designing the rig’s stiffness to ensure that the deflection of the rig when the specimen is loaded is anorder of magnitude lower than that of the specimen (Yeoh S-k et al. 1995)
• Bolt torque and weld quality are critical in measuring maximum capacity of the joint (Davison et al.,1987)
Test Procedure and Load Cases:
• The specimen should first be subjected to an incremental static loading on one axis, and the strainschecked for linearity and zero drift to indicate shake-down of residual stresses (Yeoh et al., 1995)

Report: A/SP-005-1 Light Truck Frame Joint Stiffness Study 9
LITERATURE SEARCH
Measurements:
• To evaluate the initial stiffness of the connection, the following assumptions are made: the material islinear elastic, the deformations are small and mainly due to bending and in-plane deformations arenegligible (Korol et al., 1996)
• Measurement should be set up allowing for both the rotations of the connections as a whole and thecontributions of the various components to be obtained (Bernuzzi et al., 1996)
FE Model:
• All nodes lying on the cut surfaces of the model should be subjected to an imposed boundarycondition in which displacements normal to the plane of symmetry and rotations about that plane arerestrained (Chiew et al., 1996)
• For closer correlation with experimental measurements, it is necessary to model the variation ofthickness in the cross-section of the rail and crossmember and the corner radii as realistically aspossible (Van Wingerde, 1992)
Conclusions
Valuable information in testing, FEA joint stiffness and sensitivity studies provided a basis of informationto initiate the light truck frame joint stiffness study and the development of guidelines for improving jointstiffness. Ultimately, the literature search revealed that no current studies are available in openpublications specifically evaluating truck frame joint stiffness and parameterizing those values that affectjoint stiffness.
Report: A/SP-005-1 Light Truck Frame Joint Stiffness Study 10
FINITE ELEMENT ANALYSIS
Introduction
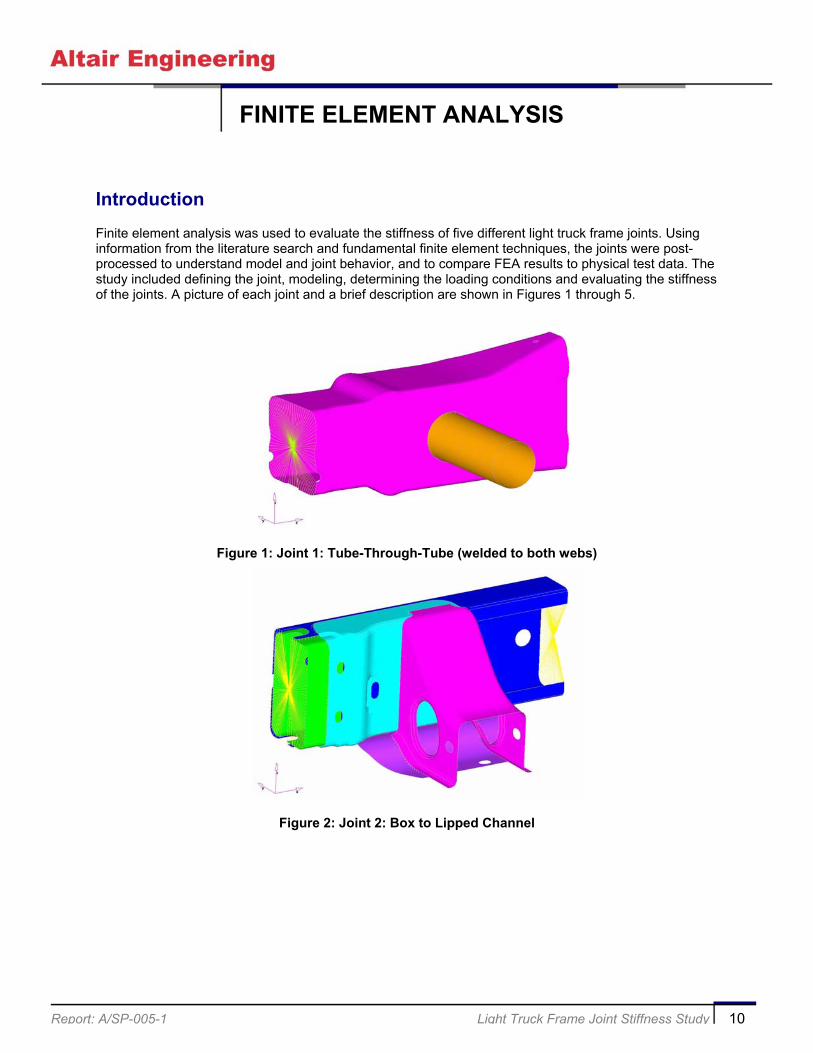
Finite element analysis was used to evaluate the stiffness of five different light truck frame joints. Usinginformation from the literature search and fundamental finite element techniques, the joints were post-processed to understand model and joint behavior, and to compare FEA results to physical test data. Thestudy included defining the joint, modeling, determining the loading conditions and evaluating the stiffnessof the joints. A picture of each joint and a brief description are shown in Figures 1 through 5.
Figure 1: Joint 1: Tube-Through-Tube (welded to both webs)
Figure 2: Joint 2: Box to Lipped Channel
Report: A/SP-005-1 Light Truck Frame Joint Stiffness Study 11
FINITE ELEMENT ANALYSIS
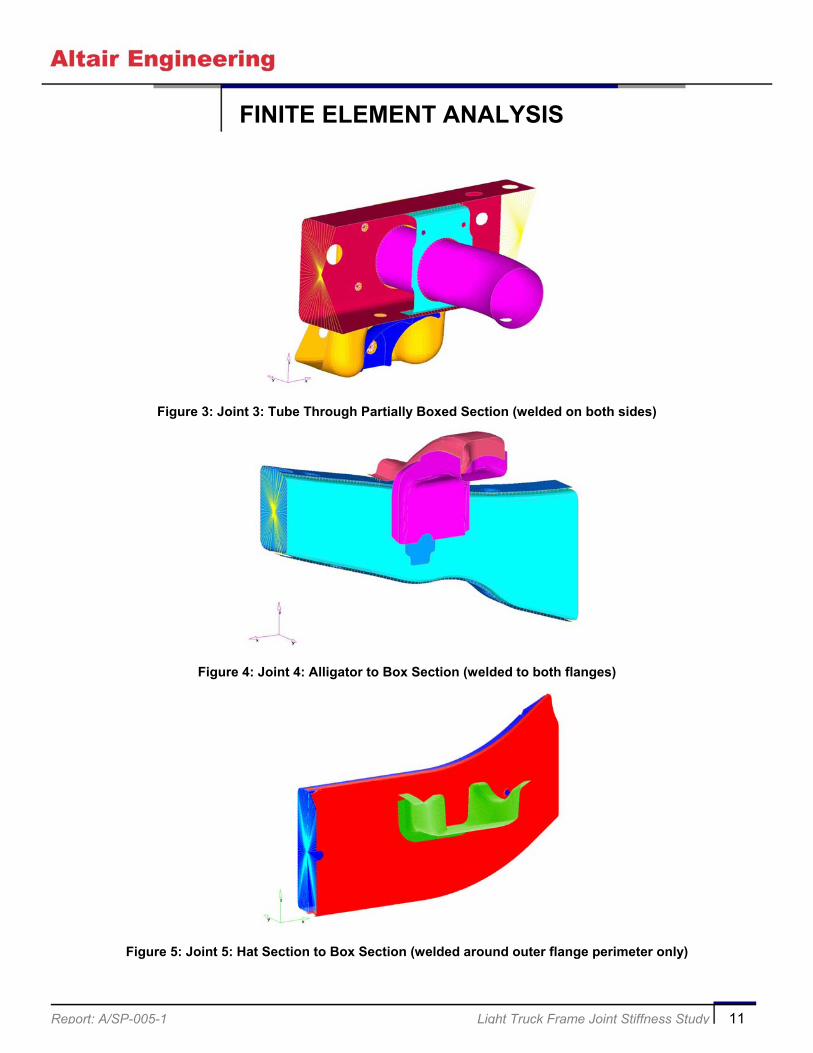
Figure 3: Joint 3: Tube Through Partially Boxed Section (welded on both sides)
Figure 4: Joint 4: Alligator to Box Section (welded to both flanges)
Figure 5: Joint 5: Hat Section to Box Section (welded around outer flange perimeter only)
Report: A/SP-005-1 Light Truck Frame Joint Stiffness Study 12
FINITE ELEMENT ANALYSIS
Defining the Joints
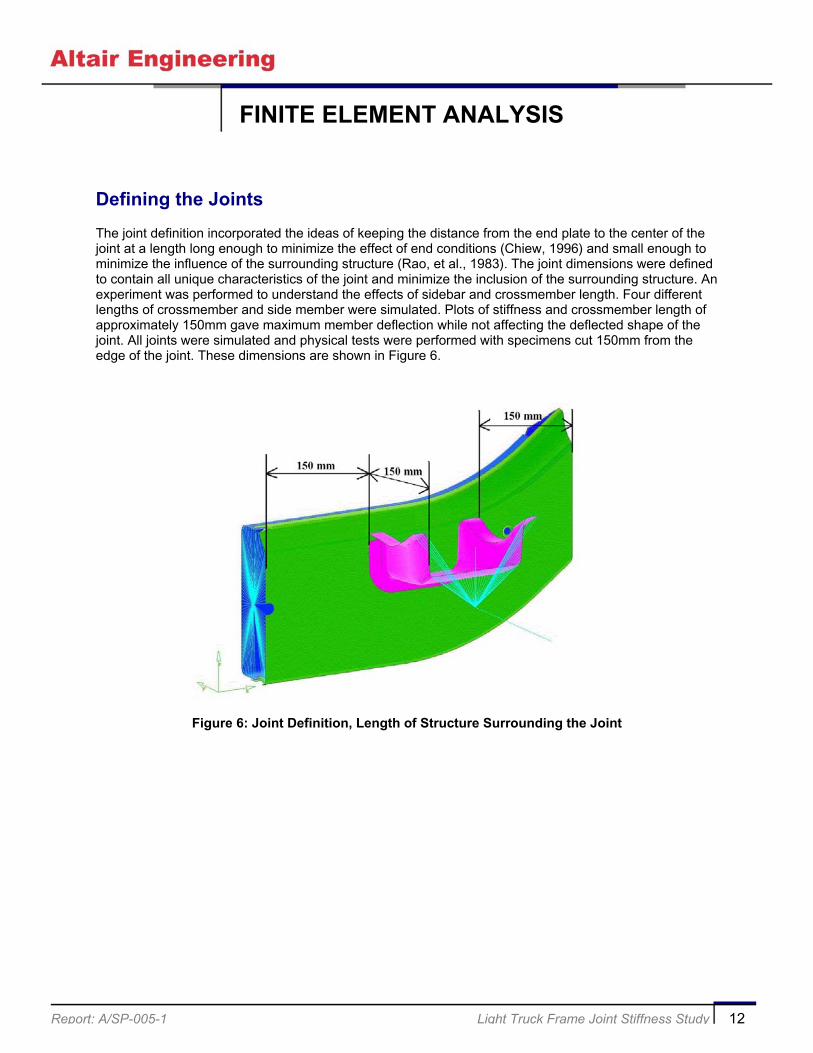
The joint definition incorporated the ideas of keeping the distance from the end plate to the center of thejoint at a length long enough to minimize the effect of end conditions (Chiew, 1996) and small enough tominimize the influence of the surrounding structure (Rao, et al., 1983). The joint dimensions were definedto contain all unique characteristics of the joint and minimize the inclusion of the surrounding structure. Anexperiment was performed to understand the effects of sidebar and crossmember length. Four differentlengths of crossmember and side member were simulated. Plots of stiffness and crossmember length ofapproximately 150mm gave maximum member deflection while not affecting the deflected shape of thejoint. All joints were simulated and physical tests were performed with specimens cut 150mm from theedge of the joint. These dimensions are shown in Figure 6.
Figure 6: Joint Definition, Length of Structure Surrounding the Joint
Report: A/SP-005-1 Light Truck Frame Joint Stiffness Study 13
FINITE ELEMENT ANALYSIS
Finite Element Analysis Model
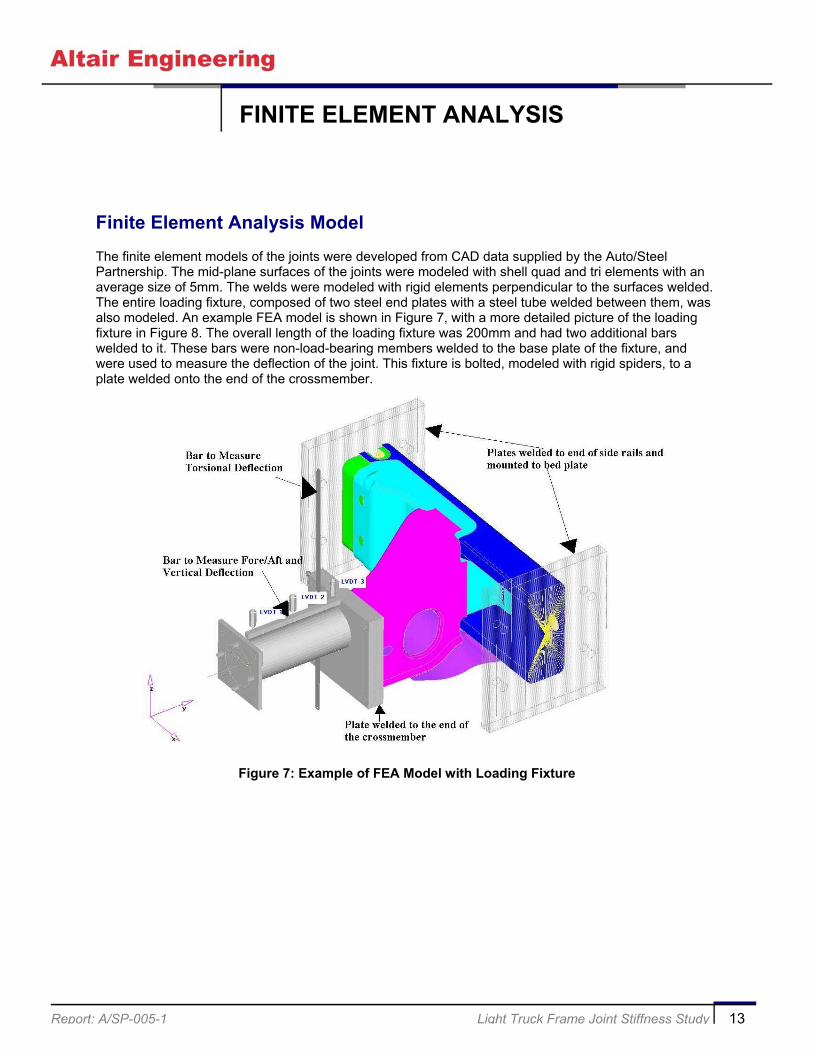
The finite element models of the joints were developed from CAD data supplied by the Auto/SteelPartnership. The mid-plane surfaces of the joints were modeled with shell quad and tri elements with anaverage size of 5mm. The welds were modeled with rigid elements perpendicular to the surfaces welded.The entire loading fixture, composed of two steel end plates with a steel tube welded between them, wasalso modeled. An example FEA model is shown in Figure 7, with a more detailed picture of the loadingfixture in Figure 8. The overall length of the loading fixture was 200mm and had two additional barswelded to it. These bars were non-load-bearing members welded to the base plate of the fixture, andwere used to measure the deflection of the joint. This fixture is bolted, modeled with rigid spiders, to aplate welded onto the end of the crossmember.
Figure 7: Example of FEA Model with Loading Fixture

Report: A/SP-005-1 Light Truck Frame Joint Stiffness Study 14
FINITE ELEMENT ANALYSIS
Figure 8: Close Up Picture of Loading Fixture
Loading Conditions
The three stiffnesses, Kx, Ky, and Kz are the rotations of the crossmember relative to the side rail. Kx isobtained by applying a vertical load (+/- Z) at the end of the crossmember and measuring the rotationfrom the vertical deflection of the non-load-bearing bar on the fixture. Ky is obtained by applying atorsional load (+/- Y) along the crossmember and measuring the rotation from the fore/aft deflection of abar attached to the base of the fixture. For Kz, a fore/aft load (+/- X) is applied at the cross member andthe rotation from the fore/aft deflection of the non-load-bearing bar on the fixture is measured. Each loadwas applied at the end of the loading fixture. The fixture was used to increase applied moment, permittinglower loading forces and measurable deflections during test. The loading was adjusted for each joint sothe peak stress was 200MPa, permitting the maximum deflection without the risk of yielding the joint. Themodel was constrained at the two ends of the side rails with rigid spiders to the center of the section. Thecenter node was then constrained in all six degrees of freedom. The deflections were measured off anon-load-bearing bar that was attached to the base plate of the loading fixture. This assured that thedeflections measured would be that of the deformed joint, and not include deformation of the fixture.
Load Applied Here

Report: A/SP-005-1 Light Truck Frame Joint Stiffness Study 15
FINITE ELEMENT ANALYSIS
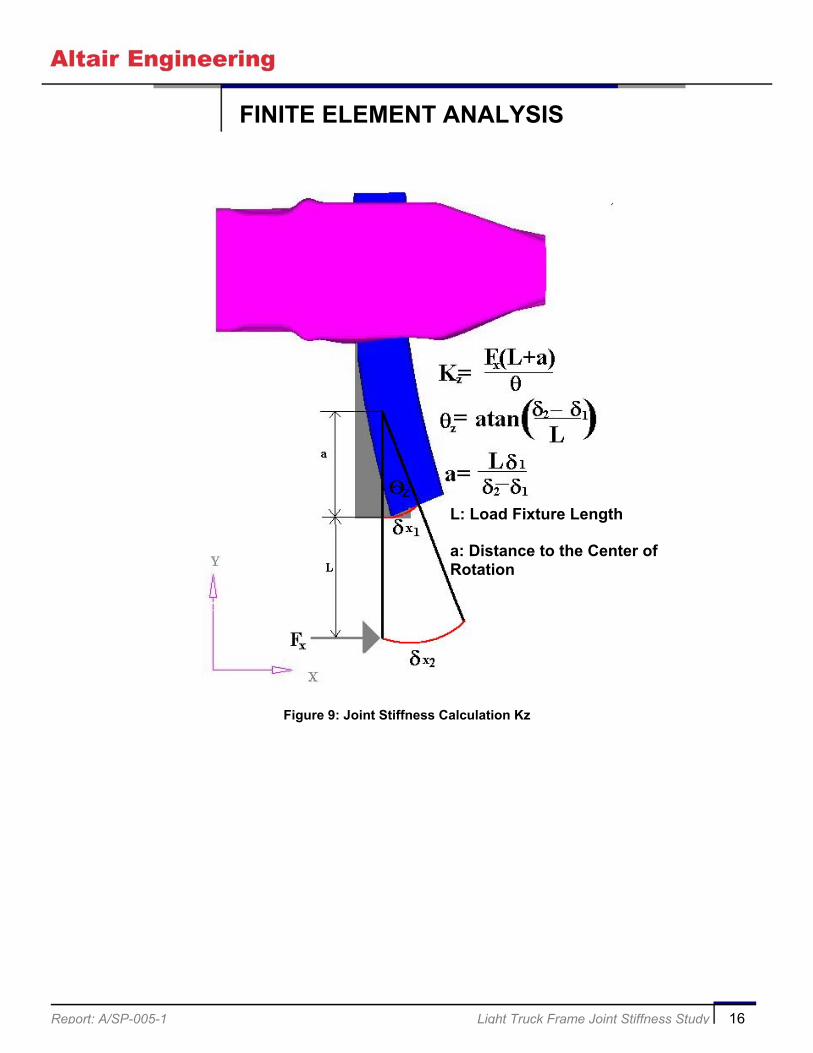
Stiffness Calculations
The joint stiffness is based on the load and deflection of the joint. It is calculated using the instantaneouscenter of rotation (Rao, 1983) to measure the applied moment. The center of rotation is calculated fromthe deflection of the joint members. The distance from the applied load to the center of rotation is thelength the load is applied over. This is significant in that it changes calculated applied moment. Thestiffness equation is:
θM
K =
where M is the applied moment and θ is the resulting rotation. Since the moment is the applied forcetimes the distance, and the distance is from the loading point, to the center of rotation, the stiffnessequation becomes:
θ)( aLF
K+
=
where F is the applied force, L is the distance between the two measured defections (δ2 and δ1) and a isthe length to the center of rotation. The equation for a, the distance to the center of rotation is:
12
1
δδδ−
=L
a
The rotation (θ) of the joint is:
−
=L
a 12tanδδ
θ
For the stiffnesses Kx and Kz the loads are applied as a force at the end of the loading fixture. Tocalculate the moment, the distance to the center of rotation is included in the calculation. These equationsare illustrated in Figures 9 and 10.
Report: A/SP-005-1 Light Truck Frame Joint Stiffness Study 16
FINITE ELEMENT ANALYSIS
Figure 9: Joint Stiffness Calculation Kz
L: Load Fixture Length
a: Distance to the Center ofRotation
z

Report: A/SP-005-1 Light Truck Frame Joint Stiffness Study 17
FINITE ELEMENT ANALYSIS
Figure 10: Joint Stiffness Calculation Kx
For the stiffness Ky, the load was applied as a moment. The equation simplifies, not needing to includethe additional length to the center of rotation, and is shown in Figure 11.
Figure 11: Joint Stiffness Calculation Ky
The calculated stiffness for the five joints is listed in Table 1.
x
y

Report: A/SP-005-1 Light Truck Frame Joint Stiffness Study 18
FINITE ELEMENT ANALYSIS
Table 1: Analysis Stiffness Summary
Kx Ky KzJoint 1: Tube- Through-Tube (welded atboth ends)
2.102 KNm/deg 3.059 KNm/deg 2.513 KNm/deg
Joint 2: Box to Lipped Channel
9.006 KNm/deg 5.117 KNm/deg 40.994 KNm/deg
Joint 3: Tube Through Partially BoxedSection (welded on both sides)
1.899 KNm/deg 5.567 KNm/deg 3.102 KNm/deg
Joint 4: Alligator to Box Section (welded toboth flanges)
0.543 KNm/deg 1.413 KNm/deg 1.016 KNm/deg
Joint 5: Hat Section to Box Section(welded all around)
0.100 KNm/deg 0.202 KNm/deg 0.202 KNm/deg

Report: A/SP-005-1 Light Truck Frame Joint Stiffness Study 19
TESTING PROCEDURE
Introduction
The five joints were tested under the same loading conditions as the finite element in order to latercorrelate the data. Three samples of each of the five joints were tested to identify the effect samplevariation. A written procedure and a pictorial procedure, included below, were used for testing. Thispictorial procedure, containing the joint preparation, fixturing and test setup is included for each of the fivejoints and can be found on pages 21-43. The test results are summarized in Stiffness Table 2.
Joint Preparation
The test joints and the surrounding frame material were removed with a plasma cutter from the framescontaining the test joints. These rough-cuts were made at a distance far enough from the joint area toavoid changing the material properties of the steel from the high heat. Final cuts at the required distance(usually 150mm from the joint) were performed on a band saw.
Joint Fixturing
All joints were equipped with steel plates on each end of the side rail and on the end of the crossmember.These plates were welded to the member ends. During test setup each joint was oriented with the siderail positioned parallel to the ground and the crossmember perpendicular. Longitudinal end plates werebolted to angle brackets that were in turn bolted to a bedplate. This proved to be a sufficiently stifffixturing method verified by a dial indicator during testing. A steel tube sandwiched between two steelplates was bolted to the crossmember end plate. This allowed force application at a distance away fromthe joint, increasing deflection to a measurable level while keeping the applied loads to a reasonablelevel. This fixture is shown in Appendix D.
Deflection Measurement
Deflection was measured using five Linear Variable Displacement Transducers (LVDTs). Twotransducers were placed on the side rail surface positioned parallel to the crossmember. The remainingthree LVDTs monitored lateral frame rail displacement and were positioned relative to the direction offorce being applied. Contact points for these three LVDTs were on additional surfaces not receiving anyof the applied loads. A diagram of the loading and measurement locations are shown in Appendix D.
Force Application
Based on the required loading, two different load application methods were employed. Joint 5, the HatSection to Box Section, had low loading requirements and a pulley/hanging weight system was used toapply the necessary force. This was chosen because of its simplicity to set up and run and its relativelylow cost. For each load case (X, Z, and torsion) loads were increased to the desired value, reduced backto zero load, and then repeated in the opposite direction. This procedure was repeated three times foreach of the three samples. For all other joints, air cylinders were implemented to apply the force. The aircylinders were chosen to provide increased force that would have been impractical to implement withweights. Measurements were taken as force was increased to maximum, decreased back to zero,increased to maximum in the opposite direction and then decreased back to zero to provide a continuoushysterisis loop.
Report: A/SP-005-1 Light Truck Frame Joint Stiffness Study 20
TESTING PROCEDURE
Test Repeatability
Each joint was tested multiple times to ensure repeatability. Three separate samples of each joint weretested three times in each of the loading directions. In all, a total of 15 were tested.
Report: A/SP-005-1 Light Truck Frame Joint Stiffness Study 21
TESTING PROCEDURE
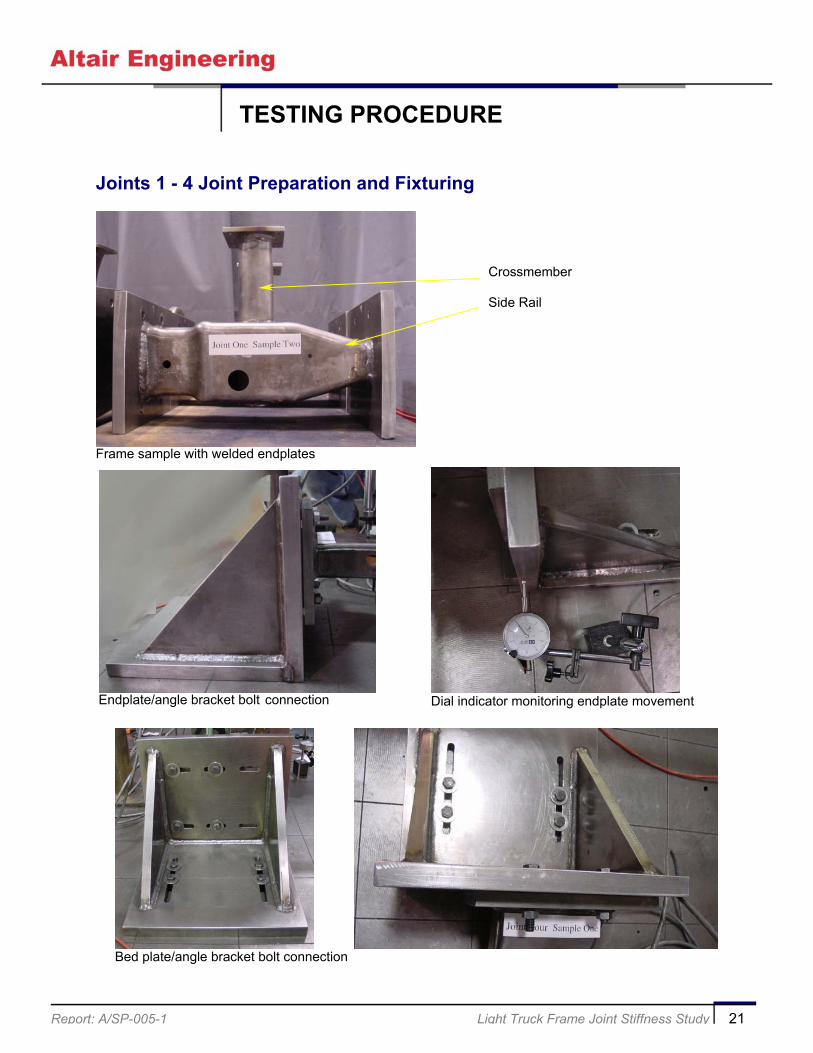
Joints 1 - 4 Joint Preparation and Fixturing
Crossmember
Side Rail
Frame sample with welded endplates
Dial indicator monitoring endplate movementEndplate/angle bracket bolt connection
Bed plate/angle bracket bolt connection
Report: A/SP-005-1 Light Truck Frame Joint Stiffness Study 22
TESTING PROCEDURE
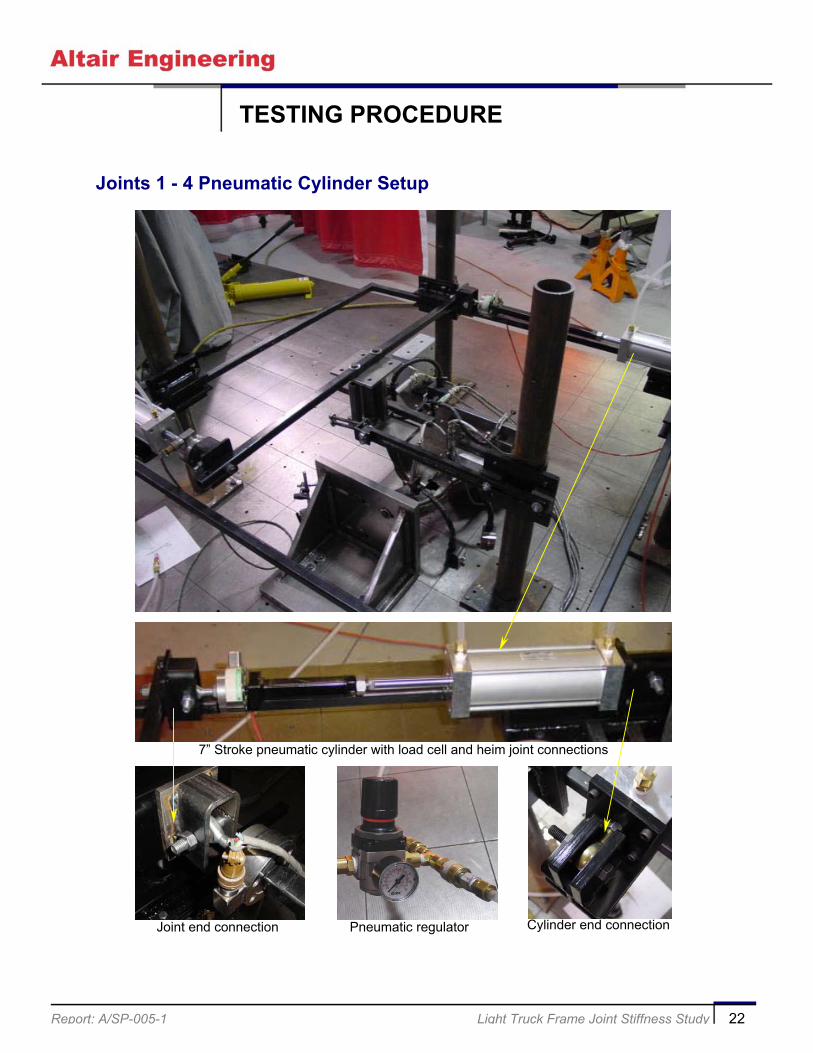
Joints 1 - 4 Pneumatic Cylinder Setup
7” Stroke pneumatic cylinder with load cell and heim joint connections
Joint end connection Pneumatic regulator Cylinder end connection

Report: A/SP-005-1 Light Truck Frame Joint Stiffness Study 23
TESTING PROCEDURE
Joint 1 - Joint Sample and Test Setup
Side View
Top View
Bottom View

Report: A/SP-005-1 Light Truck Frame Joint Stiffness Study 24
TESTING PROCEDURE
Joint 1 - X Direction Test Setup
X direction test setup including LVDT positioning
Crossmember displacement measurement
Side rail displacement measurement
Report: A/SP-005-1 Light Truck Frame Joint Stiffness Study 25
TESTING PROCEDURE
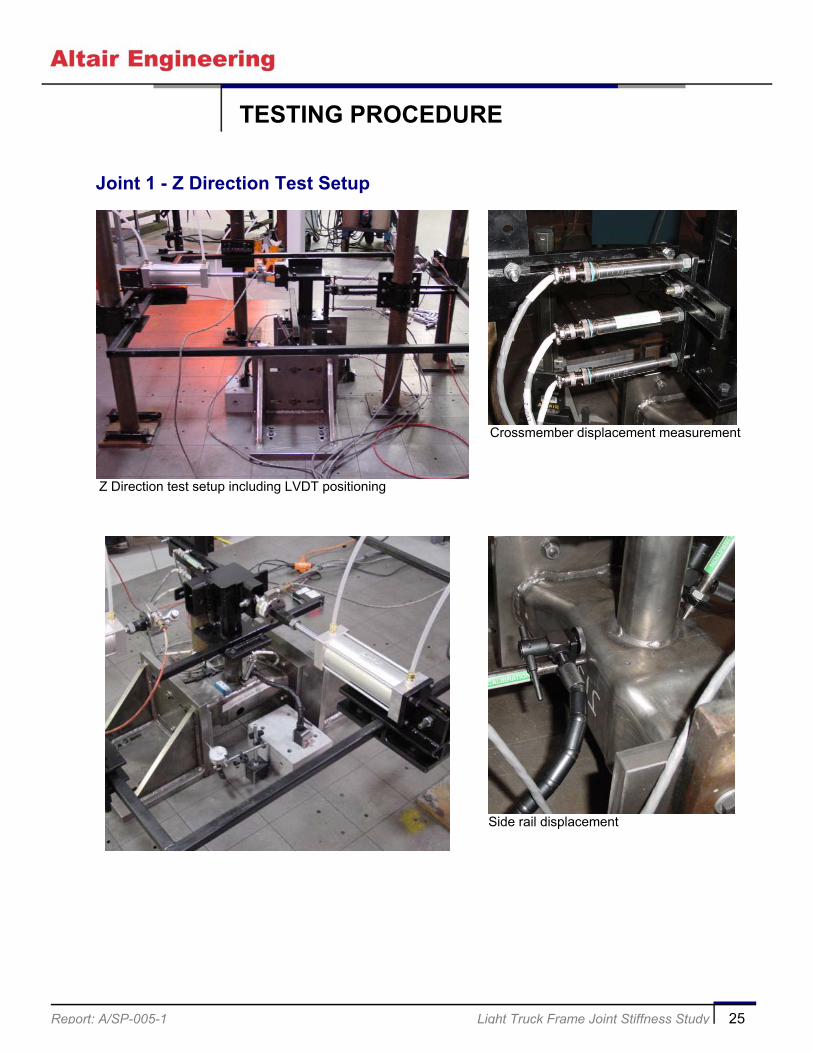
Joint 1 - Z Direction Test Setup
Z Direction test setup including LVDT positioning
Crossmember displacement measurement
Side rail displacement
Report: A/SP-005-1 Light Truck Frame Joint Stiffness Study 26
TESTING PROCEDURE
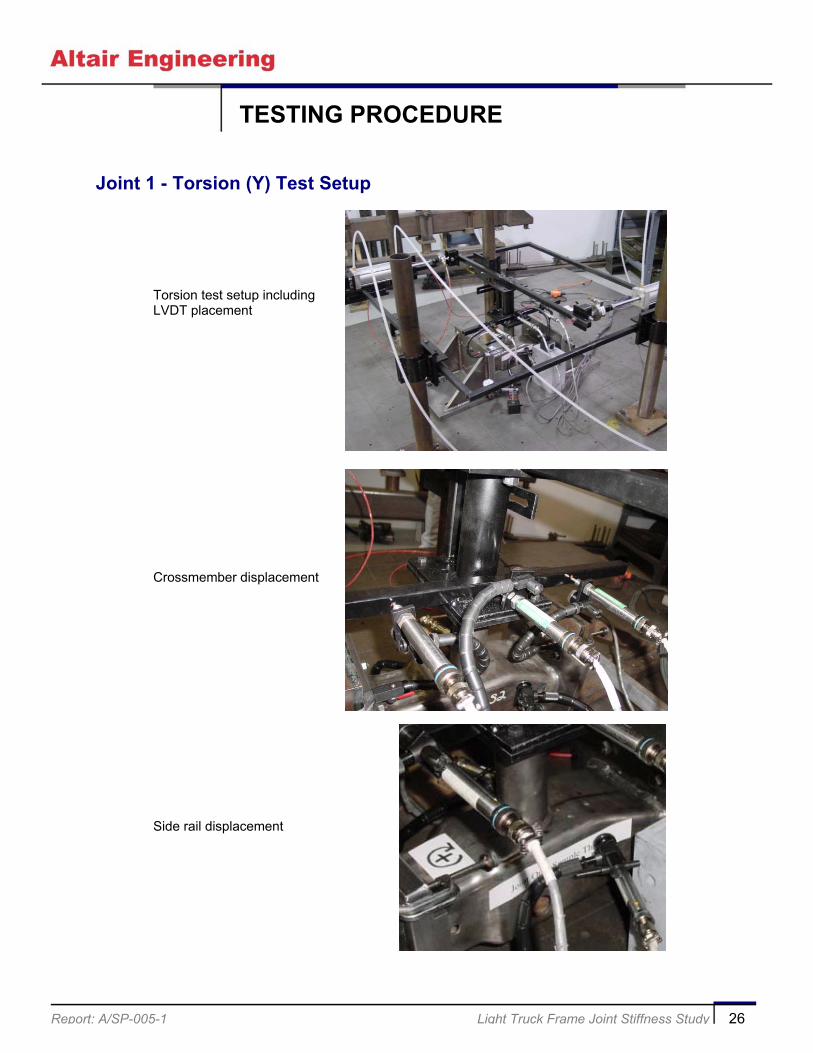
Joint 1 - Torsion (Y) Test Setup
Torsion test setup includingLVDT placement
Crossmember displacement
Side rail displacement

Report: A/SP-005-1 Light Truck Frame Joint Stiffness Study 27
TESTING PROCEDURE
Joint 2 - Joint Sample and Test Setup
Bottom View
Side View
Top View

Report: A/SP-005-1 Light Truck Frame Joint Stiffness Study 28
TESTING PROCEDURE
Joint 2 - X Direction Test Setup
X direction test setup including LVDT positioning
Crossmember displacementmeasurement
Side rail displacement measurement

Report: A/SP-005-1 Light Truck Frame Joint Stiffness Study 29
TESTING PROCEDURE
Joint 2 - Z Direction Test Setup
Z Direction test setup includingLVDT placement
Z Direction test setupincluding LVDT placement
Side rail displacementmeasurement

Report: A/SP-005-1 Light Truck Frame Joint Stiffness Study 30
TESTING PROCEDURE
Joint 2 - Torsion (Y) Test Setup
Side rail displacementmeasurement
Crossmemberdisplacementmeasurement
Torsion test setupincluding LVDTplacement
Report: A/SP-005-1 Light Truck Frame Joint Stiffness Study 31
TESTING PROCEDURE
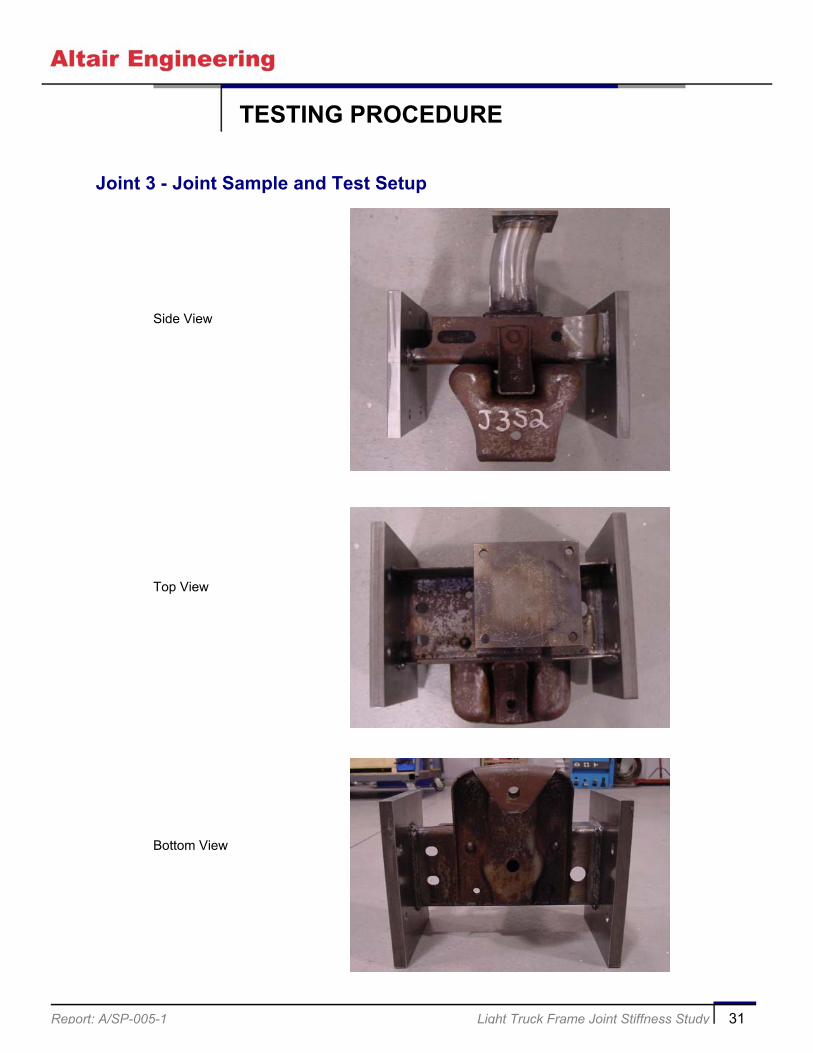
Joint 3 - Joint Sample and Test Setup
Bottom View
Side View
Top View

Report: A/SP-005-1 Light Truck Frame Joint Stiffness Study 32
TESTING PROCEDURE
Joint 3 - X Direction Test Setup
Overview of X-directionsetup including LVDTplacement
Side rail displacementshowing positive Xdirection
Crossmember rail displacement
Report: A/SP-005-1 Light Truck Frame Joint Stiffness Study 33
TESTING PROCEDURE
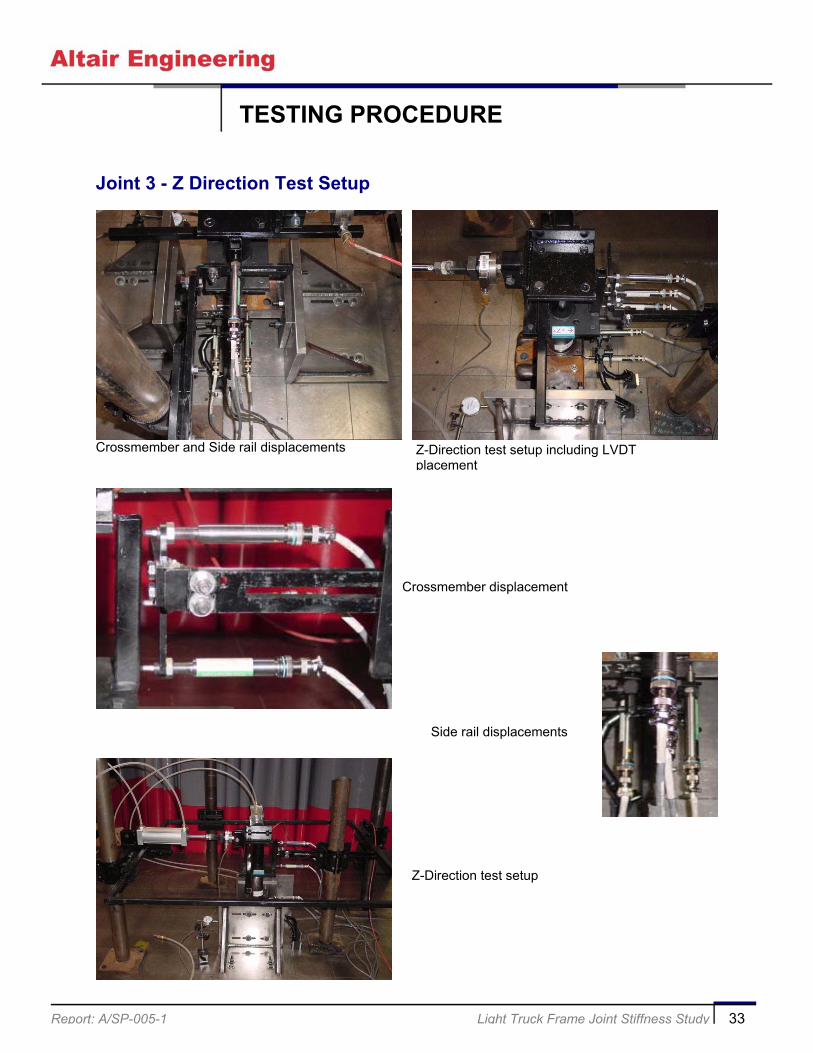
Joint 3 - Z Direction Test Setup
Crossmember and Side rail displacements
Crossmember displacement
Z-Direction test setup including LVDTplacement
Z-Direction test setup
Side rail displacements
Report: A/SP-005-1 Light Truck Frame Joint Stiffness Study 34
TESTING PROCEDURE
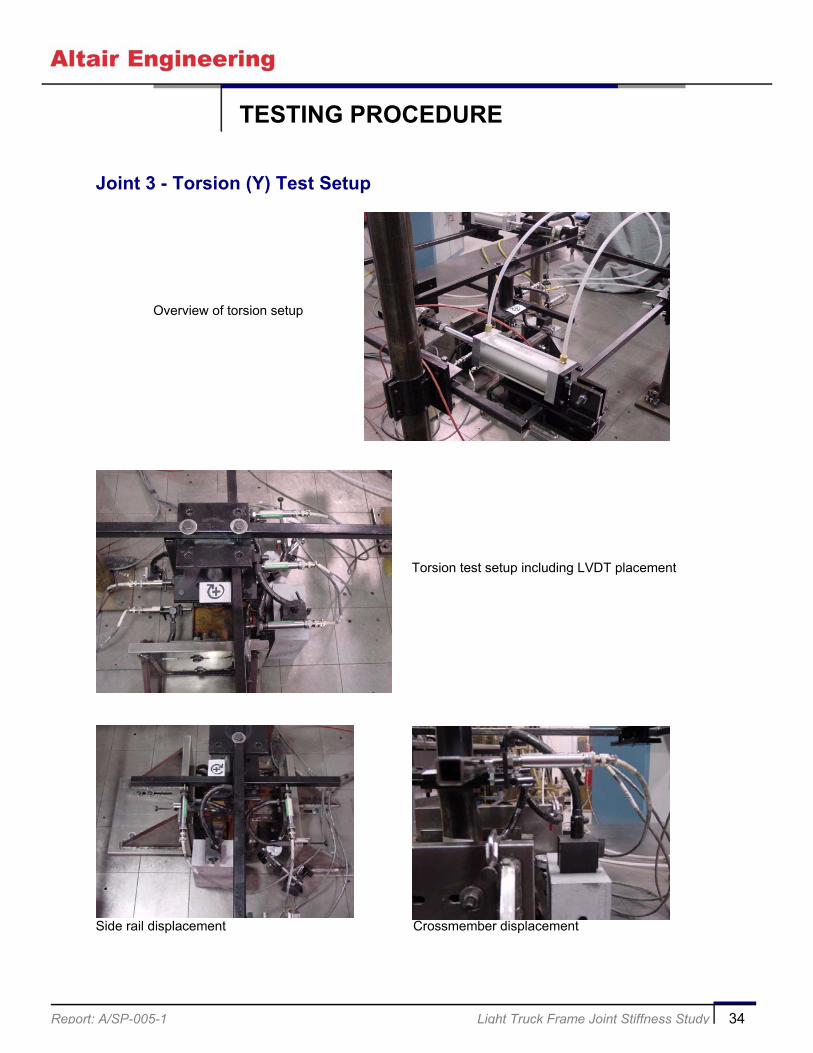
Joint 3 - Torsion (Y) Test Setup
Side rail displacement
Overview of torsion setup
Crossmember displacement
Torsion test setup including LVDT placement

Report: A/SP-005-1 Light Truck Frame Joint Stiffness Study 35
TESTING PROCEDURE
Joint 4 - Joint Sample and Test Setup
Bottom View
Side View
Top View

Report: A/SP-005-1 Light Truck Frame Joint Stiffness Study 36
TESTING PROCEDURE
Joint 4 - X Direction Test Setup
X direction test including LVDTplacement
Side rail displacementmeasurement
Crossmember displacementmeasurement
Report: A/SP-005-1 Light Truck Frame Joint Stiffness Study 37
TESTING PROCEDURE
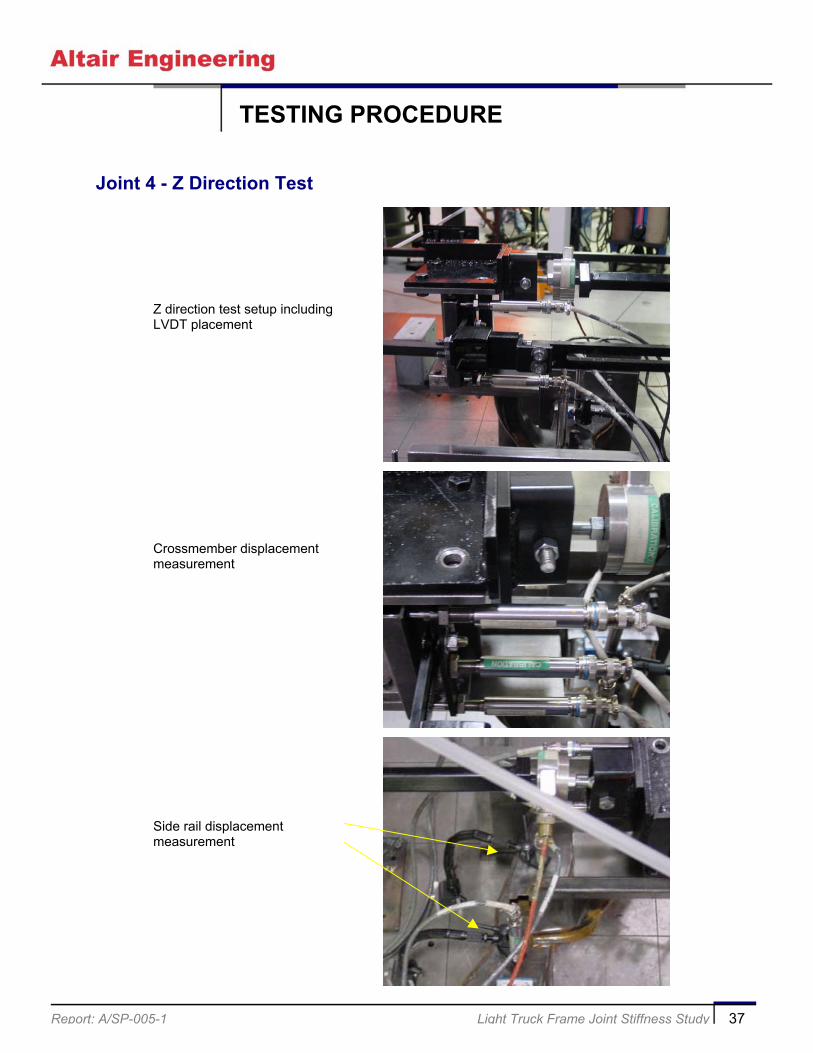
Joint 4 - Z Direction Test
Z direction test setup includingLVDT placement
Crossmember displacementmeasurement
Side rail displacementmeasurement
Report: A/SP-005-1 Light Truck Frame Joint Stiffness Study 38
TESTING PROCEDURE
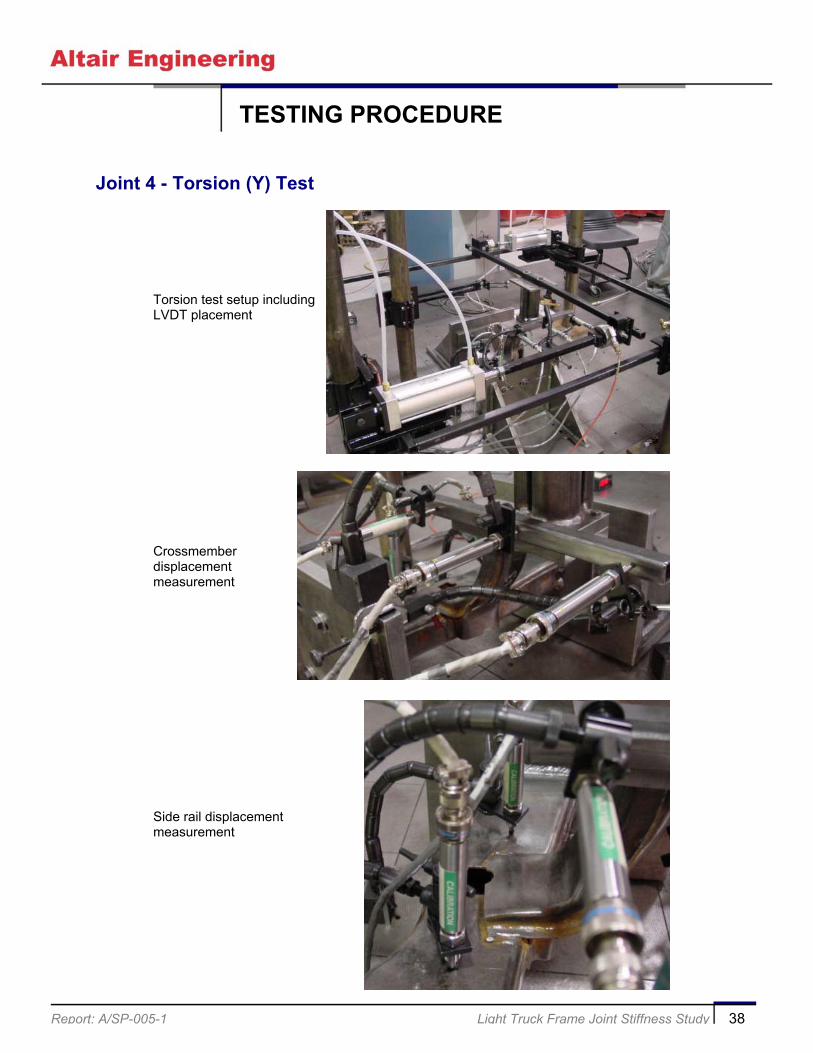
Joint 4 - Torsion (Y) Test
Torsion test setup includingLVDT placement
Crossmemberdisplacementmeasurement
Side rail displacementmeasurement
Report: A/SP-005-1 Light Truck Frame Joint Stiffness Study 39
TESTING PROCEDURE
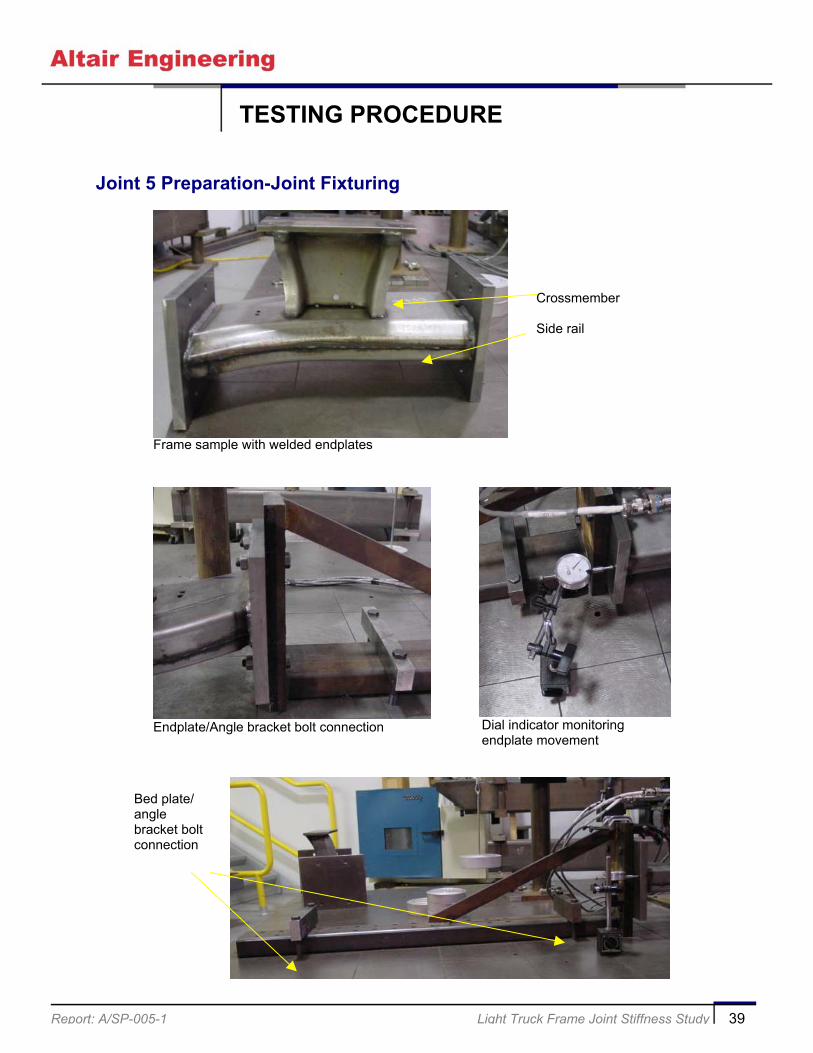
Joint 5 Preparation-Joint Fixturing
Crossmember
Side rail
Frame sample with welded endplates
Endplate/Angle bracket bolt connection Dial indicator monitoringendplate movement
Bed plate/anglebracket boltconnection

Report: A/SP-005-1 Light Truck Frame Joint Stiffness Study 40
TESTING PROCEDURE
Joint 5 - Hanging Weight Setup
Hanging weight setup (joint 5 only)
Frame fixture-mounting clamp
Fixture pulleyCalibrated 1lb weight hanger

Report: A/SP-005-1 Light Truck Frame Joint Stiffness Study 41
TESTING PROCEDURE
Joint 5 - X Direction Test Setup
Crossmember displacementmeasurement
X direction test setup including LVDT positioning
Side rail displacement measurement

Report: A/SP-005-1 Light Truck Frame Joint Stiffness Study 42
TESTING PROCEDURE
Joint 5 - Z Direction Test Setup
Side rail displacement measurement
Direction test setup including LVDT positioning
Crossmember displacementmeasurements
Force actuation tube

Report: A/SP-005-1 Light Truck Frame Joint Stiffness Study 43
TESTING PROCEDURE
Joint 5-Torsion (Y) Test Setup
Torsion test setup includingLVDT placement
Crossmember displacementmeasurement
Side rail displacementmeasurement
Report: A/SP-005-1 Light Truck Frame Joint Stiffness Study 44
TESTING PROCEDURE
Joint Stiffness Summary
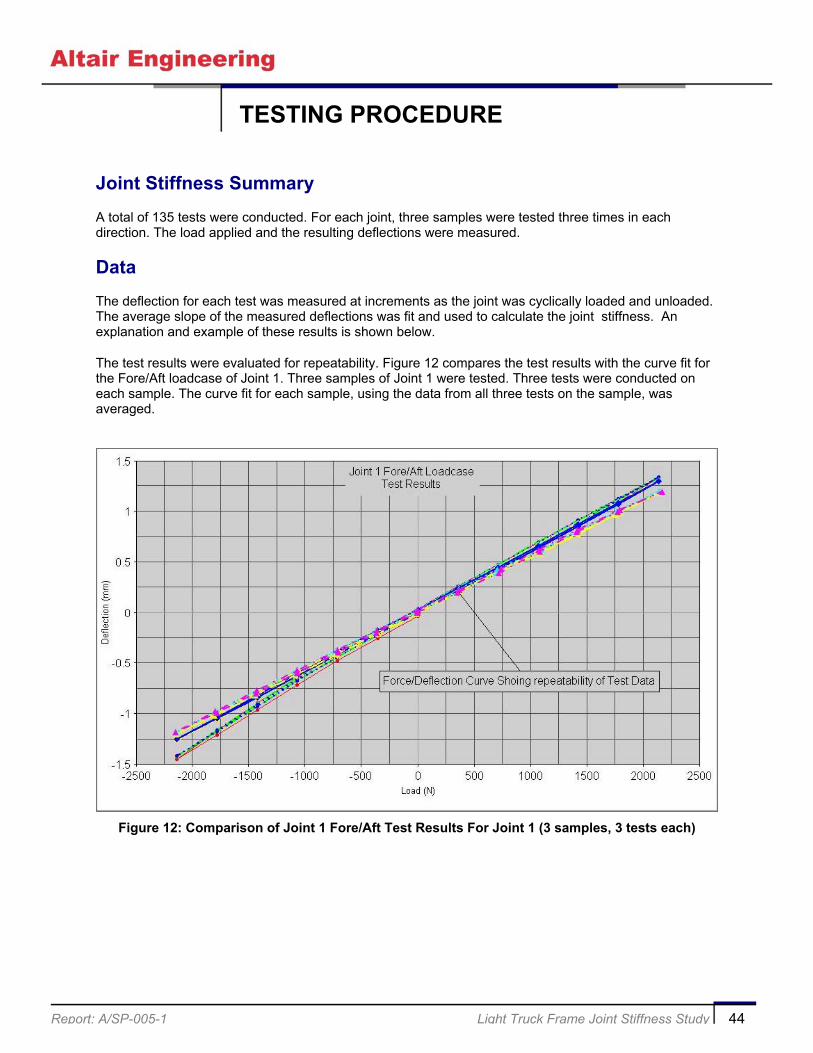
A total of 135 tests were conducted. For each joint, three samples were tested three times in eachdirection. The load applied and the resulting deflections were measured.
Data
The deflection for each test was measured at increments as the joint was cyclically loaded and unloaded.The average slope of the measured deflections was fit and used to calculate the joint stiffness. Anexplanation and example of these results is shown below.
The test results were evaluated for repeatability. Figure 12 compares the test results with the curve fit forthe Fore/Aft loadcase of Joint 1. Three samples of Joint 1 were tested. Three tests were conducted oneach sample. The curve fit for each sample, using the data from all three tests on the sample, wasaveraged.
Figure 12: Comparison of Joint 1 Fore/Aft Test Results For Joint 1 (3 samples, 3 tests each)
Report: A/SP-005-1 Light Truck Frame Joint Stiffness Study 45
TESTING PROCEDURE
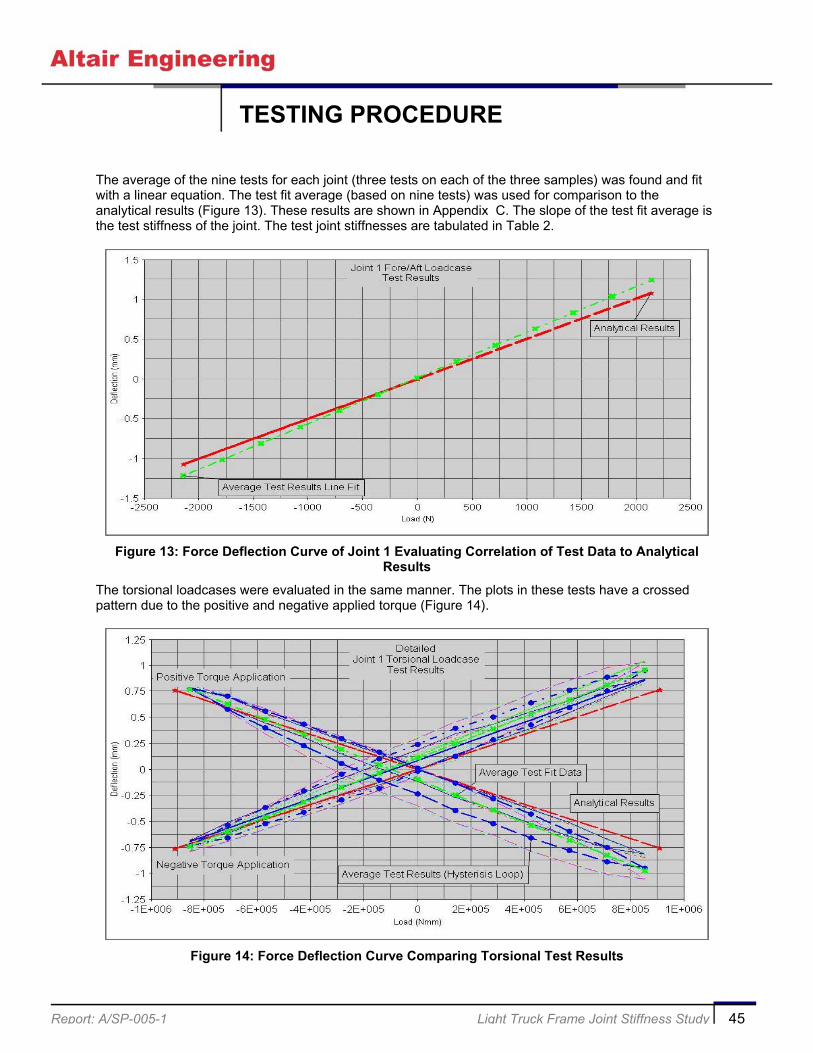
The average of the nine tests for each joint (three tests on each of the three samples) was found and fitwith a linear equation. The test fit average (based on nine tests) was used for comparison to theanalytical results (Figure 13). These results are shown in Appendix C. The slope of the test fit average isthe test stiffness of the joint. The test joint stiffnesses are tabulated in Table 2.
Figure 13: Force Deflection Curve of Joint 1 Evaluating Correlation of Test Data to AnalyticalResults
The torsional loadcases were evaluated in the same manner. The plots in these tests have a crossedpattern due to the positive and negative applied torque (Figure 14).
Figure 14: Force Deflection Curve Comparing Torsional Test Results

Report: A/SP-005-1 Light Truck Frame Joint Stiffness Study 46
TESTING PROCEDURE
Table 2: Test Joint Stiffness Summary
Kx Ky KzJoint 1: Tube- Through-Tube (welded atboth ends)
2.563 KNm/deg 2.372 KNm/deg 2.573 KNm/deg
Joint 2: Box to Lipped Channel
8.415 KNm/deg 3.909 KNm/deg 50.429 KNm/deg
Joint 3: Tube Through Partially BoxedSection (welded on both sides)
1.940 KNm/deg 4.211 KNm/deg 2.979 KNm/deg
Joint 4: Alligator to box Section (welded toboth flanges)
0.452 KNm/deg 1.081KNm/deg
0.816 KNm/deg
Joint 5: Hat Section to Box Section(welded all around)
0.116 KNm/deg 0.180 KNm/deg 0.494 KNm/deg
Report: A/SP-005-1 Light Truck Frame Joint Stiffness Study 47
CORRELATION
Introduction
Correlating the test and analysis results required multiple iterations. In the literature search, 15-30% wasthe average range of deviation between test and analysis. This average percent came from a combinationof papers, including Fragoso, 1993. The joint stiffness study deviation between test and analysis is wellwithin that range.
Correlating the Test and Analysis Data
Initially, the fixtures were modeled with rigid elements due to the assumed rigidity of the loading fixture,and the deflections were measured using similar triangles. This meant that the location, and in somecases, the direction of the deflections measured between test and analysis, were not the same. Butthrough geometry, the same rotations and thus stiffness could be calculated. The problem with thisapproach is that because of out of plane rotations in the joint and a slight influence of the loading fixtureon the deflection of the crossmember, the finite element model did not correlate well.
By including the fixture in the finite element model the deflections were measured at the same point as inthe test. This proved to be critical for accurate test/analysis correlation and lowered our deviations byproviding a more representative model of the physical test. The main deviation between the model andtest occurred from not modeling surface contact at fixture interfaces, resulting in local deflection in thefinite element model of the loading fixture base plate. Increasing plate thickness from 3/8 to 3/4 inch inboth test and analysis and retesting resulted in good correlation between the two. The test data had notchanged but the finite element analysis results were brought into the same range as the test results. Thefinal percent difference between the test and analysis results is shown in Table 3. Graphs of eachloadcase for the five joints, comparing the test and analytical results can be found in the appendix.

Report: A/SP-005-1 Light Truck Frame Joint Stiffness Study 48
CORRELATION
Table 3: Test and Analysis Joint Stiffness Correlation Summary
% Deviation Between Test and Analysis Joint StiffnessKx Ky Kz
Joint 1: Tube-Through-Tube (welded atboth ends)
21.92% -22.46% 2.39%
Joint 2: Box to Lipped Channel
-6.56% -23.62% 23.32%
Joint 3: Tube Through Partially BoxedSection (welded on both sides)
2.12% -24.36% -3.96%
Joint 4: Alligator to Box Section (welded toboth flanges)
-16.63% -23.50% -19.65%
Joint 5: Hat Section to Box Section (weldedall around)
15.44% -11.25% 5.79%
* The negative indicates analytical results lower than test
Report: A/SP-005-1 Light Truck Frame Joint Stiffness Study 49
SENSITIVITY STUDY
Introduction
An important requirement of the study was to establish a set of frame joint design rules. By using FEA, wewere able to establish guidelines for the five joint types included in the study. The designer will be able touse the design rules to predict the stiffness of a joint that is similar to one of the five types in the study.
Study Model
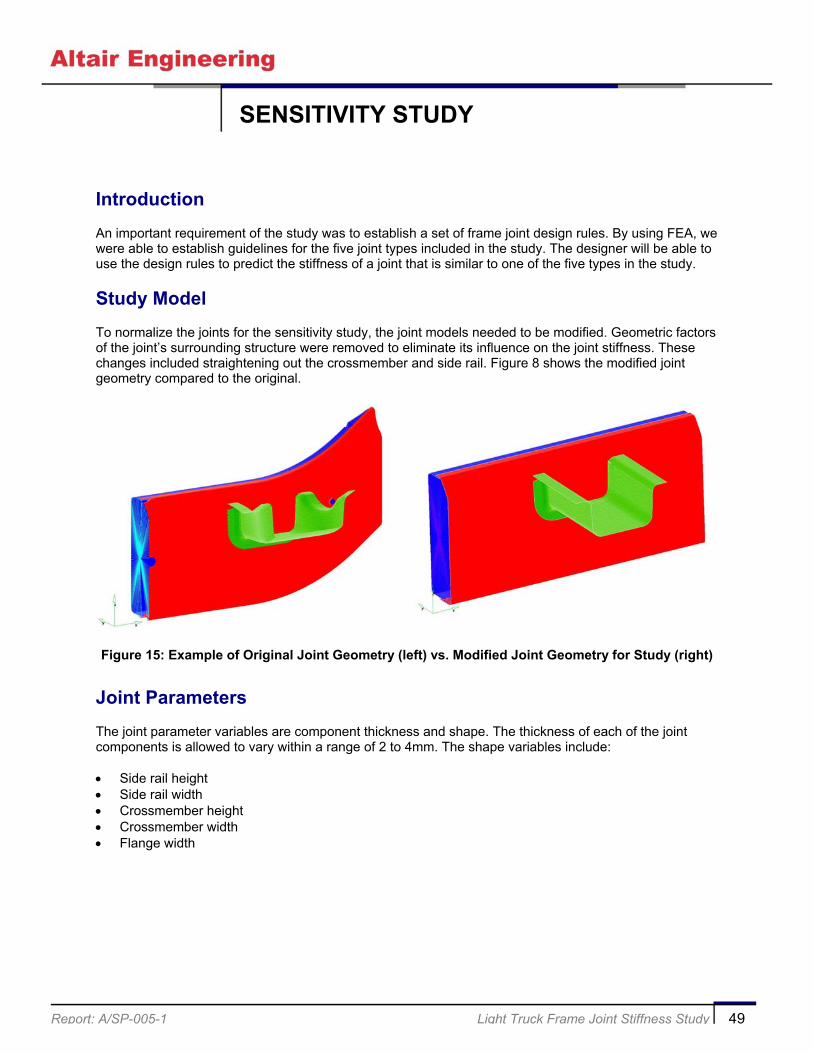
To normalize the joints for the sensitivity study, the joint models needed to be modified. Geometric factorsof the joint’s surrounding structure were removed to eliminate its influence on the joint stiffness. Thesechanges included straightening out the crossmember and side rail. Figure 8 shows the modified jointgeometry compared to the original.
Figure 15: Example of Original Joint Geometry (left) vs. Modified Joint Geometry for Study (right)
Joint Parameters
The joint parameter variables are component thickness and shape. The thickness of each of the jointcomponents is allowed to vary within a range of 2 to 4mm. The shape variables include:
• Side rail height• Side rail width• Crossmember height• Crossmember width• Flange width
Report: A/SP-005-1 Light Truck Frame Joint Stiffness Study 50
SENSITIVITY STUDY
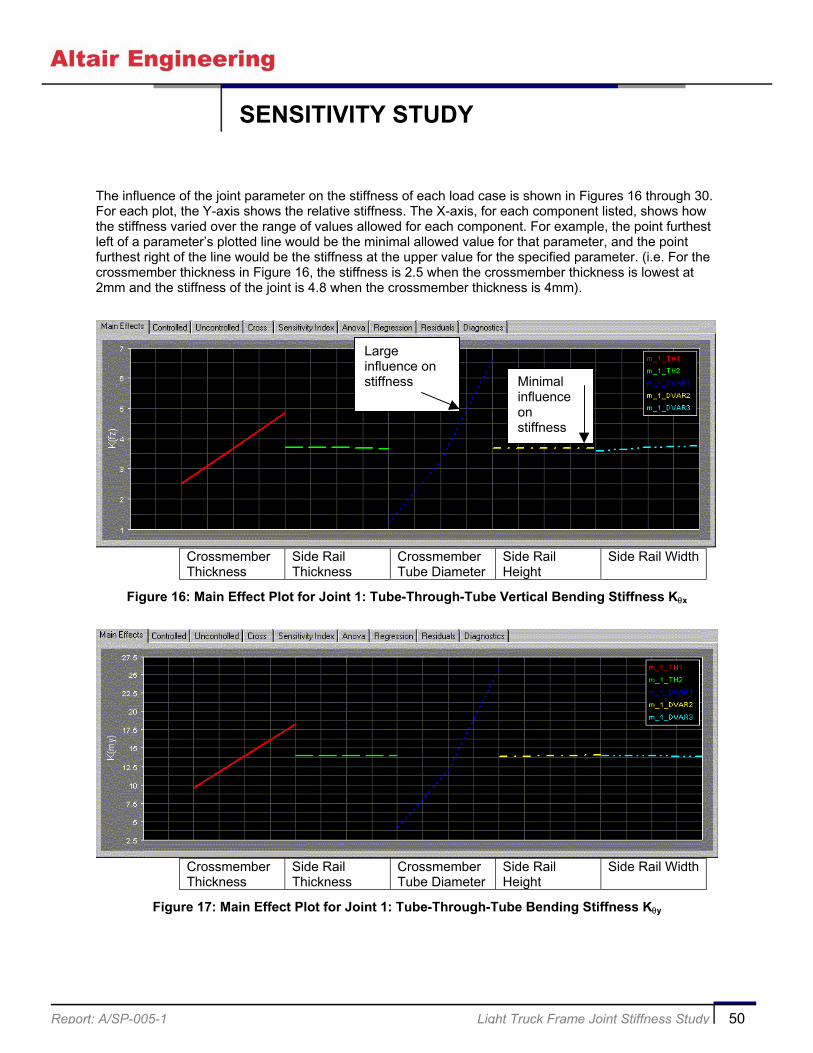
The influence of the joint parameter on the stiffness of each load case is shown in Figures 16 through 30.For each plot, the Y-axis shows the relative stiffness. The X-axis, for each component listed, shows howthe stiffness varied over the range of values allowed for each component. For example, the point furthestleft of a parameter’s plotted line would be the minimal allowed value for that parameter, and the pointfurthest right of the line would be the stiffness at the upper value for the specified parameter. (i.e. For thecrossmember thickness in Figure 16, the stiffness is 2.5 when the crossmember thickness is lowest at2mm and the stiffness of the joint is 4.8 when the crossmember thickness is 4mm).
CrossmemberThickness
Side RailThickness
CrossmemberTube Diameter
Side RailHeight
Side Rail Width
Figure 16: Main Effect Plot for Joint 1: Tube-Through-Tube Vertical Bending Stiffness Kθx
CrossmemberThickness
Side RailThickness
CrossmemberTube Diameter
Side RailHeight
Side Rail Width
Figure 17: Main Effect Plot for Joint 1: Tube-Through-Tube Bending Stiffness Kθy
Largeinfluence onstiffness Minimal
influenceonstiffness
Report: A/SP-005-1 Light Truck Frame Joint Stiffness Study 51
SENSITIVITY STUDY
CrossmemberThickness
Side RailThickness
CrossmemberTube Diameter
Side RailHeight
Side Rail Width
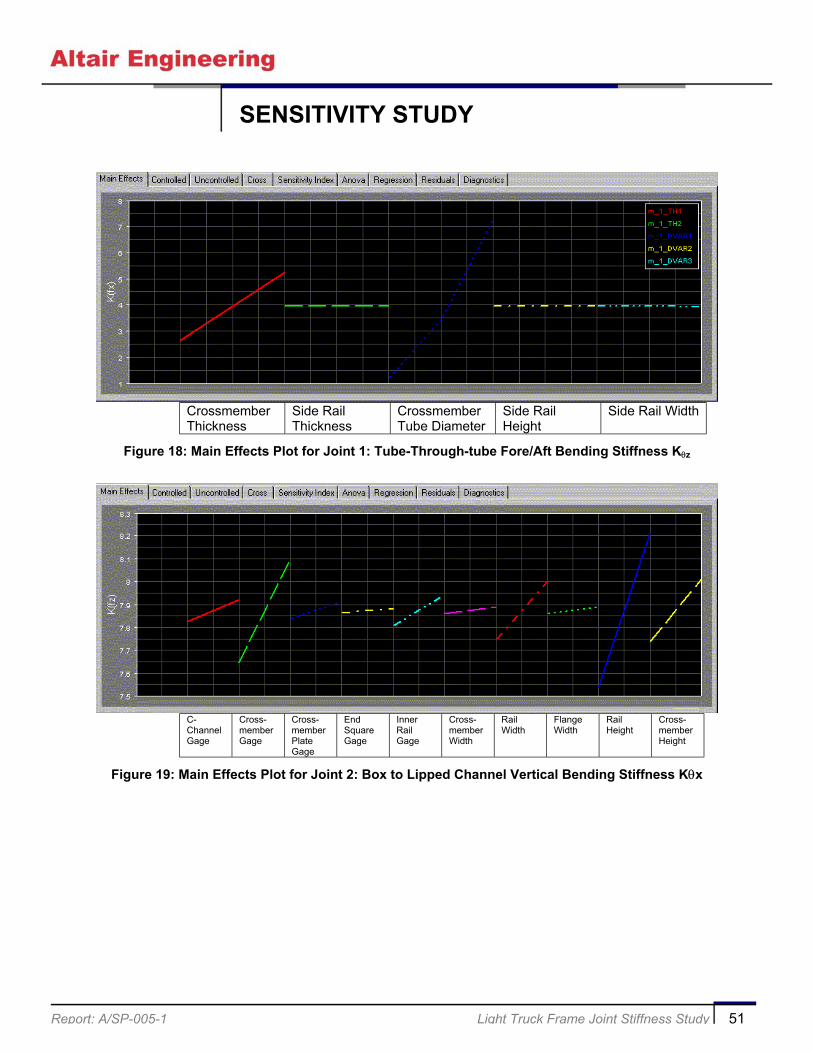
Figure 18: Main Effects Plot for Joint 1: Tube-Through-tube Fore/Aft Bending Stiffness Kθz
C-ChannelGage
Cross-memberGage
Cross-memberPlateGage
EndSquareGage
InnerRailGage
Cross-memberWidth
RailWidth
FlangeWidth
RailHeight
Cross-memberHeight
Figure 19: Main Effects Plot for Joint 2: Box to Lipped Channel Vertical Bending Stiffness Kθx
Report: A/SP-005-1 Light Truck Frame Joint Stiffness Study 52
SENSITIVITY STUDY
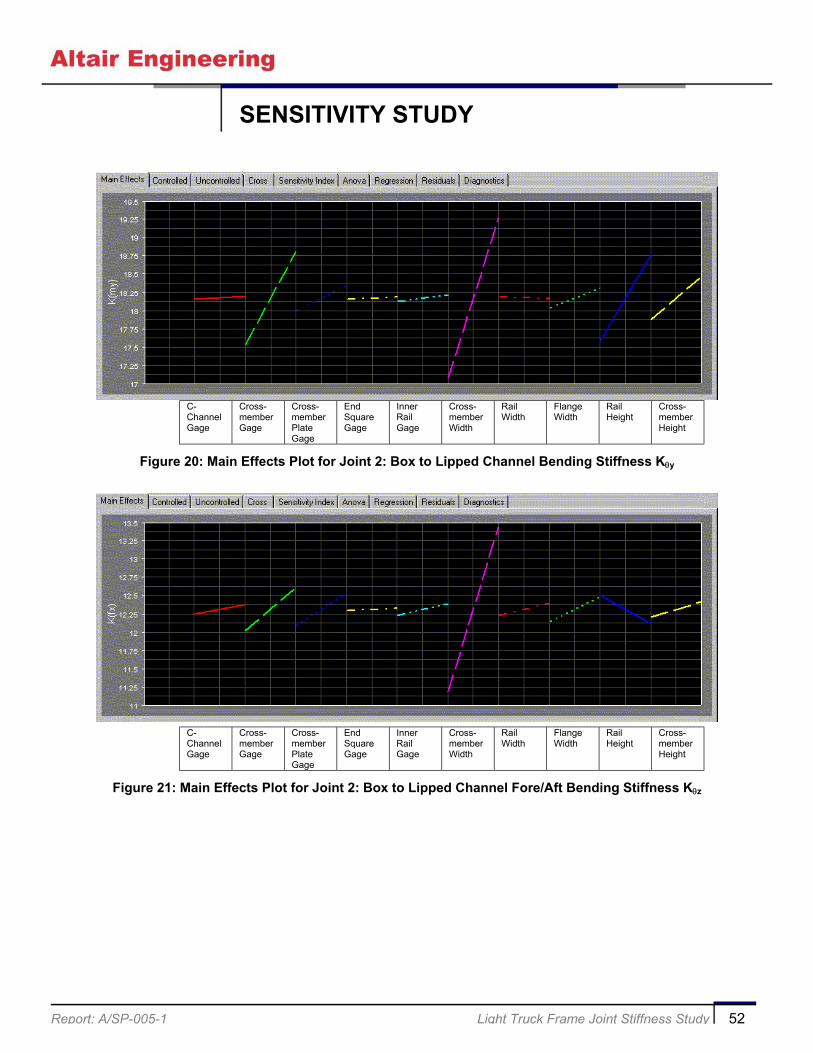
C-ChannelGage
Cross-memberGage
Cross-memberPlateGage
EndSquareGage
InnerRailGage
Cross-memberWidth
RailWidth
FlangeWidth
RailHeight
Cross-memberHeight
Figure 20: Main Effects Plot for Joint 2: Box to Lipped Channel Bending Stiffness Kθy
C-ChannelGage
Cross-memberGage
Cross-memberPlateGage
EndSquareGage
InnerRailGage
Cross-memberWidth
RailWidth
FlangeWidth
RailHeight
Cross-memberHeight
Figure 21: Main Effects Plot for Joint 2: Box to Lipped Channel Fore/Aft Bending Stiffness Kθz

Report: A/SP-005-1 Light Truck Frame Joint Stiffness Study 53
SENSITIVITY STUDY
C-ChannelGage
Cross-memberTubeGage
Inner BoxBracketGage
BackBracketGage
BottomAngleBracketGage
Cross-memberTubeDiameter
Inner BoxBracketWidth
RailHeight
Rail Width
Figure 22: Main Effects Plot for Joint 3: Tube Through Tube Partially Boxed Section VerticalBending Stiffness Kθx
C-ChannelGage
Cross-memberTubeGage
Inner BoxBracketGage
BackBracketGage
BottomAngleBracketGage
Cross-memberTubeDiameter
Inner BoxBracketWidth
RailHeight
Rail Width
Figure 23: Main Effects Plot for Joint 3: Tube Through Tube Partially Boxed Section BendingStiffness Kθy
Report: A/SP-005-1 Light Truck Frame Joint Stiffness Study 54
SENSITIVITY STUDY
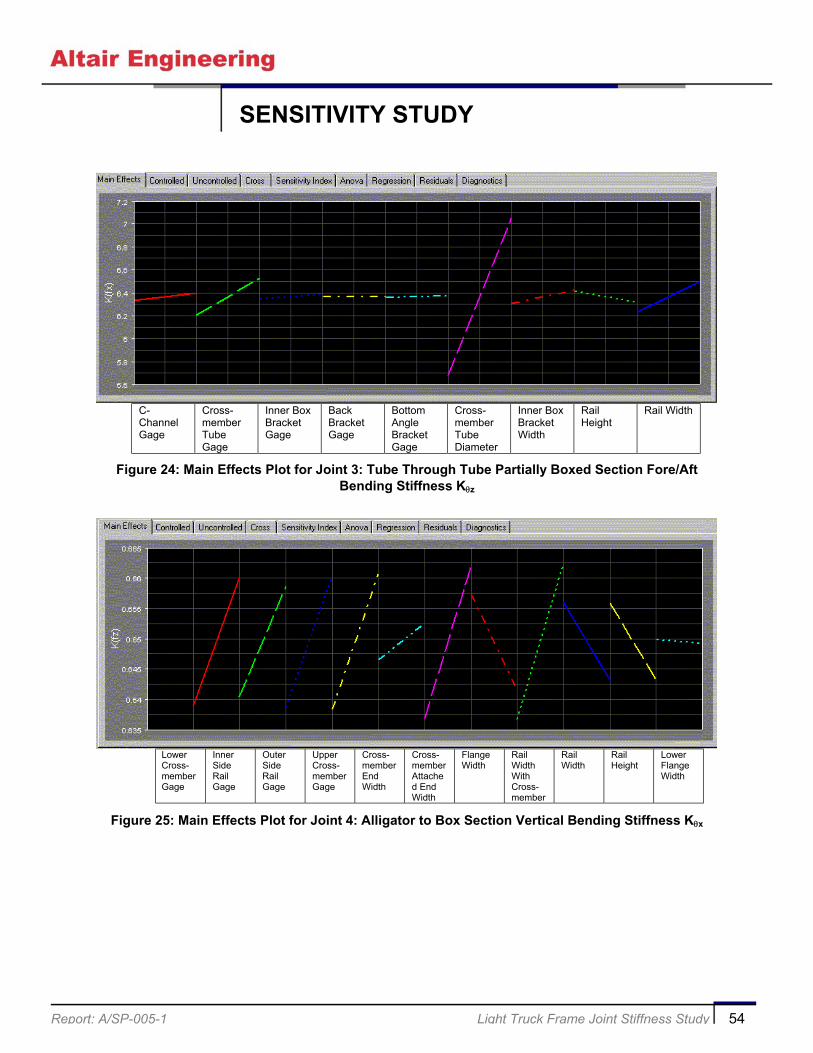
C-ChannelGage
Cross-memberTubeGage
Inner BoxBracketGage
BackBracketGage
BottomAngleBracketGage
Cross-memberTubeDiameter
Inner BoxBracketWidth
RailHeight
Rail Width
Figure 24: Main Effects Plot for Joint 3: Tube Through Tube Partially Boxed Section Fore/AftBending Stiffness Kθz
LowerCross-memberGage
InnerSideRailGage
OuterSideRailGage
UpperCross-memberGage
Cross-memberEndWidth
Cross-memberAttached EndWidth
FlangeWidth
RailWidthWithCross-member
RailWidth
RailHeight
LowerFlangeWidth
Figure 25: Main Effects Plot for Joint 4: Alligator to Box Section Vertical Bending Stiffness Kθx
Report: A/SP-005-1 Light Truck Frame Joint Stiffness Study 55
SENSITIVITY STUDY
LowerCross-memberGage
InnerSideRailGage
OuterSideRailGage
UpperCross-memberGage
Cross-memberEndWidth
Cross-memberAttachedEndWidth
FlangeWidth
RailWidthWithCross-member
RailWidth
RailHeight
LowerFlangeWidth
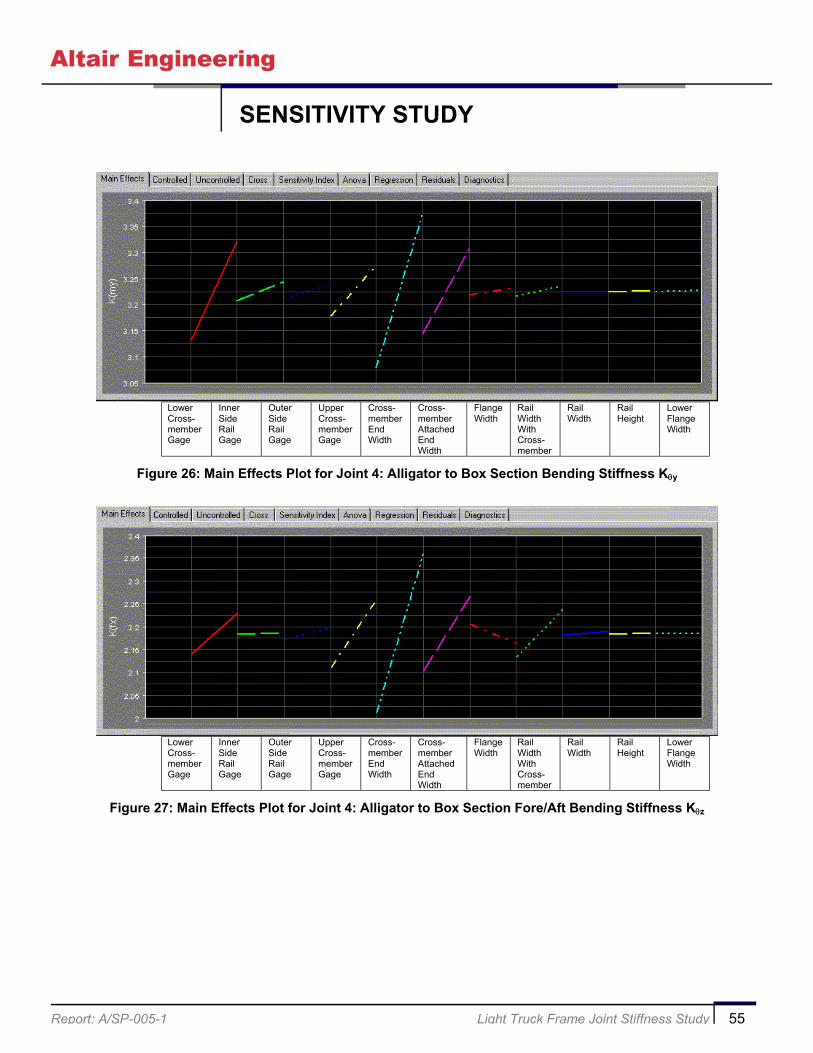
Figure 26: Main Effects Plot for Joint 4: Alligator to Box Section Bending Stiffness Kθy
LowerCross-memberGage
InnerSideRailGage
OuterSideRailGage
UpperCross-memberGage
Cross-memberEndWidth
Cross-memberAttachedEndWidth
FlangeWidth
RailWidthWithCross-member
RailWidth
RailHeight
LowerFlangeWidth
Figure 27: Main Effects Plot for Joint 4: Alligator to Box Section Fore/Aft Bending Stiffness Kθz

Report: A/SP-005-1 Light Truck Frame Joint Stiffness Study 56
SENSITIVITY STUDY
Cross-memberGage
Inner SideRail Gage
OuterSide RailGage
WeldFlangeWidth
UpperFlangeWidth
CrossMemberHeight
CrossMemberWidth
RailHeight
Rail Width
Figure 28: Main Effects Plot for Joint 5: Hat Section to Box Section Vertical Bending Stiffness Kθx
Cross-memberGage
Inner SideRail Gage
OuterSide RailGage
WeldFlangeWidth
UpperFlangeWidth
CrossMemberHeight
CrossMemberWidth
RailHeight
Rail Width
Figure 29: Main Effects Plot for Joint 5: Hat Section to Box Section Bending Stiffness Kθy

Report: A/SP-005-1 Light Truck Frame Joint Stiffness Study 57
SENSITIVITY STUDY
Cross-memberGage
Inner SideRail Gage
OuterSide RailGage
WeldFlangeWidth
UpperFlangeWidth
CrossMemberHeight
CrossMemberWidth
RailHeight
Rail Width
Figure 30: Main Effects Plot for Joint 5: Hat Section to Box Section Fore/Aft Bending Stiffness Kθz

Report: A/SP-005-1 Light Truck Frame Joint Stiffness Study 58
JOINT STIFFNESS TOOLBOX
Introduction
A design experiment was run using the Altair StudyWizard. These experiments included consideration ofthe linearity of the joint parameters and the interactions between them on the joint stiffness. Themathematical response of each joint was programmed into an Excel spreadsheet. Designers andengineers will be able to enter joint dimensions, thickness, and any discrete variables simulated in theDOE, and obtain calculated joint stiffnesses. The Excel spreadsheet allows the user to input any jointdefinition that is within the DOE experiment range.
The spreadsheets also contain Design Rules and Observations to be considered when making designdecisions. The Design Rules were created from finite element and sensitivity analysis data to help makestiffer joints. For example, in the case of Joints 1 and 3, where the crossmember is a round section, thedesign rules included two points: making the tube diameter as large as possible, and making the tubethickness as thick as large as possible. The Joint Observations contained information regarding jointdeflection and welding information stemming from the analytical results.
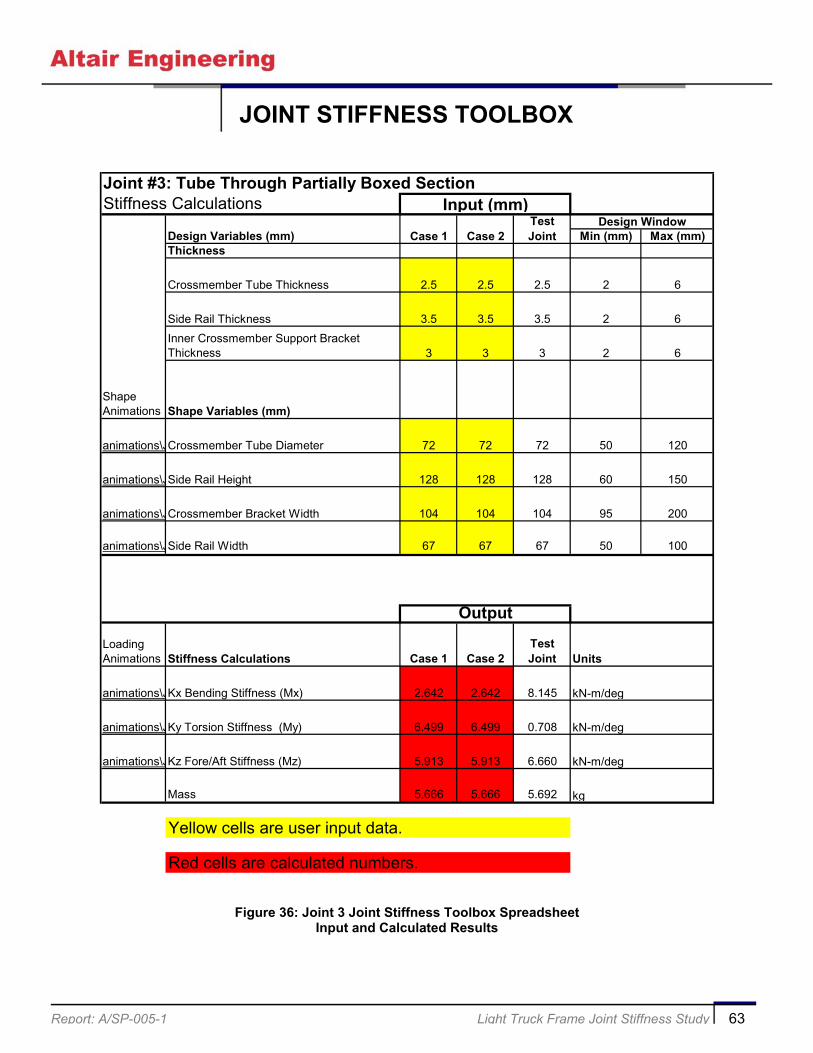
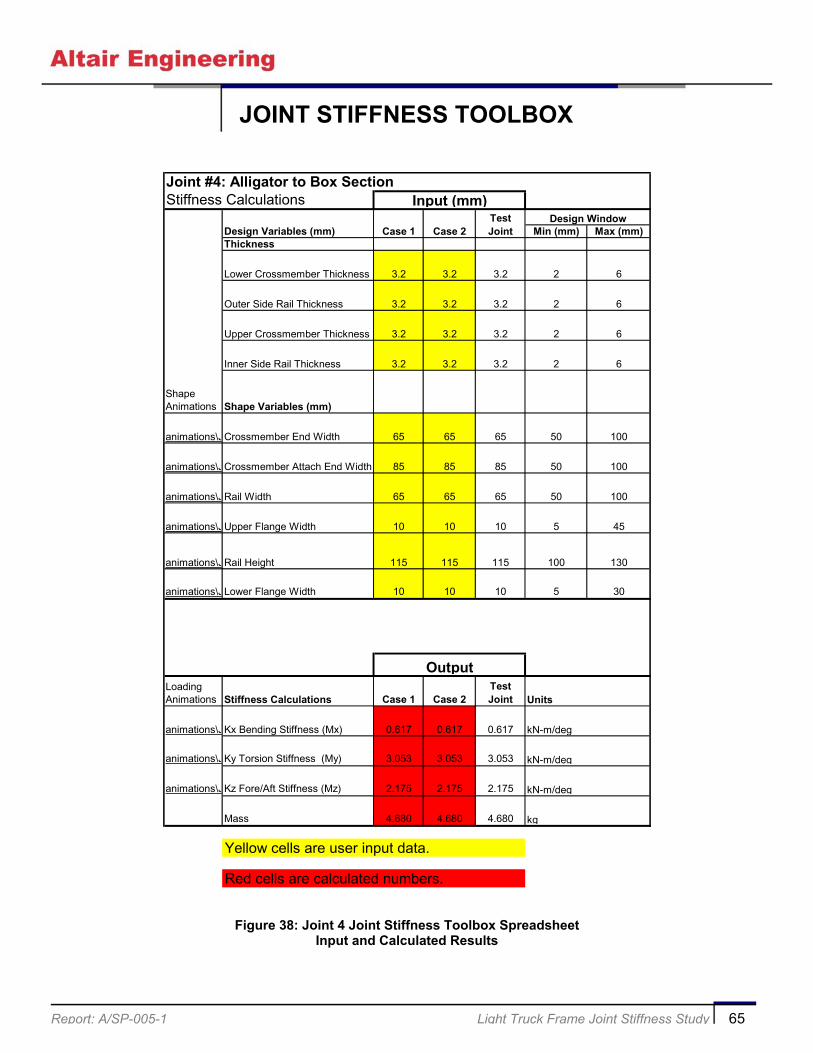
An example overview of the spreadsheet is shown in Figure 31. The spreadsheet for each of the joints isshown in Figures 32 through 41 with two figures for each joint; the first figure shows the input andcalculated results for the joint stiffness, and the second figure shows the joint observations, notes anddesign rules.
Joint #1: Tube Through TubeStiffness Calculations
Design Variables (mm) Min (mm) Max (mm)
Thickness
Crossmember 2.5 2.5 2.5 2 6
Side Rail 2.8 2.8 2.8 2 6
Shape Animations Shape Variables (mm)
animations\JCrossmember Diameter 57 57 57 50 100
animations\JSide Rail Height 125 125 125 75 150
animations\JSide Rail Width 125 125 125 75 150
Loading Animations Stiffness Calculations Case 1 Case 2
Test Joint Units
animations\JKx Bending Stiffness (Mx) 3.235 3.235 3.477 kN-m/deg
animations\JKy Torsion Stiffness (My) 3.271 3.271 12.715 kN-m/deg
animations\JKz Fore/Aft Stiffness (Mz) 3.507 3.507 3.662 kN-m/deg
Mass 4.801 4.801 4.801 kg
Yellow cells are user input data.
Red cells are calculated numbers.
Output
Input (mm)Design Window
Case 1 Case 2Test Joint
Illustration Key:A = Side RailB = Crossmember
Design Rules:* Make the crossmember diameter as large as possible.
* Make the crossmember as thick as possible.
* Thickness and diameter of the crossmember should be increased together if possible.
Joint Observations:* The crossmember is the most important part of this joint. The thickness of the crossmember is 3X more sensitive than the thickness of the side rail.
* The maximum stress is in the crossmember at the connection to the inner side rail for all 3 Stiffness Cases.
* The outer weld (the crossmember to outer side rail) could be a partial weld because this section of the joint has low stress.
Notes:* Modify the input values (yellow) based on your design criteria. There are two columns in which in to input and evaluate data, case 1 and case 2. The calculated stiffness will be displayed in red.
* Design variables are listed in order of influence on stiffness.
* Click on the animation to the left of the variables and loading conditions to see an animation of respective shape variable or loading condition.
* The mass calculation is based on 150 mm extension of joint members from the side rail to crossmember interface. (The crossmember is 150mm from the joint interface to the end of the crossmember). This caluclation is to serve as a reference, not the absolute value.
* The password to unprotect cells in this spreadsheet is: steel.
Figure 31: Example of the Joint Stiffness Toolbox Spreadsheet
Report: A/SP-005-1 Light Truck Frame Joint Stiffness Study 59
JOINT STIFFNESS TOOLBOX
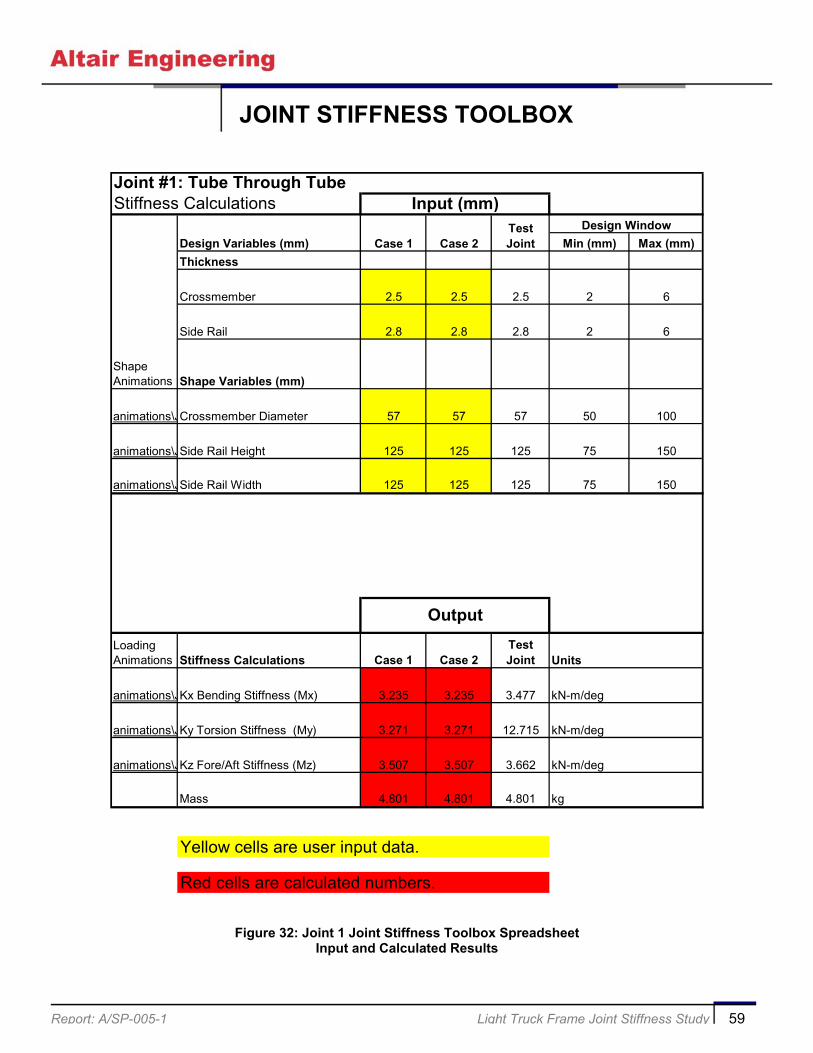
Joint #1: Tube Through TubeStiffness Calculations
Design Variables (mm) Min (mm) Max (mm)
Thickness
Crossmember 2.5 2.5 2.5 2 6
Side Rail 2.8 2.8 2.8 2 6
Shape Animations Shape Variables (mm)
animations\JCrossmember Diameter 57 57 57 50 100
animations\JSide Rail Height 125 125 125 75 150
animations\JSide Rail Width 125 125 125 75 150
Loading Animations Stiffness Calculations Case 1 Case 2
Test Joint Units
animations\JKx Bending Stiffness (Mx) 3.235 3.235 3.477 kN-m/deg
animations\JKy Torsion Stiffness (My) 3.271 3.271 12.715 kN-m/deg
animations\JKz Fore/Aft Stiffness (Mz) 3.507 3.507 3.662 kN-m/deg
Mass 4.801 4.801 4.801 kg
Yellow cells are user input data.
Red cells are calculated numbers.
Output
Input (mm)Design Window
Case 1 Case 2Test Joint
Figure 32: Joint 1 Joint Stiffness Toolbox SpreadsheetInput and Calculated Results
Report: A/SP-005-1 Light Truck Frame Joint Stiffness Study 60
JOINT STIFFNESS TOOLBOX
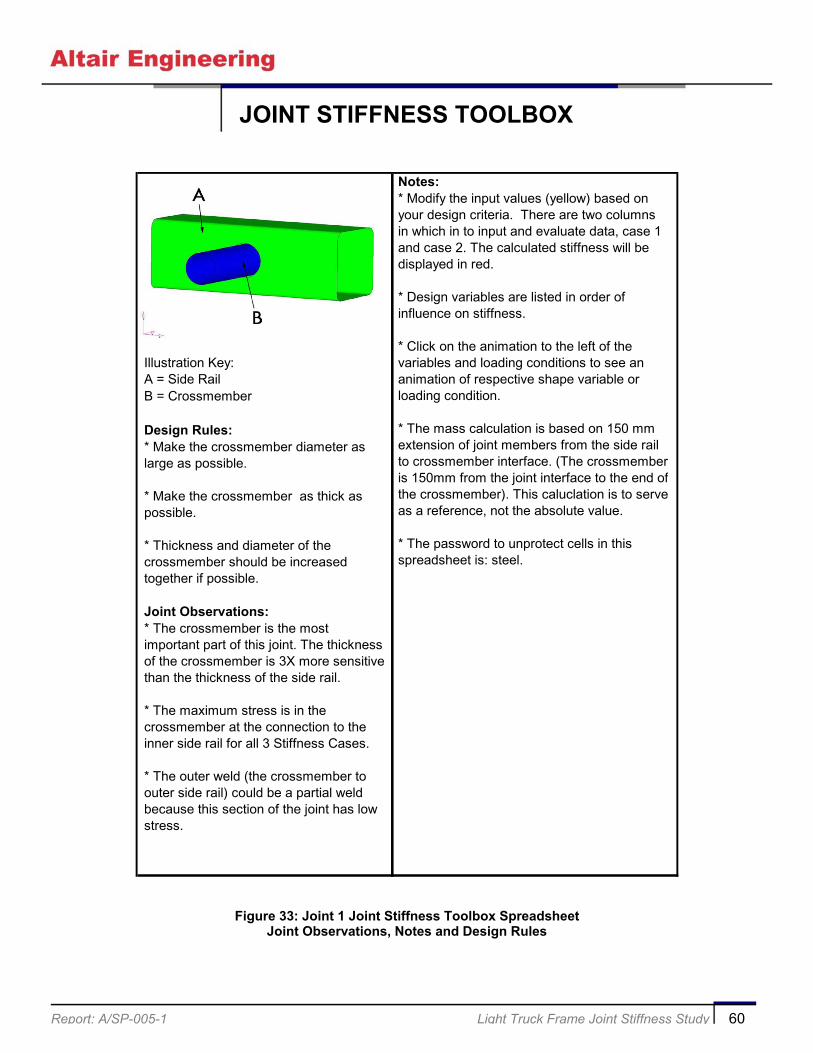
Illustration Key:A = Side RailB = Crossmember
Design Rules:* Make the crossmember diameter as large as possible.
* Make the crossmember as thick as possible.
* Thickness and diameter of the crossmember should be increased together if possible.
Joint Observations:* The crossmember is the most important part of this joint. The thickness of the crossmember is 3X more sensitive than the thickness of the side rail.
* The maximum stress is in the crossmember at the connection to the inner side rail for all 3 Stiffness Cases.
* The outer weld (the crossmember to outer side rail) could be a partial weld because this section of the joint has low stress.
Notes:* Modify the input values (yellow) based on your design criteria. There are two columns in which in to input and evaluate data, case 1 and case 2. The calculated stiffness will be displayed in red.
* Design variables are listed in order of influence on stiffness.
* Click on the animation to the left of the variables and loading conditions to see an animation of respective shape variable or loading condition.
* The mass calculation is based on 150 mm extension of joint members from the side rail to crossmember interface. (The crossmember is 150mm from the joint interface to the end of the crossmember). This caluclation is to serve as a reference, not the absolute value.
* The password to unprotect cells in this spreadsheet is: steel.
Figure 33: Joint 1 Joint Stiffness Toolbox SpreadsheetJoint Observations, Notes and Design Rules

Report: A/SP-005-1 Light Truck Frame Joint Stiffness Study 61
JOINT STIFFNESS TOOLBOX
Joint #2: Box to Lipped ChannelStiffness Calculations
Design Variables (mm) Min (mm) Max (mm)Thickness
Inner Side Rail Thickness 3 3 3 2 6
C Channel Rail Thickness 3.7 3.7 3.7 2 6
Crossmember Thickness 3 3 3 2 6
Crossmember Plate Thickness 3 3 3 2 6
End Rail Square Thickness 3 3 3 2 6
Shape Animations Shape Variables (mm)
animations\JCrossmember Width 110 110 110 80 120
animations\JSide Rail Height 160 160 160 100 200
animations\JCrossmember End Height 95 95 95 75 200
animations\JSide Rail Width 65 65 65 50 100
animations\JCrossmember Plate Flange Width 40 40 40 20 60
Loading Animations Stiffness Calculations Case 1 Case 2
Test Joint Units
animations\JKx Bending Stiffness (Mx) 40.944 40.944 40.944 kN-m/deg
animations\JKy Torsion Stiffness (My) 79.040 79.040 79.040 kN-m/deg
animations\JKz Fore/Aft Stiffness (Mz) 54.162 54.162 54.162 kN-m/deg
Mass 7.007 7.007 7.007 kg
Yellow cells are user input data.
Red cells are calculated numbers.
Case 1Test Joint
Input (mm)
Output
Design Window
Case 2
Figure 34: Joint 2 Joint Stiffness Toolbox SpreadsheetInput and Calculated Results
Report: A/SP-005-1 Light Truck Frame Joint Stiffness Study 62
JOINT STIFFNESS TOOLBOX
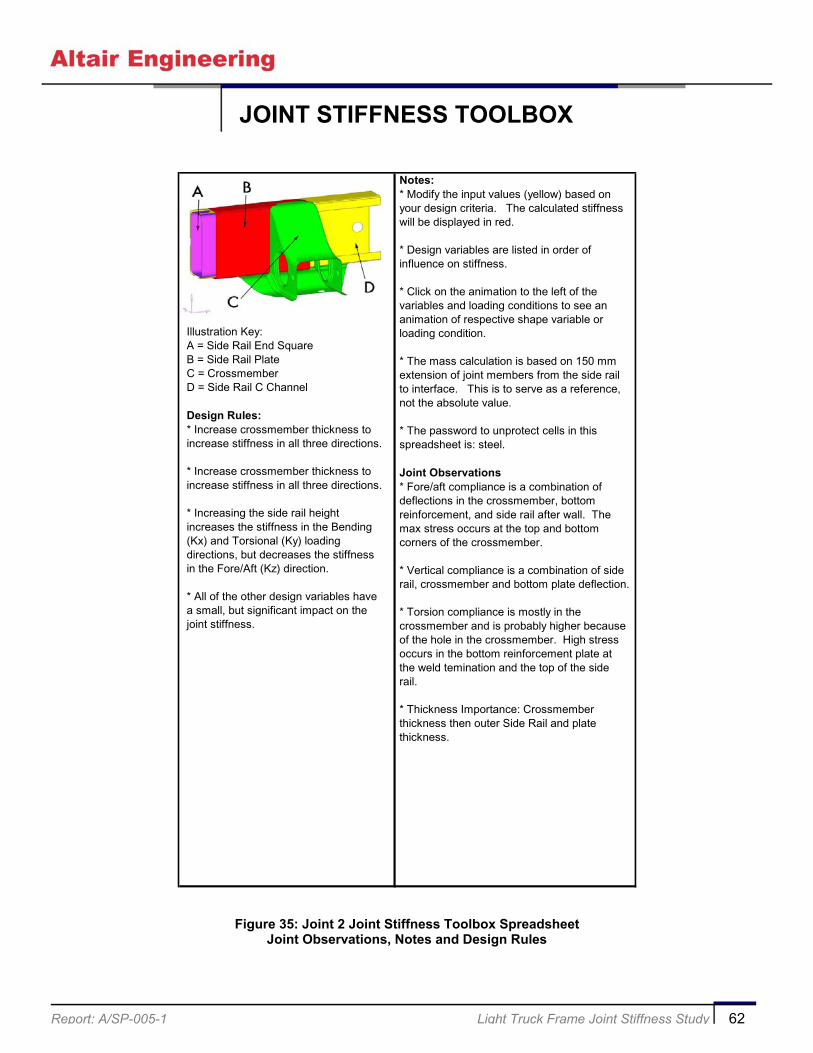
Illustration Key:A = Side Rail End SquareB = Side Rail PlateC = CrossmemberD = Side Rail C Channel
Design Rules:* Increase crossmember thickness to increase stiffness in all three directions.
* Increase crossmember thickness to increase stiffness in all three directions.
* Increasing the side rail height increases the stiffness in the Bending (Kx) and Torsional (Ky) loading directions, but decreases the stiffness in the Fore/Aft (Kz) direction.
* All of the other design variables have a small, but significant impact on the joint stiffness.
Notes:* Modify the input values (yellow) based on your design criteria. The calculated stiffness will be displayed in red.
* Design variables are listed in order of influence on stiffness.
* Click on the animation to the left of the variables and loading conditions to see an animation of respective shape variable or loading condition.
* The mass calculation is based on 150 mm extension of joint members from the side rail to interface. This is to serve as a reference, not the absolute value.
* The password to unprotect cells in this spreadsheet is: steel.
Joint Observations* Fore/aft compliance is a combination of deflections in the crossmember, bottom reinforcement, and side rail after wall. The max stress occurs at the top and bottom corners of the crossmember.
* Vertical compliance is a combination of side rail, crossmember and bottom plate deflection.
* Torsion compliance is mostly in the crossmember and is probably higher because of the hole in the crossmember. High stress occurs in the bottom reinforcement plate at the weld temination and the top of the side rail.
* Thickness Importance: Crossmember thickness then outer Side Rail and plate thickness.
Figure 35: Joint 2 Joint Stiffness Toolbox SpreadsheetJoint Observations, Notes and Design Rules
Report: A/SP-005-1 Light Truck Frame Joint Stiffness Study 63
JOINT STIFFNESS TOOLBOX
Joint #3: Tube Through Partially Boxed SectionStiffness Calculations
Design Variables (mm) Min (mm) Max (mm)Thickness
Crossmember Tube Thickness 2.5 2.5 2.5 2 6
Side Rail Thickness 3.5 3.5 3.5 2 6
Inner Crossmember Support Bracket Thickness 3 3 3 2 6
Shape Animations Shape Variables (mm)
animations\JCrossmember Tube Diameter 72 72 72 50 120
animations\JSide Rail Height 128 128 128 60 150
animations\JCrossmember Bracket Width 104 104 104 95 200
animations\JSide Rail Width 67 67 67 50 100
Loading Animations Stiffness Calculations Case 1 Case 2
Test Joint Units
animations\JKx Bending Stiffness (Mx) 2.642 2.642 8.145
animations\JKy Torsion Stiffness (My) 6.499 6.499 0.708
animations\JKz Fore/Aft Stiffness (Mz) 5.913 5.913 6.660
Mass 5.666 5.666 5.692
Yellow cells are user input data.
Red cells are calculated numbers.
kN-m/deg
Output
Input (mm)
kg
kN-m/deg
kN-m/deg
Design WindowCase 1 Case 2
Test Joint
Figure 36: Joint 3 Joint Stiffness Toolbox SpreadsheetInput and Calculated Results
Report: A/SP-005-1 Light Truck Frame Joint Stiffness Study 64
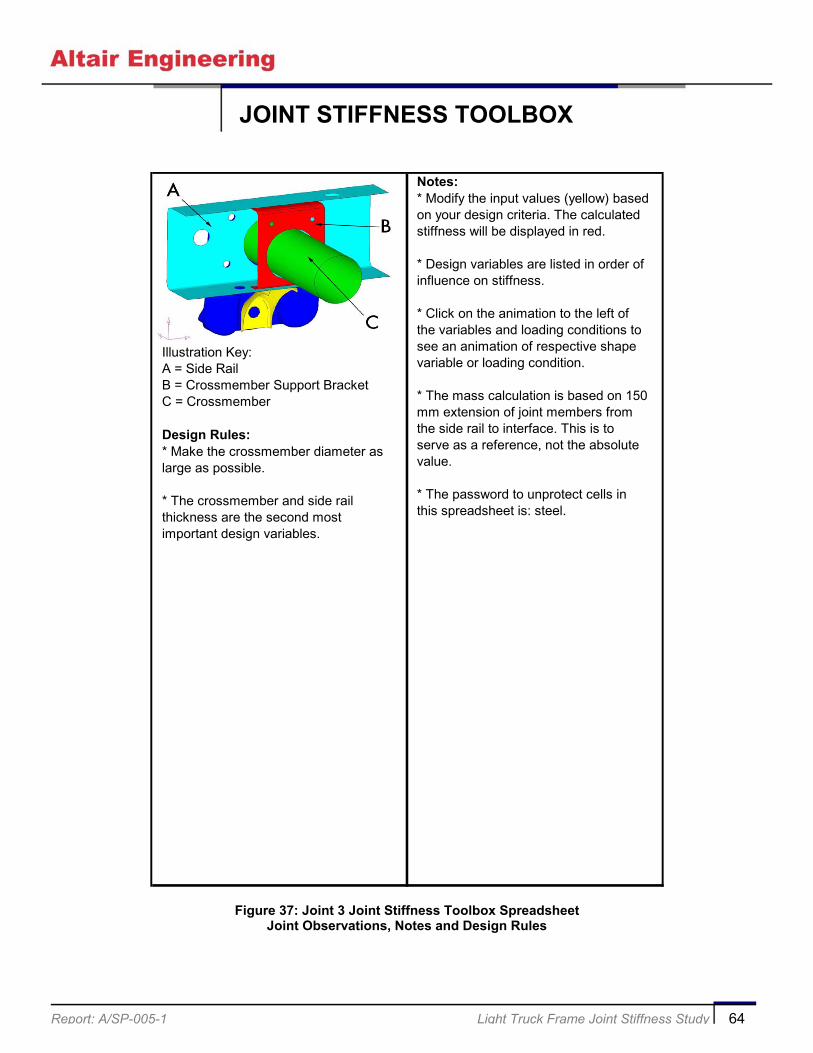
JOINT STIFFNESS TOOLBOX
Illustration Key:A = Side Rail B = Crossmember Support BracketC = Crossmember
Design Rules:* Make the crossmember diameter as large as possible.
* The crossmember and side rail thickness are the second most important design variables.
Notes:* Modify the input values (yellow) based on your design criteria. The calculated stiffness will be displayed in red.
* Design variables are listed in order of influence on stiffness.
* Click on the animation to the left of the variables and loading conditions to see an animation of respective shape variable or loading condition.
* The mass calculation is based on 150 mm extension of joint members from the side rail to interface. This is to serve as a reference, not the absolute value.
* The password to unprotect cells in this spreadsheet is: steel.
Figure 37: Joint 3 Joint Stiffness Toolbox SpreadsheetJoint Observations, Notes and Design Rules
Report: A/SP-005-1 Light Truck Frame Joint Stiffness Study 65
JOINT STIFFNESS TOOLBOX
Joint #4: Alligator to Box SectionStiffness Calculations
Design Variables (mm) Min (mm) Max (mm)Thickness
Lower Crossmember Thickness 3.2 3.2 3.2 2 6
Outer Side Rail Thickness 3.2 3.2 3.2 2 6
Upper Crossmember Thickness 3.2 3.2 3.2 2 6
Inner Side Rail Thickness 3.2 3.2 3.2 2 6
Shape Animations Shape Variables (mm)
animations\JCrossmember End Width 65 65 65 50 100
animations\JCrossmember Attach End Width 85 85 85 50 100
animations\JRail Width 65 65 65 50 100
animations\JUpper Flange Width 10 10 10 5 45
animations\JRail Height 115 115 115 100 130
animations\JLower Flange Width 10 10 10 5 30
Loading Animations Stiffness Calculations Case 1 Case 2
Test Joint
animations\JKx Bending Stiffness (Mx) 0.617 0.617 0.617
animations\JKy Torsion Stiffness (My) 3.053 3.053 3.053
animations\JKz Fore/Aft Stiffness (Mz) 2.175 2.175 2.175
Mass 4.680 4.680 4.680
Yellow cells are user input data.
Red cells are calculated numbers.
kg
Units
kN-m/deg
kN-m/deg
kN-m/deg
Test Joint
Input (mm)Design Window
Output
Case 1 Case 2
Figure 38: Joint 4 Joint Stiffness Toolbox SpreadsheetInput and Calculated Results

Report: A/SP-005-1 Light Truck Frame Joint Stiffness Study 66
JOINT STIFFNESS TOOLBOX
Illustration Key:A = Upper CrossmemberB = Outer Side RailC = Lower CrossmemberD = Inner Side Rail
Design Rules:* These are the major contributors to the joint stiffness: - Crossmember thickness - Crossmember end width - Crossmember attached end width
* These are the minor contributors to the joint stiffness: - Inner side rail thickness - Outer side rail thickness - Upper crossmember thickness - Flange width - Side rail width - Side rail height
Notes:* Modify the input values (yellow) based on your design criteria. There are two columns in which in to input and evaluate data, case 1 and case 2. The calculated stiffness will be displayed in red.
* Design variables are listed in order of influence on stiffness.
* Click on the animation to the left of the variables and loading conditions to see an animation of respective shape variable or loading condition.
* The password to unprotect cells in this spreadsheet is: steel.
Joint Observations:* The mass calculation is based on 150 mm extension of joint members from the side rail to interface. This is to serve as a reference, not the absolute value.
* Flanges on top of the side rail deflect quite a bit (local deflection).
* Lot of local deflection in the crossmember as it bends upward near the rail…Tying the crossmember together more would increase the stiffness.
Vertical Loadcase (Mx)* There is significant deflection in the inside rail wall where the crossmember connects to the side rail.
* Slight Deflection in the top side rail.
* Stiffness would increase if the crossmember was welded together more in the area near the side rail.
Torsional Loadcase (My)* Flanges aredeflecting in both crossmembers where they attach to the side rail.
* The stiffness would increase if the crossmembers were welded more at the joint.
Figure 39: Joint 4 Joint Stiffness Toolbox SpreadsheetJoint Observations, Notes and Design Rules

Report: A/SP-005-1 Light Truck Frame Joint Stiffness Study 67
JOINT STIFFNESS TOOLBOX
Joint #5: Hat Section to Box SectionStiffness Calculations
Design Variables (mm) Min (mm) Max (mm)Thickness
Crossmember Thickness 2.5 2.5 2.5 2 6
Inner Rail Thickness 2.5 2.5 2.5 2 6
Outer Rail Thickness 2.5 2.5 2.5 2 6
Shape Animations Shape Variables (mm)
animations\JCrossmember Height 65 65 65 45 85
animations\JWeld Flange Width 15 15 15 10 30
animations\JSide Rail Height 210 210 210 190 230
animations\JUpper Flange Width 18 18 18 10 45
animations\JCrossmember Width 110 110 110 90 130
animations\JSide Rail Width 65 65 65 55 75
Loading Animations Stiffness Calculations Case 1 Case 2
Test Joint Units
animations\JBending Stiffness (Mx) 0.773 0.773 0.773 kN-m/deg
animations\JTorsion Stiffness (My) 1.318 1.318 1.318 kN-m/deg
animations\JFore/Aft Stiffness (Mz) 0.995 0.995 0.995 kN-m/deg
Mass 6.053 6.053 6.053 kg
Yellow cells are user input data.
Red cells are calculated numbers.
Output
Input (mm)Design Window
Case 1 Case 2Test Joint
Figure 40: Joint 5 Joint Stiffness Toolbox SpreadsheetInput and Calculated Results
Report: A/SP-005-1 Light Truck Frame Joint Stiffness Study 68
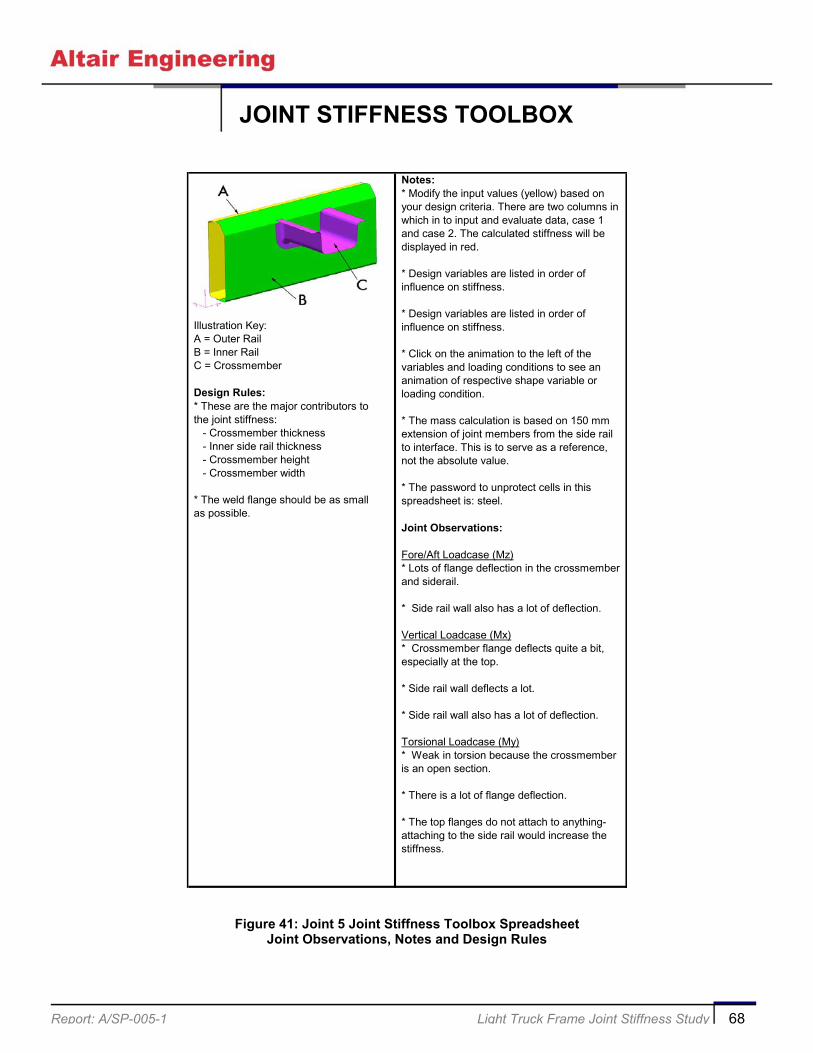
JOINT STIFFNESS TOOLBOX
Illustration Key:A = Outer RailB = Inner RailC = Crossmember
Design Rules:* These are the major contributors to the joint stiffness: - Crossmember thickness - Inner side rail thickness - Crossmember height - Crossmember width
* The weld flange should be as small as possible.
Notes: * Modify the input values (yellow) based on your design criteria. There are two columns in which in to input and evaluate data, case 1 and case 2. The calculated stiffness will be displayed in red.
* Design variables are listed in order of influence on stiffness.
* Design variables are listed in order of influence on stiffness.
* Click on the animation to the left of the variables and loading conditions to see an animation of respective shape variable or loading condition.
* The mass calculation is based on 150 mm extension of joint members from the side rail to interface. This is to serve as a reference, not the absolute value.
* The password to unprotect cells in this spreadsheet is: steel.
Joint Observations:
Fore/Aft Loadcase (Mz)* Lots of flange deflection in the crossmember and siderail.
* Side rail wall also has a lot of deflection.
Vertical Loadcase (Mx)* Crossmember flange deflects quite a bit, especially at the top.
* Side rail wall deflects a lot.
* Side rail wall also has a lot of deflection.
Torsional Loadcase (My)* Weak in torsion because the crossmember is an open section.
* There is a lot of flange deflection.
* The top flanges do not attach to anything- attaching to the side rail would increase the stiffness.
Figure 41: Joint 5 Joint Stiffness Toolbox SpreadsheetJoint Observations, Notes and Design Rules

Report: A/SP-005-1 Light Truck Frame Joint Study 69
REFERENCES
1. Bernuzzi, C.; Zandonini, R.; and Zanon, P.: “Experimental Analysis and Modeling of Semi-rigidSteel Joints Under Cyclic Reversal Loading,” Journal of Constructional Steel Research v38 n2Jun 1996 Elsevier Science Ltd Oxford Engl p. 95-123 0143-974X JCSRDL
2. Chen, T.Y. and Zhang, H-Y.: “Stress Analysis of Spatial Frames with Consideration of LocalFlexibility of Multiplanar Tubular Joint,” Engineering Structures, June 1996
3. Chiew, S.P.; Soh, C.K.; Soh, A.K.; Fung, T.C.; and Lee, W.M.: “SCF Design Equations For SteelMaltiplanar Tubular XT-Joints,” The Structural Engineer; July 1996
4. Davison, J.B.; Kirby, P.A.;and Nethercot, D.A.: “Rotational Stiffness Characteristics of SteelBeam-to-Column Connections,” Construction Steel Research, 1987
5. Hull, Frederick: “Van Frame Structural Evaluation,” SAE paper 790988; 1979
6. Korol R.M., Mansour M.H.: “Theoretical Analysis of Haunched-Reinforced T-Joints in SquareHollow Sections,” Canadian Journal of Civil Engineering; Dec. 1979;
7. Korol, R.M.; Zanaty, M.E.; and Brady, F.J.: “Unequal Width Connections of Square HollowSections in Vierendeel Trusses,” Canadian Journal of Civil Engineering, June 1977
8. Liew, J.Y.R.; Yu, C.H.; Ng, Y.H.; and Shanmugam, N.E.: “Testing of Semi-Rigid UnbracedFrames for Calibration of Second-Order Inelastic Analysis,” Journal of Constructional SteelResearch; No. 2/3
9. Lui, E. M. and. Chen, W. F: “Steel Frame Analysis with Flexible Joints,” Journal of ConstructionalSteel Research; 1998
10. Michejda, Oskar: “Truck Frame Analysis Study,” SAE paper 710594; 1971
11. Mourad, S.; Korol, R.M.; and Ghobarah, A.: “Design of Extended End-Plate connections forHollow Section Columns,” Canadian Journal of Civil Engineering, February 1996
12. Van Wingerde, A. M.: “The Fatigue Behavior of T- and X-Joint Made of Square Hollow Sections,”Heron; vol 37 no. 2; 1992
13. Yeoh S-K., Soh A-K., Soh C-K.: “Behavior of Tubular T-Joints Subjected To Combined Loadings,”Journal of Constructional Steel Research; 1995
14. Kim, Yoon Young; Yim, Hong Jae; Kang, Jeong Hoon; and Kim,Jin Hong: “Reconsideration of theJoint Modelling Technique: In a Box-Beam T-Joint,” SAE Paper 951108

Report: A/SP-005-1 Light Truck Frame Joint Study 70
APPENDIX A: ABSTRACTS
Read Articles
1. Experimental Studies and Design of Steel Tee Shear ConnectionsAstaneh, Abolhassan,and Nader, Marwan N.Journal of Structural Engineering v 116 n 10 Oct 1990 p. 2882-2902 0733-9445 JSENDH 15
A tee-framing shear connection consists of a steel tee section connected to a beam web and to asupporting member such as a column. The main role of the tee-framing shear connections is totransfer end shear reaction of simply supported beams to the supporting members. Usually, boltgroups or weld lines are used to connect the tee element to the beam web and to the support. Anexperimental investigation of the actual behavior of tee-framing shear connections is conducted bytesting nine full-size beam-to-column-joint assemblies. The connections are subjected to realisticcombinations of shear forces and rotations. The research establishes six failure modes for theseconnections. The studies indicate that the tee-framing connections tested are sufficiently flexible to beconsidered simple connections. A summary of the experimental research is presented. Theexperimental data and associated analytical studies are used to adapt mechanical models of thefailures and to develop and propose new design procedures.
2. A Numerical Approach to Define the Rotational Stiffness of a Prefabricated Connection andExperimental Study.Aydogan, M. and Akoz, A.Y.Computers & Structures, 1995
A numerical approach is proposed to define the elastic rotational stiffness of a typical joint on the topbeam of a prefabricated reinforced concrete gable frame structure. The 12 degrees of freedomtriangular plane stress finite element is used to examine the connection region. Using this jointrotational stiffness value, realistic results are obtained in the frame analysis. The experimentalverification is performed by means of the photoelastic method. Following the proposed method, aneffective joint length with reduced moment of inertia is defined and using this concept the framesolution is simply achieved, including the existence of joint.
3. Initial Stiffness of Semi-Rigid Steel Beam-to-Column ConnectionsAzizinamini, J.; Bradburn, H.; and Radziminski, J. B.Journal of Constructional Steel Research; 1987
Semi-rigid connections of the type studied in this investigation are distinguished by moment-rotationcurves which become non-linear relatively early during static loading. However, the connectionsexhibited linear unloading behavior, a linearity that was retained as moment was reapplied, to amaximum approaching that imposed during the initial load application. The slope of this latter curvewas found to be essentially the same as the initial slope of the moment-rotation curve during firstloading. Thus, the initial slope is of direct significance from a design viewpoint, in that it can be usedto represent the stiffness of the connection in the analysis of the complete structural system,particularly under live load fluctuations. In this paper, an analytical procedure is developed to predictthe initial stiffness of a particular type of semi-rigid connection; the predicted slopes were found tocompare favorably with experimentally determined connection behavior.
Report: A/SP-005-1 Light Truck Frame Joint Study 71
APPENDIX A: ABSTRACTS
4. Experimental Analysis and Modelling of Semi-Rigid Steel Joints Under Cyclic ReversalLoadingBernuzzi, C.; Zandonini, R.; and Zanon, P.Journal of Constructional Steel Research v38 n2 Jun 1996 Elsevier Science Ltd Oxford Engl p. 95-123 0143-974X JCSRDL
This paper reports on the first phase of a research project aimed at developing simple design criteriafor semi-rigid steel frames in seismic zones. The experimental phase comprised of two series of testson beam-to-column joints under cyclic reversal loading. The evaluation of the test results first allowedthe influence of the loading history to be investigated and the main stiffness and strength parametersto be identified, which define the cyclic response of the connection. A simple prediction model wasthen developed and proposed, which enables satisfactory approximation of the joint response for usein numerical analysis.
5. Finite Element Dynamic Analysis of an Automotive FrameBorowski,V. J.; Steury, R. L.; and Lubkin, J. L.SAE Paper 730506; 1973
Using several variations of a basic finite element, the dynamic displacement response and modeshapes of an automotive frame have been predicted. Small improvements in accuracy were notedwhen higher-order mass representation and allowance for shear deformation were included in theanalysis. Modeling accuracy was significantly increased however, by including certain effects that arenormally ignored. These include an allowance for the less-than-perfect rigidity of side rail-to-crossmember joints; for the torsional behavior of short, open cross-section beams; and for thereduction of flexural inertia in welded, double-channel cross-sections. With the introduction of thesefactors, the predicted natural frequencies for the first eight flexural modes can be correlated with testresults to within 4%. For this level of agreement, the finite element model appears to be sufficientlyaccurate to be used in design evaluation of frames, prior to prototype construction.
6. Experimental and Numerical Stress Analyses of Tubular XT-JointChiew, S.P ; Soh, C.K.; and Wu, N.W. (Nanyang Tech. University, Singapore)ASCE Journal of Structural Engineering; Nov 1999
A typical large-scale, steel, multiplanar tubular XT-joint specimen was tested, with its in-plane andout-or-plane braces subjected to a total of 11 different load cases comprising the basic axial loadingas welt as axial loadings combined with in-plane-bending (IPB) and out-of-plane-bending (OPB)moments. The stress concentration factors (SCFs), strain concentration factors (SNCFs), and theSCF-to-SNCF ratio (S/N Ratio) at the potential hot spot stress locations were investigated. Anaverage S/N Ratio of 1.16 was derived from all the test load cases. The SCFs at typical hot spotlocations were also calculated using finite-element (FE) analysis. The good agreement between thenumerical and the experimental SCF results confirmed the reliability of the numerical modeling of theXT-joint. In addition, the writers' SCF results were compared with Efthymiou's influence function (IF)method and the ones derived from the corresponding uniplanar T-/X-joints. A clearer understandingof the significance of the multiplanar effects for fatigue design was obtained through this comparisonstudy.
Report: A/SP-005-1 Light Truck Frame Joint Study 72
APPENDIX A: ABSTRACTS
7. SCF Design Equations For Steel Maltiplanar Tubular XT-JointsChiew, S.P.; Soh, C.K.; Soh, A.K.; Fung, T.C.; and Lee, W.M.The Structural Engineer; July 1996
A parametric study of hotspot stresses in multiplanar tubular XT-joins has been conducted in which180 finite element analyses were performed. The study covers a wide range of joint geometries undervarious combinations of axial forces. The results of the analyses are presented as a set of equationsexpressing the stress concentration factor as a function of the relevant geometric parameters forvarious combinations of axial forces. A typical full-size steel multiplanar XT-joint was selected forexperimental testing to verify the numerical analyses. A comparison is also made between the resultsobtained for multiplanar tubular XT-joints and those of the corresponding uniplanar T-and X-joints. Itwas found that, when all the braces of the multiplanar effect is significant. When the out-of-planebraces are not loaded, the multiplanar effect is insignificant for small ß value when the comparison ismade between the multiplanar XT-joints with uniplanar T-joints.
8. Stress Analysis of Spatial Frames with Consideration of Local Flexibility of MultiplanarTubular JointChen, T.Y. and Zhang, H.Y.Engineering Structures, June 1996
A polyhedral element for a multiplanar tubular joint is suggested. The stiffness matrix of thepolyhedron of a flexible joint is formulated based on the local flexibility factor matrix and coordinatetransformation. An offshore jacket is chosen as a numerical example. The computed results show thegreat effect of local flexibility of a multiplanar tubular joint on the internal forces, deformation, andstress concentration of the joint. Hence, the consideration of flexibility in the global spatial structuralanalysis is vital.
9. A Study on the Beam Modeling of Box Channel Structures: for the T Type Joint StructuresChoi, Jong-Keun; Lee, Yong-Rae; Choi, Seok-Hwan; and Lee, Jung-HanSAE Paper 960554; Feb 1996
10. Strength of Welded T-DT Joints in Rectangular and Circular Hollow Section Under VariableAxial LoadsDavies, G. and Crockett, P.Journal of Constructional Steel Research v37 n1 Mar 1996 Elsevier Science Ltd Oxford Engl p 1-310143-974X JCSRDL
Finite element methods calibrated against experimental results from tests and data bases are used toobtain interaction diagrams for the strength of hollow section T-DT joints under three-dimensionalstatic brace loading. Suggestions are made for the use of modifying factors in conjunction with planarjoint strength design recommendations. English (Author abstract) 15 Refs.
11. Rotational Stiffness Characteristics of Steel Beam-to-Column ConnectionsDavison J.B.; Kirby, P.A.; and Nethercot, D.A.Construction Steel Research, 1987
A series of tests on a variety of beam-to-column connections suitable for rectangular frames using I-section members has been conducted. The principal objective was the provision of moment-rotationdata so that a comparative assessment of the performance of the different types, in terms ofconnection stiffness and moment capacity, could be undertaken. Thus all tests employed similarbeam and column sizes, test apparatus, instrumentation and test procedures. The connections
Report: A/SP-005-1 Light Truck Frame Joint Study 73
APPENDIX A: ABSTRACTS
studied were ascending order of stiffness and strength: web cleats, flange cleats, combined seatingcleat and web cleats, flush end plate and extended end plate. Connections to the column flanges andthe column web were included. Major sources of connection flexibility have been identified and theresults prepared for subsequent use in assessments of semi-rigid joint action in steel frames.
12. Through-Thickness Properties of Column Flanges in Welded Moment Connections Dexter, R. J. (Minnesota University, USA) and Melendrez, M. I. (Disney World Int., USA)ASCE Journal of Structural Engineering; Jan 2000
Forty tee-joint specimens were tested to assure that through-thickness strength or ductility of thecolumn flanges is not a potential failure mode for welded moment connections. The specimens weredesigned with 690-MPa yield-strength pull plates and a high-strength high-toughness double grooveshop weld (not representative of structural welds) to attempt to induce through-thickness failures incolumn flanges. Despite high strain rate, high-heat input welds, and several details designed totrigger fractures, only one through-thickness failure occurred. In most cases the pull plates broke, andin all cases the stress levels exceeded 690 MPa, well above the stress level that could be deliveredby structural steel beam flanges. The only specimen fabricated without continuity plates resulted in athrough-thickness brittle fracture of the column flange, although the nominal pull-plate stress wasquite high (698 MPa). The lack of yielding in the through-thickness direction can be explained by theexistence of triaxial constraint of the column flange material.
13. Experimental Analysis of Bolted Connections: Snug Versus Preloaded BoltsFaella, C., Piluso, V. and Rizzano, G. (Salerno University)ASCE Journal of Structural Engineering, (USA) Jul 1998
The rotational stiffness of bolted connections can be properly predicted by means of the so-called'component method.' In this method, the T-stub plays a fundamental role, because it is used tocompute the stiffness contribution of the most important joint components. For this reason, anexperimental analysis on bolted T-stub assemblies has been performed. On the basis of this analysis,the possibility of predicting the axial stiffness of the T-stub assembly is investigated. In addition, asthe joint behavior is strongly influenced by the bolt preloading, the experimental analysis has beenperformed applying three different levels of bolt preloading and, starting from the obtainedexperimental results, simple rules to take it into account are suggested. Finally, the reliability of therelationships derived from the T-stub analysis has been verified through the application of thecomponent method to the prediction of the rotational stiffness of a wide number of tested specimensconcerning extended end plate connections, both with snug-tightened and pretensioned bolts,collected in the technical literature.
14. Practical-Theoretical Analysis of Chassis Torsion by Finite Element AnalysisFragoso, Helio R.SAE Brasil 93; Paper 931705
The structural calculation of a complete light truck frame using the Finite Element Method requires theknowledge of the torsional stiffness of the cargo box, cab and front end of the vehicle. This paperpresents a practical way to obtain the necessary data, avoiding the mathematical modeling of thewhole vehicle, to reduce time and machine requirements. Lab measurements of the torsional stiffnessare performed, in the frame alone and with each of the body components, allowing the definition of amathematical model for the whole vehicle.
Report: A/SP-005-1 Light Truck Frame Joint Study 74
APPENDIX A: ABSTRACTS
15. Deformations Car Body Joints Under Operating ConditionsGarro, Lorenzo and Vullo, VincenzoSAE Paper 861397 1986
In this paper an analysis of the dynamic behavior of typical bodywork joints subjected to two typicalactual load conditions is presented. This analysis is carried out by finite element method andexperimental verified by holographic interferometry measurements. The obtained results showunequivocally that along the weld spots the plate edges tend to detach one from the other and thatunder operational conditions the weld spots of a car bodywork essentially by unbuttoning.
16. Moment-Rotation Relationship of Blind Bolted Connections for HSS ColumnsGhobarah, A.; Mourad, S.; and Korol, R.M.Source: Journal of Constructional Steel Research v 40 n 1 Oct 1996 Elsevier Science Ltd Oxford Englp 63-91 0143-974X JCSRDL
An analytical model representing connection response capable of simulating its behavior of blindbolted connections for Hollow Structural Section columns in terms of its moment-rotation relationshipwas developed for the determination of the overall frame response. The model evaluates the mainconnection parameters such as its initial stiffness and plastic moment capacity on the basis of fewsecondary parameters obtained from test results. The accuracy of the analytical model was examinedby comparing the model results with experimental measurements. The model predicted theconnection rotation with reasonable accuracy at different levels of loading. A numerical example isprovided to illustrate how the connection model can be applied in the design.
17. Van Frame Structural EvaluationHull, Frederick H.SAE paper 790988; 1979
This paper describes the structural evaluation of a van production chassis frame, a light weight framedesign and four other modified production frames. Static structural properties were determined by acombination of laboratory joint stiffness measurements and a finite element model incorporatingempirical stiffness values. The finite element analysis results are compared to laboratory framebending and torsion measurements.
18. Columns with Semirigid JointsJones , Stephen W.; Kirby, Patrick A.; and Nethercot, David A.ASCE Journal of Structural Engineering; Feb 1982
The influence of a semi-rigid end restraint on the strength and behavior of steel concrete columns isexamined. A method of analysis has been developed which incorporates the effects of initial out-of-straightness, initial residual stresses and spread of yield. Results have been compared with availableexperimental data and this data correlates well. Possible column design economies due to the actualend restraint are outlined.
19. Reconsideration of the Joint Modelling Technique: In a Box-Beam T-JointKim, Yoon Young; Yim, Hong Jae; Kang, Jeong Hoon; and Kim, Jin HongSAE Paper 951108
In this paper, joint modeling techniques are investigated in a box beam T-joint, which may be viewedas a simplified model of typical vehicle body joints. For low-frequency vibration analysis, joints are
Report: A/SP-005-1 Light Truck Frame Joint Study 75
APPENDIX A: ABSTRACTS
typically modeled by torsional spring elements and the importance of reasonable spring rates hasbeen noted in many investigations. The effects of the joint branch lengths on the spring rates areinvestigated and it is shown that converging results are obtained only with proper branch lengths. Wealso discuss some facts to consider for estimating consistently the spring rates when the branches ofthe T-joints meet oblique angles. Finally, a possibility of using short beam elements instead ofconventional spring elements to account for the joint flexibility is examined. The consequence of shortbeam modeling is that the sensitivity analysis on the natural frequencies with respect to the jointflexibility can be easily performed.
20. An Experimental Investigation of Double Chord HSS TrussesKorol, R.M.; Mirza, F.A.; and Chiu, E.T.C.Canadian Journal of Civil Engineering, June 1983
The results of a series of five large scale experiments on Warren trusses comprised of square HSSand utilizing the concept of a double chord are presented. The trusses were simply supported andloaded at their top chord panel points, thus simulating gravity loading. It was found that the boltedtype, the back-to-back with overlap configuration, caused a member failure. The joints showed little orno duress. On the other hand, the two standard type trusses suffered joint failures principally by chordshearing at the ends of the top chord. This amounted to a reduction in strength of about 20% of thevalues of the other trusses. In this paper some design details are presented to help alleviate theproblem of inadequate end joint strength.
21. Finite Element Analysis of RHS T-JointsKorol R.M. and Mirza, F.A.Journal Structural Division, Sept. 1982
The finite element method is used to model the structural behavior of T-joints in rectangular hollowsections beyond the elastic limit. Their ultimate load and working strengths are determined. Alsocalculated are the punching shear and rotational stiffnesses under branch axial force and bendingmoment.
22. Plate Reinforced Square Hollow Section T-Joints of Unequal WidthKorol, R.M.; Mitri H.; and Mirza, F.A.Canadian Journal of Civil Engineering, June 1982
The carrying capacity of square hollow structural section T-joints stiffened by a rectangular flangeplate is investigated for both branch bending moment and punching shear. The ultimate moment orload is determined from the simple yield line method of which one of three failure modes is applicabledepending on the plate length. A large number of combinations of branch, chord, and plate sizes areanalyzed to provide a statistical basis for making recommendations of optimum plate lengths andthicknesses for stiffened joints in Vierendeel truss applications.
23. Predicting the Behaviour of HSS Double Chord Trusses—A Comparison With Test ResultsKorol, R.M., Miraza, R.A., and Chiu E.T.C.Canadian Journal of Civil Engineering, June 1983
Predictions from a previously developed analytical model that takes into account plastic hingingaction and includes the effects of axial load and moment interaction are compared with the results oftests on double chord RHS trusses. The model incorporates a shear spring mechanism that isapplicable to gap joints of HSS trusses. Load displacement curves generated by the program are in
Report: A/SP-005-1 Light Truck Frame Joint Study 76
APPENDIX A: ABSTRACTS
reasonable agreement with the majority of truss tests. Calculated moment-axial force interactioncurves tend to predict trends of behavior rather than to be accurate.
24. Theoretical Analysis of Haunched-Reinforced T-Joints in Square Hollow SectionsKorol, R.M. and Mansour, M.H.Canadian Journal of Civil Engineering; Dec. 1979
A theoretical analysis has been undertaken for unequal width T-joints, haunch-reinforced, in squarehollow structural sections (HSS). The unreinforced joint is merely a special case. The theory wasbased on a finite difference solution to the elastic chord flange plate equation and predicts thebranch-to-chord joint stiffnesses under both bending and axial force. The effects of varying the widthratio overall haunch length-to-width ratio, and chord width-to-thickness ratio b c were studied fordifferent plate edge boundary conditions. The latter parameter has the greatest effect on stiffness, butthe other two, including haunch size, are also significant. There is reasonable agreement between thejoint rotational stiffness factor.
25. Unequal Width Connections of Square Hollow Sections in Vierendeel TrussesKorol, R.M.; Zanaty, M.E.; and Brady, F.J.Canadian Journal of Civil Engineering, June 1977
With the advent of hollow structural steel sections, the potential for Vierendeel trusses has greatlyincreased. The absence of simplified design methods has led to an extensive research program, theresults of which are reported here. A total of 29 specimen comprising five distinct connection typeswere tested and their strength and stiffness properties were recorded. Most of the joints testedbehaved in a semi-rigid fashion, so that a stiffness method for analyzing Vierendeel trusses has beendeveloped. Design curves for prediction of joint strength are proposed and design examples oftrusses under panel point loading are analyzed. Two types of joint are recommended: the haunchtype of connection and the cord flange stiffener, both of which have adequate strength and stiffnesscharacteristics.
26. On the Definition of Beam-Wall Joint Rotations in the Analysis of Coupled Wall-FrameStructuresKwan, A.K.H.Engineering Structures, 1993
In the analysis of coupled wall-frame structures, several different definitions for the beam-wall jointrotations have been adopted. However, the various definitions used are not equivalent. Byformulating the coupling beam element as a Timoshenko beam element with both horizontal andvertical fiber rotations at each end, it is shown that the proper definition for nodal rotation at a beam-wall joint should be the rotation of the vertical fiber at the beam-wall interface; the use of otherdefinitions may lead to errors in the effective stiffness of the coupling beams. A quantitativeassessment of the errors so caused is made and it is found that in cases where coupling beams areshort and stiff, the errors could be quite significant. It is therefore proposed that existing methodswhich use definitions other than the vertical fiber rotations at the joints should be reviewed and, ifnecessary, reformulated to have the definition of the beam - wall joint rotations amended.
Report: A/SP-005-1 Light Truck Frame Joint Study 77
APPENDIX A: ABSTRACTS
27. A Study on the Improvement of the Structural Joint Stiffness for Aluminum BIWLee, Young Woong; Kwon, Yong Woo; Kwon, Soon Yong; and Cho ,Won SukSAE Paper 970583; Feb 1997
The application of aluminum Body-In-White has several technical barriers in press forming, joining,and chemical conversion treatment processes. Among them, the optimization of joining processeswith which structural stiffness and durability will be assured might have the key role for the success ofaluminum applications to BIW. In this study, stiffness, strength and fatigue strength of BIW joints withaluminum sheets were evaluated as a function of joining methods, such as resistance spot weldingand weld bonding, via both experimental and analytical routes (FEM). For the evaluation, single-lapjoint and T-shaped joints were made, with each joining method, as variation of pitch, sheet thicknessand even materials – steel sheets. Based on the experimental and FEM analysis results, the optimumjoining method for the aluminum BIW which is suitable for weight saving and has equivalent stiffnessand strength to steel is suggested. In addition, for obtaining optimum processes with improvedstiffness, and strength of the joining method, design parameter, such as the influence of the spot pitchon the structural joint stiffness and the minimum wall thickness of aluminum which is able to maintainthe equivalent stiffness and strength to steel are discussed.
28. Testing of Semi-Rigid Unbraced Frames for Calibration of Second-Order Inelastic AnalysisLiew, J.Y.R.; Yu, C.H.; Ng, Y.H.; and Shanmugam, N.E.Journal of Constructional Steel Research; No. 2/3; 1
This paper examines the behavior of semi-rigid unbraced frames through a series of tests on a varietyof rectangular frames as well as their joints so that the analysis and design methodology can bedeveloped and verified against the test results. The frame and joint tests employed similar beam andcolumn sizes and had the same connection details. The two types of connections studied were top-seat-double-web angle and extended end-plate. Column-base connections were also included in thestudies. Load-displacement plots are presented for all the test frames subjected to gravity loadsapplied to the beam and columns, and a horizontal load applied at the beam level. The principalobjective of the joint tests is to provide a comprehensive set of moment-rotation data, in terms ofstiffness and moment capacity, so that a comparative assessment of the frame performance due tothe different connection types could be undertaken. Detailed descriptions of test arrangement, loadsequences, test methods and data acquisition techniques are given. The general observed behavioris discussed. Results from the frame tests are compared with the corresponding theoretical resultsobtained from a second-order inelastic analysis.
29. The Flexibility of a Tubular Welded Joint in a Vehicle FrameLubkin, James L.SAE Paper 740340, 1974
Automotive frames frequently consist of thin tube members thick enough for much of the structure tobe modeled adequately by bar elements. However, previous results show that a typical welded jointcannot be handled by the classical “rigid joint” assumption of frame analysis. Those results includetests of a joint type common in passenger car frames, and establish errors of over 60% in analyticalpredictions for some of the lower natural frequencies. The present paper attempts to see how muchimprovement we can achieve by simply accounting for the actual tubular shape in the vicinity of thejoint, without allowing for the flexibility of the weld line itself. The study uses the NASTRAN computerprogram. The joint region is treated as a small substructure in a model otherwise composed of barelements. This procedure is economical because only those portions which really have to beanalyzed using plate elements are so treated. Parameters investigated include joint length, and twoways of attaching a shell to adjacent bar elements. The present results reduce the worst two
Report: A/SP-005-1 Light Truck Frame Joint Study 78
APPENDIX A: ABSTRACTS
frequency errors, 38% and 60%, to less than 7% and 11%, respectively. This is good enough formany purposes. Residual discrepancies are believed to be due, in part, to actual weld line flexibility.In vibration modes involving a particular kind of bending deformation, the slightly larger discrepanciesare also tentatively attributed to a nonlinear-effect; i.e., changes of cross-section shape in therelatively thin rectangular tubing used.
30. Steel Frame Analysis with Flexible JointsLui, E. M. and Chen, W. F.Journal of Constructional Steel Research; 1998;
The first part of the paper discusses various mathematical models that have been proposed torepresent the nonlinear moment-rotation behavior of the semi-rigid steel beam-to-columnconnections. This is followed by a brief description of two simplified and a rigorous analysis capableof dealing with these models in flexibly-connected steel frames. Numerical studies of frames madeusing these simplified and rigorous analysis methods are presented. Observations regarding theeffects of flexible connections on the strength, deflection and internal force distribution of steel-framedstructures are discussed.
31. Truck Frame Analysis StudyMichejda, OskarSAE paper 710594; 1971
A method of truck frame analysis is proposed to include the effects of forces acting in threedimensions as well as the effects of variable cross sections, off shear-center loading, and jointflexibility. The interaction between the frame and other components of the vehicle is discussed and amethod is proposed to include these effects in the static and dynamic stress analysis of the framecomponents. The dynamic effects on stresses are proposed to be included in experimentallydetermined dynamic stress factors defined in terms of dimensionless probability density functions forvarious frame components and on and off highway conditions. An experimental program is outlinedfor the evaluation of stiffness characteristics of the flexible joints; the upper bound of the horizontalforce acting at the front axle, and the dynamic stress factors. General analysis of forces anddeformations in the chassis due to drive-shaft impact and twisting of the vehicle is included in theAppendices.
32. Elasto-Plastic Finite Element Analysis of Double Chord Rectangular Hollow Section T-JointsMirza, F.A.; Shehata, A.A.; and Korol, R.M.Computers & Structures, 1984
Elasto-plastic response of T-joints consisting of double chord, rectangular hollow sections (RHS) hasbeen modeled by treating the chord's mated flanges as thin plates supported by coupled springs thatsimulate the action of the side walls and bottom flanges. The finite element formulation includesrectangular plate and edge boundary springs in which both in-plane and out-of-plane actions areconsidered. Material nonlinearities are incorporated through the Von-Mises yield criterion and itsassociated flow rule and the Newton-Raphson method is used for the nonlinear analysis. The modelis used to determine the ultimate strength and the load-deformation curves for both double and singlechord T-joints.

Report: A/SP-005-1 Light Truck Frame Joint Study 79
APPENDIX A: ABSTRACTS
33. Development of an Automotive Joint Model Using an Analytically-Based FormulationMoon, Y.M. (Michigan University); Jee, T.H. (Korean Passenger Car R&D Center); and Park, Y.P.(Yonsei University)Journal of Sound & Vibration, (UK) 4 Mar 1999
A FE model of an automotive structure consists of beam and shell elements. Generally, the pillarsand rockers are modeled as beam elements and other parts as shell elements. Beam elements areused since they are more efficient than shell elements. A joint is defined as an intersection region ofbeam elements, and is generally modeled as coupled rotational springs. In this study, a joint modelingmethodology is presented. First, the definition and assumptions of the joint are discussed. Second,the joint stiffness analytical model is proposed using static load test results. The proposed method ismore efficient and accurate than existing evaluation methods. Third, the sensitivity analysis method(Nelson's method) and a joint stiffness updating algorithm are presented. To verify these methods,the FE analysis results of a half size structural model of an automobile with rigid joints and rotationalspring joints are compared with experimental modal analysis results.
34. Stress Concentration Factors in Tubular K-Joints Under In-Plane Moment LoadingMorgan, M. R. and Lee, M. M. K.Journal of Structural Engineering; April 1998; v 124
An extensive parametric study is presented of the distributions of stress concentration factors intubular K-joints commonly found in offshore platforms. The study covers a comprehensive range ofgeometric joint parameters for balanced in-plane moment loading. The results of the study were firstused to assess two sets of widely used parametric equations, which predict the maximum stressconcentration factors on the outer surfaces of the chord and the brace. The new database of finite-element results was then used to develop parametric equations for predicting stress concentrationfactors at key locations around the intersection on the outer as well as the inner surfaces of the chord.The reliability of the proposed and existing parametric equations was then assessed using an acrylictest joint database and some published test data measured from a steel model. Fracture mechanicsfatigue calculations were also performed to demonstrate that the information provided from theproposed equations could be utilized to obtain accurate, and safe, fatigue life estimates.
35. Design of Extended End-Plate Connections for Hollow Section ColumnsMourad, S.; Korol, R.M.; and Ghobarah, A.Canadian Journal of Civil Engineering, February 1996
Extended end-plate connections have been widely used in moment-resisting steel frames with W-shape columns, due to their sufficient stiffness and moment capacity. In addition, such connectionsare easy to install and permit good quality control. Extended end-plate connections can also beemployed in moment-resisting frames with hollow structural section columns by using high strengthblind bolts. These bolts have been developed for installation from one side only where the rear side ofthe connection is inaccessible. In this study, a quantitative procedure for detailing and designingbeam extended end-plate connections for rectangular hollow structural section columns using highstrength blind bolts is proposed. The design procedure is consistent with the design philosophy givenin limit-state codes. The proposed design is based on the results obtained from an experimentalprogram and an analytical study.
Report: A/SP-005-1 Light Truck Frame Joint Study 80
APPENDIX A: ABSTRACTS
36. Dynamic Response of Hollow Section Frames with Bolted Moment ConnectionsMourad, S.; Ghobarah, A;. and Korol, R.M.Engineering Structures, 1995
The behavior of moment-resisting steel frames under various types of loads is dependent on the typeof beam-to-column connections and their flexibilities. The extended end-plate connection is apractical field bolted moment connection that can be adopted in moment-resisting steel frames withhollow structural steel (HSS) columns, by using high strength blind bolts. The objective of this workwas to study the behavior of blind bolted extended end-plate connections for HSS columns undercyclic loading. With proper detailing and modeling of such connections, it has been possible toinvestigate the effect of joint flexibility on the response of the frame when subjected to dynamicloading and then to compare its response to that of a rigid frame. It is concluded that the proposedbolted joint behaves in a predictable manner that can be modeled and analyzed using standard frameanalysis programs. The study also showed that the inclusion of the connection flexibility in frameanalysis is essential to obtain a more realistic frame behavior.
37. Towards an Exact Value for the Flexural Stiffness of Tall Rigid FramesOlowokere, D.; Aktan H.; and Akanni, A.N.Computers & Structures, 1991
The contribution of the flexural stiffness of tall rigid frames to the overall lateral stiffness of thebuilding is evaluated. The parametric study is conducted for nine different rigid frame geometriesrepresenting shear wall-frame buildings commonly employed. Each frame of appropriate gridgeometry and pre-sized cross-sections is subjected to prescribed lateral loading. The lateraldeflection of the various column joints is computed using the stiffness method. Subsequently,retaining the same moment of inertia, the cross-sectional areas of all columns are increased tosimulate an axially infinitely stiff column and each frame is re-analyzed using the same lateral loading.The difference in the computed horizontal joint deflection from each of the analyses represents thelateral displacement of the frame due to axial strains in the columns and, hence, a measure of the'flexural' deformation of the frame.
38. Stress Concentration Factors for Non-90° X-Connections Made of Square Hollow SectionsPacker, J.A. and Wardenier, J.Canadian Journal of Civil Engineering v 25 n 2 Apr 1998
A number of fatigue experiments and stress concentration factor measurements on non-90°, squarehollow section X-connections have been carried out. Comparison of the measured stressconcentration factors with those derived from existing parametric formulae for 90° T- and X-connections showed a strong influence of the brace angle. A tentative extension of the range ofvalidity of the parametric formulae for 90° T- and X-connections for other brace angles has beenderived. English (Author abstract) 15 Refs.
39. Automotive Body Joint Analysis for Improved Vehicle ResponseRao, Zebrowski, and Crabb
A comprehensive analysis system for defining the flexible characteristics of body structural joints isdescribed. A static test methodology of obtaining joint stiffness characteristics is presented. A jointdatabank, consisting of linear joint stiffness characteristics, is developed. A mini-computer baseddynamic joint stiffness testing methodology for obtaining dynamic joint stiffness characteristics, whichcan be integrated into finite element body models, is explained. Finite element joint modelingprocedures for obtaining joint stiffness characteristics, before hardware availability, are outlined. A

Report: A/SP-005-1 Light Truck Frame Joint Study 81
APPENDIX A: ABSTRACTS
joint modification technique integrating finite element analysis, laboratory testing and vehicleevaluation, which significantly improved vehicle NVH response, is described.
40. Welded Interior Box-Column to I-Beam ConnectionsShanmugam, N.E. and Ting, L.C.ASCE Journal of Structural Engineering; May. 1995; 3
This paper deals with experimental investigations to study the ultimate load behavior of I-beam tobox-column connections stiffened externally. Specimens representative of interior columns in a steelbuilding frame were fabricated with connections stiffened by T-sections butt-welded at the junction ofthe beam and column flange. They were tested to failure under static and fluctuating loads appliedseparately. Ultimate load-carrying capacity and typical load-deflection and moment-rotationresponses obtained experimentally are presented; the results for those specimens tested under staticloading are compared with the corresponding results using the elasto-plastic finite-element method.Close agreement is observed between the experimental and theoretical moment-rotation curves.Results show clearly that these connections satisfy the basic criteria; sufficient strength, sufficientrotation capacity, and adequate stiffness for a moment connection. The proposed connections arecapable of developing load-carrying capacity in excess of the plastic capacity of the beam framinginto the joint.
41. Transferred Load and Its Course in Passenger Car BodiesShinobu, Manabu;, Okamoto, Daichi;, Ito, Shuta; Kawakami, Hirofumi; and Takahashi, KunihiroSAE of Japan Review 16; 1995
A method to express the concept of load transfer and the course of the transferred load in thestructure is introduced. Transferred load in an actual passenger car body is investigatedexperimentally. The degree of joint stiffness between the members of the vehicle body can also bediscussed based on this concept. Difference can be shown between the course from the frontsuspension and that from the rear suspension under the condition of the torsional loading.
42. The Fatigue Behavior of T- and X-Joint Made of Square Hollow SectionsVan Wingerde, A.M.Heron; vol 37 no. 2; 1992
This work presents the results of experimental and numerical research on the fatigue behavior of T-and X-joints between square hollow sections of which the brace is welded to the face of the chord,without any additional stiffeners. The work has been carried out in the framework of the CIDECTprogram 7K “Fatigue behavior of uniplanar joints'', and an earlier ECSC program “Fatigue strength ofwelded unstiffened RHS joints in latticed structures and Vierendeel girders'' (CECA Convention nr.7210-SA/111). Furthermore, experimental results of the CIDECT program 7H “The low cycle fatiguebehavior of axially loaded T-joints between rectangular hollow sections'' have been used in this work.The aim of the research programs is to establish a better design method for the fatigue strength ofjoints in square hollow sections, based on the hot spot stress method. The results are to be proposedfor inclusion in Eurocode 3. In the experimental investigation, the strain concentration factors aremeasured at various locations of the joint for comparison with results of the numerical investigationsand Sr(h.s.)-Nf curves are determined. The numerical work provides SCF values at weld toes for arange of parametric variations in the joint dimensions. These results form the basis for a set ofparametric formulae. These formulae allow the determination of the SCF values at the weld toes ofthe brace and chord, depending on the non-dimensional parameters (β, 2γ and &tau).The results of tests and formulae are used to check the final validity of the formulae in combinationwith the Sr(h.s.)-Nf lines. English (Author abstract) 123 Refs.

Report: A/SP-005-1 Light Truck Frame Joint Study 82
APPENDIX A: ABSTRACTS
43. Behavior of Tubular T-Joints Subjected to Combined LoadingsYeoh S.K..; Soh, A.K.; and Soh, C.K.Journal of Constructional Steel Research; 1995
A large-scale test rig was specially designed and built to study the behavior of tubular joints subject tocombined loadings. A round-to-round tubular T-joint was subjected to axial load, in-plane bending,out-of-plane bending and combinations of the three load cases. The study reveals that the peak hotspot position on the T-joint under combined loads shifts in location from that of the basic load cases.The study also shows that the peak hot spot stress under combined loads was underpredicted bysuperposition of basis load cases in some instances. Comparison with existing combined hot spotprocedures reveals that some existing procedures are inadequate for predicting the peak hot spotstress of tubular T-joints.
Articles Read, Not Pursued
1. 3D Simulations of Bolted Connections to Unstiffened Columns-II. Extended EndplateConnectionsBahaari, M.R. and Sherbourne, A.N.Journal of Constructional Steel Research; Dec. 1996
Traditionally, column web stiffeners are used to increase the load carrying capacity and rigidity ofextended endplate, bolted, moment connections in structural steelwork. However, elimination of thesestiffeners in such connections is favored because of significant fabrication economy and simplificationof connection details. Besides, the optimum analysis and design of the frame may demand jointmoments other than the full plastic capacity of connecting members making column stiffeningunnecessary. In this context, the principal bending planes of the column flange and endplate areorthogonal and, thus, only a three-dimensional (3D) model can address connection behavior. For thisreason, there are only a limited number of experimental analytical reports concerning thisphenomenon. A description and application of such a model, using inelastic finite elements, hasalready been provided in Part I, a companion paper (Journal of Constructional Steel Research, 1996,Vol. 40, 169-187), in which deformation and prying action are studied for T-stub connections. Thispaper presents the structural properties, both stiffness and strength, of an extended endplateconnected to an unstiffened column flange using high strength prestressed bolts.
2. An Approximate Method for Estimation of Bending Moments in Continuous and SemirigidFrameChikho, A.H. and Kirby, P.A.Canadian Journal of Civil Engineering, December 1995
A simple hand method of estimating member bending moments in flexibly connected multistoreyframes is presented in this paper. The method allows for semirigid joint action and can be used inconjunction with any of the current rigid methods of frame design. The load factor at elastic instabilityof flexibly connected frames can be obtained by the proposed method. Also, a procedure forcalculating a linearized approximation of the joint stiffnesses in a multistory frame subjected to verticaland horizontal loads accounting for the nonlinearity of the joint's moment-rotation characteristic isincluded. Comparison of the prediction of the proposed method with an accurate analysis shows thatthe proposed method leads to an accuracy that is satisfactory for design purposes.

Report: A/SP-005-1 Light Truck Frame Joint Study 83
APPENDIX A: ABSTRACTS
3. Rigid Latticed Steel Frames: Tow Large-Scale Tests and Failure PredictionsEllis, J.SCanadian Journal of Civil Engineering, Oct 1987
This work is concerned with the predictions of failure under static load for two identical free-standinglatticed cantilever frames. Each structure was 3m high and consisted of three stories with panelpoints 1m apart; in plan it was lm2; its diagonals were at 45 degrees in the form of St. Andrew's cross;all joints were welded and were considered rigid. The four bases were bolted to the laboratory floorand the static load was applied at the top as two compressive horizontal forces parallel to the sides ofthe structure. The individual members were all solid mild steel round rods; the verticals were ofuniform cross section of 25.4mm in diameter with a slenderness of 157; the horizontal cross-armswere of uniform cross section of 19mm in diameter; and the diagonals were of uniform cross sectionof 15.9mm in diameter. The diagonals were cut at their mid-lengths and welded to give a flush joint.The total horizontal loads that caused failure of the two structures were 79.6 and 79.2kN. In bothcases failure occurred by the sudden buckling of one of the bottom-story vertical legs, inwardstowards the center of the structure. Also upon failure, the diagonals in the bottom story of thecompression face buckled inwards and the compression diagonal of the side contiguous to thebuckled leg also buckled.
4. Behaviour of Tubular Steel Trusses With Cropped WebsGhosh, A. and Morris, G.Canadian Journal of Civil Engineering; Mar. 1981
The consecutive testing of failure of four test joints in each of two identical 7.3m span x 1.8m deeptubular steel trusses with cropped webs is described. The behavior of each of the test joints isdiscussed and compared to that of similar joints previously tested as isolated specimens. Followinglarge chord-face deformations and bending of the webs in the truss plane, failure occurs by out-of-plane buckling of the compression web at those test joints with slender webs, or by yielding andtearing of the tension web at those with stocky webs. Stiffness are in close agreement forcorresponding truss and isolated joints. Strengths of the truss joints are from 0)23% lower than thoseof the isolated joint specimens. Joint deformation contributes less than 5% to truss deflection.
5. Nonlinear Analysis of Lattice StructuresKitipornchai, S and, Al-Bermani, F.G.A.Journal of Constructional Steel Research; 1992
The paper describes a nonlinear analytical technique developed by the authors in recent years forpredicting the structural response of large-scale lattice structures. This type of structure is generallymore sensitive to imperfections; hence, the analysis method needs to consider the various nonlineareffects. Sources of nonlinearity affecting the ultimate behavior of lattice structures include geometricnonlinearity, material nonlinearity, joint flexibility and slippage. Geometric nonlinearity can beaccounted for by incorporating the effect of initial stress as well as geometrical variations in thestructure during the loading process. For large-scale lattice structures, the material nonlinearity canbe incorporated by using the lumped plasticity model, while the effect of joint flexibility can beincorporated by modifying the tangent stiffness of the element using an appropriate moment-rotationrelation for the joint. The nonlinear formulation has been applied to a number of example problemsselected to demonstrate the applicability and versatility of the method.

Report: A/SP-005-1 Light Truck Frame Joint Study 84
APPENDIX A: ABSTRACTS
6. Connection Element Method for the Analysis of Semi-Rigid FramesLi, T.Q.; Choo, B.S.; and Nethercot, D.A.Journal of Constructional Steel Research; 1995
A general procedure for incorporating the effects of joint flexibility into standard methods for theanalysis of frames is presented. The method can allow for joint flexibility associated with all sixdegrees of freedom normally considered when analyzing three-dimensional frames, includingcoupling between deformations. It can also allow for the finite size and exact location of connections.Simple examples using the moment distribution technique, slope deflection equations and matrixstiffness method illustrate the application of the proposal. Additional examples to illustrate the effectsof connection length on the frame moment distribution, lateral drift and column load capacities arealso present.
7. Determination of Rotation Capacity Requirements for Steel and Composite BeamsLi, T.Q.; Choo, B.S.; and Nethercot, D.A.Journal of Constructional Steel Research; 1995
A method is presented for the calculation of the necessary joint rotations to permit the use of momentredistribution as the basis for the design of semi-continuous steel and composite frames. The methodis based on the use of moment-curvature relationships obtained from consideration of the basis steeland concrete stress-strain curves. It simplifies the determination of the support rotations required forspecific percentage redistributions of support moments to the mid-span cross-section as used in EC4by considering these to be composed of an elastic and a plastic part. Several different load cases areconsidered, together with a wide range of beam properties. The resulting calculation method, whichuses only formulae and graphs, is illustrated by an example.
8. A Practical Method for Incorporation Flexible Connections in Plane Frame AnalysisLo, D.S.K and Stiemer, S.F.Canadian Journal of Civil Engineering
A practical method for incorporating realistic flexible connections in plane frame analysis, includingthe effect of connection sizes and shear deflection, is presented. The general algorithm can be easilyimplemented in a standard plane frame analysis program and, one implemented, it can be an idealtool for production work in the steel industry. Connection stiffness is programmed directly into theanalysis using the moment-rotation equations developed by Frye and Morris or may be enteredseparately as data. Practical application of this method of analysis is demonstrated by modifying astandard plane frame analysis program to include the effect of flexible connections. Solutionsobtained using this modified program, Plane, were verified against the findings of Moncarz andGerstel. A simple plane frame structure was analyzed under various lateral load intensities fordifferent connection assumptions. It was found that the inclusion of connection behavior significantlyaltered the internal force distribution and design of the structure.
9. Behavior of Axially Loaded Tubular V-JointsScola, S.; Redwood, R.G.; and Mitri, H.S.Journal of Constructional Steel Research; 1990
The results of an experimental test program comprising seven tubular V-joints and five tubular T-joints consisting of circular hollow sections and subject to branch axial loading are reported. Thetested specimens has branch-to-chord diameter ratios varying from 0.22 to 0.65, and chord radius-to-thickness ratios of 13 to 23. The angle between branches of the V-joints was 60, 90 or 120 degrees.The behavior of the joints is examined through a comparison of ultimate strengths, stiffness
Report: A/SP-005-1 Light Truck Frame Joint Study 85
APPENDIX A: ABSTRACTS
characteristics and hotspot stresses of comparable T and V specimens. Addition of a loaded out-of-plane branch member of a T-joint increases the strength of the T-joint when the angle between thebranches is low, and decreases it when the angle is large.
10. 3D Simulations of Bolted Connections to Unstiffened Columns-I T-Stub ConnectionsSherbourne, A.N. and Bahaari, M.R.Journal of Constructional Steel Research, Dec. 1996
The paper presents a finite element methodology in a three-dimensional (3D) framework to studynumerically the stiffness and strength of the T-stub to unstiffened column flange bolted connection aspart of a comprehensive research program to investigate the behavior of endplate bolted connections.In such connections, the axes of rotation of the T-stem and column flange are at right angles; theplanes containing the tensile forces are also perpendicular to each other. Therefore, they are highlyinteractive spatially. The main objective here is to study the applicability of the model to such aconnection, so that most of the important features that are not accessible to routine experiments, likeprying action and gradual plasticity of components, can be monitored. ANSYS, version 4.4, a large-scale general purpose finite element code is selected for this analysis. Initially, the simplestconnection with the bolt groups in tension, which is a symmetric T-stub hanger with a single line ofbolts paralleled on each side of the web, is considered. Then the T-stub connection to an unstiffenedcolumn flange is discussed.
11. Criteria for the Fatigue Assessment of Hollow Structural Section ConnectionsVan Wingerde, A.M.; Packer, J.A.; and Wardenier, J.Journal of Constructional Steel Research, 1995
Discussion of fatigue design criteria is presented for connections between hollow structural sections,based on knowledge gained from an extensive study on the fatigue behavior of 90-T- and X-connections made of square hollow sections. After a general discussion of the various fatigueassessment method available the paper focuses on considerations behind the definition of the hotspot stress. On this basis, the current fatigue design guidelines are discussed. Based on knowledgedgained from experiments and having identified the important fatigue design criteria, a hot spotdefinition is established, together with the outline of a proposal for future fatigue design guidelines ofhollow section connections.
12. Study on Residual Stress Relief of Welded Structural Steel JointsWeng, C.C. and Chen, J.J.Journal of Materials in Civil Engineering; May 1993
This paper presents the results obtained from the residual stress relief tests on 21 welded structuralsteel joints: 17 butt-welded, two tee, and two corner joint specimens. The A572 grade 50 structuralsteel plates of two different thicknesses, 15 and 32mm, were used. All specimens were welded by thesubmerged arc welding (SAW) process and were designed according to the prequalified welded jointsspecified by the American Welding Society. In this study, a controlled low-temperature stress-reliefmethod was used for residual stress relief. The experimental result show that by using an appropriatecombination of the heating temperature, heating distance, and cooling method, the original high-tensile residual stresses near the weld of the joint can be reduced effectively. The residual stressesbefore and after the heat treatment were measured by using the blind hold-drilling method. Areduction of more than 50% of the original tensile residual stresses adjacent to the weld wasobserved.

Report: A/SP-005-1 Light Truck Frame Joint Study 86
APPENDIX B: MATERIAL TESTING REPORT
Samples of each material (coupons) were removed from each frame member and sent to a local material testing laboratory. The samples were tested to failure in a standard ASTM material testing rig. Plots of stress v strain for each sample are plotted for the full range of the material. An additional plot of the linear range of the material is also included for each sample. A list of coupons and their origin is below.
Coupon #1 Joint 5 Inner Side rail
Coupon #2 Joint 5 Outer Side rail
Coupon #3 Joint 5 Crossmember
Coupon #4 Joint 4 Side rail
Coupon #5 Joint 4 Crossmember
Coupon #6 Joint 3 Side rail
Coupon #7 Joint 3 Crossmember
Coupon #8 Joint 2 Side rail
Coupon #9 Joint 1 Side rail
Coupon #10 Joint 1 Crossmember
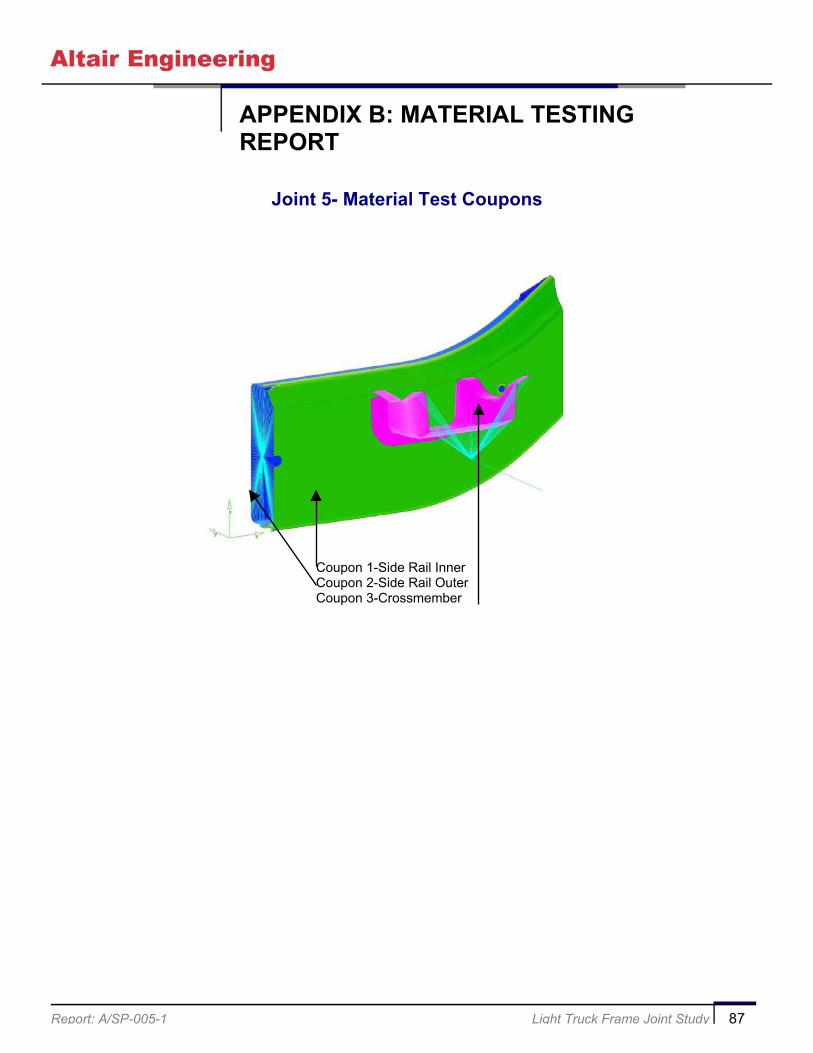
Report: A/SP-005-1 Light Truck Frame Joint Study 87
APPENDIX B: MATERIAL TESTING REPORT
Joint 5- Material Test Coupons
Coupon 1-Side Rail Inner Coupon 2-Side Rail Outer Coupon 3-Crossmember

Report: A/SP-005-1 Light Truck Frame Joint Study 88
APPENDIX B: MATERIAL TESTING REPORT
Plot 1-Full Strain Range
Coupon #1-Joint 5 Inner Side Rail
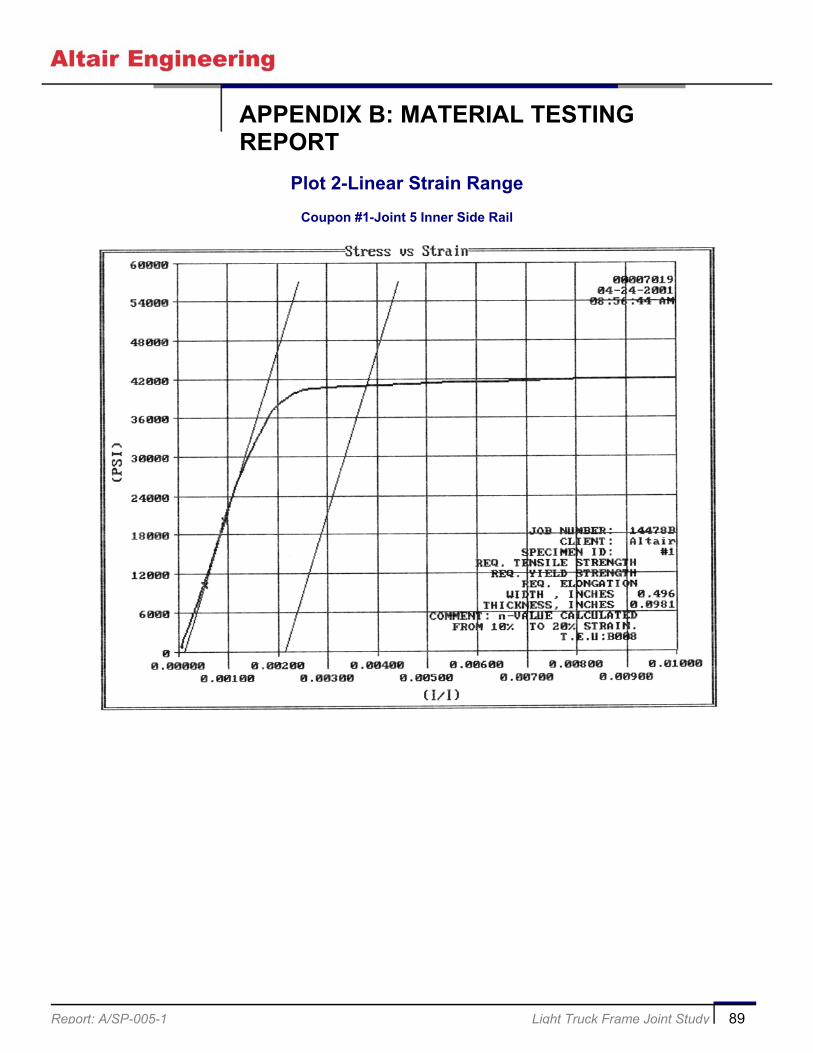
Report: A/SP-005-1 Light Truck Frame Joint Study 89
APPENDIX B: MATERIAL TESTING REPORT
Plot 2-Linear Strain Range Coupon #1-Joint 5 Inner Side Rail

Report: A/SP-005-1 Light Truck Frame Joint Study 90
APPENDIX B: MATERIAL TESTING REPORT
Plot 3-Full Strain Range
Coupon #2-Joint 5 Outer Side Rail

Report: A/SP-005-1 Light Truck Frame Joint Study 91
APPENDIX B: MATERIAL TESTING REPORT
Plot 4-Linear Strain Range Coupon #2-Joint 5 Outer Side Rail

Report: A/SP-005-1 Light Truck Frame Joint Study 92
APPENDIX B: MATERIAL TESTING REPORT
Plot 5-Full Strain Range
Coupon 3-Joint 5 Crossmember

Report: A/SP-005-1 Light Truck Frame Joint Study 93
APPENDIX B: MATERIAL TESTING REPORT
Plot 6-Linear Strain Range
Coupon 3-Joint 5 Crossmember
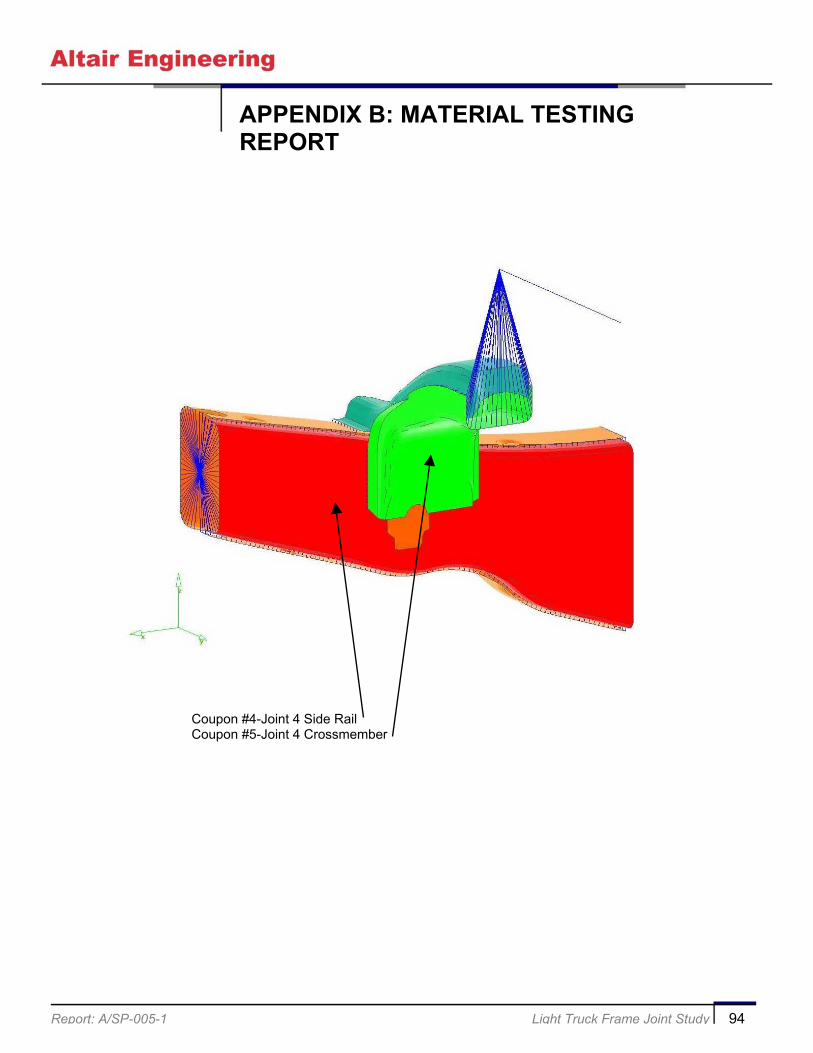
Report: A/SP-005-1 Light Truck Frame Joint Study 94
APPENDIX B: MATERIAL TESTING REPORT
Coupon #4-Joint 4 Side Rail Coupon #5-Joint 4 Crossmember

Report: A/SP-005-1 Light Truck Frame Joint Study 95
APPENDIX B: MATERIAL TESTING REPORT
Plot 7-Full Strain Range
Coupon #4-Joint 4 Side Rail
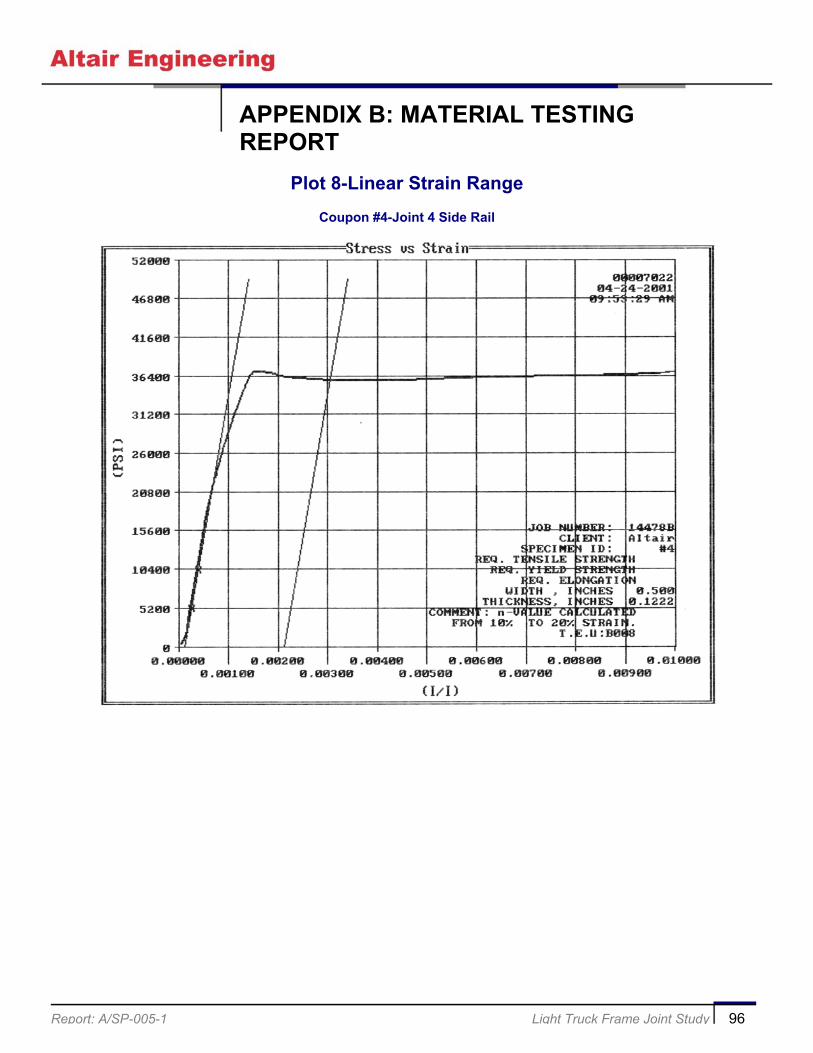
Report: A/SP-005-1 Light Truck Frame Joint Study 96
APPENDIX B: MATERIAL TESTING REPORT
Plot 8-Linear Strain Range Coupon #4-Joint 4 Side Rail
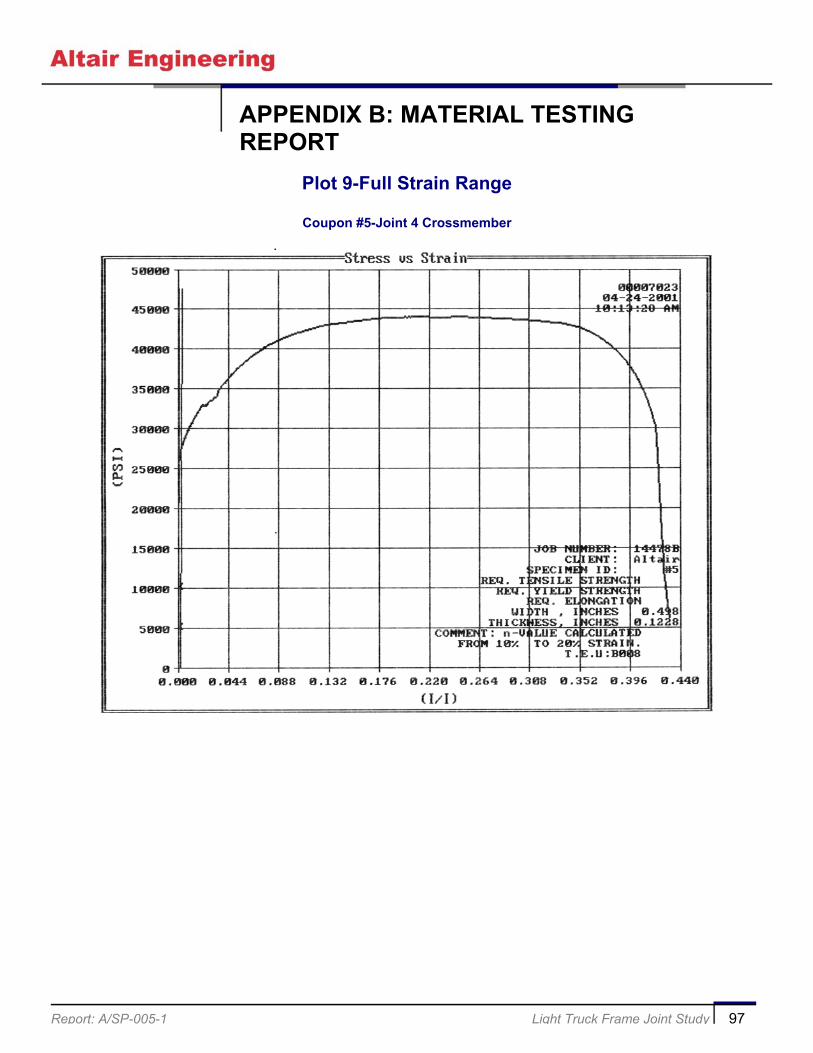
Report: A/SP-005-1 Light Truck Frame Joint Study 97
APPENDIX B: MATERIAL TESTING REPORT
Plot 9-Full Strain Range
Coupon #5-Joint 4 Crossmember

Report: A/SP-005-1 Light Truck Frame Joint Study 98
APPENDIX B: MATERIAL TESTING REPORT
Plot 10-Linear Strain Range
Coupon #5-Joint 4 Crossmember
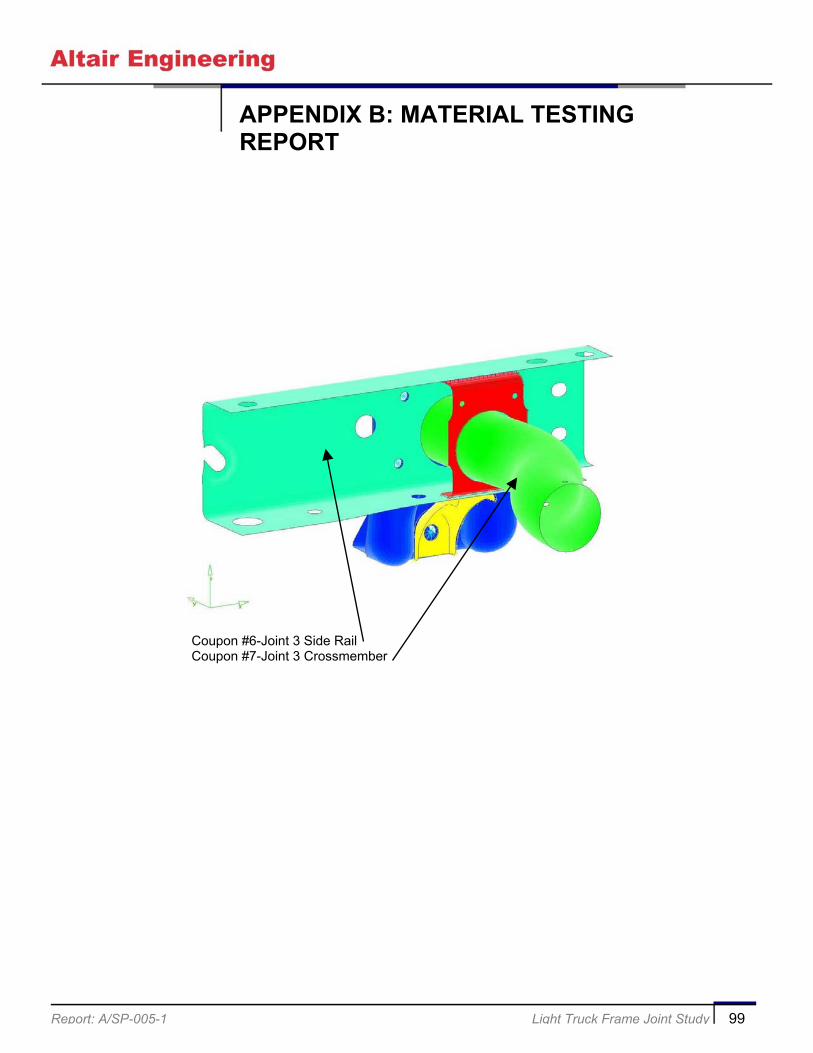
Report: A/SP-005-1 Light Truck Frame Joint Study 99
APPENDIX B: MATERIAL TESTING REPORT
Coupon #6-Joint 3 Side Rail Coupon #7-Joint 3 Crossmember

Report: A/SP-005-1 Light Truck Frame Joint Study 100
APPENDIX B: MATERIAL TESTING REPORT
Plot 11-Full Strain Range
Coupon #6-Joint 3 Side Rail

Report: A/SP-005-1 Light Truck Frame Joint Study 101
APPENDIX B: MATERIAL TESTING REPORT
Plot 12-Linear Strain Range
Coupon #6-Joint 3 Side Rail

Report: A/SP-005-1 Light Truck Frame Joint Study 102
APPENDIX B: MATERIAL TESTING REPORT
Plot 13-Full Strain Range
Coupon #7-Joint 3 Crossmember

Report: A/SP-005-1 Light Truck Frame Joint Study 103
APPENDIX B: MATERIAL TESTING REPORT
Plot 14-Linear Strain Range
Coupon #7-Joint 3 Crossmember

Report: A/SP-005-1 Light Truck Frame Joint Study 104
APPENDIX B: MATERIAL TESTING REPORT
Plot 15-Full Strain Range
Coupon #8-Joint 2 Side Rail

Report: A/SP-005-1 Light Truck Frame Joint Study 105
APPENDIX B: MATERIAL TESTING REPORT
Plot 16-Linear Strain Range
Coupon #8-Joint 2 Side Rail

Report: A/SP-005-1 Light Truck Frame Joint Study 106
APPENDIX B: MATERIAL TESTING REPORT
Plot 17-Full Strain Range
Coupon #2-Joint 5 Outer Side Rail

Report: A/SP-005-1 Light Truck Frame Joint Study 107
APPENDIX B: MATERIAL TESTING REPORT
Plot 18-Linear Strain Range
Coupon #2-Joint 5 Outer Side Rail
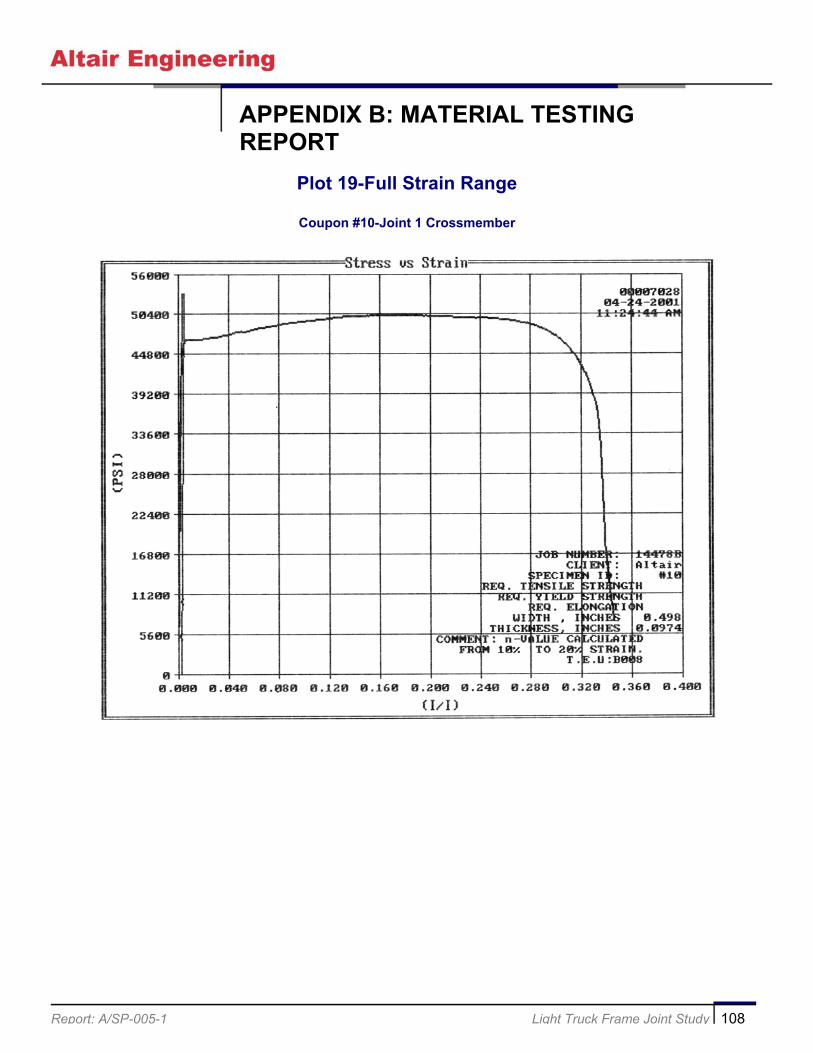
Report: A/SP-005-1 Light Truck Frame Joint Study 108
APPENDIX B: MATERIAL TESTING REPORT
Plot 19-Full Strain Range
Coupon #10-Joint 1 Crossmember
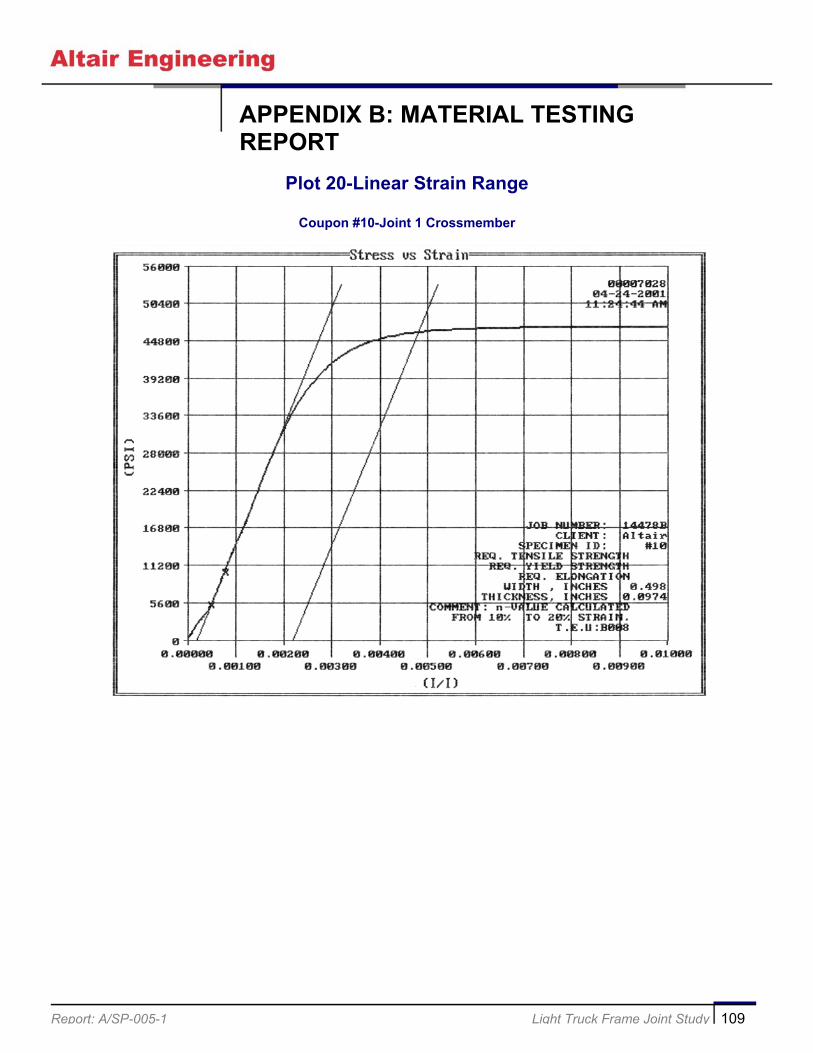
Report: A/SP-005-1 Light Truck Frame Joint Study 109
APPENDIX B: MATERIAL TESTING REPORT
Plot 20-Linear Strain Range
Coupon #10-Joint 1 Crossmember

Report: A/SP-005-1 Light Truck Frame Joint Study 110
APPENDIX C: TEST RESULTS
Joint 1 Fore/Aft Load Test vs. Analysis
Joint 1 Vertical Load Test vs. Analysis

Report: A/SP-005-1 Light Truck Frame Joint Study 111
APPENDIX C: TEST RESULTS
Joint 1 Torsion Load Test vs. Analysis
Joint 2 Fore/Aft Load Test vs. Analysis

Report: A/SP-005-1 Light Truck Frame Joint Study 112
APPENDIX C: TEST RESULTS
Joint 2 Vertical Load Test vs. Analysis
Joint 2 Torsion Load Test vs. Analysis
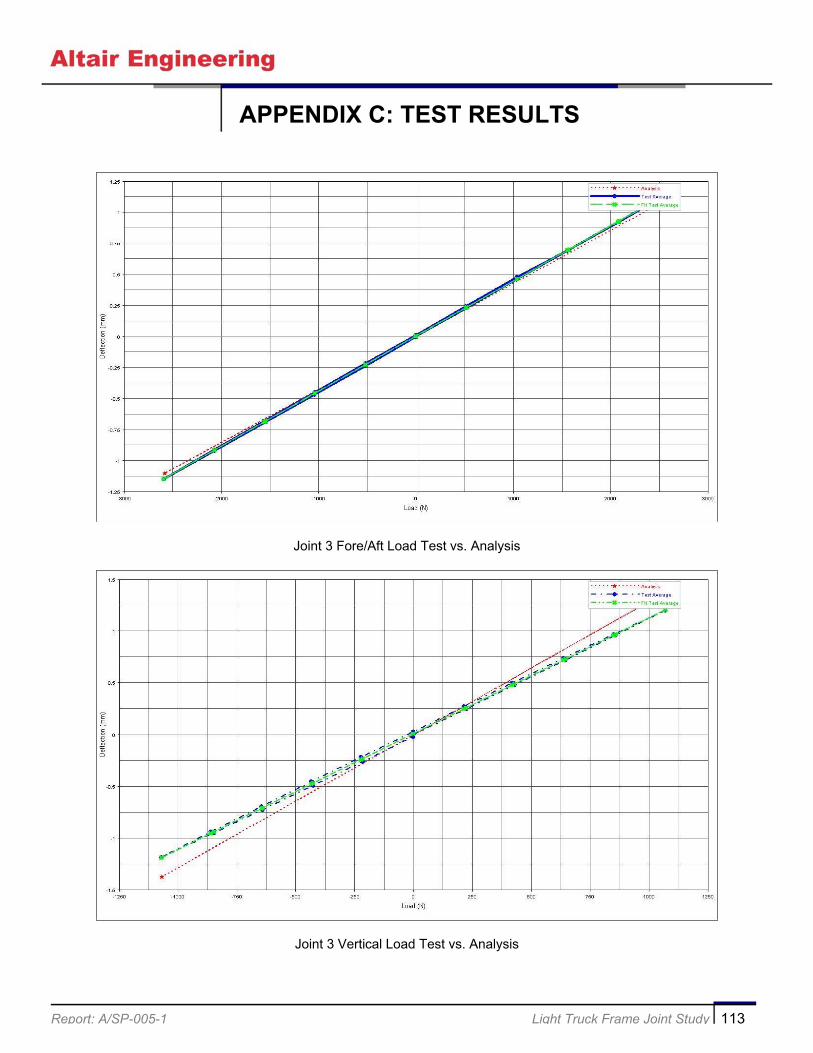
Report: A/SP-005-1 Light Truck Frame Joint Study 113
APPENDIX C: TEST RESULTS
Joint 3 Fore/Aft Load Test vs. Analysis
Joint 3 Vertical Load Test vs. Analysis
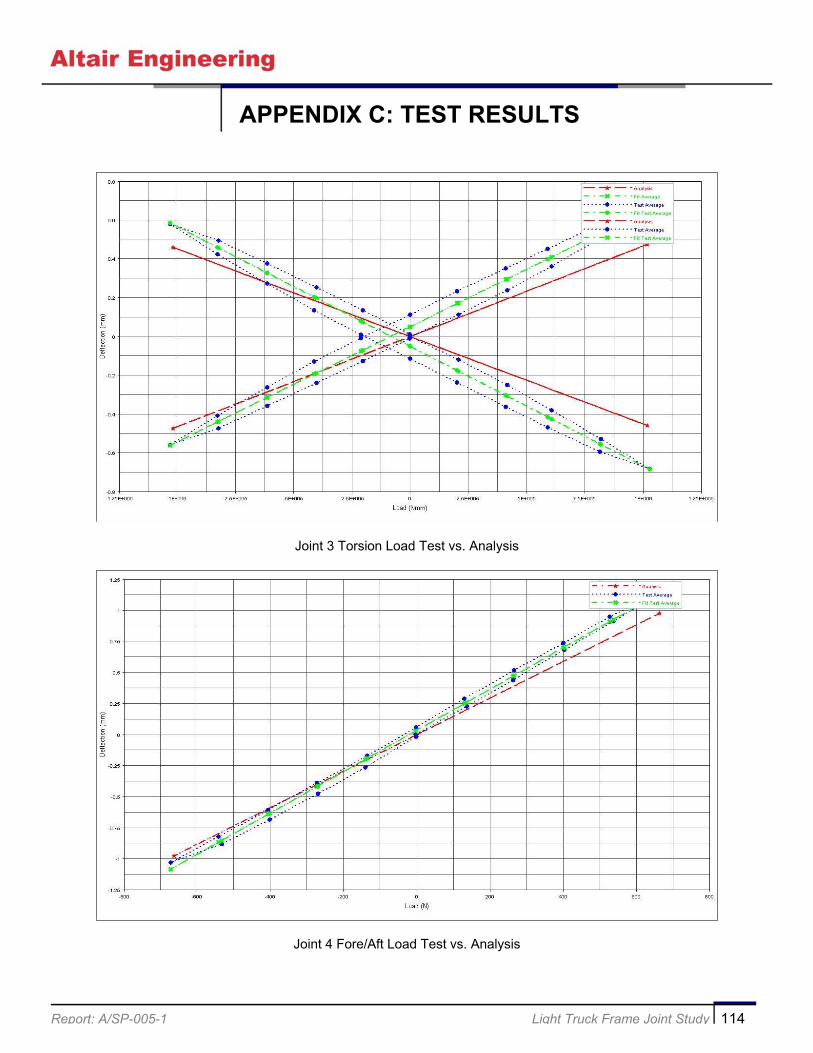
Report: A/SP-005-1 Light Truck Frame Joint Study 114
APPENDIX C: TEST RESULTS
Joint 3 Torsion Load Test vs. Analysis
Joint 4 Fore/Aft Load Test vs. Analysis
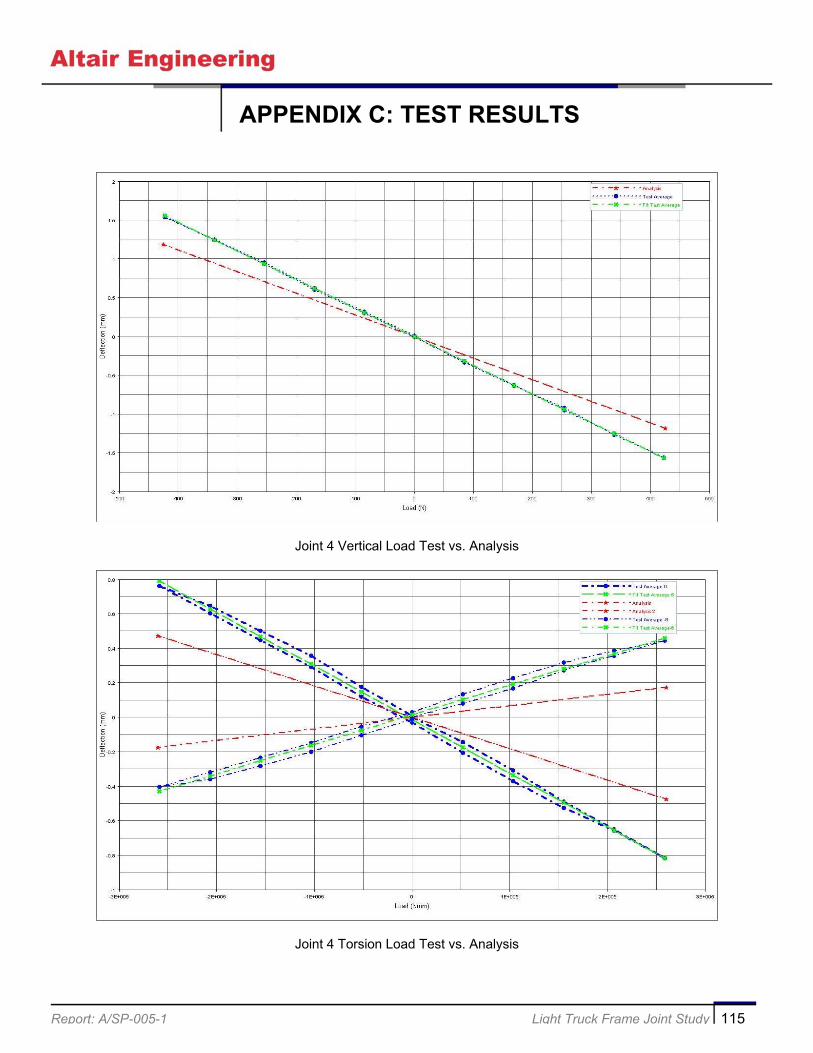
Report: A/SP-005-1 Light Truck Frame Joint Study 115
APPENDIX C: TEST RESULTS
Joint 4 Vertical Load Test vs. Analysis
Joint 4 Torsion Load Test vs. Analysis
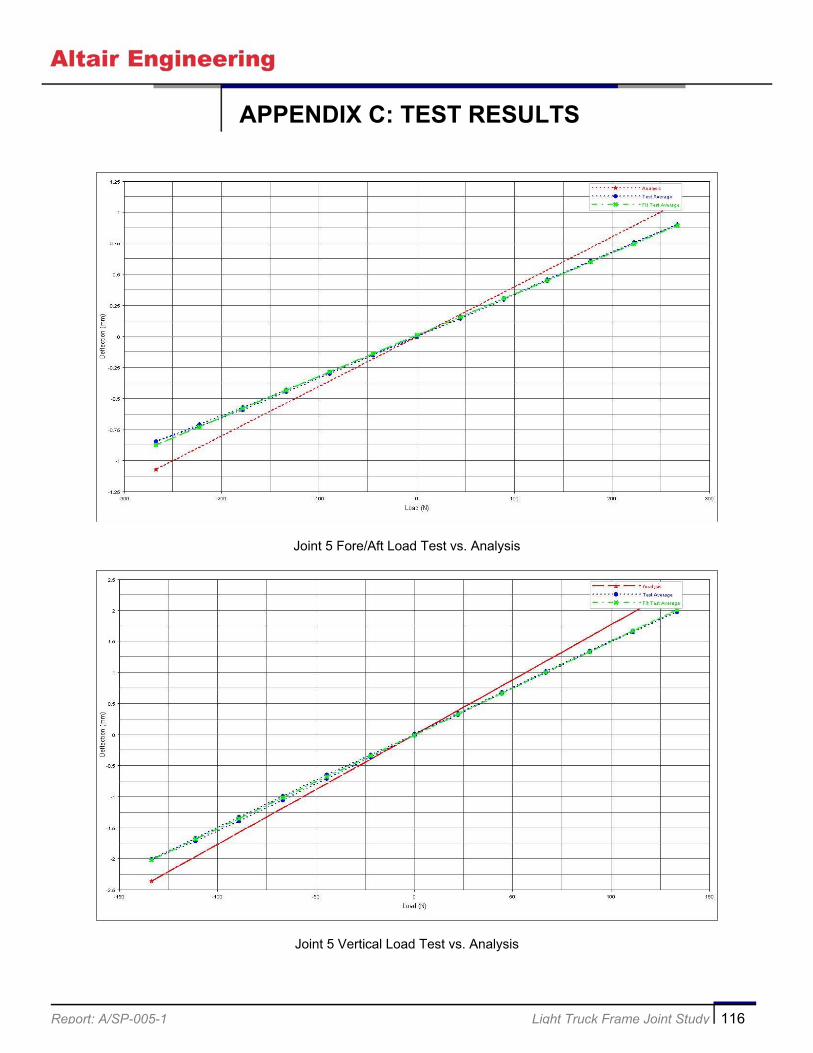
Report: A/SP-005-1 Light Truck Frame Joint Study 116
APPENDIX C: TEST RESULTS
Joint 5 Fore/Aft Load Test vs. Analysis
Joint 5 Vertical Load Test vs. Analysis
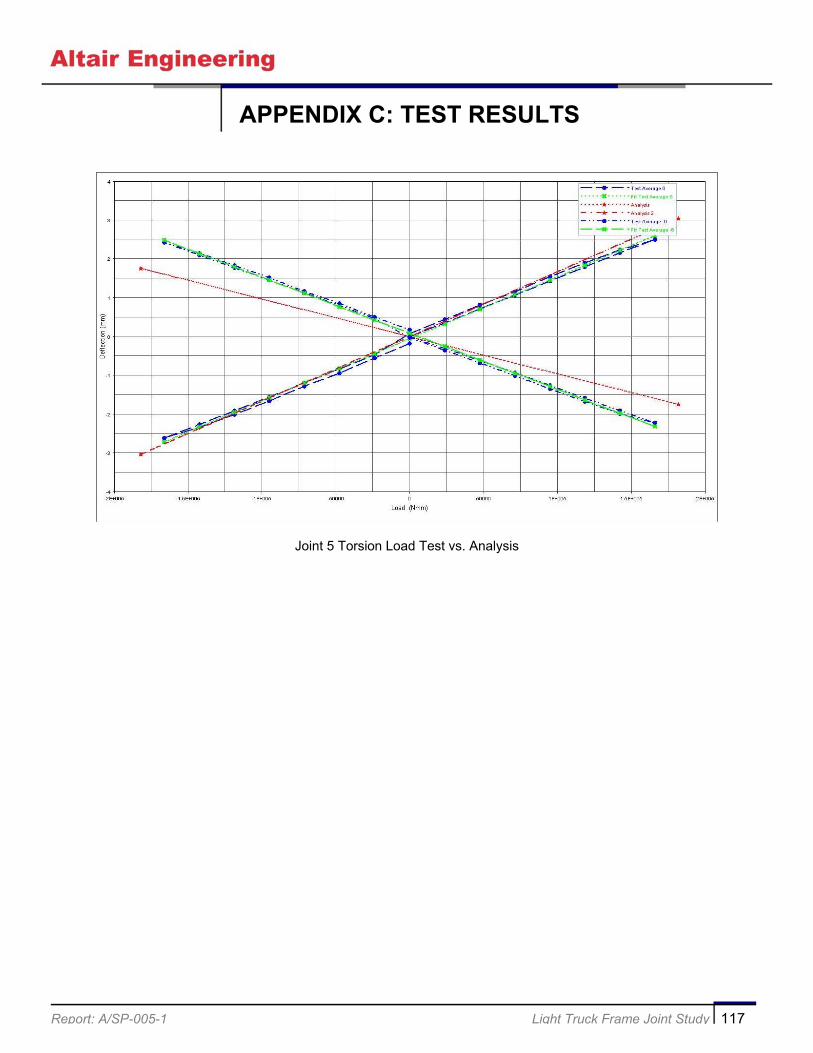
Report: A/SP-005-1 Light Truck Frame Joint Study 117
APPENDIX C: TEST RESULTS
Joint 5 Torsion Load Test vs. Analysis

Report: A/SP-005-1 Light Truck Frame Joint Study 118
APPENDIX D: DIAGRAM OF JOINT IN TEST FIXTURE
FV :Vertical Load Application Points FF/A :Fore/Aft Load Application Points
FT
FT
Fixture Mounted to Bed Plate
End Plate Welded to Side Rail
End Plate Bolted to Fixture
FV
FV 2 LVDT’s measuring Torsional Loadcase
3 LVDT’s measuring Fore/Aft and Vertical Loadcases
FF/A FF/A
304.80mm
381.00mm
50.80mm
4 bolts (1/2” Grade 8) Connecting End Plates and Fixture
25.40mm thick Steel Plates
FT :Torsional Load Application Points

Report: A/SP-005-1 Light Truck Frame Joint Study 119
APPENDIX D: DIAGRAM OF JOINT IN TEST FIXTURE
Loading Fixture with Fore/Aft and Vertical Loadcase LVDT Placement
Loading Fixture
19.05mm thick steel plates joined with 4 (1/2” Grade 8) bolts
6.25mm thick 63.5mm diameter steel pipe
Joint Crossmember
200mm
12.70mm thick steel plate
Typically 340mm
To Bedplate
Typically 270mm
Typically 200mm
LVDT 3
LVDT 2
LVDT 1
101.60mm minimum

Report: A/SP-005-1 Light Truck Frame Joint Study 120
APPENDIX D: DIAGRAM OF JOINT IN TEST FIXTURE
Loading Fixture with Torsional Loadcase LVDT Placement
152.4mm 152.4 mm C L
LVDT 1 LVDT 2 LVDT 3
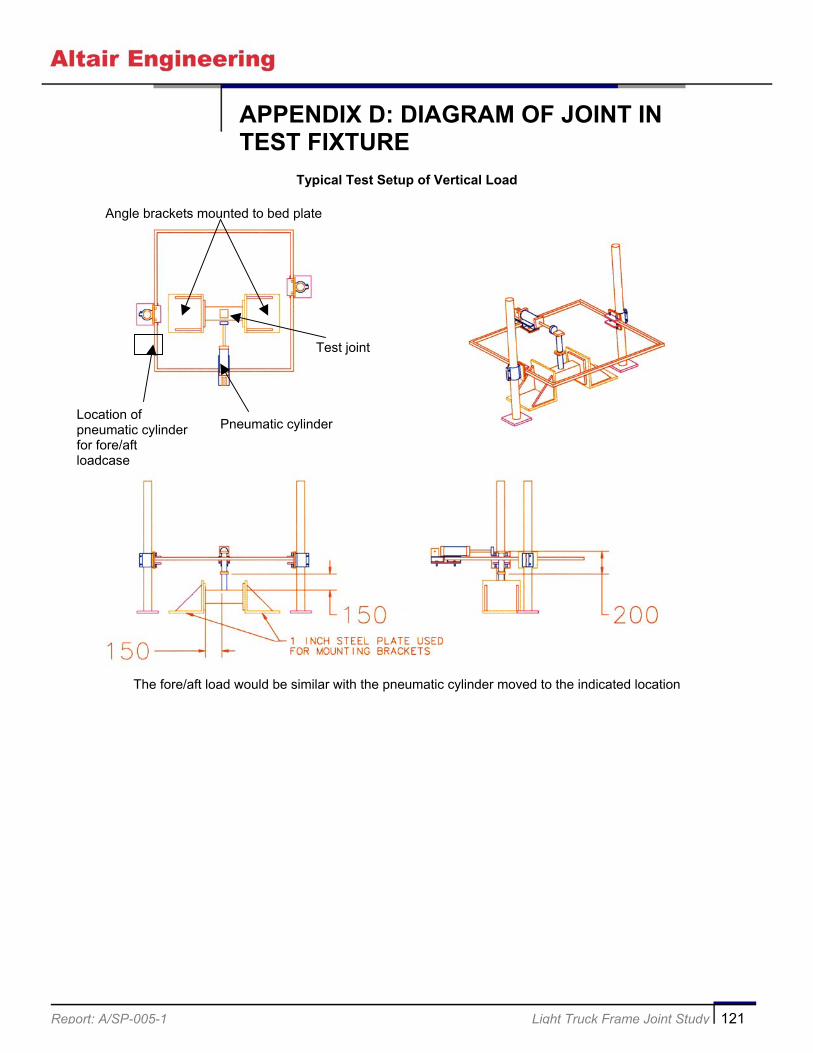
Report: A/SP-005-1 Light Truck Frame Joint Study 121
APPENDIX D: DIAGRAM OF JOINT IN TEST FIXTURE
Typical Test Setup of Vertical Load
The fore/aft load would be similar with the pneumatic cylinder moved to the indicated location
Pneumatic cylinder
Test joint
Angle brackets mounted to bed plate
Location of pneumatic cylinder for fore/aft loadcase

Report: A/SP-005-1 Light Truck Frame Joint Study 122
APPENDIX D: DIAGRAM OF JOINT IN TEST FIXTURE
Typical Test Setup of Torsional Load
Pneumatic cylinders applying torsional load on joint
914.4mm
914.4mm