Embed Size (px)
Citation preview

ORNL/TM-2015/93
Light Water Reactor Sustainability Program
Thermal aging modeling and validation on the Mo containing Fe-Cr-Ni alloys
March 2015
U.S. Department of Energy
Office of Nuclear Energy
DISCLAIMER This information was prepared as an account of work sponsored by an
agency of the U.S. Government. Neither the U.S. Government nor any agency thereof, nor any of their employees, makes any warranty, expressed or implied, or assumes any legal liability or responsibility for the accuracy, completeness, or usefulness, of any information, apparatus, product, or process disclosed, or represents that its use would not infringe privately owned rights. References herein to any specific commercial product, process, or service by trade name, trade mark, manufacturer, or otherwise, does not necessarily constitute or imply its endorsement, recommendation, or favoring by the U.S. Government or any agency thereof. The views and opinions of authors expressed herein do not necessarily state or reflect those of the U.S. Government or any agency thereof.
ORNL/TM-2015/93
Thermal aging modeling and validation on Mo-containing Fe-Cr-Ni alloys
Ying Yang, Lizhen Tan, Jeremy T. Busby
March 2015
Prepared for the U.S. Department of Energy Office of Nuclear Energy
Approved for public release; distribution is unlimited

iii
ABSTRACT
Thermodynamics of intermetallic phases in Fe-rich Fe-Cr-Ni-Mo alloys is critical knowledge to understanding thermal aging effects on the phase stability of Mo-containing austenitic steels, which subsequently facilitates alloy design/improvement and degradation mitigation of these materials for reactor applications. Among the intermetallic phases, Chi (χ), Laves, and Sigma (σ) are often of concern because of their tendency to cause embrittlement of the materials. The focus of this study is thermal stability of the Chi and Laves phases as they were less studied compared to the Sigma phase. Coupled with thermodynamic modeling, thermal stability of intermetallic phases in Mo containing Fe-Cr-Ni alloys was investigated at 1000, 850 and 700°C for different annealing times. The morphologies, compositions and crystal structures of the precipitates of the intermetallic phases were carefully examined by scanning electron microscopy, electron probe microanalysis, X-ray diffraction, and transmission electron microscopy. Three key findings resulted from this study. First, the Chi phase is stable at high temperature, and with decreasing temperature it transforms into the Laves phase that is stable at low temperature. Secondly, Cr, Mo, Ni are soluble in both the Chi and Laves phases, with the solubility of Mo playing a major role in the relative stability of the intermetallic phases. Thirdly, in situ transformation from Chi phase to Laves phase was directly observed, which increased the local strain field, generated dislocations in the intermetallic phases, and altered the precipitate phase orientation relationship with the austenitic matrix. The thermodynamic models that were developed and validated were then applied to evaluating the effect of Mo on the thermal stability of intermetallic phases in type 316 and NF709 stainless steels.

iv

v
ACKNOWLEDGEMENTS
Thermodynamic modeling and most analysis on experimental data were supported by the U.S. Department of Energy (DOE), Office of Nuclear Energy, Light Water Reactor Sustainability (LWRS) Research and Development Effort. Part of experimental work was supported by the U.S. Department of Energy (DOE), Office of Nuclear Energy, Nuclear Engineering Enabling Technology (NEET) program as part of the Reactor Materials Cross-Cut activity. Both programs are under contract DE-AC05-00OR22725 with UT-Battelle, LLC.

vi
vii
CONTENTS
ABSTRACT ................................................................................................................................................. iii
ACKNOWLEDGEMENTS .......................................................................................................................... v
ACRONYMS ............................................................................................................................................... xi
1. Introduction and motivation ............................................................................................................... 1
2. Thermodynamic modeling .................................................................................................................. 1
3. Experimental method .......................................................................................................................... 3
4. Results and discussion ........................................................................................................................ 4 4.1 SEM/BSE images and EPMA measurements .......................................................................... 4 4.2 XRD results .............................................................................................................................. 7 4.3 TEM/EDS results ..................................................................................................................... 9 4.4 Thermodynamic modeling results .......................................................................................... 12
5. Conclusions ...................................................................................................................................... 16
6. References ........................................................................................................................................ 17
viii
FIGURES Figure 1 BSE images for alloy A1 annealed at (a) 1000°C for 50 h (H1), (b) 850°C for 168 h
(H2), and (c) 700°C for 795 h (H4). The dark matrix phase in (a), (b), and (c) is Fcc. The large bright phase in (a) and (b) is Chi. The small precipitate phase in (b) and (c) is Laves. ............................................................................................................................................ 6
Figure 2 XRD results of alloy A1 annealed at 1000°C (A1H1), 850°C (A1H2), and 700°C (A1H3 and A1H4). ................................................................................................................................... 8
Figure 3 XRD results of alloy A2 annealed at 1000°C (A2H1), 850°C (A2H2), and 700°C (A2H3 and A2H4). ................................................................................................................................... 8
Figure 4 TEM results of alloy A2 aged at 850°C for 168 h: (a) overview of the large and fine particles and (b-c) fine particles of Chi and Laves phases............................................................ 9
Figure 5 (a) BF image of a Laves-χ particle in the 850°C-annealed sample, together with its high-resolution BF images of (b) Laves phase, (c) χ-phase, (d) SADP, and (e) analytical diffraction pattern. ...................................................................................................................... 11
Figure 6 TEM results showing the (a) overview, (b) high-magnification lattice fringes, and (c-d) corresponding diffraction pattern of Laves phase in alloy A2 aged at 700°C for 795 h. ........... 12
Figure 7 TEM results showing the (a) overview and (b-c) high-magnification lattice fringe and corresponding diffraction pattern of Laves phase in alloy A1 aged at 700°C for 795 h. ........... 12
Figure 8 Calculated mole fraction of phases vs. temperature for alloys A1 and A2................................... 13
Figure 9 Calculated isopleths illustrating the effect of Mo on phase stability in (a) Fe-17Cr-12Ni (wt.%) and (b) Fe-20Cr-25Ni (wt.%) alloys. .............................................................................. 15
ix
TABLES Table 1 Sample index of the annealing conditions of alloys A1 and A2. ..................................................... 3
Table 2 EPMA-measured phase compositions (at.%) in alloy A1 compared with calculated results. .......................................................................................................................... 5
Table 3 EPMA-measured phase compositions (at.%) in alloy A2 compared with calculated results. .......................................................................................................................... 5

x
xi
ACRONYMS
Department of Energy (DOE)
Light Water Reactor Sustainability (LWRS)
Nuclear Engineering Enabling Technology (NEET)
face-centered cubic (fcc)
body-centered cubic (bcc)
Calculation of Phase Diagram (Calphad)
Scientific Group Thermodata Europe (SGTE)
Redlich-Kister-Muggianu (RKM)
Scanning electron microscopy (SEM)
Backscattered electron mode (BSE)
Electron-probe microanalysis (EPMA)
wavelength-dispersive spectroscopy (WDS)
Stainless Steels (SS)
Element atomic number, X-ray absorption and fluorescence (ZAF)
X-ray diffraction (XRD)
International Centre for Diffraction Data (ICDD)
Transmission electron microscopy (TEM)
Energy Dispersive Spectroscopy (EDS)
Bright field (BF)
Dark-field (DF)
Selected area diffraction pattern (SADP)

xii
1
1. Introduction and motivation
Molybdenum-containing austenitic stainless steels such as 316 and NF709 have been extensively used as economical structural materials and cladding alloys in traditional and advanced nuclear reactors and power plants, because of their good mechanical properties at high temperatures, excellent corrosion resistance, and fabricability [1]. However, these materials are subject to microstructural instability as a result of long-term thermal aging [2]. The decomposition of the austenitic matrix often results in the precipitation of various phases such as carbides and intermetallic compounds [2, 3]. The most noticeable intermetallic compounds formed in Mo-containing austenitic steels are Sigma, Laves_C14 and Chi_a12 phases [2, 3]. These intermetallic compounds generally have a detrimental effect on the mechanical properties of materials when they precipitate on grain boundaries but may have a beneficial effect on creep resistance when they precipitate intragranularly [4].
The major alloying elements in the Mo-containing austenitic steels are Cr, Ni, and Mo, the concentrations of which significantly affect the stability of these intermetallic compounds. A good understanding of the solubilities of Cr, Ni, and Mo in the Fe-rich fcc (face-centered cubic) matrix phase and the intermetallic phases is essential for making robust choices regarding alloy compositions and heat treatment parameters, and to ensure better microstructures and mechanical properties. The composition and temperature regions of stable Sigma, Laves, and Chi phases have been studied in constituent ternaries of the Fe-Cr-Mo, Fe-Mo-Ni, Fe-Cr-Ni, and Cr-Mo-Ni systems [5-10], but knowledge of the quaternary Fe-Cr-Ni-Mo space is still lacking. The Calphad method is an efficient way to map the stability of phases in multicomponent systems [11-13] as represented by multicomponent phase diagrams. The essence of the Calphad method is to develop a set of self-consistent thermodynamic models for individual phases that can simultaneously represent the experimental data on thermodynamic properties and phase equilibria. The critically developed thermodynamic models can then be used to predict phase equilibria in the regions without experimental data. The purpose of the present work is to develop thermodynamic models for intermetallic phases in the Fe-rich region of the Fe-Cr-Ni-Mo alloys and validate the models with experimental investigation. The validated thermodynamic models were then used to predict the stability of intermetallic phases in the Fe-Cr-Ni-Mo alloys, which is an essential step to understand the phase stability of commercial Mo-containing austenitic stainless steels after long term thermal aging.
2. Thermodynamic modeling
Thermodynamic models of phases in the Fe-Cr-Ni-Mo quaternary system were developed based on those in the four constituent ternaries, i.e., Fe-Cr-Ni [7, 14], Fe-Cr-Mo [5, 14], Fe-Mo-Ni [6] and Cr-Mo-Ni [14]. For the phases of interest, two types of thermodynamic models were used in this study. One was the Substitutional Solution model [11], which is used for describing disordered solution phases such as liquid, fcc (face-centered cubic), and bcc (body-centered cubic). The other wad the Sublattice model [15] for describing intermetallic compound phases with preferential occupation of elements in certain crystallographic lattices. The detailed definitions of different thermodynamic models and the descriptions of their Gibbs energy functions are well described in the literature [11, 15] and therefore are only briefly introduced here. The Gibbs energy per mole atoms of a phase, ϕ, for a Substitutional Solution model (Cr, Fe, Mo, Ni) is expressed by the following equation:
2
= ∑ ,° + ∑ ( ) + , + , (1)
The first term, ,°, denotes the Gibbs energy of pure element i with the structure of the ϕ phase and is readily available from the SGTE (Scientific Group Thermodata Europe) standard database for pure elements [16]. The second term is the Gibbs energy contributed from ideal mixing entropy with the mole fraction of element i. R is the gas constant and T is temperature in kelvin. , is the excess energy describing non-ideal chemical interaction. It is expressed by the Redlich-Kister-Muggianu (RKM) polynomial [17], in which non-ideal interaction energy from binary, ternary or higher-order systems is included. Model parameters are included in these interaction terms and their values are optimized by fitting the calculated thermodynamic property and phase equilibrium to the available experimental data. However, for a phase without experimental data, especially in a multicomponent (n≥4) system, the excess energy can be approximated by an extrapolation method in which only the lower-order interaction energies (i.e., binary and ternary) are included in the RKM term. , denotes the magnetic contribution to the Gibbs energy, described by the Inden-Hillert-Jarl magnetic model [18, 19].
For the intermetallic compound phases, the Sublattice model is chosen depending on the crystal structure, the occupation preference of the element in each crystallographic site, the defect structure, and the homogeneity range [15]. The Sigma phase originated from the Fe-Cr binary and has a tetragonal unit cell (space group P42/mnm) with a=0.88nm and c=0.454nm [3]. Several models have been proposed for the Sigma phase [20]. In this study, the three-sublattice model (Fe,Ni)8(Cr,Mo)4(Cr,Fe,Mo,Ni)18 was chosen for being consistent with those used in the constituent ternaries [5, 7, 14]. In this model, each unit cell of the Sigma phase contains 30 atoms occupying three distinct lattice sites, with the first one preferentially occupied by Fe and Ni, the second by Cr and Mo, and the third by Cr, Fe, Mo, and Ni. The Gibbs energy of this model is expressed as the following equation: = ∑ : :,° + (8 ∗ ∑ ln( ) + 4 ∗ ∑ ( ) + 18 ∗ ∑ ( ) +, ( ) + , ( ) (2)
In contrast to the Gibbs energy derived by the Substitutional Solution model, the Gibbs energy is described as a function of site fraction in a sublattice, instead of mole fraction in an alloy. The first term denotes the Gibbs energy contributed from the so-called end-member compounds [15], with each sublattice fully occupied by only one element. The Gibbs energies of these end-member compounds are not readily available in the standard database. Therefore, they need to be optimized from experimental data. The third and fourth terms are similar to those in the Substitutional model except they are contributed to by the summation of the Gibbs energy from each sublattice. The interaction parameters in these terms are also optimized in terms of experimental data.
Since the Sigma phase is stable in all four constituent ternaries, the experimental phase equilibrium data in these ternaries can reasonably constrain the modeling of these end-members and interaction terms. The Chi phase has a bcc unit cell (space group I143m) containing 58 atoms and having a reported lattice parameter varying between 0.8807 nm and 0.892 nm [3, 21] phase. The three-sublattice model of (Cr,Fe,Ni)24(Cr,Mo)10(Cr,Fe,Ni)24 was chosen for the Chi phase to reflect its crystallographic characteristics and be consistent with that used in the Fe-Cr-Mo system [5, 14, 22]. This model has numerous end-members and interactions between
3
elements. However, this phase is found only stable in the Fe-Cr-Mo system [5, 8]. No data are available for constraining the Ni-related end-members and interactions. The Laves phase is a hexagonal phase of space group P63/mmc, with a=0.473 nm and C=0.772 nm [3]. It is modeled as (Cr,Fe,Ni)2(Cr,Fe,Mo,Ni) based on the existing thermodynamic descriptions [6, 14]. The Laves phase has slightly more experimental data than the Chi phase, mainly from the Fe-Cr-Mo and Fe-Mo-Ni ternaries [6, 8]. With this information, it becomes clear that more experimental data regarding the Ni dissolution in the Chi and Laves phases are needed for better developing their thermodynamic models. Thermodynamic modeling and phase equilibria calculations in this study were carried out using Pandat [23].
3. Experimental method
Two Fe-Cr-Ni-Mo alloys were designed for experimental investigation. Their compositions were Fe-13.5Cr-7.75Mo-9Ni (alloy A1) and Fe-15Cr-8.75Mo-13Ni (alloy A2). (Composition is expressed as atomic percent throughout this study.) These alloys were chosen because the calculated results from the extrapolated Fe-Cr-Mo-Ni thermodynamic description [14] suggested that they are located in a phase equilibrium region containing the Chi and Laves phases at the target annealing temperatures. Alloy buttons with a mass of ~50 g of the constituent elements (purity > 99.95 at.%) were prepared by arc melting in an Ar atmosphere in a water-chilled copper mold. The buttons were flipped and remelted more than 10 times to ensure good homogenization. The buttons were then drop-cast into cylindrical copper molds. The total weight loss after drop-cast was less than 0.1%; therefore, it was assumed that the alloys have compositions that are close to the target compositions. The drop-cast rods were cut into small samples and sealed into evacuated quartz capsules for annealing experiments, followed by water quenching. Each alloy was subjected to four annealing conditions: 1000°C for 50 h, 850°C for 168 h, 700°C for 336 h, and 700°C for 795 h. The sample index, compositions, and annealing conditions are listed in Table 1.
Table 1 Sample index of the annealing conditions of alloys A1 and A2.
H1: H2: H3: H4: 1000°C, 50 h 850°C,168 h 700°C,336 h 700°C,795 h A1: Fe-13.5Cr-7.75Mo-9Ni A1H1 A1H2 A1H3 A1H4 A2: Fe-15Cr-8.75Mo-13Ni A2H1 A2H2 A2H3 A2H4
The annealed samples were cut, mounted in epoxy, and metallographically prepared by a final polishing with a colloidal silica suspension. Scanning electron microscopy (SEM) in the backscattered electron mode (BSE) was used to characterize the microstructures of the metallography samples without the need for any chemical etching. The compositions of the matrix and the large-size precipitates were measured at 7 to 10 different locations by electron-probe microanalysis (EPMA) equipped with wavelength-dispersive spectroscopy (WDS) in a JEOL 8200 SEM. The accuracy of the measurement is within 0.5 at.% as a result of careful calibration using a standard 316 Stainless Steels (SS). Conventional matrix corrections (ZAF – element atomic number, X-ray absorption and fluorescence) were used to calculate the compositions from the measured X-ray intensities of Fe Kα, Cr Kα, Ni Kα, and Mo Lα peaks.
4
For crystallographic phase identification, X-ray diffraction (XRD) was performed using a Panalytical Xpert diffractometer with an X'Celerator detector with scanning ranges from nominally 5 to 60° (2θ), Mo-Kα radiation (λ = 0.709319 Å), and 3 mm adjusting slits. The phase search and match were conducted using the Jade and/or HighScore software with the ICDD (International Centre for Diffraction Data) database.
Transmission electron microscopy (TEM) and Energy Dispersive Spectroscopy (EDS) were used to characterize detailed microstructures of the alloys using a FEI CM200 field emission gun microscope at 200 kV. TEM discs of 3 mm thickness were mechanically polished to ~0.1 mm and then electro-polished using a Struers Tenupol polishing unit with a methyl sulfuric (7:1) solution at ~140 mA and -12°C.
4. Results and discussion
4.1 SEM/BSE images and EPMA measurements
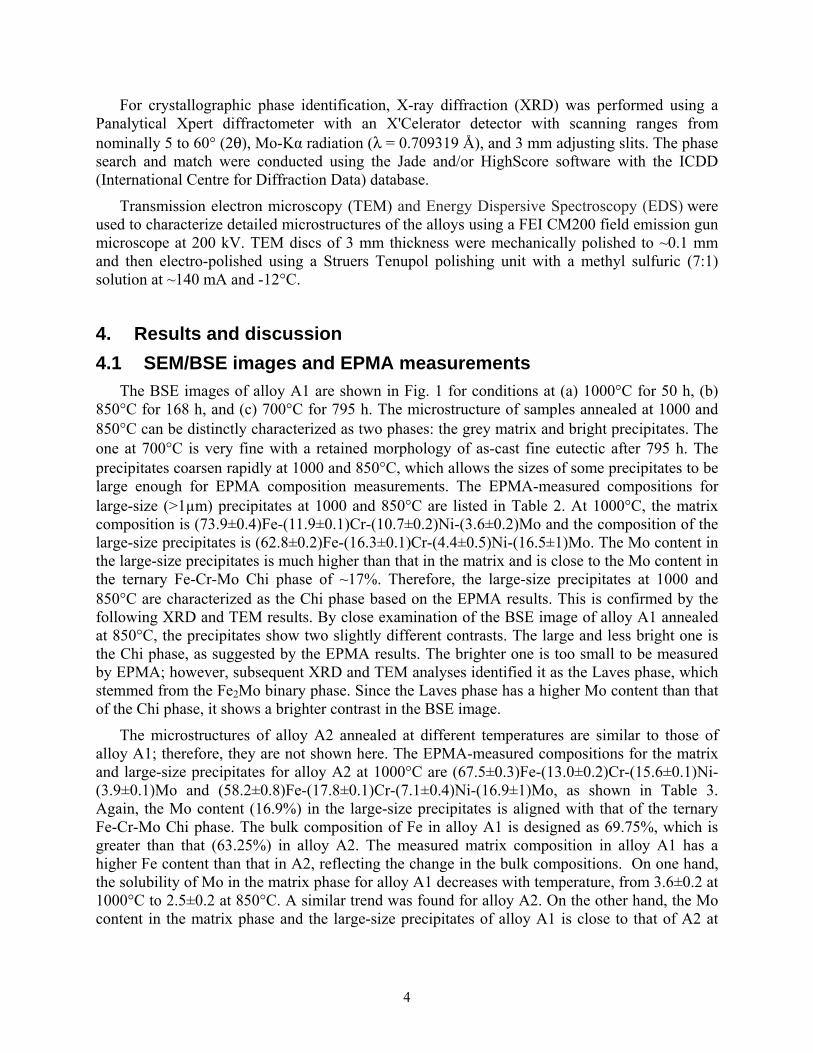
The BSE images of alloy A1 are shown in Fig. 1 for conditions at (a) 1000°C for 50 h, (b) 850°C for 168 h, and (c) 700°C for 795 h. The microstructure of samples annealed at 1000 and 850°C can be distinctly characterized as two phases: the grey matrix and bright precipitates. The one at 700°C is very fine with a retained morphology of as-cast fine eutectic after 795 h. The precipitates coarsen rapidly at 1000 and 850°C, which allows the sizes of some precipitates to be large enough for EPMA composition measurements. The EPMA-measured compositions for large-size (>1µm) precipitates at 1000 and 850°C are listed in Table 2. At 1000°C, the matrix composition is (73.9±0.4)Fe-(11.9±0.1)Cr-(10.7±0.2)Ni-(3.6±0.2)Mo and the composition of the large-size precipitates is (62.8±0.2)Fe-(16.3±0.1)Cr-(4.4±0.5)Ni-(16.5±1)Mo. The Mo content in the large-size precipitates is much higher than that in the matrix and is close to the Mo content in the ternary Fe-Cr-Mo Chi phase of ~17%. Therefore, the large-size precipitates at 1000 and 850°C are characterized as the Chi phase based on the EPMA results. This is confirmed by the following XRD and TEM results. By close examination of the BSE image of alloy A1 annealed at 850°C, the precipitates show two slightly different contrasts. The large and less bright one is the Chi phase, as suggested by the EPMA results. The brighter one is too small to be measured by EPMA; however, subsequent XRD and TEM analyses identified it as the Laves phase, which stemmed from the Fe2Mo binary phase. Since the Laves phase has a higher Mo content than that of the Chi phase, it shows a brighter contrast in the BSE image.
The microstructures of alloy A2 annealed at different temperatures are similar to those of alloy A1; therefore, they are not shown here. The EPMA-measured compositions for the matrix and large-size precipitates for alloy A2 at 1000°C are (67.5±0.3)Fe-(13.0±0.2)Cr-(15.6±0.1)Ni-(3.9±0.1)Mo and (58.2±0.8)Fe-(17.8±0.1)Cr-(7.1±0.4)Ni-(16.9±1)Mo, as shown in Table 3. Again, the Mo content (16.9%) in the large-size precipitates is aligned with that of the ternary Fe-Cr-Mo Chi phase. The bulk composition of Fe in alloy A1 is designed as 69.75%, which is greater than that (63.25%) in alloy A2. The measured matrix composition in alloy A1 has a higher Fe content than that in A2, reflecting the change in the bulk compositions. On one hand, the solubility of Mo in the matrix phase for alloy A1 decreases with temperature, from 3.6±0.2 at 1000°C to 2.5±0.2 at 850°C. A similar trend was found for alloy A2. On the other hand, the Mo content in the matrix phase and the large-size precipitates of alloy A1 is close to that of A2 at
5
given temperature, suggesting the solubility of Mo in both phases is insensitive to the investigated bulk alloy compositions.
Table 2 EPMA-measured phase compositions (at.%) in alloy A1 compared with calculated results.
1000°C, 50 h 850°C, 168 h 700°C, 795 h Phase Element EPMA Calculation EPMA Calculation TEM/EDS Calculation Fcc Fe 73.9±0.4 73.5 74.2±0.2 74.2 75.1±0.2 75.3 Cr 11.9±0.1 11.7 11.7±0.2 11.1 13.7±0.4 13.1 Mo 3.6±0.2 3.6 2.5±0.2 2.6 0.95±0.5 1.1 Ni 10.7±0.2 11.2 11.6±0.2 12.1 10.2±0.2 10.5 Chi Fe 62.8±0.2 62.4 63.7±0.4 62.7 Cr 16.3±0.1 17.1 16.4±0.3 17.4 Mo 16.5±0.1 16.0 15.8±0.5 15.9 Ni 4.4±0.5 4.5 4.1±0.4 4.0 Laves Fe 52.3±0.7 51.8 Cr 16.4±0.8 14.7 Mo 28.6±1.6 29.3 Ni 2.7±0.3 4.2
Table 3 EPMA-measured phase compositions (at.%) in alloy A2 compared with calculated results.
1000°C, 50 h 850°C, 168 h 700°C, 795 h Phase Element EPMA Calculation EPMA TEM/EDS Calculation TEM/EDS Calculation Fcc Fe 67.5±0.3 66.1 67.1±0.9 67.3±0.3 67.3 68.9±0.3 68.7 Cr 13.0±0.2 12.9 13.3±0.6 14.0±0.3 13.9 14.8±0.3 14.4 Mo 3.9±0.1 4.2 3.3±1.3 3.0±0.6 2.6 1.7±0.6 1.2 Ni 15.6±0.1 16.8 16.3±1.0 15.7±0.6 16.2 14.6±0.6 15.7 Chi Fe 58.2±0.8 58.6 58.8±0.3 57.8±0.4 58.7 Cr 17.8±0.1 18.4 18.4±0.3 20.6±0.2 20.0 Mo 16.9±1.0 16.2 15.9±0.5 16.0±0.3 15.8 Ni 7.1±0.4 6.8 6.9±0.4 5.5±0.1 5.5 Laves Fe 51.1±0.4 50.1 49.0±1.7 49.2 Cr 16.5±0.3 15.0 18.9±1.1 16.7 Mo 27.3±0.5 28.6 28.1±0.9 28.2 Ni 5.1±0.3 6.3 4.0±0.6 5.9
6
Figure 1 BSE images for alloy A1 annealed at (a) 1000°C for 50 h (H1), (b) 850°C for 168 h (H2), and (c) 700°C for 795 h (H4). The dark matrix phase in (a), (b), and (c) is Fcc. The large bright phase in (a) and (b) is Chi. The small precipitate phase in (b) and (c) is Laves.
(a) A1H1
(b) A1H2
(c) A1H4
7
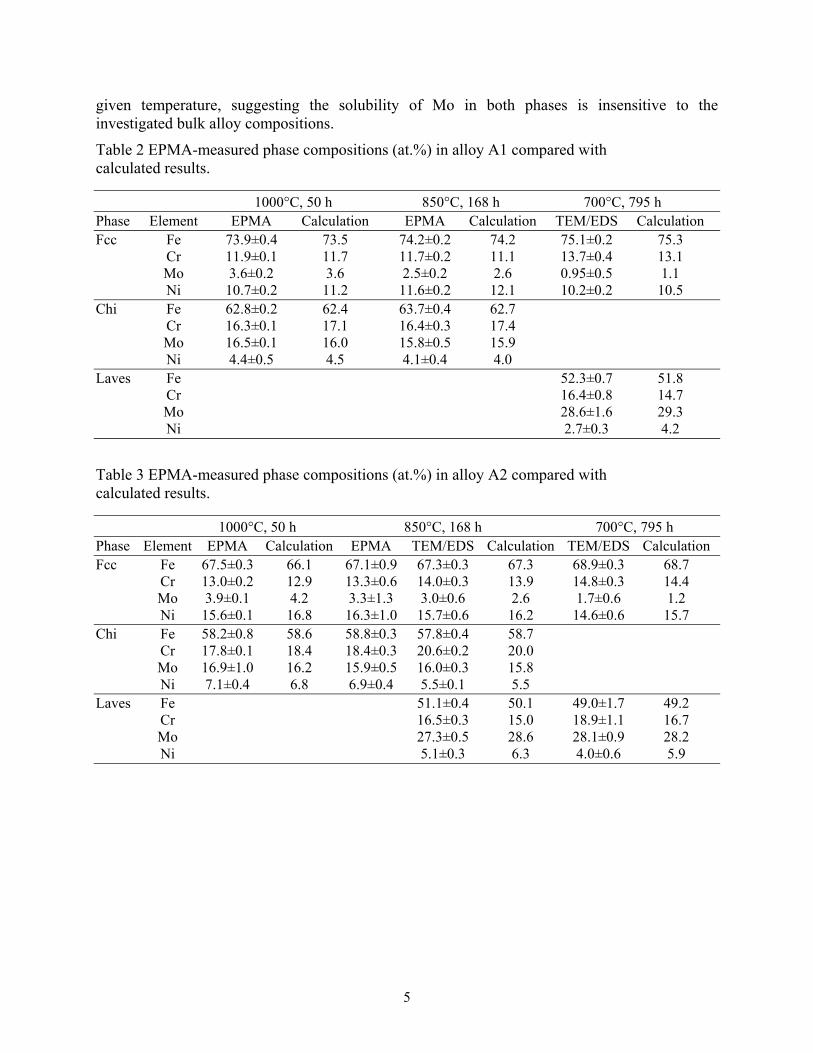
4.2 XRD results
The XRD patterns of alloys A1 and A2 annealed at 1000, 850, and 700°C are shown in Figs. 2 and 3. The intensity peaks of the matrix phase (fcc), and the precipitated phases (Chi and Laves) are marked by solid squares, circles and triangles, respectively. The curves labeled 1, 2, 3, and 4 denote the annealing conditions from 1000°C for 50 h, 850°C for 168 h, 700°C for 335 h, and 700°C for 795 h. The results clearly show the presence of the fcc matrix phase in all samples. The peaks of the Chi phase are clearly seen in the 1000 and 850°C samples, but not in the 700°C samples. The peaks of the Laves phase are seen in the 700°C samples, but not in the 1000°C ones. Upon close examination of the XRD pattern of the 850°C samples, tiny peaks corresponding to the Laves(112) and Laves(201) diffractions can be seen, suggesting that the Laves phase exists at this temperature. In addition, the Laves(112) and Laves(201) diffraction peaks of alloy A2 at 850°C are more prominent than those of alloy A1, suggesting A2 has a larger fraction of the Laves phase than A1, which is consistent with the higher content of Mo in A2. In summary, alloys A1 and A2 have similar XRD patterns and both show that the Chi phase is stable at 1000°C, becomes less stable at 850°C, and is unstable at 700°C, and the Laves phase is not stable at 1000°C but becomes stable at 850°C and below.

8
Figure 2 XRD results of alloy A1 annealed at 1000°C (A1H1), 850°C (A1H2), and 700°C (A1H3 and A1H4).
Figure 3 XRD results of alloy A2 annealed at 1000°C (A2H1), 850°C (A2H2), and 700°C (A2H3 and A2H4).
17.5 20.0 22.5 25.0 27.5
Rel
ativ
e in
tens
ity
2θ (degree)
17.5 20.0 22.5 25.0 27.5
Rel
ativ
e in
tens
ity
2θ (degree)
1:A1H12:A1H2 3:A1H3 4:A1H4
Fcc Chi Laves
1 2 3 4
Lav
es(1
03)
Lav
es(1
12)
Lav
es(2
01)
Chi
(330
)
Chi
(332
)
Fcc
(111
)
Fcc
(200
)
Chi
(510
)
Chi
(422
)
Chi
(420
)
Chi
(400
)
Lav
es(2
00)
1:A2H1 2:A2H2 3:A2H3 4:A2H4
Fcc Chi Laves
1 2 3 4
Lav
es(1
12)
Chi
(420
)
Lav
es(2
01
Chi
(330
)
Chi
(332
)
Fcc
(111
)
Fcc
(200
)
Chi
(510
)
Chi
(422
)
Lav
es(1
03)
Chi
(400
)
Lav
es(2
00)
9
4.3 TEM/EDS results
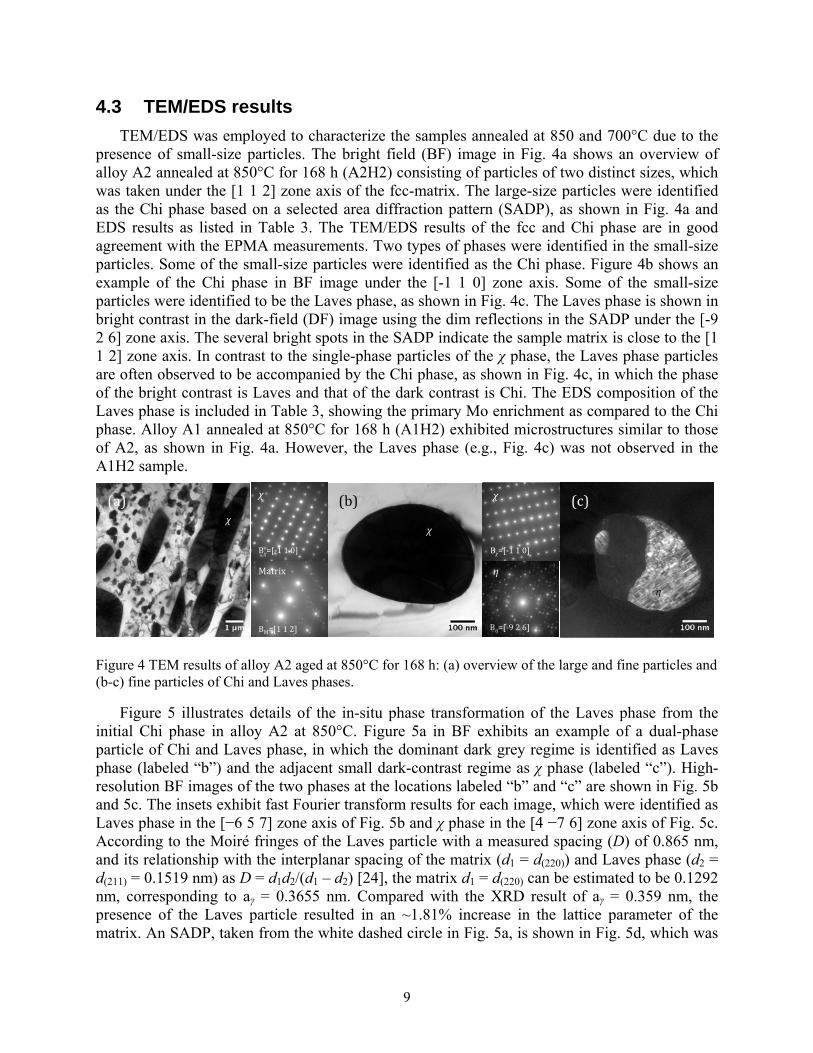
TEM/EDS was employed to characterize the samples annealed at 850 and 700°C due to the presence of small-size particles. The bright field (BF) image in Fig. 4a shows an overview of alloy A2 annealed at 850°C for 168 h (A2H2) consisting of particles of two distinct sizes, which was taken under the [1 1 2] zone axis of the fcc-matrix. The large-size particles were identified as the Chi phase based on a selected area diffraction pattern (SADP), as shown in Fig. 4a and EDS results as listed in Table 3. The TEM/EDS results of the fcc and Chi phase are in good agreement with the EPMA measurements. Two types of phases were identified in the small-size particles. Some of the small-size particles were identified as the Chi phase. Figure 4b shows an example of the Chi phase in BF image under the [-1 1 0] zone axis. Some of the small-size particles were identified to be the Laves phase, as shown in Fig. 4c. The Laves phase is shown in bright contrast in the dark-field (DF) image using the dim reflections in the SADP under the [-9 2 6] zone axis. The several bright spots in the SADP indicate the sample matrix is close to the [1 1 2] zone axis. In contrast to the single-phase particles of the χ phase, the Laves phase particles are often observed to be accompanied by the Chi phase, as shown in Fig. 4c, in which the phase of the bright contrast is Laves and that of the dark contrast is Chi. The EDS composition of the Laves phase is included in Table 3, showing the primary Mo enrichment as compared to the Chi phase. Alloy A1 annealed at 850°C for 168 h (A1H2) exhibited microstructures similar to those of A2, as shown in Fig. 4a. However, the Laves phase (e.g., Fig. 4c) was not observed in the A1H2 sample.
Figure 4 TEM results of alloy A2 aged at 850°C for 168 h: (a) overview of the large and fine particles and (b-c) fine particles of Chi and Laves phases.
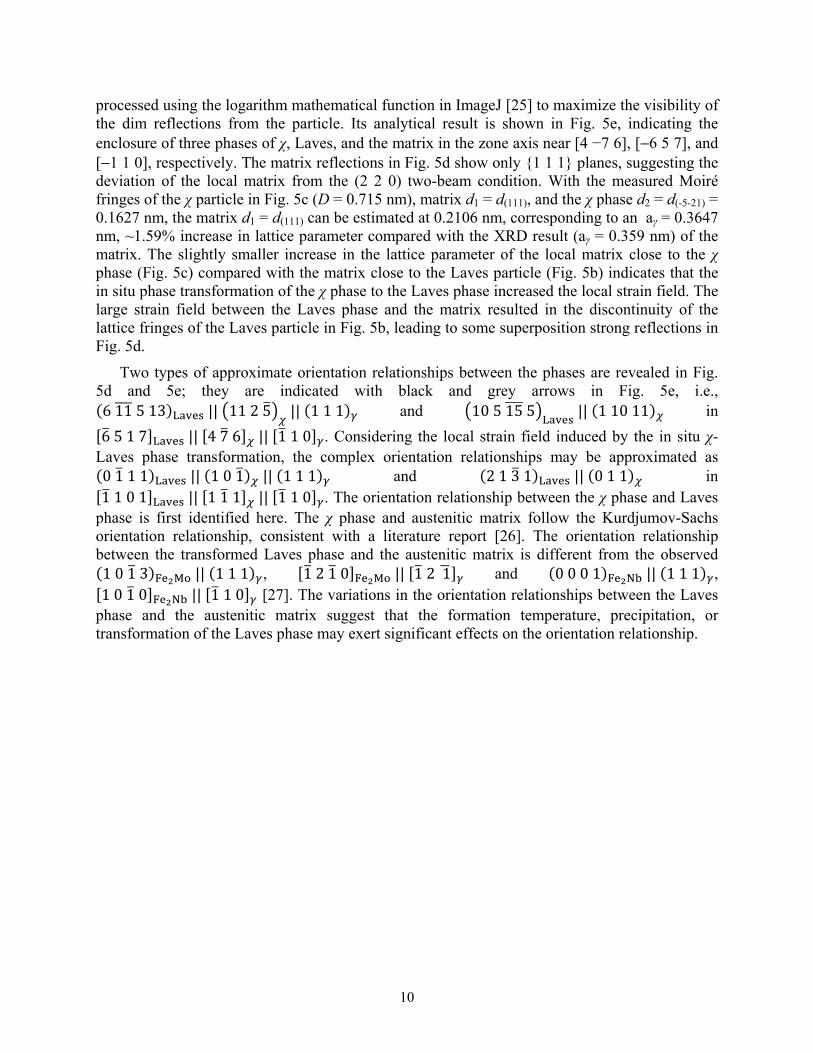
Figure 5 illustrates details of the in-situ phase transformation of the Laves phase from the initial Chi phase in alloy A2 at 850°C. Figure 5a in BF exhibits an example of a dual-phase particle of Chi and Laves phase, in which the dominant dark grey regime is identified as Laves phase (labeled “b”) and the adjacent small dark-contrast regime as χ phase (labeled “c”). High-resolution BF images of the two phases at the locations labeled “b” and “c” are shown in Fig. 5b and 5c. The insets exhibit fast Fourier transform results for each image, which were identified as Laves phase in the [−6 5 7] zone axis of Fig. 5b and χ phase in the [4 −7 6] zone axis of Fig. 5c. According to the Moiré fringes of the Laves particle with a measured spacing (D) of 0.865 nm, and its relationship with the interplanar spacing of the matrix (d1 = d(220)) and Laves phase (d2 = d(211) = 0.1519 nm) as D = d1d2/(d1 – d2) [24], the matrix d1 = d(220) can be estimated to be 0.1292 nm, corresponding to aγ = 0.3655 nm. Compared with the XRD result of aγ = 0.359 nm, the presence of the Laves particle resulted in an ~1.81% increase in the lattice parameter of the matrix. An SADP, taken from the white dashed circle in Fig. 5a, is shown in Fig. 5d, which was
Matrix
χ
χ(a)
Bχ=[-110]
BM=[112]
(b) (c)χ
χ
η
η
Bχ=[-110]
Bη=[-926]
10
processed using the logarithm mathematical function in ImageJ [25] to maximize the visibility of the dim reflections from the particle. Its analytical result is shown in Fig. 5e, indicating the enclosure of three phases of χ, Laves, and the matrix in the zone axis near [4 −7 6], [−6 5 7], and [−1 1 0], respectively. The matrix reflections in Fig. 5d show only {1 1 1} planes, suggesting the deviation of the local matrix from the (2 2 0) two-beam condition. With the measured Moiré fringes of the χ particle in Fig. 5c (D = 0.715 nm), matrix d1 = d(111), and the χ phase d2 = d(-5-21) = 0.1627 nm, the matrix d1 = d(111) can be estimated at 0.2106 nm, corresponding to an aγ = 0.3647 nm, ~1.59% increase in lattice parameter compared with the XRD result (aγ = 0.359 nm) of the matrix. The slightly smaller increase in the lattice parameter of the local matrix close to the χ phase (Fig. 5c) compared with the matrix close to the Laves particle (Fig. 5b) indicates that the in situ phase transformation of the χ phase to the Laves phase increased the local strain field. The large strain field between the Laves phase and the matrix resulted in the discontinuity of the lattice fringes of the Laves particle in Fig. 5b, leading to some superposition strong reflections in Fig. 5d.
Two types of approximate orientation relationships between the phases are revealed in Fig. 5d and 5e; they are indicated with black and grey arrows in Fig. 5e, i.e., (611513) || 1125 ||(111) and 105155 ||(11011) in 6517 || 476 || 110 . Considering the local strain field induced by the in situ χ-Laves phase transformation, the complex orientation relationships may be approximated as (0111) ||(101) ||(111) and (2131) ||(011) in 1101 || 111 || 110 . The orientation relationship between the χ phase and Laves phase is first identified here. The χ phase and austenitic matrix follow the Kurdjumov-Sachs orientation relationship, consistent with a literature report [26]. The orientation relationship between the transformed Laves phase and the austenitic matrix is different from the observed (1013) ||(111) , 1210 || 121 and (0001) ||(111) , 1010 || 110 [27]. The variations in the orientation relationships between the Laves phase and the austenitic matrix suggest that the formation temperature, precipitation, or transformation of the Laves phase may exert significant effects on the orientation relationship.
11
Figure 5 (a) BF image of a Laves-χ particle in the 850°C-annealed sample, together with its high-resolution BF images of (b) Laves phase, (c) χ-phase, (d) SADP, and (e) analytical diffraction pattern.
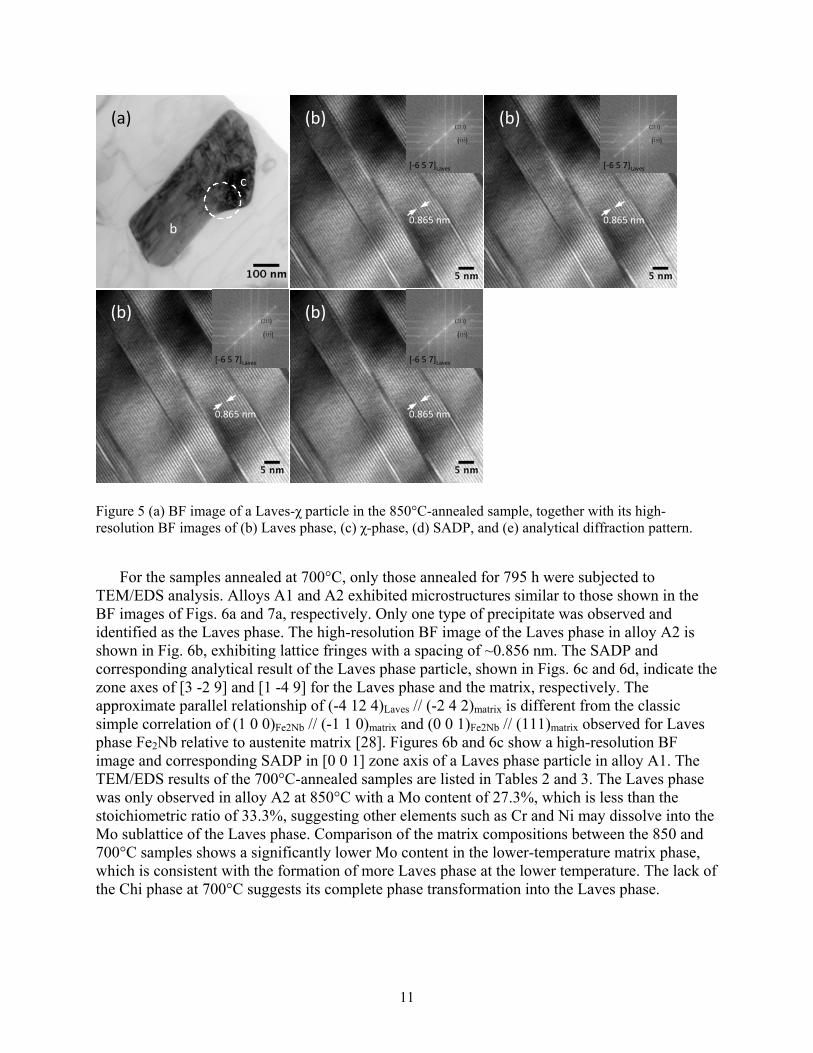
For the samples annealed at 700°C, only those annealed for 795 h were subjected to
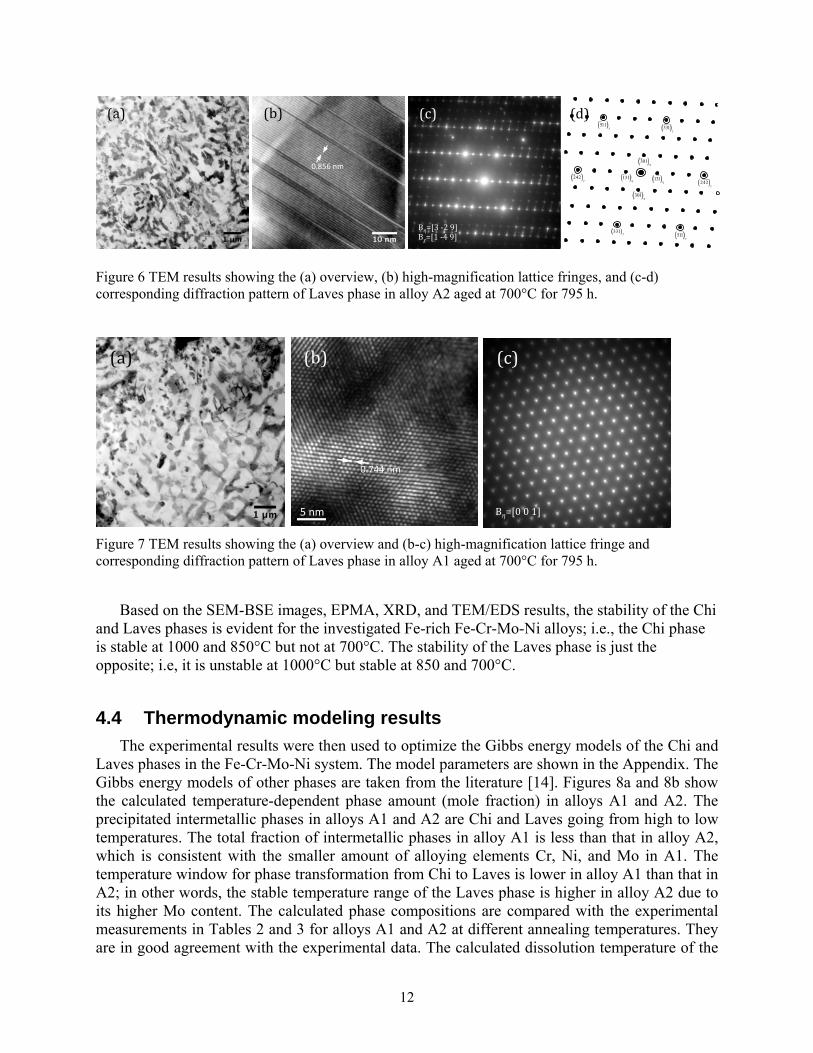
TEM/EDS analysis. Alloys A1 and A2 exhibited microstructures similar to those shown in the BF images of Figs. 6a and 7a, respectively. Only one type of precipitate was observed and identified as the Laves phase. The high-resolution BF image of the Laves phase in alloy A2 is shown in Fig. 6b, exhibiting lattice fringes with a spacing of ~0.856 nm. The SADP and corresponding analytical result of the Laves phase particle, shown in Figs. 6c and 6d, indicate the zone axes of [3 -2 9] and [1 -4 9] for the Laves phase and the matrix, respectively. The approximate parallel relationship of (-4 12 4)Laves // (-2 4 2)matrix is different from the classic simple correlation of (1 0 0)Fe2Nb // (-1 1 0)matrix and (0 0 1)Fe2Nb // (111)matrix observed for Laves phase Fe2Nb relative to austenite matrix [28]. Figures 6b and 6c show a high-resolution BF image and corresponding SADP in [0 0 1] zone axis of a Laves phase particle in alloy A1. The TEM/EDS results of the 700°C-annealed samples are listed in Tables 2 and 3. The Laves phase was only observed in alloy A2 at 850°C with a Mo content of 27.3%, which is less than the stoichiometric ratio of 33.3%, suggesting other elements such as Cr and Ni may dissolve into the Mo sublattice of the Laves phase. Comparison of the matrix compositions between the 850 and 700°C samples shows a significantly lower Mo content in the lower-temperature matrix phase, which is consistent with the formation of more Laves phase at the lower temperature. The lack of the Chi phase at 700°C suggests its complete phase transformation into the Laves phase.
(a)
b
c
(b) 211
133
[-6 5 7]Laves
0.865 nm
(b) 211
133
[-6 5 7]Laves
0.865 nm
(b) 211
133
[-6 5 7]Laves
0.865 nm
(b) 211
133
[-6 5 7]Laves
0.865 nm
12
Figure 6 TEM results showing the (a) overview, (b) high-magnification lattice fringes, and (c-d) corresponding diffraction pattern of Laves phase in alloy A2 aged at 700°C for 795 h.
Figure 7 TEM results showing the (a) overview and (b-c) high-magnification lattice fringe and corresponding diffraction pattern of Laves phase in alloy A1 aged at 700°C for 795 h.
Based on the SEM-BSE images, EPMA, XRD, and TEM/EDS results, the stability of the Chi
and Laves phases is evident for the investigated Fe-rich Fe-Cr-Mo-Ni alloys; i.e., the Chi phase is stable at 1000 and 850°C but not at 700°C. The stability of the Laves phase is just the opposite; i.e, it is unstable at 1000°C but stable at 850 and 700°C.
4.4 Thermodynamic modeling results
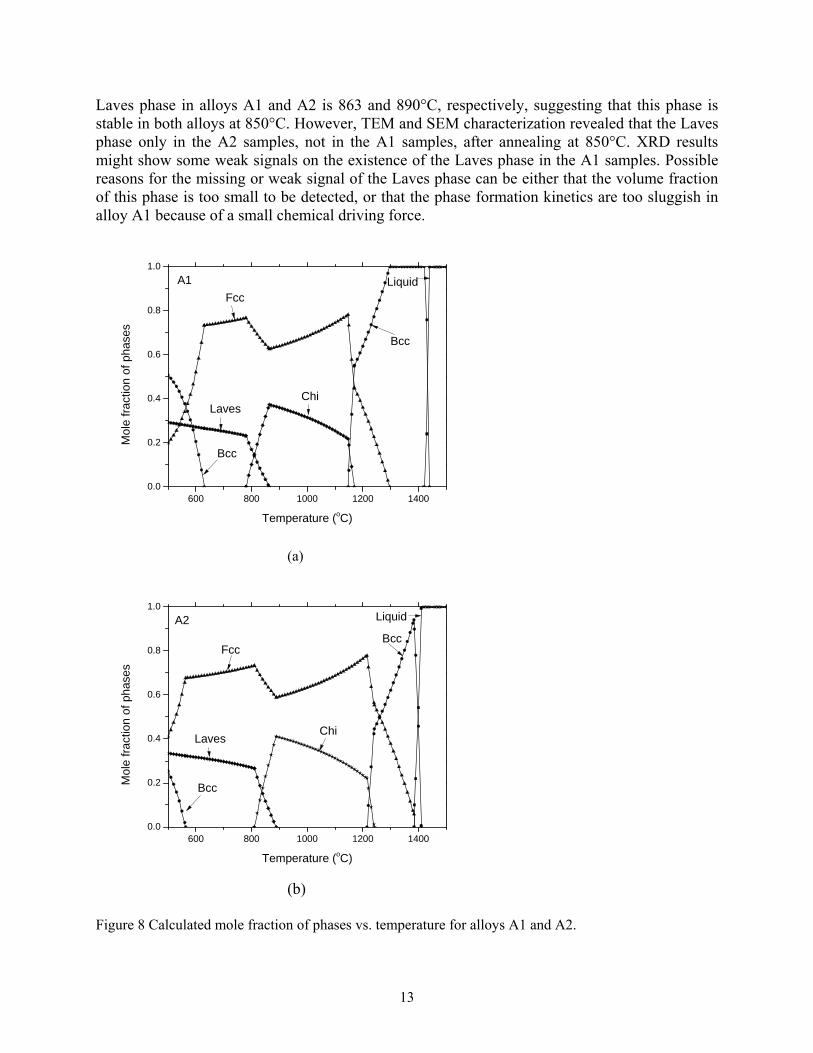
The experimental results were then used to optimize the Gibbs energy models of the Chi and Laves phases in the Fe-Cr-Mo-Ni system. The model parameters are shown in the Appendix. The Gibbs energy models of other phases are taken from the literature [14]. Figures 8a and 8b show the calculated temperature-dependent phase amount (mole fraction) in alloys A1 and A2. The precipitated intermetallic phases in alloys A1 and A2 are Chi and Laves going from high to low temperatures. The total fraction of intermetallic phases in alloy A1 is less than that in alloy A2, which is consistent with the smaller amount of alloying elements Cr, Ni, and Mo in A1. The temperature window for phase transformation from Chi to Laves is lower in alloy A1 than that in A2; in other words, the stable temperature range of the Laves phase is higher in alloy A2 due to its higher Mo content. The calculated phase compositions are compared with the experimental measurements in Tables 2 and 3 for alloys A1 and A2 at different annealing temperatures. They are in good agreement with the experimental data. The calculated dissolution temperature of the
0.856 nm
Bη=[3-29]Bχ=[1-49] 511γ
331 γ
242γ
242γ
511γ 331
γ
131η 131
η
301η
301η
(a) (b) (c) (d)
5 nm
0.744 nm
Bη=[001]
(a) (b) (c)
13
Laves phase in alloys A1 and A2 is 863 and 890°C, respectively, suggesting that this phase is stable in both alloys at 850°C. However, TEM and SEM characterization revealed that the Laves phase only in the A2 samples, not in the A1 samples, after annealing at 850°C. XRD results might show some weak signals on the existence of the Laves phase in the A1 samples. Possible reasons for the missing or weak signal of the Laves phase can be either that the volume fraction of this phase is too small to be detected, or that the phase formation kinetics are too sluggish in alloy A1 because of a small chemical driving force.
(a)
(b)
Figure 8 Calculated mole fraction of phases vs. temperature for alloys A1 and A2.
600 800 1000 1200 14000.0
0.2
0.4
0.6
0.8
1.0
Mol
e fr
actio
n of
ph
ases
Temperature (oC)
Liquid
Bcc
Fcc
ChiLaves
Bcc
A1
600 800 1000 1200 14000.0
0.2
0.4
0.6
0.8
1.0
Mol
e fr
actio
n of
ph
ases
Temperature (oC)
Liquid
BccFcc
ChiLaves
Bcc
A2
14
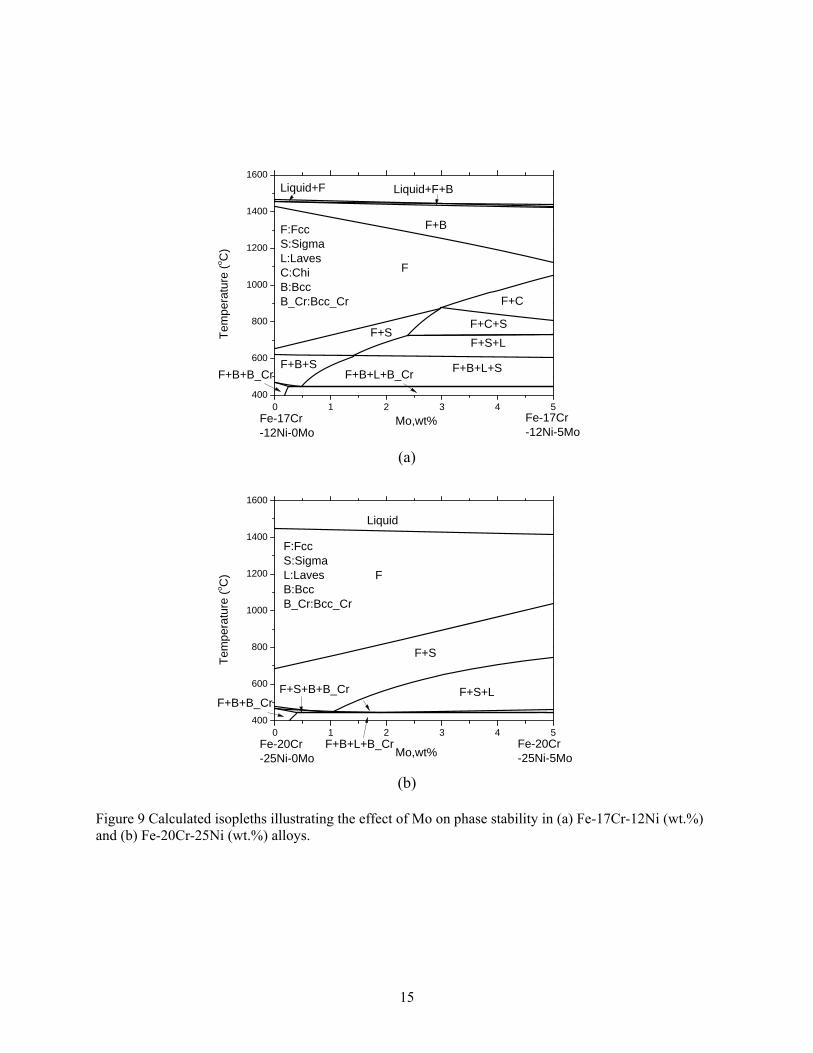
Based on the currently developed Fe-Cr-Mo-Ni thermodynamic models, two isopleths close to the compositions of type 316 and NF709 SS were calculated and plotted in Figs. 9a and 9b, which illustrate the effect of Mo addition on the phase stability in these two alloys. The Fe-17Cr-12Ni (wt.%) is chosen to represent 316, and the Fe-20Cr-25Ni (wt.%) is chosen to represent NF709. The X-axis is the Mo content added to the selected compositions. It is assumed that the added Mo substitutes for Fe only, and that the Cr and Ni contents are fixed at specified amounts. The calculated diagrams in Figs. 9a and 9b map the effect of Mo addition on the stability of intermetallic phases in these two alloys. Figure 9a shows that in 316 SS, the intermetallic phases that precipitated are Sigma and Laves going from high to low temperature when the Mo content is less than ~2.3 wt.%. When Mo content exceeds 2.3wt.%, Chi, Sigma, and Laves phases precipitate in sequence as the temperature decreases. For the NF709 SS in Fig. 9b, there is no stable region for the Chi phase for a Mo content up to 5 wt.%. The intermetallic phase that precipitates is Sigma at high temperature and Laves at low temperature. These findings are consistent with the experimentally observed precipitation sequence of intermetallic phases in 316 and NF709 SS , which suggests that the thermal stability of precipitated phases in Fe-Cr-Ni-Mo alloys has a direct impact on the stability of these intermetallic phases in the practical commercial alloys.
15
(a)
(b)
Figure 9 Calculated isopleths illustrating the effect of Mo on phase stability in (a) Fe-17Cr-12Ni (wt.%) and (b) Fe-20Cr-25Ni (wt.%) alloys.
0 1 2 3 4 5400
600
800
1000
1200
1400
1600
F:FccS:SigmaL:LavesC:ChiB:BccB_Cr:Bcc_Cr F+C
Fe-17Cr-12Ni-5Mo
F+B+SF+B+L+B_Cr
Tem
per
atur
e (o C
)
Mo,wt%
F+B
F
F+SF+C+S
F+S+L
F+B+L+SF+B+B_Cr
Liquid+F Liquid+F+B
Fe-17Cr-12Ni-0Mo
0 1 2 3 4 5400
600
800
1000
1200
1400
1600
Fe-20Cr-25Ni-5Mo
F+S+B+B_Cr
F+B+L+B_Cr
Tem
per
atur
e (o C
)
Mo,wt%
F
F+S
F+S+LF+B+B_Cr
Liquid
Fe-20Cr-25Ni-0Mo
F:FccS:SigmaL:LavesB:BccB_Cr:Bcc_Cr
16
5. Conclusions
Coupled with thermodynamic modeling, the thermal stability of the intermetallic phases in two Fe-Cr-Ni-Mo alloys was investigated at 1000, 850, and 700°C for different annealing time. The calculated phase equilibria and compositions are in good agreement with SEM/BSE, TEM, XRD, and EPMA results. The key findings resulting from this study are listed as follows:
1) For the Fe-rich Fe-Cr-Ni-Mo alloys that were investigated, the Chi phase was stable at high temperature and the Laves phase was stable at low temperature. TEM analysis results suggested that some of the Laves phase was in-situ transformed from the high-temperature Chi phase.
2) Both the Chi and Laves phases could dissolve a large amount of Mo, but the Laves phase has a higher content (~28 at.%) than the Chi phase (~16 at.%). The Mo solubility in both the matrix and Chi phases decreased with temperature. The Cr and Ni contents in the Laves phase were similar to those in the Chi phase for the investigated alloys. The chemical driving force for the formation of the Laves phase is the supersaturated Mo content from the matrix and that from Chi phase.
3) From the model evaluation on the effect of Mo on the thermal stability of intermetallic phases in the Fe-Cr-Mo-Ni isopleth sections with compositions close to those of type 316 and NF709 SS, it was found that for the section close to 316 SS, the intermetallic phases that precipitated were Sigma and Laves going from high to low temperature when the Mo content is less than ~2.3 wt.%. When the Mo content exceeds 2.3 wt.%, Chi, Sigma, and Laves phases precipitated in sequence as the temperature decreased. For the section close to NF709 SS, there is no stable region for the Chi phase for a Mo content up to 5 wt.%. The intermetallic phases that precipitated are Sigma and Laves with decreasing temperature.

17
6. References 1. Zinkle, S.J. and J.T. Busby, Structural materials for fission and fusion energy. Materials Today,
2009. 12(11): p. 12-19. 2. Weiss, B. and R. Stickler, Phase instabilities during high temperature exposure of 316 austenitic
stainless steel. Metallurgical Transactions, 1972. 3(4): p. 851-866. 3. Sourmail, T., Precipitation in creep resistant austenitic stainless steels. Materials Science and
Technology, 2001. 17(1): p. 1-14. 4. Yamamoto, Y., et al., Alloying effects on creep and oxidation resistance of austenitic stainless
steel alloys employing intermetallic precipitates. Intermetallics, 2008. 16(3): p. 453-462. 5. Andersson, J.-O. and N. Lange, An experimental study and a thermodynamic evaluation of the
Fe-Cr-Mo system. Metallurgical Transactions A, 1988. 19(6): p. 1385-1394. 6. Frisk, K., An experimental and theoretical study of the phase equilibria in the Fe-Mo-Ni system.
Metallurgical Transactions A, 1992. 23(2): p. 639-649. 7. Lee, B.-J., A Thermodynamic Evaluation of the Fe--Cr--Ni System. Journal of the Korean Institute
of Metals and Materials, 1993. 31(4): p. 480-489. 8. Liu, S., Y. Hamaguchi, and H. Kuwano, Experimental Determination of the Phase Boundaries of
Intermetallic Compounds in the Ternary Fe--Cr--Mo System. J. Jpn. Inst. Met., 1986. 50(12): p. 1023-1031.
9. Lukas, H.L., Chromium–Molybdenum–Nickel, in Refractory metal systems. 2010, Springer. p. 170-181.
10. Raynor, G. and V. Rivlin, The Cr-Fe-Ni (Chromium-Iron-Nickel) System. Bull. Alloy Phase Diagrams, 1981. 2(1): p. 89-99.
11. Saunders, N. and A.P. Miodownik, CALPHAD (Calculation of Phase Diagrams): A Comprehensive Guide: A Comprehensive Guide. Vol. 1. 1998: Elsevier.
12. Chang, Y.A., et al., Phase diagram calculation: past, present and future. Progress in Materials Science, 2004. 49(3): p. 313-345.
13. Yang, Y., et al., Effects of Ti, Zr, and Hf on the phase stability of Mo_ss+ Mo< sub> 3</sub> Si+ Mo< sub> 5</sub> SiB< sub> 2</sub> alloys at 1600° C. Acta Materialia, 2010. 58(2): p. 541-548.
14. Yang, Y. and J. Busby, Thermodynamic modeling and kinetics simulation of precipitate phases in AISI 316 stainless steels. Journal of Nuclear Materials, 2014. 448(1): p. 282-293.
15. Hillert, M., The compound energy formalism. Journal of Alloys and Compounds, 2001. 320(2): p. 161-176.
16. Dinsdale, A.T., SGTE data for pure elements. Calphad, 1991. 15(4): p. 317-425. 17. Redlich, O. and A.T. Kister, Algebraic Representation of Thermodynamic Properties and the
Classification of Solutions. Industrial & Engineering Chemistry, 1948. 40(2): p. 345-348. 18. Hillert, M. and M. Jarl, A model for alloying in ferromagnetic metals. Calphad, 1978. 2(3): p.
227-238. 19. Inden, G., Proc. Project Meeting CALPHAD V, Dusseldorf 1976. 20. Joubert, J.-M., Crystal chemistry and Calphad modeling of the σ phase. Progress in Materials
Science, 2008. 53(3): p. 528-583. 21. Kasper, J., The ordering of atoms in the chi-phase of the iron-chromium-molybdenum system.
Acta Metallurgica, 1954. 2(3): p. 456-461. 22. Joubert, J.-M. and M. Phejar, Crystal chemistry and Calphad modelling of the χ phase. Progress
in Materials Science, 2009. 54(7): p. 945-980. 23. Cao, W., et al., PANDAT software with PanEngine, PanOptimizer and PanPrecipitation for
multi-component phase diagram calculation and materials property simulation. Calphad, 2009. 33(2): p. 328-342.
24. Fultz, B. and J.M. Howe, Transmission electron microscopy and diffractometry of materials. 2012: Springer Science & Business Media.
18
25. Health., N.I.o., ImageJ Image Processing and Analysis in Java. 2008. 26. Lee, T.-H. and S.-J. Kim, Phase identification in an isothermally aged austenitic 22Cr-21Ni-
6Mo-N stainless steel. Scripta materialia, 1998. 39(7): p. 951-956. 27. Marshall, P., Austenitic stainless steels: microstructure and mechanical properties. 1984:
Springer Science & Business Media. 28. Denham, A. and J. Silcock, PRECIPITATION OF FE 2 NB IN A 16 WT-PER CENT NI-16 WT-
PER CENT CR STEEL, AND THE EFFECT OF MN AND SI ADDITIONS. J IRON STEEL INST, 1969. 207(5): p. 582-592.


![A Condensed Review of Nuclear Reactor Thermal - [email protected]](https://img.pdfslide.net/doc/110x75/620745aa49d709492c2fbd26/a-condensed-review-of-nuclear-reactor-thermal-emailprotected.jpg)