Embed Size (px)
Citation preview
Lighting Commercial Spaces 101
An Introduction to LED and Lighting Controls
1
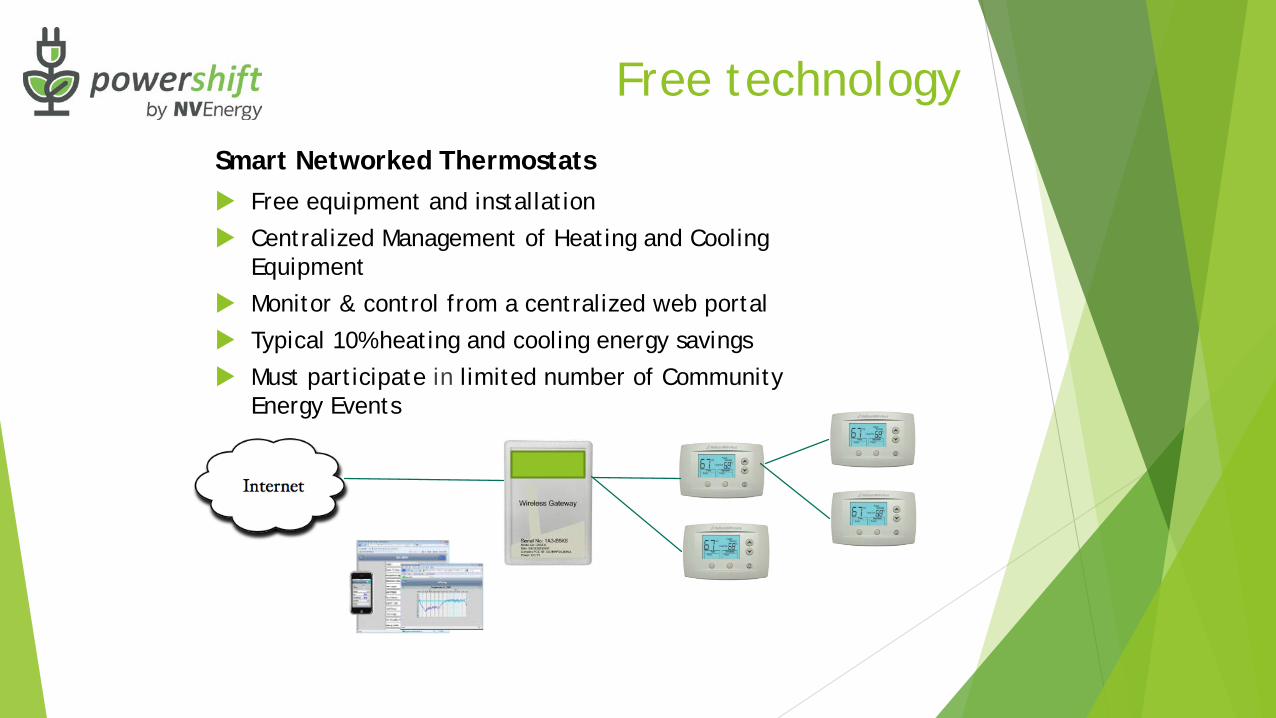
Free technologySmart Networked Thermostats Free equipment and installation Centralized Management of Heating and Cooling
Equipment Monitor & control from a centralized web portal Typical 10% heating and cooling energy savings Must participate in limited number of Community
Energy Events
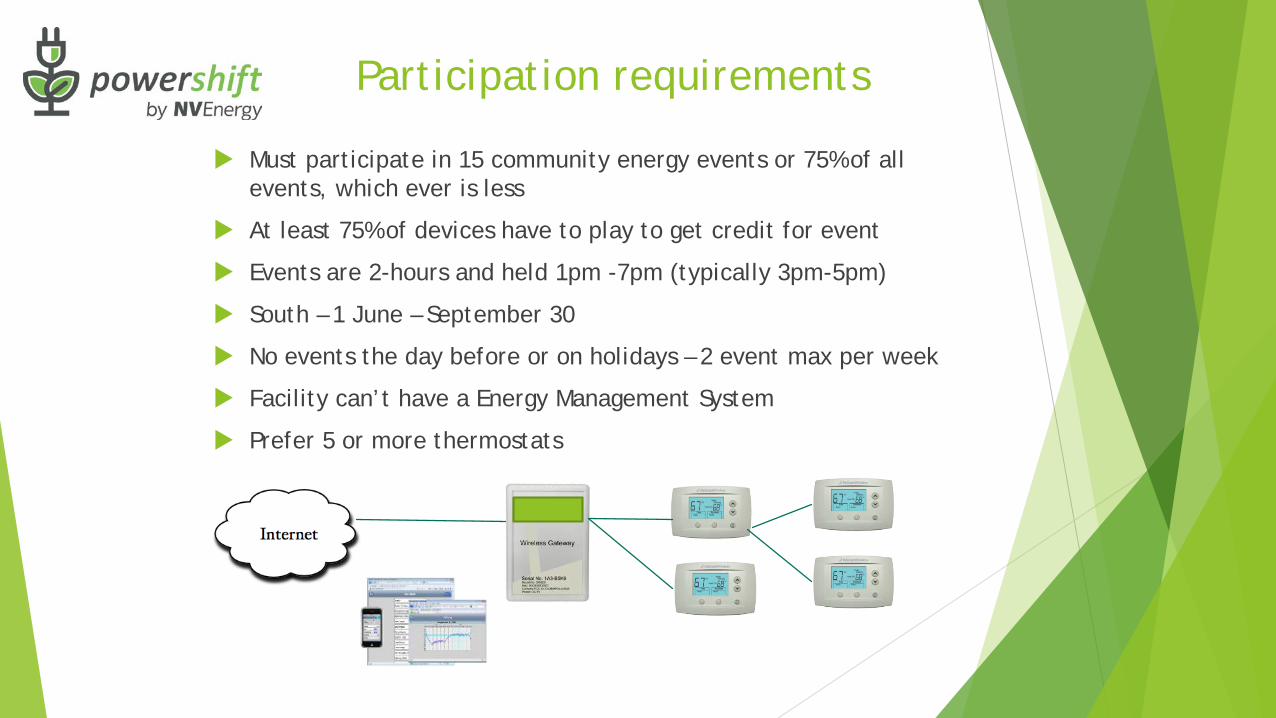
Participation requirements
Must participate in 15 community energy events or 75% of all events, which ever is less
At least 75% of devices have to play to get credit for event
Events are 2-hours and held 1pm -7pm (typically 3pm-5pm)
South – 1 June – September 30
No events the day before or on holidays – 2 event max per week
Facility can’t have a Energy Management System
Prefer 5 or more thermostats

SolarGenerations
4
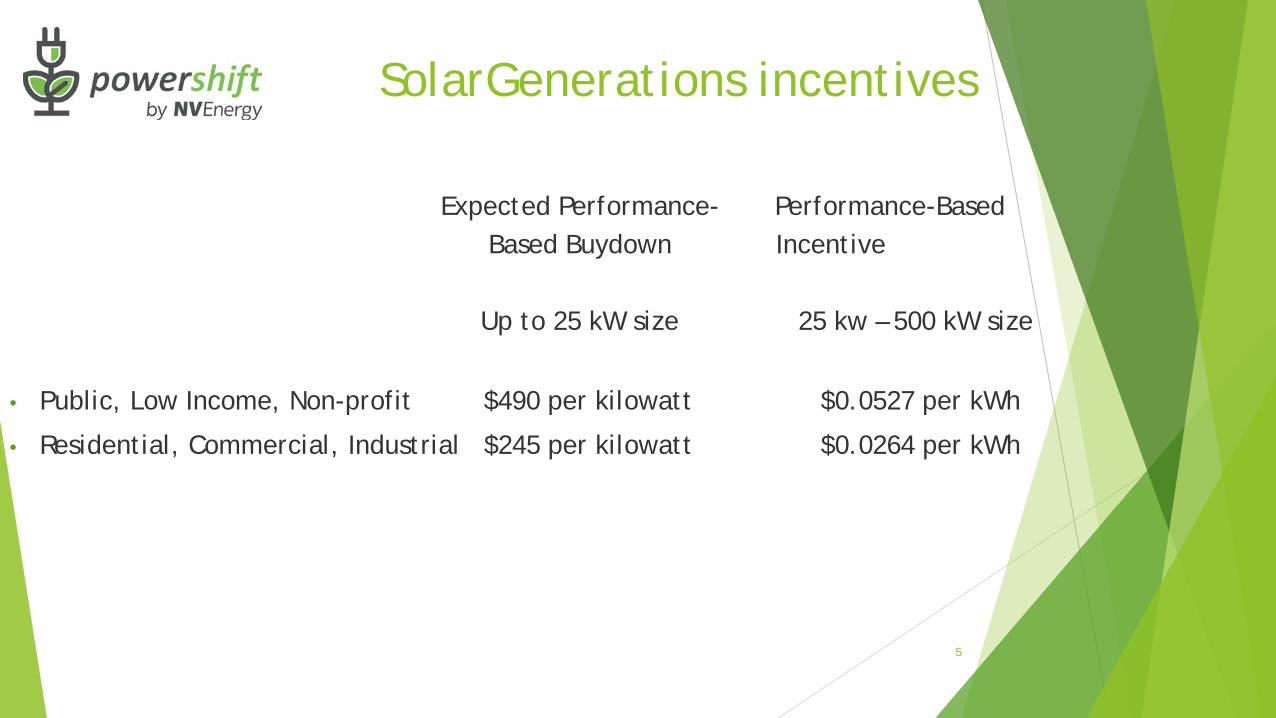
SolarGenerations incentives
5
Expected Performance- Performance-BasedBased Buydown Incentive
Up to 25 kW size 25 kw – 500 kW size
• Public, Low Income, Non-profit $490 per kilowatt $0.0527 per kWh
• Residential, Commercial, Industrial $245 per kilowatt $0.0264 per kWh
SolarGenerations offering
6
• Continuously open
• Eligible for system size up to 500 kW
• Incentives are paid up front for small systems (EPBB) and
over time for larger systems (PBI)
The importance of lighting efficiency – Industry snapshot
Fundamentals of lighting – Terms and design basics
LED – A brief overview of the technology…and savings!
Questions
7
Agenda
To show that lighting is an effective way to increase energy efficiency
To better understand the common terms used in the lighting industry
Learn the advantages of LED over other light sources
How to make a better business case for LEDs
8
Learning objectives
9
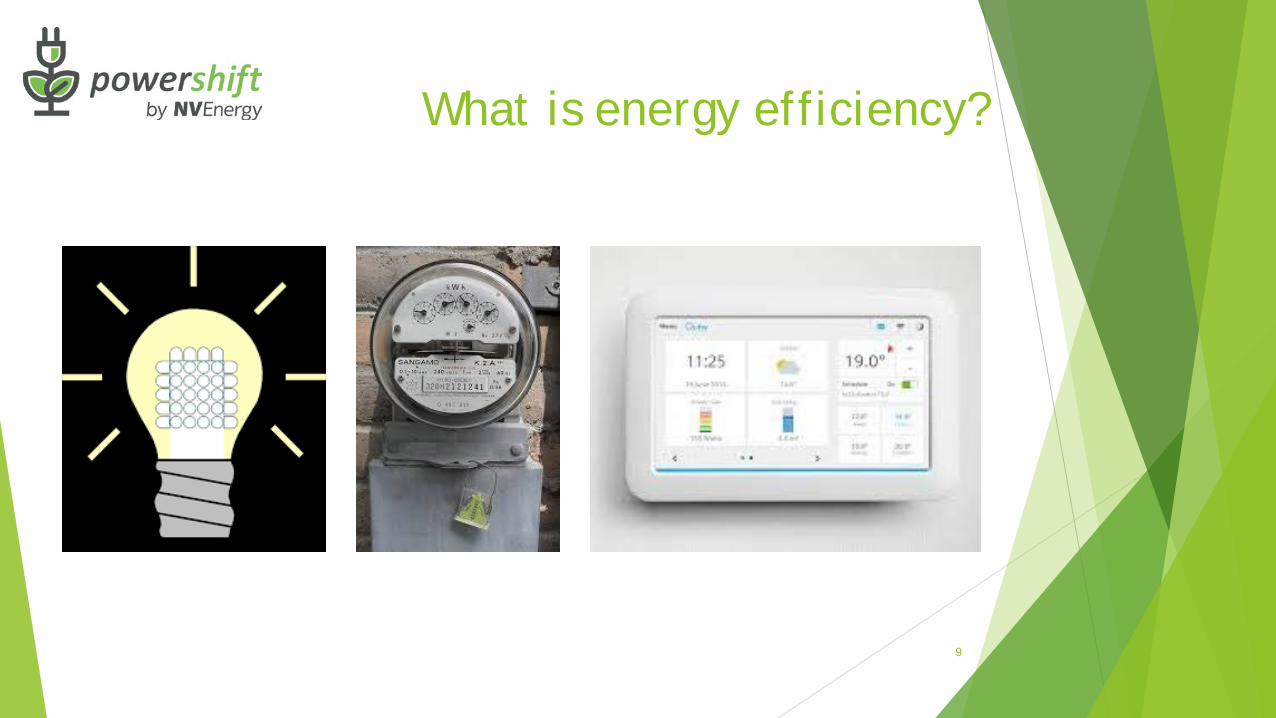
What is energy efficiency?
10
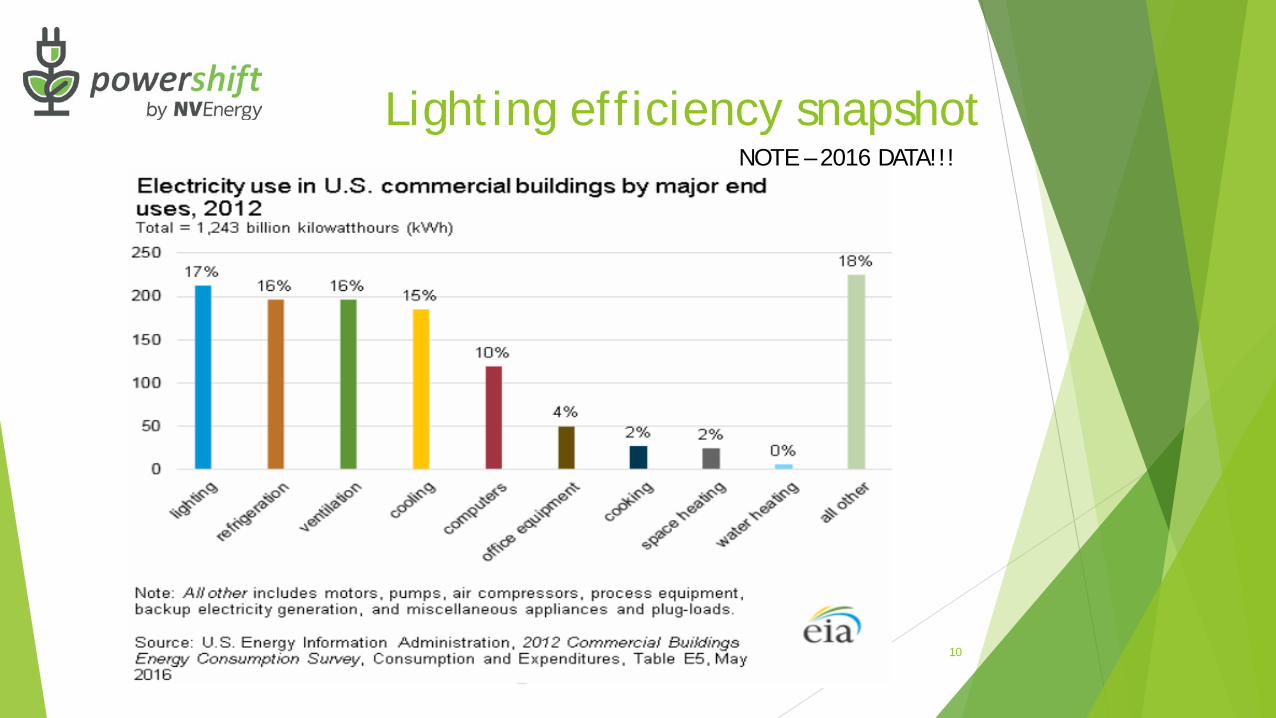
Lighting efficiency snapshotNOTE – 2016 DATA!!!
11
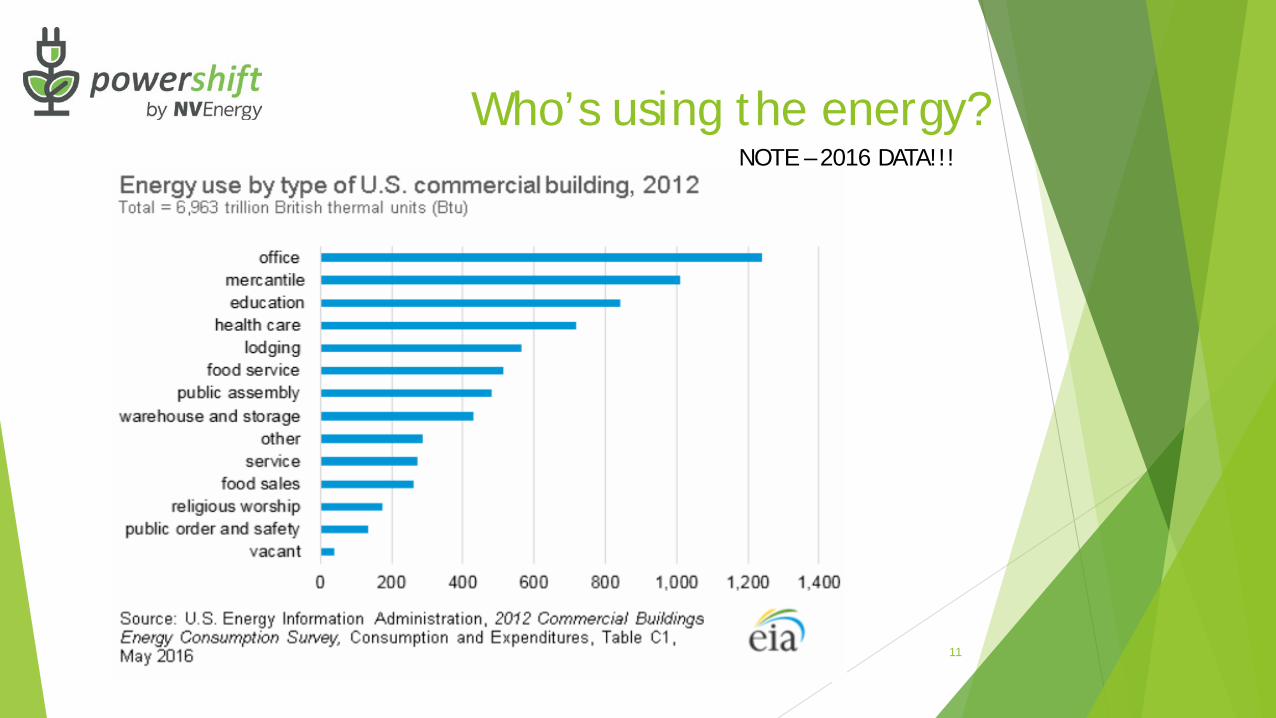
Who’s using the energy? NOTE – 2016 DATA!!!
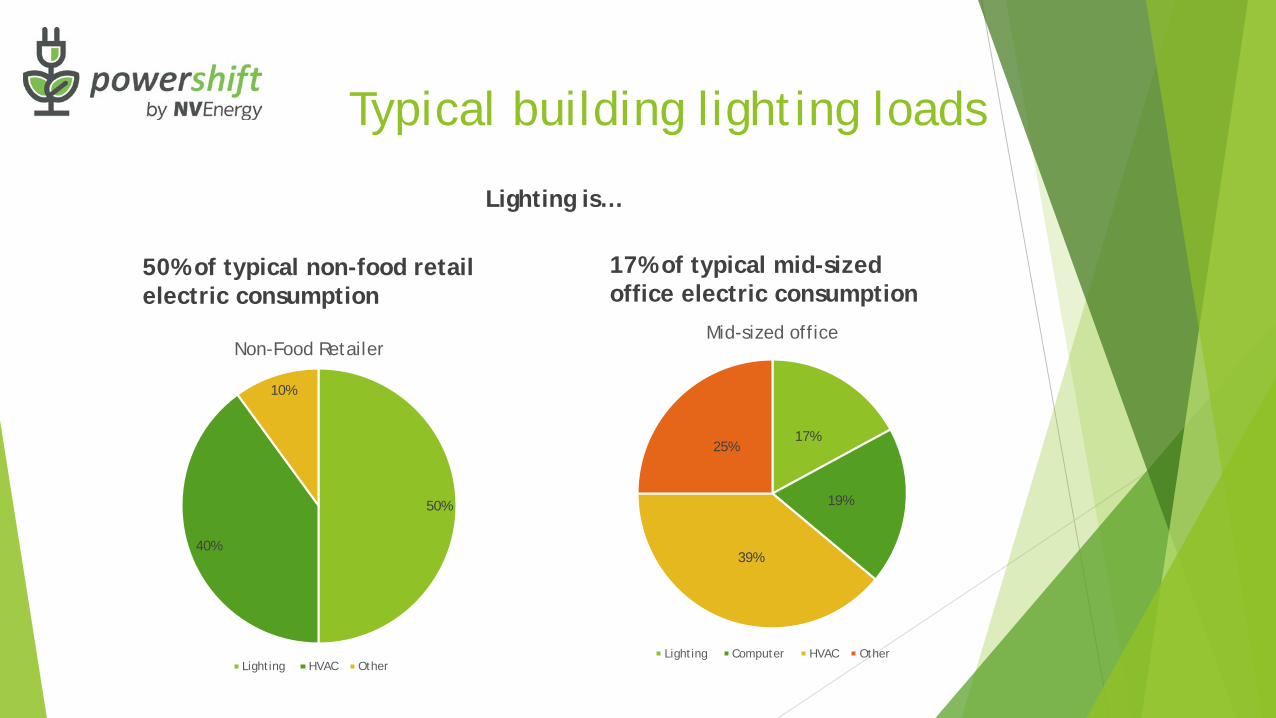
Typical building lighting loads
Lighting is…
50% of typical non-food retail electric consumption
17% of typical mid-sized office electric consumption
50%
40%
10%
Non-Food Retailer
Lighting HVAC Other
17%
19%
39%
25%
Mid-sized office
Lighting Computer HVAC Other
13
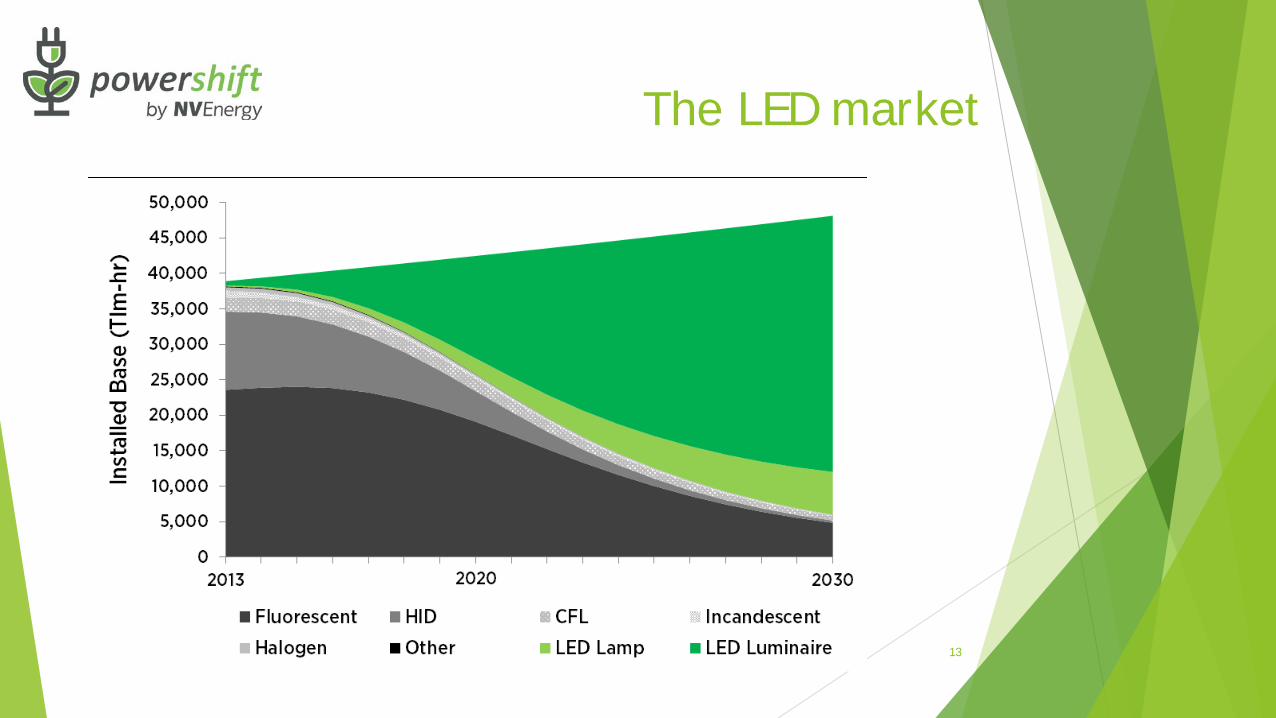
The LED market
Lighting incentives for both New Construction and Retrofit projects
Incentives for both indoor and exterior lighting applications
Higher incentive amounts for installing LED and lighting controls
Program information and applications can be found at: https://www.nvenergy.com/save-with-powershift/commercial-energy-services
14
NV Energy incentives

15
Questions?
16
Lighting fundamentals
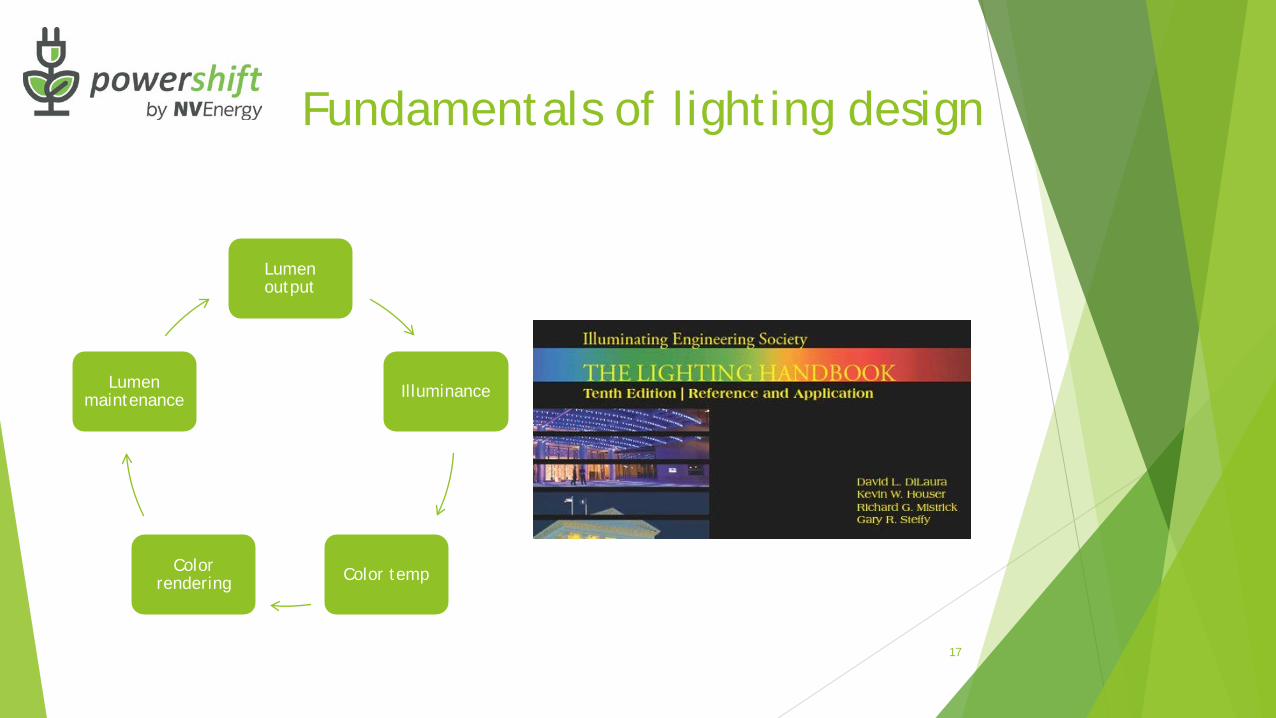
Lumen output
Illuminance
Color tempColor rendering
Lumen maintenance
17
Fundamentals of lighting design
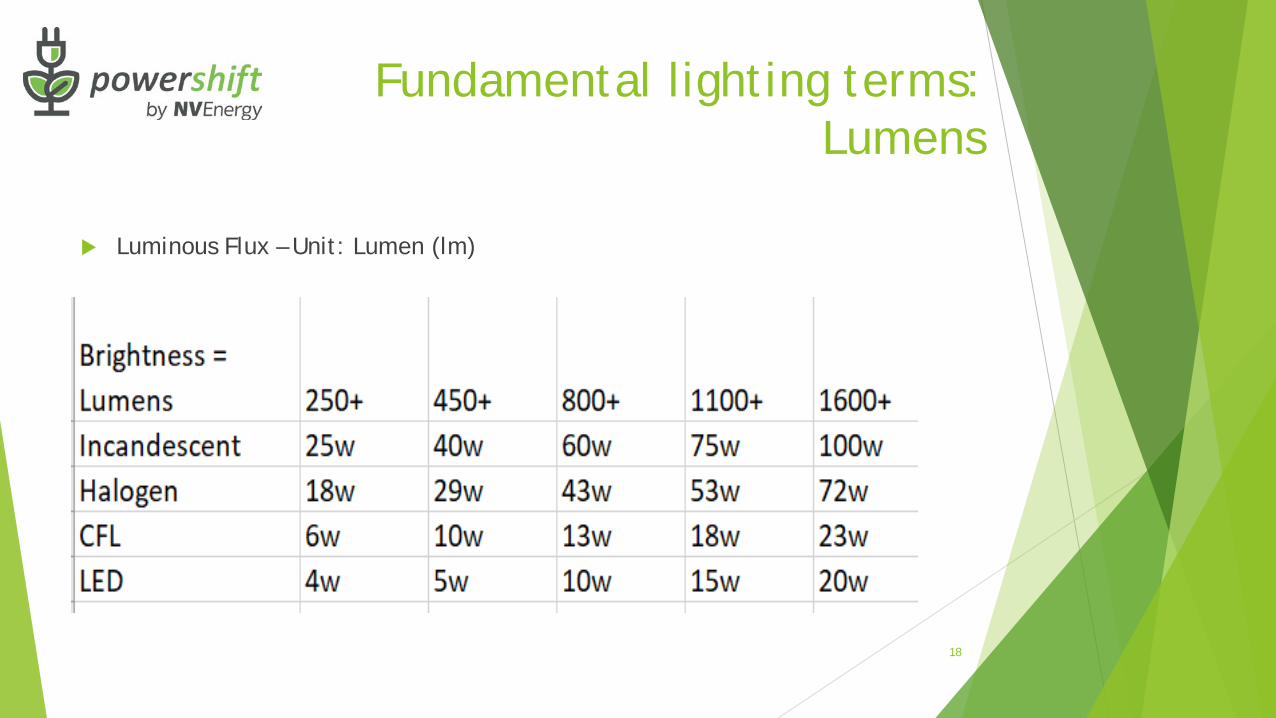
Luminous Flux – Unit: Lumen (lm)
18
Fundamental lighting terms: Lumens
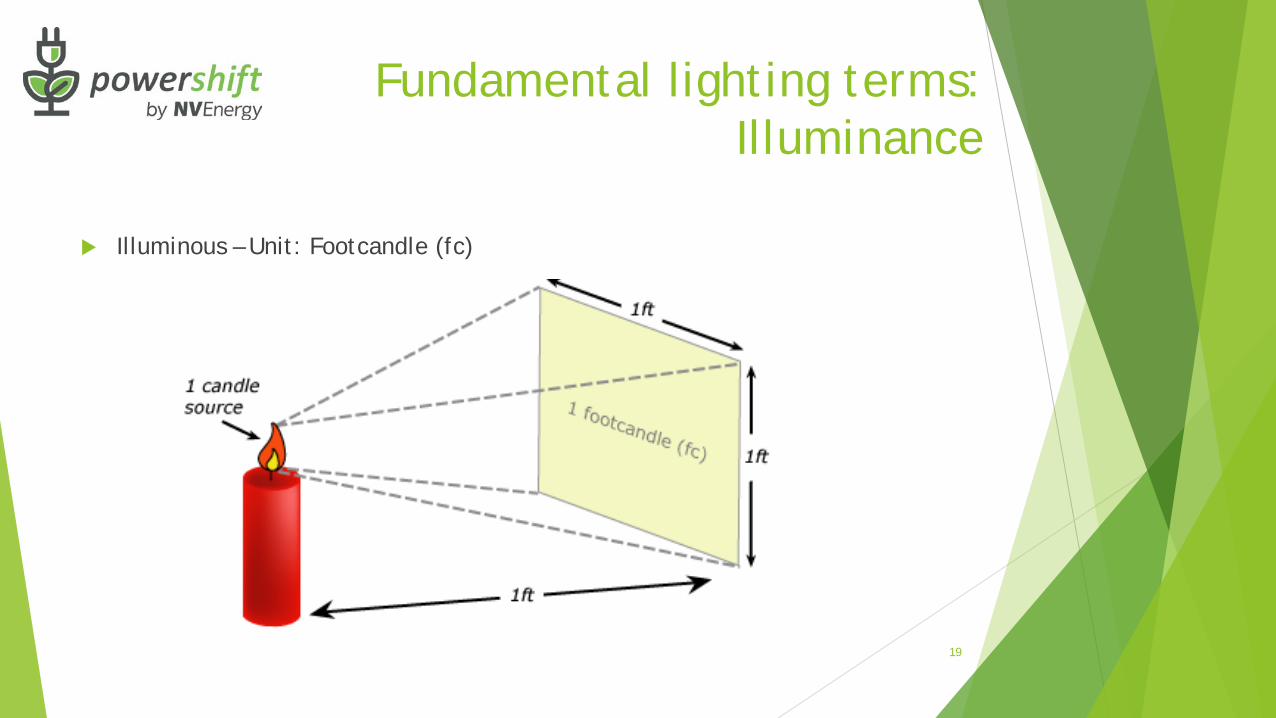
Illuminous – Unit: Footcandle (fc)
19
Fundamental lighting terms: Illuminance
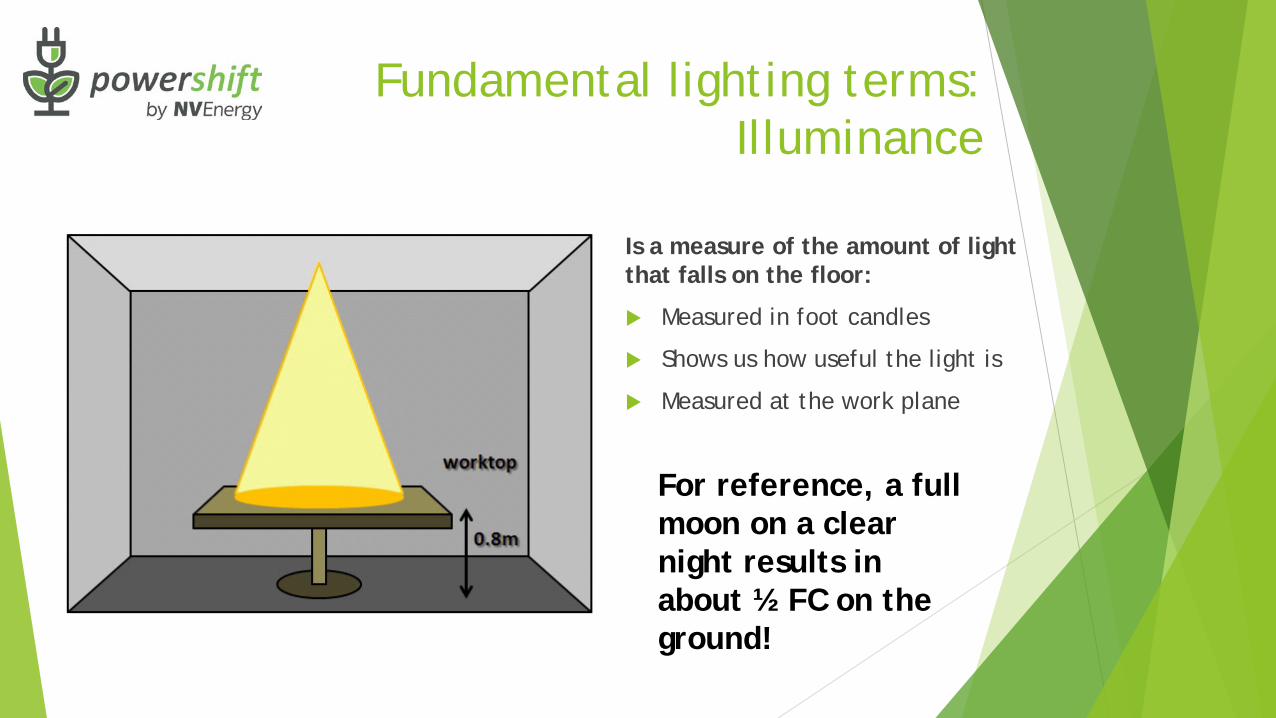
Fundamental lighting terms: Illuminance
Is a measure of the amount of light that falls on the floor:
Measured in foot candles
Shows us how useful the light is
Measured at the work plane
For reference, a full moon on a clear night results in about ½ FC on the ground!
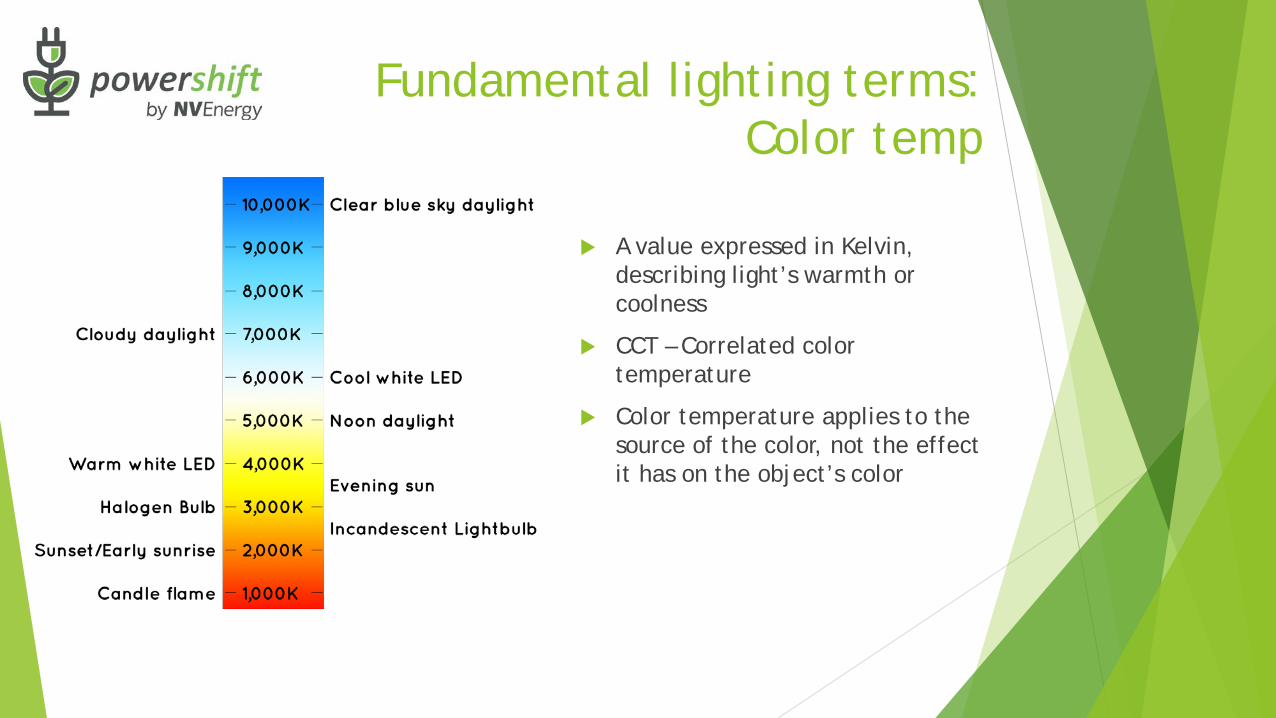
A value expressed in Kelvin, describing light’s warmth or coolness
CCT – Correlated colortemperature
Color temperature applies to the source of the color, not the effect it has on the object’s color
Fundamental lighting terms: Color temp
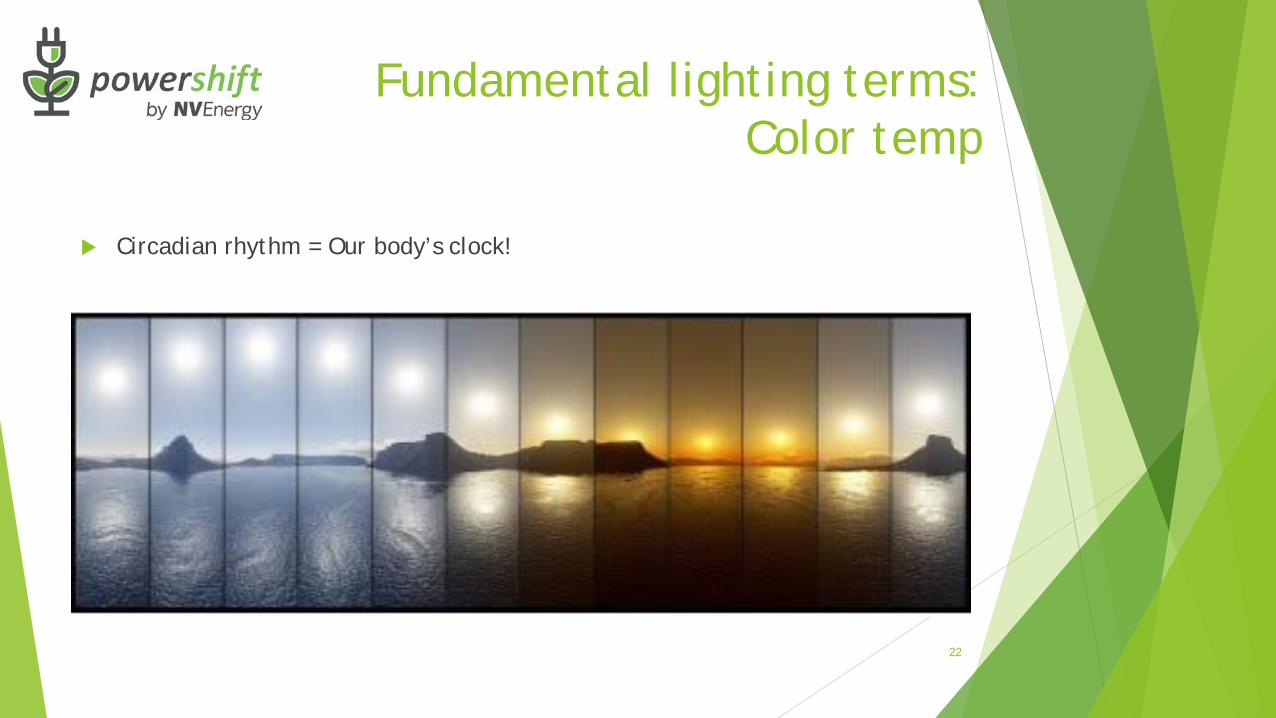
Circadian rhythm = Our body’s clock!
22
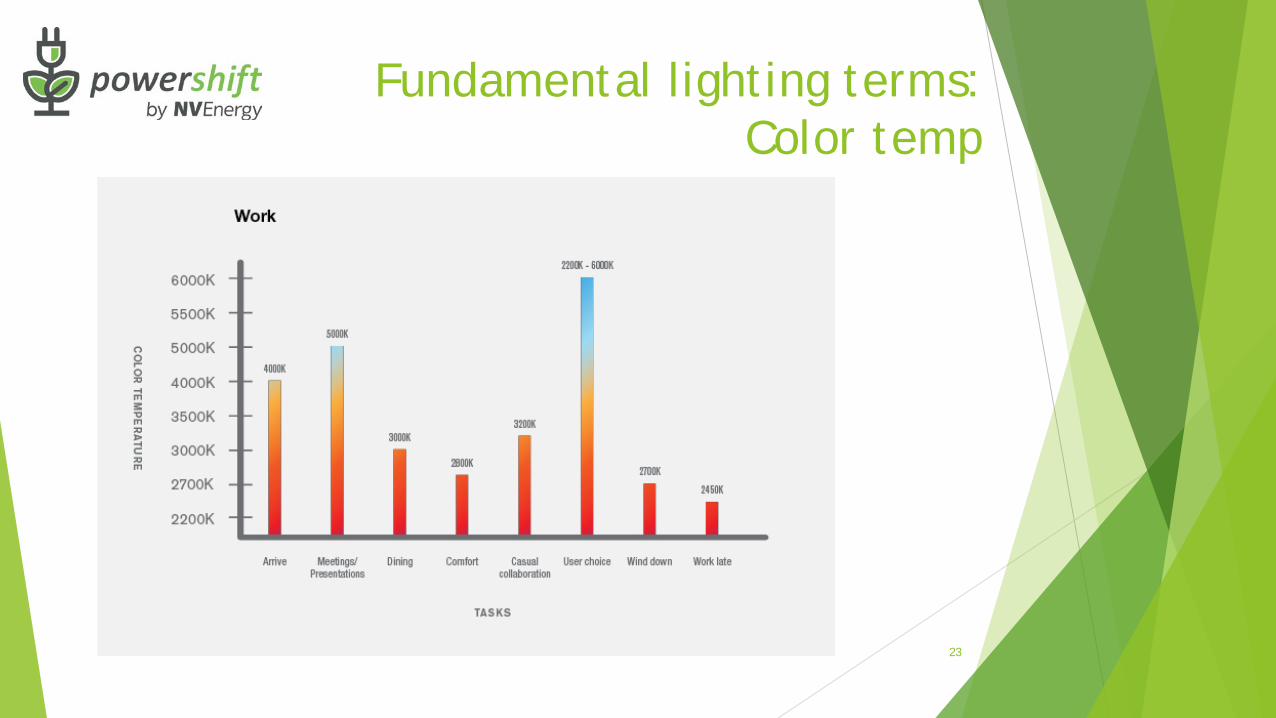
Fundamental lighting terms: Color temp
23
Fundamental lighting terms: Color temp
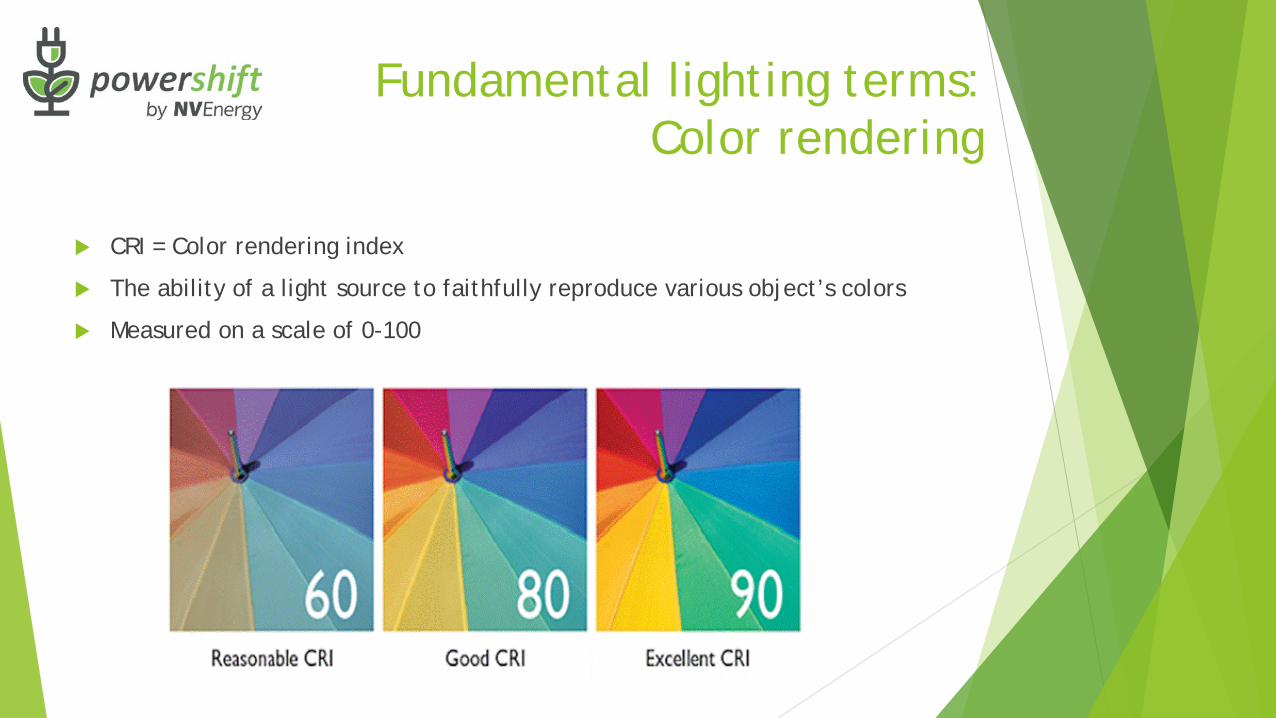
CRI = Color rendering index
The ability of a light source to faithfully reproduce various object’s colors
Measured on a scale of 0-100
Fundamental lighting terms: Color rendering
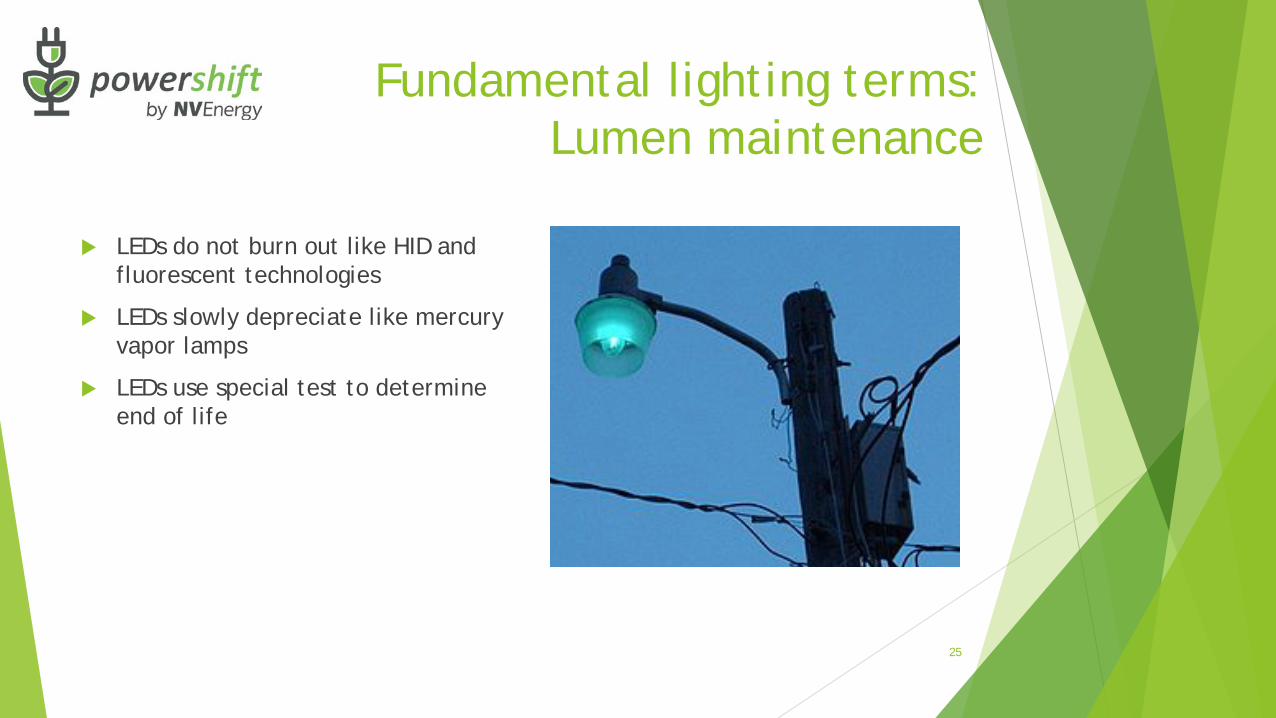
LEDs do not burn out like HID and fluorescent technologies
LEDs slowly depreciate like mercury vapor lamps
LEDs use special test to determine end of life
25
Fundamental lighting terms: Lumen maintenance
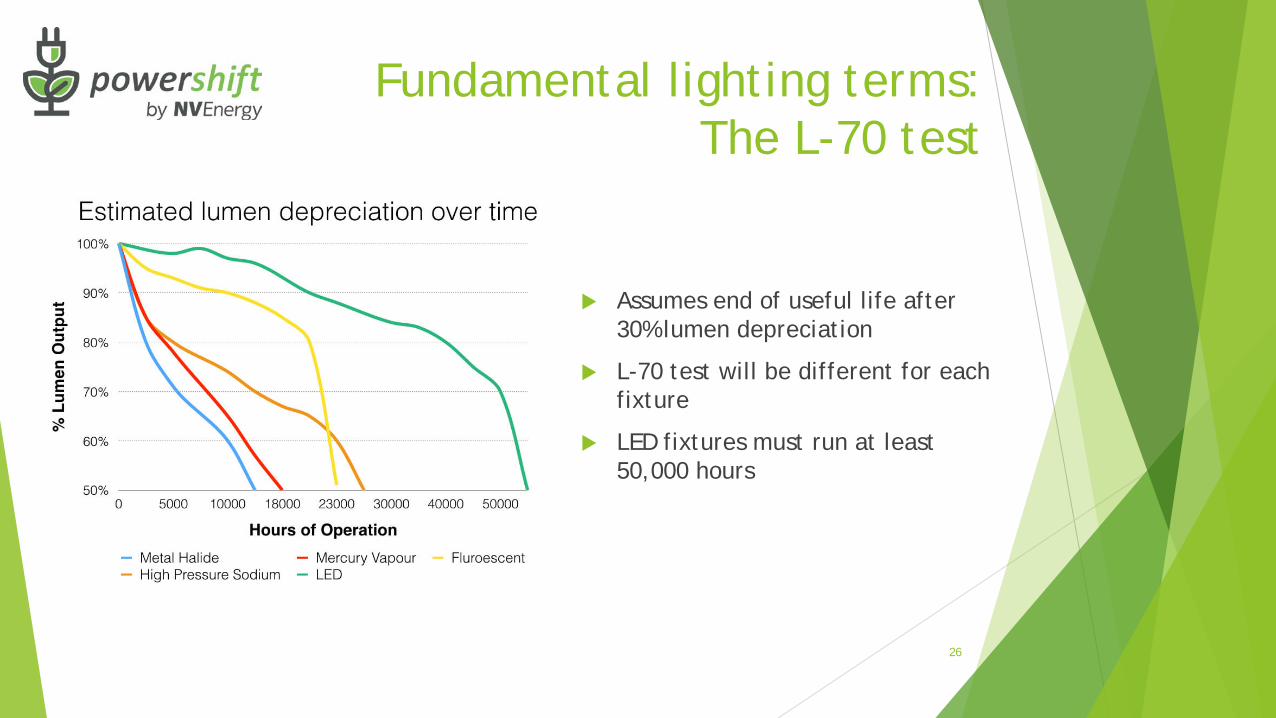
Assumes end of useful life after 30% lumen depreciation
L-70 test will be different for each fixture
LED fixtures must run at least 50,000 hours
26
Fundamental lighting terms: The L-70 test
27
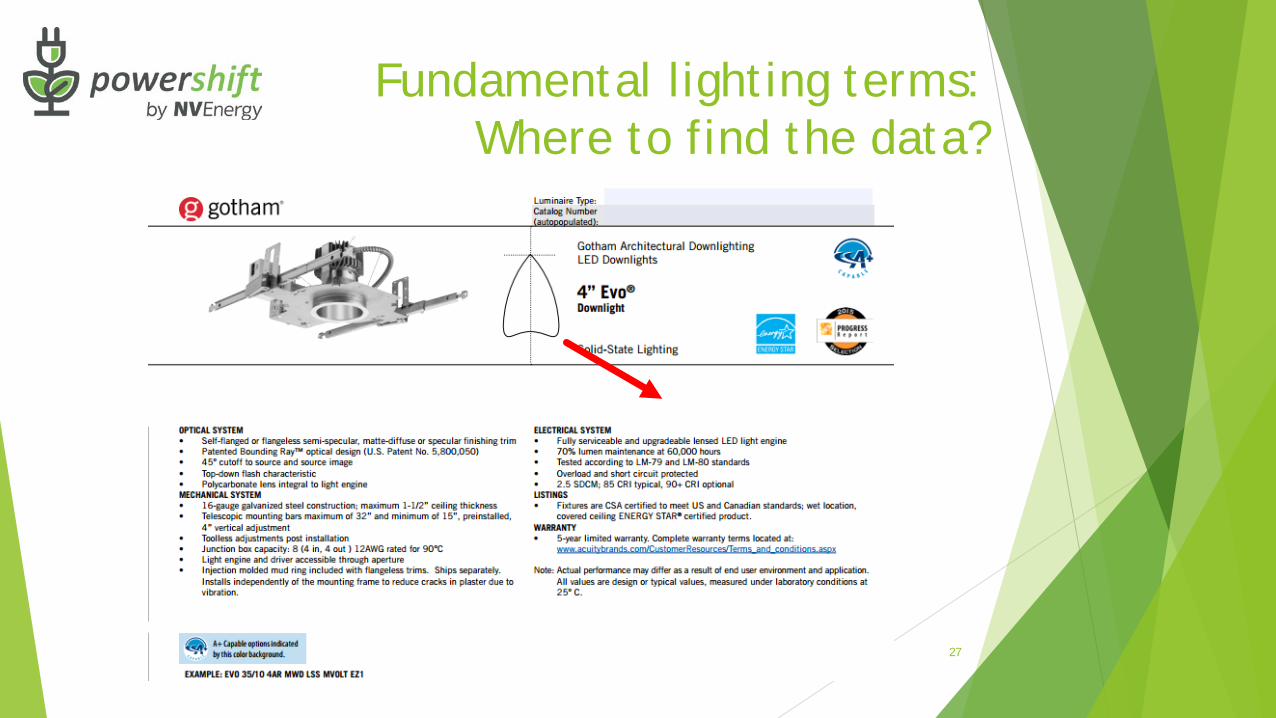
Fundamental lighting terms: Where to find the data?
28
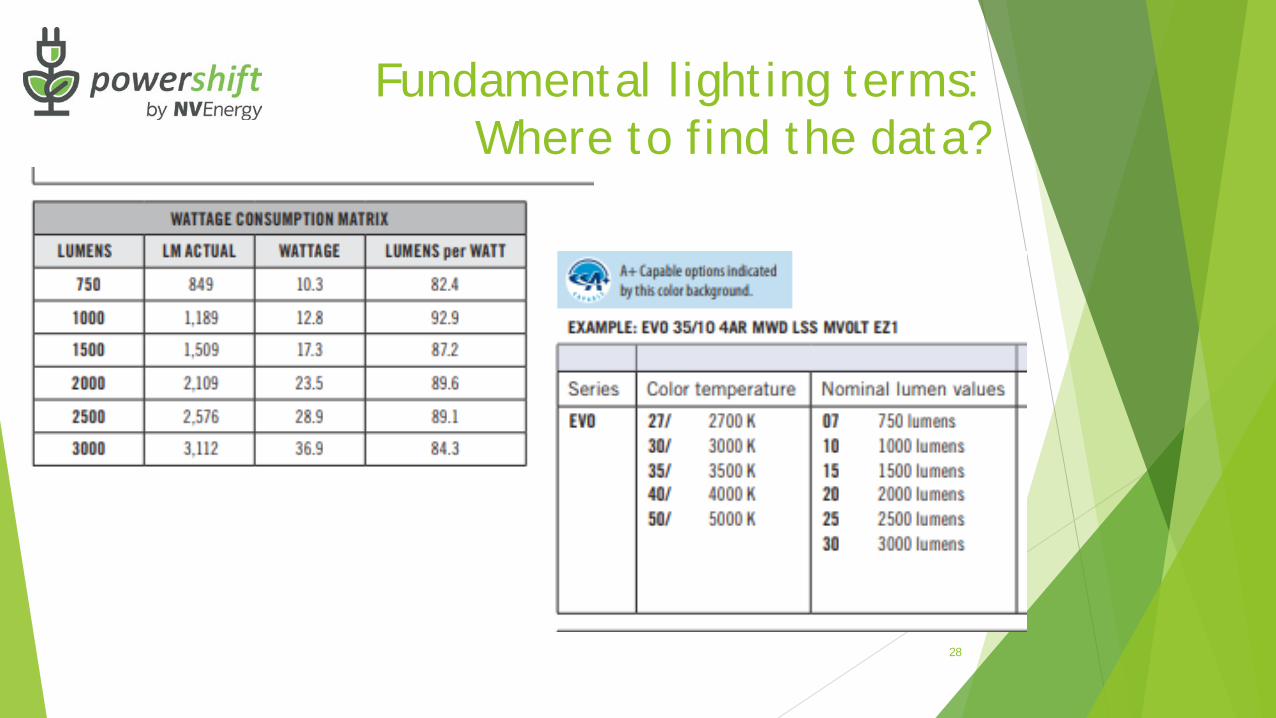
Fundamental lighting terms: Where to find the data?
Uses ASHRAE 90.1 2007
LPD of less than 1w/ft2
Means LED can have a real impact
We cover this more in sample project
29
State energy code: Nevada

Basics of LED technology and economics
30

LED
31
What makes LEDs better?
Lower Costs
EnvironmentalLower Maintenance
Controllable
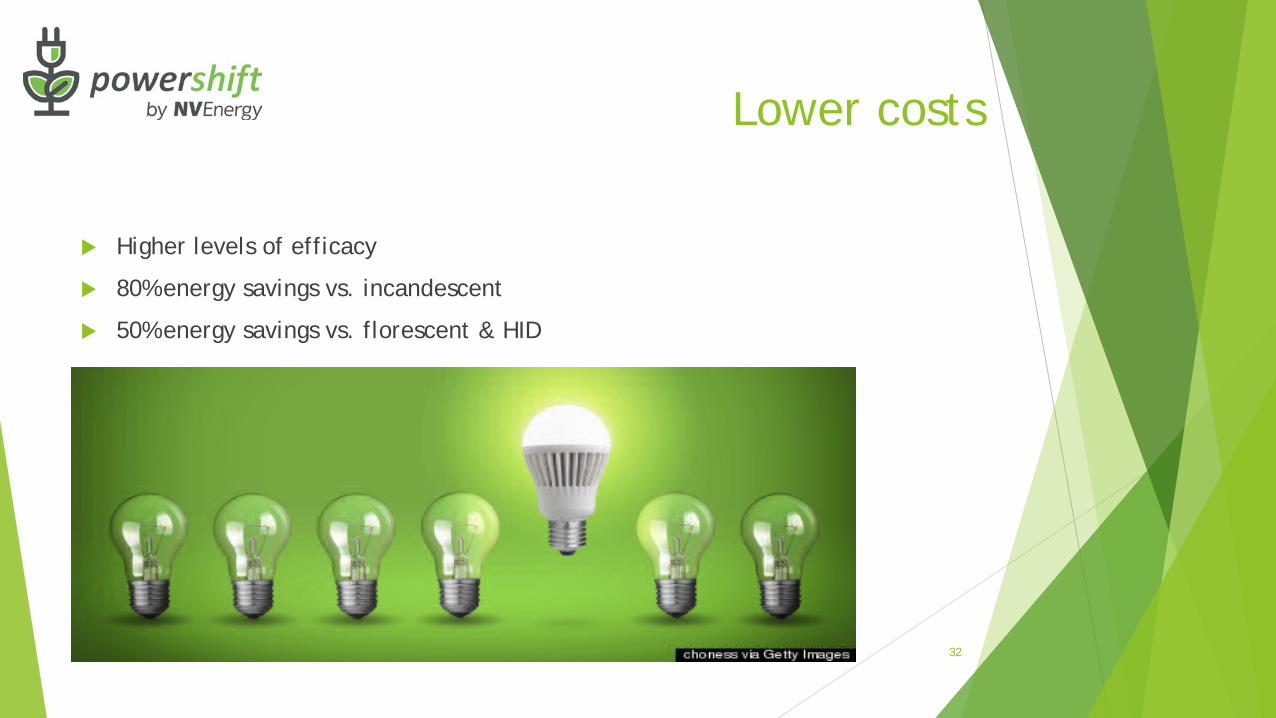
Higher levels of efficacy
80% energy savings vs. incandescent
50% energy savings vs. florescent & HID
32
Lower costs
LEDs do not contain mercury!
33
Environmentally friendly
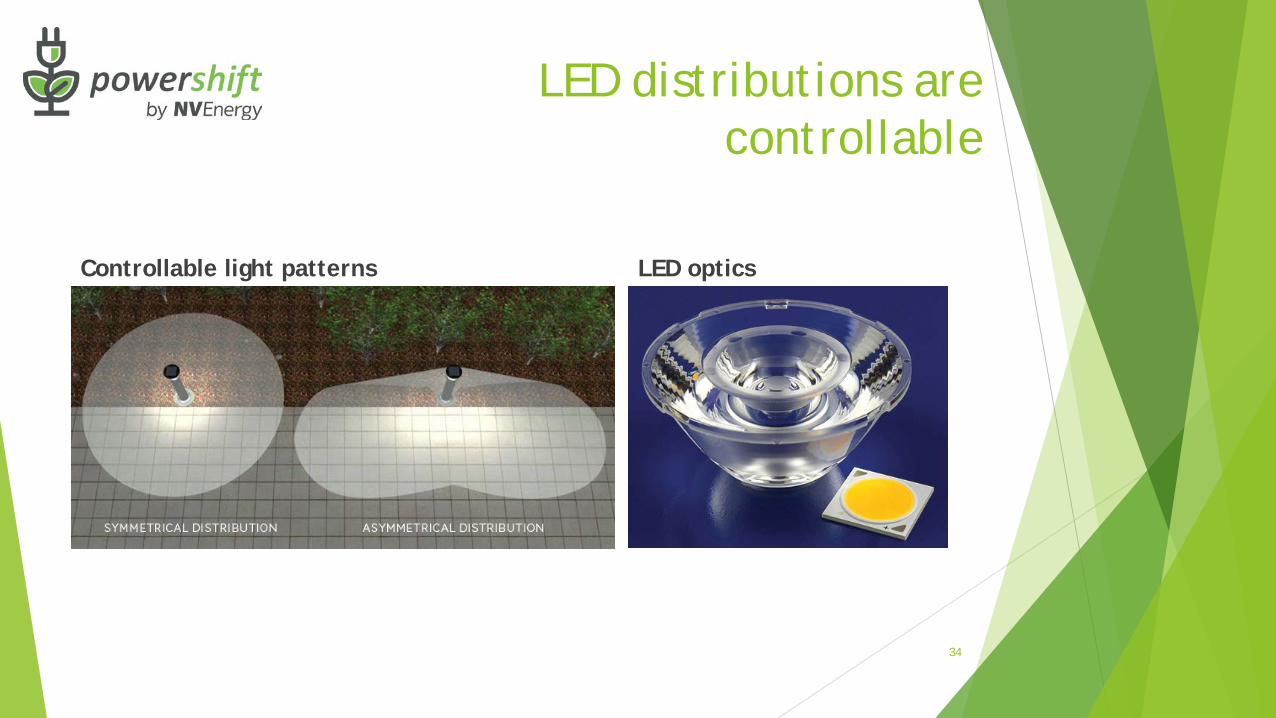
Controllable light patterns LED optics
34
LED distributions are controllable
Dimming out of the box
Extends life of fixture / lamp
Saves energy
More personal control over private spaces
Automation of shared spaces
35
LED electrical loads are controllable
36
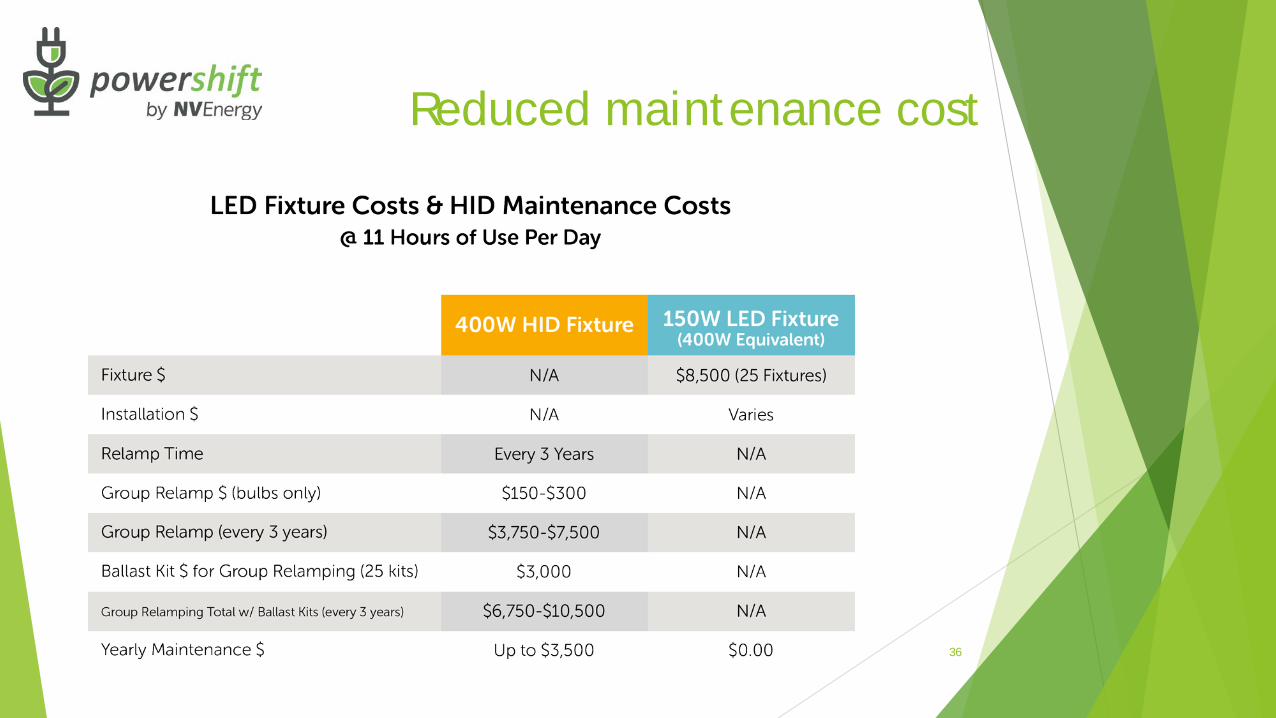
Reduced maintenance cost
Reduced maintenance cost
Lower scrap rates
Increased worker productivity
Improved indoor environment
Enhanced safety
Reduced noise
Increased convenience
Improved process control
Access to real time occupancy data
Asset tracking
Improved space utilization
Geolocation/positioning
37
Non-energy benefits

Sample project
38
Number of existing fixtures Input wattage of existing fixtures Existing Illuminance and LPD Number of new fixtures Input wattage of new fixtures New Illuminance and LPD Cost of new fixture Cost of electricity (kWh) Run hours per day Run days per year Cost to borrow capital (to calculate NPV) Utility incentive
Simple payback
Simple ROI
Net present value (NPV)
Internal rate of return (IRR)
39
Sample project with NVE incentive
What we need to know What we can produce
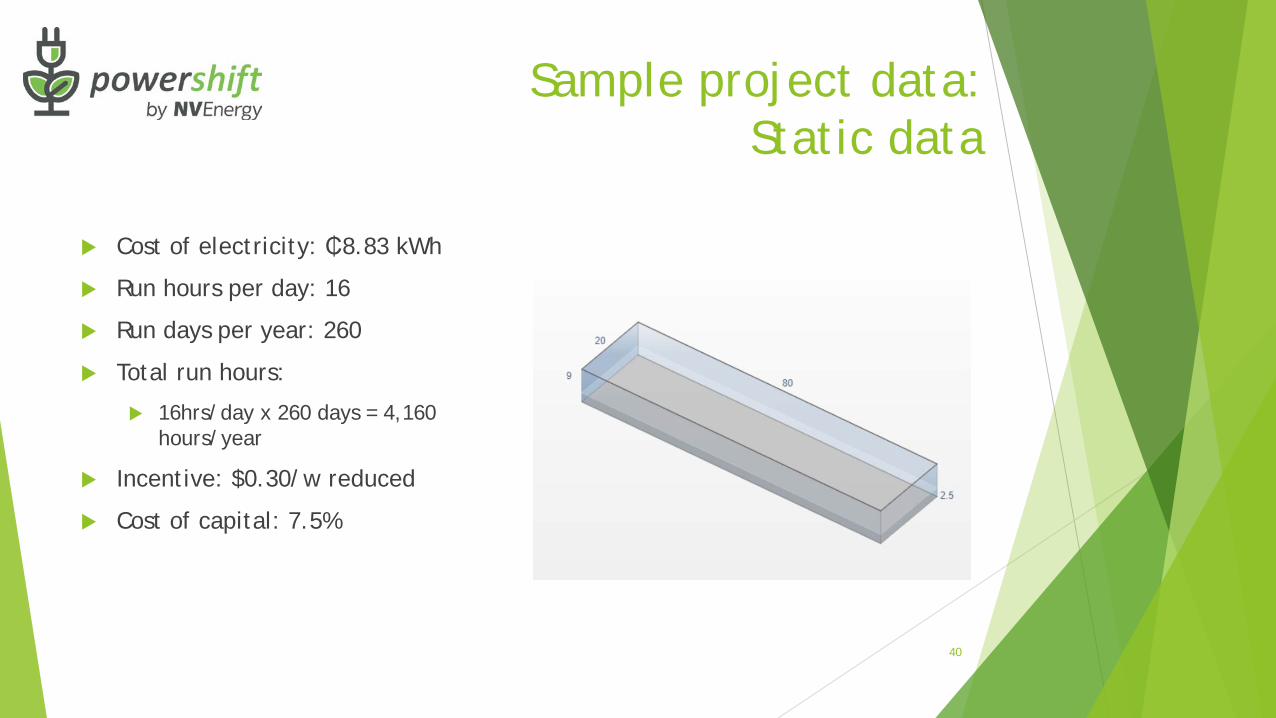
Cost of electricity: ₵8.83 kWh
Run hours per day: 16
Run days per year: 260
Total run hours:
16hrs/day x 260 days = 4,160 hours/year
Incentive: $0.30/w reduced
Cost of capital: 7.5%
40
Sample project data: Static data
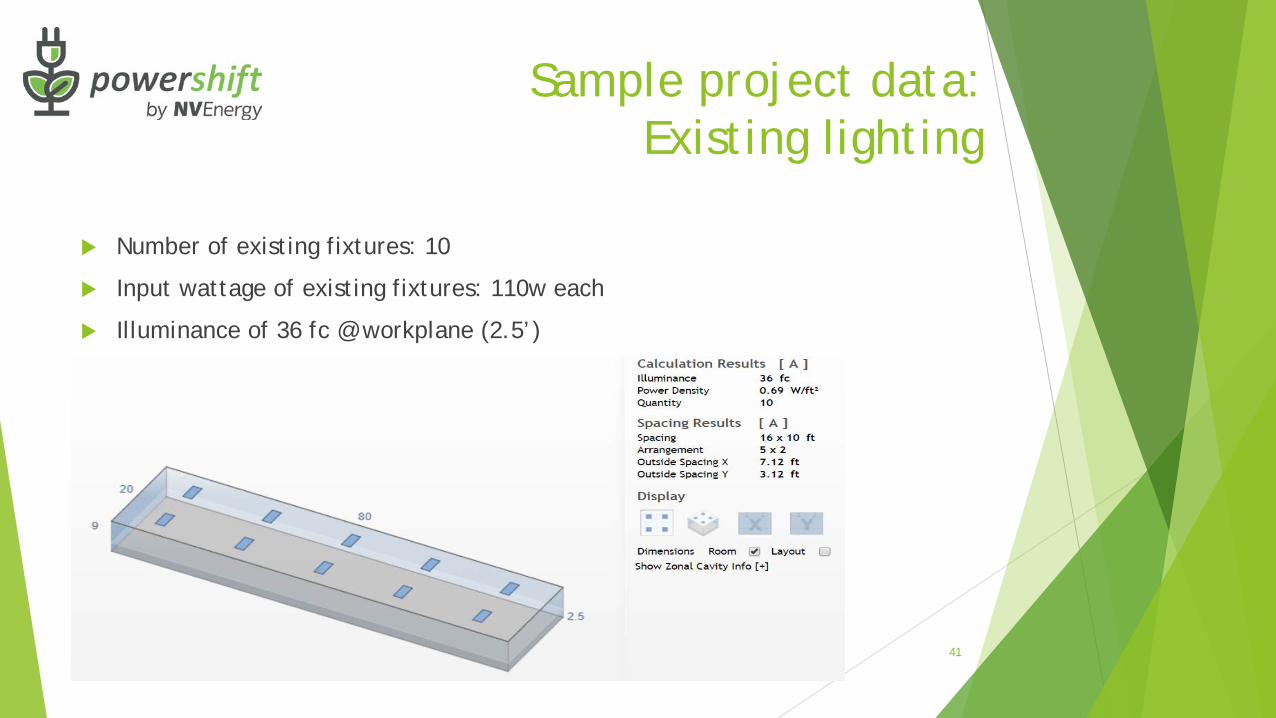
Number of existing fixtures: 10
Input wattage of existing fixtures: 110w each
Illuminance of 36 fc @ workplane (2.5’)
LPD = .7w/ft2
41
Sample project data: Existing lighting
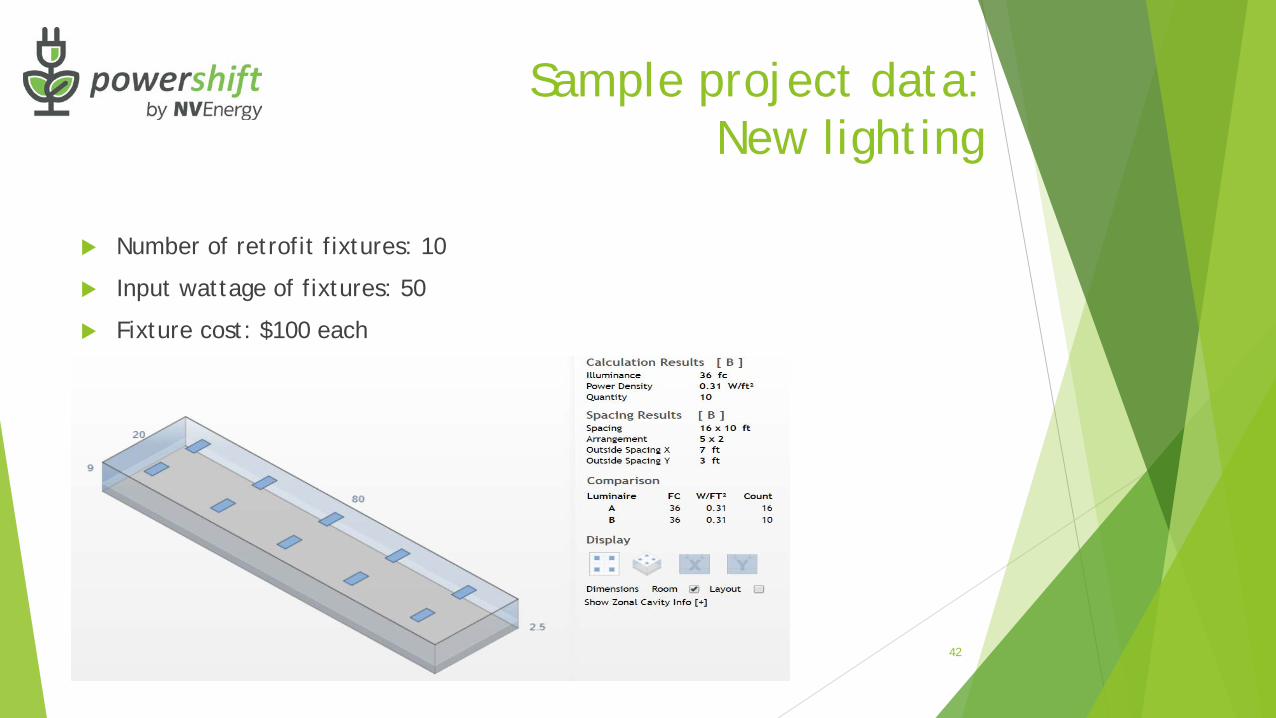
Number of retrofit fixtures: 10
Input wattage of fixtures: 50
Fixture cost: $100 each
Illuminance of 36 fc @ workplane (2.5’’)
LPD = .3w/ft2
42
Sample project data: New lighting
Number of fixtures (10) x input wattage of fixture (110) = 1100W
Total wattage draw (1100w) x run hours per day (16) = 17,600Wh/day
Total watts/day (17,600) / 1000 (kWh) = 17.6 kWh/day
kWh per day x days operated per year = 4,576 kWh/year
Yearly kWh usage (4,576) x cost of electricity ($.0883) = $404/year
43
Step 1: Determine current operating cost
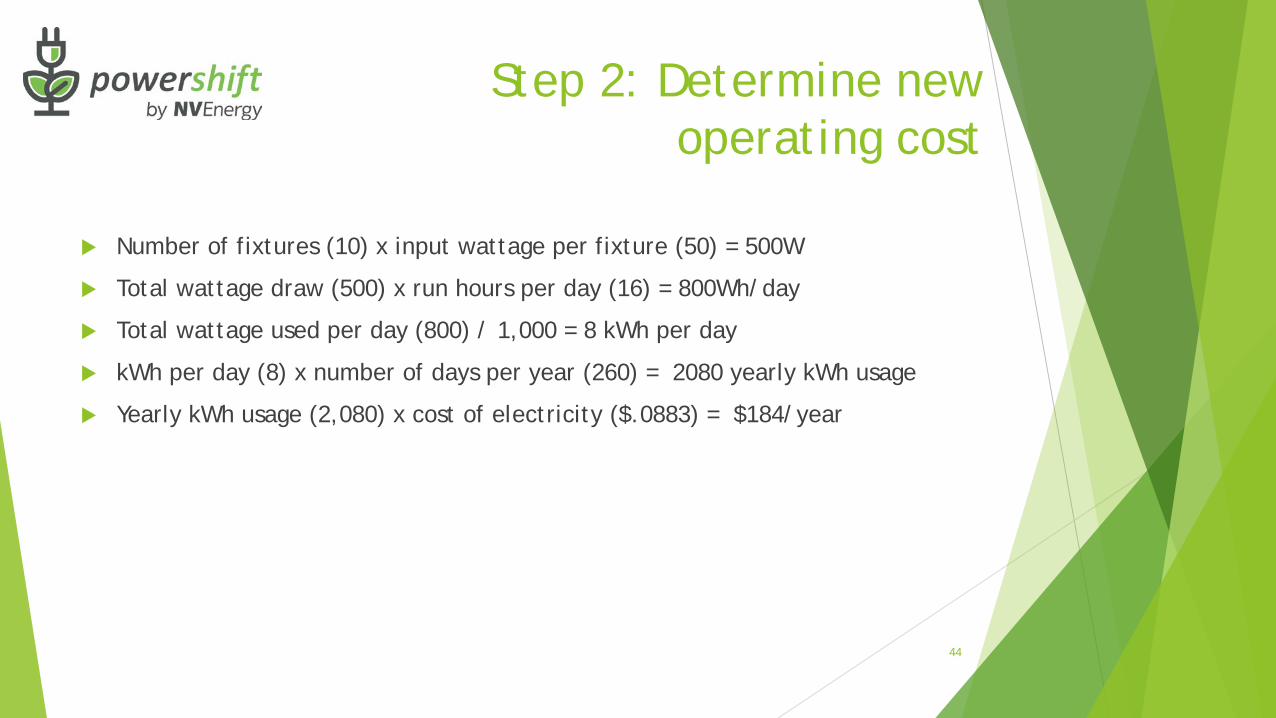
Number of fixtures (10) x input wattage per fixture (50) = 500W
Total wattage draw (500) x run hours per day (16) = 800Wh/day
Total wattage used per day (800) / 1,000 = 8 kWh per day
kWh per day (8) x number of days per year (260) = 2080 yearly kWh usage
Yearly kWh usage (2,080) x cost of electricity ($.0883) = $184/year
44
Step 2: Determine new operating cost
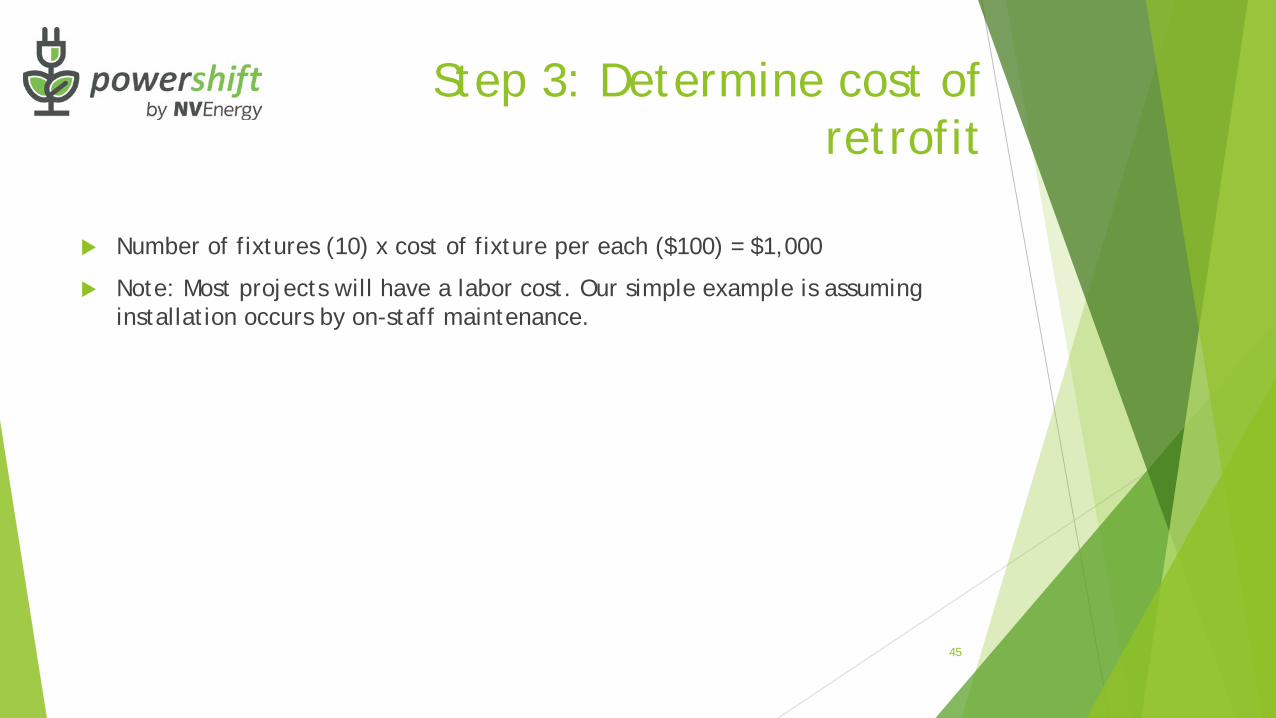
Number of fixtures (10) x cost of fixture per each ($100) = $1,000
Note: Most projects will have a labor cost. Our simple example is assuming installation occurs by on-staff maintenance.
45
Step 3: Determine cost of retrofit
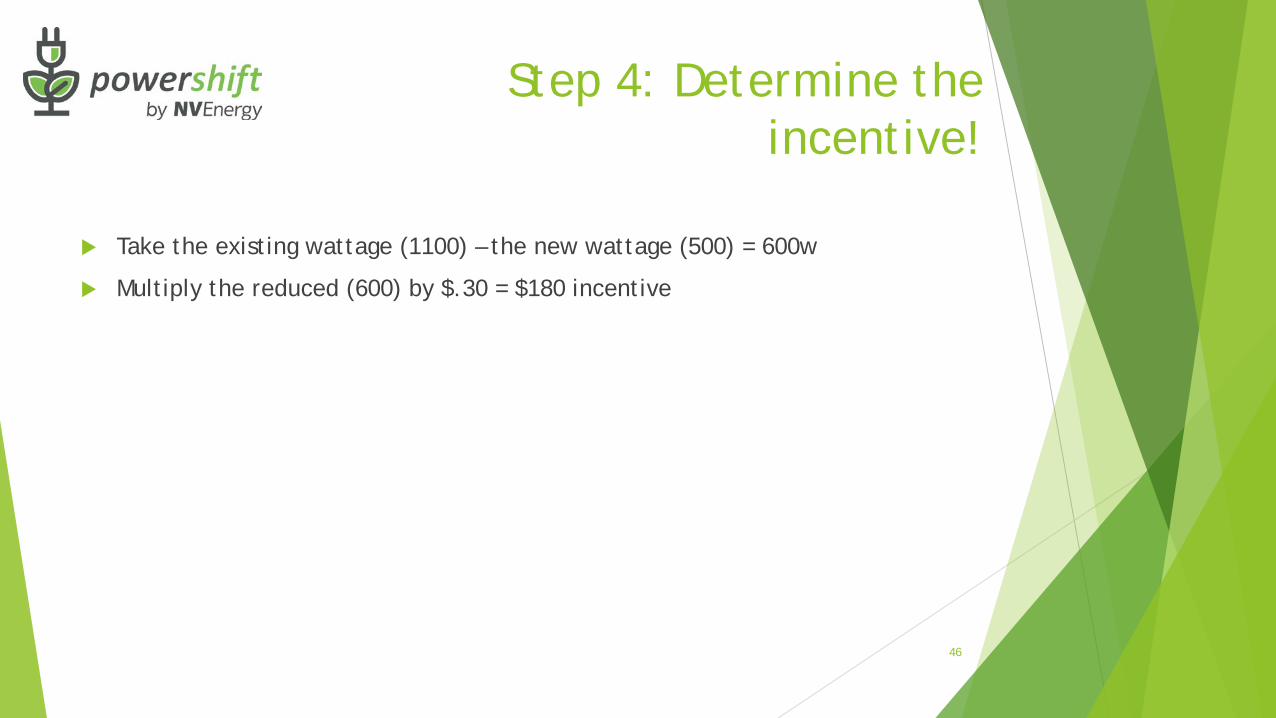
Take the existing wattage (1100) – the new wattage (500) = 600w
Multiply the reduced (600) by $.30 = $180 incentive
46
Step 4: Determine the incentive!
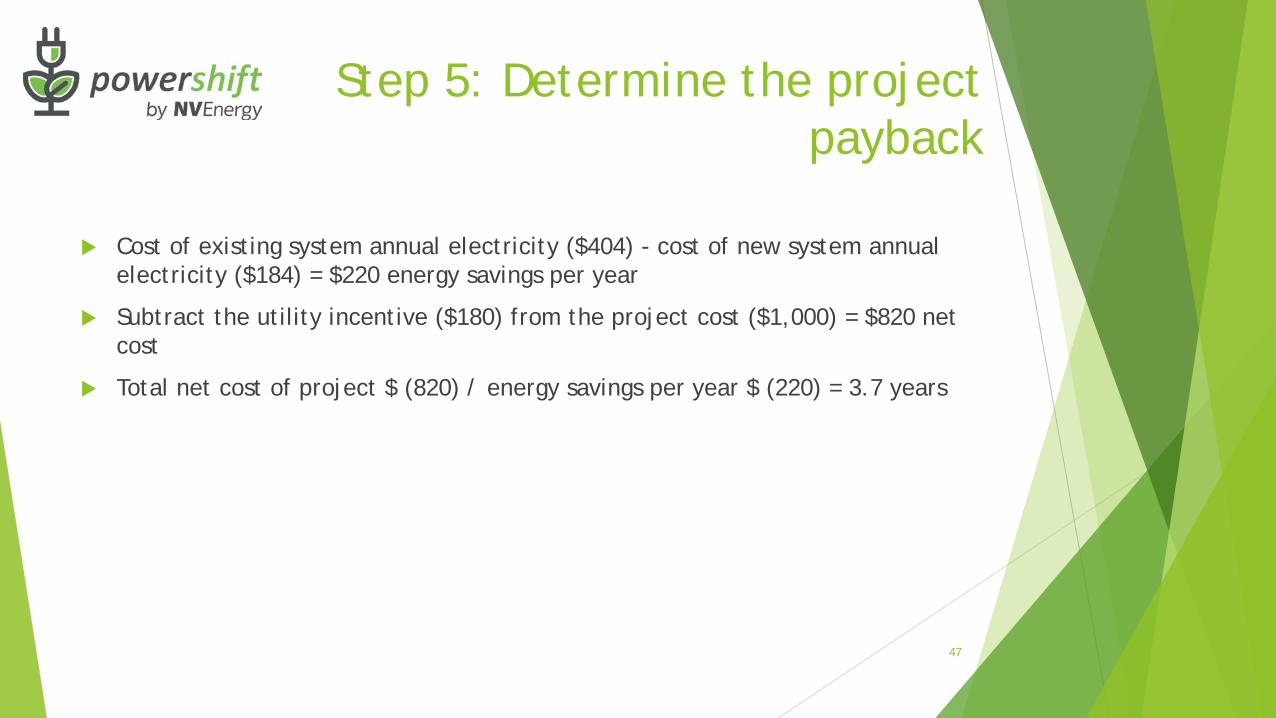
Cost of existing system annual electricity ($404) - cost of new system annual electricity ($184) = $220 energy savings per year
Subtract the utility incentive ($180) from the project cost ($1,000) = $820 net cost
Total net cost of project $ (820) / energy savings per year $ (220) = 3.7 years
47
Step 5: Determine the project payback
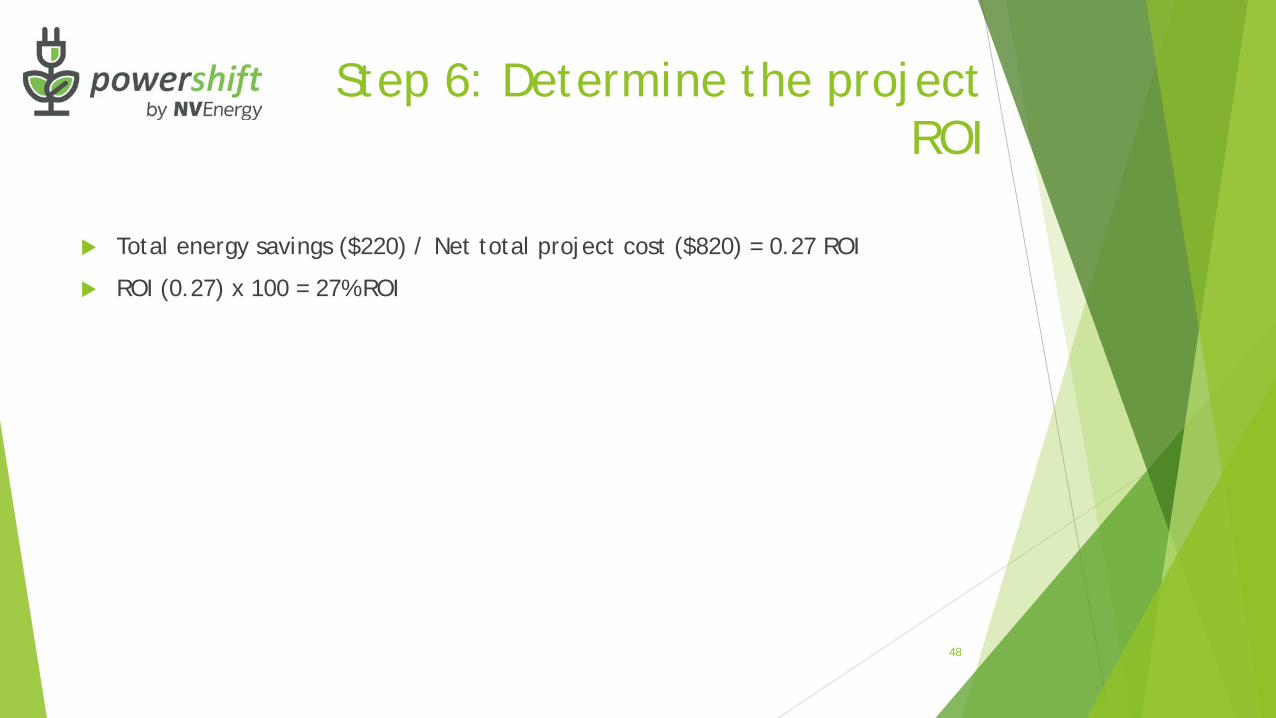
Total energy savings ($220) / Net total project cost ($820) = 0.27 ROI
ROI (0.27) x 100 = 27% ROI
48
Step 6: Determine the project ROI
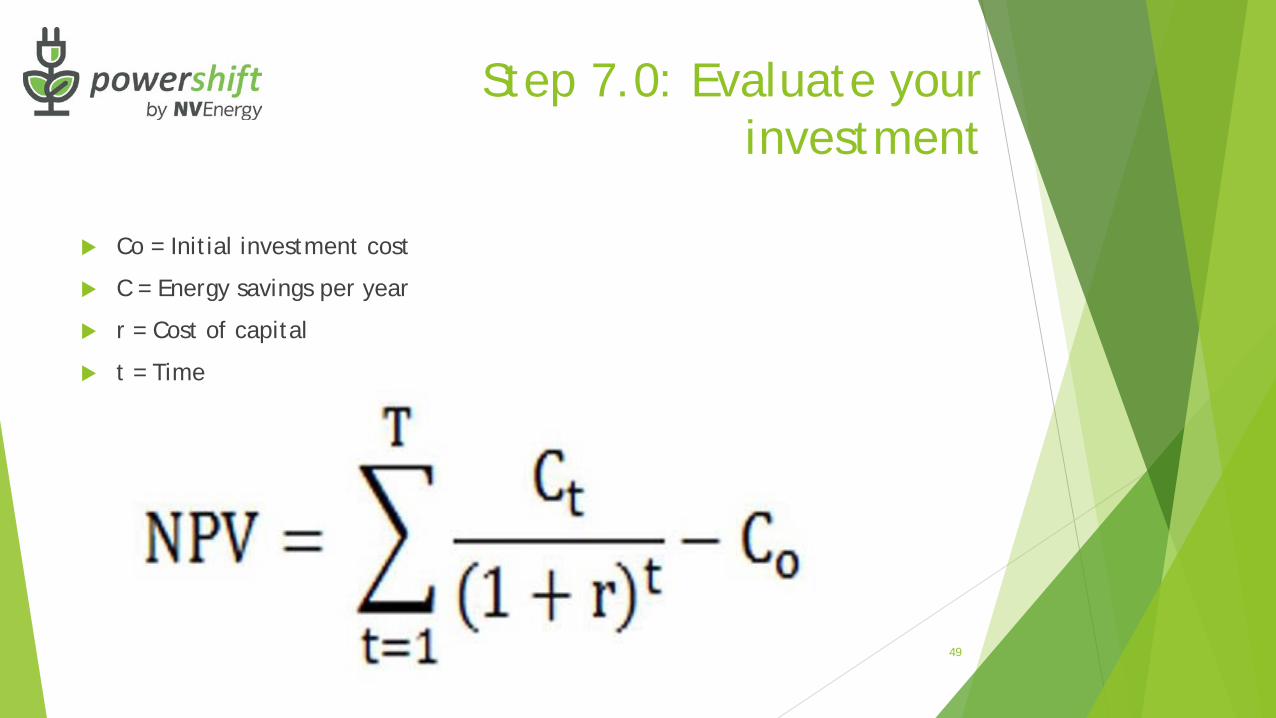
Co = Initial investment cost
C = Energy savings per year
r = Cost of capital
t = Time
49
Step 7.0: Evaluate your investment
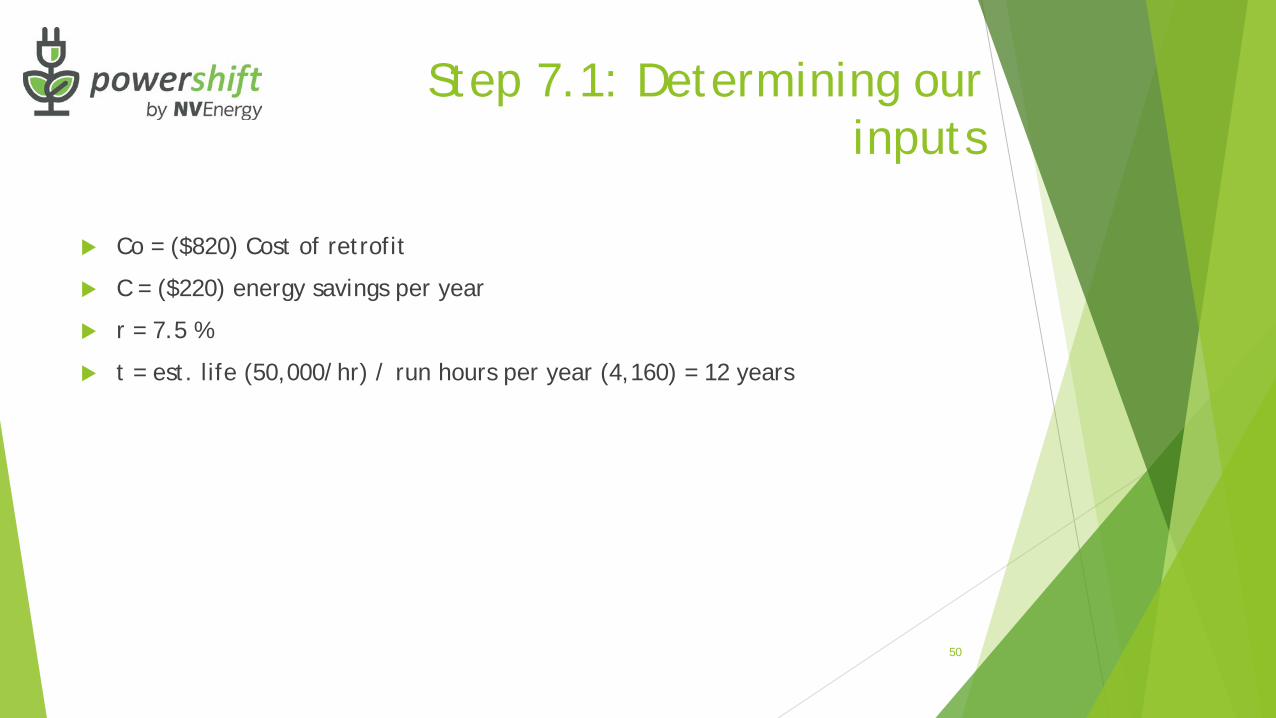
Co = ($820) Cost of retrofit
C = ($220) energy savings per year
r = 7.5 %
t = est. life (50,000/hr) / run hours per year (4,160) = 12 years
50
Step 7.1: Determining our inputs
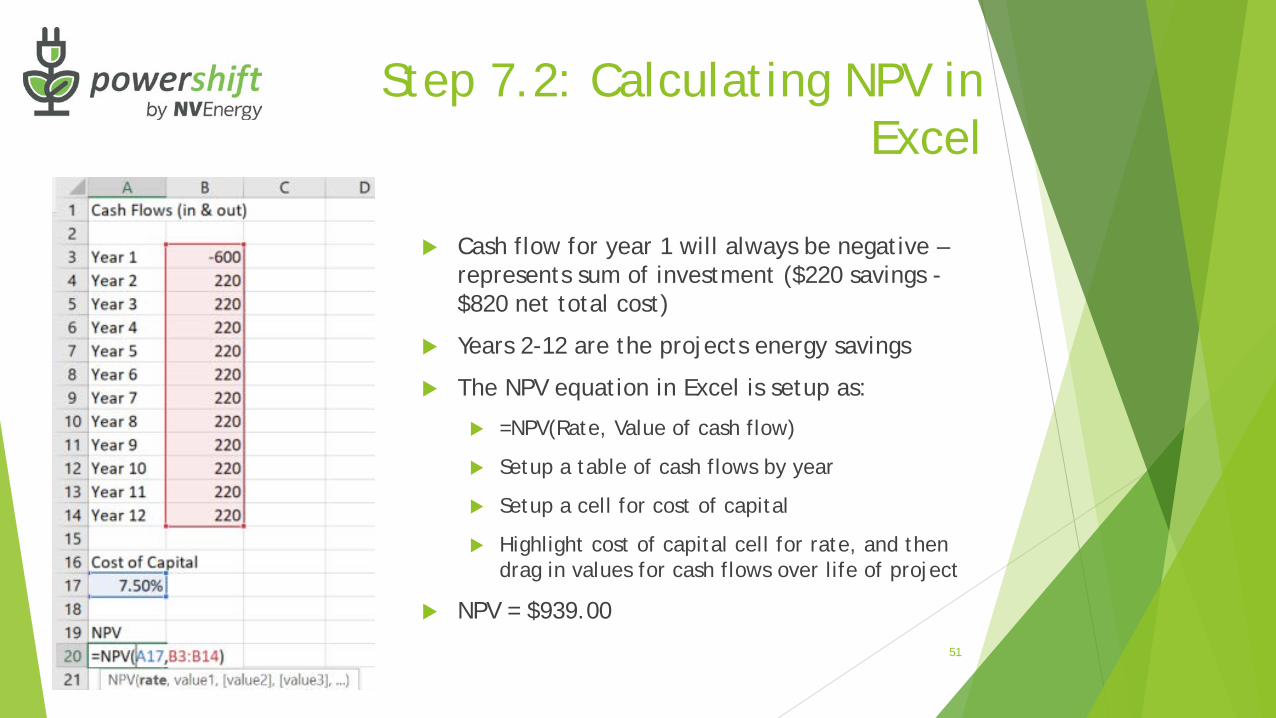
Cash flow for year 1 will always be negative –represents sum of investment ($220 savings -$820 net total cost)
Years 2-12 are the projects energy savings
The NPV equation in Excel is setup as:
=NPV(Rate, Value of cash flow)
Setup a table of cash flows by year
Setup a cell for cost of capital
Highlight cost of capital cell for rate, and then drag in values for cash flows over life of project
NPV = $939.00
51
Step 7.2: Calculating NPV in Excel
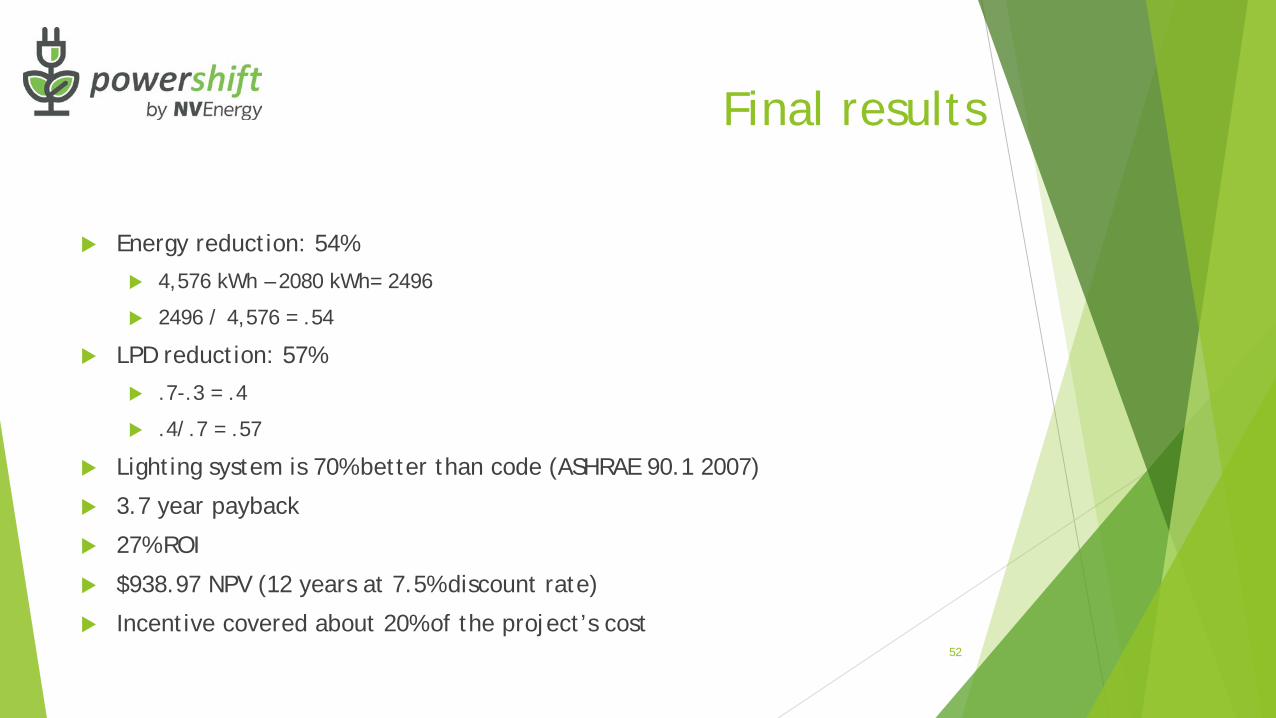
Energy reduction: 54% 4,576 kWh – 2080 kWh= 2496
2496 / 4,576 = .54
LPD reduction: 57% .7-.3 = .4
.4/.7 = .57
Lighting system is 70% better than code (ASHRAE 90.1 2007)
3.7 year payback
27% ROI
$938.97 NPV (12 years at 7.5% discount rate)
Incentive covered about 20% of the project’s cost 52
Final results

Any Questions?