Embed Size (px)
Citation preview

Lighting up Human Tissue to Detect Tumors
Asima Pradhan
Dept. Of Physics
& Centre for Laser Technology
Indian Institute of Technology, Kanpur REACH 2010gy, p REACH 2010IIT Kanpur10.10.10

Working of biological system is complicated
That the human body works with such precision as it does amazes scientistsThat the human body works with such precision as it does, amazes scientists even today when technology has advanced so much.
The precision lies at both macro-structural and micro-biochemical levels. At the micro level, the proteins occupy an important place in maintaining the functioning of cells and thus the entire system.
The basis of our research lies in extracting the molecular and subtle morphological characteristics of cancer.
Diagnosis of disease is increasingly becoming a technological task.
Cli i i ’ lClinician’s goal:
To access structural and functional changes in
diseased tissue.
Infer the identity and stage of disease.
Ultimate prognosis.

Some relevant statistics on cancer in India
Cancer cases: >25 lakh per year
Death rate 4 lakhs per year
#2 largest cause of mortality
Increasing at the rate of 11% peryear
Every day 2000 people gets affectedby mouth cancery
Highest cases:
Lung cancer in meng
Breast cancer in female
40% of total cancer deaths in
3
women: Breast and Cervical

X-ray computed tomographyIonizing radiation: harmful if used too often for routine screening.
Ultrasound
Lacks resolution to detect objects in sub millimeter scale. May not provide information about tissue chemistryinformation about tissue chemistry
• MRI: Sub millimeter spatial resolutionAbility to detect specific chemicalsCost of equipment makes its operation expensiveCost of equipment makes its operation expensive.
(Adverse effect of strong magnetic field on biological systems is still a topic of debate. People use 1.5 T to 3T)
•Pathology
This high power microscopic view demonstrates intraductal carcinoma. Neoplastic cells are still within the ductules and have not broken through into the
stroma. Note that the two large lobules in the center contain microcalcifications. Such microcalcifications can appear on mammography.
Pathology
provides the most widely used clinical method to obtain chemical information from diseased tissues.
Hi t l ( di i l h i ) b i i l l i d• Histology (traditional technique) probe microscopic structural alterations due to disease
Major drawback
• Can only be applied in-vitro and takes time.
Necessitates removal of tissue/biopsy hence a limited to probing small areas only.

OPTICAL SPECTROSCOPY AND IMAGING
• A non-invasive, • safe, ,• inexpensive, • compact techniquep q
capable of extracting diagnostically relevant structural and biochemical information is the need of hour!!!
• Diagnostics techniques based on optical spectroscopy offer such possibilities.p
• Fluorescence• Scattering
Ab i• Absorption
Essential to Study Essential to Study
Light Tissue InteractionLight Tissue Interaction
TISSUE OPTICSTISSUE OPTICS

Light-Tissue Interaction
Ab ti & S tt i
Elastic scattering Inelastic scattering
Absorption & Scattering
Tissue
Diagnostics
Imaging
Fluorescence & Raman
Diagnostics
Transmitted Light
7

Basic Aim: Detect Early Stages of Diseasei ti l tin particular, tumors
Increase in size of nucleus Changes in elastic scatteringg gCells packed
Increase in metabolic activity Biochemical changesIncrease in metabolic activity Biochemical changesIncrease in concentration of related bio-moleculesBond breaking (cross links) Fluorescence yield changes
Bonds change Raman scattering changes
Blood concentration changes Absorption changesGrowth of blood vessels
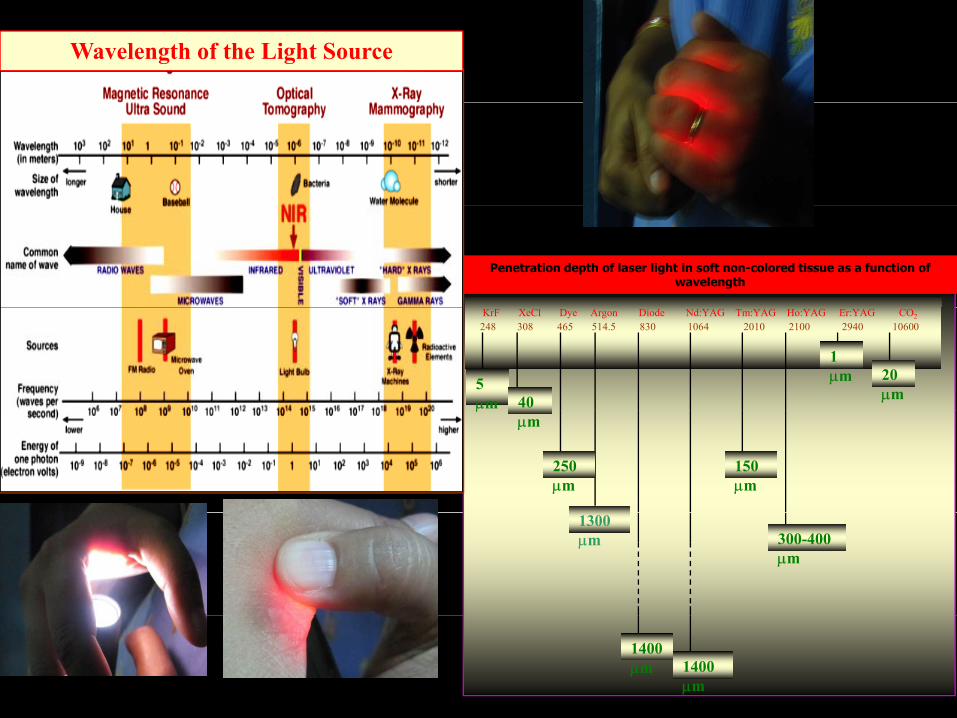
Wavelength of the Light Source
Penetration depth of laser light in soft non-colored tissue as a function of wavelength
KrF XeCl Dye Argon Diode Nd:YAG Tm:YAG Ho:YAG Er:YAG CO2248 308 465 514.5 830 1064 2010 2100 2940 10600
5 µm 40
20 µm
1 µm
µµm
250 µm
150 µm
1300 µm 300-400
µm
1400 µm 1400
µm

El ti tt i t d b
SCATTERING IN TISSUES
Elastic scattering events caused by
random spatial variations in density
refractive indexµs = 20-200 mm-1
refractive index
of extra cellular, cellular and sub cellular components.
Described by Mie theory: size ~ wavelength
Tissue scattering decreases monotonically with increasing wavelength
Change in scattering coefficient implies change in size/concentration.
Using LSS: Only morphological information
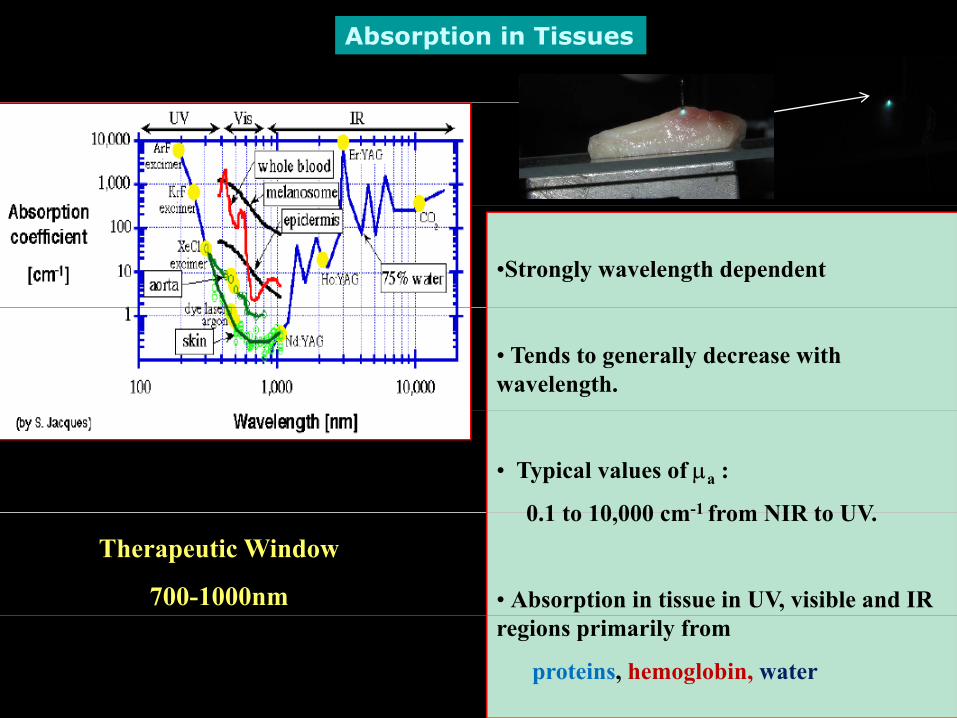
Absorption in Tissues
•Strongly wavelength dependent
• Tends to generally decrease with wavelength.
• Typical values of µa :
0 1 to 10 000 cm-1 from NIR to UV0.1 to 10,000 cm 1 from NIR to UV.
• Absorption in tissue in UV, visible and IR
Therapeutic Window
700-1000nmregions primarily from
proteins, hemoglobin, water
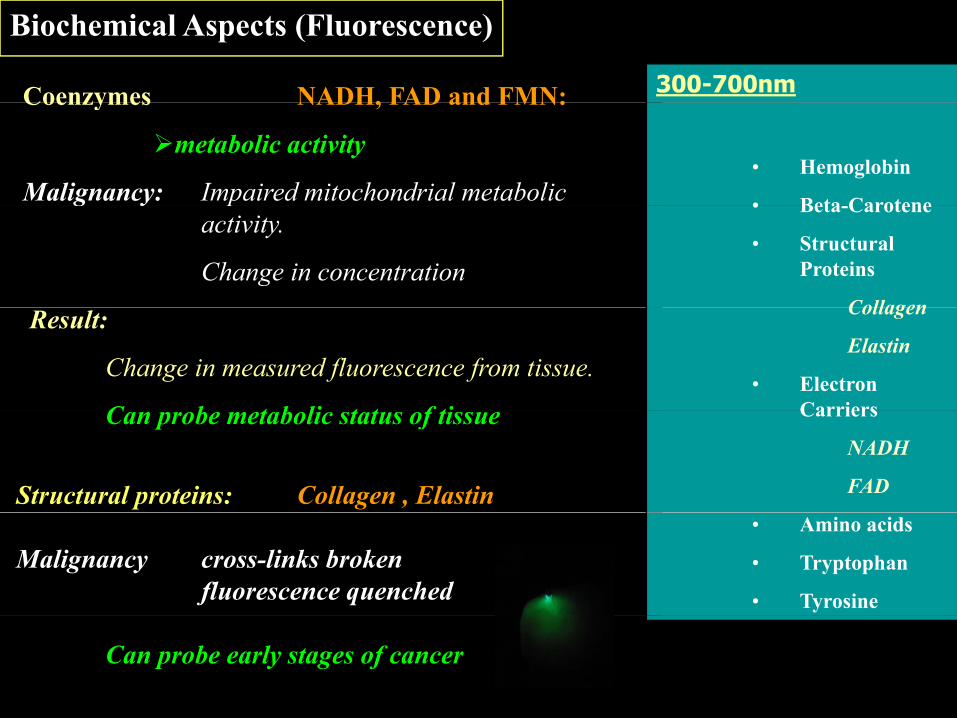
Coenzymes NADH, FAD and FMN:
Biochemical Aspects (Fluorescence)Fluorophores in Tissue
300-700nmCoenzymes NADH, FAD and FMN:
metabolic activity
Malignancy: Impaired mitochondrial metabolic • Hemoglobin
• Beta Caroteneg y pactivity.
Change in concentration
• Beta-Carotene
• Structural Proteins
CollagenResult:
Change in measured fluorescence from tissue.
C b t b li t t f ti
Collagen
Elastin
• Electron CarriersCan probe metabolic status of tissue
Structural proteins: Collagen , Elastin
Carriers
NADH
FAD
Malignancy : cross-links broken fluorescence quenched
• Amino acids
• Tryptophan
• Tyrosine
Can probe early stages of cancer

Fluorescence Spectra of Endogenous Tissue Fluorophores
Reproduced from Stephen Webb, PhD thesis, University of London, 2003
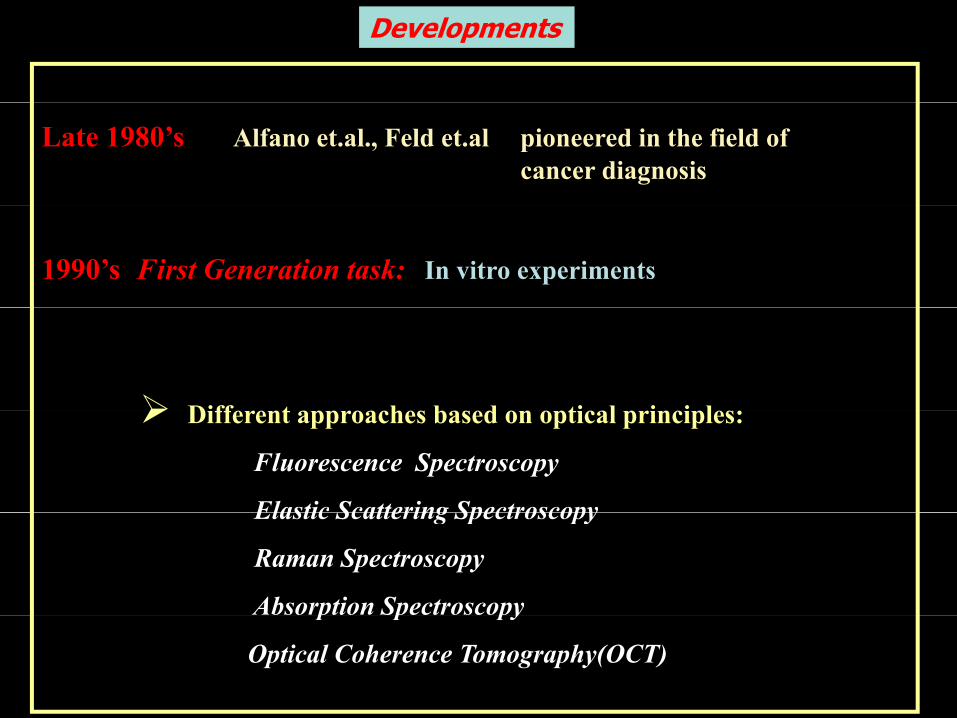
Developments
Late 1980’s Alfano et.al., Feld et.al pioneered in the field of cancer diagnosis
1990’s First Generation task: In vitro experiments
Diff t h b d ti l i i lDifferent approaches based on optical principles:
Fluorescence Spectroscopy
Elastic Scattering SpectroscopyElastic Scattering Spectroscopy
Raman Spectroscopy
Absorption Spectroscopyp p py
Optical Coherence Tomography(OCT)
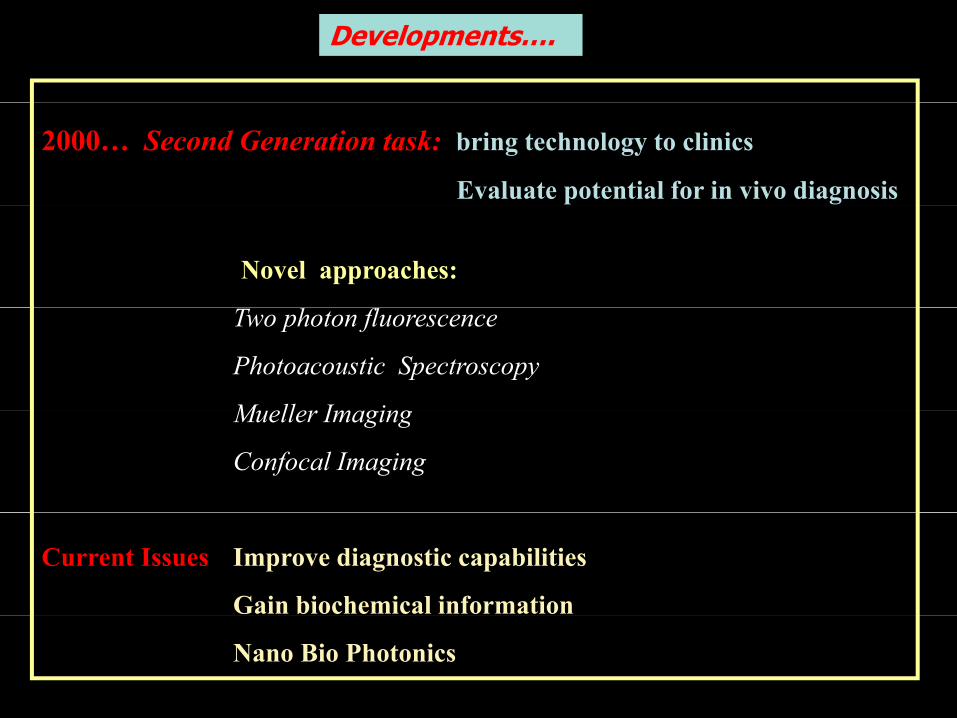
Developments….
2000… Second Generation task: bring technology to clinics
Evaluate potential for in vivo diagnosis
Novel approaches:
Two photon fluorescence
Photoacoustic Spectroscopy
M ll I iMueller Imaging
Confocal Imaging
Current Issues Improve diagnostic capabilities
Gain biochemical information
Nano Bio Photonics
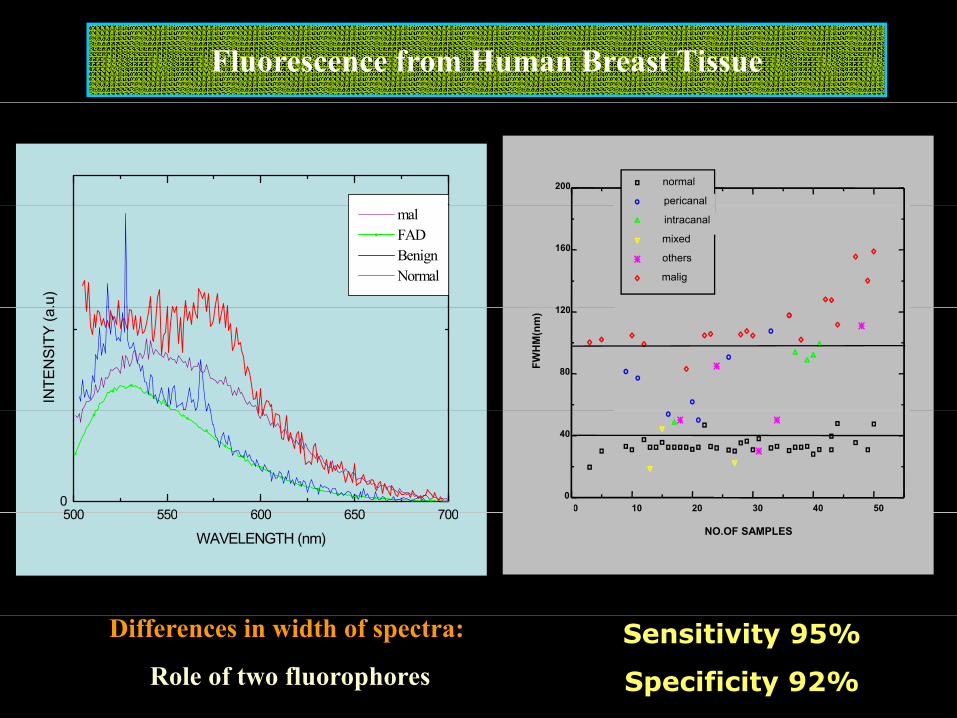
Fluorescence from Human Breast Tissue
200 normal
pericanal mal FAD Benign Normal
.u)
120
160
p
intracanal
mixed
others
malig
INTE
NSI
TY (a
80
120
FWH
M(n
m)
500 550 600 650 7000
Fluorescence with point measurements: Average conribution from bulk tissue. Thus, multiple scattering effects play major role.
0 10 20 30 40 500
40
500 550 600 650 700
WAVELENGTH (nm) NO.OF SAMPLES
Sensitivity 95%
Specificity 92%
Differences in width of spectra:
Role of two fluorophores

Various Approaches for Analysis
Large Amount of spectral data and large number of samplesrequired a proper statistics based algorithm for analysis .
Advantage: Entire spectral information content may be exploited.
Common Technique: Principal Component Analysis (PCA)
Recent Advancement: Wavelet analysis
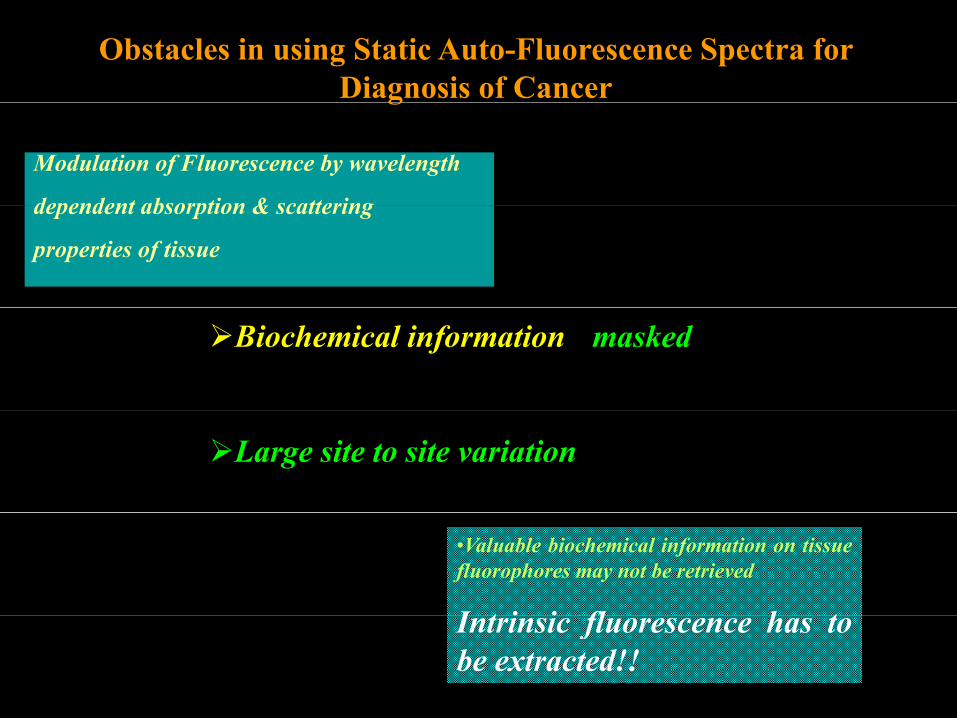
Obstacles in using Static Auto-Fluorescence Spectra for Diagnosis of Cancerg
Modulation of Fluorescence by wavelength
dependent absorption & scatteringdependent absorption & scattering
properties of tissue
Biochemical information masked
Large site to site variation
•Valuable biochemical information on tissuefluorophores may not be retrieved
I t i i fl h tIntrinsic fluorescence has tobe extracted!!

Approach used by us for extraction of Intrinsic Fluorescence
A. Polarized Fluorescence & polarized elastic scattering measurement based approach
A purely experimental approach p y p pp
B. Spatially resolved fluorescence measurementp y f
Depth information of inhomogeneityDepth information of inhomogeneity

Light Propagation in Tissueg p g
Ballistic
SnakeSnake

Underlying PrincipleUnderlying PrincipleDominant Depolarizationcontribution:
Incident polarized lightCo-polarized backscattered lightReduced comp. Cross-polarized contribution:
Multiple scattering of lightbackscattered light
Diffuse comp.I I⊥
Polarized component of thedetected fluorescence
[I- I⊥ ]f f
Extracts contributions whichhave not undergone significantg gscattering in tissue
Therefore originates fromTherefore originates fromsuperficial layer of tissue
B.V. Laxmi et al, Lasers in the Life Sci., 9, 229-243, (2001)

Underlying Principle (Cont…)U de y g c p e (Co …)
• Fluorescence detected in d l i d
Cross-polarized backscattered light
Incident polarized light
Co polarized backscattered lightcrossed polarized channel
(I )
gDiffuse comp.
Co-polarized backscattered lightReduced comp.
I I⊥
(I⊥)
• Contribution of moreContribution of more multiply scattered photons
• Hence originates from Biswal et al, Optics Express, 11, 3320 –3321 (2003)Nidhi Agarwal et al IEEE JSTQE (2003)deeper tissue layer Nidhi Agarwal,et al, IEEE JSTQE (2003)Sharad Gupta et al, JBO (2005)Anita et al, JBO (2008)

(a) Co state. (b) Cross state. (c) Co-Cross state.
PRE 2005JOSA A 2007

Underlying Principle (Cont…)U de y g c p e (Co …)
• Remove scattering effects:g ffdifference in co and cross polarized light
R b ti ff t• Remove absorption effects: fluorescent light /elastically scattered light
• Assumption:
Wavelength dependent scattering & absorption :Similar effects on polarized component of fluorescence & polarized component of elastic scattering spectrapolarized component of elastic scattering spectra
Optics Express, 2003.

Example :

Scheme
Assumption:Wavelength dependent scattering & absorption : similar effects on polarized component of fluorescence & polarized component of elastic scattering spectra
Modification is made so as to eliminate modulation due to blood
A systematic study on phantoms was also performed to validate this scheme

Where is this scheme applicable?Where is this scheme applicable?
• Layered Tissuey• Superficial tumors
Densely packedDensely packed epithelium, NADH increase
C llBasal layer
Basal layer
Collagen cross-links break in stroma
(a)Microscopic images of epithelial layer of (a) normal and (b) dysplastic state of cervix tissue

Intrinsic Fluorescence from Human Cervical Tissue
0 8
1.0
ores
cenc
e
Normal0.8
1.0
uore
scen
ce
NormalI t i i
0 2
0.4
0.6
0.8
mal
ized
ave
rage
flur
oin
tens
ity (a
.u.)
Dysplasia
Co-polarized0.2
0.4
0.6
mal
ized
ave
rage
flu
inte
nsity
(a.u
.)
DysplasiaIntrinsic
350 400 450 500 550 600 650
0.0
0.2
Peak
Nor
m
λ (nm)350 400 450 500 550 600 650
0.0
Peak
nor
m
λ (nm)
Dysplastic tissues : Increase in NADH fluorescenceSensitivity 74%Sensitivity 74%
Intrinsic fluorescence : enhanced discrimination between normaland dysplastic tissues as compared to the co polarized caseand dysplastic tissues as compared to the co-polarized case.
NADH : more reliable discriminating parameter …SPIE 2008

COVARIANCE MATRIXusing Principal Component Analysis
S i h λ 350
Data = Normalized Spectra( i (i) (V l (i) M l )
Spectra with λexc = 350nm
(variance (i)= (Value(i) – Mean value);Covariance Matrix = (DataT Data)/(n-1)

Fluorescence Imaging

Mueller matrix imaging in human cervical tissues
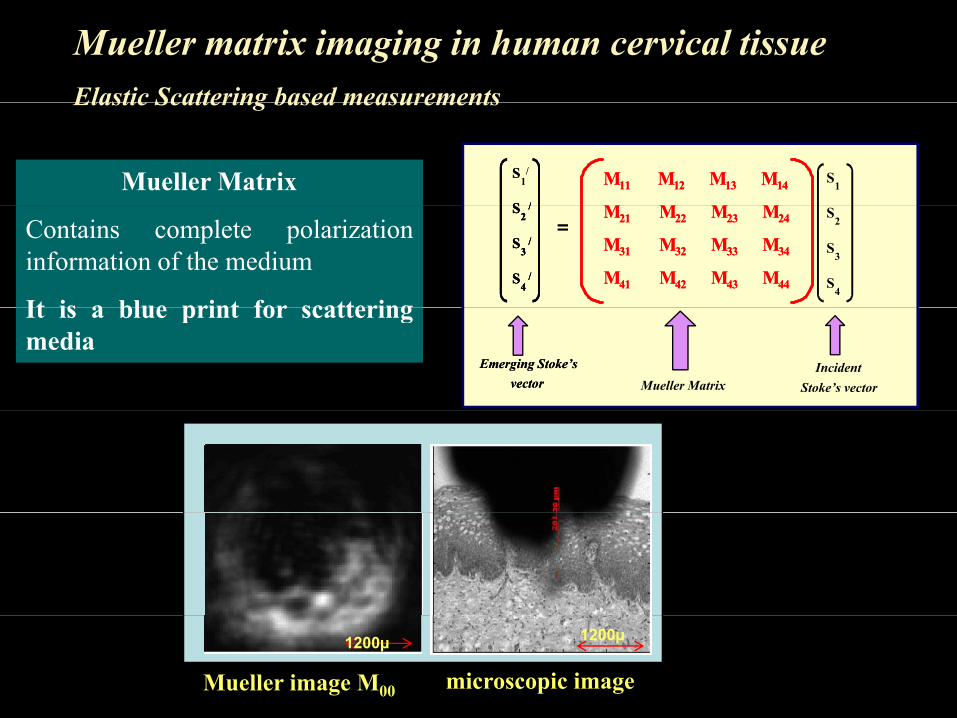
Mueller matrix imaging in human cervical tissueElastic Scattering based measurements
Mueller Matrix M11 M12 M13 M14M11 M12 M13 M14S
1/
S /
S1S
S /S /
Elastic Scattering based measurements
Contains complete polarizationinformation of the medium
It is a blue print for scattering
M21 M22 M23 M24
M31 M32 M33 M34
M41 M42 M43 M44
M21 M22 M23 M24
M31 M32 M33 M34
M41 M42 M43 M44
S2
/
S3
/
S4
/
S2
S3
S4
=S
2 /
S3
/
S4
/
S2
/
S3
/
S4
/
It is a blue print for scatteringmedia
Emerging Stoke’s vector
Incident Stoke’s vectorMueller Matrix
Emerging Stoke’s vector
1200µ1200µ
Mueller image M00 microscopic image

Polar Decomposition of Mueller Matrix
M = M∆MRMDM = M∆MRMD∆ R D
DiattenuationDepolarization
∆ R D
DiattenuationDepolarization RetardanceDepolarization
•Multiplescattering •Differential attenuation
RetardanceDepolarization
•Multiplescattering •Differential attenuation Multiple scattering•Linear & Circularretardance
ff(absorption & scattering)
Multiple scattering•Linear & Circularretardance
ff(absorption & scattering)
1200µ 1200µ1200µ

r
20
25
0.6
0.7
er
20
250.6
0.7
Normal epithelium
Dysplastic epithelium of cervixP
ixel
num
be10
15
0 3
0.4
0.5
Pix
el n
umb
10
15
0.3
0.4
0.5
pof cervix
Pixel number
20 40 60 80
50.2
0.3
Pixel number
20 40 60 80
50.2180µ180µ40µ 40µ
(a (b
Depolarization power images
Pixel number e u be()
()
Normal epithelium
Dysplastic epithelium f i
1000µ
pof cervix
of cervix
Basal B l l
40µ
40µ
Microscope images
layer Basal layer180µ 180µ

er
60
80
0.14
0.16
r
60
80
0.14
0.16
Normal Dysplastic t f
Pix
el n
umbe
20
40
0.08
0.1
0.12
Pie
l num
be
20
40
0.08
0.1
0.12
stroma of cervix
stroma of cervix
Pixel number
20 40 60 80
20
0.04
0.06
Pixel number
20 40 60 80
20
0.04
0.06180µ 180µ
Pixel number e u be
Retardance images
180µ180µ 180µ180µ
Microscope images Optics Express, Vol.17,(3) 2009

(a) (b)
Depolarization power: sensitive to morphological changes during progressionfrom normal to dysplastic state.
Retardance reveals the morphological changes around the stromal region.
Current Status: Automating and increasing data bank for use asCurrent Status: Automating and increasing data bank for use as supplementary tool in clinics

ConclusionsF t f i t i i fl t di ti t l ll tFuture of intrinsic fluorescence spectroscopy as a diagnostic tool as well as to extract biochemical information looks bright. Some refinement is to be done before this technique may be used to extract quantitative information.
Several other light-based tools such as LSS, Raman spectroscopy & OCTwith their individual strengths and weaknesses relative to fluorescence are being used at pre-clinical/clinical stages
Such approaches may not be competing but complementary tools and most importantly, concurrence with histopathological results are important
Mueller Imaging technique can be used as a supplementary technique to the ‘gold standard’ histopathology.
Great deal of clinical / pre-clinical research remains to be done to move these techniques into routine clinical practice
Lastly, focusing on the goal to use optical biopsy in-situ should not detract researchers from trying to understand the biochemical basis of disease through such optical means…

Acknowledgments
• Department of Information Technology (Photonics) [MCIT] Dr Sharad Gupta(Photonics) [MCIT]
• CSIR
• BRNS
Dr. Sharad Gupta
Dr. Maya Nair
Dr.Prashant Shukla
• IIT Kanpur
• Dr.Asha Agarwal (Professor in Pathology, GSVM Medical College)
Jaidip Jagtap
Sridhar RajaGSV edical College)
• Dr. Kiran Pandey (Professor and Head of Gyn and Obstr, GSVM Medical College)
• Dr Nirmalya Ghosh (Univ of Toronto)
Rajbeer Singh
Dharitri Rath
Krishna Kumar Tomar• Dr. Nirmalya Ghosh (Univ. of Toronto) Krishna Kumar Tomar
Meghdoot Mazumdar

Physical Modeling
Takes into account spectral characteristics of contributing fluorophores
ys ca ode g
Takes into account spectral characteristics of contributing fluorophores such as
•intensity,
•peakshift,
•bandwidth
for discriminationfor discrimination
Advantage: Offers insight into biochemical aspects of tissue.
Our study
Flavins
PorphyrinsTo differentiate spectra were fitted to Voigt function.
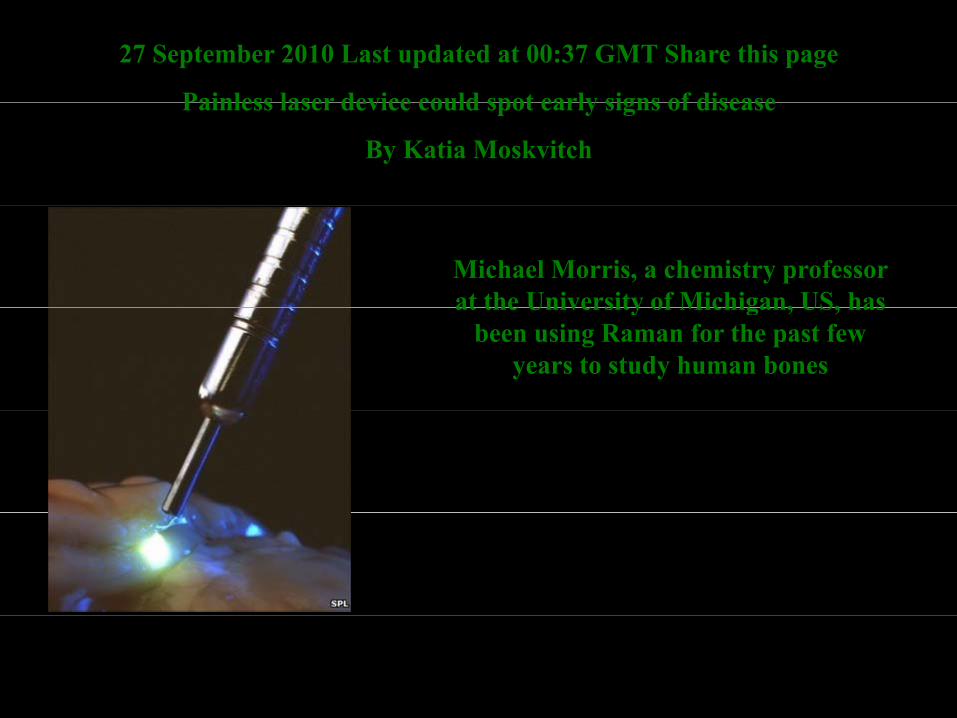
27 September 2010 Last updated at 00:37 GMT Share this page
Painless laser device could spot early signs of diseasePainless laser device could spot early signs of disease
By Katia Moskvitch
Michael Morris, a chemistry professor at the University of Michigan, US, hasat the University of Michigan, US, has
been using Raman for the past few years to study human bones

Reason for the experimental observation
Normalization of unpolarized fluorescence by unpolarized elastic scattering spectra cannot recover intrinsic fluorescence intensity information
fPropagation path of elasticallyscattered photon
Propagation path of fluorescence photon
λEM λEX λEM
λEX λEX λEMλEMEMλEMEM
Major difference in the survival of the long path photons
Results in the differential effect of absorption & scattering on unpolarizedResults in the differential effect of absorption & scattering on unpolarizedfluorescence spectra and elastic scattering spectra

British researchers at the Rutherford Appleton Laboratory in Didcot and at the Gloucestershire Royal Hospital have dco d e G ouces e s e oy osp ve
been using Raman to analyse calcifications in breast tissue that might be early signs of cancer.
We could target those calcifications and make a decision about whether
they're benign or malignant," Nicholas Stone, head of the
biophotonics research unit at the Gloucestershire Royal Hospital told
the magazine Chemical and Engineering News

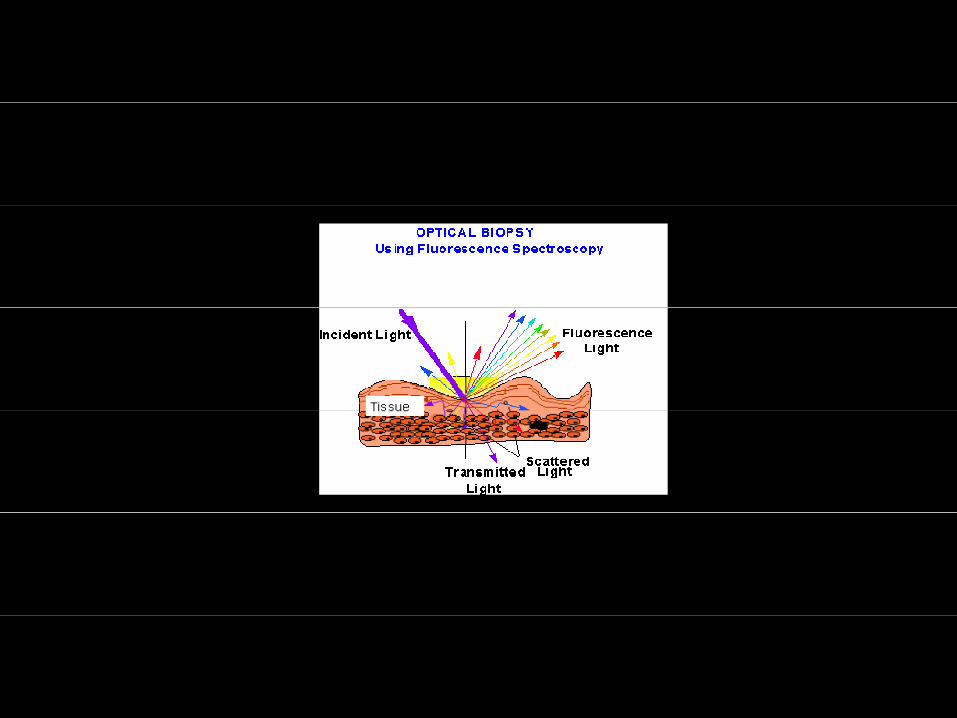
IncidentInelastic scattering (Fluorescence, Raman)
I t iti d d O ti l ti f ti h fl ti it tt iElastic scattering Intensities depend on Optical properties of tissue such as reflectivity, scatteringcoefficient, particle size, optical homogeneity, absorption coefficient etc.
Absorbed portion of light produces:
Transmitted
Absorbed portion of light produces:
· Photochemical effect
· Thermal effect
· Inelastic scattering (Fluorescence, Raman)
Depending on λ and nature of tissue
IR and visible lasers generally produce only thermal effects
UV laser: both thermal and photochemical

The extracted polarization parametersThe extracted polarization parameters
Fibrous structure & their orientation in tissue
Linear retardance
Circular retardance (Optical rotation)Dichroic absorption (orscattering) due to presence of
Concentration of chiral substances like glucose in
tissue
Total retardance R
Depolarization ∆
g) poriented structures Conjugate effect of linear &
circular retardance
Multiple scattering effects( i i f i
Diattenuation D(concentration, size, refractiveindices of scatterers present intissue)

Decomposition Procedure
STEP I: Diattenuation Vector
M11 M12 M13 M14
Experimental Mueller matrix
D = (M12 M13 M14 )T / M11
1 DT
D mMD =
M21 M22 M23 M24
M31 M32 M33 M34
M41 M42 M43 M44 (1-D2)1/2 I + (1-(1-D2)1/2DDT∧∧
D mD
STEP II :
D ={1 / M11} × [M122 + M13
2 + M142]1/2
M/= M MD-1Diattenuation M/=M∆ MR
Diattenuation Parameter
M M MDfree matrix∆ R
1 0P m
1 00 mR
1 0P∆ m/1 0 0 0
M∆
Ci l
Linear
P∆ m∆0 mR
(P-mD)/(1-D2)
P∆ m
m∆= ±[m’(m’)T +((λ1λ2)1/2 + (λ2λ3)1/2+ (λ3λ1)1/2)I]-1
P∆(1) ∆1 0 0
P∆(2) 0 ∆2 0
P∆(3) 0 0 ∆3
Circular
∆ [ ( ) (( 1 2) ( 2 3) ( 3 1) ) ]
× [(λ11/2+ λ2
1/2 +λ31/2)m’(m’)T +(λ1λ2λ3)1/2I]
∆ = 1- {tr (M∆) - 1/ 3}Net Depolarization Index


Major absorbers in tissue
WaterW e
In the UV, the absorption increases with shorter wavelength due to protein, DNA and othermolecules.
In the visible, the major absorber is different forms of hemoglobin present in tissue
In the IR, the absorption increases with longer wavelengths due to tissue water content. Scaling thep re ater absorption b 75% mimics a t pical tiss e ith 75% ater contentpure water absorption by 75% mimics a typical tissue with 75% water content.
In the red to near-infrared (NIR), absorption is minimal. This region is called the diagnostic andtherapeutic window

Mueller MatrixMueller Matrix
−−+−−+−−+−
−−−
4RHLVRVLH
4MHPVMVPH
4VHHVVVHH
2OVOH
2LORO
2MOPO
2VOHOOO
−−+−−+−−+−
−−+−−+−−+−
4LRRLLLRR
4MLPRMRPL
4VLHRVRHL
2OLOR
4RPLMRMLP
4MPPMMMPP
4VPHMVMHP
2OMOP
4442
Stokes Vectors
+
VHI
++≥
−−−
=
111111
VUQI,
LRMPVH
VUQ
2222
−
=
=
−=
=
−
=
=
1001
S,
1001
S,
01
01
S,
0101
S,
00
11
S,
0011
S LCPRCPMPVH

STEP III: MR = M∆-1 M/
Linear Retardance
OpticalRotation
1 0 0 00 cos2(2θ)+sin2(2θ)cos(δ) sin(2θ)cos(2θ)(1 − cos(δ)) -sin(2θ)sin(δ)0 sin(2θ)cos(2θ)(1 − cos(δ)) sin2(2θ)+cos2(2θ)cos(δ) cos(2θ)sin(δ)
θ δ θ δ δ
1 0 0 00 cos(2ψ) sin(2ψ) 0 0 -sin(2ψ) cos(2ψ) 0 0 0 0 1
×
Linear retarder with retardance (δ) & orientation angle (θ) Circular retarder with optical rotation (ψ)
0 sin(2θ)sin(δ) -cos(2θ)sin(δ) cos(δ) 0 0 0 1
δ = cos -1 [{(MR (2,2) + MR(3,3))2 + (MR(3,2)-MR(2,3))2}1/2 -1]Linear Retardance
ψ = tan -1 [{MR (3,2)-MR(2,3)} / {MR (2,2) + MR(3,3)}]Optical Rotation
1 ( )cos 12
Rtr MR − = −
Total Retardance 1 2 2cos 2cos ( ) cos ( ) 12
R δψ− = −

H2C CH
OH
C
OH
CH
OH
H2C O P
O
OH
N
N
CNH
CN
OO
O
PO OH
CH 3
CH 3 N
NH 2
H2C CH
OH
C
OH
CH
OH
CH2OH
O O
H2C
O
NN
CH
N
NH
CN
O
2 H H
CH3
OH OH OH
H2
O
FAD
N CNH
O
CH3
NC
NO
H2C CH
C CH
H2C
CH3
O P OH
OH
Rib fl i
N CNH
O
CH3
FMN
Riboflavin
O

Typical fluorescence spectra at various i i l hexcitation wavelengths
325nm
0.09
0.10
0.11
0.12325nm 350nm 370nm
0.05
0.06
0.07
0.08
nsity
(a.u
.)
0 01
0.02
0.03
0.04
0.05
IF In
te
350 400 450 500 550 600 650 700-0.01
0.00
0.01
Wavelength (nm)g ( )

Fluorescence spectra of cervical tissue with 370nm excitation
1500000
2000000
)
Nor Can
co-polarized 200000
250000
300000
.)
Nor Can
cross-polarized
500000
1000000
Inte
nsity
(a.u
.)
50000
100000
150000
Inte
nsity
(a.u
.
400 450 500 550 600 650 700
0
Wavelength (nm)400 450 500 550 600 650 700
0
Wavelength(nm)
0.20
0.25
u.)
Nor Can
Intrinsic
0.05
0.10
0.15
Inte
nsity
(a.u
400 450 500 550 600 650 700
0.00
Wavelength (nm)

Ratio of Intrinsic Fluorescence for Cervical Tissue at 370nm Excitation
Sensitivity 74%
4
5
6
7
8
IF 370nmo
Can
cer
0
1
2
3
4
atio
of N
orm
al to
0 10 20 30 40 50-2
-1Ra
No. Patients

RESULTS
16.8mm16.8mm
40mmGroove to hold optical fiber
FLAVIN PHANTOM: The peak maximum was found to be 522.2 nm.

Optical Coherence Tomographyp g p y
Ex vivo arthroscopic OCT of an embeddedcartilage tear (a) 2-D OCT clearly delineateda minute cartilage tear that was less than 0.2mm thick but embedded 0.6 mm below thecartilage surface. (b) Green fluorescent dye-stained histology from a parallel cross-section of the dashed area in (a). Image size:roughly 6 mm wide and 2 mm deep for (a);3 6 mm wide and 1 mm deep for (b) The3.6 mm wide and 1 mm deep for (b). Thewhite arrows in both images indicate theembedded tears
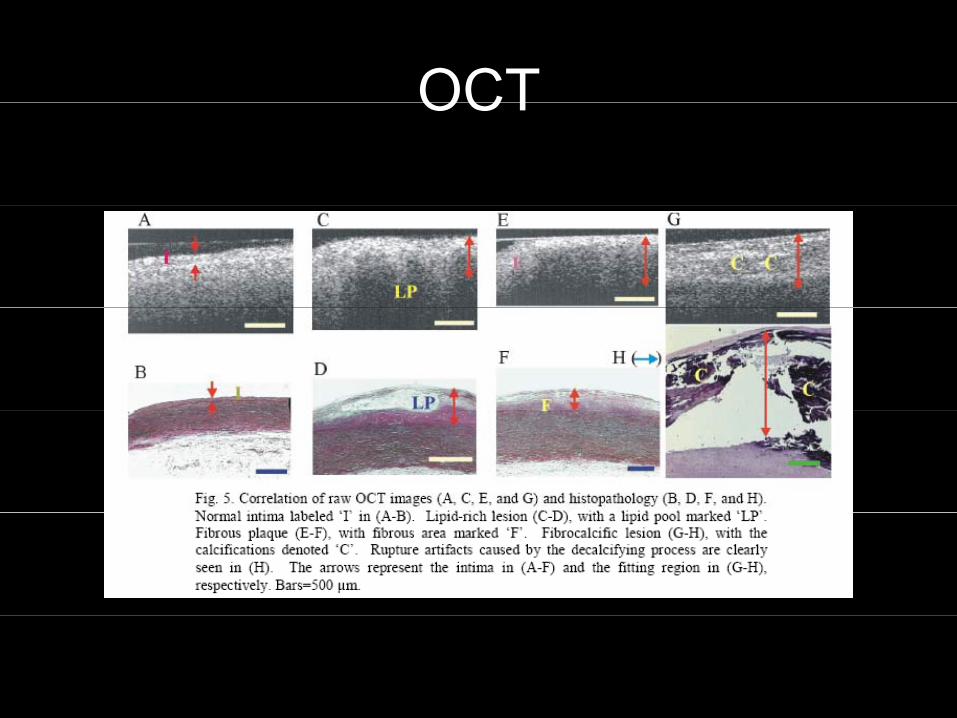
OCTOCT