Embed Size (px)
Citation preview

LIGHTING LIGHTING up the Futureup the FutureLIGHTING LIGHTING up the Futureup the Future
Q4 FY2012

AGENDAAGENDAAGENDAAGENDA
SECTOR UPDATE
COMPANY OVERVIEW
PERFORMANCE HIGHLIGHTSPERFORMANCE HIGHLIGHTS
FINANCIAL RESULTS
PROJECT UPDATE
2

SECTOR UPDATESECTOR UPDATESECTOR UPDATESECTOR UPDATE

EMERGING SCENARIOEMERGING SCENARIOEMERGING SCENARIOEMERGING SCENARIO
Slowing GDP growth but still robust Growth Trend in Sectoral components of IIP
8.7% 8.7%
5.8%
3.7%5.4%
9.00%
7.30%8.30%
8.00%
-2.1%
7.30%%6.80%
Mining Manufactuing Electricity
Apr'10 - Feb'11 Apr'11 - Feb'12
FY'08 FY'09 FY'10 FY'11 FY'12 E
Growth moderated through policy action to contain inflation
Government initiates measures to address the issues confronting the PowerSector
4Source: CSO, RBI

CAPACITY BUILD UPCAPACITY BUILD UPCAPACITY BUILD UPCAPACITY BUILD UP
Capacity Build up during XI Plan (GW)Capacity Build up during XI Plan (GW)
16 518
39
525
160
180
200
143.03 147.94159.40
173.63199.63 The installed power generation capacity in
the country has crossed 200 GW in April’12
O h l fi h f P i36
4 11
374
13
37
516
38
5
131
39
80
100
120
140
160
W)
Over the last five years share of Privatesector has increased from 14% to 27%.
67 GW of power capacity has been added92 94 102 113
131
‐
20
40
60
FY 2008 FY 2009 FY 2010 FY 2011 FY 2012
Capacity (in G
67 GW o po e capac ty as bee addedin XI Plan (incl. R.E.S) – FY12 witnessedaddition of 26 GW (incl. R.E.S)
Sector wise Break up of Capacity as on 31st March 2008 and 31st March 2012 (XI Plan period)
Thermal Hydro Nucler Others
Central Sector60 GW30%
Private Sector, 54 GW27%
Central Sector48 GW34%
P i S
Source: CEA 5
State Sector86 GW43%
Private Sector, 20 GW14%State Sector
75 GW52%

DEMAND SUPPLY SCENARIODEMAND SUPPLY SCENARIODEMAND SUPPLY SCENARIODEMAND SUPPLY SCENARIO
Power Demand Supply Position FY’12 (BU) Peak Demand and Peak Met FY’12 (GW)Power Demand Supply Position FY 12 (BU) Peak Demand and Peak Met FY 12 (GW)
130
11615.6%
13.8%120
140
14%
16%
18%937857
11.4%
8.8%800
900
1000
10%
12%
42 3840
11.1%
7.8%
60
80
100
6%
8%
10%
12%
290 260
6.4%
5.3%
8.5%
400
500
600
700
4%
6%
8%
38
16
32
16
40 3737 4.1%
0
20
40
NR WR SR ER &NE All India
0%
2%
4%
6%290 260
110
237
105
276 258 257
0
100
200
300
NR WR SR ER &NE All India
0%
2%
4%
NR WR SR ER &NE All IndiaPeak Demand (GW) Peak Met (GW) % Peak Shortage
NR WR SR ER &NE All IndiaRequirement (BU) Availability (BU) % Deficit
India is the fifth largest electricity‐generating and electricity consuming country inthe world. The demand for power is expected to grow at 7.5% during XII Planperiod.
Restructuring of SEB’s (as per Shunglu Committee) and measures to improveRestructuring of SEB s (as per Shunglu Committee) and measures to improvefinancial health of SEB’s to have major positive impact on the sector.
Raising of tariffs by distribution utilities augurs well for the sector
1
6Source: CEA, IEA

API COAL INDEX visAPI COAL INDEX visààvis USvis US$:`$:` Indexed Indexed API COAL INDEX visAPI COAL INDEX visààvis USvis US$:`$:` Indexed Indexed
130
140
150 API 4 Coal Index USD:Re
100
110
120
80
90
pr‐10
ay‐10
un‐10
ul‐10
ug‐10
ep‐10
ct‐10
ov‐10
ec‐10
an‐11
eb‐11
ar‐11
pr‐11
ay‐11
un‐11
ul‐11
ug‐11
ep‐11
ct‐11
ov‐11
ec‐11
an‐12
eb‐12
ar‐12
Ap
Ma Ju Ju Au Se Oc
No De Ja Fe Ma
Ap
Ma Ju Ju Au Se Oc
No De Ja Fe Ma
Month API 4 Coal Index USD:`D 11 100 100 Dec‐11 100 100 Jan‐12 102 97 Feb‐12 101 94 Mar‐12 100 96
Source:API4 Coal Index, RBI 7

COMPANY OVERVIEWCOMPANY OVERVIEWCOMPANY OVERVIEWCOMPANY OVERVIEW
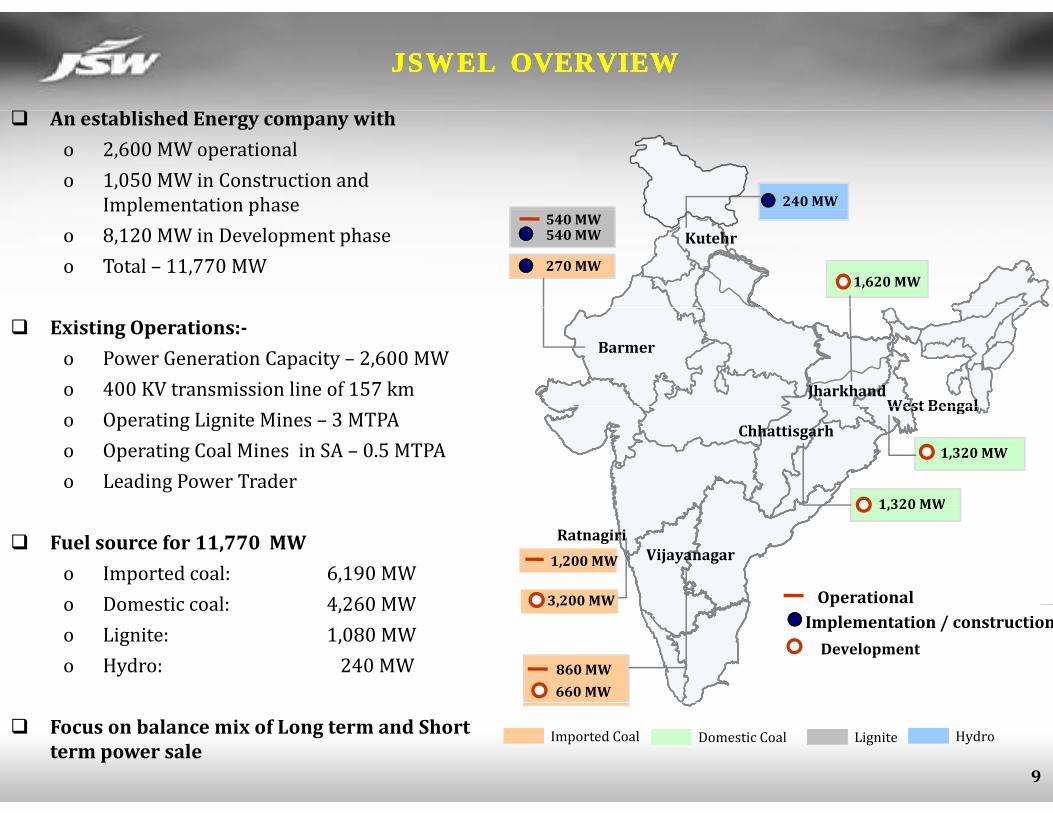
JSWEL OVERVIEWJSWEL OVERVIEWJSWEL OVERVIEWJSWEL OVERVIEW
240 MW
An established Energy company with
o 2,600 MW operational o 1,050 MW in Construction and
Implementation phaseKutehr540 MW
270 MW
540 MW
1,620 MW
Implementation phaseo 8,120 MW in Development phaseo Total – 11,770 MW
Barmer
West BengalJharkhand
Existing Operations:
o Power Generation Capacity – 2,600 MWo 400 KV transmission line of 157 km
West Bengal
Chhattisgarh
1 320 MW
1,320 MW
o Operating Lignite Mines – 3 MTPAo Operating Coal Mines in SA – 0.5 MTPAo Leading Power Trader
RatnagiriVijayanagar
Projects under operation & construction
1,320 MW
Operational
1,200 MW
3,200 MW
Fuel source for 11,770 MW
o Imported coal: 6,190 MWo Domestic coal: 4 260 MW j p
Project s under development
860 MW
pImplementation / construction
Development
660 MW
3,200 MWo Domestic coal: 4,260 MWo Lignite: 1,080 MWo Hydro: 240 MW
9
Imported Coal Domestic Coal HydroLigniteFocus on balance mix of Long term and Short term power sale

PERFORMANCE HIGHLIGHTSPERFORMANCE HIGHLIGHTSPERFORMANCE HIGHLIGHTSPERFORMANCE HIGHLIGHTS

KEY HIGHLIGHTSKEY HIGHLIGHTSKEY HIGHLIGHTSKEY HIGHLIGHTS
Achieved highest net generation: 4,618 million units in Q4FY12 13,594 million units in FY12
MOEF grants approval for Chhattisgarh power projectMOEF grants approval for Chhattisgarh power project
Vijayanagar units bag best operating power plantawards from Ministry of Power for FY201011 andawards from Ministry of Power for FY2010 11 andFY200910 in the Silver and Bronze category
11

OPERATIONS PERFORMANCEOPERATIONS PERFORMANCEOPERATIONS PERFORMANCEOPERATIONS PERFORMANCE
C i G h (MW) N G i G h (MU)Capacity Growth (MW) Net Generation Growth (MU)
51%2,600
1,73074%
50%13,594
995
74%
4 618
9,016
53%
Q4 FY'10 Q4 FY'11 Q4 FY'12
3,0124,618
Q4 12MFY 2011 FY 2012
12

OPERATIONS PERFORMANCEOPERATIONS PERFORMANCEOPERATIONS PERFORMANCEOPERATIONS PERFORMANCE
QoQ Plantwise Net Generation (MU) YoY Plantwise Net Generation (MU)
3,0123,012
4,6184,618
Ratnagiri Vijayanagar VijayanagarRatnagiri 6 259
9,0169,016
13,59413,594
3,0123,012Vijayanagar
1,714
Vijayanagar 1,772
2,018 j y g 6,687 5,905
6,259
Ratnagiri 972
Ratnagiri 1,534
Barmer 326
Barmer 828
Q4 FY 2011 Q4 FY 2012
Barmer 795
Barmer 1,430
FY 2011 FY 2012
Vijayanagar Barmer Ratnagiri
13
Vijayanagar Barmer Ratnagiri
PLF (Q4 FY 2012) 102% 80% 85%

SALE OF POWERSALE OF POWERSALE OF POWERSALE OF POWER
S l Mi (MU)Sales Mix (MU)
13,684
36%9,016
67% 64%46%
33%
3,012
4,723
67% 54%
67% 64%33%
46%
Q4 FY 2011 Q4 FY 2012 FY 2011 FY 2012Realisation `/ kwh
Q4 FY 2011 Q4 FY 2012 FY 2011 FY 2012Short Term Sales Long Term Sales
Q Q
Merchant Realisation 4.72 4.33 4.92 4.40
Long Term Realisation 3 71 3 49 3 63 3 34Long Term Realisation 3.71 3.49 3.63 3.34
Average Realisation 4.38 3.99 4.52 4.08
14

FINANCIAL RESULTSFINANCIAL RESULTSFINANCIAL RESULTSFINANCIAL RESULTS
15

CONSOLIDATED RESULTSCONSOLIDATED RESULTSCONSOLIDATED RESULTSCONSOLIDATED RESULTS
1,459 4,428 Turnover (` Crores) 2,107 (44% ) 6,265
Q4FY2012 FY2012Q4FY2011 FY2011
1,459 4,428 Turnover (` Crores) 2,107 (44% ) 6,265
453 1,697 EBITDA (` Crores))) 613 (35% ) 1,594
31% 38% EBITDA (%) 29% 25%
123 433 Interest (` Crores)) 233 717
91 267 Depreciation (` Crores) 151 50391 267 Depreciation (` Crores) 151 503
240 998 PBT (` Crores) 291 (21% ) 213
206 842 PAT (` Crores) 225 (9% ) 170
1.25 5.13 EPS (`) 1.37 1.04
16
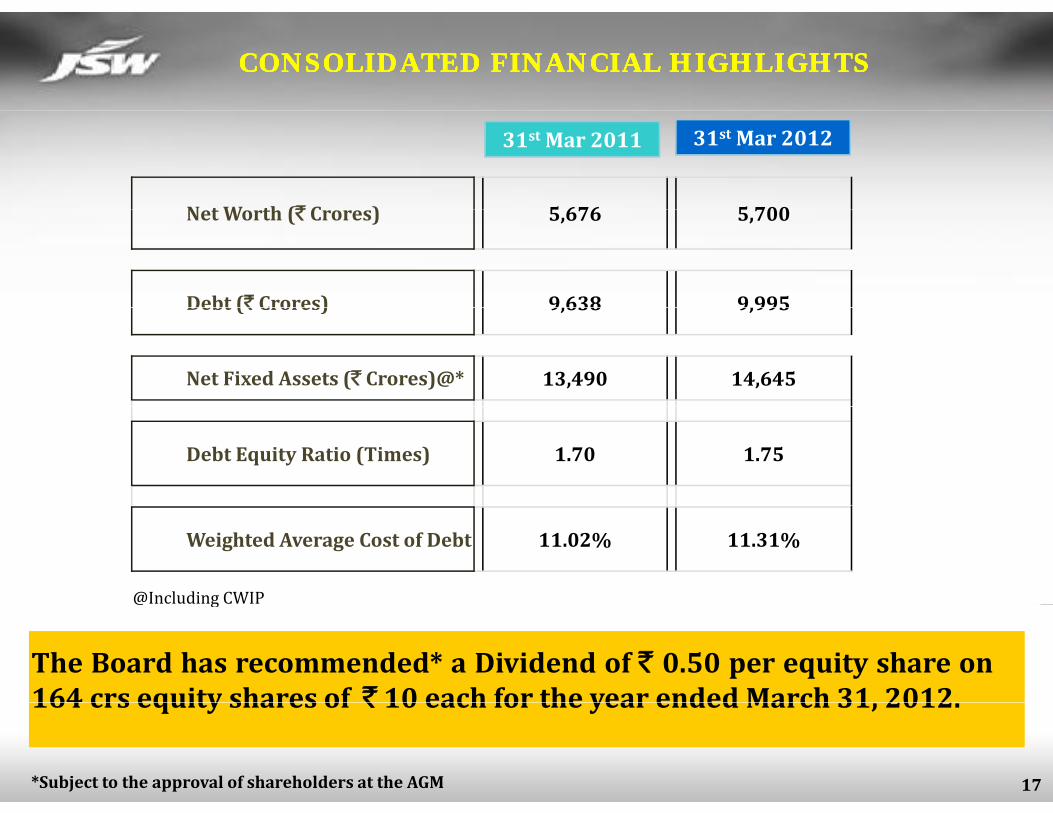
CONSOLIDATED FINANCIAL HIGHLIGHTSCONSOLIDATED FINANCIAL HIGHLIGHTSCONSOLIDATED FINANCIAL HIGHLIGHTSCONSOLIDATED FINANCIAL HIGHLIGHTS
N t W th (` C ) 5 676 5 700
31st Mar 201231st Mar 2011
Net Worth (` Crores) 5,676 5,700
Debt (` Crores) 9,638 9,995Debt (` Crores) 9,638 9,995
Net Fixed Assets (` Crores)@* 13,490 14,645
Debt Equity Ratio (Times) 1.70 1.75
@Including CWIP
Weighted Average Cost of Debt 11.02% 11.31%
@ g
The Board has recommended* a Dividend of ` 0.50 per equity share on164 crs equity shares of ` 10 each for the year ended March 31 2012
17
164 crs equity shares of ` 10 each for the year ended March 31, 2012.
*Subject to the approval of shareholders at the AGM
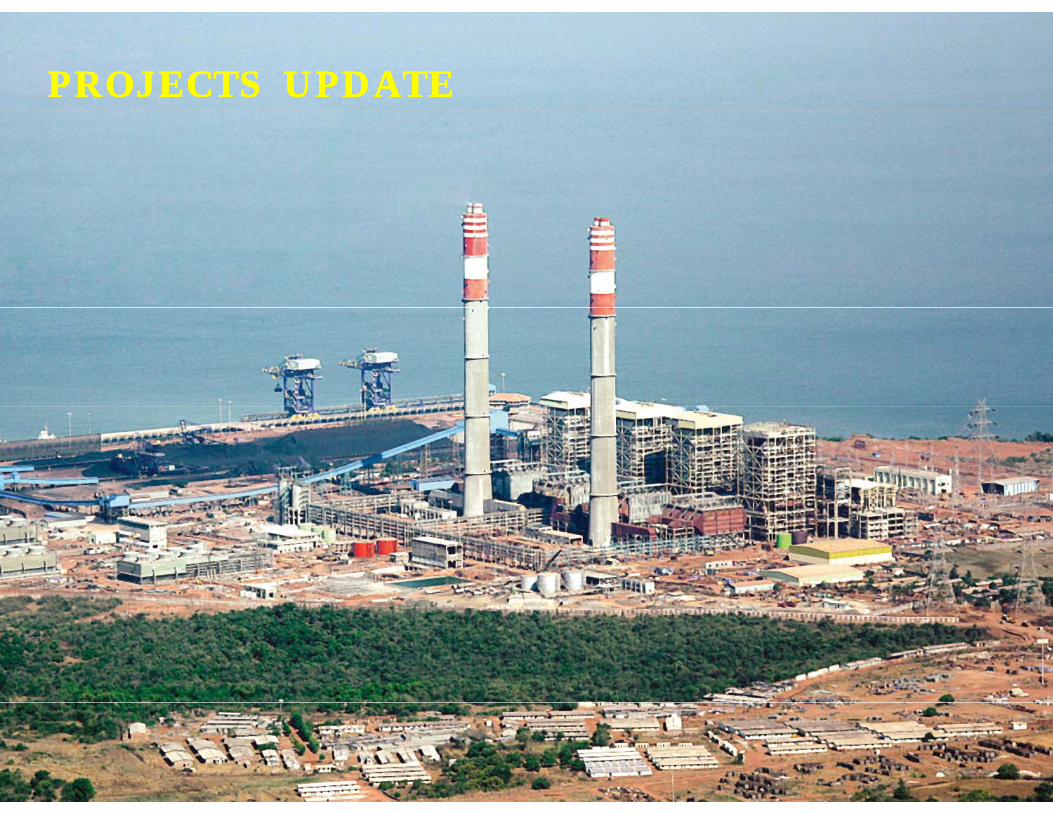
PROJECTS UPDATEPROJECTS UPDATEPROJECTS UPDATEPROJECTS UPDATE

RAJ WEST POWER LTD. IRAJ WEST POWER LTD. IRAJ WEST POWER LTD. IRAJ WEST POWER LTD. I
Gross Capacity 1,080 MW (8 x 135)
Status UpdateProject Details
p y , ( )
Technology Subcritical Captive Lignite based TPP
FSA with BLMCL (49% JV) for supply
•Unit V synchronized on 30th March,2012
•Unit VI Turbine put on barring andunit likely to synchronize by May’12
Fuel LinkageFSA with BLMCL (49% JV) for supply of lignite from captive lignite mines of BLMCL
Water All i f IGNP
unit likely to synchronize by May 12
Water Allocation
Allocation from IGNP
P Off t kLong term arrangement for entire
it ith t t G t Power Off take capacity with state Government distribution utilities
` 6,865Crs
Project Cost
,Debt / Equity: 75:25Amt spent till Mar 31, 2012:` 5,857 Crs
CommissioningUnit I – IV OperationalEntire project completion in 2012
19

CHATTISGARH POWER PROJECTCHATTISGARH POWER PROJECTCHATTISGARH POWER PROJECTCHATTISGARH POWER PROJECT
•PPA signed with GoCG for 35% ofpowerGross Capacity 1,320 MW (2 x 660)
Status UpdateProject Details
p
•Water allocation obtained
•Topography survey and geotechnical
p y , ( )
Technology Supercritical domestic coal based TPP
p g p y y ginvestigations completed
• Environment Clearance received fromMOEF on 12th March 2012
Fuel Linkage11% interest in coal block jointly allocated; applied for additional coal linkage
• Land acquisition in progresssatisfactorily
g
Water Allocation 35 mn cmpa water allocated from Mahanadi River
•Applied to Pollution control board forConsent to Establish
Mahanadi River
Power Off takeCombination of long term & short term agreements; 35% to State
• Construction of water barragecommenced
•Offers received for BTG equipment
Power Off take term agreements; 35% to State Govt.
` 6,500 Crs •Offers received for BTG equipmentunder reviewProject Cost
` 6,500 CrsAmt spent till Mar 31, 2012 : ` 94 Crs
20

KUTEHR HYDRO PROJECTKUTEHR HYDRO PROJECTKUTEHR HYDRO PROJECTKUTEHR HYDRO PROJECT
Status UpdateProject Details
Gross Capacity 240 MW (3 x 80)•Techno Economic Clearance from CEAreceived
MOEF d d F t t I l
Technology Runoftheriver Hydropower
•MOEF accorded Forest stage I clearance& Environment clearance
•Prequalification of vendors for electromechanical & hydro mechanical works
Water Allocation
Ravi River
Free power to GoHP 12% to
mechanical & hydro mechanical workscompleted, tender documentationunder finalisation
• Implementation agreement signed withHP government
Power Off take
Free power to GoHP – 12% to 30% of delivered energy for 40 years. Balance through short term arrangements
HP government
• Land acquisition under progress
Project Cost` 1,798 CrsAmt spent till Mar 31, 2012 : ` 138 Crs
•Technical & commercial bid underevaluation for main civil works
• CDM validation under progress• CDM validation under progress
21

WEST BENGAL POWER PROJECTWEST BENGAL POWER PROJECTWEST BENGAL POWER PROJECTWEST BENGAL POWER PROJECT
Gross Capacity 1320 MW (2 x 660)
Status UpdateProject Details
• Land in possession
Technology 1,320 MW Supercritical TPP
Fuel LinkageIchhapur MinesWBMDTC to
• Supplementary agreement to PPAoffering 40% output from Unit II & IIIsigned withWBEDCL
Fuel Linkagesupply fuel
Power Off take40% to WBMEDCL , balance on merchantmerchant
Project Cost Total Cost: Approx. ` 7,000 Crs
22

JSWEL JSWEL -- VIJAYANAGARVIJAYANAGARJSWEL JSWEL -- VIJAYANAGARVIJAYANAGAR
Status UpdateProject Details
Gross Capacity 660 MW (1 x 660)
Technology Super critical coal based TPP
• Land identified
•TOR cleared by MOEF
Fuel LinkageImported coal / Domestic linkage coal
Water Source Almatti Dam
•Plant layout finalised
• Soil Investigation completed
Power Off takeMerchant power & Long Term PPA
•DPR under preparation
• EIA & EMP report submitted
Project Cost Total Cost: ` 3,300 Crs
23

RAJ WEST POWER LTD. IIRAJ WEST POWER LTD. IIRAJ WEST POWER LTD. IIRAJ WEST POWER LTD. II
Status UpdateProject Details
Gross Capacity 270 MW (2 x 135)
Subcritical Captive lignite based
• Land in possession
Status UpdateProject Details
TechnologySubcritical Captive lignite based TPP
Fuel Linkage Applied to Ministry of Coal
•Applied for coal linkage•Government consent awaited
WaterAllocation
Allocation from IGNP
Power Off takeShort Term power purchase
Power Off takep p
arrangements
Project CostTotal Cost: ` 1,350 CrsAmount spent till Mar 31, 2012 : ` 61 Crs
24

JSW ENERGY RATNAGIRI EXPANSIONJSW ENERGY RATNAGIRI EXPANSIONJSW ENERGY RATNAGIRI EXPANSIONJSW ENERGY RATNAGIRI EXPANSION
Status UpdateProject Details
Gross Capacity 3,200 MW (4 x 800)
Technology Supercritical imported coal based TPP
•Substantial land in possession
•Approvals awaitedTPP
Authority Letter of support from Government of Maharashtra
Fuel Linkage Imported Coal
Water Allocation Sea Water
Power Off take Combination of long term & short term agreements
` 150 Bn Project Cost ` 150 Bn. Amt spent till Mar 31, 2012: ` 79 Crs
25

EQUIPMENT MANUFACTURING EQUIPMENT MANUFACTURING –– JSW TOSHIBAJSW TOSHIBAEQUIPMENT MANUFACTURING EQUIPMENT MANUFACTURING –– JSW TOSHIBAJSW TOSHIBA
Status UpdateProject Details
Gross Capacity 3GW Steam Turbine Generators•Blade production commenced
•Building & Equipment Warehousecompleted
TechnologySuper critical steam turbines of size 5001000 MW
completed
• Construction activities of TGManufacturing Facility completed
Procurement All orders placed •The factory inaugurated on 12th Feb2012 by the Chief Minister ofTamilnadu
•Trial production of different TurbineInvestment
Entire equity required from JSWEL: ` 64 Crs has been invested
•Trial production of different TurbineGenerator components at Main Plantunder progress
26

DOMESTIC MINING PROJECTSDOMESTIC MINING PROJECTSDOMESTIC MINING PROJECTSDOMESTIC MINING PROJECTS
• Lignite production commenced
Status Update
BLMCL Kapurdi Mine
•Mining lease transferred in the name of BLMCL•Production of 1.8 Million Tons till date• Lignite supplied to Power plant 1.67 Million Tons•Revised Mining Plan for enhancing the Lignite production of Kapurdi •Revised Mining Plan for enhancing the Lignite production of Kapurdi from present 3 MTPA to 7 MTPA submitted to MoC on 26th March 2012
•MOEF Clearance received BLMCL Jalipa Mine
•MOEF Clearance received •Mine development plan approved
• Land acquisition under progress; Entire price depositedh hi d d i f li i i bl k h d•The trenching and demarcation of Jalipa Lignite block has started from March, 2012
MJSJ Coal Public hearing completedJ J g p
Land acquisition under progress
27

OVERSEAS COAL PROJECTOVERSEAS COAL PROJECTOVERSEAS COAL PROJECTOVERSEAS COAL PROJECT
SACMH Status Update
LocationUmlabu & Ilanga (Wit Bank Region), South Africa • Coal production commenced
Control93.27 % Equity holdingAcquired shares under put call option agreement
•Raw Coal produced duringQ4FY’12: 193,786 Tonnes
•Total Sales during Q4FY’12:125 086 T
Attractive Features
•Richard’s Bay Coal Terminal Entitlement for 0.5 MTPA•Railway siding within the mine with a capacity to handle upto 0 5 MTPA
125,086 Tonnes(YTD Sales: 455,280 Tonnes)
•Open cast & underground mining capacity to handle upto 0.5 MTPA
GCV (NAR) 6000 Kcal 6200 Kcal
under progress
28

STRATEGYSTRATEGYSTRATEGYSTRATEGY
29

STRATEGYSTRATEGYSTRATEGYSTRATEGY
• Balance mix of Long term and Short term sales• Balance mix of Long term and Short term sales
• Venture into associated • Venture into associated
• Attain fuel security• Attain fuel security
• Venture into associated segments – Transmission, Distribution and Trading
• Explore opportunities in
• Venture into associated segments – Transmission, Distribution and Trading
• Explore opportunities in Core Business of Power
Core Business of Power • Attain fuel security• Attain fuel security • Explore opportunities in
Mining
• Harness opportunities in E i t M f t i
• Explore opportunities in Mining
• Harness opportunities in E i t M f t i
of Power Generationof Power Generation
Equipment ManufacturingEquipment Manufacturing
• Efficient operation• Continuous Cost reduction• Focus on regular plant maintenance
• Efficient operation• Continuous Cost reduction• Focus on regular plant maintenance
30
g pg p
FORWARD LOOKING & CAUTIONARY STATEMENTFORWARD LOOKING & CAUTIONARY STATEMENTFORWARD LOOKING & CAUTIONARY STATEMENTFORWARD LOOKING & CAUTIONARY STATEMENT
Certain statements in this report concerning our future growth prospects are forward lookingstatements, which involve a number of risks, and uncertainties that could cause actual results todiffer materially from those in such forward looking statements. The risk and uncertaintiesrelating to these statements include, but are not limited to risks and uncertainties regardingrelating to these statements include, but are not limited to risks and uncertainties regardingfluctuations in earnings, our ability to manage growth, intense competition within Power industryincluding those factors which may affect our cost advantage, wage increases in India, our ability toattract and retain highly skilled professionals, time and cost overruns on fixedprice, fixedtimeframe contracts our ability to commission mines within contemplated time and costs our ability toframe contracts, our ability to commission mines within contemplated time and costs, our ability toraise the finance within time and cost client concentration, restrictions on immigration, our abilityto manage our internal operations, reduced demand for power, our ability to successfully completeand integrate potential acquisitions, liability for damages on our service contracts, the success ofthe companies in which the Company has made strategic investments withdrawal ofthe companies in which the Company has made strategic investments, withdrawal offiscal/governmental incentives, impact of regulatory measures, political instability, legalrestrictions on raising capital or acquiring companies outside India, unauthorized use of ourintellectual property and general economic conditions affecting our industry. The company doesnot undertake to update any forward looking statements that may be made from time to time bynot undertake to update any forward looking statements that may be made from time to time byor on behalf of the company.
31

32