Embed Size (px)
Citation preview

Lightning Protection and Radio Frequency
Interference Mitigation for the Karoo Array
Telescope
by
P. Gideon Wiid
Dissertation presented in fulfilment of the requirements for the degree of
Doctor of Philosophy in Engineering at the Faculty of Engineering,
Stellenbosch University
Promotors: Prof. Howard C. Reader & Dr. Riana H. Geschke
Department of Electrical and Electronic Engineering
March 2010

Declaration
By submitting this dissertation electronically, I declare that the entirety of the work
contained therein is my own, original work, that I am the owner of the copyright thereof
(unless to the extent explicitly otherwise stated) and that I have not previously in its
entirety or in part submitted it for obtaining any qualification.
March 2010
Copyright c© 2010 Stellenbosch University
All rights reserved.
i

Summary
South Africa and Australia are now the two remaining countries bidding for the Square
Kilometre Array (SKA), the biggest and most sensitive project ever undertaken in radio
astronomy. The South African SKA is demonstrating its technology capabilities through
the Karoo Array Telescope (KAT or MeerKAT).
The development of KAT is taking place in stages to optimise design and minimise
risks at each stage. An array of seven 12 m antennas will be complete by the end of 2009,
called KAT-7. The following phase will see the construction of MeerKAT, which will lead
to eighty arrayed dishes.
Lightning and RFI studies for KAT-7 are the focus of this dissertation. Due to the
extent and complexity of the South African demonstrator project, these studies have
largely been conducted on a single structure. Parameters for the dish antenna and pedestal
design changed throughout their development. To be effective, the doctoral research had
to track these changes appropriately.
A Method of Moments frequency domain computational electromagnetic code, FEKO,
is used throughout the study. The consequences of direct and indirect lightning strikes
are examined for the KAT-7 structure. Important FEKO model verification is achieved
through measurement of physical scale models in an anechoic chamber. The microwave
simulation code, CST, gives direct comparison of FEKO results by using a finite volume
time domain method of calculation.
Using frequency domain analysis on these models, the lightning down conductor design
over the dish antenna bearings is optimised with cost-effectiveness as one driving parame-
ter. RFI coupling levels for different designs are compared to each other to identify areas
requiring RFI mitigation. Analysis of resonances enables evaluation of the mitigation at
frequencies sensitive to radio astronomy.
A Sommerfeld integral ground plane is used together with the computational model
to investigate the use of the concrete foundation steel reinforcing as part of the lightning
earthing electrode system. Different interconnections of the steel reinforcing elements are
critically evaluated.
The KAT-7 design incorporated clear lightning protection and RFI mitigation policies
derived from recommendations contained within this dissertation.
ii

Opsomming
Suid-Afrika en Australie is nou die oorblywende twee lande wat bie vir die Vierkante Kilo-
meter Reeks (SKA), die grootste en mees sensitiewe projek nog ooit in radio astronomie
onderneem. Die Suid Afrikaanse SKA demonstreer sy tegnologiese bekwaamheid met die
Karoo Reeks Teleskoop (KAT of MeerKAT).
Die ontwikkeling van KAT vind plaas in fases om die ontwerp te optimaliseer en risikos
te minimaliseer met elke fase. ’n Reeks van sewe 12 m antennas, genaamd KAT-7, sal teen
die einde van 2009 klaar wees. Die volgende fase behels die konstruksie van MeerKAT,
wat sal lei tot ’n tagtig-skottel reeks.
Die fokus van hierdie proefskrif hanteer weerlig en radiofrekwensie steurings (RFS)
vir KAT-7. As gevolg van die omvang en kompleksiteit van die Suid-Afrikaanse demon-
streerder projek, is die studies hoofsaaklik op een struktuur gedoen. Parameters vir die
antenna-skottel en -voetstuk ontwerp het met hul ontwikkeling deurgaans verander. Om
effektief te wees, moes die doktorale navorsing hierdie veranderinge toepaslik volg.
’n Metode-van-Momente frekwensiedomein rekenaar elektromagnetiese kode, FEKO,
is deurgaans met die studie gebruik. Die gevolge van direkte en indirekte weerligslae vir
die KAT-7 struktuur is ondersoek. Belangrike FEKO model bevestiging is bereik met
metings van skaalmodelle in ’n anegoıse kamer. Die mikrogolf-simulasie kode, CST, gee
’n direkte vergelyking met die FEKO resultate deur ’n eindige-volume-tyd-domein metode
van berekening te gebruik.
Met behulp van frekwensiedomein analise van hierdie modelle, is die weerligafleier-
ontwerp oor die antenna-skottel laers ge-optimaliseer, met koste-effektiwiteit as een van
die drywingsparameters. RFS koppelingsvlakke vir onderskeie ontwerpe is teen mekaar
opgeweeg om areas te identifiseer wat RFS tempering benodig. Analise van resonansies
stel die evaluering van die tempering in staat teen frekwensies wat sensitief is vir radio
astronomie.
’n Sommerfeld integrale grondvlak word saam met die rekenaarmodel gebruik om die
insluiting van die beton se staalversterking as deel van die aardingselektrodestelsel te
ondersoek. Verskillende bindmetodes van die onderlinge staalversterkingselemente word
krities geevalueer.
Die KAT-7 ontwerp inkorporeer duidelike weerligbeveiligings- en RFS temperingstrate-
giee, komende van aanbevelings in hierdie proefskrif omskryf.
iii

Acknowledgements
First and foremost, I want to thank my Lord God for the strength and guidance through-
out the three years of research for this PhD degree. Thank you to my wife Ilse, for her
support through busy and difficult times, with tons of love and patience, and lots of cof-
fee and snacks. Thanks to my mother-in-law, father and step-mom for their enduring
support, and to my friends and family for all the words of encouragement.
I would like to thank the following people for their contribution to the work done in
this dissertation: Rodney Urban, Howard Reader, Riana Geschke, Willem Esterhuyse and
Wessel Crouwkamp, for their role in the design and building of the scale models. Riana,
Rodney, Howard, Paul van der Merwe, Philip Kibet and Martin Siebers, for assisting the
measurements in the anechoic chamber. Paul, Howard, Wernich de Villiers and Richard
Lord for helping with the measurements at HartRAO. Johan Cronje and Mel van Rooyen
at EMSS, for their support with the use of FEKO. Danie Ludick, Evan Lezar, Kevin Cole
and David Davidson for their help in accessing the high performance computing centres.
Willem, Richard, Carel van der Merwe, Japie Ludick and Kim de Boer for excellent
collaboration and support from the SA SKA. David, Johan Joubert and Lex van Deursen
for constructive comments on the final dissertation.
The author would like to thank the South African SKA offices and the Tertiary Educa-
tion Support Programme for funding the research project, EMSS South Africa for making
FEKO available to Stellenbosch University for research, the Stellenbosch University High
Performance Computer (Rhasatsha) support team as well as the Centre for High Perfor-
mance Computing (Iqudu) and their support team, and CST for the license used in this
research.
A final thank you to the greatest leadership one could ask for in two supervisors, Riana
and Howard. Thanks for continual support in many areas, professional guidance, friendly
assistance, informed advice and good humour throughout.
− Ek is tot alles in staat deur Hom wat my krag gee −
− Fil 4:13 −
iv

Dedication
This dissertation is dedicated to the love of my life −my wife, Ilse
v

Abbreviations
ADM Advanced Demonstrator Model
CEM Computational Electromagnetics
CHPC Centre for High Performance Computing
CM Common mode
CW Continuous Wave
dB Decibel
EM Electromagnetic
EMC Electromagnetic Compatibility
EMI Electromagnetic Interference
EMP Electromagnetic Pulse
ESA European Space Agency
FEM Finite Element Method
F.l.t.r. From left to right
Fig Figure
FDTD Finite Distance Time Domain
FVTD Finite Volume Time Domain
GHz GigaHertz
HartRAO Hartebeespoort Radio Astronomy Observatory
IEC International Electrotechnical Commission
ITU International Telecommunications Union
KAT Karoo Array Telescope
LDC Lightning Down Conductor
LOFAR Low Frequency Array
LPDA Log Periodic Dipole Antenna
LPS Lightning Protection System
MeerKAT Karoo Array Telescope (Final stage)
MHz MegaHertz
MLFMM Multilevel Fast Multipole Method
MoM Method of Moments
PEC Perfect Electric Conductor
vi

ABBREVIATIONS vii
RF Radio Frequency
RFI Radio Frequency Interference
RFS Radio Frekwensie Steurings
RSA Republic of South Africa
SA South African
SG Signal Generator
S-parameter Scattering parameter
SKA Square Kilometre Array
SMA Sub-miniature version A
SOLT Short-Open-Load-Through
VNA Vector Network Analyser
XDM Experimental Demonstrator Model

Contents
Declaration i
Summary ii
Opsomming iii
Acknowledgements iv
Dedication v
Abbreviations vi
1 Introduction 1
1.1 Background . . . . . . . . . . . . . . . . . . . . . . . . . . . . . . . . . . . 1
1.2 Challenge: Radio Astronomy, Lightning
Protection and Radio Frequency Interference
Mitigation . . . . . . . . . . . . . . . . . . . . . . . . . . . . . . . . . . . . 3
1.3 Methodology: Computational Electromagnetics . . . . . . . . . . . . . . . 5
1.4 Claims and Original Contributions . . . . . . . . . . . . . . . . . . . . . . 6
1.5 Dissertation Layout . . . . . . . . . . . . . . . . . . . . . . . . . . . . . . . 8
2 Literature Review 10
2.1 Introduction . . . . . . . . . . . . . . . . . . . . . . . . . . . . . . . . . . . 10
2.2 RFI Mitigation Plan . . . . . . . . . . . . . . . . . . . . . . . . . . . . . . 11
2.2.1 Identifying the Risk . . . . . . . . . . . . . . . . . . . . . . . . . . . 11
2.2.2 Characterising the RFI Source . . . . . . . . . . . . . . . . . . . . . 11
2.2.3 Computational Modelling . . . . . . . . . . . . . . . . . . . . . . . 13
2.2.4 Lightning Excitation and Scale Models . . . . . . . . . . . . . . . . 15
2.2.5 Lightning Protection System . . . . . . . . . . . . . . . . . . . . . . 15
2.3 Conclusion . . . . . . . . . . . . . . . . . . . . . . . . . . . . . . . . . . . . 16
3 Verification of FEKO Scale Model 17
3.1 Introduction . . . . . . . . . . . . . . . . . . . . . . . . . . . . . . . . . . . 17
viii

CONTENTS ix
3.2 Early Design 1/40th Scale Model . . . . . . . . . . . . . . . . . . . . . . . . 18
3.2.1 Physical Scale Model . . . . . . . . . . . . . . . . . . . . . . . . . . 19
3.2.2 FEKO Scale Model . . . . . . . . . . . . . . . . . . . . . . . . . . . 19
3.2.3 Verification by Measurement . . . . . . . . . . . . . . . . . . . . . . 21
3.3 Evaluation with CST Code . . . . . . . . . . . . . . . . . . . . . . . . . . . 25
3.4 Conclusions . . . . . . . . . . . . . . . . . . . . . . . . . . . . . . . . . . . 27
4 Real Earth in Scale Model 28
4.1 Introduction . . . . . . . . . . . . . . . . . . . . . . . . . . . . . . . . . . . 28
4.2 XDM Design 1/40th Scale Model . . . . . . . . . . . . . . . . . . . . . . . 28
4.2.1 Physical Scale Model . . . . . . . . . . . . . . . . . . . . . . . . . . 30
4.2.2 Scale Model in FEKO . . . . . . . . . . . . . . . . . . . . . . . . . 31
4.2.3 Verification by Measurement . . . . . . . . . . . . . . . . . . . . . . 31
4.2.4 Evaluation with CST . . . . . . . . . . . . . . . . . . . . . . . . . . 33
4.2.5 S-parameter Magnitude Results . . . . . . . . . . . . . . . . . . . . 36
4.3 XDM Scale Model with Simulated Karoo Soil . . . . . . . . . . . . . . . . 37
4.3.1 Measurement of Model with Simulated Soil . . . . . . . . . . . . . . 37
4.3.2 Simulated Soil in FEKO . . . . . . . . . . . . . . . . . . . . . . . . 37
4.3.3 Simulated Soil in CST . . . . . . . . . . . . . . . . . . . . . . . . . 42
4.3.4 Comparison of Results . . . . . . . . . . . . . . . . . . . . . . . . . 42
4.4 Full-scale Measurements at HartRAO . . . . . . . . . . . . . . . . . . . . . 43
4.5 Conclusions . . . . . . . . . . . . . . . . . . . . . . . . . . . . . . . . . . . 45
5 Accurate Scale Model of KAT-7 47
5.1 Introduction . . . . . . . . . . . . . . . . . . . . . . . . . . . . . . . . . . . 47
5.2 KAT-7 Design 1/20th Scale Model . . . . . . . . . . . . . . . . . . . . . . . 47
5.2.1 Physical Scale Model . . . . . . . . . . . . . . . . . . . . . . . . . . 48
5.2.2 Scale Model in FEKO . . . . . . . . . . . . . . . . . . . . . . . . . 50
5.3 Verification by Measurement . . . . . . . . . . . . . . . . . . . . . . . . . . 53
5.3.1 S-parameter Measurement . . . . . . . . . . . . . . . . . . . . . . . 53
5.3.2 Plane Wave Measurement . . . . . . . . . . . . . . . . . . . . . . . 56
5.4 Comparison of Results . . . . . . . . . . . . . . . . . . . . . . . . . . . . . 56
5.4.1 S-parameter Measurement Results . . . . . . . . . . . . . . . . . . 56
5.4.2 Plane Wave Measurement Results . . . . . . . . . . . . . . . . . . . 57
5.5 Conclusions . . . . . . . . . . . . . . . . . . . . . . . . . . . . . . . . . . . 60
6 KAT-7 Lightning Protection 62
6.1 Introduction . . . . . . . . . . . . . . . . . . . . . . . . . . . . . . . . . . . 62
6.2 CEM Model Used for RFI Investigations . . . . . . . . . . . . . . . . . . . 63

CONTENTS x
6.3 Equivalent Lightning Excitations . . . . . . . . . . . . . . . . . . . . . . . 66
6.3.1 Simulated Direct Lightning Strike . . . . . . . . . . . . . . . . . . . 66
6.3.2 Interpretation of Direct Strike Results . . . . . . . . . . . . . . . . 67
6.3.3 Simulated Indirect Lightning Strike . . . . . . . . . . . . . . . . . . 68
6.3.4 Interpretation of Indirect Strike Results . . . . . . . . . . . . . . . . 69
6.4 Lightning Down Conductor Investigations . . . . . . . . . . . . . . . . . . 69
6.4.1 LDC Over Elevation Bearings . . . . . . . . . . . . . . . . . . . . . 71
6.4.2 LDC Over Azimuth Bearing . . . . . . . . . . . . . . . . . . . . . . 73
6.4.3 Results for LDC Over Elevation Bearings . . . . . . . . . . . . . . . 74
6.4.4 Results for LDC Over Azimuth Bearing . . . . . . . . . . . . . . . . 79
6.4.5 Coated Interfaces and Corrective Bonding . . . . . . . . . . . . . . 82
6.5 RFI Resonances . . . . . . . . . . . . . . . . . . . . . . . . . . . . . . . . . 83
6.6 Earthing Investigations . . . . . . . . . . . . . . . . . . . . . . . . . . . . . 85
6.6.1 Numerical Modelling of Earthing and Bonding . . . . . . . . . . . . 87
6.6.2 Modelling Results . . . . . . . . . . . . . . . . . . . . . . . . . . . . 90
6.7 Conclusions . . . . . . . . . . . . . . . . . . . . . . . . . . . . . . . . . . . 95
7 Conclusions and Recommendations 97
List of Figures
1.1 Artist’s impression of the SKA, “the international radio telescope of the
21st century” [2]. . . . . . . . . . . . . . . . . . . . . . . . . . . . . . . . . 1
1.2 Government proclaimed radio quiet zone in the Karoo, called the “Central
astronomy advantage area” [1]. . . . . . . . . . . . . . . . . . . . . . . . . 2
1.3 Several lightning strikes, each typically conducting up to 300 kA (photo-
graph taken by the author). . . . . . . . . . . . . . . . . . . . . . . . . . . 4
1.4 The structure consists of three main elements: the parabolic dish, the
pedestal on which the dish is mounted, and the steel reinforced concrete
foundation. . . . . . . . . . . . . . . . . . . . . . . . . . . . . . . . . . . . 7
2.1 Amplitude density of lightning protection level 1 current against frequency [16]. 12
2.2 Lightning flash density map for RSA, showing the location of XDM and
KAT-7. . . . . . . . . . . . . . . . . . . . . . . . . . . . . . . . . . . . . . . 14
3.1 Photograph of the first scale model following an early KAT design. . . . . 18
3.2 FEKO model of the early KAT design, with basic dimensions. . . . . . . . 19
3.3 FEKO model showing the excitation ports and the dish wire which was
bent out of place in the direction indicated. . . . . . . . . . . . . . . . . . 20
3.4 Variations of FEKO results for S21 according to changes in dish geometry. . 21
3.5 Discretisation mesh of the FEKO model. . . . . . . . . . . . . . . . . . . . 22
3.6 Diagram of the measurement setup in the anechoic chamber. . . . . . . . . 22
3.7 Comparison between the measured and FEKO results for S11. . . . . . . . 23
3.8 Comparison between the measured and FEKO results for S21. . . . . . . . 24
3.9 Comparison between the measured and FEKO results for S22. . . . . . . . 24
3.10 Comparison between the measured and CST results for S11 [54]. . . . . . . 25
3.11 Comparison between the measured and CST results for S21 [54]. . . . . . . 26
3.12 Comparison between the measured and CST results for S22 [54]. . . . . . . 26
4.1 Photograph of the XDM as constructed at HartRAO. . . . . . . . . . . . . 29
4.2 Photograph of the XDM design scale model. . . . . . . . . . . . . . . . . . 29
xi

LIST OF FIGURES xii
4.3 XDM design FEKO scale model. The excitation port can be seen at the
top, and the measurement ports are placed one on the right hand side, and
one on the bottom ground plate. The basic dimensions are shown on the
figure. . . . . . . . . . . . . . . . . . . . . . . . . . . . . . . . . . . . . . . 30
4.4 Discretisation mesh of the XDM design FEKO model. . . . . . . . . . . . . 31
4.5 Diagram of the measurement setup for the XDM scale model. . . . . . . . 32
4.6 Photograph of the XDM scale model as measured in the anechoic chamber. 32
4.7 S11 Magnitude comparison between FEKO and measured results for the
excitation port of the XDM model without simulated soil. . . . . . . . . . 33
4.8 S11 Magnitude comparison between CST and measured results for the ex-
citation port of the XDM model without simulated soil. . . . . . . . . . . . 34
4.9 S21 Magnitude comparison between FEKO and measured results for the
bottom port of the XDM model without simulated soil. . . . . . . . . . . . 34
4.10 S21 Magnitude comparison between CST and measured results for the bot-
tom port of the XDM model without simulated soil. . . . . . . . . . . . . . 35
4.11 S21 Magnitude comparison between FEKO and measured results for the
side port of the XDM design model without simulated soil. . . . . . . . . . 35
4.12 S21 Magnitude comparison between CST and measured results for the side
port of the XDM model without simulated soil. . . . . . . . . . . . . . . . 36
4.13 XDM design scale model, filled with a salt solution to simulate Karoo soil. 37
4.14 XDM design FEKO scale model with a salt solution included as dielectric,
using a MoM / FEM hybrid solution. . . . . . . . . . . . . . . . . . . . . . 38
4.15 XDM design FEKO scale model with unrefined mesh and Sommerfeld
ground plane. . . . . . . . . . . . . . . . . . . . . . . . . . . . . . . . . . . 38
4.16 XDM design FEKO scale model with refined mesh and Sommerfeld ground
plane. . . . . . . . . . . . . . . . . . . . . . . . . . . . . . . . . . . . . . . 39
4.17 XDM design CST scale model with salt-water dielectric. . . . . . . . . . . 40
4.18 S11 Magnitude comparison between FEKO, CST and measured results for
the top port of the XDM design model with simulated soil. . . . . . . . . . 40
4.19 S21 Magnitude comparison between FEKO, CST and measured results for
the side port of the XDM design model with simulated soil. . . . . . . . . . 41
4.20 S21 Magnitude comparison between FEKO, CST and measured results for
the bottom port of the XDM design model with simulated soil. . . . . . . . 41
4.21 Continuous wave current injection using a signal generator connected to
the LDC of the XDM. . . . . . . . . . . . . . . . . . . . . . . . . . . . . . 44
4.22 Pick-up loops inside the XDM structure formed by cable sheaths and earth-
ing layout [56]. Test points are indicated by the letters TP and a number. . 45
5.1 Near-final engineering design of the KAT-7 structure. . . . . . . . . . . . . 48

LIST OF FIGURES xiii
5.2 Engineering drawing of the simplified scale model following the KAT-7
structure design. . . . . . . . . . . . . . . . . . . . . . . . . . . . . . . . . 49
5.3 Photograph of the KAT-7 design scale model, as set up in the anechoic
chamber for S-parameter measurement verification. . . . . . . . . . . . . . 49
5.4 KAT-7 design FEKO scale model with simulated lightning injection on the
dish focal point as the excitation port. A pick-up port is formed by a loop
connected to the bottom of the pedestal. Basic dimensions are shown in
the picture. . . . . . . . . . . . . . . . . . . . . . . . . . . . . . . . . . . . 50
5.5 EM plane wave simulating antenna excitation on FEKO model of KAT-7
with dish angled at 45 degrees. The ground plate is seen with this model
and has dimensions of 924 mm by 861 mm. . . . . . . . . . . . . . . . . . . 51
5.6 EM plane wave simulating antenna excitation on FEKO model of KAT-7
with dish angled at 90 degrees. . . . . . . . . . . . . . . . . . . . . . . . . 51
5.7 Diagram of the setup for the KAT-7 scale model S-parameter measurement. 52
5.8 Photograph showing the characterisation of LPDAs used for plane wave
excitation in anechoic chamber. . . . . . . . . . . . . . . . . . . . . . . . . 54
5.9 Diagram of the setup for the KAT-7 scale model plane wave antenna mea-
surement. . . . . . . . . . . . . . . . . . . . . . . . . . . . . . . . . . . . . 54
5.10 LPDA plane wave measurement verification of KAT-7 design scale model
in anechoic chamber. For this measurement the dish is angled at 45 degrees
facing away from the pick-up loop. . . . . . . . . . . . . . . . . . . . . . . 55
5.11 LPDA plane wave measurement verification of KAT-7 design scale model
in anechoic chamber. For this measurement the dish is angled at 90 degrees
and the elevation set screw is on the opposite side of the pick-up loop. . . . 55
5.12 S11 magnitude comparison of ADM scale model measurement and FEKO
simulation. . . . . . . . . . . . . . . . . . . . . . . . . . . . . . . . . . . . . 57
5.13 S21 magnitude comparison of ADM scale model measurement and FEKO
simulation. . . . . . . . . . . . . . . . . . . . . . . . . . . . . . . . . . . . . 58
5.14 S22 magnitude comparison of ADM scale model measurement and FEKO
simulation. . . . . . . . . . . . . . . . . . . . . . . . . . . . . . . . . . . . . 58
5.15 S21 magnitude comparison of plane wave excitation ADM scale model mea-
surement and FEKO simulation. Here the dish is angled at 45 degrees and
facing away from the pick-up loop. The antenna gain and noise floor level
for the measurement is shown as well. . . . . . . . . . . . . . . . . . . . . . 59
5.16 S21 magnitude comparison of plane wave excitation ADM scale model mea-
surement and FEKO simulation. Here the dish is angled at 90 degrees and
the elevation set screw on the opposite side of the pick-up loop. The an-
tenna gain and noise floor level for the measurement is shown as well. . . . 60

LIST OF FIGURES xiv
6.1 SA SKA design drawing with detail on the KAT-7 base. The pedestal is
elevated onto a concrete lip to allow levelling at the construction phase.
The structure is then effectively lifted from ground level by 32 bolts. . . . . 63
6.2 Photographs of the foundation showing the foundation bolts on the concrete
lip on the left, and the space provided for cable entry on the right. . . . . . 64
6.3 From left to right (f.l.t.r.): The LDC dish lightning rod; The receiver light-
ning rod; The area where the receiver lightning rod conductor goes through
the dish; The connection between the conductors from the receiver rod and
the dish rod. . . . . . . . . . . . . . . . . . . . . . . . . . . . . . . . . . . . 64
6.4 F.l.t.r. The LDC on the backing structure where it splits in two; The
strap shown here going beneath the elevation bearing axle; The ring-plate
connection to 4 copper shoes over the azimuth bearing. . . . . . . . . . . . 65
6.5 KAT-7 FEKO model with lightning rods and complete LDC added. The
model is raised onto the foundation bolts, which in the model’s case is
connected to the ground plane. A direct lightning strike is modelled by a
current injection at the receiver lightning rod. . . . . . . . . . . . . . . . . 66
6.6 Current injection through lightning rod onto struts of dish for equivalent
direct-lightning strike. Loops are formed between the dish struts, structure
and ground. . . . . . . . . . . . . . . . . . . . . . . . . . . . . . . . . . . . 67
6.7 Computed current density and electric field results for the equivalent direct-
lightning strike. Currents are more uniform on each strut and the capacitive
coupling between dish and pedestal at mid-pedestal height is just apparent. 68
6.8 Comparison of electric field results for an equivalent direct strike. A cross-
section of the bottom part of the pedestal is shown with an open floor on
the left and a shielded floor on the right. The electric field values are shown
for points on the z-axis in the middle of the pedestal. . . . . . . . . . . . . 69
6.9 Plane-wave excitation from different directions, modelling indirect lightning
strikes. . . . . . . . . . . . . . . . . . . . . . . . . . . . . . . . . . . . . . . 70
6.10 Sectioned view of plane-wave excitation from the front of the dish. Higher
current density is apparent on the lower and upper struts. . . . . . . . . . 70
6.11 KAT-7 scale model in FEKO, with lightning down conductors (1st and 3rd
arrow from the top), straps over elevation bearings (2nd arrow), and shoes
over azimuth bearing (4th arrow). . . . . . . . . . . . . . . . . . . . . . . . 71
6.12 F.l.t.r. Full scale elevation bearing design; Scale model straps over elevation
bearings in FEKO; Simplified FEKO structure with straps over elevation
bearings. . . . . . . . . . . . . . . . . . . . . . . . . . . . . . . . . . . . . . 72
6.13 The LDC straps are shown here connected over the elevation bearing axle
on the left, and connected beneath the axle on the right. . . . . . . . . . . 72

LIST OF FIGURES xv
6.14 Full scale azimuth bearing design, showing the inner ring of the bearing in
the middle picture and the outer ring in the picture on the right. One of
the 71 roller elements is shown, designed in such a way to be able to take
the weight of the yoke and dish. . . . . . . . . . . . . . . . . . . . . . . . . 73
6.15 F.l.t.r. Full scale azimuth bearing design; Scale model design in FEKO of
shoes over azimuth bearing; Simplified FEKO model with shoes over az-
imuth bearing; Detail of air gap simulating coated surface between bearing
interfaces. . . . . . . . . . . . . . . . . . . . . . . . . . . . . . . . . . . . . 74
6.16 Surface current density results for a direct current injection. The dish is
angled at 45 degrees and the straps connected over the elevation bearing
axle. . . . . . . . . . . . . . . . . . . . . . . . . . . . . . . . . . . . . . . . 75
6.17 Surface current density results for a direct current injection. The dish is
angled at 45 degrees and the straps connected beneath the elevation bearing
axle. . . . . . . . . . . . . . . . . . . . . . . . . . . . . . . . . . . . . . . . 75
6.18 Surface current density results for a plane-wave excitation from the side.
The dish is angled at 45 degrees and the straps connected over the elevation
bearing axle. . . . . . . . . . . . . . . . . . . . . . . . . . . . . . . . . . . . 76
6.19 Surface current density results for a plane-wave excitation from the side.
The dish is angled at 45 degrees and the straps connected beneath the
elevation bearing axle. . . . . . . . . . . . . . . . . . . . . . . . . . . . . . 77
6.20 Surface current density results for a direct current injection. The dish is
angled at 90 degrees and the straps connected over the elevation bearing
axle. . . . . . . . . . . . . . . . . . . . . . . . . . . . . . . . . . . . . . . . 77
6.21 Surface current density results for a direct current injection. The dish is
angled at 90 degrees and the straps connected beneath the elevation bearing
axle. . . . . . . . . . . . . . . . . . . . . . . . . . . . . . . . . . . . . . . . 78
6.22 Surface current density results for a plane-wave excitation from the side.
The dish is angled at 90 degrees and the straps connected over the elevation
bearing axle. . . . . . . . . . . . . . . . . . . . . . . . . . . . . . . . . . . . 78
6.23 Surface current density results for a plane-wave excitation from the side.
The dish is angled at 90 degrees and the straps connected beneath the
elevation bearing axle. . . . . . . . . . . . . . . . . . . . . . . . . . . . . . 79
6.24 Simulations repeated with coated surfaces for the dish at 45 degrees. The
first picture shows current density results for the straps over the bearings
and the following picture for the straps below. . . . . . . . . . . . . . . . . 80

LIST OF FIGURES xvi
6.25 Different scenarios for connection of the LDC copper shoes over the azimuth
bearing. F.l.t.r. No conductors or shoes connected; Two conductors and
two shoes connected; Four shoes connected, but no conductors, thus the
steel of the yoke and pedestal is used for the LDC; Four conductors and
four shoes connected. . . . . . . . . . . . . . . . . . . . . . . . . . . . . . . 80
6.26 Surface current density on the bearing elements for four shoes connected
over the bearing, as seen from below and from inside the structure. . . . . 81
6.27 Original design over the azimuth bearing on the left, showing high current
density at the coated interfaces due to capacitive coupling. The altered
design on the right shows noticeably lower current density at key interfaces
compared to the previous figure. . . . . . . . . . . . . . . . . . . . . . . . . 82
6.28 Simulated electric field inside the bottom of the pedestal structure, for
three different scenarios, f.l.t.r. Coated interfaces with high electric field
levels inside the pedestal; Optimised bonding with decreased electric field
levels inside the pedestal; Ideal galvanically connected structure with very
low electric field levels inside. The electric field values are shown for points
on the z-axis in the middle of the pedestal. . . . . . . . . . . . . . . . . . . 83
6.29 Surface current density results, at 587 MHz, in and outside the pedestal
and yoke, for the azimuth bearing galvanically connected. . . . . . . . . . . 84
6.30 Photographs f.l.t.r. The foundation excavation for one of the KAT-7 an-
tennas with the steel reinforcing to be used in the background; The steel
reinforcing for one of the structure foundations; Welding of foundation steel
reinforcing elements to improve resistance to earth. . . . . . . . . . . . . . 86
6.31 F.l.t.r Early design sketch of the earth electrode layout; The pedestal
mounting foundation bolts connected to the reinforcing; Earth electrode
connected to the foundation ring with a bolted lug; Exo-thermic welding
connection for the earth electrode conductors. . . . . . . . . . . . . . . . . 87
6.32 FEKO simulation of the simplified pedestal and steel reinforcing connected
to the earthing. An infinite Sommerfeld ground plane simulates the soil
interface. The interface at the bottom of the soil is set up as a PEC
ground plane. Symmetry is used to reduce computation time, seen as
two green rectangles. A current injection is modelled with four concentric
conductors, connected from the PEC earth below the soil. They combine
above the model to connect to a discrete voltage port with fixed current
value, which is used to simulate a direct lightning strike. . . . . . . . . . . 88

LIST OF FIGURES xvii
6.33 The picture on the left gives a side view of the model with the reinforcing
and earth. The only current return path is formed by the earthing con-
ductors via the soil to the PEC ground plane; The picture on the right
shows how the earthing conductors are connected to the pedestal founda-
tion ring in the middle of the steel reinforcing. Different interconnections
of the elements and earthing are investigated. . . . . . . . . . . . . . . . . 89
6.34 Steel reinforcing elements not interconnected to investigate the effect on
earthing. . . . . . . . . . . . . . . . . . . . . . . . . . . . . . . . . . . . . . 90
6.35 Wire current and surface current density results from FEKO 1 GHz simu-
lation for steel reinforcing rods interconnected. . . . . . . . . . . . . . . . . 91
6.36 Wire current and surface current density results from FEKO 1 GHz simu-
lation for steel reinforcing rods not interconnected. . . . . . . . . . . . . . 92
6.37 Wire current results from FEKO 1 GHz simulation for steel reinforcing
rods interconnected. . . . . . . . . . . . . . . . . . . . . . . . . . . . . . . 93
6.38 Wire current results from FEKO 1 GHz simulation for steel reinforcing
rods not interconnected. . . . . . . . . . . . . . . . . . . . . . . . . . . . . 94
7.1 Photograph of the first KAT-7 dish being installed in the Karoo during
July 2009 [1]. . . . . . . . . . . . . . . . . . . . . . . . . . . . . . . . . . . 98

Chapter 1
Introduction
The ambitious goals of the international Square Kilometre Array (SKA) project, brings to
mind the mission statement of the popular Star Trek series created by Gene Roddenberry:
“To boldly go where no man has gone before”.
This biggest and most sensitive project ever undertaken in radio astronomy, endeav-
ours to probe to the edges of the universe. It will help to answer fundamental questions in
astronomy, physics and cosmology, including the nature of dark energy and dark matter,
as well as to explore the origins of the first galaxies, stars and planets [1]. An artist’s
impression of the international SKA is shown in Fig. 1.1.
1.1 Background
The Republic of South Africa (RSA) and Australia are now the two remaining countries
bidding to host the SKA. A consortium of the major international science funding agencies,
Figure 1.1: Artist’s impression of the SKA, “the international radio telescope of the
21st century” [2].
1

Chapter 1 — Introduction 2
in consultation with the SKA Science and Engineering Committee (SSEC), will announce
the selected site for the SKA in 2012.
The South African (SA) SKA is demonstrating its technology capabilities through the
Karoo Array Telescope (KAT or MeerKAT), currently under construction in the Karoo
area of the Northern Cape province. The development of KAT is taking place in stages to
optimise design and minimise risks at each stage. An interferometer array of seven 12 m
antennas will be complete by the end of 2009, called KAT-7. The following phase will
see the construction and commissioning of MeerKAT, which will lead to eighty arrayed
dishes at the same site [1].
Figure 1.2: Government proclaimed radio quiet zone in the Karoo, called the “Central
astronomy advantage area” [1].

Chapter 1 — Introduction 3
1.2 Challenge: Radio Astronomy, Lightning
Protection and Radio Frequency Interference
Mitigation
To better convey the sensitivity needed for radio astronomy, the non-SI unit used by
radio astronomers, jansky, is explained. Named after Karl Guthe Jansky, who was the
first person to observe radio waves emanating from the milky way, the jansky is a measure
of the spectral power flux density, or the “strength” of radio sources, and is defined as:
1 Jy = 1 ∗ 10−26 [W/m2/Hz] (1.1)
As an example, one of the strongest radio sources at 1420 MHz (except for the sun) is
Virgo A, at 201.81 Jy. If a 26 m radio astronomy antenna were to point at this star for 30
years, 12 hours each day, the total collected energy (approximately 25 nWh) would still
be a million times less than the energy a 100 watt bulb would consume in 1 second [1, 3].
Strong sources like Virgo A are well researched, so radio astronomers are more inter-
ested in sources within the milli-jansky range, and the SKA will probe the micro-jansky
range and smaller. Because of this sensitivity of the antennas, the surrounding environ-
ment should preferably be radio frequency interference (RFI) free. Even static build-up
on a nylon chair or loose hardware on a power line will interfere with the radio signals [3].
Considering these facts, it becomes clear that RFI can influence the measurements
done by a radio telescope. This interference can enter the data stream at any frequency.
Even if the interference is not at precisely the same frequency, the electronic receiver
circuits can be driven into saturation, causing data corruption.
The SKA site in the Karoo chosen by South Africa is already relatively RFI free. To
safeguard this advantage, the SA Government has proclaimed the site as a radio quiet
zone (Fig. 1.2). The surrounding mountains also provide natural shielding from outside
interference for the site.
However, there are still several possible causes of RFI with the introduction of the
SKA into this environment, such as self-generated noise, coupling between neighbouring
antenna systems and conducted noise through the power cabling and earthing systems.
Direct and indirect lightning strikes (shown in Fig. 1.3) form an equivalently impor-
tant part of the investigation. Some of the RFI aspects may be mitigated with good
electromagnetic compatibility (EMC) design principles and proper implementation. The
dissertation addresses these challenges in conjunction with specific aspects relevant to the
lightning protection.
RFI coupling and lightning damage mechanisms need to be determined and mitigated.
If RFI needs to be addressed at the digital signal processing stage, the electronic hardware
increases in expense. The research considers the identification of areas in the design which

Chapter 1 — Introduction 4
Figure 1.3: Several lightning strikes, each typically conducting up to 300 kA
(photograph taken by the author).
are in need of RFI mitigation. Spectral analysis of lightning shows that there are frequency
components up to 50 MHz. Most of the damage to systems is done at the low frequencies
(kHz). RFI is more strongly coupled in the MHz frequency range. When developing
measures to protect against both direct and indirect lightning, system EMC integrity is
simultaneously improved. An illustration of this point is given in section 6.4.4, where by
diverting lightning currents, interior coupling from exterior interference is reduced by more
than 10 dB. Although this is demonstrated at 50 MHz, current diversion has implications
for a wide span of high frequency signals. Lightning protection and interference hardening
by current diversion are discussed in [4].
Where RFI and lightning problem areas in the design can be identified before imple-
mentation, a significant cost-saving can be achieved, especially when a total of 80 dishes
for MeerKAT are considered. This is ever more true for the full SKA project. The research
described in this dissertation gives practical contributions toward this goal.
The electronic systems also need to be protected against lightning overvoltages, and
lightning-induced currents and fields. General surge protection is dealt with by the project
contractors. What the doctoral research adds to the protection, is to use solid EMC
principles to minimise RFI levels toward the inside of the pedestal, where the sensitive
electronics reside.
At the KAT-7 stage of the project, time deadlines are strictly adhered to, and design
parameters are continuously evolving as the manufacturing and construction of the an-
tenna structures are carried out. These factors influence the decision on how the research

Chapter 1 — Introduction 5
is conducted, as time-constraints decree the level and speed at which valuable feedback
on design changes need to be given for implementation on KAT-7.
1.3 Methodology: Computational Electromagnetics
Many lightning studies have been conducted in both the time and frequency domain.
Each domain has specific benefits, depending on what is investigated. Lightning impulses
can be accurately modelled, simulated and injected into a physical measurement setup.
Time-domain measurements can be done with an oscilloscope, and the signals Fourier
transformed to consider frequencies of interest.
For the investigations in this dissertation, the frequency domain was chosen. Working
in the frequency domain, high dynamic range measurements are possible (as seen in sec-
tion 5.4.2, Fig. 5.15). Specific frequencies can be used to investigate coupling mechanisms,
identify current paths and apply good EMC principles for lightning protection and RFI
mitigation.
If analysis were done in the time-domain, a Fourier transform of the results allows
a comprehensive frequency study of the system. In some cases this is advantageous.
However, in a measurement environment, an oscilloscope is necessary to replicate these
measurements. An oscilloscope has inherently low dynamic range. In EMC studies, in-
stead of analysing all frequencies, a single frequency in a high dynamic range measurement
system often yields principal issues. In particular, interface integrity is readily identified.
For example, a cable penetrating a galvanic barrier which does not make 360 degree con-
tact, will allow exterior currents through the barrier at all frequencies. This test is not
frequency specific. It can be argued that in a complex system, such as a radio telescope,
all possible frequencies should be tested. In practice, specific resonant frequencies will
change from one system to another by the movement of a single cable. In our research,
we have opted to focus on system principles with high sensitivity measurements to identify
specific areas of concern.
Instead of considering the whole array of seven antennas as a complete system, only
one dish design is investigated. FEKO [5], a Method of Moments (MoM) based frequency
domain code, is used for numerical modelling of the design due to the code’s computa-
tional speed with conductive wires and surfaces. Simplified geometrically scaled numerical
models in FEKO (following scaling principles discussed in [6, 7]) are verified by rigorous
scattering parameter (S-parameter) measurements of physical scale models in an anechoic
chamber, using high-dynamic-range measurement equipment. The frequency range of in-
vestigation is determined by the relevant equipment capabilites (e.g. anechoic chamber
from 500 kHz) and CEM code computational requirements at higher frequency (above
6 GHz, the simulations become computationally expensive). Additional verification is

Chapter 1 — Introduction 6
done with a finite volume time domain (FVTD) code, CST [8].
With the inclusion of a Sommerfeld integral ground plane in FEKO and dielectric
material in CST, soil can be considered in a numerical model. Verification is done by
adding a saltwater mix with the correct conductivity to the corresponding physical scale
model and taking S-parameter measurements.
The verified numerical model following the KAT-7 design gives accurate predictions
of lightning induced current paths and electromagnetic (EM) field levels for the complete
structure. Direct lightning strikes are modelled with a direct current injection onto the
numerical model, and an indirect strike is modelled using EM plane waves from different
directions.
Coupling levels for different lightning down conductor (LDC) designs are compared to
each other to decide on cost-effective solutions for KAT-7. Specific surface current and
electric field results are not considered, but comparative levels are used together with
solid EMC design principles to select the best options for lightning protection and RFI
mitigation. Keeping within the frequency limits of the available equipment, CEM codes
and actual lightning frequencies, the high-frequency component of lightning at 50 MHz
was chosen as a representative frequency for investigations. This principle has been used
in lightning investigations within South Africa’s power utility, ESKOM.
AdaptFEKO is used to evaluate worst case coupling levels for these designs at resonant
frequencies, and areas that require RFI mitigation are identified.
Following lightning protection standard [9] good practices on earthing, the steel rein-
forcing of the concrete foundation for the structure is bonded to the earthing electrode.
The effectiveness of the interconnection of the steel reinforcing elements are evaluated in
FEKO by including the Sommerfeld integral ground plane in the numerical model.
1.4 Claims and Original Contributions
The KAT-7 structure consists of three main elements as shown in Fig. 1.4, the dish, the
pedestal and the foundation (including earthing). The original KAT-7 design incorporated
clear lightning protection and RFI mitigation policies derived from recommendations con-
tained within this dissertation. However, mechanical construction of complete structures
must be regarded as the primary design criteria. During the construction process the
structure was fabricated with environmental conditions in mind. Specifically this led to
main surfaces and interfaces being protected by either gun-coating or paint, which directly
compromised the galvanic integrity of the entire system.
This dissertation presents original design contributions for lightning protection and
RFI mitigation for KAT-7. This has had a significant bearing on South Africa’s intended
demonstrator for the world’s largest radio astronomy project, the SKA. The contributions

Chapter 1 — Introduction 7
Figure 1.4: The structure consists of three main elements: the parabolic dish, the
pedestal on which the dish is mounted, and the steel reinforced concrete foundation.
have been tested using the computational electromagnetic code, FEKO. The validity of
this approach has been established through extensive checking of physical and computa-
tional scale models. The following principal claims are made concerning:
Method of lightning excitation in models
• At the 2008 URSI conference [10], the validity of a simulated lightning current in-
jection measurement was brought into question. Our modelling has shown how this
injection method does influence the measurement. However, when used according
to recommendations in [11], the method is presently deemed to be valid. The au-
thor has demonstrated an improvement on the method by taking the excitation
conductor connected to ground on four different sides. This is shown to give a
more symmetrical injection current which does not influence the levels on one side
only (see section 6.6.2). Additionally, a plane-wave excitation technique has been
introduced for comparison.
The lightning down conductor design
• Using verified CEM scale model simulations of different strapping connections over
the elevation bearings of the KAT-7 dish, the author has shown that straps con-
nected below the elevation bearing axle provide better protection for the bearings

Chapter 1 — Introduction 8
at higher frequency. This involves a cost-saving for the project, with shorter straps
being sufficient.
• When the LDC over the azimuth bearings was considered, coated surfaces and static-
bearing roller elements are taken into account for modelling. The author has shown
the influence that these coatings have on capacitive coupling levels and RFI toward
the inside of the pedestal structure. Using copper shoes, corrective bonding and
alternative termination of the lightning conductors, a considerable improvement was
made for the distribution of surface currents around the azimuth bearing. Coupling
levels toward the inside of the pedestal were reduced as well.
Identification of resonances
• A demonstration was given of how the FEKO program AdaptFEKO can be used to
identify structure resonances for a defined frequency range. This will enable inves-
tigations into a pedestal, fully populated with equipment and cabinets, to highlight
areas requiring RFI mitigation.
The lightning earthing electrode design
• Project cost and time are saved by evaluating the inclusion of the foundation re-
inforcing as part of the lightning earthing system. This eliminated the need for
welded interconnection of all metallic elements of the reinforcing, which can take up
to three days per structure. The findings were achieved with MoM code combined
with a Sommerfeld integral ground plane and simulated soil below.
1.5 Dissertation Layout
Chapter 2 of this dissertation discusses published literature on lightning protection and
modelling, scale models and measurement, as well as computational electromagnetic
(CEM) codes used for investigating lightning and RFI in structures above and below
ground. The design, construction and verification of the first scale model used in this
research is detailed in chapter 3. A consequent design scale model is used to refine in-
vestigation methods to include soil conditions in the model (chapter 4). The 5th chapter
considers the detailed physical scale model of KAT-7 and the verification of the compu-
tational scale model for current injection and plane wave excitation.
Using the verified KAT-7 scale model in FEKO, detail and results on lightning ex-
citations and investigations into the lightning down conductor design can be found in
chapter 6. AdaptFEKO is used to consider resonant frequencies to identify areas requir-
ing RFI mitigation. Specific studies toward optimal earthing connections of the KAT-7

Chapter 1 — Introduction 9
foundation steel reinforcing, using FEKO together with a Sommerfeld integral ground
plane, are shown here as well.
Finally, chapter 7 concludes the dissertation with an evaluation of the contributions
of this research to KAT-7 and recommendations on future work for MeerKAT. This is
followed by the bibliography.
− Whether you believe you can do something or not, you are right −
− Henry Ford −

Chapter 2
Literature Review
In this review chapter, important aspects of existing literature related to this dissertation
are highlighted. Basic principles of the RFI mitigation plan, and where they fit into
the lightning protection for this project, are explained. The current focus for modelling
of lightning is mentioned, and the application of certain methods previously used are
discussed. The use of numerical electromagnetic modelling to evaluate the current and
electric field behaviour of a lightning protection system during a lightning strike is detailed.
Scale model measurement verification of such numerical models, plays an important role
in the level of confidence that can be placed in the computational results. With the unique
requirements in radio astronomy radio frequency (RF) engineering, the implementation of
our contribution toward the lightning protection and RFI mitigation on KAT-7 is given.
2.1 Introduction
Considering all the aspects involved in the design of lightning protection and RFI miti-
gation of a very complex system, it is clear that a systematic approach is essential. The
main trait that sets this project apart from any other, is the level of RFI protection that
is needed due to the sensitivity of the radio astronomy equipment (see section 1.2). The
possibility exists to eliminate the effects of RFI in the received radio signals through dig-
ital signal processing, but with the sheer amount of antenna dishes for the project, that
option is eliminated from a cost perspective. The computing power and storage capacity
for this alternative for the full SKA is not even available at present. The most expedient
method to ensure effective RFI mitigation, is to complement the design of the lightning
protection system with solid EMC design principles in order to minimise RFI coupling
toward the sensitive instrumentation inside each structure.
10

Chapter 2 — Literature Review 11
2.2 RFI Mitigation Plan
Practical guidelines on EMC management can be found in [12, 13, 14, 15]. Key items for
a complex system is that EMC issues need to be clearly identified, defined and controlled.
The identification of critical aspects for system susceptibility and electromagnetic inter-
ference (EMI) or RFI mitigation, control of assembly and installation, as well as defining
the tests to be done, all form an important part of the control plan.
2.2.1 Identifying the Risk
With the proclamation of the core area in the Karoo as a radio quiet site, lightning was
identified as one of the possible environmental sources of interference. Low frequency
lightning induced currents and voltages from both direct and indirect strikes may lead to
equipment failure and even loss of life. This is mainly governed by international standards
on lightning protection. Higher frequency induced currents and voltages may interfere
with the data-streams of the radio astronomy observations, and here RFI mitigation
plays an important role.
The standards on protection against lightning [16, 17] give information regarding the
basic parameters of lightning current, lightning coupling mechanisms, lightning threat
parameters, protection levels and the determination of cost-effectiveness of the lightning
protection system (LPS). The method of risk assessment for damage to structures, failure
of equipment or loss of life, and the management thereof, are explained in [18]. Clear
guidelines on specific requirements for the lightning air terminations, LDC and earth ter-
mination system are stipulated in [9]. The lightning protection of electrical and electronic
equipment inside structures is dealt with in [19]. This chapter will not go into the detail
of these factors, but will only highlight some of the issues relevant to RFI mitigation on
the KAT-7 structures.
2.2.2 Characterising the RFI Source
At the early stages of the research, several international radio astronomy observatory
sites were visited to discuss existing EMC, lightning protection, and earthing policies.
This included Astron, Westerbork Sterrenwacht and Low Frequency Array (LOFAR) in
the Netherlands, as well as Jodrell Bank Observatory and Manchester University in the
United Kingdom [20]. These discussions helped to focus on the main issues that are of
concern, including current paths, earthing and the relevant aspects of shielding.
To understand the risks involved with direct and indirect lightning strikes on the LPS
of a structure, the above-mentioned International Electrotechnical Commission (IEC)
standards were reviewed. In [16] the parameters of lightning current are explained. Light-

Chapter 2 — Literature Review 12
Figure 2.1: Amplitude density of lightning protection level 1 current against
frequency [16].
ning flashes to earth can be downward or upward flashes, initiated by either downward
leader from cloud to earth, or upward leader from an earthed structure to cloud. The
lightning current can consist of one or more long or short strokes. These strokes have
different time-pulse characteristics. A stroke consists of a current curve rising to a peak
value in a short time interval, and then decreasing over time to zero value. The front time
is defined in the standard as the time interval from 10 % to 90 % of the peak current value,
and the time to half value as the time from a virtual origin to half the peak value when
the current is decreasing. The different strokes, combined to form a lightning strike, give
rise to a frequency content as seen in Fig. 2.1. The figure shows the maximum current
amplitude density as a function of frequency. From the envelope curve one can see that
the higher frequency content up to 50 MHz is mainly due to short strokes subsequent to
an initial short stroke. The subsequent short stroke has a front time of 0.25 µs, and a
time to half-value of 100 µs.

Chapter 2 — Literature Review 13
To simulate the effects of lightning on a lightning protection system, test parameters
similar to the peak current values shown in Fig. 2.1 are used to calculate the current
levels to which the LPS will be subjected during direct strikes. Both direct and indirect
lightning strikes can induce currents on other parts of the structure. Different coupling
mechanisms are detailed in [17], of which resistive coupling and magnetic coupling have
the greatest influence. A lightning discharge to an object creates a potential rise reaching
several hundreds of kV at the point of impact with respect to remote earth, generating
currents that are distributed amongst conductive paths which are bonded to the reference
point of the system. For indirect lightning, magnetic fields are created by the lightning
discharge channel, having approximately the same time variation as the current at dis-
tances of hundreds of metres. The magnetic field variations induce voltages and currents
in conductive paths on a structure.
In [18] the risk assessment of lightning is discussed in detail. Parameters that influence
the calculation, are the lightning flash density of a specific area, as well as the collection
area of the structure. A map of the lightning flash density for South Africa is given in
Fig. 2.2. The core area for KAT-7 and MeerKAT has a flash density of approximately
two to three lightning strikes per square kilometre per year. To ensure that the lightning
protection is cost-effective, a calculation has to be done to compare the cost of loss with
no LPS, versus the cost of the LPS plus the cost of possible loss with the LPS installed.
With the amount of structures planned for MeerKAT and the SKA, the probability
of a lightning strike exists. With the high levels of lightning current and risk of RFI to
sensitive equipment inside the structure, we decided to incorporate an LPS in the design.
However, cost-effectiveness remains the principal design constraint.
2.2.3 Computational Modelling
To simulate the effects of a lightning stroke, one of the International Telecommunication
Union (ITU) recommendations for protection against interference [11], recommends the
Method of Moments. This approach has been successfully used in literature [21, 22,
23]. Numerical models are preferred above measurement methods for situations where
experimental reproduction of interference is difficult [23]. The radio astronomy sites
where this project’s telescopes will be installed, are all radio quiet zones. This eliminates
the measurement methods as proposed by [24, 25], using an electromagnetic pulse (EMP)
simulator as a lightning simulation.
When using computational modelling, verification of the code is done with measure-
ments to validate the numerical calculations [22, 24, 26]. The use of scale models enables
these measurements to be done in a controlled environment [22, 24, 25, 27, 28]. How-
ever, we did not have access to equipment such as EMP simulators [24, 25] to use for
experimental validation of our computational code.

Chapter 2 — Literature Review 14
Figure 2.2: Lightning flash density map for RSA, showing the location of XDM and
KAT-7.
Equipment available to us, was a Hewlett Packard two-port vector network analyser
(VNA) and an anechoic chamber. S-parameters can be measured on devices inside the
chamber using the VNA in the frequency range from 300 kHz to 18 GHz.
With the MoM used in the frequency domain, and the available equipment able to
do accurate frequency domain measurements, the MoM based code FEKO was selected
for our simulations. Doing analysis in the frequency domain enables investigations at
frequencies which are of specific interest. To evaluate electromagnetic fields and currents
on the KAT structure due to external RFI from lightning, the modelling was done at the
highest probable lightning frequency of 50 MHz.
A finite difference time domain (FDTD) or finite volume time domain code can be
used for lightning analysis as well [22, 29], and to evaluate specific frequencies require
mathematical manipulation of the results using Fourier transforms [22]. This function is
available in the FVTD based code, CST [8]. The code is used in our work to compare the
MoM results at the verification stage of this project. Detail on the MoM can be found
in [5, 30] and the FDTD and FVTD methods are explained in [8, 30].

Chapter 2 — Literature Review 15
2.2.4 Lightning Excitation and Scale Models
Extensive modelling has been done in the time domain of the lightning return stroke
channel and current [6, 31, 32, 33]. One paper discussed this lightning excitation using
a thin-wire antenna model [34]. The source used for the modelling is typically a voltage
source tuned to provide a specific current impulse [21, 35, 36].
To verify the modelling, scale models are constructed with impulse generators as the
main excitation [37, 38, 39]. The current injection simulating a direct strike is constructed
on the scale model as a vertical wire onto a specific part of the scaled structure [22, 39].
Detail on how to incorporate the scaling factors to real values are given in [6]. However,
an interesting observation from [40] states that care should be taken when relating scale
model parameters to real parameters. Conductivity has to be scaled as well, and with a
scaling factor of four for example, that involves a scaled conductivity of four times the
real value [6, 7, 40]. Additionally, relative permittivity does not scale according to the
scaling factor, thus making the use of dielectric in a scale model difficult to relate to
real models with dielectric [40]. Scale model parameters can, however, be replicated in
numerical models.
A recent progress overview of lightning modelling in [29], relates several interesting
uses of computational modelling. One example is simplification of the model using perfect
electric conducting (PEC) ground plane. To evaluate the effect of finitely conducting soil
on electromagnetic fields at the air-soil interface, more precise modelling is done using the
Sommerfeld integral [29, 41].
A final observation on the lightning excitation is made from [11]. A test setup to
simulate lightning effects for modelling and measurement is given. The earthing of a
structure is used as a return path connected to the earth of the lightning excitation. Here
it is warned that the position of the excitation conductor can influence the measurement
of induced voltages inside the structure. This is shown with an example done at a constant
frequency with constant continuous wave (CW) current excitation.
Some practical issues regarding the LDC design for wind turbines is discussed in [42],
explaining the influence of indirect lightning strikes as well. This shows the need to model
indirect lightning strikes for models.
2.2.5 Lightning Protection System
In [43, 44], realistic models of European Space Agency (ESA) launch vehicles and their
lightning down conductors are replicated in numerical models to study the lightning pro-
tection system. Specifically, [43] refers to the lightning qualification logic applied to the
ARIANNE 5 launcher, complying with technical efficiency, cost and schedule constraints.
The modelling in [44] assumes perfect connections for all steel elements in their simula-

Chapter 2 — Literature Review 16
tions. However, where there are discontinuities in the structure, and the lightning current
path impedance changes, reflections of the lightning impulse may occur [21]. These re-
flections in the time domain can be related to resonances in the frequency domain, for
which [45] explains how radio frequency resonances and nulls are influenced by reinforced
concrete construction.
The suggestion is made in both [44, 46] that the entire LDC system be incorporated
in modelling. For their simulations, finite-conductivity soil is included in the numeri-
cal calculation. With the inclusion of soil conditions, the modelling takes underground
and above-ground fields which are influenced by the finite ground conductivity into ac-
count [32, 47]. This is done accurately using Sommerfeld’s integral equations [41].
Further modelling has been done on lightning currents to ground for power line tow-
ers [48], modelling of grounding electrodes under lightning currents [49, 50], and the effect
of lightning current injection on ground mesh and buried bare wires [51, 52]
Here the focus for the project is shifted to the bonding and interconnection of the
earthing to the lightning protection system as discussed in the IEC standard [9]. The
standard requires that all steel elements of a structure be connected to, and where possible,
utilised as part of, the LDC. Where steel reinforcing is used in concrete foundations, the
steel elements should be welded or securely bound [9, 53].
2.3 Conclusion
With the information from this survey, a good foundation was laid to investigate the light-
ning protection and RFI mitigation of KAT-7 by using numerical modelling. Verification
of the modelling forms an important part of the research, which allows the computational
code to be used with confidence for the relevant lightning and RFI studies.
− It takes less time to do things right, than to explain why you did it wrong −
− Henry Wadsworth Longfellow −

Chapter 3
Verification of FEKO Scale Model
The following chapter explains how a simplified 1/40th scale model of an early design of
KAT was constructed, replicated in a MoM code, FEKO, and verified with measurement.
A FVTD code, CST, is used to evaluate both the FEKO and the measured results.
3.1 Introduction
The MoM-based CEM code, FEKO, is chosen due to the code’s computational speed with
dominantly metallic structures, open boundaries and minimal dielectric.
To be able to trust the computational modelling, verification of the code is essential.
However, where experimental validation is not practically possible, scale models allow a
more controlled environment to conduct measurements [24].
The operational band for an early design of KAT falls within the 700 MHz to 1750
MHz range [1]. The available anechoic chamber absorption is best between 2 GHz and
18 GHz for measurements. A scaling factor had to be chosen accordingly. Frequency is
scaled proportionally [6, 7], and we chose a scaling factor of 40. For the scale model,
measurements were only done between 2 GHz and 6 GHz, corresponding to 50 MHz to
150 MHz in real terms. The lower frequency is limited by the chamber absorption and
the upper frequency limit was chosen to stay within the computational power available.
The main purpose of this work was to do the CEM code verification. It is not important
to cover the operational range precisely, as principal current paths can be identified at
any reasonable portion of a high frequency band.
Placing an excitation port and a pick-up loop on the device under test, eliminates the
need for invasive probes. An S-parameter measurement between the two ports gives an
accurate definition of both ports’ reflection characteristics with S11 and S22, as well as the
coupling between them using the transmission coefficient S21. With careful calibration of
a 2-port VNA, rigorous measurements can be made of these S-parameters. The setup is
easily replicated in the computational code up to the calibration planes. This gives an
17

Chapter 3 — Verification of FEKO Scale Model 18
Figure 3.1: Photograph of the first scale model following an early KAT design.
accurate verification of the computational code in order to use the model for further RFI
studies.
A FVTD-based code, CST, is used to evaluate both the FEKO and the measured
results. Through comparison of both codes’ results to each other and to the measurement,
this forms a comprehensive authentication for the modelling used.
3.2 Early Design 1/40th Scale Model
The electromagnetic environment inside a building can systematically be analysed using
a simplified wire model of the steel reinforcing and lightning protection down conductors
only [23, 28]. An early design of KAT was planned using steel-reinforced concrete for the
structure, and a composite material for the parabolic dish, mounted on metallic struts.
From [9], the steel elements of a structure can also be used as part of the lightning down
conductor (LDC) system. Thus we simplified the design for the scale model to contain
only the main metallic struts and surfaces of the pedestal structure and the dish. The
complete model is mounted on a conducting ground plane and shown in Fig. 3.1.
Chapter 3 — Verification of FEKO Scale Model 19
Figure 3.2: FEKO model of the early KAT design, with basic dimensions.
3.2.1 Physical Scale Model
The first 1:40 scale model is constructed using brass rods, semi-rigid cable and thin
conductive metallic plates. One port in the bottom centre of the structure connects the
dish to the core wire of the semi-rigid cable which goes through the centre of the structure.
The core wire at the top was stripped from the dielectric and outer copper sheath, and
forms a monopole onto which the dish, which is represented by four wires on a small
plate, was soldered. Another port’s core wire forms a pick-up loop at one of the struts
going down to the earth, adjacent to one of the dish-wires. The area where this core wire
is stripped of the dielectric, is flush with the ground plane plate. Sub-miniature version
A (SMA) connectors attach the semi-rigid cable entry to the model from its underside,
defining the calibration plane, and allowing minimally invasive S-parameter measurements
of the model.
3.2.2 FEKO Scale Model
Careful measurement of the scale model wire thickness and lengths yielded the exact
dimensions to be used in the FEKO model. The thin-wire approximation of the MoM
code is not applicable to the relatively thick brass rods used on the model, especially in
the 2 GHz to 6 GHz frequency range. Accordingly, the geometry was represented by solid

Chapter 3 — Verification of FEKO Scale Model 20
Figure 3.3: FEKO model showing the excitation ports and the dish wire which was bent
out of place in the direction indicated.
cylinders of the exact dimensions.
The excitation port of the semi-rigid core wire onto the dish was simplified by placing
the FEKO thin wire discrete voltage port at the interface where the core wire is stripped
from the dielectric and outer sheath. This eliminated the need for modelling the dielectric,
which is computationally expensive using the MoM code.
The pick-up loop’s port was defined as a 0.5 mm length thin wire discrete voltage
port between the ground plane and the loop itself. Both ports were defined with a 50 Ω
impedance, representing the characteristic impedance of the VNA and the cables. They
are indicated on Fig. 3.3. This enables FEKO to calculate S-parameters equivalent to the
VNA measurement.
When we modelled the ground plane as an infinite perfect electrically conducting
(PEC) plane, it was found that resonances associated with its dimensions were not present.
Therefore the ground plane plate was also accurately defined in the FEKO model. It
did, however, increase the computational time. Thus an accurate approximation of the
MoM code, the multilevel fast multipole method (MLFMM) was utilised to speed up the
solution.
After initial measurements of the physical model was made, it was found that the
dish of the model is too heavy for the semi-rigid core wire, causing the dish to sag during
handling. The lower dish-wire is consequently in closer proximity to the wire which
connects to the pickup loop. When the semi-rigid core wire supporting the dish was bent

Chapter 3 — Verification of FEKO Scale Model 21
Figure 3.4: Variations of FEKO results for S21 according to changes in dish geometry.
higher or lower by approximately 10 degrees, a difference of signal level was seen and
resonances changed significantly with the change in position of these wires. This change
was successfully replicated in FEKO by adjusting the angle of the dish-wire by 10 degrees
downwards and upwards respectively (see Fig. 3.3). The change in coupling between the
two ports is shown by the S21 results in Fig. 3.4.
For MoM discretisation in the frequency range of 2 GHz to 6 GHz, the triangle edge
size was chosen to be most efficient at 4 GHz, but within the parameter limits for 6 GHz.
This resulted in 8,168 metallic triangles and 2 metallic segments in free space that had
to be computed. The discretised triangle mesh is shown in Fig. 3.5. A simulation of 101
discrete frequency points took approximately seven and a half hours to run on a four-core
processor with 15 GB of memory available.
3.2.3 Verification by Measurement
The S-parameters are measured using a two-port Hewlett Packard 8510 vector network
analyser (VNA) connected to the model via two phase stable cables leading into an ane-
choic chamber. A diagram showing the measurement setup of the physical scale model in
the anechoic chamber can be seen in figure 3.6.
The VNA was calibrated between 2 GHz and 6 GHz with 401 discrete points. A short-
open-load-through (SOLT) procedure was used for calibration, where the connection point

Chapter 3 — Verification of FEKO Scale Model 22
Figure 3.5: Discretisation mesh of the FEKO model.
Figure 3.6: Diagram of the measurement setup in the anechoic chamber.
Chapter 3 — Verification of FEKO Scale Model 23
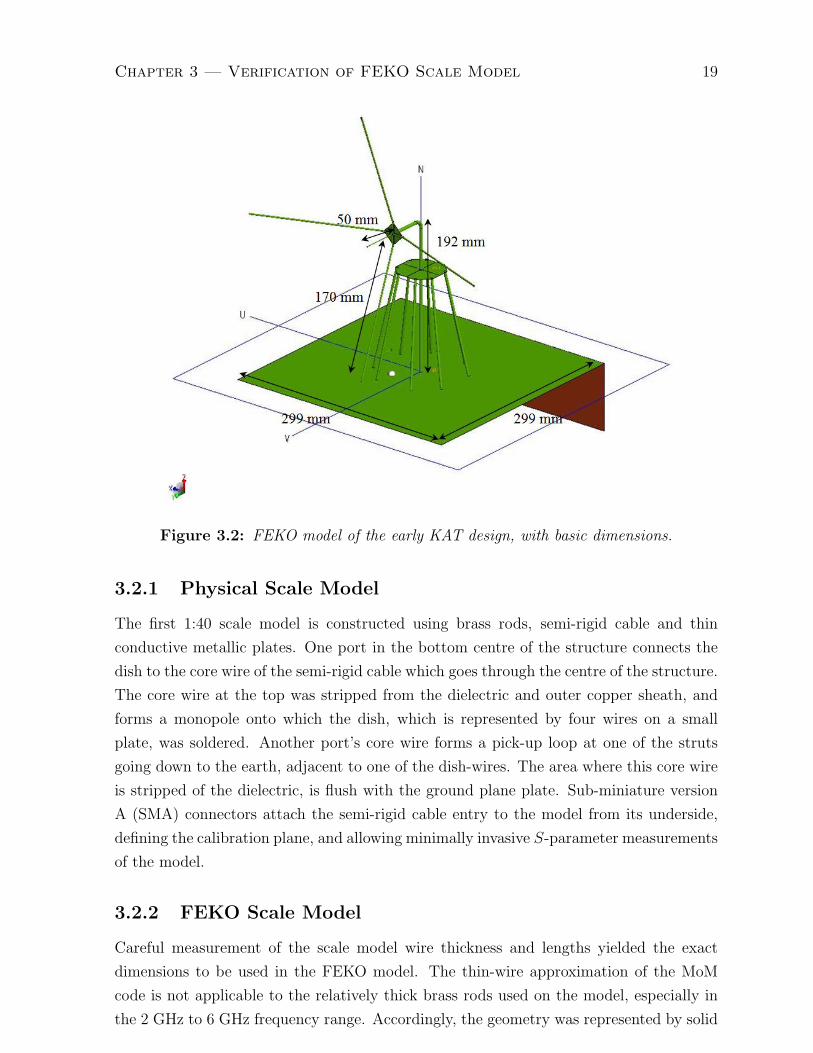
Figure 3.7: Comparison between the measured and FEKO results for S11.
of the phase stable cable to the model sets the calibration plane. The measurement was
carefully taken between the set frequencies and the results recorded to file for all the
S-parameters. Measurements were taken under identical conditions on a second occasion,
proving repeatability of the measurement.
The S-parameter results were saved to file and the data extracted. MATLAB plots
were made to compare the measured results to the simulated results of FEKO. The com-
parison between the S-parameter magnitude results are given in Fig. 3.7 to Fig. 3.9.
The comparison of the measurement and FEKO results for S11 in Fig. 3.7, show that
the plot for the FEKO simulation is in the same dB-range as for the measurement, but
not following the shape precisely. The resonance is off-set by 61.5 MHz from 3 GHz,
showing a difference of 1 mm in the length of the semi-rigid core-wire. The wire acts as a
monopole at the tip of the dish and is the cause for the major resonance at that frequency.
Considering S21 as seen in Fig. 3.8, the lower end and higher end frequencies show that
the measurement and FEKO simulation are in close agreement. Although variations are
limited to around 5 dB in the 3.5 GHz to 5 GHz range, the strong radiation characteristics
of the dish-wires while easily being bent, make a good comparison between the measured
and simulated results difficult.
The result for S22 in Fig. 3.9 shows the best correlation between the measurement
and the FEKO results. The differences between the values are less than 0.5 dB, except
in the areas of resonance. The main resonance at 3.9 GHz is the resonant frequency for

Chapter 3 — Verification of FEKO Scale Model 24
Figure 3.8: Comparison between the measured and FEKO results for S21.
Figure 3.9: Comparison between the measured and FEKO results for S22.

Chapter 3 — Verification of FEKO Scale Model 25
Figure 3.10: Comparison between the measured and CST results for S11 [54].
the small loop antenna of port 2.
An important observation made during the measurements, is that when chokes are
placed on the measurement cables, the magnitude of the S-parameter resonances change
slightly. This indicates that some stray currents are present on the outer sheaths of
the measurement cables, originating from the ground plate of the model. To make an
improvement on future models, EM barriers can be incorporated in the model design.
3.3 Evaluation with CST Code
Running parallel to this research project, another project by a postdoctoral fellow on a
related topic, used CST for safety-related investigations on the KAT design [54]. The
same physical scale model S-parameter measurement was used to validate the numerical
model in CST. Open boundaries were used for free space and electric boundaries for
the ground plane. The geometry was constructed in a similar manner to FEKO, and
the two ports were also defined as discrete voltage ports with 50 Ω impedance. With
these values set, the whole volume containing the model was discretised to form a mesh.
The transient solver in CST was used to calculate a time-domain response which is then
Fourier transformed to calculate the frequency domain S-parameters.
The magnitude comparison between the CST and measured results are shown in
Fig. 3.10 to Fig. 3.12. The CST plots match the FEKO plots almost exactly. Minor
variations in the shape of the plot are attributed to the Fourier transform of the CST

Chapter 3 — Verification of FEKO Scale Model 26
Figure 3.11: Comparison between the measured and CST results for S21 [54].
Figure 3.12: Comparison between the measured and CST results for S22 [54].

Chapter 3 — Verification of FEKO Scale Model 27
data compared to the FEKO result.
The variation in S11 magnitude rarely exceeds 3 dB. A similar offset from the resonant
frequency of the dish monopole is seen as with FEKO, indicating the same 1 mm difference
in length.
For the S21 results, the CST plot follows the measurement closely, except for one
deep resonance at 5.1 GHz. As this feature is a consequence of coupling, the physical
cause is not immediately clear. In the case of reflections for any given port, path length
resonances are easier to determine. Apart from this resonance, the results agree to within
5 dB, similar to the FEKO results.
No more than 1 dB separates the CST and measured results in Fig. 3.12, testifying
to the accuracy of the code. The minor offset of the resonant frequencies indicates a
small dimensional error (less than 1 mm) on the computational model. This confirms the
importance of accurate geometrical dimensions in the computational model.
3.4 Conclusions
The main objective for the work relayed in this chapter, which is the verification of
the FEKO model, is successfully obtained. Rigorous S-parameter measurements in an
anechoic chamber, in conjunction with the CST code results, show that the computational
modelling in FEKO is convincingly validated and that the code can be trusted. However,
the code is extremely dependent on the correct dimensional input and description of the
geometry. With stray current found on the measurement cables, EM barriers will further
add to the rigour of future model measurements.
− In theory, there is no difference between theory and practice. But, in
practice, there is. −
− Jan L.A. van de Snepscheut −

Chapter 4
Real Earth in Scale Model
This chapter describes the following design of KAT, the experimental demonstrator model
or XDM. In addition to incorporating the experience from the earlier modelling, equivalent
soil conditions are introduced. The model, with and without the simulated soil, is verified
by measurement and comparison to CST. Measurements are also done on the actual
XDM as built at South Africa’s main radio astronomy centre, the Hartebeeshoek Radio
Astronomy Observatory (HartRAO). Fig. 4.1 shows the XDM that we tested for lightning
and EMC.
4.1 Introduction
The design for XDM utilised steel reinforced concrete for the structure and foundation,
and a lightweight composite material for the dish. The dish reflective layer was formed
by an aluminium flash-spraying technique, resulting in an approximately 50 µm-thick
coating. Scale modelling and verification was done during construction, while full-scale
measurements were done after the structure was completed.
4.2 XDM Design 1/40th Scale Model
Learning from previous modelling experience, the dish was not included in the XDM scale
model design to eliminate earlier problems (see section 3.2.2). The focus for this model
was shifted to the foundation, pedestal structure, and cable conduits. The simplified scale
model includes the reinforcing within the concrete of the XDM pedestal structure, as well
as in the foundation. According to international standards [9], this reinforcing can also
be used as part of the lightning protection system.
28

Chapter 4 — Real Earth in Scale Model 29
Figure 4.1: Photograph of the XDM as constructed at HartRAO.
Figure 4.2: Photograph of the XDM design scale model.

Chapter 4 — Real Earth in Scale Model 30
Figure 4.3: XDM design FEKO scale model. The excitation port can be seen at the
top, and the measurement ports are placed one on the right hand side, and one on the
bottom ground plate. The basic dimensions are shown on the figure.
4.2.1 Physical Scale Model
The simplified scale model following the XDM design can be seen in Fig. 4.2. The pedestal
concrete steel reinforcing was represented by eight brass rods, and ring bonding bars by
three thin metal plates, all interconnected. Eight radially connected horizontal brass
rods mimic the steel reinforcing in the foundation. These rods then connect the pedestal
structure to a ground plate. A brass pipe, which connects to the bottom ring bonding
bar, depicts a cable conduit running from the pedestal.
Three ports are placed on the structure for S-parameter measurements similar to the
previous model. The excitation port, which can simulate a direct lightning strike, is
formed by a semi-rigid cable which enters via an SMA bulkhead connector through the
ground plate at the bottom and extends to the top of the model. Here the core wire was
stripped from the dielectric and sheath, and terminated onto the top ring.
The pick-up ports are formed by loops at two locations. One of the ports is placed
on the end of the pipe representing the cable conduit, connecting to the side plate of the
model. It uses an SMA bulkhead connector core wire to connect in an L-shape to the
pipe. The SMA connector is soldered to the side plate to ensure a good connection to
ground. Another port is placed at one of foundation reinforcement brass rods. Here the
SMA connector is placed below the ground plate and the core wire forms a pick-up loop
when connected to the foundation rod.
To prevent stray currents flowing from the ground plate onto the measurement cable
sheaths, the side plate forms an EM barrier at the conduit port on the side of the model.
This was achieved by bending 65 mm of the ground plate up by 90 degrees. The process

Chapter 4 — Real Earth in Scale Model 31
Figure 4.4: Discretisation mesh of the XDM design FEKO model.
was extended to all four sides of the plate to facilitate a watertight enclosure, which
enables the inclusion of a salt solution to represent the Karoo soil properties.
4.2.2 Scale Model in FEKO
The dimensions of the scale model following the XDM design were accurately measured
and the model reconstructed in FEKO. The excitation port was defined at the point where
the core wire of the semi-rigid cable is stripped from the dielectric. This eliminates the
need for the use of dielectric in the model. All three ports were again defined by 50 Ω
discrete voltage ports. S-parameters are calculated in FEKO similar to the VNA mea-
surement. The XDM design scale model in FEKO is shown in Fig. 4.3. The discretisation
edge length for meshing was chosen the same as with the previous model, but a larger
local mesh size was defined for the ground plate and sides. Subsequently a mesh was
formed with 15,080 triangles and 3 segments in free space. The meshed structure can be
seen in figure 4.4. The frequency range for investigation was chosen between 1 GHz and
6 GHz for the computation. The total time taken for FEKO to calculate the S-parameters
at 51 discrete frequency points, on a four-core machine with 15 GB memory, was forty
and a half hours.
4.2.3 Verification by Measurement
Similar to the procedure used in section 3.2.3, the S-parameters were measured using a
two-port VNA connected to the model via two phase stable cables leading into an anechoic
chamber. Different from the previous model, however, a third port was present in a two-
port measurement. To prevent unwanted reflections from this port being left open, a

Chapter 4 — Real Earth in Scale Model 32
Figure 4.5: Diagram of the measurement setup for the XDM scale model.
Figure 4.6: Photograph of the XDM scale model as measured in the anechoic chamber.

Chapter 4 — Real Earth in Scale Model 33
Figure 4.7: S11 Magnitude comparison between FEKO and measured results for the
excitation port of the XDM model without simulated soil.
50 Ω load was connected to it when measurements were made. A diagram showing the
measurement setup of the XDM scale model in the anechoic chamber can be seen in
figure 4.5.
4.2.4 Evaluation with CST
The physical model geometry was replicated in CST. All three ports were represented
by discrete voltage ports with 50 Ω impedance. Model boundaries were set to open
for all sides except the ground plane, which was set to electric boundary. With the 4
mm diameter brass rods used for the model, the FVTD discretisation had to be small
enough to ensure that all the elements in the model were represented in the mesh. Due
to a lot of empty space in the total model volume, this led to a very large mesh being
computationally expensive. However, a function in CST allows mesh adaptation for these
situations, and after running the feature, the refined mesh was reduced to approximately
300,000 mesh cells. The frequency range was, however, limited to up to 3 GHz by the
mesh size, to ensure accurate results. The transient solver was used for the calculations
and the results Fourier transformed by CST to S-parameter results. The simulation was
run on a dual-core machine and took just over six hours.

Chapter 4 — Real Earth in Scale Model 34
Figure 4.8: S11 Magnitude comparison between CST and measured results for the
excitation port of the XDM model without simulated soil.
Figure 4.9: S21 Magnitude comparison between FEKO and measured results for the
bottom port of the XDM model without simulated soil.

Chapter 4 — Real Earth in Scale Model 35
Figure 4.10: S21 Magnitude comparison between CST and measured results for the
bottom port of the XDM model without simulated soil.
Figure 4.11: S21 Magnitude comparison between FEKO and measured results for the
side port of the XDM design model without simulated soil.

Chapter 4 — Real Earth in Scale Model 36
Figure 4.12: S21 Magnitude comparison between CST and measured results for the side
port of the XDM model without simulated soil.
4.2.5 S-parameter Magnitude Results
Fig. 4.7 and Fig. 4.8 show the S11 magnitude comparison between FEKO and measured
results, and the CST and measured results respectively, for the excitation port at the
top of the XDM model. Excellent agreement to within 0.3 dB is shown for both CST
and FEKO results compared to the measurement. The first sharp resonance is missed by
FEKO due to the limited amount of frequency points calculated.
The S21 magnitude comparison between FEKO and measured results can be seen in
Fig. 4.9 and the CST and measured results are shown in Fig. 4.10. Both figure’s results
are for the XDM bottom port simulations and measurement. The FEKO result variation
from the measured result stays within 2 dB, except at the resonances. Here, some of
the resonances are missed due to only 21 frequency points being calculated in the whole
frequency range. For the CST results, the plot differs from the measurement by no more
than 3 dB, but it follows the resonances closely, seeing that a total of 401 frequency points
were Fourier transformed.
The same comparison for the side port FEKO and CST results are shown in Fig. 4.11
and Fig. 4.12. For both codes the measured and computed values stay within a 3 dB limit
from each other.
Considering the correlation between the measurement and the two codes, the verifica-
tion of the computational code can be deemed a success.

Chapter 4 — Real Earth in Scale Model 37
Figure 4.13: XDM design scale model, filled with a salt solution to simulate Karoo soil.
4.3 XDM Scale Model with Simulated Karoo Soil
The verified models are used to investigate the influence of the Karoo soil. The soil is
simulated using a scaled conductivity salt water mix. With the Karoo soil resistivity
of 200 Ω-meter and a scaling factor of 40, the conductivity of the salt solution needed
to be 40 ∗ 1/200 = 0.2 S/m. This was achieved by adding normal sodium chloride to
distilled water at room temperature until the required conductivity was measured. The
measurement was done using a calibrated conductivity probe.
4.3.1 Measurement of Model with Simulated Soil
The salt solution is added to the model and measurements are made in the anechoic cham-
ber with the VNA, using the same measurement setup and procedure as in section 4.2.3.
4.3.2 Simulated Soil in FEKO
An initial attempt to model the enclosed salt solution in FEKO used a hybrid MoM / finite
element method (FEM) solution (see Fig. 4.14). The salt solution has a 36 mm depth
and size inside the enclosure of 300 mm x 300 mm. This volume has to be meshed with
tetrahedra. To further complicate the modelling, the relative permittivity of the salt
solution has to be taken into consideration for the mesh size. The assumed value of 80 for
the relative permittivity of salt-water, implies a wavelength of 1/9th times the wavelength
in free space. For accurate solution to the FEM code at 1 GHz, the proposed side length
of a dielectric tetrahedron mesh cell had to be between 3 mm and 6 mm. With 5 mm

Chapter 4 — Real Earth in Scale Model 38
Figure 4.14: XDM design FEKO scale model with a salt solution included as dielectric,
using a MoM / FEM hybrid solution.
Figure 4.15: XDM design FEKO scale model with unrefined mesh and Sommerfeld
ground plane.

Chapter 4 — Real Earth in Scale Model 39
Figure 4.16: XDM design FEKO scale model with refined mesh and Sommerfeld
ground plane.
edge length, the mesh involved 6,356 metallic triangles and 425,567 tetrahedral elements.
This required 42 GB of memory, which was not available at that stage of the project.
The alternative method to include the salt-water, which requires less memory, is the
FEKO infinite ground plane with a Sommerfeld integral solution. However, using the
infinite plane, it follows that the model is “immersed” in salt-water (shown in Fig. 4.15),
instead of salt-water being enclosed inside the model EM barriers. An initial meshed
system consisted of 3 wire-segments and 20,000 triangles, requiring only 6.8 GB of memory.
A successful simulation was run on a four-core machine with 15 GB memory, taking
almost eighteen hours for one frequency point to solve. With 13 mm edge length for this
simulation, however, the meshing was still very coarse.
Consequently the Centre for High Performance Computing (CHPC) became available
for use by students and staff at Stellenbosch University. This facility consists of 160
nodes, each with 2 dual-core processors and 16 GB of memory. The meshing in FEKO
was refined to an edge length of 2 mm, resulting in 3 segments and 155,238 triangles to
solve (Fig. 4.16). This required a total of 402 GB of memory. A sum of 32 nodes were
used on the CHPC, which initially took four days to compute one frequency point, but
after updating the networking software, was improved to just under twenty-four hours per
frequency point. In total, seven frequency points were calculated for the FEKO model.

Chapter 4 — Real Earth in Scale Model 40
Figure 4.17: XDM design CST scale model with salt-water dielectric.
Figure 4.18: S11 Magnitude comparison between FEKO, CST and measured results for
the top port of the XDM design model with simulated soil.

Chapter 4 — Real Earth in Scale Model 41
Figure 4.19: S21 Magnitude comparison between FEKO, CST and measured results for
the side port of the XDM design model with simulated soil.
Figure 4.20: S21 Magnitude comparison between FEKO, CST and measured results for
the bottom port of the XDM design model with simulated soil.

Chapter 4 — Real Earth in Scale Model 42
4.3.3 Simulated Soil in CST
The second verification again involved CST. The verified CST model without salt-water
dielectric was utilised. When the dielectric was added to the model however (Fig. 4.17),
meshing had to be refined extensively to accommodate the dielectric material with as-
sumed relative permittivity of 80. The amount of mesh cells was limited to 1,000,000
by the available license, and the required fine mesh could not be achieved. Successful
simulations were only done for a frequency range between 1 GHz and 1.5 GHz, with a
mesh containing 750,000 mesh cells. This simulation took approximately seventeen hours
on a dual-core machine. However, due to the license limitation, the meshing could not be
further refined for accuracy.
4.3.4 Comparison of Results
The unrefined CST results, as well as the FEKO Sommerfeld results, compared to mea-
surement, are shown in Fig. 4.18 to Fig. 4.20. In the S11 results of Fig. 4.18, both codes
conform to the measurement to within 0.2 dB, except for a resonance that is detected in
the computations at 1.2 GHz, which is not reflected in the measurement.
For the S21 results of the side port in Fig. 4.19, the variation between measurement
and the simulations is between 10 dB and 23 dB, and resonant frequencies do not align.
A difference of 1 dB to 11 dB between measured and computed values of Fig. 4.20, show
better agreement for the S21 results. For both S21 results, the computational code values
are closer to each other than they are to the measurement.
The deviation of specifically the resonances in the plots, indicates that wavelengths in
the dielectric material are not the same for the physical and the numerical model. The
accuracy for the assumed relative permittivity value of 80 is thus brought into question.
This point was raised at an SKA conference by a FEKO software developer. As a result of
this discussion, the literature was reviewed and [55] was obtained, accurately defining the
permittivity of seawater in the frequency range of 1 Hz to 256 GHz. Between 1 GHz and
2 GHz for example, the real part of the relative permittivity is given as 71, due to inertial
properties of molecule orientation polarization. The total polarization of seawater is the
polarization due to the displacement of ions inside water (i.e. atomic polarization) added
to the displacement of bound charges in water molecules (i.e. induced and orientation
polarization).
The modelling in FEKO and CST take both the dielectric properties and conductivity
into account with the simplified definition of the complex relative permittivity as shown
in equations 4.1 and 4.3. Thus the use of salt water for modelling above 1 GHz can be
justified using this definition in the computational codes. Ideally, more accurate estimates
of soil properties could be obtained from drilled core samples from the Karoo. However,

Chapter 4 — Real Earth in Scale Model 43
project timelines did not allow this, and we had to assume a constant conductivity from
initial estimates obtained by the project team.
From [55], the complex permittivity of seawater with different salinity and tempera-
ture was accurately modelled. This was compared to previous measurements, as well as
extrapolated, fitted results at frequencies from 1 Hz to 256 GHz. The equations show
a more detailed expression for the complex relative permittivity, but they also show the
simplified form as described in the computational codes. From [55]’s resulting values of
permittivity of seawater, the variations between the computed and measured results can
be understood.
When the resonant frequency wavelengths are adjusted according to the error ratio of
71:80, it is seen that the resonances around 1.2 GHz and 1.37 GHz move into alignment.
This confirms that the relative permittivity value of seawater at 71 is closer to the actual
measured permittivity.
If the sharpness of the resonances are considered, it shows that the imaginary part of
the permittivity is incorrect as well. The value that the simulations use, is defined by the
conductivity and the frequency in the following way:
εeff = ε0εr − jσ
ω(4.1)
where εeff is the effective permittivity, ε0 is the permittivity of free space, εr is the
relative permittivity, σ is the conductivity and ω is the radial frequency. If the effective
permittivity can be expressed as follows:
εeff = ε0εr − jε0σ
ε0ω= ε0(ε
′ − jε′′) (4.2)
then the complex relative permittivity can be seen as:
εrcomplex = εr − jσ
ε0ω= ε′ − jε′′ (4.3)
When the conductivity value of 0.2 from the simulations is used to calculate ε′′ at
1 GHz in equation 4.3, a value of 3.6 is obtained. However, the value of sea water as given
by [55] is 70. This indicates higher losses in the actual sea water, explaining the sharper
resonances in CST compared to the measurement of the salt solution.
Taking into account that the unrefined CST mesh and the FEKO infinite plane were
not entirely accurate representations of the model, and that the relative permittivity was
not correctly defined, the results from this investigation are deemed satisfactory.
4.4 Full-scale Measurements at HartRAO
An RFI audit at the XDM site revealed a number of pick-up loops and current paths
that would be important if very low RFI immunity were sought. These loops and paths

Chapter 4 — Real Earth in Scale Model 44
Figure 4.21: Continuous wave current injection using a signal generator connected to
the LDC of the XDM.
were identified through a number of measurements of which only one is highlighted in this
section. These measurements identified that a direct current strike would still damage
the systems contained within the pedestal. However, the risk of such a strike is low
(the XDM is surrounded by high hills) and it was agreed that no immediate mitigation
measures were required. A number of background emissions was noted which could be
reduced in pick-up level by modifications to the cabling layout [56].
To consider lightning RFI, the standard method would be to use an EMP simulator.
However, the observatory is a radio quiet zone, and alternative methods had to be utilised.
A signal generator (SG) inside a cherry-picker crane is used to generate a 10 MHz and 50
MHz continuous wave (CW) signal onto different LDC elements of the XDM, of which one
is shown in Fig. 4.21. The SG is powered from the 220 V mains outlet inside the structure
using a 15 m lead. Only the positive terminal of the signal generator is connected onto
the LDC, while the ground of the signal generator is connected to the earthing bonding
bar inside the structure via the lead and mains. This creates an excitation loop of RFI,
which couples to earth loops inside and on the structure.
Using a battery-operated hand-held spectrum analyser and a common mode (CM)
current probe, the levels of coupling were measured at various test points. Fig. 4.22
shows one of the pick-up loops, formed by the cabinet power cable sheath leading to a
power filter on top of the shielded cabinet, and power and communication cable sheaths,
all of which connects to the cabinet and to the earth bonding bar.
From the measured levels, it was presumed that with such a large pick-up area formed,

Chapter 4 — Real Earth in Scale Model 45
Figure 4.22: Pick-up loops inside the XDM structure formed by cable sheaths and
earthing layout [56]. Test points are indicated by the letters TP and a number.
currents can easily be induced on the cable sheaths through magnetic coupling. However,
when this research was communicated at the 2008 URSI conference [10], the question
arose as to the validity of the excitation. Using the mains power earthing, forces the
currents to flow through the earthing cables and connections of the structure. Thus the
coupling could be resistive instead of magnetic. When planning the final model of the
research, this issue was included for investigation.
The screening effectiveness of the cabinet was tested using the current probe and spec-
trum analyser inside and outside the cabinet. When placed on the inside, the spectrum
analyser was set to record maximum levels. The cabinet shielding was measured between
30 and 35 dB within the 100 kHz to 10 MHz band [56]. This indicated that the sensitive
equipment inside was sufficiently shielded against induced currents on the cable sheaths.
4.5 Conclusions
With valuable experience gained on the initial scale model, the XDM scale model was
carefully planned, constructed and successfully verified using measurement and CST code.
To simulate the Karoo soil conditions, a salt solution with scaled conductivity is
added to the physical model and represented in the computational models in FEKO and
CST. However, some limitations hamper the full utilisation of both codes. The unrefined
CST mesh and the infinite FEKO plane are not entirely accurate representations of the
model. The relative permittivity value for the salt solution was also found inaccurate
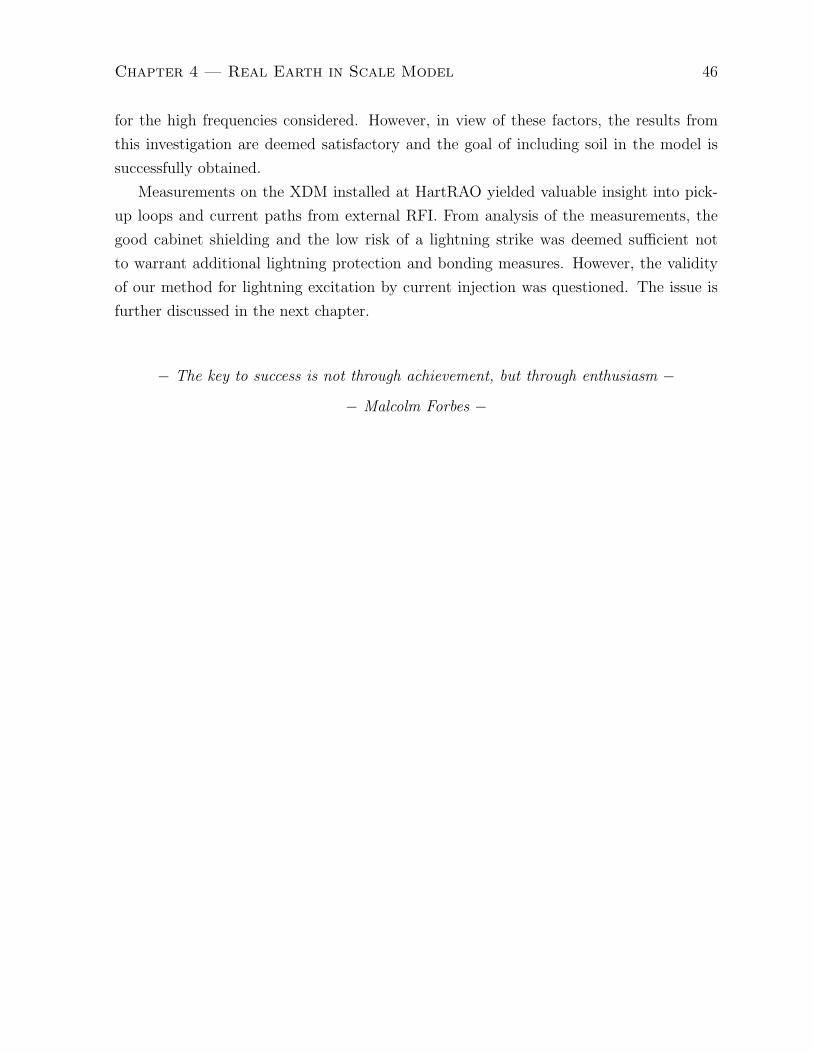
Chapter 4 — Real Earth in Scale Model 46
for the high frequencies considered. However, in view of these factors, the results from
this investigation are deemed satisfactory and the goal of including soil in the model is
successfully obtained.
Measurements on the XDM installed at HartRAO yielded valuable insight into pick-
up loops and current paths from external RFI. From analysis of the measurements, the
good cabinet shielding and the low risk of a lightning strike was deemed sufficient not
to warrant additional lightning protection and bonding measures. However, the validity
of our method for lightning excitation by current injection was questioned. The issue is
further discussed in the next chapter.
− The key to success is not through achievement, but through enthusiasm −
− Malcolm Forbes −

Chapter 5
Accurate Scale Model of KAT-7
With confidence in our computational code and measurement verification strategies, we
designed an accurate scale model of the KAT-7 structure with assistance from the SA SKA
mechanical engineer. This chapter gives detail on the construction and two measurement
verifications of the model.
5.1 Introduction
The final design for the KAT-7 stage of the project was named the advanced development
model or ADM. Fig. 5.1 shows the engineering design of this structure.
Taking earlier recommendations and manufacturing criteria into consideration, the
design team made several material and layout changes to the design. Steel replaces
the steel reinforced concrete as the structure material for the ADM. The layout and
mechanisms for the elevation of the dish were changed, using a set screw system instead
of a geared system. For the dish, the light-weight composite material is still used, but the
reflective layer is created using a conductive mesh embedded in the dish, instead of the
flash-sprayed aluminium. The design layout for the counterweights was changed as well.
For this research project, a very accurate scale model of this design was required. The
scale model had to be constructed in such a way as to easily do verification measurements,
and be true to the actual design in order to study lightning and RFI in our computational
model with confidence. For this purpose, we approached the mechanical designer of the
ADM.
5.2 KAT-7 Design 1/20th Scale Model
After discussion with the SA SKA mechanical engineer who designed the ADM, he agreed
to help in producing an accurate detailed scale model following a simplified version of the
KAT-7 design.
47

Chapter 5 — Accurate Scale Model of KAT-7 48
Figure 5.1: Near-final engineering design of the KAT-7 structure.
With all the relevant requirements met, the designer produced the 1/20th scale model
design shown in Fig. 5.2. All elements of the model were separately drawn to enable
precision engineering of each.
The design drawings were sent to an engineering company who used laser-cutting to
produce all the parts of the model. These were sent for tin-plating to prevent corrosion
and ensure good galvanic connection when constructed. The assembly was done in-house
by the Stellenbosch University Electrical and Electronic Engineering electronician.
5.2.1 Physical Scale Model
The model was mounted on a large, flat ground plane plate. The injection port was
created with a semi-rigid cable coming through the ground plane via an SMA bulkhead
connector and terminating with only its core wire onto the focal point of the dish. A
pick-up loop was placed at the base of the pedestal by extending the core wire of an
SMA bulkhead connector onto the pedestal wall. The physical model as measured for
S-parameters in the anechoic chamber is shown in Fig. 5.3.
One of the simplifications done on the dish to ease manufacturing, was to change the
dish design from parabolic to cone-shaped. The cone could then be produced out of a

Chapter 5 — Accurate Scale Model of KAT-7 49
Figure 5.2: Engineering drawing of the simplified scale model following the KAT-7
structure design.
Figure 5.3: Photograph of the KAT-7 design scale model, as set up in the anechoic
chamber for S-parameter measurement verification.

Chapter 5 — Accurate Scale Model of KAT-7 50
Figure 5.4: KAT-7 design FEKO scale model with simulated lightning injection on the
dish focal point as the excitation port. A pick-up port is formed by a loop connected to
the bottom of the pedestal. Basic dimensions are shown in the picture.
single piece of flat plate, pop-riveted at the edges. The counterweights were removed as
well to simplify the design.
The two elements of the pedestal were designed such that it could replicate the move-
ment of the azimuth bearing of the ADM. Similarly, the elevation bearing movement was
enabled by two screws connecting the bearing to the pedestal, and two adjustable plates
representing the set screw. The dish could thus be fixed at any angle between 0 degrees
and 90 degrees from the vertical.
With the current injection semi-rigid removed, this enables plane wave measurements
with the dish in any position and orientation.
5.2.2 Scale Model in FEKO
Exact dimensions were available in the design file for the KAT-7 scale model. Although
the model could not be successfully imported in FEKO, the correct dimensions could be
used to replicate the model.
Discrete voltage ports with 50 Ω impedance were used for the excitation and pick-up
loops. The excitation port was placed on top of the semi-rigid sheath, connecting the
sheath and the core wire which extends to the focal point of the dish. Similarly the pick-
up loop port is placed as a wire port between the ground plane and the core wire forming
the loop.

Chapter 5 — Accurate Scale Model of KAT-7 51
Figure 5.5: EM plane wave simulating antenna excitation on FEKO model of KAT-7
with dish angled at 45 degrees. The ground plate is seen with this model and has
dimensions of 924 mm by 861 mm.
Figure 5.6: EM plane wave simulating antenna excitation on FEKO model of KAT-7
with dish angled at 90 degrees.

Chapter 5 — Accurate Scale Model of KAT-7 52
Figure 5.7: Diagram of the setup for the KAT-7 scale model S-parameter measurement.
These wire ports were defined with length of 3 mm and radius of 0.03 mm. The re-
maining core wires were defined as thin wires as well, with discretisation of the same value
as the port. Surface meshing was chosen for triangles with an edge length of 14 mm. Due
to the detail of the model, small features were discretised with extremely fine mesh trian-
gles. This resulted in warnings and errors with the FEKO calculation. A function of the
code, “Merge coincident vertices”, was used after each meshing, to solve the discretisation
problem. The resulting model was meshed with 33 segments and 20,637 triangles.
The numerical calculation could then be done between the two ports to correspond to
the two-port S-parameter VNA measurement. With a memory requirement of only 8 GB,
a normal four-core machine would be able to run the simulation, but using 32 nodes on
the CHPC, the S-parameters for 51 discrete frequency points were calculated within a
few hours. The frequency range used was chosen between 0.5 GHz and 5 GHz. When
verified, the model can then be used for investigations into the 50 MHz high frequency
content of lightning, as well as other RFI frequencies of interest up to 250 MHz.
Keeping the future simulations for lightning and RFI in mind, a plane wave excita-
tion model was needed as well. If this model could be successfully verified, it could be
used for indirect lightning strike investigations and external RFI sources as well. The
frequency range for the plane wave experiment was chosen between 1 GHz and 6 GHz to
correspond to the frequency range of the antenna used for the plane wave illumination
and measurement of the model.
The scale model in FEKO was manipulated to adjust the dish to two different angles
and orientations. For one scenario, the dish was angled at 45 degrees facing away from
the pick-up loop (Fig. 5.5). For another scenario, the dish was changed to 90 degrees

Chapter 5 — Accurate Scale Model of KAT-7 53
from the vertical, which is also defined as the stow position for the dish. For this dish
angle, the set screw of the dish was orientated on the opposite side of the pick-up loop
(Fig. 5.6).
An electromagnetic plane wave with 10 V/m value was defined in FEKO, which could
be replicated in measurement by an antenna illumination of the dish in the anechoic
chamber. The placement of the plane wave was chosen to propagate toward the side of
the model, with vertical E-field orientation and horizontal H-field orientation. Opposing
sides of excitation were used for the two models.
The semi-rigid and excitation port were removed and the pick-up loop port was re-
placed by a 50 Ω load. To be able to compare a measured S-parameter to the FEKO
simulation, the current values through the 50 Ω load was requested as the solution to the
simulation. In measurement, the S21 transmission parameter gives the comparison of the
pick-up loop measured voltage wave, compared to the input voltage wave at the antenna.
More detail on the measurement calculations in the following sections.
5.3 Verification by Measurement
The measurement verification technique was proven in the previous two chapters to be
accurate. The same procedure is used for the KAT-7 scale model. However, to verify
the use of plane waves in FEKO, additional measurements are made using a log-periodic
dipole antenna (LPDA).
5.3.1 S-parameter Measurement
The S-parameters are measured to verify the computational model, and to use this method
of current injection to do further modelling of simulated direct lightning strikes. The
measurement was done in the anechoic chamber (Fig. 5.3) similarly to the previous models.
A diagram of the measurement setup is shown in Fig. 5.7. The VNA was calibrated using
a SOLT procedure, where the connection point of the phase stable cable to the model
sets the calibration plane. With future radio astronomy for the anticipated SKA to
be conducted at frequencies between 70 MHz and 10 GHz, and the KAT-7 operating
range between 500 MHz and 2.5 GHz, a scaled frequency range of 0.5 GHz to 5 GHz
was chosen. The anechoic chamber absorption limits the lower frequency, and the upper
frequency is limited by the computational cost of modelling in FEKO. The measurements
were carefully taken with 201 discrete points and the results recorded to file for all the
S-parameters.
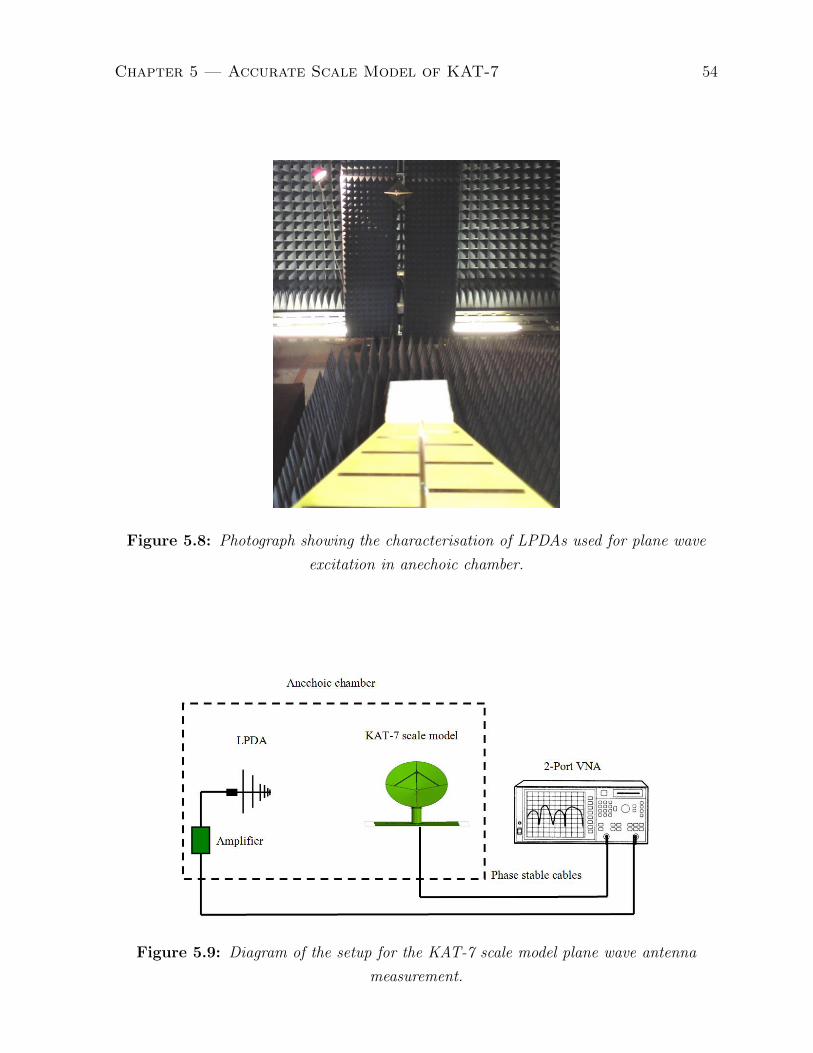
Chapter 5 — Accurate Scale Model of KAT-7 54
Figure 5.8: Photograph showing the characterisation of LPDAs used for plane wave
excitation in anechoic chamber.
Figure 5.9: Diagram of the setup for the KAT-7 scale model plane wave antenna
measurement.

Chapter 5 — Accurate Scale Model of KAT-7 55
Figure 5.10: LPDA plane wave measurement verification of KAT-7 design scale model
in anechoic chamber. For this measurement the dish is angled at 45 degrees facing away
from the pick-up loop.
Figure 5.11: LPDA plane wave measurement verification of KAT-7 design scale model
in anechoic chamber. For this measurement the dish is angled at 90 degrees and the
elevation set screw is on the opposite side of the pick-up loop.

Chapter 5 — Accurate Scale Model of KAT-7 56
5.3.2 Plane Wave Measurement
We plan to use plane wave excitations to model indirect lightning strikes. To verify
the modelling, a plane wave measurement using an LPDA was done. Two LPDAs were
characterised beforehand using other known antennas for the three-antenna method [58].
The photograph in Fig. 5.8 shows the one LPDA facing the second LPDA on the opposite
side of the anechoic chamber.
After the antennas were characterised, the gain for the LPDA was calculated. Fig. 5.15
near the end of this chapter shows the antenna gain plotted over the frequency range.
Then the setup was changed to have one LPDA on the far end of the chamber, con-
nected to port 2 of the VNA through an uni-directional low-noise amplifier. However, the
VNA was programmed to attenuate the input signal by the same factor as the amplifier.
The amplifier is installed in the chamber specifically for antenna measurements.
The calibration of the VNA was done for 201 discrete frequency points between 1 GHz
and 5 GHz, where the antenna gain is constant. A good calibration was obtained with
the noise floor level around -90 dB as shown in Fig. 5.15.
The scale model, with dish angled at 45 degrees, was placed on a perspex mount inside
the chamber and orientated in the same way as the FEKO simulation. Port 1 was then
connected to the pick-up loop of the model. In doing a S21 measurement, it allows the
installed amplifier to operate correctly. And with S21 = S12, this means that the pick-up
loop voltage is measured due to the plane wave excitation of the antenna. Fig. 5.9 shows
a diagram of the layout for this measurement.
The procedure is repeated for the model dish adjusted to 90 degrees to the vertical
and orientation changed by 180 degrees. Photographs of the 45 degree dish plane wave
measurement and 90 degree plane wave measurement are shown in Fig 5.10 and Fig. 5.11
respectively.
5.4 Comparison of Results
The S-parameter verification results are given in Fig. 5.12 to Fig. 5.14.
5.4.1 S-parameter Measurement Results
The S11 magnitude plot for the FEKO results follows the measured results plot closely
to within less than 1 dB, except at the resonances (see Fig. 5.12). Slight misalignment of
resonances can be attributed to small errors (less than 1 mm) in the model definition in
FEKO. The first resonance visible at just above 500 MHz corresponds to a half-wavelength
resonance of the support struts’ dimension on the dish. At 880 MHz and 1.76 GHz, the
feed-port semi-rigid cable dimension forms single and multiple wavelength resonances.

Chapter 5 — Accurate Scale Model of KAT-7 57
Figure 5.12: S11 magnitude comparison of ADM scale model measurement and FEKO
simulation.
Another multiple wavelength resonance is seen at 1.30 GHz, where the ground plate side-
dimension is 924 mm. A resonance at 2.04 GHz is caused by reflections inside the yoke
part of the pedestal, which has an opening for access. This dimension between the yoke
top and pedestal top is 147 mm.
In Fig. 5.13 the magnitude comparison shows that for most of the results, FEKO
correlates to within 5 dB to the measurement. Only a few resonant frequencies show
larger variation with the worst being 17 dB difference at 2.65 GHz.
For S22, the agreement between FEKO and measurement is within 0.3 dB between 0.5
GHz and 1.7 GHz. In the frequency range of 1.7 GHz to 3 GHz, the values differ by no
more than 1 dB, and the main resonance aligns. Above 3 GHz, the plots diverge by up
to 3 dB, as can be seen in Fig. 5.14.
5.4.2 Plane Wave Measurement Results
Before the plane wave measurement results can be compared to the FEKO simulation,
the simulation current values need to be converted to the coupling parameter S21, and
the gain of the antenna needs to be accounted for in the measurement.
The measured S21 magnitude in dB, was adjusted by subtracting the dB gain of the
antenna:
S21actual = S21measured −GLPDA dB (5.1)

Chapter 5 — Accurate Scale Model of KAT-7 58
Figure 5.13: S21 magnitude comparison of ADM scale model measurement and FEKO
simulation.
Figure 5.14: S22 magnitude comparison of ADM scale model measurement and FEKO
simulation.

Chapter 5 — Accurate Scale Model of KAT-7 59
With the calibration done up to the model SMA port and the LPDA connection, this was
the only adjustment that needed to be done. The antenna mismatch was found not to
make a noticeable difference to the measured value.
From the FEKO simulation, the current value on the impedance port is given in dB
for each frequency. This means that the current value has already been normalised to its
reference. The dB-current values are converted back to linear and with the impedance
vale of 50 Ω, this implies a voltage value equal to the current multiplied by the impedance:
Vout = 50 ∗ 10IdB/20 V (5.2)
To calculate S21 for each frequency, the input voltage Vin is taken as equal to 1 due to
the normalisation, and the S21 dB magnitude values are calculated by:
S21FEKO = 20 ∗ log10(Vout/Vin) dB (5.3)
where Vout is the linear voltage calculated from the current.
The values of S21FEKO in equation 5.3 are compared to the values of S21actual (from
equation 5.1) in Fig. 5.15 for the dish angled at 45 degrees. For 51 frequency points
calculated in FEKO, the results show conformity to within 5 dB across the frequency band.
Figure 5.15: S21 magnitude comparison of plane wave excitation ADM scale model
measurement and FEKO simulation. Here the dish is angled at 45 degrees and facing
away from the pick-up loop. The antenna gain and noise floor level for the measurement
is shown as well.

Chapter 5 — Accurate Scale Model of KAT-7 60
Figure 5.16: S21 magnitude comparison of plane wave excitation ADM scale model
measurement and FEKO simulation. Here the dish is angled at 90 degrees and the
elevation set screw on the opposite side of the pick-up loop. The antenna gain and noise
floor level for the measurement is shown as well.
Only three points have higher disagreement, where resonances are slightly misaligned.
This is due to minor errors in the geometry.
The comparison of results for the 90 degree dish angle is shown in Fig. 5.16. These
plots show similar correlation and have variation of less than 5 dB, except at three resonant
points where the difference is larger. As mentioned in section 5.3.2, the antenna gain and
noise floor level are shown in these figures as well.
5.5 Conclusions
This chapter detailed the production of a physical scale model which was simplified from
the actual KAT-7 design. Computational modelling in FEKO was verified with rigorous
measurement of the model in an anechoic chamber. S-parameter measurements veri-
fied the computational model for further investigation into direct lightning strikes using
FEKO.
Indirect lightning strikes can be studied in FEKO as well, after antenna plane wave
measurements verified the numerical model.

Chapter 5 — Accurate Scale Model of KAT-7 61
With the research completed at this stage of the project, a secure foundation was
created for specific lightning protection and RFI mitigation investigations using FEKO.
− Even if you are on the right track, you will get run over if you just sit
there −
− Will Rogers −

Chapter 6
KAT-7 Lightning Protection
Direct and indirect lightning strikes on the verified FEKO KAT-7 design scale model
are studied in this chapter. A direct strike is modelled with a current injection on the
dish lightning rod, while EM plane waves from different directions represent indirect
lightning strikes. The design layout of the lightning down conductor, specifically over the
elevation and azimuth bearings, is optimised for RFI mitigation and cost-effectiveness.
Resonant frequencies are investigated to identify problem areas in order to effectively
mitigate RFI. The modelling of the foundation steel reinforcing as part of the earth
electrode for the lightning protection system (LPS) is discussed as well. The investigation
considers interconnection of steel elements as required by international standards. The
concrete and soil are modelled as a homogeneous medium below a Sommerfeld integral
ground plane in FEKO. From the simulation results, recommendations were given to the
KAT-7 design team.
6.1 Introduction
To predict the behaviour of lightning currents on and electromagnetic fields inside one of
the structures accurately, computational electromagnetics is chosen, which is the numer-
ical solution to Maxwell’s equations. Successful verification of numerical models through
measurements and comparison to another numerical code has given us confidence to utilise
accurate scale models in FEKO to investigate lightning and RFI.
From discussions with the KAT-7 design team, main areas of concern were identified.
These included the design and layout of the lightning protection system (especially at the
bearings, where movement had to be accounted for), as well as the cable entry from below
the pedestal floor, and shielding of the inside. However, one of the main driving factors
behind the design is cost, and this is especially true for the MeerKAT’s 80 antennas. If
the LDC design layout could be planned effectively to keep the cost of material low and
help in RFI mitigation as well, the project would benefit greatly.
62

Chapter 6 — KAT-7 Lightning Protection 63
Figure 6.1: SA SKA design drawing with detail on the KAT-7 base. The pedestal is
elevated onto a concrete lip to allow levelling at the construction phase. The structure is
then effectively lifted from ground level by 32 bolts.
6.2 CEM Model Used for RFI Investigations
One of the major advantages of using a CEM scale model above a physical scale model, is
that the conductivity can actually be scaled in the CEM model. This cannot be done for
physical models, as conductive materials with 20 times better conduction either do not
exist, or have to be supercooled to obtain the conductivity [40]. For the different metals
used in the full-scale design, the scaled conductivity was included with skin effect in the
FEKO scale model. It was found that the results with the inclusion of skin effect were
almost exactly the same as with the use of PEC. Further modelling only used PEC for
all metallic parts. However, where soil is simulated, the soil conductivity is scaled.
The precise layout for different options of the KAT-7 LDC was added to the FEKO
model. The base of the actual pedestal is designed in such a way as to fit over 32 bolts
which are securely embedded in the concrete. The design drawing for the pedestal base
is shown in Fig. 6.1.
The concrete foundation has a 600 mm deep cylindrical space provided for cables
entering the pedestal from below ground level. The lip of this opening is constructed to
be 300 mm above the ground level, and the foundation bolts protrude from this lip. Two
nuts are placed on each bolt, allowing the pedestal to be levelled during construction (see
Fig. 6.2). With this slight elevation of the pedestal, stray currents can leak around the
edges of the pedestal base and introduce electromagnetic interference to the inside of the
pedestal.

Chapter 6 — KAT-7 Lightning Protection 64
Figure 6.2: Photographs of the foundation showing the foundation bolts on the concrete
lip on the left, and the space provided for cable entry on the right.
Figure 6.3: From left to right (f.l.t.r.): The LDC dish lightning rod; The receiver
lightning rod; The area where the receiver lightning rod conductor goes through the dish;
The connection between the conductors from the receiver rod and the dish rod.

Chapter 6 — KAT-7 Lightning Protection 65
Figure 6.4: F.l.t.r. The LDC on the backing structure where it splits in two; The strap
shown here going beneath the elevation bearing axle; The ring-plate connection to 4
copper shoes over the azimuth bearing.
Two lightning rods are placed on the dish, one at the focal point receiver, and one at
the top of the dish for the dish facing forward (shown in the two pictures on the left-hand
side of Fig. 6.3). The down conductor attached to the receiver rod, is connected to the
top strut using conductor clamps. This conductor joins the top rod’s conductor at the
back of the structure after going through an opening in the dish (right-hand side pictures
of Fig. 6.3). The opening allows the connection of the top strut to the dish backing
structure.
The joint conductor splits in two conductors and is then connected, either over or
beneath the elevation bearings, onto the pedestal. From here the two conductors go down
the sides of the pedestal and connect to a ring plate above the azimuth bearing (Fig. 6.4).
The ring plate is connected over the bearing onto four copper shoes which are spring-
loaded to ensure good galvanic connection. These shoes are directly connected to the
bottom steel part of the pedestal and depend on the steel structure and foundation bolt
connections for current conduction to ground. The bolts are connected to a ring inside
the concrete, having four bolted lug connections going to the ring earth conductor, which
forms the earth electrode together with 8 copper rods.
The numerical model with the LDC included is shown in Fig. 6.5 above a perfectly
conducting ground plane. Here a direct lightning strike is modelled.
For the investigations in this chapter, it was decided that the consideration of soil does
not affect the discussion sufficiently to warrant the substantial overheads in computation
necessary for its inclusion. However, specific questions regarding the steel reinforcing in-
side the concrete are discussed in section 6.6, where real earth is modelled as a Sommerfeld
integral ground plane.

Chapter 6 — KAT-7 Lightning Protection 66
Figure 6.5: KAT-7 FEKO model with lightning rods and complete LDC added. The
model is raised onto the foundation bolts, which in the model’s case is connected to the
ground plane. A direct lightning strike is modelled by a current injection at the receiver
lightning rod.
6.3 Equivalent Lightning Excitations
The following sections give detail on the simulation of direct and indirect lightning strikes
through different methods of excitation in the FEKO modelling. Initial results are dis-
cussed.
6.3.1 Simulated Direct Lightning Strike
We elected to investigate the highest probable lightning frequency at 50 MHz only. Beyond
this point the RFI becomes negligible according to IEC standards [16]. With the scaling
factor of 20, the simulation frequency was 1 GHz. This fits within the frequency range
for which the model was verified.
A direct strike was modelled with a current injection via a 50 Ω wire-port at the
dish receiver lightning rod as shown in (Fig. 6.5). Similar excitations have been used
in [37, 38, 39] to simulate lightning current return strokes.
To investigate problematic areas during a lightning strike, surface currents and electric
fields were requested as the calculations to be done by FEKO. Meshing resulted in 280
segments and 22,538 triangles. This required 10 GB of memory, and the simulation was
run on a four-core machine, with 15 GB of memory available, in just under five hours.

Chapter 6 — KAT-7 Lightning Protection 67
Figure 6.6: Current injection through lightning rod onto struts of dish for equivalent
direct-lightning strike. Loops are formed between the dish struts, structure and ground.
6.3.2 Interpretation of Direct Strike Results
Several interesting, and perhaps unexpected, features are found with the direct injection
method. From a high-level perspective, the currents on each strut are approximately
equal. However, on closer scrutiny, there are several loops that are formed when the
ground connected injection cable similar to the physical model semi-rigid is employed.
Some of these are highlighted in Fig. 6.6.
The current density and electric field plot of Fig. 6.7 should also be considered in this
discussion. Some capacitive coupling is discernible between the dish and the pedestal at
mid-pedestal height with the dish in this position. The lower strut also forms a common
path between the identified loops 1 and 2. As a consequence, the lower strut current
density differs from the other struts. Additionally, the ground plane forms the return
path for the current injection.
The question arises as to whether or not this is a fair representation of a direct strike,
as in real conditions, no such directed return path is created. Measurements have been
made on the actual XDM using this technique. The immediate value of this approach is
that current paths can be determined using CM current probes and this readily identifies
cable barriers that are not sufficiently protected.
What the results show is that the injection method does affect the resulting currents
due to the loops being formed. However, by placing the injection conductor further away
from the pedestal base, the influence of the injecting current magnetic field is lessened.
Recommendations in this regard are alluded to in [11], where different configurations of
lightning excitation with a continuous CW current source are compared to each other.

Chapter 6 — KAT-7 Lightning Protection 68
Figure 6.7: Computed current density and electric field results for the equivalent
direct-lightning strike. Currents are more uniform on each strut and the capacitive
coupling between dish and pedestal at mid-pedestal height is just apparent.
With the test setup recommended, the earthing is used as the return path, as with our
testing. Furthermore, the higher coupling level is shown with an angled excitation con-
ductor closer to the structure being tested. Guidelines on minimum distance away from
the structure is given as a distance more than three times the diameter of the structure
for tall structures.
In Fig. 6.8, a comparison between the electric field results for an equivalent direct strike
is shown for two cases. The first case is where the pedestal bottom is open (which was
relevant for an initial wooden floor design) and cable shields enter the pedestal between
the bolts that the pedestal rests on. The following scenario shows where the bottom of
the pedestal is totally shielded by a metallic plate, and cable shields are concentrically
bonded to the plate upon entering. The plate allows shielding of between 40 dB and 50
dB toward the inside of the pedestal, compared to an open pedestal. Feedback in this
regard was important to the KAT-7 design team.
6.3.3 Simulated Indirect Lightning Strike
By way of contrast, an indirect lightning strike was modelled with a 10 V/m EM plane
wave from 12 different directions, which can be seen in Fig. 6.9. The plane-wave propaga-

Chapter 6 — KAT-7 Lightning Protection 69
Figure 6.8: Comparison of electric field results for an equivalent direct strike. A
cross-section of the bottom part of the pedestal is shown with an open floor on the left
and a shielded floor on the right. The electric field values are shown for points on the
z-axis in the middle of the pedestal.
tion is perpendicular toward the dish with vertical electric field orientation and horizontal
magnetic field orientation. The current density and E-field results in FEKO are calculated
for each of these plane waves at 1 GHz.
6.3.4 Interpretation of Indirect Strike Results
Fig. 6.10 shows the current density arising from such an indirect excitation toward the
front of the dish. An immediate observation is that the top and bottom struts have
substantially higher induced currents, because they form a loop cutting the magnetic
field. In this case there is no preferential ground return orientation.
From these studies one could consider which struts give the most protection to the
galvanically conducting cables running to the feed-horn. In the case where the dish
position is most frequently angled at 45 degrees to the horizontal, and indirect strikes are
most common, the side struts would afford the best shielding to the cables.
Throughout the design phase of KAT-7, this thinking was used to maximise the use
of the metallic pedestal interior as an EMC-zone. Careful inspection of Fig. 6.10 also
shows interior surface current density which is worsened by poorly-bonded cabling and
incomplete barriers at the base for an equivalent indirect lightning strike.
6.4 Lightning Down Conductor Investigations
For the LDC system, different configurations of the conductors and their connections over
the bearings were considered. The main components of the LDC include the lightning

Chapter 6 — KAT-7 Lightning Protection 70
Figure 6.9: Plane-wave excitation from different directions, modelling indirect lightning
strikes.
Figure 6.10: Sectioned view of plane-wave excitation from the front of the dish. Higher
current density is apparent on the lower and upper struts.
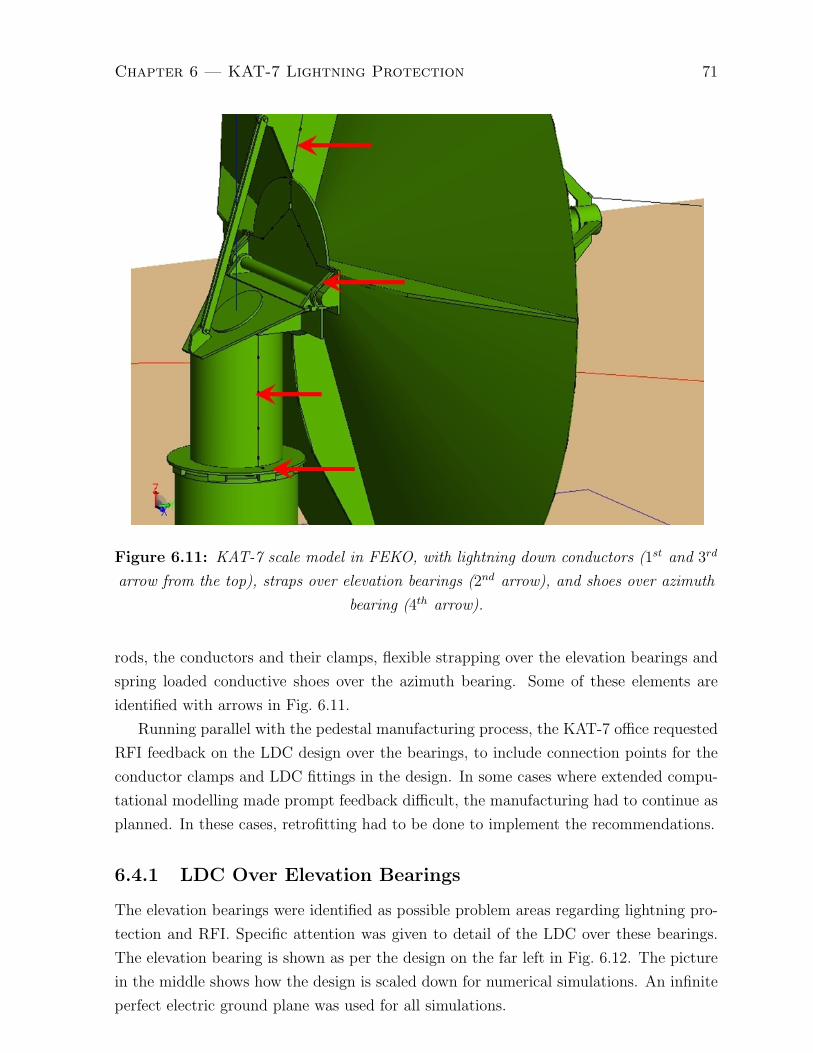
Chapter 6 — KAT-7 Lightning Protection 71
Figure 6.11: KAT-7 scale model in FEKO, with lightning down conductors (1st and 3rd
arrow from the top), straps over elevation bearings (2nd arrow), and shoes over azimuth
bearing (4th arrow).
rods, the conductors and their clamps, flexible strapping over the elevation bearings and
spring loaded conductive shoes over the azimuth bearing. Some of these elements are
identified with arrows in Fig. 6.11.
Running parallel with the pedestal manufacturing process, the KAT-7 office requested
RFI feedback on the LDC design over the bearings, to include connection points for the
conductor clamps and LDC fittings in the design. In some cases where extended compu-
tational modelling made prompt feedback difficult, the manufacturing had to continue as
planned. In these cases, retrofitting had to be done to implement the recommendations.
6.4.1 LDC Over Elevation Bearings
The elevation bearings were identified as possible problem areas regarding lightning pro-
tection and RFI. Specific attention was given to detail of the LDC over these bearings.
The elevation bearing is shown as per the design on the far left in Fig. 6.12. The picture
in the middle shows how the design is scaled down for numerical simulations. An infinite
perfect electric ground plane was used for all simulations.

Chapter 6 — KAT-7 Lightning Protection 72
Figure 6.12: F.l.t.r. Full scale elevation bearing design; Scale model straps over
elevation bearings in FEKO; Simplified FEKO structure with straps over elevation
bearings.
Figure 6.13: The LDC straps are shown here connected over the elevation bearing axle
on the left, and connected beneath the axle on the right.
The discretised model in FEKO was too large to run on a normal four-core machine.
Thus the simulation was submitted to the CHPC. However, with increased usage and
long queues, valuable time was lost with unavailability of the CHPC. We decided to
further simplify the model to exclude the dish part, in order to run simulations on single
machines instead of the clusters. Using the simplified model allowed EMC principles to
be investigated and different design scenarios compared to each other. The simplified
structure without the dish is shown to the right of Fig. 6.12.
The main concern was whether the LDC straps should go over the bearing axle or
underneath it. Here the optimal lightning protection is desired at the lowest cost. An
initial design had the straps connected over the bearing axle. To reduce the length of
strapping to keep costs low, the design was changed to go beneath the axle. The question

Chapter 6 — KAT-7 Lightning Protection 73
Figure 6.14: Full scale azimuth bearing design, showing the inner ring of the bearing in
the middle picture and the outer ring in the picture on the right. One of the 71 roller
elements is shown, designed in such a way to be able to take the weight of the yoke and
dish.
was raised as to which design would render the optimal protection.
The simplified model excluding the dish was used to calculate the surface currents
and electric fields at 1 GHz in FEKO. Two scenarios were investigated, namely with the
longer straps going over the axle, and the shorter straps connected beneath (Fig. 6.13).
6.4.2 LDC Over Azimuth Bearing
The azimuth bearing consists of an outer ring, an inner ring and 71 bearing roller elements.
The outer ring bolts onto the bottom part of the pedestal, and the inner ring is bolted to
the top part of the pedestal, called the yoke. The bearing design is such that the roller
elements are cylindrical and oriented in a 45 degree angle to be able to carry the weight
of the yoke and dish. Fig 6.14 shows the design of the rings of the bearing, as well as one
of the 71 roller elements.
The two lightning down conductors coming from the elevation bearing terminates on a
360 degree connected steel ring which is bolted on the bottom lip of the yoke, and extends
over the radius of the bearing. Four spring-loaded copper shoes bolted onto the outer ring
of the bearing act as a brushing system to connect to the steel ring above. The full-scale
design for one of these shoes is shown on the far left picture of Fig 6.15. The following
picture to the right shows the scale model design in FEKO for the 4 shoes. However, with
the unavailability of the CHPC, the dish was left out of this model and the simplification
of the pedestal and yoke is seen in the third picture of Fig. 6.15.
Here we focused on the amount of shoe-connections needed to effectively protect the
azimuth bearing against lightning, keeping cost in mind. Simulations were done for dif-
ferent scenarios of the LDC design over the bearings, including layouts with 2, 4 and 8
shoes, and with or without the conductors from the elevation bearing.
Perfect connections between the bearings and metallic parts of the structure were
assumed, which allows use of the metallic structure as part of the LDC system [9]. In the
implementation, however, the mechanical engineering team, although mindful of EMC

Chapter 6 — KAT-7 Lightning Protection 74
Figure 6.15: F.l.t.r. Full scale azimuth bearing design; Scale model design in FEKO of
shoes over azimuth bearing; Simplified FEKO model with shoes over azimuth bearing;
Detail of air gap simulating coated surface between bearing interfaces.
matters, made corrosion protection a priority. Consequently, the metal interfaces were
painted or gun-coated, which introduced capacitive coupling specifically at the bearing
interfaces. The last picture in Fig. 6.15 shows a section view of the bearing and shoe
interface, where these coated surfaces are modelled with an air gap.
Two different orientations of the dish, at 45 degrees and at 90 degrees, were considered.
Direct current injection of 1000 V and 100 A, and a plane-wave excitation of 100 V/m,
were used to evaluate as many as possible scenarios for which the coupling levels could be
compared. The results calculated in FEKO were the surface current density and electric
field.
6.4.3 Results for LDC Over Elevation Bearings
Each scenario was excited by the same level of current or electric field, and the surface
current density and electric field result levels were compared to each other for the different
scenarios. Specific levels were not considered for this investigation.
Surface current density results are shown in Fig. 6.16 and Fig. 6.17 for the straps
connected over and beneath the bearing axle respectively. The indicated levels of surface
current density agree to within 0.4 dB for these two scenarios, except at the point where
the axle enters the elevation bearing. Here the surface current levels are 3.7 dB higher for
the straps connected over the bearing than for the straps connected below the bearing.
No difference could be observed between scenarios for the electric field results. With
no contribution to the recommendations given, these results were omitted.
With the plane-wave excitation, the surface current density levels were highest when
the plane wave is directly from the side of the model. When comparing the case for the
straps over versus the straps below the axle, the results in Fig. 6.18 and Fig. 6.19 show
that the levels on the bearing and axle mounting differ by no more than 0.7 dB. However,

Chapter 6 — KAT-7 Lightning Protection 75
Figure 6.16: Surface current density results for a direct current injection. The dish is
angled at 45 degrees and the straps connected over the elevation bearing axle.
Figure 6.17: Surface current density results for a direct current injection. The dish is
angled at 45 degrees and the straps connected beneath the elevation bearing axle.

Chapter 6 — KAT-7 Lightning Protection 76
Figure 6.18: Surface current density results for a plane-wave excitation from the side.
The dish is angled at 45 degrees and the straps connected over the elevation bearing axle.
the current density for the strap going beneath the axle is 3 dB higher than the value on
the axle connection to the bearing. For the strap going over, the axle connection value is
3 dB higher compared to the strap’s value.
These results indicates that the strap going below the axle has a better protection
characteristic compared to the strap going over when the dish is angled at 45 degrees.
Considering the dish at an angle of 90 degrees to the vertical, the surface current
density results are given in Fig. 6.20 and Fig. 6.21. From the figures it can be seen that
all of the levels in the strap going over the axle are between 2 dB and 3 dB lower than the
case with the straps going below. From inspection, it was found that the current injection
level for the latter case is 2.3 dB higher, indicating that the comparative levels agree to
within 1 dB.
The plane-wave excitation results follow in Fig. 6.22 and Fig. 6.23. For this case, all
the levels are between 1 dB and 2 dB higher for the straps going over the bearing axle
compared to the straps connected below.
The simulations were repeated with the surfaces coated as mentioned in section 6.4.
The coating of paint was modelled with a 2 mm air gap, which relates to a 100 micron
space. The current density results of Fig. 6.24 show that the results are still in agreement
with the values obtained without the coated surfaces.
The final recommendation given to the KAT-7 design team was that the level of
protection is better for the case where the LDC straps are connected below the elevation

Chapter 6 — KAT-7 Lightning Protection 77
Figure 6.19: Surface current density results for a plane-wave excitation from the side.
The dish is angled at 45 degrees and the straps connected beneath the elevation bearing
axle.
Figure 6.20: Surface current density results for a direct current injection. The dish is
angled at 90 degrees and the straps connected over the elevation bearing axle.

Chapter 6 — KAT-7 Lightning Protection 78
Figure 6.21: Surface current density results for a direct current injection. The dish is
angled at 90 degrees and the straps connected beneath the elevation bearing axle.
Figure 6.22: Surface current density results for a plane-wave excitation from the side.
The dish is angled at 90 degrees and the straps connected over the elevation bearing axle.

Chapter 6 — KAT-7 Lightning Protection 79
Figure 6.23: Surface current density results for a plane-wave excitation from the side.
The dish is angled at 90 degrees and the straps connected beneath the elevation bearing
axle.
bearing axle. This implies a lower cost for the shorter straps needed for this application.
The recommendation was implemented on the KAT-7 structures.
6.4.4 Results for LDC Over Azimuth Bearing
Four models evaluating different scenarios of connection over the azimuth bearings, are
shown in Fig. 6.25. Each model has a different amount of copper shoe connections over
the bearing and a different amount of conductors coming from the elevation bearings to
the steel ring which connects to the shoes.
With the assumption that all steel elements of the structure was galvanically con-
nected, the surface current density for these four scenarios were modelled in FEKO. The
results showed that the levels of current density did not change much between the differ-
ent cases. One of the results, for the four shoes connected and no conductors, is shown
in Fig. 6.26. Here the only change between scenarios is that the bearing elements di-
rectly behind the shoes have lower current density levels than when there are no shoes
connected. The electric field levels inside were the same for the different scenarios.

Chapter 6 — KAT-7 Lightning Protection 80
Figure 6.24: Simulations repeated with coated surfaces for the dish at 45 degrees. The
first picture shows current density results for the straps over the bearings and the
following picture for the straps below.
Figure 6.25: Different scenarios for connection of the LDC copper shoes over the
azimuth bearing. F.l.t.r. No conductors or shoes connected; Two conductors and two
shoes connected; Four shoes connected, but no conductors, thus the steel of the yoke and
pedestal is used for the LDC; Four conductors and four shoes connected.

Chapter 6 — KAT-7 Lightning Protection 81
Figure 6.26: Surface current density on the bearing elements for four shoes connected
over the bearing, as seen from below and from inside the structure.

Chapter 6 — KAT-7 Lightning Protection 82
Figure 6.27: Original design over the azimuth bearing on the left, showing high current
density at the coated interfaces due to capacitive coupling. The altered design on the right
shows noticeably lower current density at key interfaces compared to the previous figure.
6.4.5 Coated Interfaces and Corrective Bonding
As mentioned in section 6.4, all the element surfaces were coated for corrosion protection.
The bearing itself was gun-coated and the pedestal and yoke structures were painted.
From this it became apparent that even the bolts connecting these elements would only
contact the painted surfaces, and not make galvanic connection. To ensure that all possible
practical conditions were included in the modelling, it was elected to repeat the modelling
with the coated surfaces.
At the interfaces between the yoke, bearing and pedestal, the areas are fairly large and
the distance between the elements very small. With the painted or gun-coated surface, this
creates a capacitor. At high frequency, capacitive coupling takes place at these interfaces,
introducing surface currents to the inside of the structure. The worst case surface current
density for the original design is shown in the first picture of Fig. 6.27. The high levels of
coupling can be seen here if the elements are not galvanically connected.
Alterations to the design was discussed with the design team, as this layout was
discovered to show the worst coupling levels. The yoke and pedestal had, however, already
been manufactured, and the fittings for the LDC connections were already installed. The
only alternative was to investigate a design which could be retrofitted still using the
installed fittings.
Lower coupling levels were seen with more conductors used concentrically around the
yoke and the pedestal. The design was changed to let the two down conductors split into
four terminations onto the steel ring. Bonding of the copper shoes onto the bearing had
to ensure galvanic connection, and conductors from the shoes to the pedestal steel was

Chapter 6 — KAT-7 Lightning Protection 83
Figure 6.28: Simulated electric field inside the bottom of the pedestal structure, for
three different scenarios, f.l.t.r. Coated interfaces with high electric field levels inside the
pedestal; Optimised bonding with decreased electric field levels inside the pedestal; Ideal
galvanically connected structure with very low electric field levels inside. The electric
field values are shown for points on the z-axis in the middle of the pedestal.
needed. When these alterations to the design was modelled, we observed that the worst
case surface current coupling levels dropped by 12 dB. The decreased current density at
the interfaces can clearly be seen in Fig. 6.27. This can be attributed to the more uniform
surface current distribution using four connections compared to two connections to the
steel plate.
Different levels of E-field coupling to the inside of the structure are shown in Fig. 6.28.
The picture on the left shows the electric field levels for the original LDC design. The
results for the optimised design E-field is seen in the middle picture, while the picture to
the right has the assumed perfect galvanic connection with no LDC connected over the
bearing. From the original LDC design, the E-field levels are reduced by 12 dB with the
optimised design. However, the ideal galvanically connected structure would have given
30 dB shielding without the need of an LDC. The recommendations were relayed to the
KAT-7 design office and the changes will be implemented on one of the KAT-7 structures.
The FEKO modelling aided in designing corrective bonding placement for improved
lightning protection, and minimal induction to the interior of the structure.
6.5 RFI Resonances
Where discontinuities in the structure exist, lightning currents may experience reflec-
tions in the time domain, due to sudden changes in impedance of the current path [21].
These reflections can be linked to resonances in the frequency domain. A program within
FEKO, called AdaptFEKO, uses adaptive frequency sampling to identify sharper reso-
nances within a certain frequency range. More frequency points are then chosen closer to

Chapter 6 — KAT-7 Lightning Protection 84
Figure 6.29: Surface current density results, at 587 MHz, in and outside the pedestal
and yoke, for the azimuth bearing galvanically connected.

Chapter 6 — KAT-7 Lightning Protection 85
the resonances and less points where the curve is relatively smooth. This helps to ensure
that very sharp resonances are not missed when choosing the amount of frequency points
for a wide frequency range. The code chooses the frequency points at which resonances
occur to calculate the current density and the EM field.
A frequency range with 21 frequency points between 20 MHz and 1 GHz was used
to investigate areas which require RFI mitigation due to possible reflections. This corre-
sponds to a real frequency range of 1 MHz to 50 MHz, which includes the higher frequency
lightning content. Although the highest concentration of energy for the lightning current
lies around 25 kHz, the main lightning protection is being dealt with by the contractors.
The result for one of these investigations is shown in Fig. 6.29 for the pedestal, yoke
and azimuth bearing galvanically connected. The only pathway for leakage currents and
fields to enter the interior, is in between the bearing roller elements. At 587.368 MHz,
a resonance is apparent on the inside of the yoke, where surface current density inside
is equivalent to that on the outside of the yoke. Surface currents inside the pedestal,
however, are at levels of 60 dB to 65 dB less than the outside.
When considering the scaled dimensions of the model yoke interior, it was discovered
that the height of 102 mm from the bearing to the ceiling corresponds directly to the
wavelength of the 5th harmonic of 587.368 MHz. The harmonic frequency scales in real
terms to 146.8 MHz. This is close to a frequency range of 150 MHz to 153 MHz, which is
used as one of the operational bands for pulsar detection. If the design dimensions were
slightly different, lightning induced reflections inside the structure could interfere with
observed radio signals from pulsars.
From these results it is seen that resonances inside the structure can assist the identifi-
cation of areas requiring RFI mitigation at sensitive frequencies. By investigating resonant
frequencies on accurate scale models in FEKO, including all interfaces and equipment,
recommendations on future design parameters for the placement of shields and cabinets
inside the structure can be given to MeerKAT to effectively mitigate lightning interference.
As a final comment on this analysis, some resonant frequencies are dependent on
particular cable lengths and layout. In practice, variations between pedestal cable and
cabinet configurations can lead to quite different characteristics. Specific investigations
are thus not always profitable. Rather, a design team should be alert to the possibility of
structural resonances, and take care to keep these out of sensitive bands.
6.6 Earthing Investigations
From the IEC standards on lightning protection [9], the requirement is given that the
LPS should utilise the metal elements of the structure in the design. The requirement for
steel reinforcing in concrete, is that the interconnection of the metal elements should be

Chapter 6 — KAT-7 Lightning Protection 86
continuous, thus the elements should either be welded or securely connected.
In the first picture of Fig. 6.30 the foundation excavations is shown in the photograph,
with the steel reinforcing to be used in the background. The second picture gives a closer
view of the steel reinforcing for one of the structure foundations, and the last picture
illustrates full welding of all the elements of the reinforcing.
To follow the standard requirement, earthing was done via eight copper rods in the
bottom of the foundation excavation. Four rods are placed one at each corner, and the
other four are placed in between them on the sides. All of the rods are interconnected
with a copper ring conductor using exo-thermic welding. An early design sketch is seen
as the first picture in Fig. 6.31. The earthing is connected onto a ring that forms part
of the pedestal foundation bolts (second picture). The connection is shown in the third
picture as a bolted lug connection onto the ring. The last picture of the figure illustrates
one of the exo-welded joints of the earth electrode conductors.
The design team opted to implement different earthing strategies on some of the KAT-
7 structures. Three of the structure’s foundation steel reinforcing was welded together to
ensure proper continuity of the steel. The labour-intensive welding process took three full
work days to complete per structure. The building of the full KAT-7 structure takes about
2 weeks, so this seemed a disproportionate amount of time devoted to the foundation.
The KAT-7 building team expressed concern about the time and cost implications.
Another interconnection method that was implemented on one structure, was to con-
nect the steel elements with binding wires (5 % was welded for stability only), and a
third method had only 20 % of interconnections welded. Soil resistivity surveys and earth
resistance tests were done on all seven foundation’s earthing. The earth resistance tests
were initially carried out with just the copper earth wires and rods installed in the foun-
dation excavation. Afterwards, the tests were repeated when the foundation reinforcing
Figure 6.30: Photographs f.l.t.r. The foundation excavation for one of the KAT-7
antennas with the steel reinforcing to be used in the background; The steel reinforcing for
one of the structure foundations; Welding of foundation steel reinforcing elements to
improve resistance to earth.

Chapter 6 — KAT-7 Lightning Protection 87
Figure 6.31: F.l.t.r Early design sketch of the earth electrode layout; The pedestal
mounting foundation bolts connected to the reinforcing; Earth electrode connected to the
foundation ring with a bolted lug; Exo-thermic welding connection for the earth electrode
conductors.
was connected and the concrete poured.
The requirement from the standards [9] states that the resistance to earth of the earth
electrode system be below 10 Ω for effective lightning protection. For two of the structures
with reinforcing steel elements welded, the earth resistance was measured as 26.4 Ω and
28.2 Ω before, and 9.21 Ω and 7.71 Ω after the concrete was poured. The improvement
in earth resistance by adding the steel reinforced concrete with welded interconnections
of steel elements, was therefore 17.2 Ω and 20.5 Ω respectively.
The foundation using binding wires had values of 33.4 Ω and 9.38 Ω, indicating an
improvement of 24 Ω. Where the reinforcing was only 20 % welded, the resistance to earth
was decreased by 12.4 Ω to 6.88 Ω. It was found that the addition of the steel elements
to the earth electrode system lowered the earth resistance by between 12 and 24 Ω. The
interconnection with binding wires showed the best improvement in earth resistance.
If it could be proved that the welded interconnection of the steel elements is not
essential for the earth electrode system, it would save both time and cost to the project,
eliminating the labour-intensive process of welding all the steel elements of the reinforcing.
6.6.1 Numerical Modelling of Earthing and Bonding
The simplified scale model used in section 6.4.2 is employed to investigate earthing and
bonding. At the base of the pedestal, only four of the foundation bolts are galvanically
connected to the pedestal steel for the LDC. Although all thirty-two bolts go into the
foundation and are connected to the two foundation rings, only the four relevant bolts are
modelled. The steel reinforcing is included as a grid of fifteen by fifteen wires, connected
below ground level to the first foundation ring. A similar grid is formed at the bottom
of the concrete foundation, and both grids are connected with fourteen vertical wires on
each side. A ring conductor at a level halfway in between the two grids, is represented by

Chapter 6 — KAT-7 Lightning Protection 88
Figure 6.32: FEKO simulation of the simplified pedestal and steel reinforcing connected
to the earthing. An infinite Sommerfeld ground plane simulates the soil interface. The
interface at the bottom of the soil is set up as a PEC ground plane. Symmetry is used to
reduce computation time, seen as two green rectangles. A current injection is modelled
with four concentric conductors, connected from the PEC earth below the soil. They
combine above the model to connect to a discrete voltage port with fixed current value,
which is used to simulate a direct lightning strike.

Chapter 6 — KAT-7 Lightning Protection 89
Figure 6.33: The picture on the left gives a side view of the model with the reinforcing
and earth. The only current return path is formed by the earthing conductors via the soil
to the PEC ground plane; The picture on the right shows how the earthing conductors
are connected to the pedestal foundation ring in the middle of the steel reinforcing.
Different interconnections of the elements and earthing are investigated.
a wire that connects the vertical wires on all sides.
Eight vertical wires below the foundation are interconnected by a ring wire that forms
the earthing copper rods and ring conductor. Four wires connect the earthing ring on
each side to the bottom foundation ring inside the foundation grid.
Earth is simulated by a Sommerfeld integral ground plane which has dielectric material
representing the soil and a PEC ground plane beneath it. The material is defined with the
same assumed conductivity for both soil and concrete, scaled and converted from 100 Ωm
to 0.2 S/m. From [32, 48], an accepted value for the relative permittivity of soil is given
as ε = 10. To simplify the model, the area below the pedestal which allows cable entry is
left out of the model, forming a homogeneous area below the air-soil interface.
The bottom of the simulated soil forms a PEC ground plane. The discrete voltage
port, which forms the current injection for a simulated direct lightning strike, is connected
to this PEC ground plane via four wires. These wires run parallel to the ground plane
to the extent of the model, and then bend down to connect to this ground plane (see the
picture in Fig. 6.32). This forms the return path for the current injection from the voltage
port. Current values on the wires can then be compared for the different scenarios.
For the interconnected scenario, all of the wires are connected at each intersection.
The right-hand side picture of Fig. 6.33 shows all the interconnected reinforcing steel
elements, as well as the earthing rods and ring below it. The diagonal wires connecting

Chapter 6 — KAT-7 Lightning Protection 90
Figure 6.34: Steel reinforcing elements not interconnected to investigate the effect on
earthing.
the foundation ring to the earthing ring are connected to the bottom steel grid as well.
In Fig. 6.34, none of the reinforcing elements are interconnected, neither are they
connected to the earthing ring or rods. This is achieved by translating the elements by
2 mm in different directions in the model, thereby being in close proximity in the concrete,
but not galvanically connected. The only connections made are the elements that cross
the top foundation ring, which are connected to that ring and each other, and the diagonal
earth wires connecting the foundation ring to the earth ring.
The two models are meshed in FEKO to each form 1160 triangles and 2720 segments.
Geometrical symmetry is used in two planes to increase the computational speed. For the
1 GHz frequency considered, the simulations took less than three hours each to run on a
four-core machine.
6.6.2 Modelling Results
The foundation reinforcing element current results, for interconnection versus no inter-
connection of steel reinforcing, can be seen in Fig. 6.35 and Fig. 6.36. The same results
for the copper earthing elements of the earth electrode system are shown in Fig. 6.37 and
Fig. 6.38.
When the currents on the steel reinforcing for the two scenarios are compared, the
elements at the top of the reinforcing show less than 2 dB variation in value. However,
the results on the lower elements of the concrete reinforcing show that the interconnected
scenario (where the earthing and lower grid is connected as well) has higher currents
flowing. Where the elements are not interconnected, the lowest current result is 9 dB

Chapter 6 — KAT-7 Lightning Protection 91
Figure 6.35: Wire current and surface current density results from FEKO 1 GHz
simulation for steel reinforcing rods interconnected.

Chapter 6 — KAT-7 Lightning Protection 92
Figure 6.36: Wire current and surface current density results from FEKO 1 GHz
simulation for steel reinforcing rods not interconnected.

Chapter 6 — KAT-7 Lightning Protection 93
Figure 6.37: Wire current results from FEKO 1 GHz simulation for steel reinforcing
rods interconnected.

Chapter 6 — KAT-7 Lightning Protection 94
Figure 6.38: Wire current results from FEKO 1 GHz simulation for steel reinforcing
rods not interconnected.

Chapter 6 — KAT-7 Lightning Protection 95
lower than the lowest value for interconnected elements.
Considering the copper earthing elements for the different scenarios, the results in
Fig. 6.37 and Fig. 6.38 differ no more than 3 dB, except for three wire segments. The
largest variation on these segments of the copper wire, is seen where it is connected to the
lower grid steel reinforcing in the interconnected case. Here the current levels are 17 dB
lower than the levels for the copper wire that is not connected.
These results indicate that the interconnection of the steel reinforcing does not affect
the earthing greatly. However, the connections between the earthing electrode and the
foundation steel rings and reinforcing elements do show changes in current levels. After
discussion with the infrastructure team of KAT-7, we found that the foundation ring onto
which the earth rods are connected, is painted as well.
At higher frequencies, such as the scaled 50 MHz used for simulation, capacitive cou-
pling would aid the conduction of current to earth through this connection. However, if
proper galvanic connection is not made, the main lightning current components at 25 kHz
and 1 MHz may prefer the reinforcing elements as the lowest impedance path to earth.
This could cause cracking of the concrete and damage to the foundation when lightning
strikes. For this reason, some countries forbid the use of concrete steel reinforcing as part
of the earth electrode [9].
To conform to South African standards, which are in line with IEC standards [9, 16,
18, 19], using binding wires to connect the steel reinforcing elements would be sufficient,
seeing that it has the best improvement in earth resistance as well. High frequency
simulations show that the interconnection of the steel elements do not contribute largely
to the flow of current, except where connections are made to the copper earth electrodes.
However, with practical considerations of corrosion protection inside the concrete [9, 57],
these connections need closer scrutiny for the MeerKAT design.
6.7 Conclusions
The verified CEM models are used for investigations into RFI characterisation for maxi-
mum lightning protection. Different excitation methods for equivalent direct and indirect
lightning strikes are evaluated and a direct injection method is found to be valid under
certain conditions. However, an improvement on the current injection method is to not
take it from one side only, but have the excitation wire connected to ground on four
different sides to lessen the magnetic field influence.
The modelling is used to study various different design options for the LDC layout
and bonding over the bearings. To consider the RFI implications of the design as well,
surface current density and electric fields are calculated in FEKO at the highest probable
lightning frequency of 1 GHz, which scales in real terms to 50 MHz. The results are

Chapter 6 — KAT-7 Lightning Protection 96
used to compare the lightning current and RFI behaviour for the different cases and
determine the optimal design layout regarding cost-effectiveness, lightning protection and
RFI mitigation.
The function AdaptFEKO is used to show that resonances can identify areas requiring
RFI mitigation inside the structure. This can help the future MeerKAT design to ensure
that the dimensions of shielded enclosures inside the structure do not cause lightning
induced reflections at frequencies sensitive to radio astronomy observations.
Using a Sommerfeld integral ground plane with soil and concrete below, the FEKO
simulations have shown that welding the steel reinforcement elements of the concrete
foundation does not affect the currents flowing in earth sufficiently to substantiate the
time and cost, compared to using binding wire to interconnect all the steel elements.
However, the earthing rods and bonding ring play an important role, and the connection
of this earthing system to the pedestal foundation bolts is a more relevant matter requiring
attention. Feedback pertaining to the earthing issues at hand were given to the SA SKA
team to consider when planning the design for MeerKAT.
Continuous feedback has been given to the KAT design team on an active international
project. FEKO has played an important role in these investigations.
− The most important thing is to not stop questioning −
− Albert Einstein −

Chapter 7
Conclusions and Recommendations
This dissertation has presented original design contributions regarding lightning protec-
tion and RFI mitigation for South Africa’s intended demonstrator for the world’s largest
radio astronomy project, the SKA. These contributions have been tested using the compu-
tational electromagnetic code, FEKO. This approach has been validated through extensive
checking of physical and computational scale models.
Two methods of lightning excitation were used in the investigations. An equivalent
current injection method simulated direct lightning strikes. The connection of the current
injection was brought into question at an URSI conference, but ITU recommendations
give conditions for which it is valid. However, an improvement on the method is to
not take the injection from one side only, but establish the ground connection from four
concentric sides to minimise the effects of the electromagnetic fields produced by the
injection current.
The design for the lightning down conductor system for KAT-7 was enhanced by
strapping beneath the elevation bearings’ axle, and copper shoe connections with optimal
bonding over the pedestal azimuth bearings. Coated surfaces and static-bearing roller
elements are taken into account for the modelling, having significant influence on the
results. Worst case levels of induced RFI into the pedestal are compared, to evaluate
the primary areas requiring RFI mitigation in the design. Using AdaptFEKO, structure
resonances identify RFI sensitive areas for specific frequencies. The entire lightning down
conductor (LDC) design keeps cost-effectiveness as a design constraint.
Project cost and time are saved by evaluating the method of interconnection of the
foundation reinforcing as part of the lightning earthing system. This eliminated the
need for welding all metallic elements of the reinforcing, which can take up to 3 days
per structure. The findings were achieved with MoM code combined with a Sommerfeld
integral ground plane and simulated soil below.
The principles and recommendations of this dissertation will be applied in the design of
MeerKAT as well. Further recommendations toward this goal would include the following:
97

Chapter 7 — Conclusions and Recommendations 98
Figure 7.1: Photograph of the first KAT-7 dish being installed in the Karoo during July
2009 [1].
• Investigate the option of surface coatings only after galvanic connection of conduc-
tive elements have been established. The life cycle costing of the corrosion protection
against lightning protection should be established to determine a final decision.
• Accurate numerical simulation of the inside of the pedestal should be done with
the inclusion of all equipment cabinets. Evaluating resonant frequencies for this
enclosure will identify possible induction problems due to lightning. The layout and
design of shielding plates or grids for this enclosure can be studied in FEKO to
minimise RFI toward the inside of the structure.
• Instead of utilising the foundation steel reinforcing in the lightning earthing system
to lower resistance to earth, rather extend the earthing through additional horizontal
or vertical earthing rods and ring conductors. The effectivity can be tested through
calculations according to South African National Standards on Earthing and by
simulating the layout in FEKO.
With the construction of KAT-7 nearing completion, recommendations that have not
yet been actioned due to scheduling constraints, will be implemented on at least one of
the structures. A photograph of the first KAT-7 dish being installed during June of 2009
is shown in Fig. 7.1.
− Think like a man of action, act like a man of thought −
− Henry L. Bergson −

Bibliography
[1] South African SKA (Square Kilometre Array), http://www.ska.ac.za/
[2] Square Kilometre Array, the international radio telescope for the 21st century,
http://www.skatelescope.org/
[3] R.T. Lord, RFI and radio astronomy - why the fuss?, National Research Foundation,
MeerKAT (KAT-7 Phase) Technical Report, K0000-2001V1-009 TR, Revision 1, 08
July 2009
[4] P.C.T. van der Laan, A.P.J. van Deursen, “Reliable protection of electronics against
lightning”, 23rd ICLP, Florence, Italy, Paper 3.14, Vol. I, pp. 370 − 373, Sept 1996
[5] FEKO, Electromagnetic Software and Systems (EMSS), http://www.feko.info/
[6] A. Piantini, J.M. Janiszewski, A. Borghetti, C.A. Nucci, M. Paolone, “A scale model
for the study of the LEMP response of complex power distribution networks”, IEEE
Trans.Power Del., Vol. 22, No. 1, pp. 710 − 720, Jan 2007
[7] G. Sinclair, “Theory of models of electromagnetic systems”, Proceedings of the I.R.E.,
pp. 1364− 1370 Nov 1948
[8] Computer Simulation Technology (CST), Microwave Studio, http://www.cst.com/
[9] International Electrotechnical Commission, “Protection against lightning, Part 3:
Physical damage to structures and life hazard”, IEC 62305-3:2006, Jan 2006
[10] H.C. Reader, R.H. Geschke, P.S. van der Merwe, Dr. R.G. Urban, P.G. Wiid, D.J.
Rossouw, “Issues in EMC metrology and modelling for SKA demonstrator”, 2008
URSI General assembly, Commissions A and E: EMC Measurements, Chicago, USA,
August 2008
[11] International Telecommunication Union, Standardization Sector, “Series K: Protec-
tion against interference, Protection against LEMP in telecommunication centres”,
ITU-T Recommendation K.40, May 1996
99

BIBLIOGRAPHY 100
[12] T. Williams, “EMC for Product Designers, Meeting the European Directive”,
Newnes, Third Edition, 2001
[13] T. Williams, K. Armstrong, “EMC for Systems and Installations”, Newnes, First
Edition, 2000
[14] P.A. Chatterton, M.A. Houlden, “EMC, Electromagnetic theory to practical design”,
Wiley, First Edition, 1992
[15] J.J. Goedbloed, “Electromagnetic compatibility”, Prentice Hall, First English Lan-
guage Edition, 1992
[16] International Electrotechnical Commission, “Protection against lightning, Part 1:
General principles”, IEC 62305-1:2006, Jan 2006
[17] International Telecommunication Union, Standardization Sector, “Series K: Protec-
tion against interference, Risk assessment of damages to telecommunication sites due
to lightning discharges”, ITU-T Recommendation K.39, May 1996
[18] International Electrotechnical Commission, “Protection against lightning, Part 2:
Risk management”, IEC 62305-2:2006, Jan 2006
[19] International Electrotechnical Commission, “Protection against lightning, Part 4:
Electrical and electronic systems within structures”, IEC 62305-4:2006, Jan 2006
[20] Private communications during site visits with the following people: Arnold van
Ardenne, Albert-Jan Boonstra, Jan-Pieter de Reijer (Astron), Tim Iken, Andrew
Faulkner (Jodrell Bank Observatory), and Tony Brown (Manchester University)
[21] Y. Baba, M. Ishii “Numerical Electromagnetic field analysis of lightning current in
tall structures”, IEEE Transactions on Power Delivery, Vol. 16, No. 2, pp. 324 − 328,
Apr 2001
[22] V. Hedge, U. Kumar, “Studies on characteristics of lightning generated currents in
an interconnected lightning protection system”, Journal of Electrostatics, Vol. 67,
pp. 590 − 596, 2009
[23] M. Bandinelli, F. Bessi, S. Chiti, M. Infantino, R. Pomponi, “Numerical Model-
ing for LEMP effect evaluation inside a telecommunication exchange”, IEEE Trans.
Electromagn. Compat., Vol. 38, No. 3, pp. 265 − 273, Aug 1996
[24] M. Paolone, F. Rachidi, A Borghetti, C.A. Nucci, M. Rubinstein, V.A. Rakov, M.A.
Uman, “Lightning electromagnetic field coupling to overhead lines: theory, numerical
simulations and experimental validation”, IEEE Trans. Electromagn. Compat., Vol.
51, No. 3, pp. 532 − 547, Aug 2009

BIBLIOGRAPHY 101
[25] M. Ianoz, “Review of new developments in the modeling of lightning electromagnetic
effects”, IEEE Trans. Electromagn. Compat., Vol. 49, No. 2, pp. 224 − 236, May
2007
[26] A. Borghetti, J.A. Gutierrez, C.A. Nucci, M. Paolone, E. Petrache, F. Rachidi,
“Lightning-induced voltages on complex distribution systems: models, advanced
software tools and experimental verification”, Journal of Electrostatics, Vol. 60,
pp. 163 − 174, 2004
[27] A. Piantini, J.M. Janiszewski, “Lightning-induced voltages on overhead lines - appli-
cation of the extended Rusck model”, IEEE Trans. Electromagn. Compat., Vol. 51,
No. 3, pp. 548 − 558, Aug 2009
[28] A. Orlandi, C. Mazzetti, Z. Flisowski, M. Yarmarkin, “Systematic approach for the
analysis of the electromagnetic environment inside a building during lightning strike”,
IEEE Trans. Electromagn. Compat., Vol. 40, No. 4, pp. 521 − 535, Nov 1998
[29] V. Rakov, F. Rachidi, “Overview of recent progress in lightning research and lightning
protection”, IEEE Trans. Electromagn. Compat., Vol. 51, No. 3, pp. 428 − 442, Aug
2009
[30] D.B. Davidson, “Computational electromagnetics for RF and microwave engineer-
ing”, Cambridge University Press, First Edition, 2005
[31] Y. Baba, V.A. Rakov, “Electromagnetic models of the lightning return stroke”, Jour-
nal of Geophysical Research, Vol. 112, D04102, pp. 1 − 17, 2007
[32] Y. Baba, V.A. Rakov, “Electric and magnetic fields predicted by different electro-
magnetic models of the lightning return stroke versus measured fields”, IEEE Trans.
Electromagn. Compat., Vol. 51, No. 3, pp. 479 − 487, Aug 2009
[33] G. Maslowski, V.A. Rakov, “New insights into lightning return-stroke models with
specified longitudinal current distribution”, IEEE Trans. Electromagn. Compat., Vol.
51, No. 3, pp. 471 − 478, Aug 2009
[34] S.H.S. Moosavi, R. Mioni, S.H.H. Sadeghi, “Representation of a lightning return-
stroke channel as a nonlinearly loaded thin-wire antenna”, IEEE Trans. Electromagn.
Compat., Vol. 51, No. 3, pp. 488 − 498, Aug 2009
[35] F. Rachidi, “Modeling lightning return strokes to tall structures: a review”, Journal
of Lightning Research, Vol. 1, pp. 16 − 31, 2007

BIBLIOGRAPHY 102
[36] L. Grcev, F. Rachidi, V. Rakov, “Comparison of electromagnetic models of lightning
return strokes using current and voltage sources”, Proc. 12th Int. Conf. Atmospheric
Electricity, Versailles, 2003
[37] Y. Baba, V. Rakov, “On the interpretation of ground reflections observed in small-
scale experiments simulating lightning strikes to towers”, IEEE Trans. Electromagn.
Compat., Vol. 47, No. 3, pp. 533 − 542, Aug 2005
[38] K. Yamamoto, T. Noda, S. Yokoyama, A. Ametani, “An experimental study of light-
ning overvoltages in wind turbine generation systems using a reduced-size model”,
Electrical Engineering in Japan, Vol. 158, No. 4, pp. 65 − 72, 2007
[39] Y. Baba, V.A. Rakov, “Applications of electromagnetic models of the lightning re-
turn stroke”, IEEE Transactions on Power Delivery, Vol. 23, No. 2, pp. 800 − 811,
Apr 2008
[40] S. Evans, “Application of dimensional analysis in electromagnetic measurements”,
4110 Classical Electromagnetism Notes, University Engineering Department, Cam-
bridge
[41] V. Cooray, “Propagation effects due to finitely conducting ground on lightning-
generated magnetic fields evaluated using Sommerfeld’s integrals”, IEEE Trans. Elec-
tromagn. Compat., Vol. 51, No. 3, pp. 526 − 531, Aug 2009
[42] F. Rachidi, M. Rubinstein, J. Montanya, J. Bermudez, R.R. Sola, G. Sola, N.
Korovkin, “A review of current issues in lightning protection of new-generation
wind-turbine blades”, IEEE Transactions on Industrial Electronics, Vol. 55, No. 6,
pp. 2489 − 2496, June 2008
[43] A. Schaffar, J. Decibieux, L. Mureax, “Arianne 5 launcher lightning qualification
logic”, ESA Workshop on Aerospace EMC, Florence, Italy, Mar/Apr 2009
[44] E. Bachelier, F. Issac, S. Bertuol, J.P. Parmantier, J.C. Elliot, “Numerical EM sim-
ulation for the definition of the lightning protection systems of the future VEGA
and SOYUZ launching pads”, ESA Workshop on Aerospace EMC, Florence, Italy,
Mar/Apr 2009
[45] R.A. Dalke, C.L. Holloway, P. McKenna, M. Johansson, A.S. Ali, “Effects of rein-
forced concrete structures on RF communications”, IEEE Trans. Electromagn. Com-
pat., Vol. 42, No. 4, pp. 486 − 496, Nov 2000
[46] G. Ala, M.L. di Silvestre, “A simulation model for electromagnetic transients in
lightning protection systems”, IEEE Trans. Electromagn. Compat., Vol. 44, No. 4,
pp. 539 − 554, Nov 2002

BIBLIOGRAPHY 103
[47] A. Mimouni, F. Rachidi, Z. Azzouz, “Electromagnetic environment in the imme-
diate vicinity of a lightning return stroke”, Journal of Lightning Research, Vol. 2,
pp. 64 − 75, 2007
[48] L. Grcev, P.J. van Deursen, J.B.M. van Waes, “Lightning current distribution to
ground at a power line tower carrying a radio base station”, IEEE Trans. Electro-
magn. Compat., Vol. 47, No. 1, pp. 160 − 170, Feb 2005
[49] L. Grcev, “Modeling of underground electrodes under lightning conditions”, IEEE
Trans. Electromagn. Compat., Vol. 51, No. 3, pp. 559 − 571, Aug 2009
[50] L. Grcev, “Impulse efficiency of ground electrodes”, IEEE Transactions on Power
Delivery, Vol. 21, No. 1, pp. 441 − 451, Jan 2009
[51] H. Motoyama, “Experimental and analytical studies on lightning surge characteristics
of ground mesh”, Electrical Engineering in Japan, Vol. 160, No. 4, pp. 687 − 693,
2007
[52] H. Motoyama, “Electromagnetic transient response of buried bare wire and ground
grid”, IEEE Transactions on Power Delivery, Vol. 122, No. 3, pp. 1673 − 1679,
Jul 2007
[53] International Telecommunication Union, Standardization Sector, “Series K: Protec-
tion against interference, Bonding configurations and earthing inside a telecommu-
nication building”, ITU-T Recommendation K.27, May 1996
[54] R.G. Urban, “Review and design of a lightning protection system for XDM and KAT-
7 dishes”, Postdoctoral Report, Department Electrical and Electronic Engineering,
Stellenbosch University, December 2007
[55] R. Sumaraju, J. Trumpf, “Frequency, temperature and salinity variation of the per-
mittivity of seawater”, IEEE Transactions on antennas and propagation, Vol. 54,
No. 11, pp. 3441 − 3448, Nov 2006
[56] H.C. Reader, W de Villiers, P.G. Wiid, P.S. van der Merwe, R.T. Lord, “RFI investi-
gation of XDM”, National Research Foundation, Measurement Investigation Report,
NRF-KAT7-1.1-TR-001, Revision 1, 20 May 2008
[57] B. Keiser, “Principles of electromagnetic compatibility”, Artech House, Third Edi-
tion, 1987
[58] C.A. Balanis, “Antenna theory, analysis and design”, Wiley, Third Edition, 2005

BIBLIOGRAPHY 104
[59] P.C.T. van der Laan, “Electromagnetic fields in electrical engineering, understanding
basic concepts”, Shaker Publishing, 2005
[60] V. Amoruso, F. Lattarulo, “Lightning-originated tangential electric field across air-
soil interfaces”, IEEE Proc. Sci. Meas. Technol., Vol. 141, No. 1, pp. 65 − 70,
Jan 1994
[61] Y. Baba, V. Rakov, “On the mechanism of attenuation of current waves propagating
along a vertical perfectly conducting wire above ground: application to lightning”,
IEEE Trans. Electromagn. Compat., Vol. 47, No. 3, pp. 521 − 532, Aug 2005
[62] Y. Baba, V.A. Rakov, “Influences of the presence of a tall grounded strike object
and an upward connecting leader on lightning currents and electromagnetic fields”,
IEEE Trans. Electromagn. Compat., Vol. 49, No. 4, pp. 886 − 892, Nov 2007
[63] A.M.A. Baker, M.S. Alam, M. Tanrioven, H.B. Ahmad, “Electromagnetic compati-
bility analysis in buildings affected by lightning strike”, IEEE Trans. Electromagn.
Compat., Vol. 47, No. 3, pp. 197 − 204, Aug 2005
[64] J.L. Bermudez, F. Rachidi, W. Janischewskyj, V. Shostak, M. Rubinstein, D. Pa-
vanello, A.M. Hussein, J.S. Chang, M. Paolone, “Determination of lightning currents
from far electromagnetic fields: effect of a strike object”, Journal of Electrostatics,
Vol. 65, pp. 289 − 295, 2007
[65] S. Cristina, A. Orlandi, “Lightning channel’s influence on currents and electromag-
netic fields in a building struck by lightning”, IEEE, pp. 338 − 342, 1990
[66] H.J. Geldenhuys, “The effects of lightning in shallow coal mines − an engineering
study”, University of Witwatersrand, A thesis submitted to the Faculty of Engineer-
ing, University of Witwatersrand, in fulfilment of the requirements for the degree of
Doctor of Philosophy in Electrical Engineering, Johannesburg, Feb 1995
[67] N.W. Ebertsohn, R.H. Geschke, H.C. Reader, “Cable trays in EMC: measurement
and modeling to 30 MHz”, IEEE Trans. Electromagn. Compat., Vol. 49, No. 2,
pp. 346 − 353, May 2007
[68] C.A. Nucci, F. Rachidi, “Lightning-induced overvoltages”, IEEE Transmission and
Distribution Conference, Panel Session: Distribution Lightning Protection, New Or-
leans, April 1999
[69] R.K. Pokharel, M. Ishii, “Applications of time-domain numerical electromagnetic
code to lightning surge analysis”, IEEE Trans. Electromagn. Compat., Vol. 49, No. 3,
pp. 623 − 631, Aug 2007

BIBLIOGRAPHY 105
[70] K. R. Rand, “Lightning protection and grounding solutions for communication sites”,
Polyphaser Corporation, First Edition, Jan 2000
[71] M. Rubinstein, “An approximate formula for the calculation of the horizontal electric
field from lightning at close, intermediate and long range”, IEEE Trans. Electromagn.
Compat., Vol. 38, No. 3, pp. 531 − 535, Aug 1996
[72] T. Tominaga, N. Kuwabara, J. Kato, A. Ramli, A. Halim, H. Ahmad, “Characteris-
tics of lightning surges induced in telecommunication center in tropical area”, IEEE
Trans. Electromagn. Compat., Vol. 45, No. 1, pp. 82 − 91, Feb 2003
[73] J. Zou, J. Lee, Y. Ji, S. Chang, B. Zhang, J. He, “Transient simulation model for a
lightning protection system using the approach of a coupled transmission line net-
work”, IEEE Trans. Electromagn. Compat., Vol. 49, No. 3, pp. 614 − 622, Aug 2007
− And in the end it is not the years in your life that count, but the life in
your years −
− Abraham Lincoln −