Embed Size (px)
Citation preview

February 2010
DIMENSIONS OF ENERGY INSECURITY
FOR LOW INCOME HOUSEHOLDS
Final Report
LIHEAP SPECIAL STUDY OF THE 2005
RESIDENTIAL ENERGY CONSUMPTION SURVEY
This document has been prepared for the Office of Community Services' Division of Energy
Assistance by APPRISE Incorporated under contract #DE-AM01-04EI41006. The statements,
findings, conclusions, and recommendations are solely those of analysts from APPRISE and do not
necessarily reflect the views of HHS.
Prepared for the U.S. Department of Health and Human Services, Administration for Children and Families, Office of Community Services, Division of Energy Assistance
www.appriseinc.org Table of Contents
APPRISE Incorporated
Table of Contents
Executive Summary ................................................................................................................... i
Study Goals .................................................................................................................... i
Levels and Types of Energy Insecurity ........................................................................ ii
Factors Related to Energy Insecurity ........................................................................... vi
Performance of the Home Energy Insecurity Scale .................................................... xii
Study Implications .......................................................................................................xv
I. Introduction ............................................................................................................................1
A. Background ..............................................................................................................1
B. Study Goals ..............................................................................................................2
C. Organization of Report ............................................................................................2
II. Level and Types of Energy Insecurity ..................................................................................3
A. Space Heating Disruptions .......................................................................................3
B. Air Conditioning Disruptions ..................................................................................5
C. LIHEAP’s Role in Restoring Home Heating and Cooling ......................................7
D. Electric Service Disruptions ..................................................................................10
E. Financial Dimensions of Energy Insecurity ...........................................................10
F. Health and Safety Dimensions of Energy Insecurity .............................................12
G. Correlation Among Types of Energy Insecurity ....................................................13
H. Summary of Findings .............................................................................................16
III. Factors Related to Energy Insecurity .................................................................................17
A. Definition of Analysis Factors ...............................................................................17
B. Energy Insecurity by Geography ...........................................................................18
C. Energy Insecurity by Poverty Level and Income Group .......................................22
D. Energy Insecurity by Vulnerability Group and Income Type ...............................26
E. Energy Insecurity by Energy Burden .....................................................................32
F. Energy Insecurity by LIHEAP Recipiency ............................................................36
G. Multivariate Analysis .............................................................................................39
IV. Performance of the Home Energy Insecurity Scale ...........................................................42
www.appriseinc.org Table of Contents
APPRISE Incorporated
A. The 2005 RECS Home Energy Insecurity Scale ...................................................42
B. The Alternative Home Energy Insecurity Scale ....................................................49
V. Study Implications ..............................................................................................................57
A. Levels and Types of Energy Insecurity .................................................................57
B. Factors Related to Energy Insecurity .....................................................................58
C. Home Energy Insecurity Scale...............................................................................59
VI. Appendix............................................................................................................................61
A. 2005 RECS Section K: Energy Assistance Questions ..........................................61

www.appriseinc.org Executive Summary
APPRISE Incorporated Page i
Executive Summary
The 2005 Residential Energy Consumption Survey (RECS) is a national survey that collected
energy-related data for occupied housing units and households. The Office of Community
Services (OCS) in the Administration for Children and Families (ACF) of the U.S. Department
of Health and Human Services (HHS) funded a special set of questions for low income
households responding to the 2005 RECS. Those questions collected information on residential
and home energy-related problems faced by low income households and measured the extent to
which participation in LIHEAP helped to ameliorate those problems.1 The purpose of this report
is to present the findings from analyses of those questions.
Study Goals
In RECS surveys prior to 2005, survey questions on energy affordability issues were limited to
heating service disconnections and other electric service disconnections. However, low income
households can experience other problems as result of having high energy bills. For example, in
order to make their home energy bill affordable, a household might have to keep the home at a
temperature that is unhealthy, particularly for young children, disabled, or elderly individuals.
The 2005 RECS included a set of questions that documented the different types of energy
affordability problems that low income households face. The purpose of this study is use the
2005 RECS data to develop information on the Energy Insecurity2 of low income households,
including:
Levels and Types of Energy Insecurity – Estimation of the rate at which low income
households face various types of energy problems; examination of survey respondent
reports on the extent to which LIHEAP restores home heating and cooling for households
experiencing utility service or fuel delivery interruptions.
Factors Related to Energy Insecurity – An analysis of the factors associated with energy
problems including income, energy burden, geographic region and other demographic
and housing factors.
1 Unless otherwise indicated, “low income” refers to households with income at or below the Federal maximum
LIHEAP eligibility standard (i.e., the greater of 150 percent of HHS Poverty Guidelines or 60 percent of State
median income). 2 In the literature, Energy Insecurity is defined as the “lack of consistent access to enough of the kinds of energy
needed for a healthy and safe life in the geographic area where a household is located.” (Cook et al., A Brief
Indicator of Energy Security: Associations with Food Security, Child Health, and Child Development in US Infants
and Toddlers. Pediatrics; Oct 2008, 122; e867-e875.)
www.appriseinc.org Executive Summary
APPRISE Incorporated Page ii
Performance of the Home Energy Insecurity Scale – An assessment of the performance
of the Home Energy Insecurity Scale3 in measuring the impacts of energy costs on low
income households compared to other Energy Insecurity measures used in the past.
This exploratory study furnishes important information regarding the performance of LIHEAP,
as well as the types of information that should be collected to assess the energy needs of low
income households.
Levels and Types of Energy Insecurity
The most observable types of Energy Insecurity are the interruption of space heating services
during the heating season and the interruption of air conditioning services during the cooling
season. The 2005 RECS furnishes information on the estimated number of low income
households that reported heating or air conditioning interruptions in the twelve months prior to
the survey.
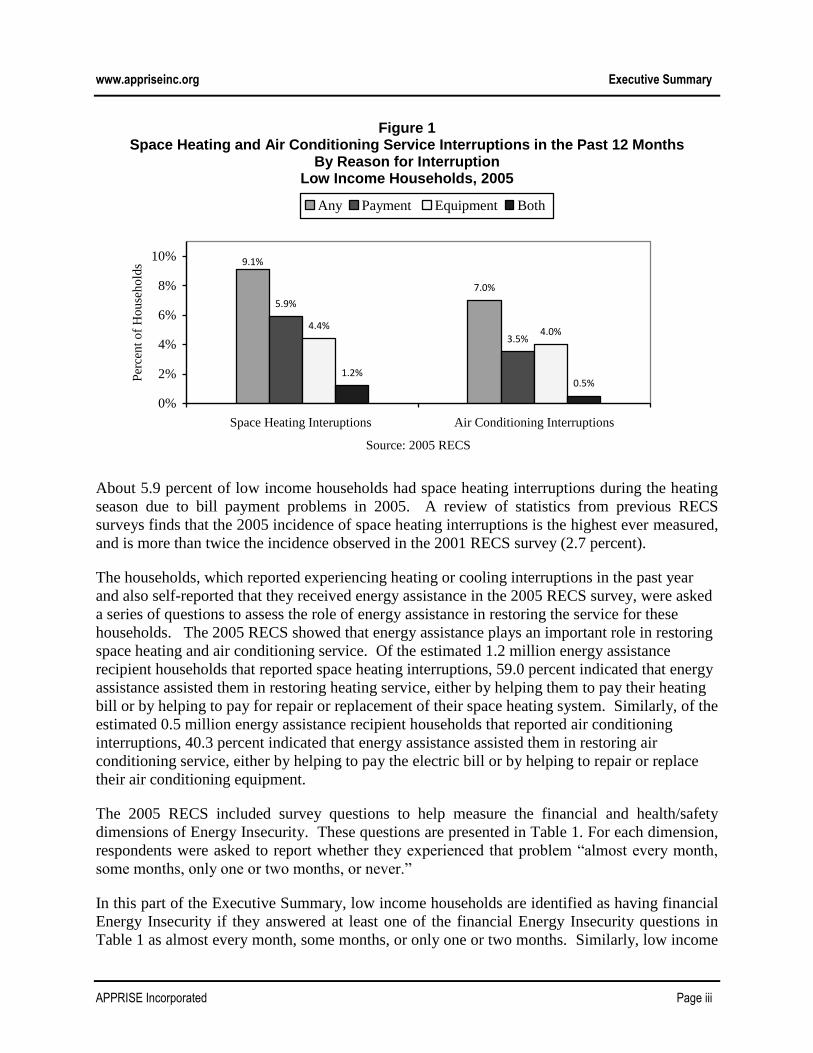
Figure 1 presents statistics on heating and air conditioning interruptions. Payment interruptions
refer to those caused by loss of service due to energy bill payment problems. Equipment
interruptions refer to those that occurred when heating or cooling equipment malfunctioned and
the household could not afford to pay for its repair or replacement. The figure shows that 9.1
percent of low income households had some type of space heating interruptions due to any
reasons; 5.9 percent had interruptions due to bill payment problems, 4.4 percent had interruptions
due to equipment problems, and 1.2 percent experienced both types of problems. The figure also
shows that 7.0 percent of low income households that cooled had some type of air conditioning
interruptions due to any reasons; 3.5 percent had interruptions due to bill payment problems, 4.0
percent had interruptions due to equipment problems, and 0.5 percent had both types of
interruptions. Overall, 11.6 percent of low income households experienced a space heating
interruption, an air conditioning interruption, or both types of problems.
3 Colton, R. (2003). Measuring the Outcomes of Low-Income Energy Assistance Programs through a Home Energy
Insecurity Scale. A Publication prepared for: LIHEAP Committee on Managing for Results. U.S. Department of
Health and Human Services. Administration for Children and Families. Office of Community Services, Division of
Energy Assistance.
www.appriseinc.org Executive Summary
APPRISE Incorporated Page iii
Figure 1 Space Heating and Air Conditioning Service Interruptions in the Past 12 Months
By Reason for Interruption Low Income Households, 2005
7.0%
5.9%
3.5%4.4%
4.0%
1.2%0.5%
9.1%
0%
2%
4%
6%
8%
10%
Space Heating Interuptions Air Conditioning Interruptions
Source: 2005 RECS
Per
cen
t o
f H
ou
seh
old
s
Any Payment Equipment Both
About 5.9 percent of low income households had space heating interruptions during the heating
season due to bill payment problems in 2005. A review of statistics from previous RECS
surveys finds that the 2005 incidence of space heating interruptions is the highest ever measured,
and is more than twice the incidence observed in the 2001 RECS survey (2.7 percent).
The households, which reported experiencing heating or cooling interruptions in the past year
and also self-reported that they received energy assistance in the 2005 RECS survey, were asked
a series of questions to assess the role of energy assistance in restoring the service for these
households. The 2005 RECS showed that energy assistance plays an important role in restoring
space heating and air conditioning service. Of the estimated 1.2 million energy assistance
recipient households that reported space heating interruptions, 59.0 percent indicated that energy
assistance assisted them in restoring heating service, either by helping them to pay their heating
bill or by helping to pay for repair or replacement of their space heating system. Similarly, of the
estimated 0.5 million energy assistance recipient households that reported air conditioning
interruptions, 40.3 percent indicated that energy assistance assisted them in restoring air
conditioning service, either by helping to pay the electric bill or by helping to repair or replace
their air conditioning equipment.
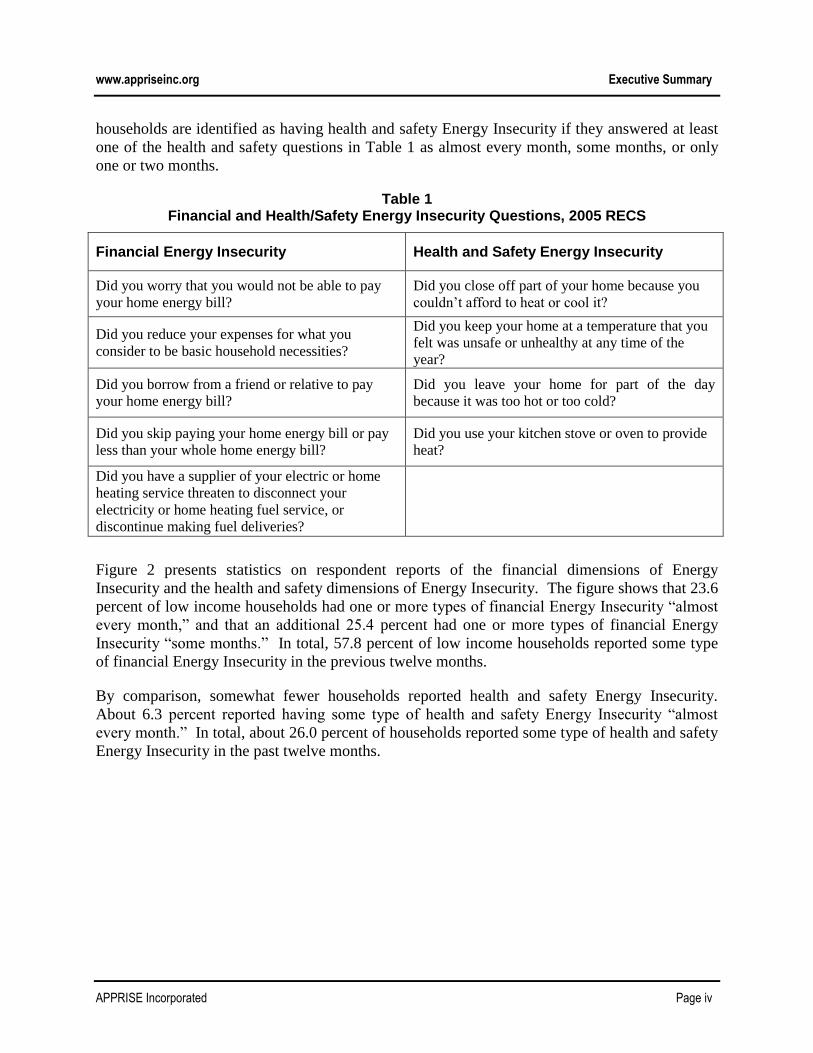
The 2005 RECS included survey questions to help measure the financial and health/safety
dimensions of Energy Insecurity. These questions are presented in Table 1. For each dimension,
respondents were asked to report whether they experienced that problem “almost every month,
some months, only one or two months, or never.”
In this part of the Executive Summary, low income households are identified as having financial
Energy Insecurity if they answered at least one of the financial Energy Insecurity questions in
Table 1 as almost every month, some months, or only one or two months. Similarly, low income
www.appriseinc.org Executive Summary
APPRISE Incorporated Page iv
households are identified as having health and safety Energy Insecurity if they answered at least
one of the health and safety questions in Table 1 as almost every month, some months, or only
one or two months.
Table 1 Financial and Health/Safety Energy Insecurity Questions, 2005 RECS
Financial Energy Insecurity Health and Safety Energy Insecurity
Did you worry that you would not be able to pay
your home energy bill?
Did you close off part of your home because you
couldn’t afford to heat or cool it?
Did you reduce your expenses for what you
consider to be basic household necessities?
Did you keep your home at a temperature that you
felt was unsafe or unhealthy at any time of the
year?
Did you borrow from a friend or relative to pay
your home energy bill?
Did you leave your home for part of the day
because it was too hot or too cold?
Did you skip paying your home energy bill or pay
less than your whole home energy bill?
Did you use your kitchen stove or oven to provide
heat?
Did you have a supplier of your electric or home
heating service threaten to disconnect your
electricity or home heating fuel service, or
discontinue making fuel deliveries?
Figure 2 presents statistics on respondent reports of the financial dimensions of Energy
Insecurity and the health and safety dimensions of Energy Insecurity. The figure shows that 23.6
percent of low income households had one or more types of financial Energy Insecurity “almost
every month,” and that an additional 25.4 percent had one or more types of financial Energy
Insecurity “some months.” In total, 57.8 percent of low income households reported some type
of financial Energy Insecurity in the previous twelve months.
By comparison, somewhat fewer households reported health and safety Energy Insecurity.
About 6.3 percent reported having some type of health and safety Energy Insecurity “almost
every month.” In total, about 26.0 percent of households reported some type of health and safety
Energy Insecurity in the past twelve months.

www.appriseinc.org Executive Summary
APPRISE Incorporated Page v
Figure 2 Financial and Health/Safety Energy Insecurity in the Past 12 Months
By Frequency of Energy Insecurity Low Income Households, 2005
6.3%
25.4%
12.4%8.9% 7.3%
42.2%
23.6%
74.0%
0%
20%
40%
60%
80%
Financial Energy Insecurity Health & Safety Energy Insecurity
Source: 2005 RECS
Per
cen
t o
f H
ou
seh
old
s
Almost Every Month Some Months One or Two Months Never
The analysis also shows that there is a relationship between the incidence of financial Energy
Insecurity and the other Energy Insecurity dimensions. Almost one-fourth of households that
reported experiencing financial Energy Insecurity “almost every month” also reported a space
heating interruption, while only 8 percent of those who reported financial Energy Insecurity in
“one or two months” had a space heating interruption. About one-half of households that
reported having financial Energy Insecurity “almost every month” also reported experiencing
some type of health and safety Energy Insecurity.
The analysis of the 2005 RECS Energy Insecurity data finds that the series of questions help to
better understand the energy affordability problems faced by low income households. The data
on different types of energy insecurity (heating disruptions, air conditioning disruptions,
financial energy insecurity, and health and safety energy insecurity) and the intensity measures
of energy insecurity (almost every month, some months, one or two months, or never) serve to
broaden the understanding of energy affordability problems. Key findings include:
Incidence – The data show that over two-thirds of low income households faced some
type of energy insecurity during 2005.
Overlap – Some households faced only one type of problem; but many others
experienced multiple problems during the year.
Intensity – The intensity of any dimension of energy insecurity was directly related to the
number of types of energy insecurity faced by a low income household.
www.appriseinc.org Executive Summary
APPRISE Incorporated Page vi
While it is still important to track the rate at which households experience heating system and/or
air conditioning service disruptions, these data demonstrate the broader relationships between
energy bills and impacts faced by low income households.
Factors Related to Energy Insecurity
The 2005 RECS facilitates the development of a better understanding of the geographic,
demographic, and programmatic dimensions of Energy Insecurity for low income households.
This study developed tabulations that show how Energy Insecurity varies by Census Region, by
income and poverty group, by income source and vulnerability group, and by level of energy
burden. The tabulations also illustrate how the experiences of LIHEAP recipient households
compare to income eligible nonrecipient households.
Geography
The RECS data show that low income households in the South and West Census regions
experienced higher rates of heating and air conditioning service interruptions than households in
the Northeast and Midwest. Similar patterns are observed for other types of Energy Insecurity:
Heating and Air Conditioning Interruptions – About 7.1 percent of low income
households in the Northeast and 8.8 percent of those in the Midwest had heating and/or
air conditioning interruptions during the past 12 months. In the South and West regions,
more than 14.1 percent of low income households experienced heating and/or air
conditioning interruptions.
Financial Energy Insecurity – Low income households in the Northeast are less likely
than those in other regions to report financial Energy Insecurity; about 39.0 percent of
low income households in the Northeast reported having to reduce expenses for
household necessities, compared to at least 49.5 percent in the other three regions.
Health and Safety Insecurity – There are also some differences by region in health and
safety measures. For example, about 5.7 percent of low income households in the
Northeast reported keeping their home at a temperature that they felt was unsafe
compared to 10.1 percent of low income households in the South. However, in general,
low income households in the Northeast reported lower rates of health and safety Energy
Insecurity than those in other regions.
Previous research has shown that restrictions on cold weather service terminations in the
Northeast and Midwest may be one important reason why low income households in those
regions are less likely to experience heating service interruptions than low income households in
the South and West. However, it is unclear why households in the Northeast region also have
lower rates of health and safety Energy Insecurity than households in other regions. One
possibility is that winter service termination restrictions allow clients to defer winter bills so that
they do not need to make health and safety trade-offs when it is cold. Another possibility is that

www.appriseinc.org Executive Summary
APPRISE Incorporated Page vii
non-LIHEAP fuel assistance programs may affect the differential rates of Energy Insecurity in
different regions.
Poverty Level
Figure 3 shows the incidence of service interruptions, financial Energy Insecurity, and health and
safety Energy Insecurity by poverty level. Households with income at or below the HHS
Poverty Guidelines have higher rates for all types of Energy Insecurity than other types of low
income households.
Figure 3 Service Interruptions, Financial Energy Insecurity, and
Health and Safety Energy Insecurity in the Past 12 Months By Poverty Level
Low Income Households, 2005
14.5%
32.8%
10.0%
54.7%
22.0%
8.3%
19.0%
64.9%
49.0%
0%
20%
40%
60%
80%
Heating/Cooling Interuptions Financial Energy Insecurity Health and Safety Energy
Insecurity
Source: 2005 RECS
Per
cent of
House
hold
s
≤100% of poverty >100%-150% of poverty >150% of poverty
These data show that poverty level is one important dimension of Energy Insecurity. However,
they also show that some households with income at or below the HHS Poverty Guidelines do
not experience Energy Insecurity while many households with higher income do experience
Energy Insecurity. Since LIHEAP’s funding level does not allow it to serve all low income
households, it may be appropriate to target households that are experiencing higher levels of
Energy Insecurity.
Vulnerability Group
Elderly individuals and young children are more vulnerable to the health implications from
inadequate heating or cooling.4 Figure 4 shows the incidence of service interruptions, financial
Energy Insecurity, and health and safety Energy Insecurity by vulnerability group. It is restricted
4 Note that the LIHEAP statute also considers disabled individuals to be vulnerable. However, the 2005 RECS did
not collect information on disability.

www.appriseinc.org Executive Summary
APPRISE Incorporated Page viii
to households with income at or below the HHS Poverty Guidelines to eliminate any income
dimension from the analysis. The figure shows that elderly households are less likely to have
service interruptions than young child households and other types of households, and are slightly
less likely to have financial Energy Insecurity. However, elderly households have higher rates of
health and safety Energy Insecurity than the other household groups.
Figure 4 Service Interruptions, Financial Energy Insecurity, and
Health and Safety Energy Insecurity in the Past 12 Months By Vulnerability Group
Households with Income at or below HHS Poverty Guidelines, 2005
10.5%
45.4%
35.7%
14.3%
26.7%
18.0%
68.1%
33.7%
74.4%
0%
10%
20%
30%
40%
50%
60%
70%
80%
Heating/Cooling Interuptions Financial Energy Insecurity Health and Safety Energy
Insecurity
Source: 2005 RECS
Pe
rce
nt
of
Ho
use
ho
lds
Elderly Young Child Other
Previous research has shown that elderly households are more likely to pay their energy bills and
are less likely to lose energy service than other types of households. This research confirms that
finding. Moreover, this research further finds that low income elderly households are no more
likely than other types of low income households to report that they have to reduce expenses for
basic necessities to pay their energy bills. However, it does find that low income elderly
households are more likely to keep their home at a temperature that they feel is unsafe because of
the cost of energy. Further research on these findings might reveal whether these findings relate
to differences in behavior, differences in financial resources, or differences in reporting by
different groups of households.
Energy Burden
There are two types of energy burden examined in the study: residential energy burden, which is
the percent of household income spent on all residential energy bills, and home energy burden,
which is the percent of household income spent on space heating and cooling. Figure 5 shows the
incidence of service interruptions, financial Energy Insecurity, and health and safety Energy
Insecurity by residential energy burden level and Figure 6 shows those statistics by home energy

www.appriseinc.org Executive Summary
APPRISE Incorporated Page ix
burden level.5 Figure 5 shows that higher residential energy burden is associated with higher
levels of all types of Energy Insecurity. However, Figure 6 shows that home energy burden is
not associated with Energy Insecurity.
Figure 5 Service Interruptions, Financial Energy Insecurity, and
Health and Safety Energy Insecurity in the Past 12 Months By Residential Energy Burden Level
Low Income Households, 2005
14.2%
30.9%
10.7%
59.6%
26.5%
9.5%
51.1%
19.9%
62.1%
0%
20%
40%
60%
80%
Heating/Cooling Interuptions Financial Energy Insecurity Health and Safety Energy
Insecurity
Source: 2005 RECS
Pe
rce
nt o
f H
ou
se
ho
lds
High Burden Moderate Burden Low Burden
5 This study defines high energy burden as the “energy share” of severe housing (shelter) burden. Severe housing
burden is considered by some researchers to be 50% of income. (See Cushing N. Dolbeare. 2001. “Housing
Affordability: Challenge and Context.” Cityscape: A Journal of Policy Development and Research, (5)2:111-130. A
Publication of the U.S. Department of Housing and Urban Development, Office of Policy Development and
Research.) The median total residential energy costs for households at or below 150 percent of the HHS’ Poverty
Guidelines are 21.8 percent of housing costs. This study defines a residential energy burden of 10.9 percent of
income as a high burden, moderate energy burden as costs at or above 6.5 percent of income but less than 10.9
percent of income, and low energy burden as costs less than 6.5 percent of income. Heating and cooling
expenditures comprise 39.3 percent of total residential energy expenditures for all households. Therefore, high
home energy burden is defined for purposes of this study as heating and cooling costs that exceed 4.3 percent of
income. Moderate home energy burden is defined as heating and cooling costs above 2.6 percent of income but less
than 4.3 percent of income.
www.appriseinc.org Executive Summary
APPRISE Incorporated Page x
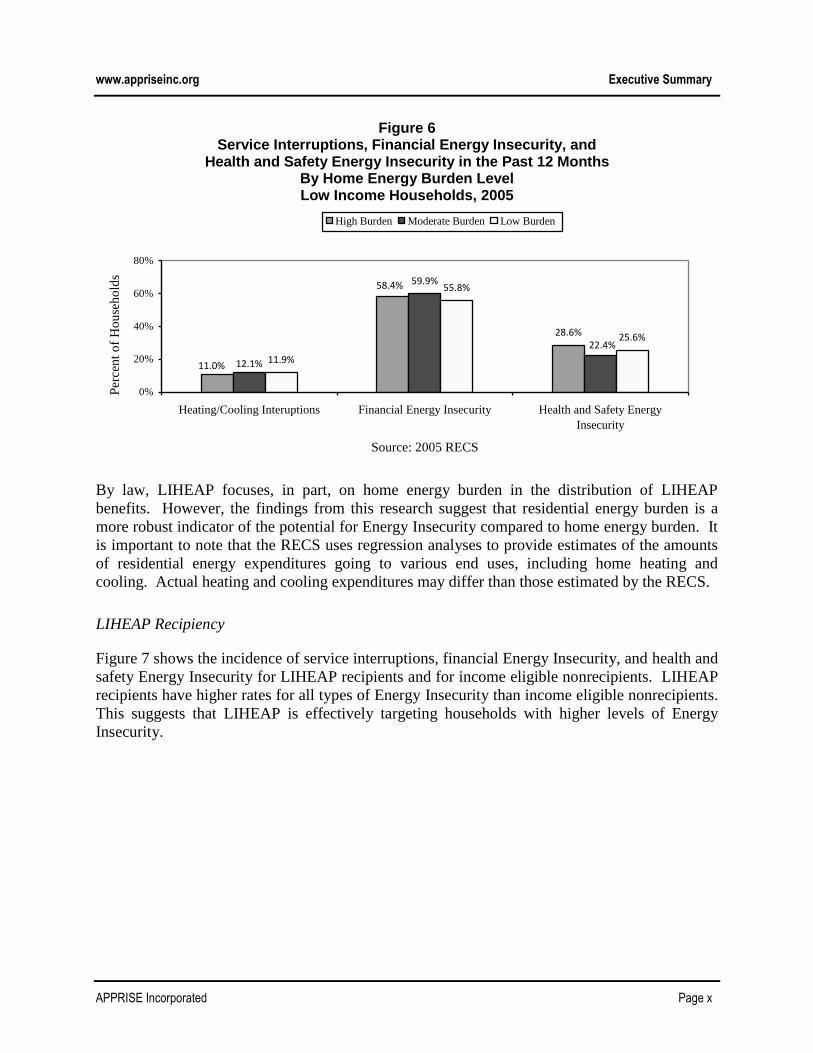
Figure 6 Service Interruptions, Financial Energy Insecurity, and
Health and Safety Energy Insecurity in the Past 12 Months By Home Energy Burden Level Low Income Households, 2005
28.6%
59.9%
11.9%
55.8%
25.6%
58.4%
11.0%
22.4%
12.1%
0%
20%
40%
60%
80%
Heating/Cooling Interuptions Financial Energy Insecurity Health and Safety Energy
Insecurity
Source: 2005 RECS
Per
cen
t o
f H
ou
seh
old
s
High Burden Moderate Burden Low Burden
By law, LIHEAP focuses, in part, on home energy burden in the distribution of LIHEAP
benefits. However, the findings from this research suggest that residential energy burden is a
more robust indicator of the potential for Energy Insecurity compared to home energy burden. It
is important to note that the RECS uses regression analyses to provide estimates of the amounts
of residential energy expenditures going to various end uses, including home heating and
cooling. Actual heating and cooling expenditures may differ than those estimated by the RECS.
LIHEAP Recipiency
Figure 7 shows the incidence of service interruptions, financial Energy Insecurity, and health and
safety Energy Insecurity for LIHEAP recipients and for income eligible nonrecipients. LIHEAP
recipients have higher rates for all types of Energy Insecurity than income eligible nonrecipients.
This suggests that LIHEAP is effectively targeting households with higher levels of Energy
Insecurity.

www.appriseinc.org Executive Summary
APPRISE Incorporated Page xi
Figure 7 Service Interruptions, Financial Energy Insecurity, and
Health and Safety Energy Insecurity in the Past 12 Months By LIHEAP Recipient Group
Low Income Households, 2005
15.7%
79.3%
41.7%
11.3%
56.3%
24.9%
0%
20%
40%
60%
80%
100%
Heating/Cooling Interuptions Financial Energy Insecurity Health and Safety Energy
Insecurity
Source: 2005 RECS
Per
cen
t o
f H
ou
seh
old
s
LIHEAP Recipients LIHEAP Nonrecipients
Figure 7 also shows that some LIHEAP recipients do not experience Energy Insecurity. One
important research question that cannot be answered with the existing RECS survey data is
whether recipient households do not experience Energy Insecurity because they received
LIHEAP benefits or if they would not experience Energy Insecurity even if they did not receive
LIHEAP.
Multivariate Analysis
Data tabulations from the 2005 RECS show the geographic, demographic, and programmatic
dimensions of Energy Insecurity. However, a multivariate analysis of the data is needed to see
how all these factors simultaneously affect the Energy Insecurity of low income households and
to assess which are the most important factors associated with levels of Energy Insecurity. Some
key findings from the multivariate analysis included:
Census Region – The multivariate analysis confirmed that households in the South and
West were more likely to have service interruptions than households in the other regions
and households in the Northeast had the lowest rate of health and safety Energy
Insecurity. However, the multivariate analysis found that lower rates of financial Energy
Insecurity in the Northeast are related to other factors and that households in all regions
experience financial Energy Insecurity at about the same level.
Residential Energy Burden – The multivariate analysis confirmed the findings that both
poverty level and residential energy burden are associated with all types of Energy
Insecurity. Furthermore, the analysis also showed that residential energy burden has the
strongest relationship with Energy Insecurity.
www.appriseinc.org Executive Summary
APPRISE Incorporated Page xii
Most findings from the multivariate analyses were consistent with the findings from the tabular
analyses of the data. Therefore, the reader can rely on the results from the tabular analyses.
Multivariate analysis indicated that high residential energy burden is the strongest factor related
to Energy Insecurity of low income households compared to other factors included in the
analysis.
Performance of the Home Energy Insecurity Scale
Colton originally developed the Home Energy Insecurity Scale in 2003 for OCS as a tool to
describe the home energy status of LIHEAP income-eligible households. The Scale combines
information obtained from various Energy Insecurity questions into a single measure that can
characterize the energy needs of low income households. Based on responses to these questions,
households are categorized in one of the five thresholds:
“A thriving household is one that has achieved generally accepted standards of well-
being. A thriving household can engage in the full range of home energy uses of its
choice without outside assistance and without financial strain.
A capable household is secure, even though not having achieved the full range of
generally accepted standards of well-being.
A stable household does not face significant threats and is unlikely to be in immediate
crisis. A stable household may on infrequent occasion need to engage in temporary or
inappropriate actions because it lacks money to pay its home energy bills, but it does not
do so regularly.
A vulnerable household is one that is not in immediate danger, but that may avoid this
danger only through temporary or inappropriate solutions. A vulnerable household may
occasionally face energy choices that require it to compromise not merely on comfort
and/or convenience, but on basic household energy needs such as heating and/or hot
water.
An in-crisis household faces immediate needs that threaten the household’s physical
and/or emotional safety. Three alternative conditions exist of which anyone might place
someone in the “in-crisis” threshold: (1) the household goes without energy; or (2) the
household has energy, but has to routinely compromise on its energy use for basic
household necessities; or (3) the household does not compromise on its energy use, but in
order to maintain that energy use, must compromise on non-energy basic necessities.”
The Home Energy Insecurity Scale was initially developed as a tool for caseworkers to measure
the impact of energy assistance programs on the home Energy Insecurity of low income
households. APPRISE subsequently collaborated with Colton and developed a modified set of
questions. The modified instrument could be used by interviewers, and allows a systematic and
automated assessment of Energy Insecurity based on survey responses.

www.appriseinc.org Executive Summary
APPRISE Incorporated Page xiii
Most of the previous research using the Home Energy Insecurity Scale was focused on LIHEAP
recipients or was collected for a set of households in a particular geographic area. The 2005
RECS furnishes the first national data on Energy Insecurity for all low income households.
Figure 8 shows the level of Energy Insecurity using the initial categorization methodology. It
can be seen that the original scale assigns almost all households to three categories – Thriving,
Vulnerable, and In-Crisis. After reviewing the categorization methodology, an alternative
assignment procedure was tested to assess whether minor revisions to the categorization
procedures would change the distribution of households. In fact, the changes resulted in a
significant redistribution. This suggests that more research needs to be done on assignment to
the scale.
Figure 8 Home Energy Insecurity, Original Scale
Low Income Households, 2005
39.6%
3.2% 3.6%
28.0%25.6%
0%
5%
10%
15%
20%
25%
30%
35%
40%
45%
Thriving Capable Stable Vulnerable In-Crisis
Source: 2005 RECS
Per
cen
t o
f H
ou
seh
old
s
Figure 9 presents Home Energy Insecurity on the revised scale. The modified scale shows that
about 40 percent of low income households are thriving (i.e., report no Energy Insecurity
problems), while about one-fourth are vulnerable or in-crisis, indicating that they needed
immediate action during the year to resolve Energy Insecurity problems.

www.appriseinc.org Executive Summary
APPRISE Incorporated Page xiv
Figure 9 Home Energy Insecurity, Modified Scale
Low Income Households, 2005
38.5%
18.2% 17.0%
12.5% 13.9%
0%
5%
10%
15%
20%
25%
30%
35%
40%
45%
Thriving Capable Stable Vulnerable In-Crisis
Source: 2005 RECS
Per
cen
t o
f H
ou
seh
old
s
The modified Home Energy Insecurity Scale furnishes useful summary information about the
factors related to Energy Insecurity.
Geographic Distribution – While households in the South and West are most likely to be
categorized as vulnerable or in-crisis, a substantial percentage of low income households
in all regions are at risk.
Poverty Level – About one-third of households with income below poverty are vulnerable
or in-crisis, compared to about one-fifth of households with income above 150 percent of
the poverty level.
Vulnerability Group – About 40 percent of elderly households with incomes below
poverty are categorized as thriving, compared to about one-fourth of households with
young children and other households.
Residential Energy Burden – About one-third of households with high residential energy
burden are vulnerable or in-crisis, compared to one-fourth of moderate burden
households, and one-fifth of low-burden households.
LIHEAP Recipients – Almost one-half of LIHEAP recipients were vulnerable or in-crisis,
compared to one-fourth of nonrecipients.
The modified Home Energy Insecurity Scale appears to be a useful way to assess the need for
energy assistance for low income households. It shows that certain groups of households are
more likely to be at greater risk for having energy problems, but it also shows that low income
households of all types report Energy Insecurity. It may be appropriate to use the Home Energy
Insecurity Scale as a performance measure to assess the rate at which LIHEAP is reaching those
with the greatest need for energy assistance. Furthermore, when measuring Energy Insecurity
www.appriseinc.org Executive Summary
APPRISE Incorporated Page xv
for LIHEAP recipient households, it is important to focus on whether Energy Insecurity is
measured before or after receiving LIHEAP assistance so that the change in Energy Insecurity
can be assessed.
Study Implications
The 2005 RECS included a set of questions that documented the different types of energy
affordability problems that low income households face. The study finds that the Energy
Insecurity questions administered in the 2005 RECS offer a much more comprehensive
understanding of the energy problems faced by low income households than did the more limited
set of questions included in prior RECS surveys. The analysis suggests that the questions added
to the 2005 RECS represent an important contribution to document and understand the energy
needs of low income households.
The study finds that there are certain factors that are associated with Energy Insecurity. These
findings suggest that States may be able to increase the effectiveness of LIHEAP by considering
these factors when they target households for LIHEAP outreach and when they set LIHEAP
benefit levels. Relevant findings from the analysis include:
Poverty Level – The analysis shows that poverty level, rather than income level, is
associated with all types of Energy Insecurity.
Energy Burden – Residential energy burden is associated with Energy Insecurity
while home energy burden is very weakly associated; States might be able to
increase the effectiveness of their LIHEAP programs by using actual residential
energy bills to help set benefit levels.
Vulnerable Groups – It is important for States to consider all types of Energy
Insecurity in setting benefits. While low income elderly households have lower rates
of service interruptions and financial Energy Insecurity, they report similar rates of
health and safety Energy Insecurity as non-elderly low income households.
The 2005 RECS furnishes the first opportunity to estimate Energy Insecurity for all low
income households. This study furnishes the following three important findings with respect
to the Home Energy Insecurity Scale and its uses:
1. LIHEAP Targeting – The Home Energy Insecurity Scale makes it easier for LIHEAP
program managers to see what groups of households are at greatest risk for problems
resulting from energy affordability.
2. Performance Measurement – It is clear that some low income households have a
higher level of Energy Insecurity than others. It may be appropriate to use the
reduction in Energy Insecurity as a performance measure for LIHEAP.
3. Study and Analysis – It is important to measure how the different levels of Home
Energy Insecurity relate to the long term health and well-being of low income

www.appriseinc.org Executive Summary
APPRISE Incorporated Page xvi
households. For that reason, it would be appropriate to continue to study the Home
Energy Insecurity Scale and its policy implications.
www.appriseinc.org Introduction
APPRISE Incorporated Page 1
I. Introduction
The 2005 Residential Energy Consumption Survey (RECS) is a national survey that collected
energy-related data for occupied housing units and households. The Office of Community
Services (OCS) in the Administration for Children and Families (ACF) of the U.S. Department
of Health and Human Services (HHS) funded a special set of questions for low income
households responding to the 2005 RECS. Those questions collected information on residential
and home energy-related problems faced by low income households and measured the extent to
which participation in LIHEAP helped to ameliorate those problems.6 The purpose of this report
is to present the findings from analyses of those questions.
A. Background
The RECS is a household energy survey that was first conducted in 1978 and has been
periodically conducted since that time. (The two most recent surveys conducted in 2001 and
2005). The RECS collects information from households on the energy using characteristics
of their housing units and their household. In addition, the survey obtains energy
consumption and expenditure data directly from energy suppliers. The RECS furnishes a
rich database of energy-related information on households and housing units.7
For most of the RECS surveys, HHS provided funding to improve the information available
on low income home energy issues, including supplemental samples of low income
households and LIHEAP-recipient households to increase the precision of survey estimates,
and special questions related to LIHEAP recipiency and the energy-related problems faced
by low income households. For the 2005 RECS, HHS funding was used to oversample
LIHEAP recipient households, obtain administrative data on LIHEAP recipiency and
benefits for survey respondents, and administer a set of questions on energy-related
problems. The LIHEAP oversample increased the number of LIHEAP recipient households
in the RECS sample from about 200 interviews to 434 interviews. The collection of
LIHEAP administrative data furnished higher quality information on LIHEAP recipiency
and benefits than the respondent self-reports from previous RECS surveys.8 The 2005
RECS also included a battery of questions related to home energy problems faced by low
income households.
6 Unless otherwise indicated, “low income” refers to households with income at or below the Federal maximum
LIHEAP eligibility standard (i.e., the greater of 150 percent of HHS Poverty Guidelines and 60 percent of State
median income). 7 Information on RECS can be accessed at the EIA website at http://www.eia.doe.gov/emeu/recs/.
8 The problem with respondent self-reports is that respondents may confuse LIHEAP with other energy assistance
programs in the State and may not remember the exact amount of the LIHEAP benefit they received. Finally,
respondents generally underreport participation in public assistance programs on surveys.
www.appriseinc.org Introduction
APPRISE Incorporated Page 2
B. Study Goals
The purpose of this study is to use the 2005 RECS data to develop information on the
Energy Insecurity of low income households, including:
Levels and Types of Energy Insecurity – Estimation of the rate at which low income
households face various types of energy problems and examination of survey respondent
reports on the extent to which LIHEAP restores home heating and cooling for households
experiencing service interruptions.
Factors Related to Energy Insecurity – An analysis of the factors associated with energy
problems including income, energy burden, geographic region and other demographic
and housing factors.
Performance of the Home Energy Insecurity Scale – An assessment of the performance
of the Home Energy Insecurity Scale in measuring the impacts of energy costs on low
income households compared to other Energy Insecurity measures used in the past.
This study furnishes important information to OCS regarding the performance of LIHEAP,
as well as the types of information that OCS should collect to assess the energy needs of low
income households.
C. Organization of Report
Four sections follow this introduction.
Section II – Levels and Types of Energy Insecurity
Section III – Factors Related to Energy Insecurity
Section IV – Performance of the Home Energy Insecurity Scale
Section V – Study Implications
APPRISE prepared this report for the Office of Community Services’ Division of Energy
Assistance under contract with the Energy Information Administration (Contract #DE-
AM01-04EI4006, Task #DE-DT0000095). The statements, findings, conclusions, and
recommendations are solely those of analysts from APPRISE and do not necessarily reflect
the views of EIA or HHS.
www.appriseinc.org Level and Types of Energy Insecurity
APPRISE Incorporated Page 3
II. Level and Types of Energy Insecurity
In RECS surveys prior to 2005, survey questions on energy affordability issues were limited to
heating service disconnections and electric service disconnections. However, low income
households can experience other problems as result of having high energy bills. For example, in
order to make their home energy bill affordable, a household might have to keep their home at a
temperature that is unhealthy, particularly for young children or elderly individuals. The 2005
RECS included a set of questions that documented the different types of energy affordability
problems that low income households face. This section of the report presents information on
the level and types of energy affordability problems.
A. Space Heating Disruptions
One problem that some low income households face when they are unable to pay their
energy bills is that they go without energy service and are unable to heat their homes with
their main heating equipment when heat is needed. Questions on space heating disruptions
have been asked on RECS surveys since 1982. While the format of the questions has
changed somewhat over time, there is a consistent series of information on heating service
disruptions from 1982 through 2005.
In the 2005 RECS, the following space heating disruption questions were asked.
K-2: Was there ever a time during the last 12 months when you wanted to use your main
source of heat, but could not, for one or more of the following reasons:
K3a: Your heating system was broken and you were unable to pay for its repair
or replacement?
K3b: You ran out of fuel oil, kerosene, propane (bottled gas), coal, or wood
because you were unable to pay for a delivery?
K3c: The utility company discontinued your electric service because you were
unable to pay your bill?
K3d: The utility company discontinued your gas service because you were unable
to pay your bill?
One important element of these questions is that they refer to the household’s main sources
of heat. For example, if a household’s main source of heat is a gas warm air furnace, they
might be unable to use that furnace because it was broken, because the gas company
disconnected their service for nonpayment, or because the electric company disconnected
service for nonpayment and electricity was needed to run the gas furnace.
Disruption of a household’s main source of heat does not necessarily mean that the
household is completely without heat. Some heat interruptions are relatively short. For

www.appriseinc.org Level and Types of Energy Insecurity
APPRISE Incorporated Page 4
example, data from the 2001 RECS show 4.3 percent of heat interruptions (question K-3d)
were less than two hours. In addition, data from the 2001 RECS show that during 35
percent of heat interruptions, low income households were able to heat their home in some
other way. However, a space heating disruption does imply that the household is having
significant energy affordability problems.
On the other hand, a household may have other energy affordability problems even though
the household does not have a space heating disruption. In many jurisdictions, utility
companies are prohibited from disconnecting energy service during the winter heating
season (typically from November 1 to April 1). In these jurisdictions, utility service
disconnections do not necessarily result in space heating disruptions during heating season.
Table II-1 presents data from the 2005 RECS on space heating disruptions for low income
households. For each type of space heating disruption, the table shows the number of low
income households that experienced that type of disruption, the percent of low income
households where reason is applicable9 that experienced that disruption, and the percent of
all low income households that experienced that disruption. Table II-1 shows that 0.3
million low income households that had a space heating disruption due to being “unable to
pay for bulk fuel delivery” out of about 5.7 million low income households that used a bulk
fuel as their main heating fuel, representing 5.3 percent of these households. Table II-1 also
shows that such interruptions affected 0.8 percent of the entire population of low income
households.
Table II-1 Inability to Use the Main Source of Heat in the Past 12 Months
Low Income Households, 2005
Reason for Space Heating
Disruption
Number of Low Income
Households
Percent of Low Income
Households Where
Reason Applicable
Percent of All Low
Income Households
Unable to pay for the repair
of broken heating system 1,581,233 4.5% 4.4%
Unable to pay for bulk fuel
delivery 300,284 5.3% 0.8%
Unable to pay for electric
service 1,671,636 4.7% 4.7%
Unable to pay for gas
service 621,956 3.8% 1.7%
Disruption due to any
reason 3,265,563 9.2% 9.1%
Source: 2005 RECS
Table II-1 shows that between 3.8 percent and 5.3 percent of all main heating fuel groups
(electric, gas, and bulk fuels) were unable to use their main source of heat because they were
9 For example, the reason “unable to pay for bulk fuel delivery” is only applicable to those households that have a heating
system and heat their home with bulk fuel.
www.appriseinc.org Level and Types of Energy Insecurity
APPRISE Incorporated Page 5
unable to pay for energy service at some time during the winter of 2004-2005. In addition,
about 4.5 percent of low income households had a broken main heating system during that
winter. In total, over 9 percent of low income households had a space heating disruption.
Some households use natural gas or a bulk fuel as their main source of heat, but are unable
to use their heating equipment because they have lost their electric service. The 2005 RECS
shows that about 300,000 households that heat with natural gas or a bulk fuel were unable to
use their main source of heat because they lost their electric service. This is about 12 percent
of the main heat disruptions for gas and bulk fuel main heaters.
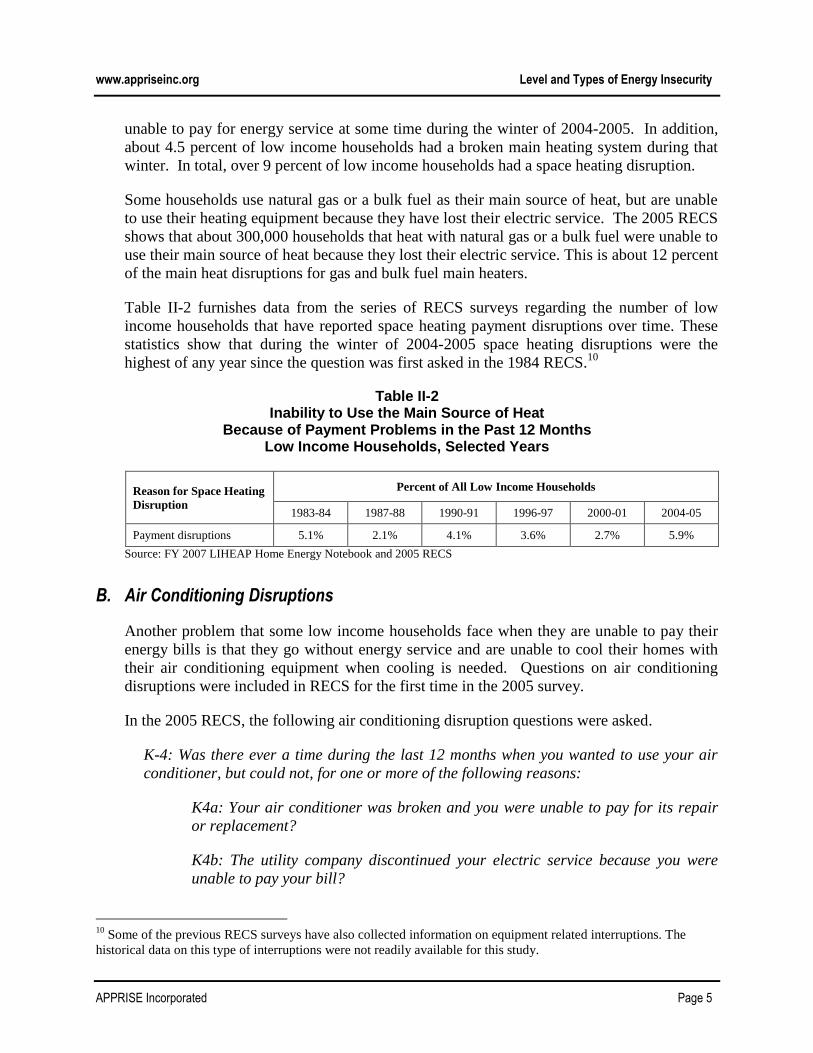
Table II-2 furnishes data from the series of RECS surveys regarding the number of low
income households that have reported space heating payment disruptions over time. These
statistics show that during the winter of 2004-2005 space heating disruptions were the
highest of any year since the question was first asked in the 1984 RECS.10
Table II-2 Inability to Use the Main Source of Heat
Because of Payment Problems in the Past 12 Months Low Income Households, Selected Years
Reason for Space Heating
Disruption
Percent of All Low Income Households
1983-84 1987-88 1990-91 1996-97 2000-01 2004-05
Payment disruptions 5.1% 2.1% 4.1% 3.6% 2.7% 5.9%
Source: FY 2007 LIHEAP Home Energy Notebook and 2005 RECS
B. Air Conditioning Disruptions
Another problem that some low income households face when they are unable to pay their
energy bills is that they go without energy service and are unable to cool their homes with
their air conditioning equipment when cooling is needed. Questions on air conditioning
disruptions were included in RECS for the first time in the 2005 survey.
In the 2005 RECS, the following air conditioning disruption questions were asked.
K-4: Was there ever a time during the last 12 months when you wanted to use your air
conditioner, but could not, for one or more of the following reasons:
K4a: Your air conditioner was broken and you were unable to pay for its repair
or replacement?
K4b: The utility company discontinued your electric service because you were
unable to pay your bill?
10
Some of the previous RECS surveys have also collected information on equipment related interruptions. The
historical data on this type of interruptions were not readily available for this study.

www.appriseinc.org Level and Types of Energy Insecurity
APPRISE Incorporated Page 6
One important element of these questions is that they refer to the household’s air
conditioning equipment. Disruption of a household’s air conditioning equipment does not
necessarily mean that the household is completely without the ability to keep their home
cool. Households can keep their home cooler than the outside temperature by using active
cooling strategies at night when it is cool outside (e.g., using window fans) and by using
passive cooling strategies during the day (i.e., closing shades on the south and west sides of
the homes) However, an air conditioning disruption does imply that the household is having
significant energy affordability problems.
Table II-3 presents data from the 2005 RECS on air conditioning disruptions for low income
households. For each type of air condition disruption, the table shows the number of low
income households that experienced that type of disruption, the percent of eligible
households that experienced that disruption, and the percent of all low income households
that experienced that disruption. The percent reason applicable to experience a particular
type of disruption is based on the number of households that have air conditioning. Table II-
3 shows that 2.5 million low income households had that disruption out of 28.7 million low
income households that have air conditioning equipment, representing 8.7 percent of the
these households. Table II-3 also shows that such interruptions affected 7.0 percent of the
entire population of low income households.
Table II-3 Inability to Use Air Conditioning in the Past 12 Months
Low Income Households, 2005
Reason for Air
Conditioning Disruption
Number of Low Income
Households
Percent of Low Income
Households Where
Reason Applicable
Percent of All Low
Income Households
Unable to pay for the repair
of broken heating system 1,427,509 4.9% 4.0%
Unable to pay for electric
service 1,240,278 4.3% 3.5%
Disruption due to any
reason 2,507,547 8.7% 7.0%
Source: 2005 RECS
Air conditioning disruptions were evenly split between equipment disruptions and electric
service disruptions. This indicates that households need both space cooling energy
assistance and assistance with cooling equipment repairs.
www.appriseinc.org Level and Types of Energy Insecurity
APPRISE Incorporated Page 7
C. LIHEAP’s Role in Restoring Home Heating and Cooling11
The 2005 RECS included some questions on LIHEAP’s role in restoring energy service for
households experiencing heating or cooling disruptions. The households that experienced
heating or cooling interruptions in the past year and reported on the survey that they
received energy assistance were asked the following questions to assess LIHEAP’s role in
restoring the service for the households receiving LIHEAP.
K-3: Was there ever a time during the past 12 months when you wanted to use your main
source of heat, but could not, for one or more of the following reasons:
K-3a: Your heating system was broken and you were unable to pay for its repair or
replacement?
K-3a1: Did receiving energy assistance help you to restore heating of your
home?
K-3b: You ran out of fuel oil, kerosene, propane (bottled gas), coal, or wood because
you were unable to pay for a delivery?
K-3b1: Did receiving energy assistance help you to restore heating of your
home?
K-3c: The utility company discontinued your electric service because you were
unable to pay your bill?
K-3c1: Did receiving energy assistance help you to restore heating of your
home?
K-3d: The utility company discontinued your gas service because you were unable to
pay your bill?
K-3d1: Did receiving energy assistance help you to restore heating of your
home?
K-4: Was there ever a time during the past 12 months when you wanted to use your air-
conditioner, but could not, for one or more of the following reasons:
K-4a: Your air-conditioner was broken and you were unable to pay for its repair or
replacement?
K-4a1: Did receiving energy assistance help you to restore cooling of your
home?
11
In Section 2C of the report, LIHEAP recipiency is self-reported by the survey respondents. In other parts of the
report, LIHEAP recipient households refer to those survey respondents that were verified to be LIHEAP recipients
using State administrative LIHEAP records.
www.appriseinc.org Level and Types of Energy Insecurity
APPRISE Incorporated Page 8
K-4b: The utility company discontinued your electric service because you were
unable to pay your bill?
K-4b1: Did receiving energy assistance help you to restore cooling of your
home?”
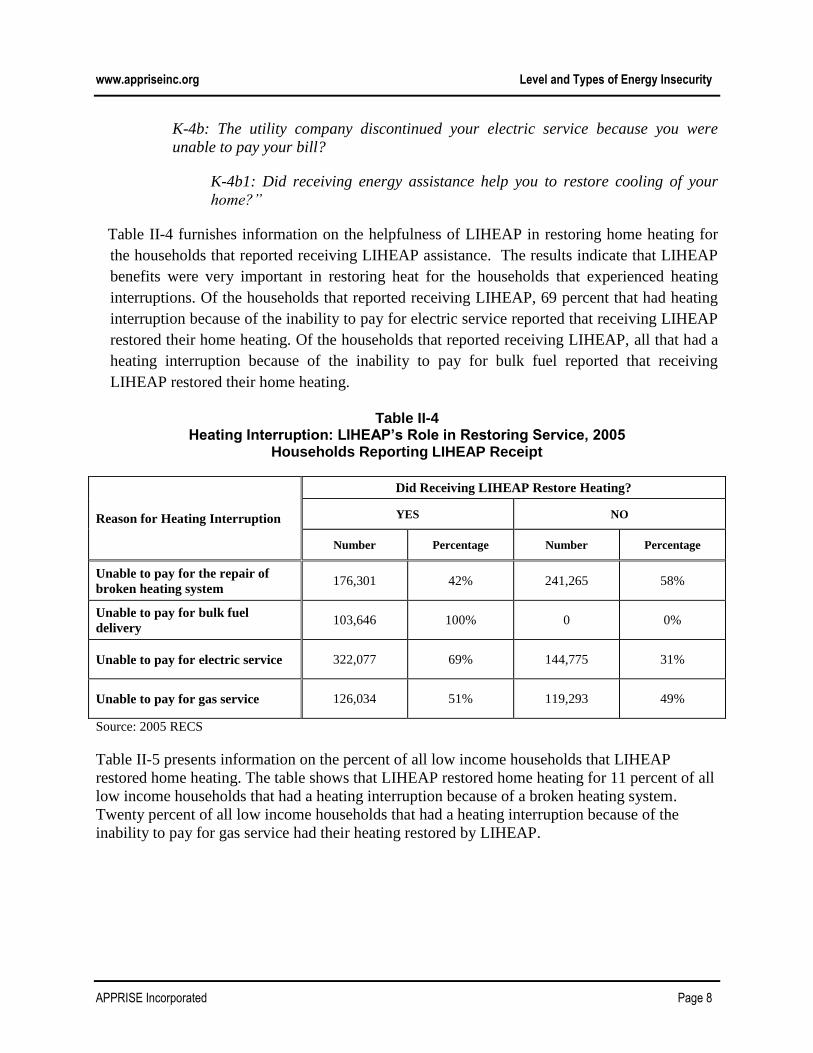
Table II-4 furnishes information on the helpfulness of LIHEAP in restoring home heating for
the households that reported receiving LIHEAP assistance. The results indicate that LIHEAP
benefits were very important in restoring heat for the households that experienced heating
interruptions. Of the households that reported receiving LIHEAP, 69 percent that had heating
interruption because of the inability to pay for electric service reported that receiving LIHEAP
restored their home heating. Of the households that reported receiving LIHEAP, all that had a
heating interruption because of the inability to pay for bulk fuel reported that receiving
LIHEAP restored their home heating.
Table II-4 Heating Interruption: LIHEAP’s Role in Restoring Service, 2005
Households Reporting LIHEAP Receipt
Reason for Heating Interruption
Did Receiving LIHEAP Restore Heating?
YES NO
Number Percentage Number Percentage
Unable to pay for the repair of
broken heating system 176,301 42% 241,265 58%
Unable to pay for bulk fuel
delivery 103,646 100% 0 0%
Unable to pay for electric service 322,077 69% 144,775 31%
Unable to pay for gas service 126,034 51% 119,293 49%
Source: 2005 RECS
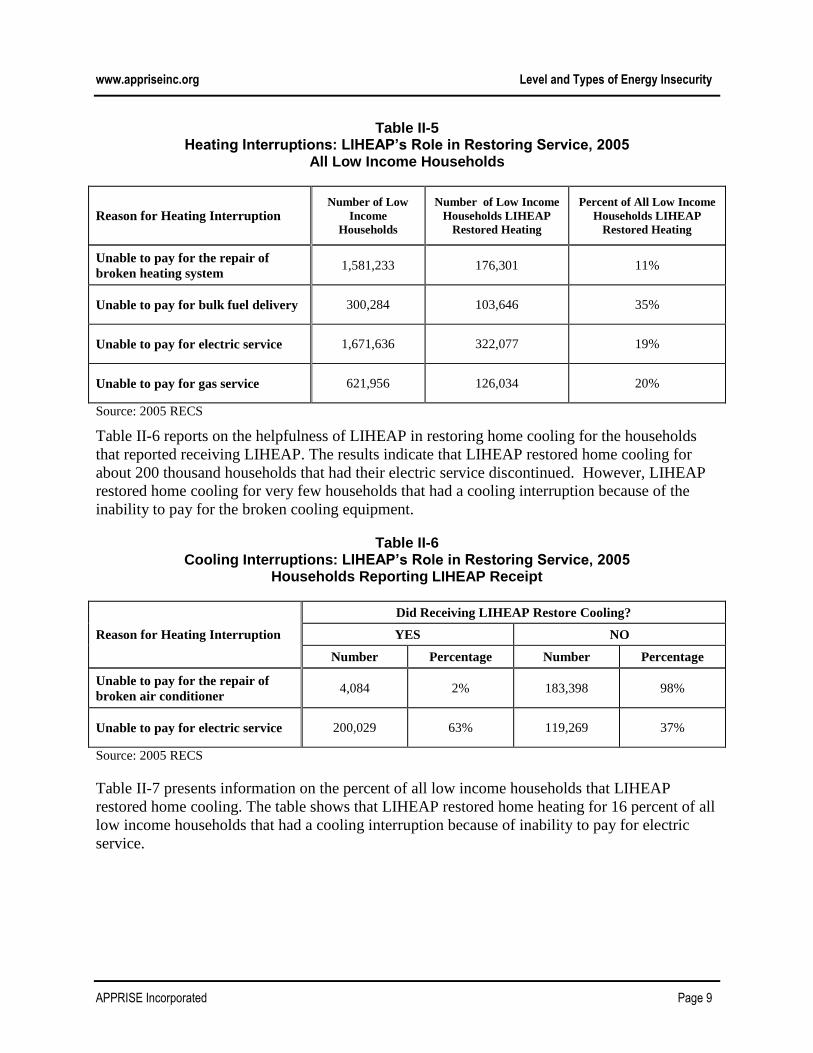
Table II-5 presents information on the percent of all low income households that LIHEAP
restored home heating. The table shows that LIHEAP restored home heating for 11 percent of all
low income households that had a heating interruption because of a broken heating system.
Twenty percent of all low income households that had a heating interruption because of the
inability to pay for gas service had their heating restored by LIHEAP.
www.appriseinc.org Level and Types of Energy Insecurity
APPRISE Incorporated Page 9
Table II-5 Heating Interruptions: LIHEAP’s Role in Restoring Service, 2005
All Low Income Households
Reason for Heating Interruption Number of Low
Income
Households
Number of Low Income
Households LIHEAP
Restored Heating
Percent of All Low Income
Households LIHEAP
Restored Heating
Unable to pay for the repair of
broken heating system 1,581,233 176,301 11%
Unable to pay for bulk fuel delivery 300,284 103,646 35%
Unable to pay for electric service 1,671,636 322,077 19%
Unable to pay for gas service 621,956 126,034 20%
Source: 2005 RECS
Table II-6 reports on the helpfulness of LIHEAP in restoring home cooling for the households
that reported receiving LIHEAP. The results indicate that LIHEAP restored home cooling for
about 200 thousand households that had their electric service discontinued. However, LIHEAP
restored home cooling for very few households that had a cooling interruption because of the
inability to pay for the broken cooling equipment.
Table II-6 Cooling Interruptions: LIHEAP’s Role in Restoring Service, 2005
Households Reporting LIHEAP Receipt
Reason for Heating Interruption
Did Receiving LIHEAP Restore Cooling?
YES NO
Number Percentage Number Percentage
Unable to pay for the repair of
broken air conditioner 4,084 2% 183,398 98%
Unable to pay for electric service 200,029 63% 119,269 37%
Source: 2005 RECS
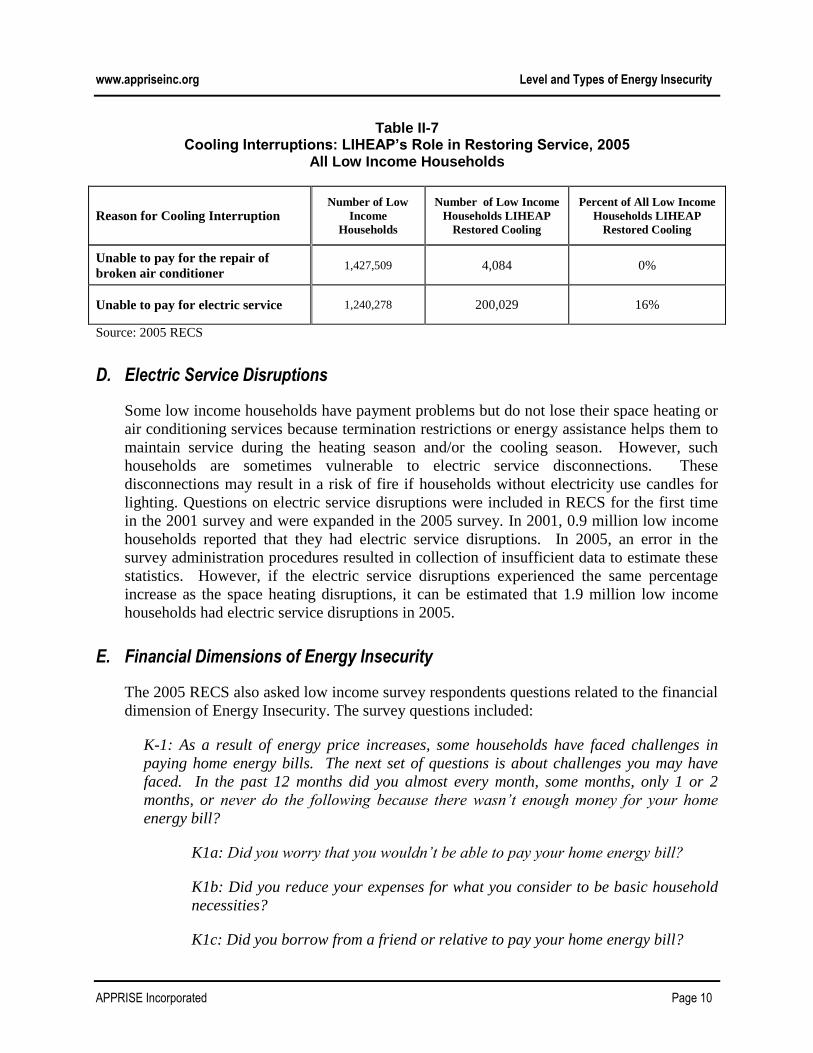
Table II-7 presents information on the percent of all low income households that LIHEAP
restored home cooling. The table shows that LIHEAP restored home heating for 16 percent of all
low income households that had a cooling interruption because of inability to pay for electric
service.
www.appriseinc.org Level and Types of Energy Insecurity
APPRISE Incorporated Page 10
Table II-7 Cooling Interruptions: LIHEAP’s Role in Restoring Service, 2005
All Low Income Households
Reason for Cooling Interruption Number of Low
Income
Households
Number of Low Income
Households LIHEAP
Restored Cooling
Percent of All Low Income
Households LIHEAP
Restored Cooling
Unable to pay for the repair of
broken air conditioner 1,427,509 4,084 0%
Unable to pay for electric service 1,240,278 200,029 16%
Source: 2005 RECS
D. Electric Service Disruptions
Some low income households have payment problems but do not lose their space heating or
air conditioning services because termination restrictions or energy assistance helps them to
maintain service during the heating season and/or the cooling season. However, such
households are sometimes vulnerable to electric service disconnections. These
disconnections may result in a risk of fire if households without electricity use candles for
lighting. Questions on electric service disruptions were included in RECS for the first time
in the 2001 survey and were expanded in the 2005 survey. In 2001, 0.9 million low income
households reported that they had electric service disruptions. In 2005, an error in the
survey administration procedures resulted in collection of insufficient data to estimate these
statistics. However, if the electric service disruptions experienced the same percentage
increase as the space heating disruptions, it can be estimated that 1.9 million low income
households had electric service disruptions in 2005.
E. Financial Dimensions of Energy Insecurity
The 2005 RECS also asked low income survey respondents questions related to the financial
dimension of Energy Insecurity. The survey questions included:
K-1: As a result of energy price increases, some households have faced challenges in
paying home energy bills. The next set of questions is about challenges you may have
faced. In the past 12 months did you almost every month, some months, only 1 or 2
months, or never do the following because there wasn’t enough money for your home
energy bill?
K1a: Did you worry that you wouldn’t be able to pay your home energy bill?
K1b: Did you reduce your expenses for what you consider to be basic household
necessities?
K1c: Did you borrow from a friend or relative to pay your home energy bill?
www.appriseinc.org Level and Types of Energy Insecurity
APPRISE Incorporated Page 11
K1d: Did you skip paying your home energy bill or pay less than your whole
home energy bill?
K1e: Did you have a supplier of your electric or home heating service threaten to
disconnect your electricity or home heating fuel service, or discontinue making
fuel deliveries?
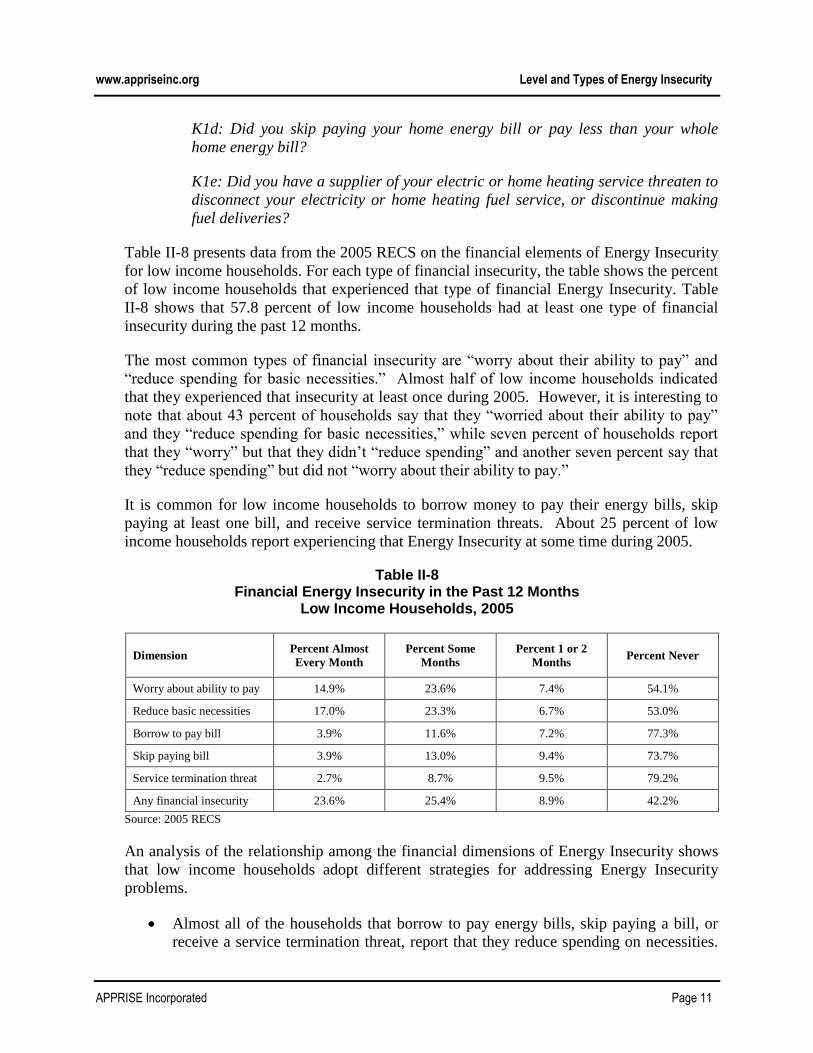
Table II-8 presents data from the 2005 RECS on the financial elements of Energy Insecurity
for low income households. For each type of financial insecurity, the table shows the percent
of low income households that experienced that type of financial Energy Insecurity. Table
II-8 shows that 57.8 percent of low income households had at least one type of financial
insecurity during the past 12 months.
The most common types of financial insecurity are “worry about their ability to pay” and
“reduce spending for basic necessities.” Almost half of low income households indicated
that they experienced that insecurity at least once during 2005. However, it is interesting to
note that about 43 percent of households say that they “worried about their ability to pay”
and they “reduce spending for basic necessities,” while seven percent of households report
that they “worry” but that they didn’t “reduce spending” and another seven percent say that
they “reduce spending” but did not “worry about their ability to pay.”
It is common for low income households to borrow money to pay their energy bills, skip
paying at least one bill, and receive service termination threats. About 25 percent of low
income households report experiencing that Energy Insecurity at some time during 2005.
Table II-8 Financial Energy Insecurity in the Past 12 Months
Low Income Households, 2005
Dimension Percent Almost
Every Month
Percent Some
Months
Percent 1 or 2
Months Percent Never
Worry about ability to pay 14.9% 23.6% 7.4% 54.1%
Reduce basic necessities 17.0% 23.3% 6.7% 53.0%
Borrow to pay bill 3.9% 11.6% 7.2% 77.3%
Skip paying bill 3.9% 13.0% 9.4% 73.7%
Service termination threat 2.7% 8.7% 9.5% 79.2%
Any financial insecurity 23.6% 25.4% 8.9% 42.2%
Source: 2005 RECS
An analysis of the relationship among the financial dimensions of Energy Insecurity shows
that low income households adopt different strategies for addressing Energy Insecurity
problems.
Almost all of the households that borrow to pay energy bills, skip paying a bill, or
receive a service termination threat, report that they reduce spending on necessities.
www.appriseinc.org Level and Types of Energy Insecurity
APPRISE Incorporated Page 12
For example, about 25 percent of households say that they had to borrow to pay their
energy bill. Of those who borrow, 84 percent said that they had to reduce spending
for basic necessities. Similarly, of the households that say that they received a
service termination notice, 85 percent reported that they had to reduce spending for
basic necessities.
It appears that some households borrow money to avoid skipping a payment or
receiving a service termination notice. About one-third of households that reported
borrowing did not need to skip paying a bill and - about half of low income
households that borrowed to pay their bill did not have a service termination notice.
It is clear that the heating and cooling disruption statistics understate the level of Energy
Insecurity among low income households. While about 10 percent of households experience
space heating disruptions, almost half of households reduce spending for basic necessities
and about one-fourth of households have threats of service termination.
F. Health and Safety Dimensions of Energy Insecurity
The 2005 RECS also asked low income survey respondents questions related to the health
and safety dimensions of Energy Insecurity. The survey questions included:
K-1: As a result of energy price increases, some households have faced challenges in
paying home energy bills. The next set of questions is about challenges you may have
faced. In the past 12 months did you almost every month, some months, only 1 or 2
months, or never do the following because there wasn’t enough money for your home
energy bill?
K1f: Did you close off part of your home because you couldn’t afford to heat or
cool it?
K1g: Did you keep your home at a temperature that you felt was unsafe or
unhealthy at any time of the year?
K1h: Did you leave your home for part of the day because it was too hot or too
cold?
K1i: Did you use your kitchen stove or oven to provide heat?
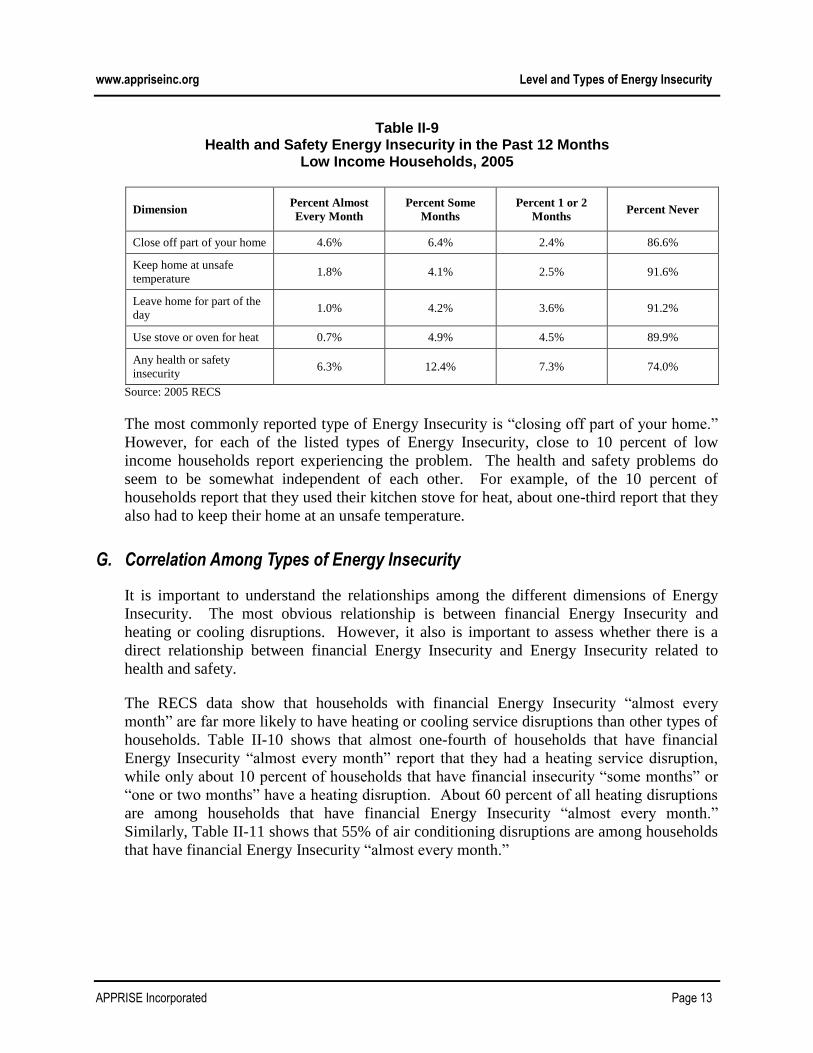
Table II-9 presents data from the 2005 RECS on the health and safety elements of Energy
Insecurity for low income households. For each type of health and safety insecurity, the
table shows the percent of low income households indicating how often they experienced
that type of financial Energy Insecurity. Table II-9 shows that 26.0 percent of low income
households had at least one type of health and safety insecurity during the past 12 months.
www.appriseinc.org Level and Types of Energy Insecurity
APPRISE Incorporated Page 13
Table II-9 Health and Safety Energy Insecurity in the Past 12 Months
Low Income Households, 2005
Dimension Percent Almost
Every Month
Percent Some
Months
Percent 1 or 2
Months Percent Never
Close off part of your home 4.6% 6.4% 2.4% 86.6%
Keep home at unsafe
temperature 1.8% 4.1% 2.5% 91.6%
Leave home for part of the
day 1.0% 4.2% 3.6% 91.2%
Use stove or oven for heat 0.7% 4.9% 4.5% 89.9%
Any health or safety
insecurity 6.3% 12.4% 7.3% 74.0%
Source: 2005 RECS
The most commonly reported type of Energy Insecurity is “closing off part of your home.”
However, for each of the listed types of Energy Insecurity, close to 10 percent of low
income households report experiencing the problem. The health and safety problems do
seem to be somewhat independent of each other. For example, of the 10 percent of
households report that they used their kitchen stove for heat, about one-third report that they
also had to keep their home at an unsafe temperature.
G. Correlation Among Types of Energy Insecurity
It is important to understand the relationships among the different dimensions of Energy
Insecurity. The most obvious relationship is between financial Energy Insecurity and
heating or cooling disruptions. However, it also is important to assess whether there is a
direct relationship between financial Energy Insecurity and Energy Insecurity related to
health and safety.
The RECS data show that households with financial Energy Insecurity “almost every
month” are far more likely to have heating or cooling service disruptions than other types of
households. Table II-10 shows that almost one-fourth of households that have financial
Energy Insecurity “almost every month” report that they had a heating service disruption,
while only about 10 percent of households that have financial insecurity “some months” or
“one or two months” have a heating disruption. About 60 percent of all heating disruptions
are among households that have financial Energy Insecurity “almost every month.”
Similarly, Table II-11 shows that 55% of air conditioning disruptions are among households
that have financial Energy Insecurity “almost every month.”

www.appriseinc.org Level and Types of Energy Insecurity
APPRISE Incorporated Page 14
Table II-10 Relationship of Financial Energy Insecurity to Heating Service Disruptions
Low Income Households, 2005
Frequency of Financial
Energy Insecurity No Heating Disruption Any Heating Disruption Heating Disruption Rate
Almost Every Month 20.0% 5.9% 23%
Some Months 24.0% 3.2% 12%
One or Two Months 7.8% 0.7% 8%
Never 38.0% 0.5% 1%
ALL 89.7% 10.3% 10%
Source: 2005 RECS
Table II-11 Relationship of Financial Energy Insecurity to Air Conditioning Disruptions
Low Income Households, 2005
Frequency of Financial
Energy Insecurity
No Air Conditioning
Disruption
Any Air Conditioning
Disruption
Air Conditioning
Disruption Rate
Almost Every Month 21.2% 4.9% 19%
Some Months 24.1% 3.2% 13%
One or Two Months 8.0% 0.6% 7%
Never 38.0% 0.2% 1%
ALL 91.2% 8.8% 9%
Source: 2005 RECS
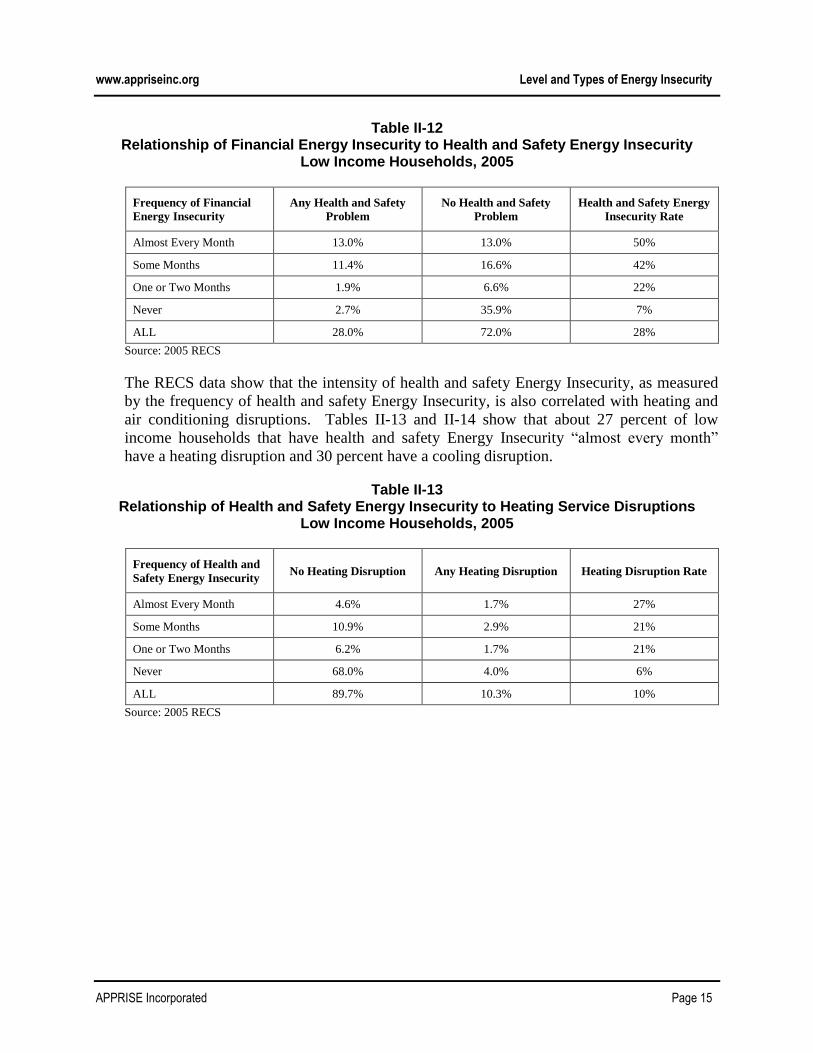
The RECS data also show that households with financial Energy Insecurity “almost every
month” are far more likely to have health or safety Energy Insecurity. Table II-12 shows that
half of the households that have financial Energy Insecurity “almost every month” also
report that they had health and safety Energy Insecurity. By comparison, among those low
income households that have no indicators of financial Energy Insecurity, only 7 percent
have a health and safety Energy Insecurity.
www.appriseinc.org Level and Types of Energy Insecurity
APPRISE Incorporated Page 15
Table II-12 Relationship of Financial Energy Insecurity to Health and Safety Energy Insecurity
Low Income Households, 2005
Frequency of Financial
Energy Insecurity
Any Health and Safety
Problem
No Health and Safety
Problem
Health and Safety Energy
Insecurity Rate
Almost Every Month 13.0% 13.0% 50%
Some Months 11.4% 16.6% 42%
One or Two Months 1.9% 6.6% 22%
Never 2.7% 35.9% 7%
ALL 28.0% 72.0% 28%
Source: 2005 RECS
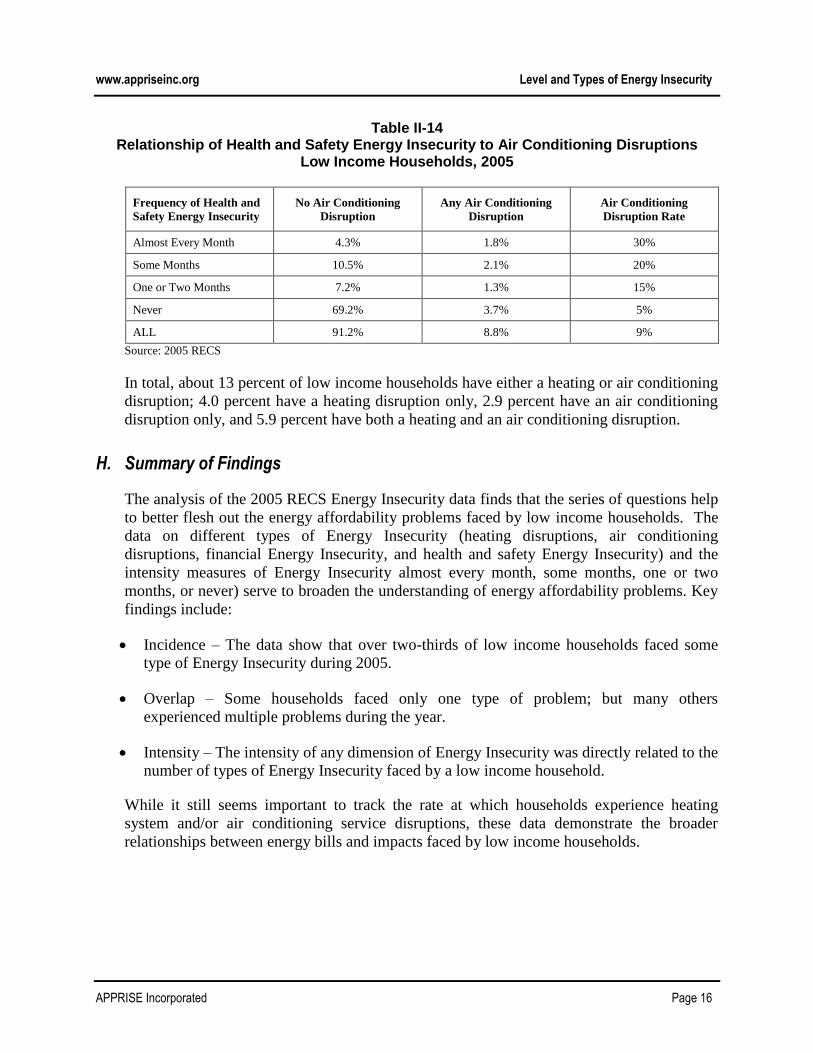
The RECS data show that the intensity of health and safety Energy Insecurity, as measured
by the frequency of health and safety Energy Insecurity, is also correlated with heating and
air conditioning disruptions. Tables II-13 and II-14 show that about 27 percent of low
income households that have health and safety Energy Insecurity “almost every month”
have a heating disruption and 30 percent have a cooling disruption.
Table II-13 Relationship of Health and Safety Energy Insecurity to Heating Service Disruptions
Low Income Households, 2005
Frequency of Health and
Safety Energy Insecurity No Heating Disruption Any Heating Disruption Heating Disruption Rate
Almost Every Month 4.6% 1.7% 27%
Some Months 10.9% 2.9% 21%
One or Two Months 6.2% 1.7% 21%
Never 68.0% 4.0% 6%
ALL 89.7% 10.3% 10%
Source: 2005 RECS
www.appriseinc.org Level and Types of Energy Insecurity
APPRISE Incorporated Page 16
Table II-14 Relationship of Health and Safety Energy Insecurity to Air Conditioning Disruptions
Low Income Households, 2005
Frequency of Health and
Safety Energy Insecurity
No Air Conditioning
Disruption
Any Air Conditioning
Disruption
Air Conditioning
Disruption Rate
Almost Every Month 4.3% 1.8% 30%
Some Months 10.5% 2.1% 20%
One or Two Months 7.2% 1.3% 15%
Never 69.2% 3.7% 5%
ALL 91.2% 8.8% 9%
Source: 2005 RECS
In total, about 13 percent of low income households have either a heating or air conditioning
disruption; 4.0 percent have a heating disruption only, 2.9 percent have an air conditioning
disruption only, and 5.9 percent have both a heating and an air conditioning disruption.
H. Summary of Findings
The analysis of the 2005 RECS Energy Insecurity data finds that the series of questions help
to better flesh out the energy affordability problems faced by low income households. The
data on different types of Energy Insecurity (heating disruptions, air conditioning
disruptions, financial Energy Insecurity, and health and safety Energy Insecurity) and the
intensity measures of Energy Insecurity almost every month, some months, one or two
months, or never) serve to broaden the understanding of energy affordability problems. Key
findings include:
Incidence – The data show that over two-thirds of low income households faced some
type of Energy Insecurity during 2005.
Overlap – Some households faced only one type of problem; but many others
experienced multiple problems during the year.
Intensity – The intensity of any dimension of Energy Insecurity was directly related to the
number of types of Energy Insecurity faced by a low income household.
While it still seems important to track the rate at which households experience heating
system and/or air conditioning service disruptions, these data demonstrate the broader
relationships between energy bills and impacts faced by low income households.
www.appriseinc.org Factors Related to Energy Insecurity
APPRISE Incorporated Page 17
III. Factors Related to Energy Insecurity
Section II presented information on the incidence of each type of Energy Insecurity and the
relationship among the different types of Energy Insecurity. This section furnishes detailed
information on how Energy Insecurity levels vary for key population subgroups.
A. Definition of Analysis Factors
The factors reviewed in this section include:
1. Geography – The geographic dimension considered is Census Region.
2. Poverty – The analysis uses the HHS Poverty Guidelines as one way of defining income.
The poverty levels examined include at or below the 100% of the poverty guidelines,
above 100% but at or below 150%, and above 150% but at or below 60% of State median
income. (Note: In the 2005 RECS, households were eligible for Section K - the Energy
Insecurity questions - if their income was at or below the Federal Maximum Eligibility
Standard for their State.)
3. Income – The analysis also uses income groups based on reported household income.
Households are categorized as having annual household income at or below $10,000,
above $10,000 but at or below $20,000, and $20,000 or more. (Note: Households with
income that is above the Federal Maximum Income Standard for their State are excluded
from the analysis because they were not asked the Section K questions.)
4. Income Type – Based on reported sources of income households are categorized into four
income groups:
o Employed – Households that reported receiving some income from wages or self-
employment.
o Retired – Households that did not report receiving employment income, but did
report receiving retirement income such as Social Security or pensions.
o Public Assistance – Households that did not report receiving employment income
or retirement income, but did report receiving public assistance.
o Other – Households that did not report receiving employment income, retirement
income, or public assistance income.
5. Vulnerability Group – Households are categorized into the following vulnerability
groups.

www.appriseinc.org Factors Related to Energy Insecurity
APPRISE Incorporated Page 18
o Young Child – A household is categorized as young child if one or more
individuals in the home is 5 years or younger. (Note: If a household contains both
an elderly and young child member, it is categorized as Young Child.)12
o Elderly – A household is categorized as elderly if one or more individuals in the
home are aged 60 years or older and there is no young child in the household.
o Other – A household is categorized as other if there is no elderly individual and
no young child in the home.13
-
6. Energy Burden – For the purpose of the study, households are categorized as having high
energy burden if residential energy burden is greater than 10.9 percent (i.e., if annual
energy expenditures are greater than 10.9 percent of annual income), as having moderate
energy burden if energy burden is less 10.9 percent, but greater than or equal to 6.5
percent, and low if energy burden is less than 6.5 percent.14
7. LIHEAP Status – In the 2005 RECS, survey respondents were checked against State
LIHEAP administrative records to assess whether they had received LIHEAP.
These factors are used to examine how Energy Insecurity is distributed geographically and
demographically for the population of low income households.
B. Energy Insecurity by Geography
Tables III-1 through III-5 present information on the geographic dimensions of Energy
Insecurity for LIHEAP income eligible households. The 2005 RECS estimates that there
were 38.6 million households that were income eligible for LIHEAP. Of these households,
8.1 million live in the Northeast, 9.4 million in the Midwest, 13.9 million in the South, and
7.2 million in the West census regions. The statistics presented here are for the households
that responded to the Section K questions, representing 35.9 million of the 38.6 million low
income households.15
Table III-1 shows that in 2005, 9.2 percent of LIHEAP income eligible households were
without heat at some point during the year. This corresponds to about 3.6 million
households. Heat interruptions tend to occur at a higher rate in the South and West Census
Regions regardless of the underlying reason. In 2005, 13.4 percent (1.0 million) of
households in the West and 10.3 percent (1.4 million) of households in the South went
without heat in 2005. The lower incidence of heat interruptions in the Northeast and
12
According to the 2005 RECS, there are about 470 thousand low income households that contain both elderly and
young child members. 13
Note that LIHEAP also considers disabled individuals to be vulnerable. However, the 2005 RECS did not collect
information on disability. 14
LIHEAP Energy Burden Evaluation Study, March 2005, prepared by APPRISE Incorporated under PSC Order
No. 043Y00471301D. 15
Section K questions were not asked to some of the households that did not answer the household income question
but later turned out to be income eligible for LIHEAP after their household income was imputed.
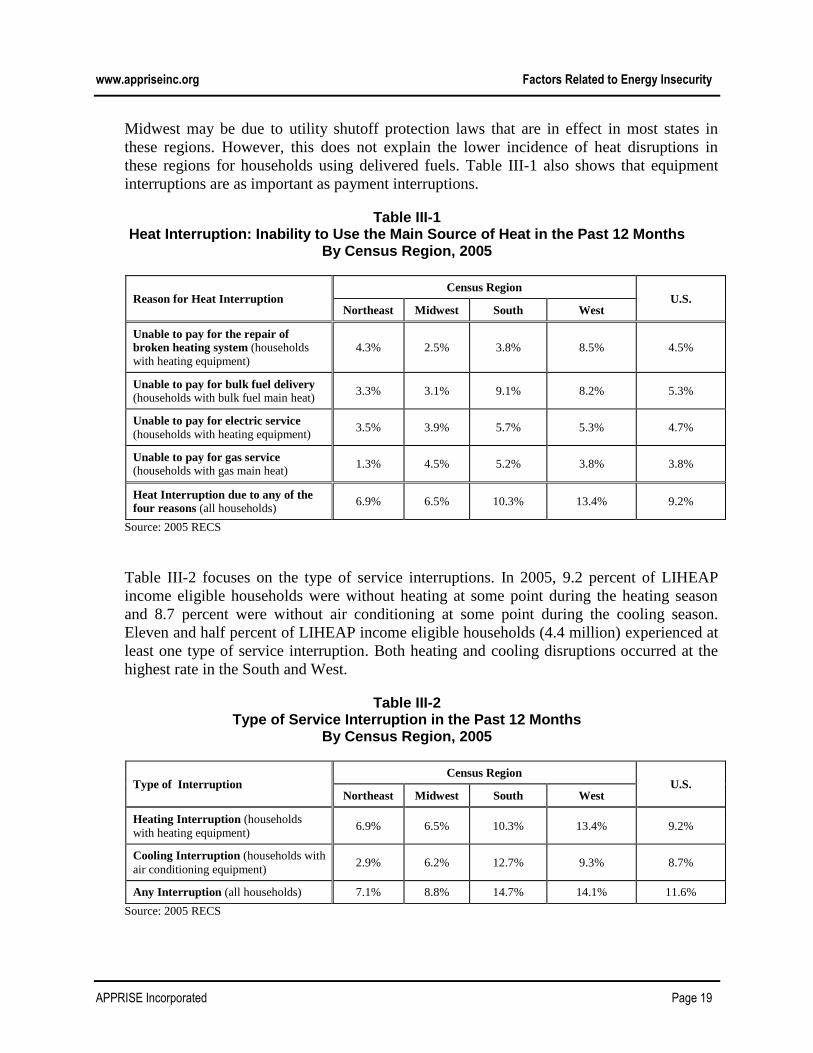
www.appriseinc.org Factors Related to Energy Insecurity
APPRISE Incorporated Page 19
Midwest may be due to utility shutoff protection laws that are in effect in most states in
these regions. However, this does not explain the lower incidence of heat disruptions in
these regions for households using delivered fuels. Table III-1 also shows that equipment
interruptions are as important as payment interruptions.
Table III-1 Heat Interruption: Inability to Use the Main Source of Heat in the Past 12 Months
By Census Region, 2005
Reason for Heat Interruption Census Region
U.S. Northeast Midwest South West
Unable to pay for the repair of
broken heating system (households
with heating equipment)
4.3% 2.5% 3.8% 8.5% 4.5%
Unable to pay for bulk fuel delivery
(households with bulk fuel main heat) 3.3% 3.1% 9.1% 8.2% 5.3%
Unable to pay for electric service (households with heating equipment)
3.5% 3.9% 5.7% 5.3% 4.7%
Unable to pay for gas service
(households with gas main heat) 1.3% 4.5% 5.2% 3.8% 3.8%
Heat Interruption due to any of the
four reasons (all households) 6.9% 6.5% 10.3% 13.4% 9.2%
Source: 2005 RECS
Table III-2 focuses on the type of service interruptions. In 2005, 9.2 percent of LIHEAP
income eligible households were without heating at some point during the heating season
and 8.7 percent were without air conditioning at some point during the cooling season.
Eleven and half percent of LIHEAP income eligible households (4.4 million) experienced at
least one type of service interruption. Both heating and cooling disruptions occurred at the
highest rate in the South and West.
Table III-2 Type of Service Interruption in the Past 12 Months
By Census Region, 2005
Type of Interruption Census Region
U.S. Northeast Midwest South West
Heating Interruption (households
with heating equipment) 6.9% 6.5% 10.3% 13.4% 9.2%
Cooling Interruption (households with
air conditioning equipment) 2.9% 6.2% 12.7% 9.3% 8.7%
Any Interruption (all households) 7.1% 8.8% 14.7% 14.1% 11.6%
Source: 2005 RECS
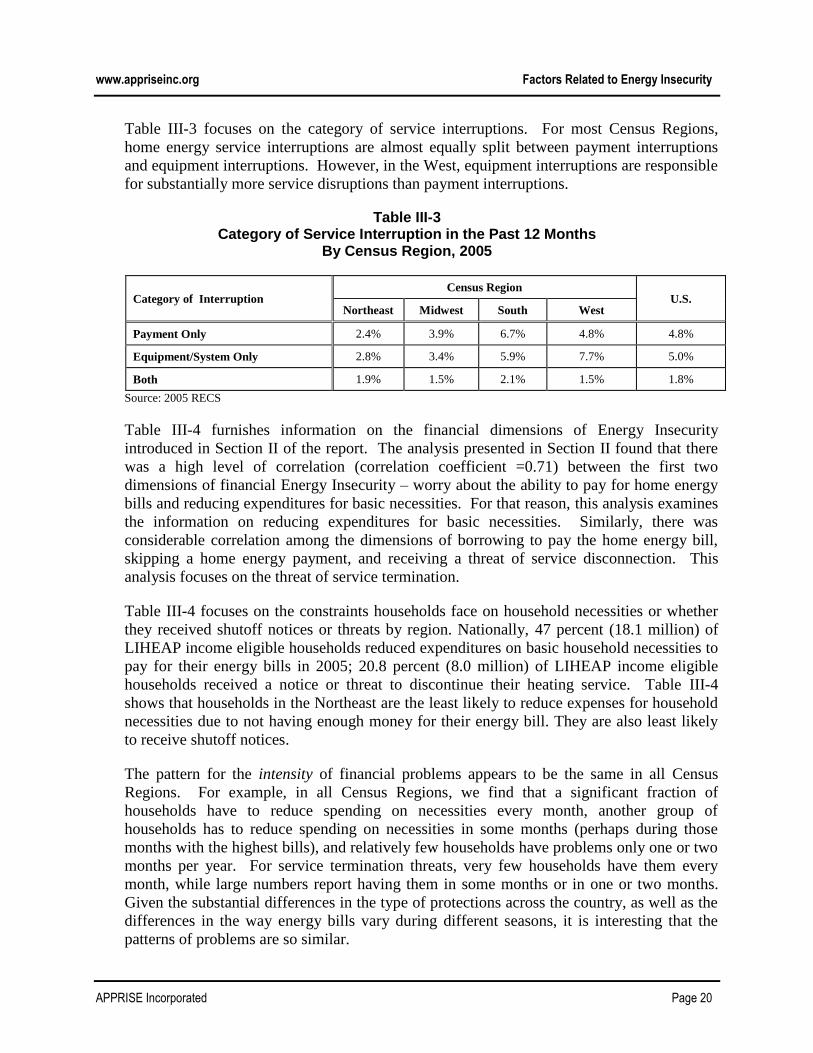
www.appriseinc.org Factors Related to Energy Insecurity
APPRISE Incorporated Page 20
Table III-3 focuses on the category of service interruptions. For most Census Regions,
home energy service interruptions are almost equally split between payment interruptions
and equipment interruptions. However, in the West, equipment interruptions are responsible
for substantially more service disruptions than payment interruptions.
Table III-3 Category of Service Interruption in the Past 12 Months
By Census Region, 2005
Category of Interruption Census Region
U.S. Northeast Midwest South West
Payment Only 2.4% 3.9% 6.7% 4.8% 4.8%
Equipment/System Only 2.8% 3.4% 5.9% 7.7% 5.0%
Both 1.9% 1.5% 2.1% 1.5% 1.8%
Source: 2005 RECS
Table III-4 furnishes information on the financial dimensions of Energy Insecurity
introduced in Section II of the report. The analysis presented in Section II found that there
was a high level of correlation (correlation coefficient =0.71) between the first two
dimensions of financial Energy Insecurity – worry about the ability to pay for home energy
bills and reducing expenditures for basic necessities. For that reason, this analysis examines
the information on reducing expenditures for basic necessities. Similarly, there was
considerable correlation among the dimensions of borrowing to pay the home energy bill,
skipping a home energy payment, and receiving a threat of service disconnection. This
analysis focuses on the threat of service termination.
Table III-4 focuses on the constraints households face on household necessities or whether
they received shutoff notices or threats by region. Nationally, 47 percent (18.1 million) of
LIHEAP income eligible households reduced expenditures on basic household necessities to
pay for their energy bills in 2005; 20.8 percent (8.0 million) of LIHEAP income eligible
households received a notice or threat to discontinue their heating service. Table III-4
shows that households in the Northeast are the least likely to reduce expenses for household
necessities due to not having enough money for their energy bill. They are also least likely
to receive shutoff notices.
The pattern for the intensity of financial problems appears to be the same in all Census
Regions. For example, in all Census Regions, we find that a significant fraction of
households have to reduce spending on necessities every month, another group of
households has to reduce spending on necessities in some months (perhaps during those
months with the highest bills), and relatively few households have problems only one or two
months per year. For service termination threats, very few households have them every
month, while large numbers report having them in some months or in one or two months.
Given the substantial differences in the type of protections across the country, as well as the
differences in the way energy bills vary during different seasons, it is interesting that the
patterns of problems are so similar.

www.appriseinc.org Factors Related to Energy Insecurity
APPRISE Incorporated Page 21
Table III-4 Financial Dimensions of Energy Insecurity in the Past 12 Months
By Census Region, 2005
Dimension Frequency
Census Region
U.S.
Northeast Midwest South West
Reduced Expenses for
Household Necessities Due
to Not Having Enough
Money for the Energy Bill
During the Past Year
Almost Every Month 12.4% 15.7% 20% 18.1% 17.0%
Some Months 20.5% 27.3% 22.9% 22.0% 23.3%
1 or 2 Months 6.1% 6.3% 6.7% 8.0% 6.7%
Never / No 61.0% 50.7% 50.5% 51.8% 53.0%
Received Notice or Threat
to Disconnect or
Discontinue Electricity or
Home Heating Fuel Due to
Not Having Enough Money
for the Energy Bill During
the Past Year
Almost Every Month 2.3% 2.1% 3.8% 1.6% 2.7%
Some Months 6.1% 9.3% 9.2% 9.6% 8.7%
1 or 2 Months 7.4% 10.5% 9.6% 10.3% 9.5%
Never / No 84.3% 78.1% 77.4% 78.6% 79.2%
Source: 2005 RECS
Table III-5 furnishes information on the health and safety dimensions of Energy Insecurity
by Census Region. This analysis presents information on three important aspects of health
and safety Energy Insecurity – keeping the home at an unsafe temperature, leaving the home
for part of the day, and using the kitchen stove or oven for heat. Nationally, 8.4 percent (3.2
million) of LIHEAP income eligible households reported that they kept their home at an
unsafe temperature, 10.1 percent (3.8 million) used kitchen stove or oven to provide heat,
and 8.8 percent (3.4 million) left home during day because it was too hot or cold for at least
1 or 2 months. The overlapping between these three actions is relatively low. Only 0.4
million of households took all three actions and 1.8 million took any two of the three
actions. 20 percent (7.7million) of LIHEAP income eligible households engaged in at least
one of the three actions. This is the total number of households that faced a constraint on
energy use because of unaffordable energy.
At the Census Region level, households in the Northeast Region are the least likely to
experience any of these types of health and safety Energy Insecurity. Households in the
South Region were the most likely to keep their home at an unsafe temperature and to use
their kitchen stove or oven for heat. Households in the West Region were the most likely to
leave their home for part of the day because it was too hot or too cold.
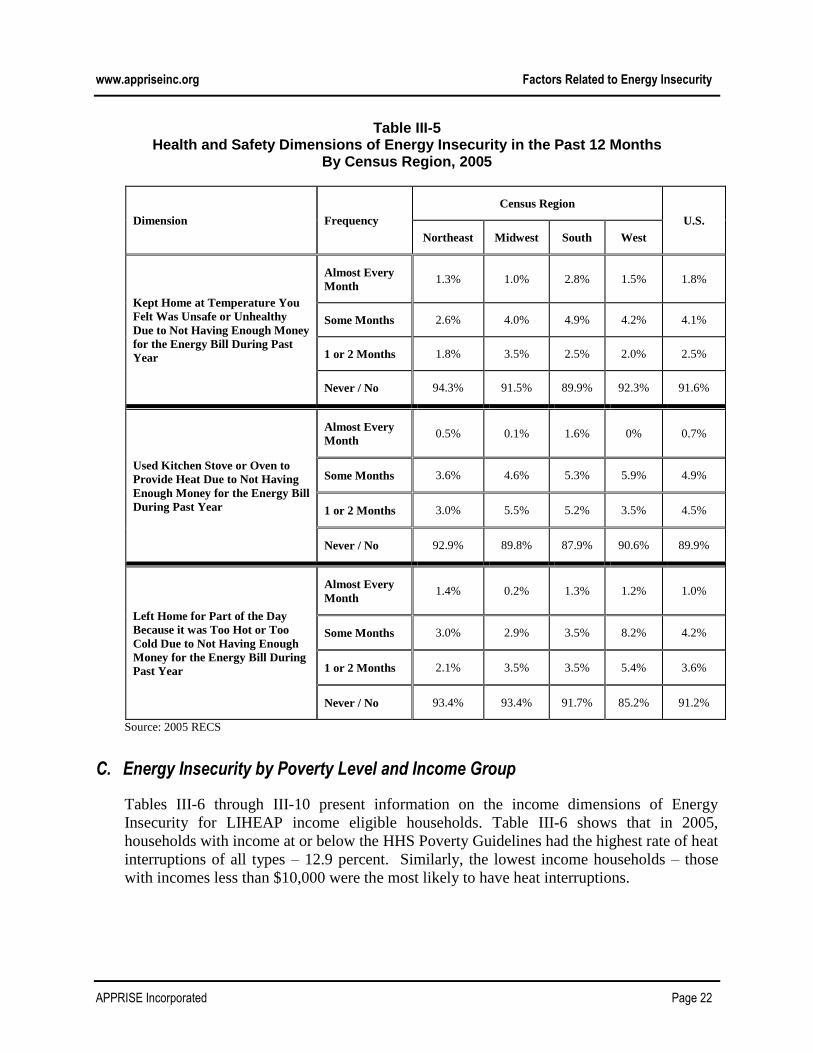
www.appriseinc.org Factors Related to Energy Insecurity
APPRISE Incorporated Page 22
Table III-5 Health and Safety Dimensions of Energy Insecurity in the Past 12 Months
By Census Region, 2005
Dimension Frequency
Census Region
U.S.
Northeast Midwest South West
Kept Home at Temperature You
Felt Was Unsafe or Unhealthy
Due to Not Having Enough Money
for the Energy Bill During Past
Year
Almost Every
Month 1.3% 1.0% 2.8% 1.5% 1.8%
Some Months 2.6% 4.0% 4.9% 4.2% 4.1%
1 or 2 Months 1.8% 3.5% 2.5% 2.0% 2.5%
Never / No 94.3% 91.5% 89.9% 92.3% 91.6%
Used Kitchen Stove or Oven to
Provide Heat Due to Not Having
Enough Money for the Energy Bill
During Past Year
Almost Every
Month 0.5% 0.1% 1.6% 0% 0.7%
Some Months 3.6% 4.6% 5.3% 5.9% 4.9%
1 or 2 Months 3.0% 5.5% 5.2% 3.5% 4.5%
Never / No 92.9% 89.8% 87.9% 90.6% 89.9%
Left Home for Part of the Day
Because it was Too Hot or Too
Cold Due to Not Having Enough
Money for the Energy Bill During
Past Year
Almost Every
Month 1.4% 0.2% 1.3% 1.2% 1.0%
Some Months 3.0% 2.9% 3.5% 8.2% 4.2%
1 or 2 Months 2.1% 3.5% 3.5% 5.4% 3.6%
Never / No 93.4% 93.4% 91.7% 85.2% 91.2%
Source: 2005 RECS
C. Energy Insecurity by Poverty Level and Income Group
Tables III-6 through III-10 present information on the income dimensions of Energy
Insecurity for LIHEAP income eligible households. Table III-6 shows that in 2005,
households with income at or below the HHS Poverty Guidelines had the highest rate of heat
interruptions of all types – 12.9 percent. Similarly, the lowest income households – those
with incomes less than $10,000 were the most likely to have heat interruptions.
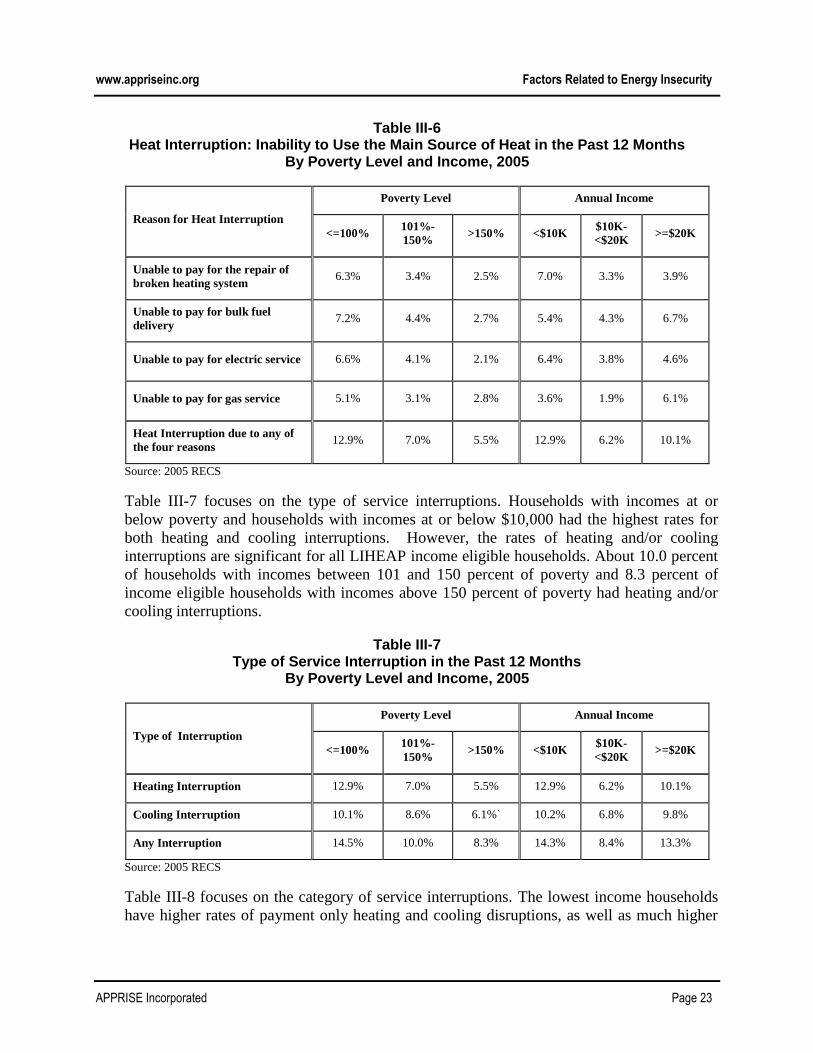
www.appriseinc.org Factors Related to Energy Insecurity
APPRISE Incorporated Page 23
Table III-6 Heat Interruption: Inability to Use the Main Source of Heat in the Past 12 Months
By Poverty Level and Income, 2005
Reason for Heat Interruption
Poverty Level Annual Income
<=100% 101%-
150% >150% <$10K
$10K-
<$20K >=$20K
Unable to pay for the repair of
broken heating system 6.3% 3.4% 2.5% 7.0% 3.3% 3.9%
Unable to pay for bulk fuel
delivery 7.2% 4.4% 2.7% 5.4% 4.3% 6.7%
Unable to pay for electric service 6.6% 4.1% 2.1% 6.4% 3.8% 4.6%
Unable to pay for gas service 5.1% 3.1% 2.8% 3.6% 1.9% 6.1%
Heat Interruption due to any of
the four reasons 12.9% 7.0% 5.5% 12.9% 6.2% 10.1%
Source: 2005 RECS
Table III-7 focuses on the type of service interruptions. Households with incomes at or
below poverty and households with incomes at or below $10,000 had the highest rates for
both heating and cooling interruptions. However, the rates of heating and/or cooling
interruptions are significant for all LIHEAP income eligible households. About 10.0 percent
of households with incomes between 101 and 150 percent of poverty and 8.3 percent of
income eligible households with incomes above 150 percent of poverty had heating and/or
cooling interruptions.
Table III-7 Type of Service Interruption in the Past 12 Months
By Poverty Level and Income, 2005
Type of Interruption
Poverty Level Annual Income
<=100% 101%-
150% >150% <$10K
$10K-
<$20K >=$20K
Heating Interruption 12.9% 7.0% 5.5% 12.9% 6.2% 10.1%
Cooling Interruption 10.1% 8.6% 6.1%` 10.2% 6.8% 9.8%
Any Interruption 14.5% 10.0% 8.3% 14.3% 8.4% 13.3%
Source: 2005 RECS
Table III-8 focuses on the category of service interruptions. The lowest income households
have higher rates of payment only heating and cooling disruptions, as well as much higher
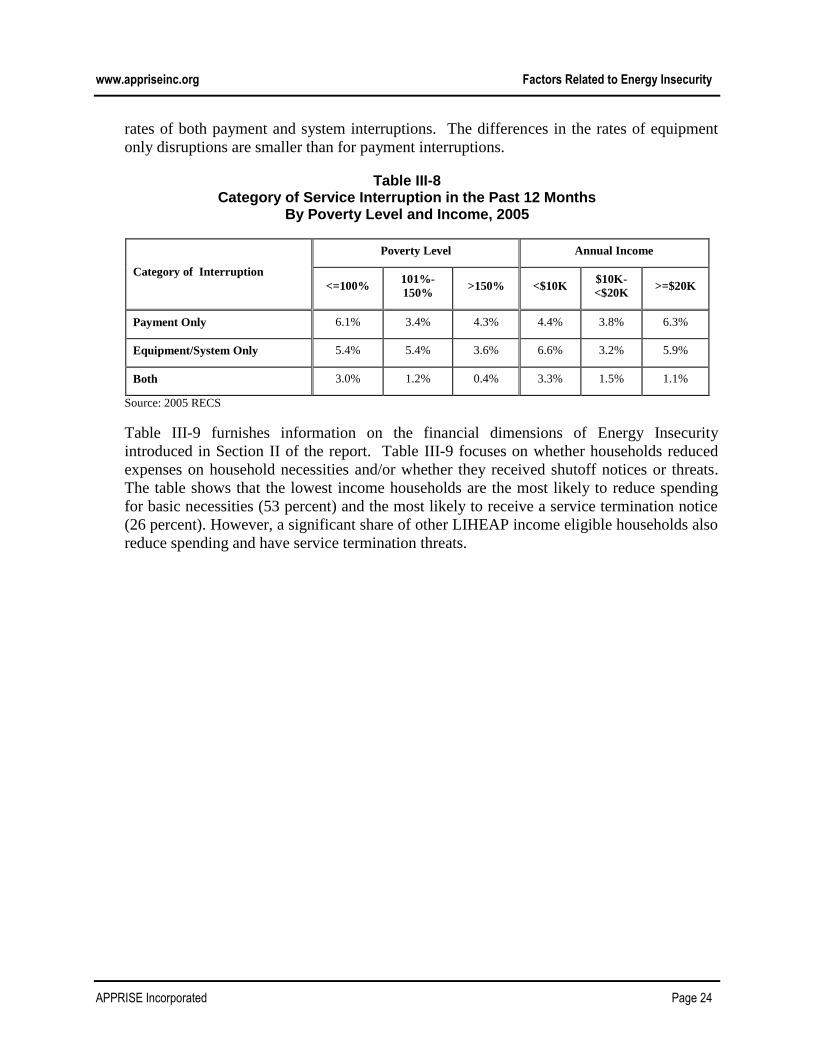
www.appriseinc.org Factors Related to Energy Insecurity
APPRISE Incorporated Page 24
rates of both payment and system interruptions. The differences in the rates of equipment
only disruptions are smaller than for payment interruptions.
Table III-8 Category of Service Interruption in the Past 12 Months
By Poverty Level and Income, 2005
Category of Interruption
Poverty Level Annual Income
<=100% 101%-
150% >150% <$10K
$10K-
<$20K >=$20K
Payment Only 6.1% 3.4% 4.3% 4.4% 3.8% 6.3%
Equipment/System Only 5.4% 5.4% 3.6% 6.6% 3.2% 5.9%
Both 3.0% 1.2% 0.4% 3.3% 1.5% 1.1%
Source: 2005 RECS
Table III-9 furnishes information on the financial dimensions of Energy Insecurity
introduced in Section II of the report. Table III-9 focuses on whether households reduced
expenses on household necessities and/or whether they received shutoff notices or threats.
The table shows that the lowest income households are the most likely to reduce spending
for basic necessities (53 percent) and the most likely to receive a service termination notice
(26 percent). However, a significant share of other LIHEAP income eligible households also
reduce spending and have service termination threats.
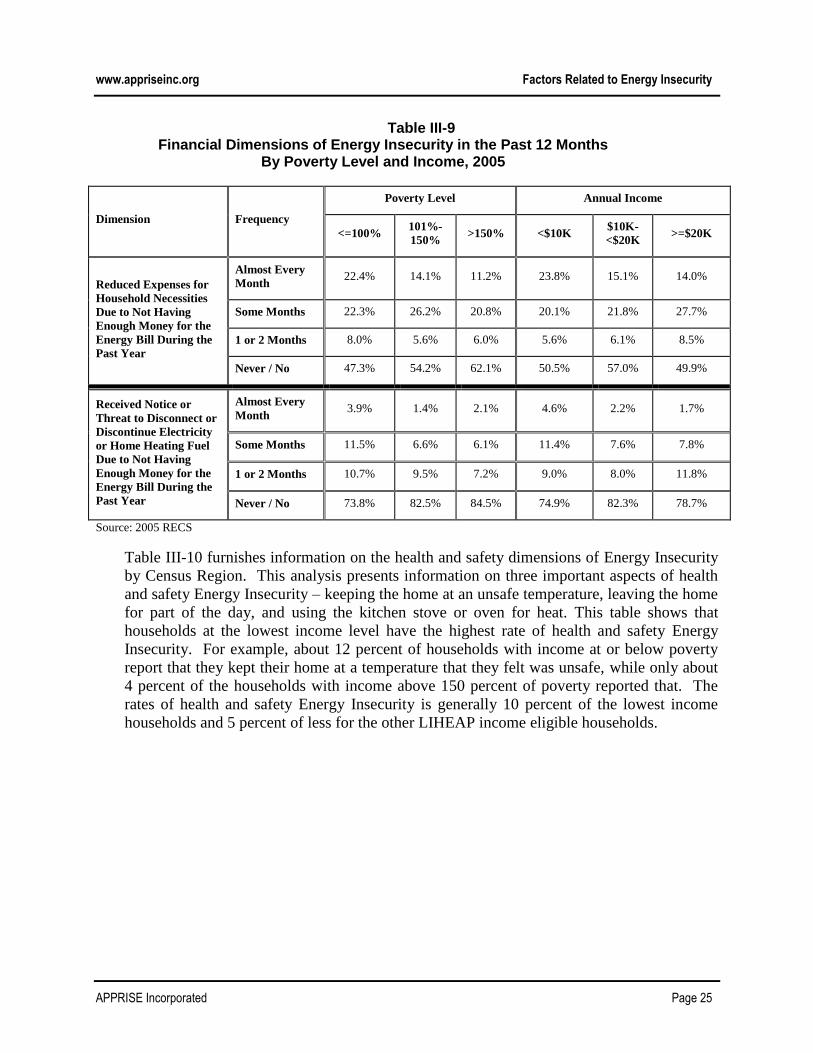
www.appriseinc.org Factors Related to Energy Insecurity
APPRISE Incorporated Page 25
Table III-9 Financial Dimensions of Energy Insecurity in the Past 12 Months
By Poverty Level and Income, 2005
Dimension Frequency
Poverty Level Annual Income
<=100% 101%-
150% >150% <$10K
$10K-
<$20K >=$20K
Reduced Expenses for
Household Necessities
Due to Not Having
Enough Money for the
Energy Bill During the
Past Year
Almost Every
Month 22.4% 14.1% 11.2% 23.8% 15.1% 14.0%
Some Months 22.3% 26.2% 20.8% 20.1% 21.8% 27.7%
1 or 2 Months 8.0% 5.6% 6.0% 5.6% 6.1% 8.5%
Never / No 47.3% 54.2% 62.1% 50.5% 57.0% 49.9%
Received Notice or
Threat to Disconnect or
Discontinue Electricity
or Home Heating Fuel
Due to Not Having
Enough Money for the
Energy Bill During the
Past Year
Almost Every
Month 3.9% 1.4% 2.1% 4.6% 2.2% 1.7%
Some Months 11.5% 6.6% 6.1% 11.4% 7.6% 7.8%
1 or 2 Months 10.7% 9.5% 7.2% 9.0% 8.0% 11.8%
Never / No 73.8% 82.5% 84.5% 74.9% 82.3% 78.7%
Source: 2005 RECS
Table III-10 furnishes information on the health and safety dimensions of Energy Insecurity
by Census Region. This analysis presents information on three important aspects of health
and safety Energy Insecurity – keeping the home at an unsafe temperature, leaving the home
for part of the day, and using the kitchen stove or oven for heat. This table shows that
households at the lowest income level have the highest rate of health and safety Energy
Insecurity. For example, about 12 percent of households with income at or below poverty
report that they kept their home at a temperature that they felt was unsafe, while only about
4 percent of the households with income above 150 percent of poverty reported that. The
rates of health and safety Energy Insecurity is generally 10 percent of the lowest income
households and 5 percent of less for the other LIHEAP income eligible households.
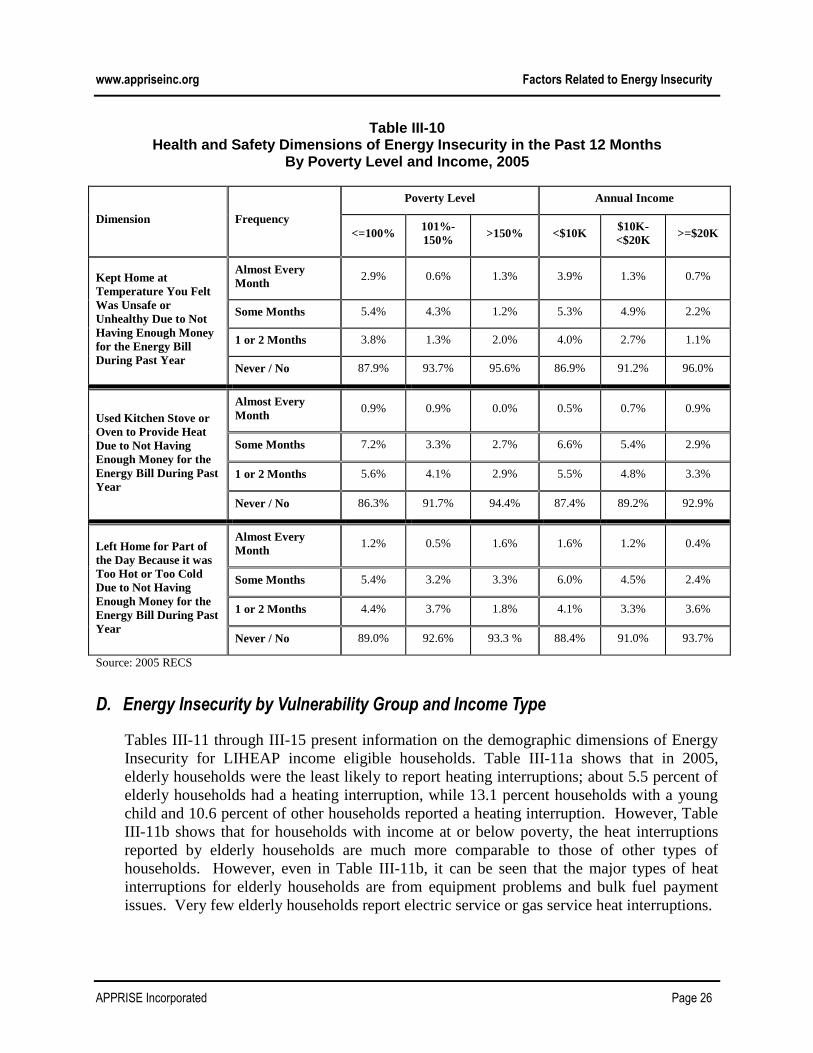
www.appriseinc.org Factors Related to Energy Insecurity
APPRISE Incorporated Page 26
Table III-10 Health and Safety Dimensions of Energy Insecurity in the Past 12 Months
By Poverty Level and Income, 2005
Dimension Frequency
Poverty Level Annual Income
<=100% 101%-
150% >150% <$10K
$10K-
<$20K >=$20K
Kept Home at
Temperature You Felt
Was Unsafe or
Unhealthy Due to Not
Having Enough Money
for the Energy Bill
During Past Year
Almost Every
Month 2.9% 0.6% 1.3% 3.9% 1.3% 0.7%
Some Months 5.4% 4.3% 1.2% 5.3% 4.9% 2.2%
1 or 2 Months 3.8% 1.3% 2.0% 4.0% 2.7% 1.1%
Never / No 87.9% 93.7% 95.6% 86.9% 91.2% 96.0%
Used Kitchen Stove or
Oven to Provide Heat
Due to Not Having
Enough Money for the
Energy Bill During Past
Year
Almost Every
Month 0.9% 0.9% 0.0% 0.5% 0.7% 0.9%
Some Months 7.2% 3.3% 2.7% 6.6% 5.4% 2.9%
1 or 2 Months 5.6% 4.1% 2.9% 5.5% 4.8% 3.3%
Never / No 86.3% 91.7% 94.4% 87.4% 89.2% 92.9%
Left Home for Part of
the Day Because it was
Too Hot or Too Cold
Due to Not Having
Enough Money for the
Energy Bill During Past
Year
Almost Every
Month 1.2% 0.5% 1.6% 1.6% 1.2% 0.4%
Some Months 5.4% 3.2% 3.3% 6.0% 4.5% 2.4%
1 or 2 Months 4.4% 3.7% 1.8% 4.1% 3.3% 3.6%
Never / No 89.0% 92.6% 93.3 % 88.4% 91.0% 93.7%
Source: 2005 RECS
D. Energy Insecurity by Vulnerability Group and Income Type
Tables III-11 through III-15 present information on the demographic dimensions of Energy
Insecurity for LIHEAP income eligible households. Table III-11a shows that in 2005,
elderly households were the least likely to report heating interruptions; about 5.5 percent of
elderly households had a heating interruption, while 13.1 percent households with a young
child and 10.6 percent of other households reported a heating interruption. However, Table
III-11b shows that for households with income at or below poverty, the heat interruptions
reported by elderly households are much more comparable to those of other types of
households. However, even in Table III-11b, it can be seen that the major types of heat
interruptions for elderly households are from equipment problems and bulk fuel payment
issues. Very few elderly households report electric service or gas service heat interruptions.

www.appriseinc.org Factors Related to Energy Insecurity
APPRISE Incorporated Page 27
Table III-11a Heat Interruption: Inability to Use the Main Source of Heat in the Past 12 Months
By Vulnerability Group and Income Type, 2005 All LIHEAP Income Eligible Households
Reason for Heat Interruption
Vulnerability Group Income Type
Young
Child Elderly Other Employed Retired
Cash
Assistance
or Other
Unable to pay for the repair of
broken heating system 6.1% 4.2% 3.9% 4.1% 3.6% 7.4%
Unable to pay for bulk fuel
delivery 5.7% 4.4% 6.5% 5.9% 4.0% 6.6%
Unable to pay for electric
service 7.3% 1.7% 6.1% 5.6% 2.2% 6.0%
Unable to pay for gas service 6.2% 0.5% 5.4% 4.6% 0.9% 6.1%
Heat Interruption due to any
of the four reasons 13.1% 5.5% 10.6% 10.0% 5.2% 13.3%
Source: 2005 RECS
Table III-11b
Heat Interruption: Inability to Use the Main Source of Heat in the Past 12 Months By Vulnerability Group and Income Type, 2005
Households with Income at or Below the HHS Poverty Guidelines
Reason for Heat Interruption
Vulnerability Group Income Type
Young
Child Elderly Other Employed Retired
Cash
Assistance
or Other
Unable to pay for the repair of
broken heating system 6.1% 8.0% 5.1% 5.6% 6.5% 7.9%
Unable to pay for bulk fuel
delivery 1.3% 6.2% 11.0% 7.9% 7.5% 4.8%
Unable to pay for electric
service 7.3% 1.5% 10.4% 8.2% 3.4% 6.5%
Unable to pay for gas service 3.6% 0.0% 10.7% 7.1% 0.8% 5.6%
Heat Interruption due to any
of the four reasons 12.6% 9.2% 16.2% 14.1% 9.5% 14.4%
Source: 2005 RECS
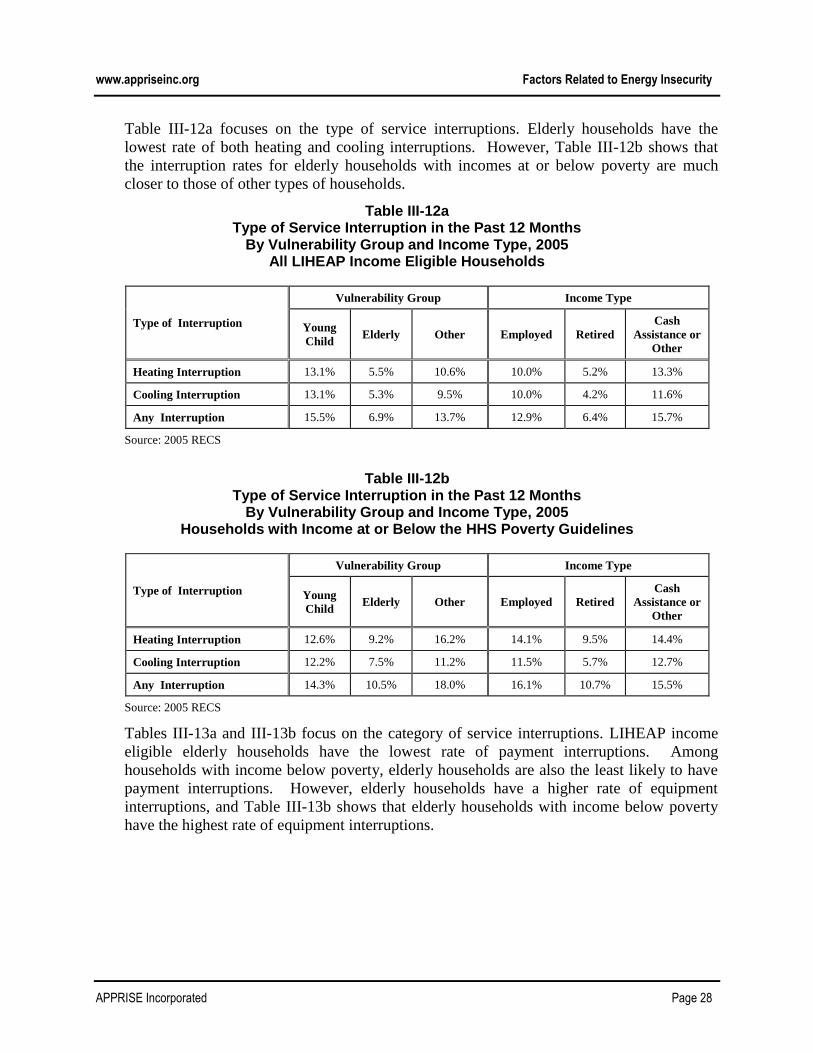
www.appriseinc.org Factors Related to Energy Insecurity
APPRISE Incorporated Page 28
Table III-12a focuses on the type of service interruptions. Elderly households have the
lowest rate of both heating and cooling interruptions. However, Table III-12b shows that
the interruption rates for elderly households with incomes at or below poverty are much
closer to those of other types of households.
Table III-12a Type of Service Interruption in the Past 12 Months
By Vulnerability Group and Income Type, 2005 All LIHEAP Income Eligible Households
Type of Interruption
Vulnerability Group Income Type
Young
Child Elderly Other Employed Retired
Cash
Assistance or
Other
Heating Interruption 13.1% 5.5% 10.6% 10.0% 5.2% 13.3%
Cooling Interruption 13.1% 5.3% 9.5% 10.0% 4.2% 11.6%
Any Interruption 15.5% 6.9% 13.7% 12.9% 6.4% 15.7%
Source: 2005 RECS
Table III-12b Type of Service Interruption in the Past 12 Months
By Vulnerability Group and Income Type, 2005 Households with Income at or Below the HHS Poverty Guidelines
Type of Interruption
Vulnerability Group Income Type
Young
Child Elderly Other Employed Retired
Cash
Assistance or
Other
Heating Interruption 12.6% 9.2% 16.2% 14.1% 9.5% 14.4%
Cooling Interruption 12.2% 7.5% 11.2% 11.5% 5.7% 12.7%
Any Interruption 14.3% 10.5% 18.0% 16.1% 10.7% 15.5%
Source: 2005 RECS
Tables III-13a and III-13b focus on the category of service interruptions. LIHEAP income
eligible elderly households have the lowest rate of payment interruptions. Among
households with income below poverty, elderly households are also the least likely to have
payment interruptions. However, elderly households have a higher rate of equipment
interruptions, and Table III-13b shows that elderly households with income below poverty
have the highest rate of equipment interruptions.
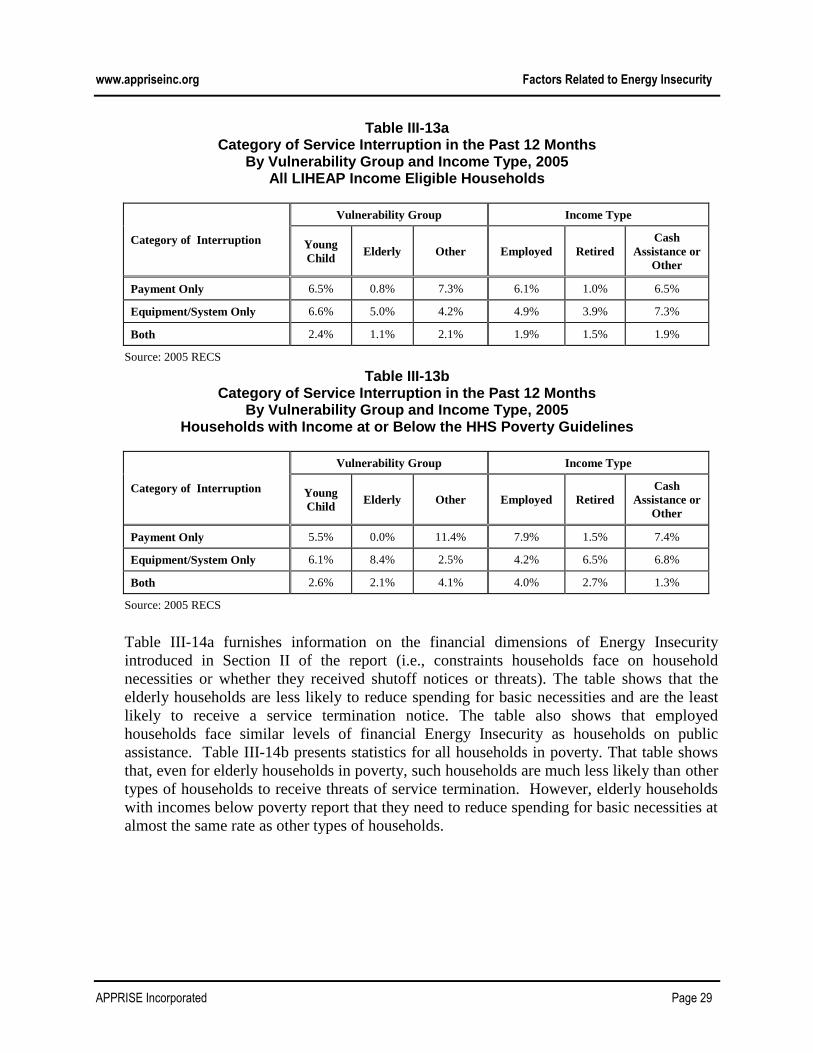
www.appriseinc.org Factors Related to Energy Insecurity
APPRISE Incorporated Page 29
Table III-13a Category of Service Interruption in the Past 12 Months
By Vulnerability Group and Income Type, 2005 All LIHEAP Income Eligible Households
Category of Interruption
Vulnerability Group Income Type
Young
Child Elderly Other Employed Retired
Cash
Assistance or
Other
Payment Only 6.5% 0.8% 7.3% 6.1% 1.0% 6.5%
Equipment/System Only 6.6% 5.0% 4.2% 4.9% 3.9% 7.3%
Both 2.4% 1.1% 2.1% 1.9% 1.5% 1.9%
Source: 2005 RECS
Table III-13b Category of Service Interruption in the Past 12 Months
By Vulnerability Group and Income Type, 2005 Households with Income at or Below the HHS Poverty Guidelines
Category of Interruption
Vulnerability Group Income Type
Young
Child Elderly Other Employed Retired
Cash
Assistance or
Other
Payment Only 5.5% 0.0% 11.4% 7.9% 1.5% 7.4%
Equipment/System Only 6.1% 8.4% 2.5% 4.2% 6.5% 6.8%
Both 2.6% 2.1% 4.1% 4.0% 2.7% 1.3%
Source: 2005 RECS
Table III-14a furnishes information on the financial dimensions of Energy Insecurity
introduced in Section II of the report (i.e., constraints households face on household
necessities or whether they received shutoff notices or threats). The table shows that the
elderly households are less likely to reduce spending for basic necessities and are the least
likely to receive a service termination notice. The table also shows that employed
households face similar levels of financial Energy Insecurity as households on public
assistance. Table III-14b presents statistics for all households in poverty. That table shows
that, even for elderly households in poverty, such households are much less likely than other
types of households to receive threats of service termination. However, elderly households
with incomes below poverty report that they need to reduce spending for basic necessities at
almost the same rate as other types of households.
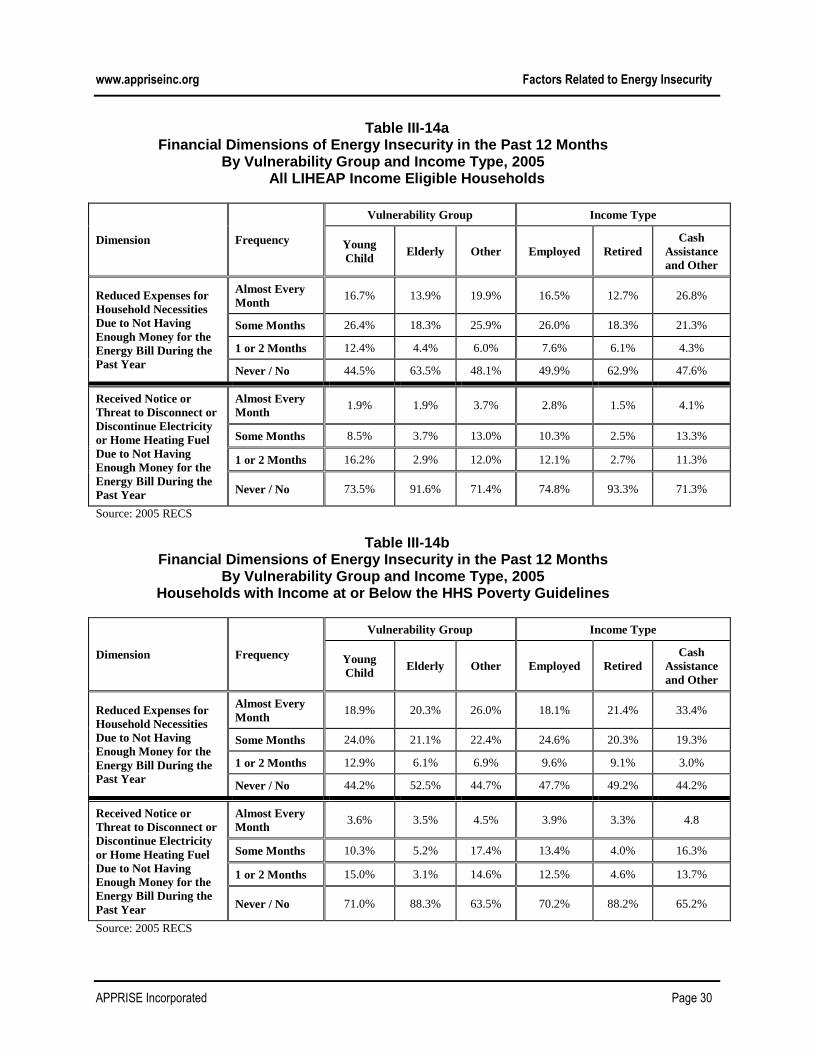
www.appriseinc.org Factors Related to Energy Insecurity
APPRISE Incorporated Page 30
Table III-14a Financial Dimensions of Energy Insecurity in the Past 12 Months
By Vulnerability Group and Income Type, 2005 All LIHEAP Income Eligible Households
Dimension Frequency
Vulnerability Group Income Type
Young
Child Elderly Other Employed Retired
Cash
Assistance
and Other
Reduced Expenses for
Household Necessities
Due to Not Having
Enough Money for the
Energy Bill During the
Past Year
Almost Every
Month 16.7% 13.9% 19.9% 16.5% 12.7% 26.8%
Some Months 26.4% 18.3% 25.9% 26.0% 18.3% 21.3%
1 or 2 Months 12.4% 4.4% 6.0% 7.6% 6.1% 4.3%
Never / No 44.5% 63.5% 48.1% 49.9% 62.9% 47.6%
Received Notice or
Threat to Disconnect or
Discontinue Electricity
or Home Heating Fuel
Due to Not Having
Enough Money for the
Energy Bill During the
Past Year
Almost Every
Month 1.9% 1.9% 3.7% 2.8% 1.5% 4.1%
Some Months 8.5% 3.7% 13.0% 10.3% 2.5% 13.3%
1 or 2 Months 16.2% 2.9% 12.0% 12.1% 2.7% 11.3%
Never / No 73.5% 91.6% 71.4% 74.8% 93.3% 71.3%
Source: 2005 RECS
Table III-14b Financial Dimensions of Energy Insecurity in the Past 12 Months
By Vulnerability Group and Income Type, 2005 Households with Income at or Below the HHS Poverty Guidelines
Dimension Frequency
Vulnerability Group Income Type
Young
Child Elderly Other Employed Retired
Cash
Assistance
and Other
Reduced Expenses for
Household Necessities
Due to Not Having
Enough Money for the
Energy Bill During the
Past Year
Almost Every
Month 18.9% 20.3% 26.0% 18.1% 21.4% 33.4%
Some Months 24.0% 21.1% 22.4% 24.6% 20.3% 19.3%
1 or 2 Months 12.9% 6.1% 6.9% 9.6% 9.1% 3.0%
Never / No 44.2% 52.5% 44.7% 47.7% 49.2% 44.2%
Received Notice or
Threat to Disconnect or
Discontinue Electricity
or Home Heating Fuel
Due to Not Having
Enough Money for the
Energy Bill During the
Past Year
Almost Every
Month 3.6% 3.5% 4.5% 3.9% 3.3% 4.8
Some Months 10.3% 5.2% 17.4% 13.4% 4.0% 16.3%
1 or 2 Months 15.0% 3.1% 14.6% 12.5% 4.6% 13.7%
Never / No 71.0% 88.3% 63.5% 70.2% 88.2% 65.2%
Source: 2005 RECS
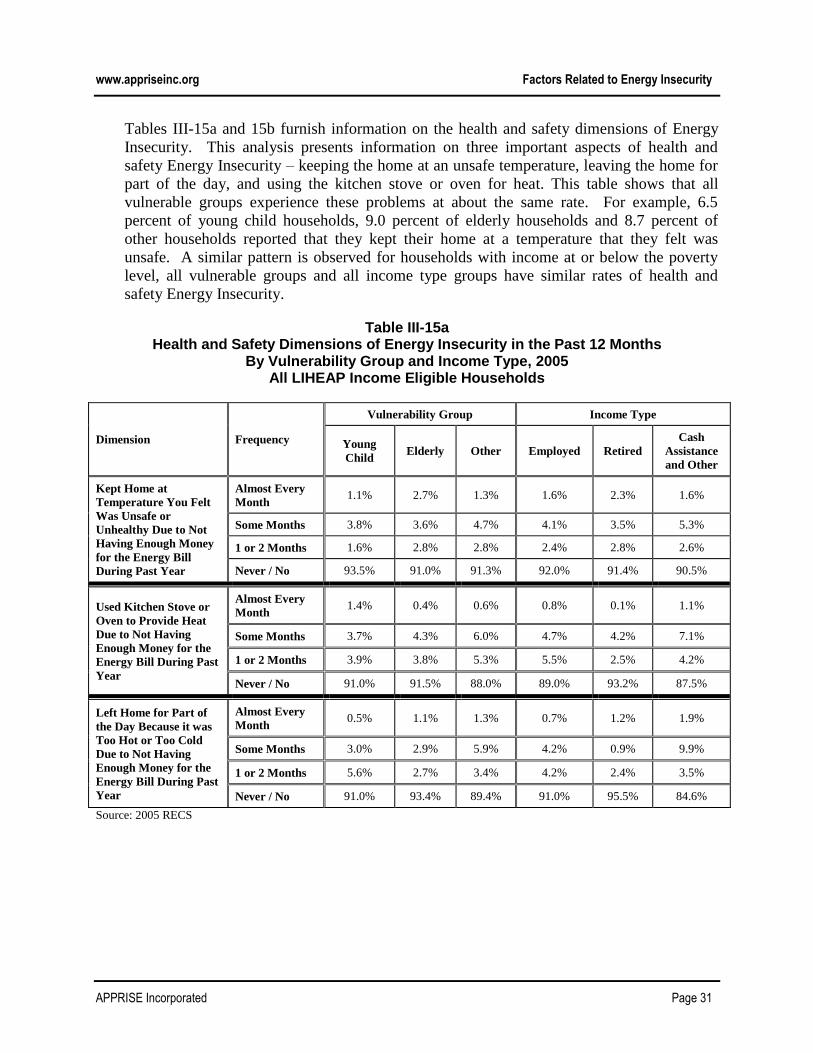
www.appriseinc.org Factors Related to Energy Insecurity
APPRISE Incorporated Page 31
Tables III-15a and 15b furnish information on the health and safety dimensions of Energy
Insecurity. This analysis presents information on three important aspects of health and
safety Energy Insecurity – keeping the home at an unsafe temperature, leaving the home for
part of the day, and using the kitchen stove or oven for heat. This table shows that all
vulnerable groups experience these problems at about the same rate. For example, 6.5
percent of young child households, 9.0 percent of elderly households and 8.7 percent of
other households reported that they kept their home at a temperature that they felt was
unsafe. A similar pattern is observed for households with income at or below the poverty
level, all vulnerable groups and all income type groups have similar rates of health and
safety Energy Insecurity.
Table III-15a Health and Safety Dimensions of Energy Insecurity in the Past 12 Months
By Vulnerability Group and Income Type, 2005 All LIHEAP Income Eligible Households
Dimension Frequency
Vulnerability Group Income Type
Young
Child Elderly Other Employed Retired
Cash
Assistance
and Other
Kept Home at
Temperature You Felt
Was Unsafe or
Unhealthy Due to Not
Having Enough Money
for the Energy Bill
During Past Year
Almost Every
Month 1.1% 2.7% 1.3% 1.6% 2.3% 1.6%
Some Months 3.8% 3.6% 4.7% 4.1% 3.5% 5.3%
1 or 2 Months 1.6% 2.8% 2.8% 2.4% 2.8% 2.6%
Never / No 93.5% 91.0% 91.3% 92.0% 91.4% 90.5%
Used Kitchen Stove or
Oven to Provide Heat
Due to Not Having
Enough Money for the
Energy Bill During Past
Year
Almost Every
Month 1.4% 0.4% 0.6% 0.8% 0.1% 1.1%
Some Months 3.7% 4.3% 6.0% 4.7% 4.2% 7.1%
1 or 2 Months 3.9% 3.8% 5.3% 5.5% 2.5% 4.2%
Never / No 91.0% 91.5% 88.0% 89.0% 93.2% 87.5%
Left Home for Part of
the Day Because it was
Too Hot or Too Cold
Due to Not Having
Enough Money for the
Energy Bill During Past
Year
Almost Every
Month 0.5% 1.1% 1.3% 0.7% 1.2% 1.9%
Some Months 3.0% 2.9% 5.9% 4.2% 0.9% 9.9%
1 or 2 Months 5.6% 2.7% 3.4% 4.2% 2.4% 3.5%
Never / No 91.0% 93.4% 89.4% 91.0% 95.5% 84.6%
Source: 2005 RECS
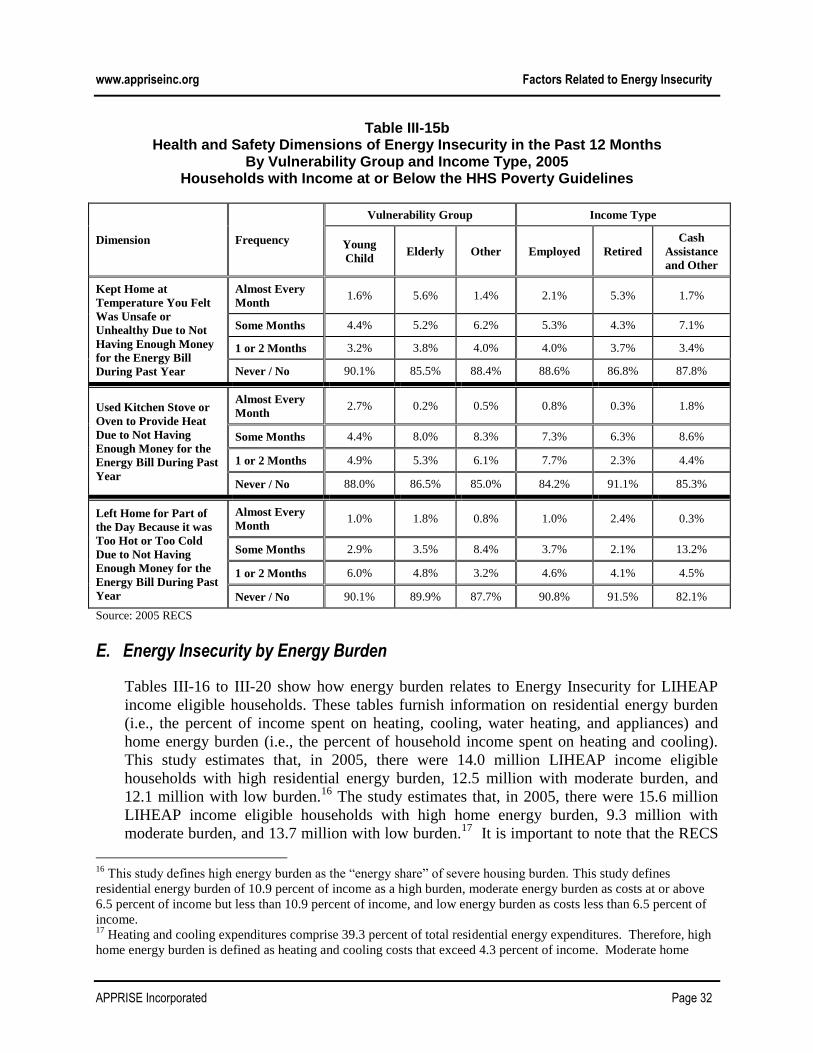
www.appriseinc.org Factors Related to Energy Insecurity
APPRISE Incorporated Page 32
Table III-15b Health and Safety Dimensions of Energy Insecurity in the Past 12 Months
By Vulnerability Group and Income Type, 2005 Households with Income at or Below the HHS Poverty Guidelines
Dimension Frequency
Vulnerability Group Income Type
Young
Child Elderly Other Employed Retired
Cash
Assistance
and Other
Kept Home at
Temperature You Felt
Was Unsafe or
Unhealthy Due to Not
Having Enough Money
for the Energy Bill
During Past Year
Almost Every
Month 1.6% 5.6% 1.4% 2.1% 5.3% 1.7%
Some Months 4.4% 5.2% 6.2% 5.3% 4.3% 7.1%
1 or 2 Months 3.2% 3.8% 4.0% 4.0% 3.7% 3.4%
Never / No 90.1% 85.5% 88.4% 88.6% 86.8% 87.8%
Used Kitchen Stove or
Oven to Provide Heat
Due to Not Having
Enough Money for the
Energy Bill During Past
Year
Almost Every
Month 2.7% 0.2% 0.5% 0.8% 0.3% 1.8%
Some Months 4.4% 8.0% 8.3% 7.3% 6.3% 8.6%
1 or 2 Months 4.9% 5.3% 6.1% 7.7% 2.3% 4.4%
Never / No 88.0% 86.5% 85.0% 84.2% 91.1% 85.3%
Left Home for Part of
the Day Because it was
Too Hot or Too Cold
Due to Not Having
Enough Money for the
Energy Bill During Past
Year
Almost Every
Month 1.0% 1.8% 0.8% 1.0% 2.4% 0.3%
Some Months 2.9% 3.5% 8.4% 3.7% 2.1% 13.2%
1 or 2 Months 6.0% 4.8% 3.2% 4.6% 4.1% 4.5%
Never / No 90.1% 89.9% 87.7% 90.8% 91.5% 82.1%
Source: 2005 RECS
E. Energy Insecurity by Energy Burden
Tables III-16 to III-20 show how energy burden relates to Energy Insecurity for LIHEAP
income eligible households. These tables furnish information on residential energy burden
(i.e., the percent of income spent on heating, cooling, water heating, and appliances) and
home energy burden (i.e., the percent of household income spent on heating and cooling).
This study estimates that, in 2005, there were 14.0 million LIHEAP income eligible
households with high residential energy burden, 12.5 million with moderate burden, and
12.1 million with low burden.16
The study estimates that, in 2005, there were 15.6 million
LIHEAP income eligible households with high home energy burden, 9.3 million with
moderate burden, and 13.7 million with low burden.17
It is important to note that the RECS
16
This study defines high energy burden as the “energy share” of severe housing burden. This study defines
residential energy burden of 10.9 percent of income as a high burden, moderate energy burden as costs at or above
6.5 percent of income but less than 10.9 percent of income, and low energy burden as costs less than 6.5 percent of
income. 17
Heating and cooling expenditures comprise 39.3 percent of total residential energy expenditures. Therefore, high
home energy burden is defined as heating and cooling costs that exceed 4.3 percent of income. Moderate home

www.appriseinc.org Factors Related to Energy Insecurity
APPRISE Incorporated Page 33
uses regression analyses to provide estimates of the amounts of residential energy
expenditures going to various end uses, including home heating and cooling. Actual heating
and cooling expenditures may differ than those estimated by the RECS.
Table III-16 shows that in 2005, households with high residential energy burden were much
more likely to have a heat interruption than households with moderate or low burdens.
However, it appears that there is very little relationship between home energy burden and
heat interruptions. One reason that high residential energy burden is better associated with
heat interruptions compared to home energy burden may be the fact that if the household
cannot pay its whole energy bill, it will be without heat regardless of what portion of the
energy bill was for space heating.
Table III-16 Heat Interruption: Inability to Use the Main Source of Heat in the Past 12 Months
By Energy Burden, 2005
Reason for Heat Interruption Residential Energy Burden Home Energy Burden
High Moderate Low High Moderate Low
Unable to pay for the repair of
broken heating system 5.4% 3.8% 4.1% 3.9% 4.0% 5.4%
Unable to pay for bulk fuel
delivery 4.6% 6.4% 5.6% 1.9% 8.5% 12.7%
Unable to pay for electric
service 6.9% 3.3% 3.7% 4.8% 4.2% 4.9%
Unable to pay for gas service 6.4% 3.2% 2.0% 6.3% 2.3% 1.8%
Heat Interruption due to any of
the four reasons 12.7% 7.4% 7.2% 9.8% 8.8% 9.0%
Source: 2005 RECS
Table III-17 focuses on the type of service interruptions. It shows that when all types of
service interruptions are considered, households with high residential burden are still more
likely to have heat interruptions. However, home energy burden is not correlated with
service interruptions, in part because high home energy burden households report the lowest
rate of cooling interruptions.
energy burden is defined as heating and cooling costs above 2.6 percent of income but less than 4.3 percent of
income.
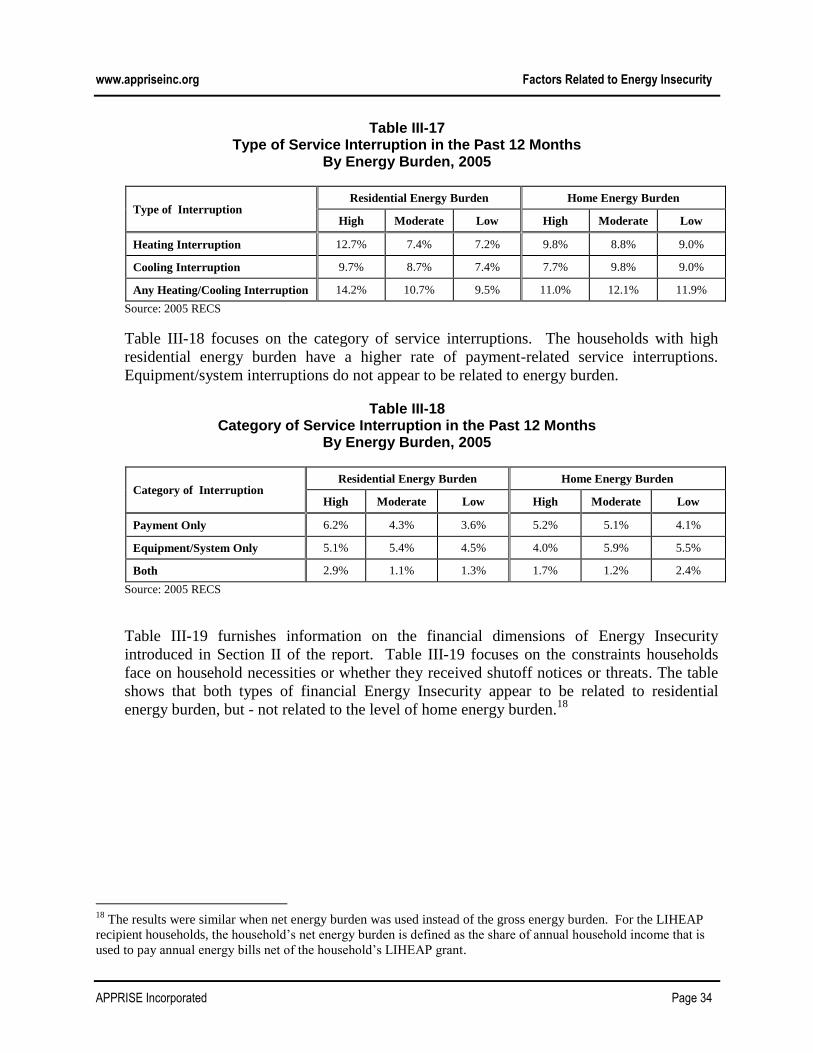
www.appriseinc.org Factors Related to Energy Insecurity
APPRISE Incorporated Page 34
Table III-17 Type of Service Interruption in the Past 12 Months
By Energy Burden, 2005
Type of Interruption Residential Energy Burden Home Energy Burden
High Moderate Low High Moderate Low
Heating Interruption 12.7% 7.4% 7.2% 9.8% 8.8% 9.0%
Cooling Interruption 9.7% 8.7% 7.4% 7.7% 9.8% 9.0%
Any Heating/Cooling Interruption 14.2% 10.7% 9.5% 11.0% 12.1% 11.9%
Source: 2005 RECS
Table III-18 focuses on the category of service interruptions. The households with high
residential energy burden have a higher rate of payment-related service interruptions.
Equipment/system interruptions do not appear to be related to energy burden.
Table III-18 Category of Service Interruption in the Past 12 Months
By Energy Burden, 2005
Category of Interruption Residential Energy Burden Home Energy Burden
High Moderate Low High Moderate Low
Payment Only 6.2% 4.3% 3.6% 5.2% 5.1% 4.1%
Equipment/System Only 5.1% 5.4% 4.5% 4.0% 5.9% 5.5%
Both 2.9% 1.1% 1.3% 1.7% 1.2% 2.4%
Source: 2005 RECS
Table III-19 furnishes information on the financial dimensions of Energy Insecurity
introduced in Section II of the report. Table III-19 focuses on the constraints households
face on household necessities or whether they received shutoff notices or threats. The table
shows that both types of financial Energy Insecurity appear to be related to residential
energy burden, but - not related to the level of home energy burden.18
18
The results were similar when net energy burden was used instead of the gross energy burden. For the LIHEAP
recipient households, the household’s net energy burden is defined as the share of annual household income that is
used to pay annual energy bills net of the household’s LIHEAP grant.
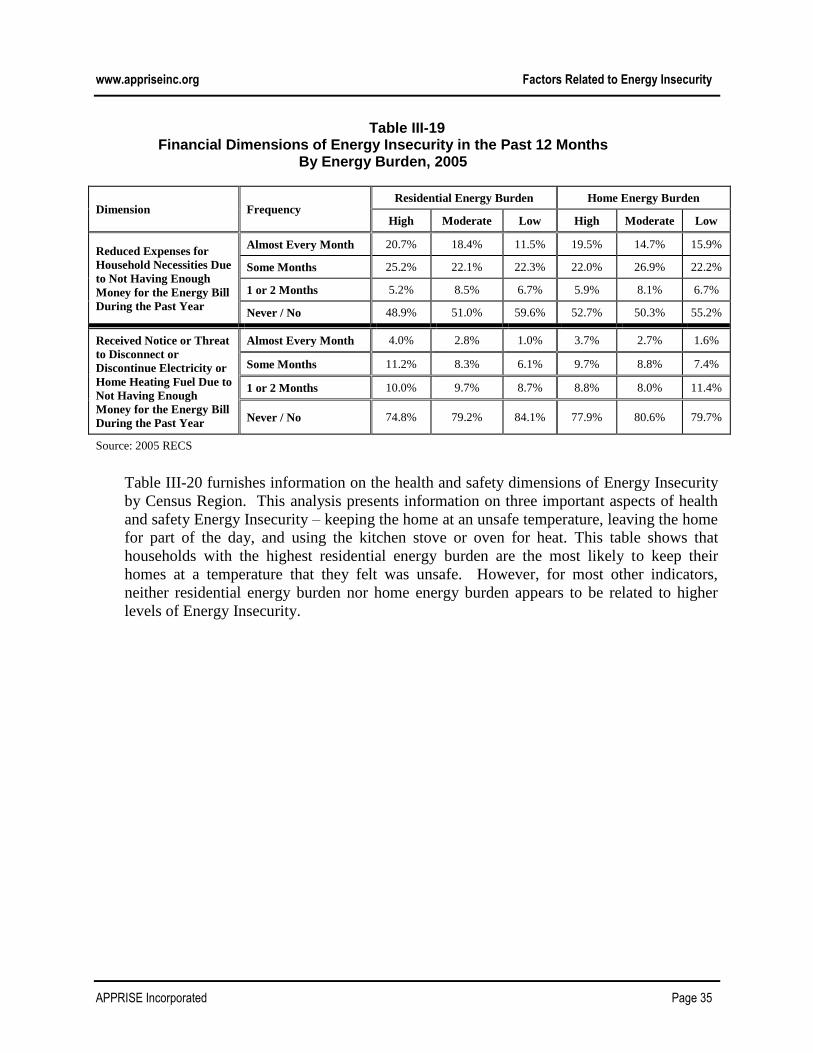
www.appriseinc.org Factors Related to Energy Insecurity
APPRISE Incorporated Page 35
Table III-19 Financial Dimensions of Energy Insecurity in the Past 12 Months
By Energy Burden, 2005
Dimension Frequency Residential Energy Burden Home Energy Burden
High Moderate Low High Moderate Low
Reduced Expenses for
Household Necessities Due
to Not Having Enough
Money for the Energy Bill
During the Past Year
Almost Every Month 20.7% 18.4% 11.5% 19.5% 14.7% 15.9%
Some Months 25.2% 22.1% 22.3% 22.0% 26.9% 22.2%
1 or 2 Months 5.2% 8.5% 6.7% 5.9% 8.1% 6.7%
Never / No 48.9% 51.0% 59.6% 52.7% 50.3% 55.2%
Received Notice or Threat
to Disconnect or
Discontinue Electricity or
Home Heating Fuel Due to
Not Having Enough
Money for the Energy Bill
During the Past Year
Almost Every Month 4.0% 2.8% 1.0% 3.7% 2.7% 1.6%
Some Months 11.2% 8.3% 6.1% 9.7% 8.8% 7.4%
1 or 2 Months 10.0% 9.7% 8.7% 8.8% 8.0% 11.4%
Never / No 74.8% 79.2% 84.1% 77.9% 80.6% 79.7%
Source: 2005 RECS
Table III-20 furnishes information on the health and safety dimensions of Energy Insecurity
by Census Region. This analysis presents information on three important aspects of health
and safety Energy Insecurity – keeping the home at an unsafe temperature, leaving the home
for part of the day, and using the kitchen stove or oven for heat. This table shows that
households with the highest residential energy burden are the most likely to keep their
homes at a temperature that they felt was unsafe. However, for most other indicators,
neither residential energy burden nor home energy burden appears to be related to higher
levels of Energy Insecurity.
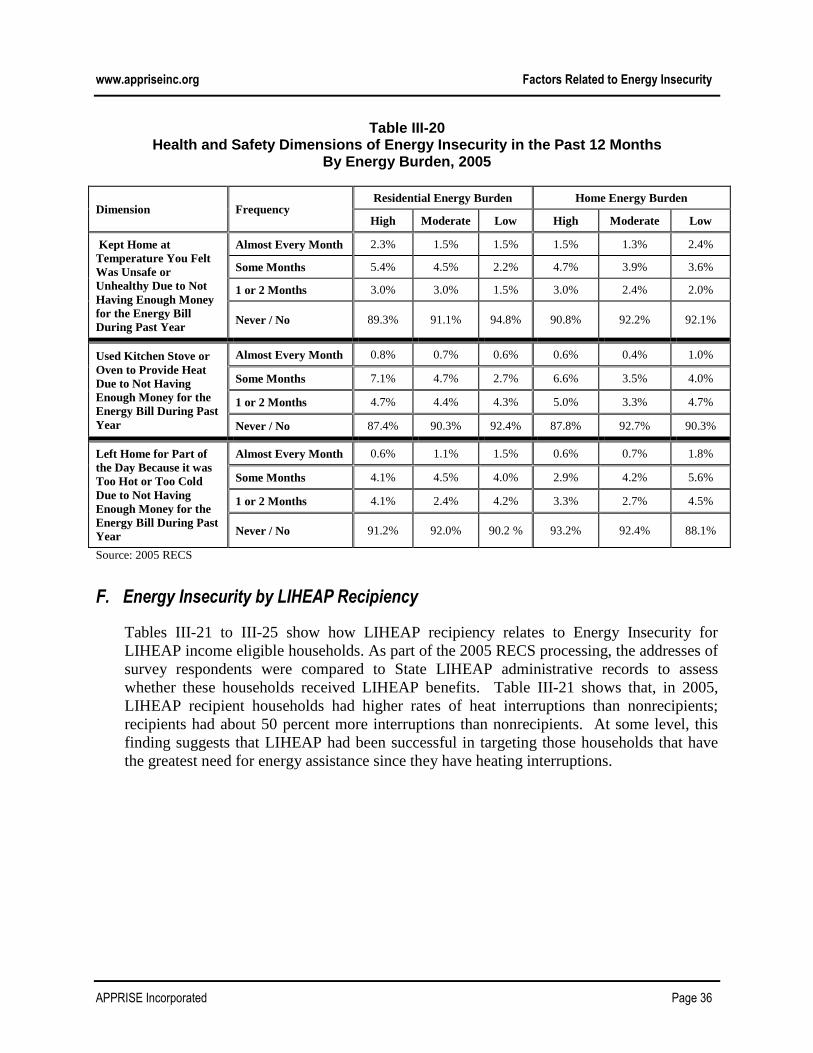
www.appriseinc.org Factors Related to Energy Insecurity
APPRISE Incorporated Page 36
Table III-20 Health and Safety Dimensions of Energy Insecurity in the Past 12 Months
By Energy Burden, 2005
Dimension Frequency Residential Energy Burden Home Energy Burden
High Moderate Low High Moderate Low
Kept Home at
Temperature You Felt
Was Unsafe or
Unhealthy Due to Not
Having Enough Money
for the Energy Bill
During Past Year
Almost Every Month 2.3% 1.5% 1.5% 1.5% 1.3% 2.4%
Some Months 5.4% 4.5% 2.2% 4.7% 3.9% 3.6%
1 or 2 Months 3.0% 3.0% 1.5% 3.0% 2.4% 2.0%
Never / No 89.3% 91.1% 94.8% 90.8% 92.2% 92.1%
Used Kitchen Stove or
Oven to Provide Heat
Due to Not Having
Enough Money for the
Energy Bill During Past
Year
Almost Every Month 0.8% 0.7% 0.6% 0.6% 0.4% 1.0%
Some Months 7.1% 4.7% 2.7% 6.6% 3.5% 4.0%
1 or 2 Months 4.7% 4.4% 4.3% 5.0% 3.3% 4.7%
Never / No 87.4% 90.3% 92.4% 87.8% 92.7% 90.3%
Left Home for Part of
the Day Because it was
Too Hot or Too Cold
Due to Not Having
Enough Money for the
Energy Bill During Past
Year
Almost Every Month 0.6% 1.1% 1.5% 0.6% 0.7% 1.8%
Some Months 4.1% 4.5% 4.0% 2.9% 4.2% 5.6%
1 or 2 Months 4.1% 2.4% 4.2% 3.3% 2.7% 4.5%
Never / No 91.2% 92.0% 90.2 % 93.2% 92.4% 88.1%
Source: 2005 RECS
F. Energy Insecurity by LIHEAP Recipiency
Tables III-21 to III-25 show how LIHEAP recipiency relates to Energy Insecurity for
LIHEAP income eligible households. As part of the 2005 RECS processing, the addresses of
survey respondents were compared to State LIHEAP administrative records to assess
whether these households received LIHEAP benefits. Table III-21 shows that, in 2005,
LIHEAP recipient households had higher rates of heat interruptions than nonrecipients;
recipients had about 50 percent more interruptions than nonrecipients. At some level, this
finding suggests that LIHEAP had been successful in targeting those households that have
the greatest need for energy assistance since they have heating interruptions.

www.appriseinc.org Factors Related to Energy Insecurity
APPRISE Incorporated Page 37
Table III-21 Heat Interruption: Inability to Use the Main Source of Heat in the Past 12 Months
By LIHEAP Recipiency, 2005
Reason for Heat Interruption LIHEAP Recipients LIHEAP Nonrecipients
Unable to pay for the repair of broken heating
system 6.8% 4.3%
Unable to pay for bulk fuel delivery 13.5% 4.7%
Unable to pay for electric service 6.1% 4.6%
Unable to pay for gas service 7.9% 3.4%
Heat Interruption due to any of the four reasons 13.6% 8.9%
Source: 2005 RECS
Table III-22 focuses on the type of service interruptions. It shows that when all types of
service interruptions are considered, LIHEAP recipient households are still more likely to
have heat interruptions; LIHEAP recipients have about 50 percent more heating
interruptions and about 25 percent more cooling interruptions.
Table III-22 Type of Service Interruption in the Past 12 Months
By LIHEAP Recipiency, 2005
Type of Interruption LIHEAP Recipients LIHEAP Nonrecipients
Heating Interruption 13.6% 8.9%
Cooling Interruption 10.8% 8.5%
Any Heating/Cooling Interruption 15.7% 11.3%
Source: 2005 RECS
Table III-23 focuses on the category of service interruptions. LIHEAP recipient households
have about 50 percent more payment interruptions than nonrecipients and about 25 percent
more equipment interruptions. LIHEAP recipients are also much more likely to have both
types of service interruptions.
Table III-23 Category of Service Interruption in the Past 12 Months
By LHEAP Recipiency, 2005
Category of Interruption LIHEAP Recipients LIHEAP Nonrecipients
Payment Only 6.8% 4.6%
Equipment/System Only 6.1% 4.9%
Both 2.8% 1.7%
Source: 2005 RECS
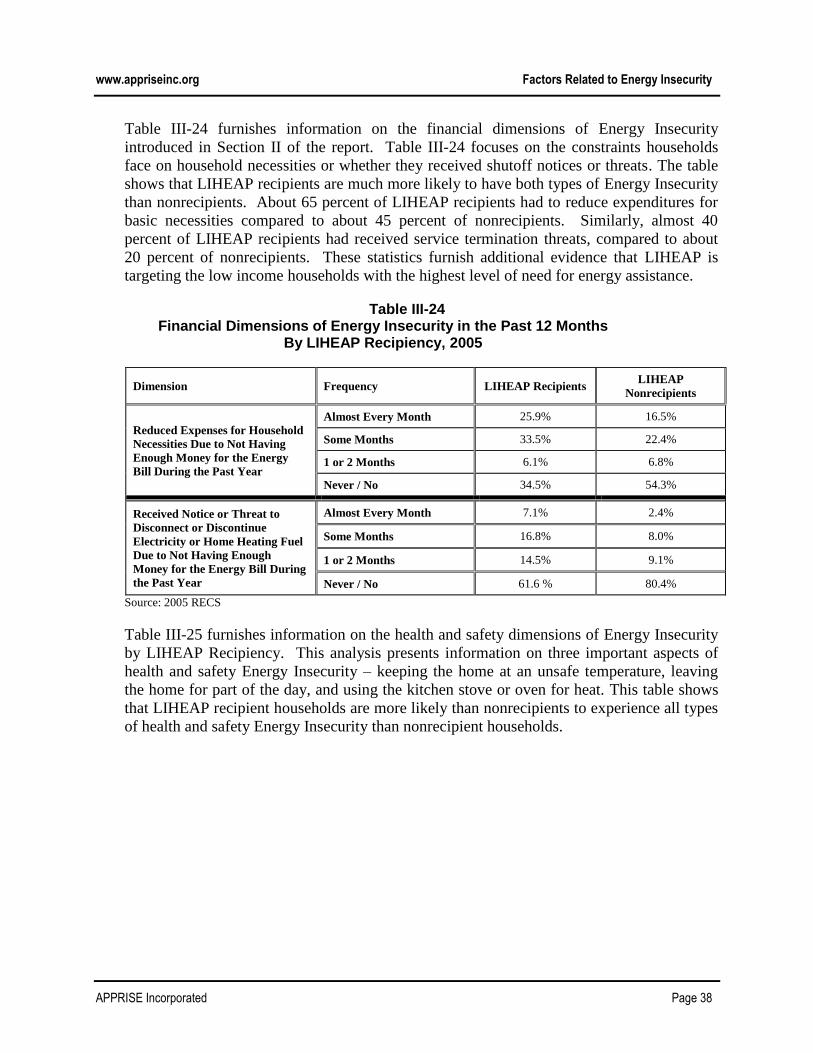
www.appriseinc.org Factors Related to Energy Insecurity
APPRISE Incorporated Page 38
Table III-24 furnishes information on the financial dimensions of Energy Insecurity
introduced in Section II of the report. Table III-24 focuses on the constraints households
face on household necessities or whether they received shutoff notices or threats. The table
shows that LIHEAP recipients are much more likely to have both types of Energy Insecurity
than nonrecipients. About 65 percent of LIHEAP recipients had to reduce expenditures for
basic necessities compared to about 45 percent of nonrecipients. Similarly, almost 40
percent of LIHEAP recipients had received service termination threats, compared to about
20 percent of nonrecipients. These statistics furnish additional evidence that LIHEAP is
targeting the low income households with the highest level of need for energy assistance.
Table III-24 Financial Dimensions of Energy Insecurity in the Past 12 Months
By LIHEAP Recipiency, 2005
Dimension Frequency LIHEAP Recipients LIHEAP
Nonrecipients
Reduced Expenses for Household
Necessities Due to Not Having
Enough Money for the Energy
Bill During the Past Year
Almost Every Month 25.9% 16.5%
Some Months 33.5% 22.4%
1 or 2 Months 6.1% 6.8%
Never / No 34.5% 54.3%
Received Notice or Threat to
Disconnect or Discontinue
Electricity or Home Heating Fuel
Due to Not Having Enough
Money for the Energy Bill During
the Past Year
Almost Every Month 7.1% 2.4%
Some Months 16.8% 8.0%
1 or 2 Months 14.5% 9.1%
Never / No 61.6 % 80.4%
Source: 2005 RECS
Table III-25 furnishes information on the health and safety dimensions of Energy Insecurity
by LIHEAP Recipiency. This analysis presents information on three important aspects of
health and safety Energy Insecurity – keeping the home at an unsafe temperature, leaving
the home for part of the day, and using the kitchen stove or oven for heat. This table shows
that LIHEAP recipient households are more likely than nonrecipients to experience all types
of health and safety Energy Insecurity than nonrecipient households.
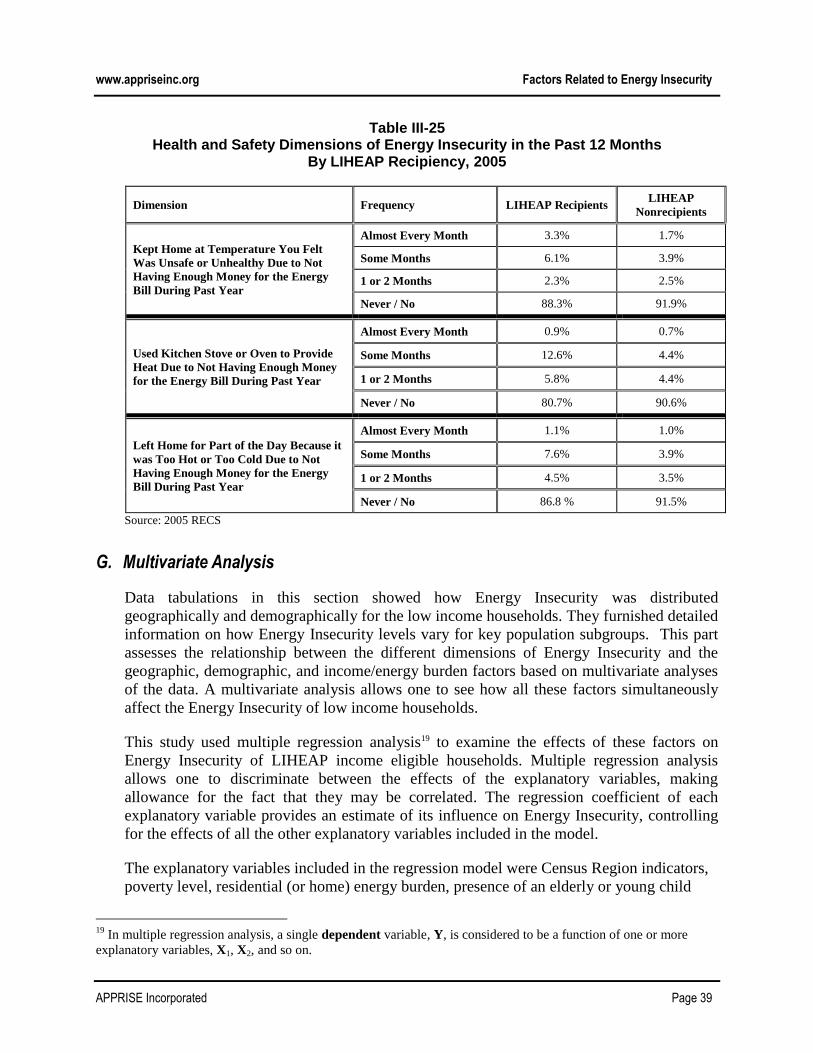
www.appriseinc.org Factors Related to Energy Insecurity
APPRISE Incorporated Page 39
Table III-25 Health and Safety Dimensions of Energy Insecurity in the Past 12 Months
By LIHEAP Recipiency, 2005
Dimension Frequency LIHEAP Recipients LIHEAP
Nonrecipients
Kept Home at Temperature You Felt
Was Unsafe or Unhealthy Due to Not
Having Enough Money for the Energy
Bill During Past Year
Almost Every Month 3.3% 1.7%
Some Months 6.1% 3.9%
1 or 2 Months 2.3% 2.5%
Never / No 88.3% 91.9%
Used Kitchen Stove or Oven to Provide
Heat Due to Not Having Enough Money
for the Energy Bill During Past Year
Almost Every Month 0.9% 0.7%
Some Months 12.6% 4.4%
1 or 2 Months 5.8% 4.4%
Never / No 80.7% 90.6%
Left Home for Part of the Day Because it
was Too Hot or Too Cold Due to Not
Having Enough Money for the Energy
Bill During Past Year
Almost Every Month 1.1% 1.0%
Some Months 7.6% 3.9%
1 or 2 Months 4.5% 3.5%
Never / No 86.8 % 91.5%
Source: 2005 RECS
G. Multivariate Analysis
Data tabulations in this section showed how Energy Insecurity was distributed
geographically and demographically for the low income households. They furnished detailed
information on how Energy Insecurity levels vary for key population subgroups. This part
assesses the relationship between the different dimensions of Energy Insecurity and the
geographic, demographic, and income/energy burden factors based on multivariate analyses
of the data. A multivariate analysis allows one to see how all these factors simultaneously
affect the Energy Insecurity of low income households.
This study used multiple regression analysis19 to examine the effects of these factors on
Energy Insecurity of LIHEAP income eligible households. Multiple regression analysis
allows one to discriminate between the effects of the explanatory variables, making
allowance for the fact that they may be correlated. The regression coefficient of each
explanatory variable provides an estimate of its influence on Energy Insecurity, controlling
for the effects of all the other explanatory variables included in the model.
The explanatory variables included in the regression model were Census Region indicators,
poverty level, residential (or home) energy burden, presence of an elderly or young child
19
In multiple regression analysis, a single dependent variable, Y, is considered to be a function of one or more
explanatory variables, X1, X2, and so on.
www.appriseinc.org Factors Related to Energy Insecurity
APPRISE Incorporated Page 40
member in the household, and whether the household uses bulk fuel. Although the overall
model was statistically significant, the amount of variation in various forms of Energy
Insecurity that can be explained by the regression model was low. That means that there is a
significant amount of variation in Energy Insecurity that cannot be explained by the
explanatory variables included in the model.
Key findings from the data tabulations in this section were:
Geography – Low income households in the South and West Census Regions were
more likely to experience service interruptions. Households in the Northeast were
less likely to have financial or health and safety Energy Insecurity.
Income – Lower household income was associated with a higher level of Energy
Insecurity.
Vulnerability – Elderly low income households experienced lower levels of service
interruptions and financial Energy Insecurity compared to other groups of vulnerable
households. However, all vulnerable households experienced health and safety
Energy Insecurity at about the same rate.
Energy Burden – Households with high residential energy burden experienced higher
levels of Energy Insecurity. The association between the level of home energy
burden and level of Energy Insecurity was weak.
LIHEAP Recipiency – LIHEAP recipient households had higher rates of service
interruptions and both financial and health and safety Energy Insecurity compared to
nonrecipient low income households.
The multivariate analysis of data confirmed the following findings from the tabular analysis:
Low income households in the South and West were likely to experience higher rates of
service interruptions and households in the Northeast were likely to have lower levels of
health and safety Energy Insecurity when poverty level, residential energy burden,
presence of an elderly or young child member in the household, and whether the
household uses bulk fuel were controlled for.
Lower household income was associated with a greater incidence of Energy Insecurity of
any type when other factors were controlled for.
High residential energy burden was associated with a greater incidence of Energy
Insecurity of any type when other factors were controlled for.
Elderly low income households experienced lower levels of service interruptions and
financial Energy Insecurity when other factors were controlled for.
The multivariate analysis of data showed the following differences:
www.appriseinc.org Factors Related to Energy Insecurity
APPRISE Incorporated Page 41
Low income households in different Census regions were likely to experience similar
rates of financial Energy Insecurity when other factors were controlled for.
Elderly low income households experienced lower levels of health and safety Energy
Insecurity when other factors were controlled for.
Key new findings from the multivariate analysis include:
Both the level of residential energy burden and household poverty level are strong factors
related to Energy Insecurity. However, high residential energy burden is a better predictor
of Energy Insecurity than household poverty level.
High home energy burden is also associated with higher levels of Energy Insecurity.
However, once household poverty level is controlled for, this association no longer
exists. This suggests that household poverty level is a better predictor of household
Energy Insecurity than home energy burden.
Most findings from the multivariate analyses were consistent with the findings from the tabular
analyses of the data. Therefore, the reader can rely on the results from the tabular analyses.
Multivariate analysis indicated that high residential energy burden is the strongest factor related
to Energy Insecurity of low income households compared to other factors included in the
analysis.

www.appriseinc.org Performance of the Home Energy Insecurity Scale
APPRISE Incorporated Page 42
IV. Performance of the Home Energy Insecurity Scale
This section of the report examines the Home Energy Insecurity Scale developed by Colton for
OCS in 2003. The scale was developed as a way to describe the overall status of households
with respect to Energy Insecurity. In this section, data from the 2005 RECS are used to compute
the Home Energy Insecurity Scale classifications of all LIHEAP income eligible households. In
addition, an alternative way to define the scale is proposed.
A. The 2005 RECS Home Energy Insecurity Scale
Colton originally developed the Home Energy Insecurity Scale in 2003 for OCS as a tool to
describe the home energy status of LIHEAP income-eligible households. 20
The Scale
combines information obtained from various Energy Insecurity questions into a single
measure that can characterize the energy needs of low income households. Based on
responses to these questions, households are placed in one of the five thresholds:
“A thriving household is one that has achieved generally accepted standards of well-
being. A thriving household can engage in the full range of home energy uses of its
choice without outside assistance and without financial strain.
A capable household is secure, even though not having achieved the full range of
generally accepted standards of well-being.
A stable household does not face significant threats and is unlikely to be in immediate
crisis. A stable household may on infrequent occasion need to engage in temporary or
inappropriate actions because it lacks money to pay its home energy bills, but it does not
do so regularly.
A vulnerable household is one that is not in immediate danger, but that may avoid this
danger only through temporary or inappropriate solutions. A vulnerable household may
occasionally face energy choices that require it to compromise not merely on comfort
and/or convenience, but on basic household energy needs such as heating and/or hot
water.
An in-crisis household faces immediate needs that threaten the household’s physical
and/or emotional safety. Three alternative conditions exist of which anyone might place
someone in the “in-crisis” threshold: (1) the household goes without energy; or (2) the
household has energy, but has to routinely compromise on its energy use for basic
20
Colton, R. (2003). “Measuring the Outcomes of Low-Income Energy Assistance Programs through a Home
Energy Insecurity Scale.” A Publication Prepared for: LIHEAP Committee on Managing for Results. U.S.
Department of Health and Human Services. Administration for Children and Families. Office of Community
Services, Division of Energy Assistance.

www.appriseinc.org Performance of the Home Energy Insecurity Scale
APPRISE Incorporated Page 43
household necessities; or (3) the household does not compromise on its energy use, but in
order to maintain that energy use, must compromise on non-energy basic necessities.”
The Home Energy Insecurity Scale was initially developed as a tool for caseworkers to
measure the impact of energy assistance programs on the home Energy Insecurity of low
income households. APPRISE subsequently collaborated with Colton and developed a
modified set of questions. The modified instrument can be used by interviewers, and allows
a systematic and automated assessment of Energy Insecurity based on survey responses.
The 2005 RECS questionnaire used this modified set of questions. The response patterns
used to classify households on the 2005 RECS Home Energy Insecurity Scale are given in
Table IV-1.
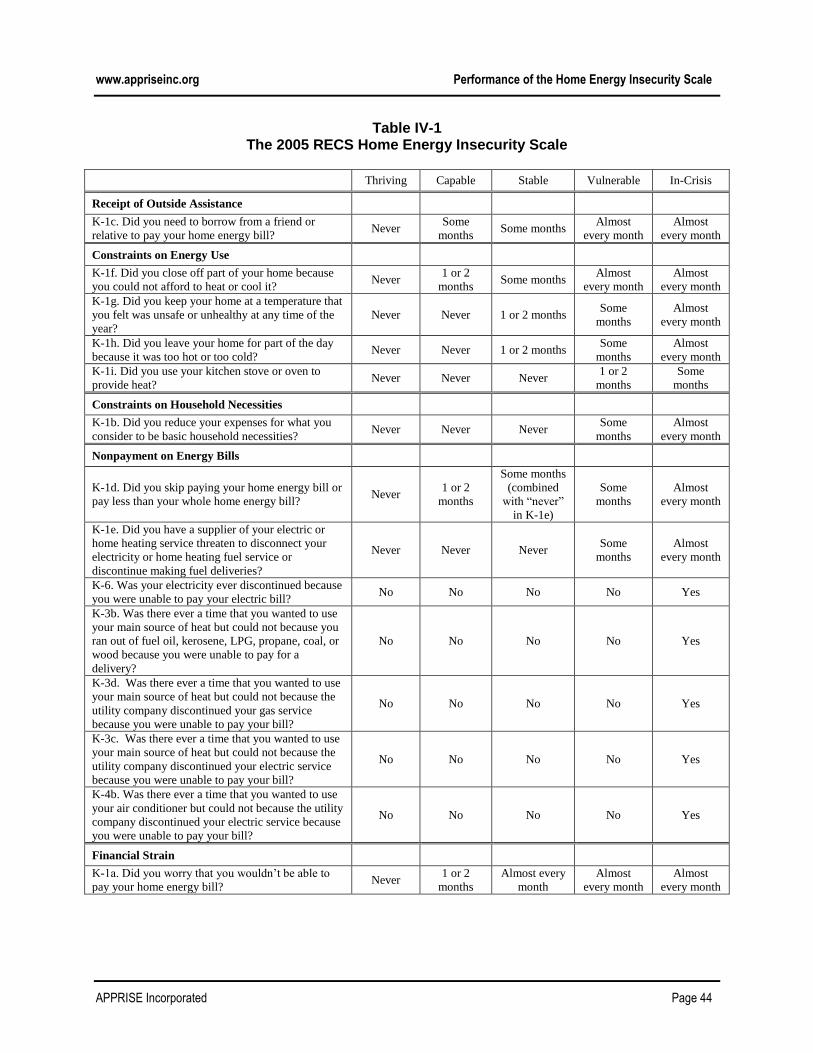
www.appriseinc.org Performance of the Home Energy Insecurity Scale
APPRISE Incorporated Page 44
Table IV-1 The 2005 RECS Home Energy Insecurity Scale
Thriving Capable Stable Vulnerable In-Crisis
Receipt of Outside Assistance
K-1c. Did you need to borrow from a friend or
relative to pay your home energy bill? Never
Some
months Some months
Almost
every month
Almost
every month
Constraints on Energy Use
K-1f. Did you close off part of your home because
you could not afford to heat or cool it? Never
1 or 2
months Some months
Almost
every month
Almost
every month
K-1g. Did you keep your home at a temperature that
you felt was unsafe or unhealthy at any time of the
year?
Never Never 1 or 2 months Some
months
Almost
every month
K-1h. Did you leave your home for part of the day
because it was too hot or too cold? Never Never 1 or 2 months
Some
months
Almost
every month
K-1i. Did you use your kitchen stove or oven to
provide heat? Never Never Never
1 or 2
months
Some
months
Constraints on Household Necessities
K-1b. Did you reduce your expenses for what you
consider to be basic household necessities? Never Never Never
Some
months
Almost
every month
Nonpayment on Energy Bills
K-1d. Did you skip paying your home energy bill or
pay less than your whole home energy bill? Never
1 or 2
months
Some months
(combined
with “never”
in K-1e)
Some
months
Almost
every month
K-1e. Did you have a supplier of your electric or
home heating service threaten to disconnect your
electricity or home heating fuel service or
discontinue making fuel deliveries?
Never Never Never Some
months
Almost
every month
K-6. Was your electricity ever discontinued because
you were unable to pay your electric bill? No No No No Yes
K-3b. Was there ever a time that you wanted to use
your main source of heat but could not because you
ran out of fuel oil, kerosene, LPG, propane, coal, or
wood because you were unable to pay for a
delivery?
No No No No Yes
K-3d. Was there ever a time that you wanted to use
your main source of heat but could not because the
utility company discontinued your gas service
because you were unable to pay your bill?
No No No No Yes
K-3c. Was there ever a time that you wanted to use
your main source of heat but could not because the
utility company discontinued your electric service
because you were unable to pay your bill?
No No No No Yes
K-4b. Was there ever a time that you wanted to use
your air conditioner but could not because the utility
company discontinued your electric service because
you were unable to pay your bill?
No No No No Yes
Financial Strain
K-1a. Did you worry that you wouldn’t be able to
pay your home energy bill? Never
1 or 2
months
Almost every
month
Almost
every month
Almost
every month
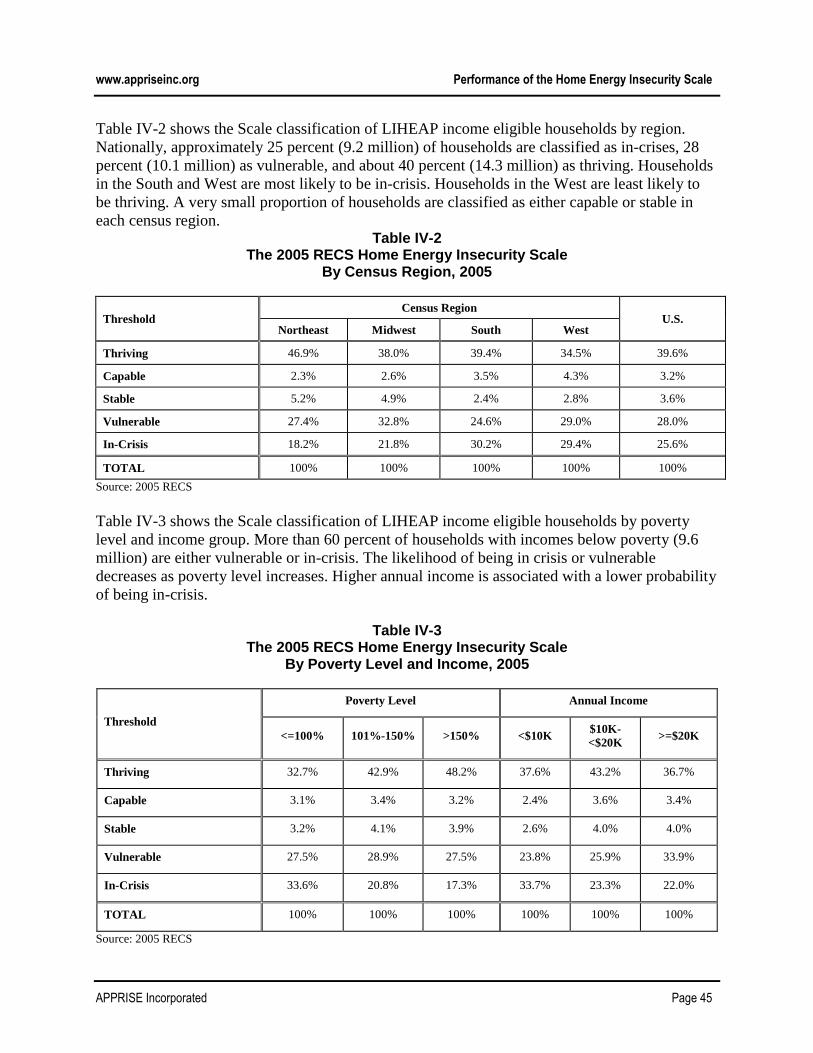
www.appriseinc.org Performance of the Home Energy Insecurity Scale
APPRISE Incorporated Page 45
Table IV-2 shows the Scale classification of LIHEAP income eligible households by region.
Nationally, approximately 25 percent (9.2 million) of households are classified as in-crises, 28
percent (10.1 million) as vulnerable, and about 40 percent (14.3 million) as thriving. Households
in the South and West are most likely to be in-crisis. Households in the West are least likely to
be thriving. A very small proportion of households are classified as either capable or stable in
each census region. Table IV-2
The 2005 RECS Home Energy Insecurity Scale By Census Region, 2005
Threshold Census Region
U.S. Northeast Midwest South West
Thriving 46.9% 38.0% 39.4% 34.5% 39.6%
Capable 2.3% 2.6% 3.5% 4.3% 3.2%
Stable 5.2% 4.9% 2.4% 2.8% 3.6%
Vulnerable 27.4% 32.8% 24.6% 29.0% 28.0%
In-Crisis 18.2% 21.8% 30.2% 29.4% 25.6%
TOTAL 100% 100% 100% 100% 100%
Source: 2005 RECS
Table IV-3 shows the Scale classification of LIHEAP income eligible households by poverty
level and income group. More than 60 percent of households with incomes below poverty (9.6
million) are either vulnerable or in-crisis. The likelihood of being in crisis or vulnerable
decreases as poverty level increases. Higher annual income is associated with a lower probability
of being in-crisis.
Table IV-3
The 2005 RECS Home Energy Insecurity Scale By Poverty Level and Income, 2005
Threshold
Poverty Level Annual Income
<=100% 101%-150% >150% <$10K $10K-
<$20K >=$20K
Thriving 32.7% 42.9% 48.2% 37.6% 43.2% 36.7%
Capable 3.1% 3.4% 3.2% 2.4% 3.6% 3.4%
Stable 3.2% 4.1% 3.9% 2.6% 4.0% 4.0%
Vulnerable 27.5% 28.9% 27.5% 23.8% 25.9% 33.9%
In-Crisis 33.6% 20.8% 17.3% 33.7% 23.3% 22.0%
TOTAL 100% 100% 100% 100% 100% 100%
Source: 2005 RECS
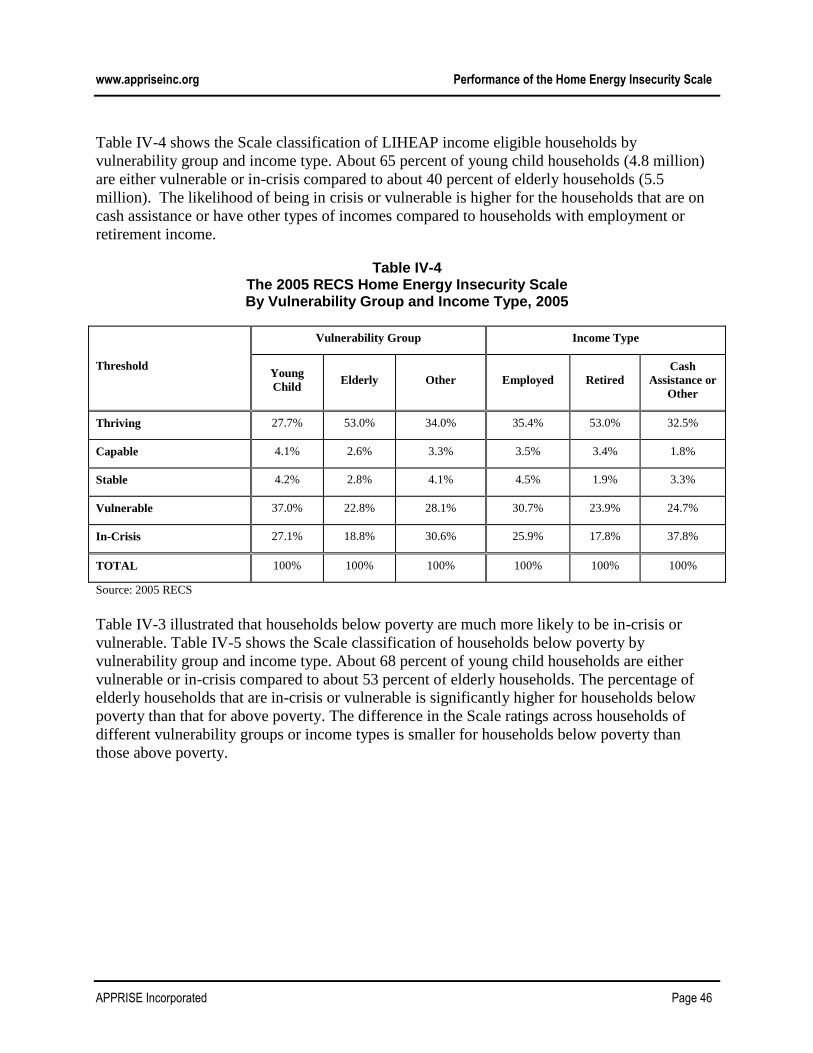
www.appriseinc.org Performance of the Home Energy Insecurity Scale
APPRISE Incorporated Page 46
Table IV-4 shows the Scale classification of LIHEAP income eligible households by
vulnerability group and income type. About 65 percent of young child households (4.8 million)
are either vulnerable or in-crisis compared to about 40 percent of elderly households (5.5
million). The likelihood of being in crisis or vulnerable is higher for the households that are on
cash assistance or have other types of incomes compared to households with employment or
retirement income.
Table IV-4 The 2005 RECS Home Energy Insecurity Scale By Vulnerability Group and Income Type, 2005
Threshold
Vulnerability Group Income Type
Young
Child Elderly Other Employed Retired
Cash
Assistance or
Other
Thriving 27.7% 53.0% 34.0% 35.4% 53.0% 32.5%
Capable 4.1% 2.6% 3.3% 3.5% 3.4% 1.8%
Stable 4.2% 2.8% 4.1% 4.5% 1.9% 3.3%
Vulnerable 37.0% 22.8% 28.1% 30.7% 23.9% 24.7%
In-Crisis 27.1% 18.8% 30.6% 25.9% 17.8% 37.8%
TOTAL 100% 100% 100% 100% 100% 100%
Source: 2005 RECS
Table IV-3 illustrated that households below poverty are much more likely to be in-crisis or
vulnerable. Table IV-5 shows the Scale classification of households below poverty by
vulnerability group and income type. About 68 percent of young child households are either
vulnerable or in-crisis compared to about 53 percent of elderly households. The percentage of
elderly households that are in-crisis or vulnerable is significantly higher for households below
poverty than that for above poverty. The difference in the Scale ratings across households of
different vulnerability groups or income types is smaller for households below poverty than
those above poverty.

www.appriseinc.org Performance of the Home Energy Insecurity Scale
APPRISE Incorporated Page 47
Table IV-5 The 2005 RECS Home Energy Insecurity Scale
By Vulnerability Group and Income Type for Households below Poverty, 2005
Threshold
Vulnerability Group Income Type
Young
Child Elderly Other Employed Retired
Cash
Assistance or
Other
Thriving 24.1% 42.7% 29.1% 29.8% 41.2% 29.2%
Capable 2.7% 3.4% 3.0% 3.5% 3.2% 2.0%
Stable 5.4% 1.1% 3.7% 4.8% 0.3% 3.0%
Vulnerable 37.6% 25.3% 23.7% 30.3% 26.3% 22.4%
In-Crisis 30.2% 27.5% 40.5% 31.8% 29.0% 43.5%
TOTAL 100% 100% 100% 100% 100% 100%
Source: 2005 RECS
Table IV-6 shows the Scale classification of LIHEAP income eligible households by residential
and home energy burden. Higher residential energy burden is associated with a worse Scale
threshold classification. The association of home energy burden and the Scale rating is weaker
than that for residential energy burden and the Scale.
Table IV-6 The 2005 RECS Home Energy Insecurity Scale
By Energy Burden, 2005
Threshold
Residential Energy Burden Home Energy Burden
High Moderate Low High Moderate Low
Thriving 35.5% 38.3% 45.7% 38.8% 39.5% 40.7%
Capable 2.8% 3.1% 3.8% 3.8% 2.6% 3.0%
Stable 3.5% 3.5% 3.8% 3.4% 4.3% 3.4%
Vulnerable 27.3% 30.2% 26.5% 25.9% 32.9% 27.0%
In-Crisis 31.0% 24.8% 20.2% 28.1% 20.7% 26.0%
TOTAL 100% 100% 100% 100% 100% 100%
Source: 2005 RECS
Table IV-7 shows the Scale classification of LIHEAP income eligible households by LIHEAP
status. Nearly 75 percent of LIHEAP recipient households are either vulnerable or in-crisis
compared to about 52 percent of LIHEAP nonrecipients. A very small percentage of LIHEAP
recipient or nonrecipient households are classified as either capable or stable.
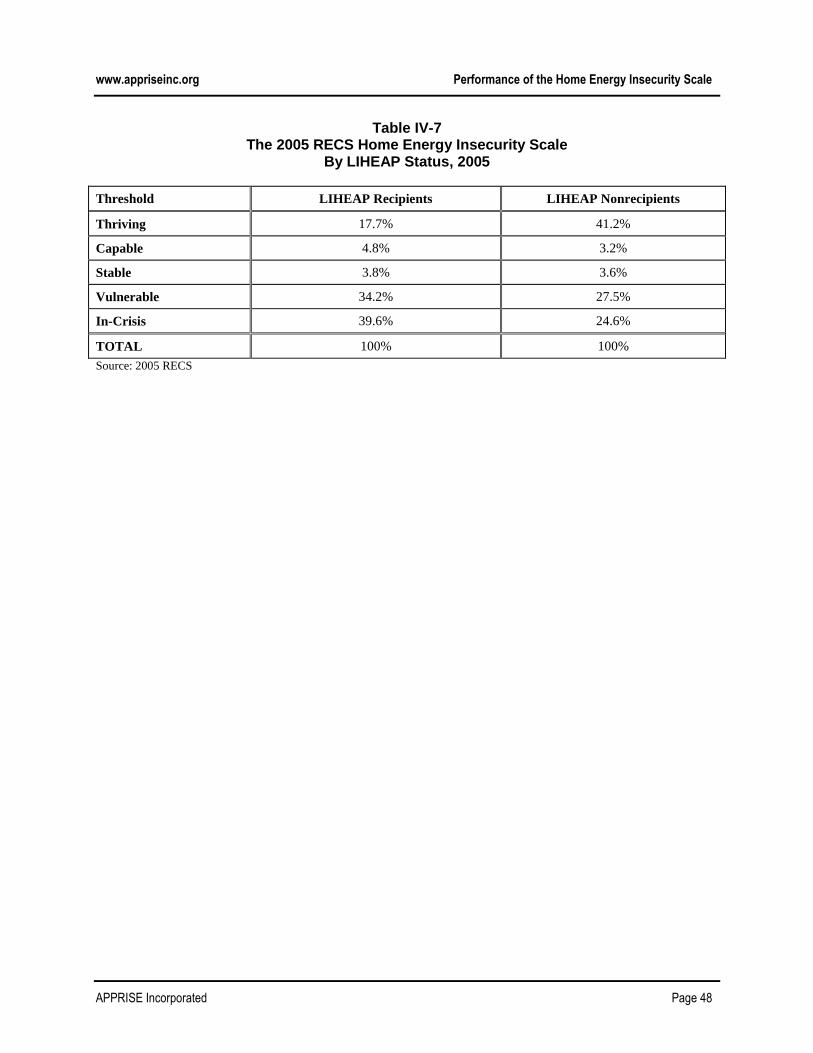
www.appriseinc.org Performance of the Home Energy Insecurity Scale
APPRISE Incorporated Page 48
Table IV-7 The 2005 RECS Home Energy Insecurity Scale
By LIHEAP Status, 2005
Threshold LIHEAP Recipients LIHEAP Nonrecipients
Thriving 17.7% 41.2%
Capable 4.8% 3.2%
Stable 3.8% 3.6%
Vulnerable 34.2% 27.5%
In-Crisis 39.6% 24.6%
TOTAL 100% 100%
Source: 2005 RECS
www.appriseinc.org Performance of the Home Energy Insecurity Scale
APPRISE Incorporated Page 49
B. The Alternative Home Energy Insecurity Scale
The Home Energy Insecurity Scale is a convenient way of combining information from the
Energy Insecurity questions into one measure that characterizes the needs of the low income
population. After reviewing the categorization methodology on the Scale, an alternative
assignment procedure was tested to assess whether minor revisions to the categorization
procedures would change the distribution of households.
One problem associated with the version of the 2005 RECS Home Energy Insecurity Scale is
that it places a very small percentage of households that are not thriving into capable and stable
categories and pushes the rest into vulnerable or in-crisis categories. This makes it hard to
characterize the needs of low income households.
This study investigated the underlying factors that place households in vulnerable and in-crisis
status on the Scale and revised the classification of households based on the responses to the
following questions:
Did you need to borrow from a friend or relative to pay your home energy bill?
Did you close off part of your home because you could not afford to heat or cool it?
Did you worry that you wouldn’t be able to pay your home energy bill?
Did you have a supplier of your electric or home heating service threaten to disconnect
your electricity or home heating fuel service or discontinue making fuel deliveries?
Did you reduce your expenses for what you consider to be basic household necessities?
According to the new classification, a household can be capable it closes off part of home for
some months and stable if it does it for almost every month. The question about financial strain
is used only to separate thriving households from the rest. A household can still be stable if it
receives shutoff notice or threat for 1 or 2 months but does not actually experiences a shutoff.
The question about the reduction in expenditures on household necessities does not clearly
specify what these necessities are. About half of the RECS respondents said that they reduced
their expenditures on household necessities in order to pay for their energy bills. The Scale
places all of these households into either vulnerable or in-crisis categories. This study proposes a
different classification based on this question that moves some households into stable and
capable thresholds.
Moreover, the households that were identified to be LIHEAP recipients from the State
administrative records were classified to be capable instead of thriving on the Alternative Home
Energy Insecurity Scale even though these households answered each and every question on the
Scale as “never” or “no.”

www.appriseinc.org Performance of the Home Energy Insecurity Scale
APPRISE Incorporated Page 50
The response patterns used to classify households on the Alternative Home Energy Insecurity
Scale are given in Table IV-7. The changes from the 2005 RECS Home Energy Insecurity Scale
are highlighted in the table.
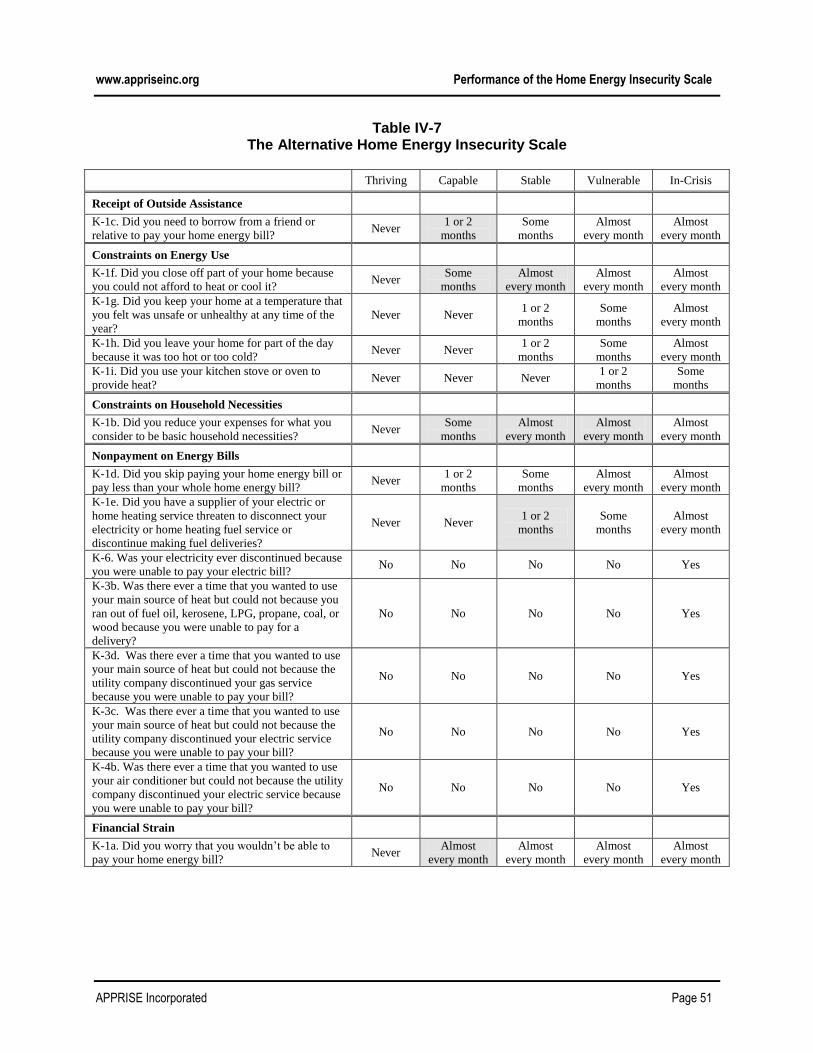
www.appriseinc.org Performance of the Home Energy Insecurity Scale
APPRISE Incorporated Page 51
Table IV-7 The Alternative Home Energy Insecurity Scale
Thriving Capable Stable Vulnerable In-Crisis
Receipt of Outside Assistance
K-1c. Did you need to borrow from a friend or
relative to pay your home energy bill? Never
1 or 2
months
Some
months
Almost
every month
Almost
every month
Constraints on Energy Use
K-1f. Did you close off part of your home because
you could not afford to heat or cool it? Never
Some
months
Almost
every month
Almost
every month
Almost
every month
K-1g. Did you keep your home at a temperature that
you felt was unsafe or unhealthy at any time of the
year?
Never Never 1 or 2
months
Some
months
Almost
every month
K-1h. Did you leave your home for part of the day
because it was too hot or too cold? Never Never
1 or 2
months
Some
months
Almost
every month
K-1i. Did you use your kitchen stove or oven to
provide heat? Never Never Never
1 or 2
months
Some
months
Constraints on Household Necessities
K-1b. Did you reduce your expenses for what you
consider to be basic household necessities? Never
Some
months
Almost
every month
Almost
every month
Almost
every month
Nonpayment on Energy Bills
K-1d. Did you skip paying your home energy bill or
pay less than your whole home energy bill? Never
1 or 2
months
Some
months
Almost
every month
Almost
every month
K-1e. Did you have a supplier of your electric or
home heating service threaten to disconnect your
electricity or home heating fuel service or
discontinue making fuel deliveries?
Never Never 1 or 2
months
Some
months
Almost
every month
K-6. Was your electricity ever discontinued because
you were unable to pay your electric bill? No No No No Yes
K-3b. Was there ever a time that you wanted to use
your main source of heat but could not because you
ran out of fuel oil, kerosene, LPG, propane, coal, or
wood because you were unable to pay for a
delivery?
No No No No Yes
K-3d. Was there ever a time that you wanted to use
your main source of heat but could not because the
utility company discontinued your gas service
because you were unable to pay your bill?
No No No No Yes
K-3c. Was there ever a time that you wanted to use
your main source of heat but could not because the
utility company discontinued your electric service
because you were unable to pay your bill?
No No No No Yes
K-4b. Was there ever a time that you wanted to use
your air conditioner but could not because the utility
company discontinued your electric service because
you were unable to pay your bill?
No No No No Yes
Financial Strain
K-1a. Did you worry that you wouldn’t be able to
pay your home energy bill? Never
Almost
every month
Almost
every month
Almost
every month
Almost
every month
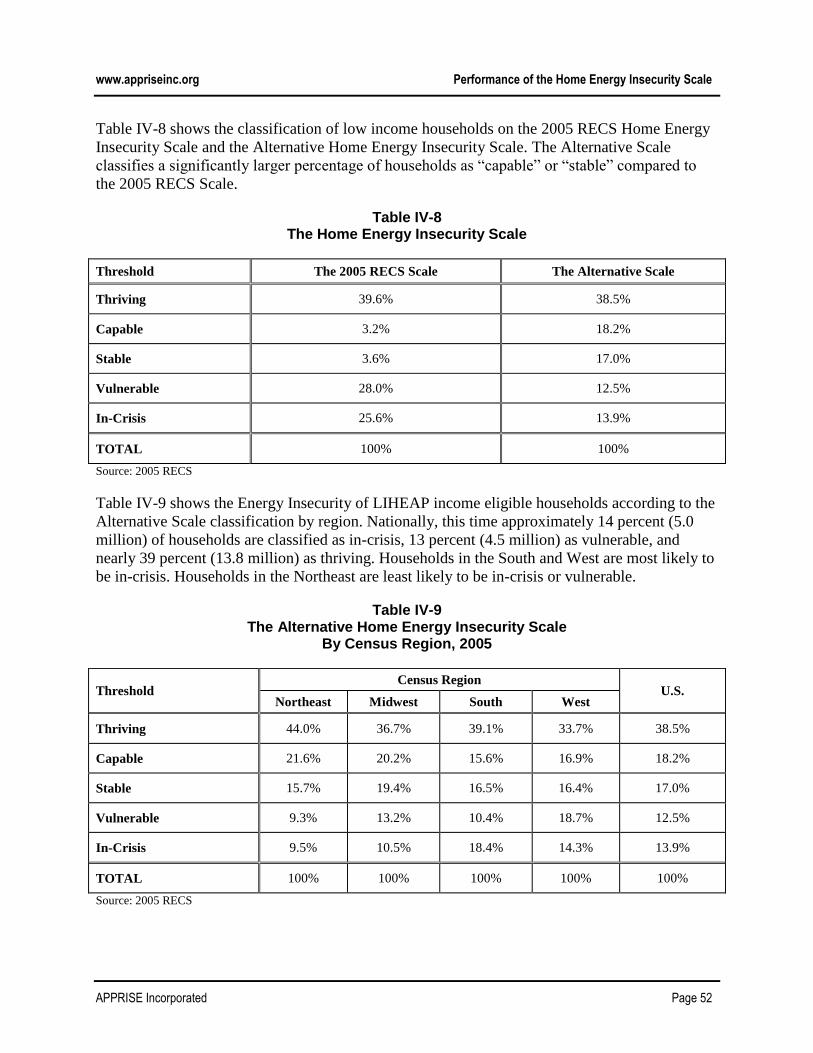
www.appriseinc.org Performance of the Home Energy Insecurity Scale
APPRISE Incorporated Page 52
Table IV-8 shows the classification of low income households on the 2005 RECS Home Energy
Insecurity Scale and the Alternative Home Energy Insecurity Scale. The Alternative Scale
classifies a significantly larger percentage of households as “capable” or “stable” compared to
the 2005 RECS Scale.
Table IV-8 The Home Energy Insecurity Scale
Threshold The 2005 RECS Scale The Alternative Scale
Thriving 39.6% 38.5%
Capable 3.2% 18.2%
Stable 3.6% 17.0%
Vulnerable 28.0% 12.5%
In-Crisis 25.6% 13.9%
TOTAL 100% 100%
Source: 2005 RECS
Table IV-9 shows the Energy Insecurity of LIHEAP income eligible households according to the
Alternative Scale classification by region. Nationally, this time approximately 14 percent (5.0
million) of households are classified as in-crisis, 13 percent (4.5 million) as vulnerable, and
nearly 39 percent (13.8 million) as thriving. Households in the South and West are most likely to
be in-crisis. Households in the Northeast are least likely to be in-crisis or vulnerable.
Table IV-9 The Alternative Home Energy Insecurity Scale
By Census Region, 2005
Threshold Census Region
U.S. Northeast Midwest South West
Thriving 44.0% 36.7% 39.1% 33.7% 38.5%
Capable 21.6% 20.2% 15.6% 16.9% 18.2%
Stable 15.7% 19.4% 16.5% 16.4% 17.0%
Vulnerable 9.3% 13.2% 10.4% 18.7% 12.5%
In-Crisis 9.5% 10.5% 18.4% 14.3% 13.9%
TOTAL 100% 100% 100% 100% 100%
Source: 2005 RECS

www.appriseinc.org Performance of the Home Energy Insecurity Scale
APPRISE Incorporated Page 53
Table IV-10 shows the Energy Insecurity of LIHEAP income eligible households according to
the Alternative Scale classification by poverty level and income group. Nearly 35 percent of
households with incomes below poverty are either vulnerable or in-crisis. The likelihood of
being in crisis or vulnerable decreases as poverty level or household income increases.
Table IV-10 The Alternative Home Energy Insecurity Scale
By Poverty Level and Income, 2005
Threshold
Poverty Level Annual Income
<=100% 101%-
150% >150% <$10K
$10K-
<$20K >=$20K
Thriving 31.0% 41.9% 47.6% 35.9% 41.9% 36.2%
Capable 17.7% 19.1% 17.9% 15.3% 16.3% 22.9%
Stable 17.1% 17.9% 15.4% 14.9% 16.7% 19.1%
Vulnerable 15.3% 10.5% 10.0% 15.4% 12.4% 10.3%
In-Crisis 18.9% 10.7% 9.1% 18.5% 12.8% 11.5%
TOTAL 100% 100% 100% 100% 100% 100%
Source: 2005 RECS
Table IV-11 shows the Energy Insecurity of LIHEAP income eligible households according to
the Alternative Scale classification by vulnerability group and income type. More than 25
percent of young child households are either vulnerable or in-crisis compared to about 18 percent
of elderly households. The likelihood of being in crisis or vulnerable is higher for households
that are on cash assistance or have other types of incomes compared to households with
employment or retirement income.

www.appriseinc.org Performance of the Home Energy Insecurity Scale
APPRISE Incorporated Page 54
Table IV-11 The Alternative Home Energy Insecurity Scale By Vulnerability Group and Income Type, 2005
Threshold
Vulnerability Group Income Type
Young
Child Elderly Other Employed Retired
Cash
Assistance
or Other
Thriving 26.7% 51.4% 33.0% 34.7% 51.4% 30.3%
Capable 21.3% 17.9% 17.0% 18.5% 19.4% 15.1%
Stable 26.4% 13.0% 16.1% 18.3% 15.1% 15.5%
Vulnerable 11.0% 8.9% 16.3% 13.9% 5.6% 19.1%
In-Crisis 14.9% 8.9% 17.6% 14.7% 8.5% 20.0%
TOTAL 100% 100% 100% 100% 100% 100%
Source: 2005 RECS
Table IV-10 illustrated that households below poverty are much more likely to be in-crisis or
vulnerable. Table IV-12 shows the Scale classification of households below poverty by
vulnerability group and income type. Twenty-nine percent of young child households are either
vulnerable or in-crisis compared to 26 percent of elderly households. The percentage of elderly
households that are in-crisis or vulnerable is significantly higher for households below poverty
than that for above poverty.
The difference in the Scale ratings across households of different vulnerability groups or income
types is smaller for households below poverty than those above poverty.

www.appriseinc.org Performance of the Home Energy Insecurity Scale
APPRISE Incorporated Page 55
Table IV-12 The Alternative Home Energy Insecurity Scale
By Vulnerability Group and Income Type for Households below Poverty, 2005
Threshold
Vulnerability Group Income Type
Young
Child Elderly Other Employed Retired
Cash
Assistance or
Other
Thriving 23.1% 40.3% 27.8% 28.9% 42.38.9% 26.6%
Capable 23.1% 19.6% 13.1% 18.6% 20.5% 12.1%
Stable 24.8% 14.0% 15.4% 15.3% 19.6% 18.4%
Vulnerable 12.8% 12.1% 19.3% 17.0% 6.8% 21.7%
In-Crisis 16.2% 14.0% 24.3% 20.2% 14.2% 21.2%
TOTAL 100% 100% 100% 100% 100% 100%
Source: 2005 RECS
Table IV-13 shows the Energy Insecurity of LIHEAP income eligible households according to
the Alternative Scale classification by residential and home energy burden. Higher residential
energy burden is associated with a worse Scale threshold classification. The association of home
energy burden and the Scale rating is weaker than that for residential energy burden and the
Scale.
Table IV-13
The Alternative Home Energy Insecurity Scale By Energy Burden, 2005
Threshold Residential Energy Burden Home Energy Burden
High Moderate Low High Moderate Low
Thriving 34.3% 37.0% 44.7% 37.6% 38.1% 39.7%
Capable 18.9% 17.2% 18.4% 18.8% 21.0% 15.6%
Stable 15.7% 18.9% 16.6% 15.9% 17.1% 18.2%
Vulnerable 13.0% 14.6% 9.7% 12.3% 12.6% 12.7%
In-Crisis 18.3% 12.2% 10.6% 15.4% 11.2% 14.0%
TOTAL 100% 100% 100% 100% 100% 100%
Source: 2005 RECS
Table IV-14 shows the Energy Insecurity of low income households according to the Alternative
Scale classification by LIHEAP status. About 45 percent of LIHEAP recipient households are
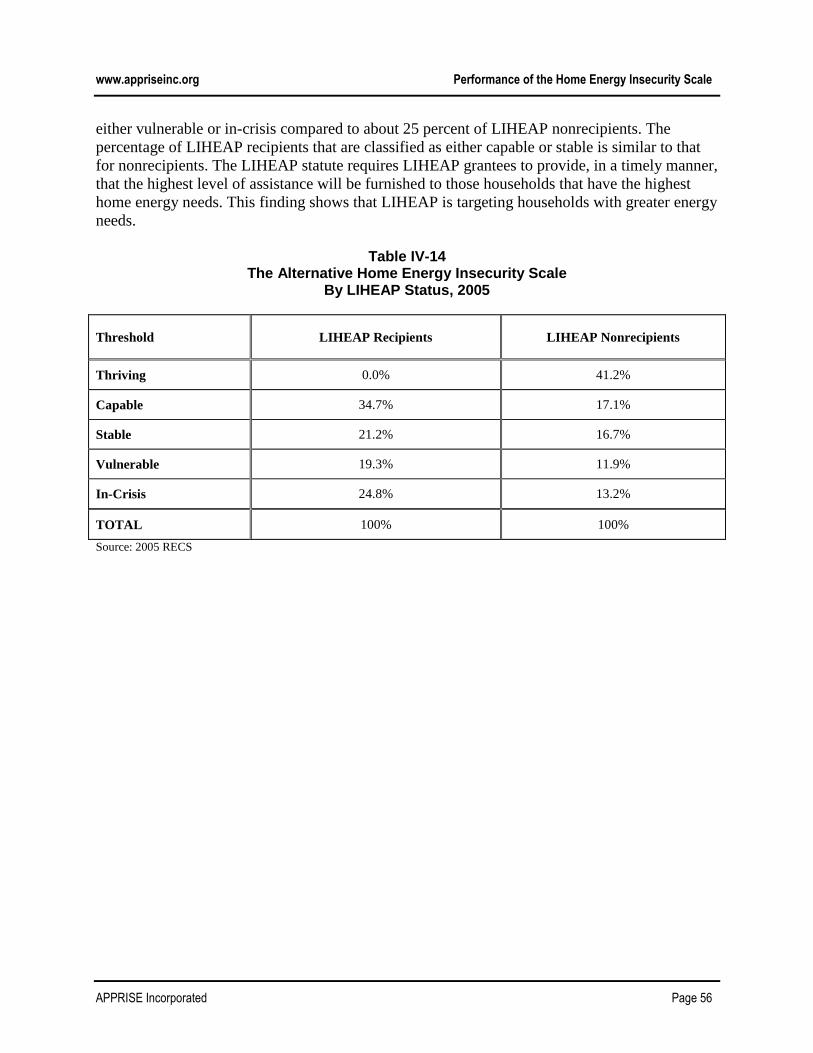
www.appriseinc.org Performance of the Home Energy Insecurity Scale
APPRISE Incorporated Page 56
either vulnerable or in-crisis compared to about 25 percent of LIHEAP nonrecipients. The
percentage of LIHEAP recipients that are classified as either capable or stable is similar to that
for nonrecipients. The LIHEAP statute requires LIHEAP grantees to provide, in a timely manner,
that the highest level of assistance will be furnished to those households that have the highest
home energy needs. This finding shows that LIHEAP is targeting households with greater energy
needs.
Table IV-14
The Alternative Home Energy Insecurity Scale By LIHEAP Status, 2005
Threshold LIHEAP Recipients LIHEAP Nonrecipients
Thriving 0.0% 41.2%
Capable 34.7% 17.1%
Stable 21.2% 16.7%
Vulnerable 19.3% 11.9%
In-Crisis 24.8% 13.2%
TOTAL 100% 100%
Source: 2005 RECS

www.appriseinc.org Study Implications
APPRISE Incorporated Page 57
V. Study Implications
In RECS surveys prior to 2005, survey questions on energy affordability issues were limited to
heating service disconnections and electric service disconnections. The 2005 RECS included a
set of questions that documented the different types of energy affordability problems that low
income households face. This study used the 2005 RECS data to develop information on the
Energy Insecurity of low income households, including:
Levels and Types of Energy Insecurity – The study estimated the rate at which low
income households face various types of energy problems and examined survey
respondent reports on the extent to which LIHEAP restores home heating and cooling for
households experiencing service interruptions.
Factors Related to Energy Insecurity – The study included an analysis of the factors
associated with energy problems including income, energy burden, geographic region and
other demographic and housing factors.
Performance of the Home Energy Insecurity Scale – The study assessed the performance
of the Home Energy Insecurity Scale for measuring the impacts of energy costs on low
income households compared to other Energy Insecurity measures used in the past.
This study furnishes important information regarding the performance of LIHEAP, as well as the
types of information that should be collected to assess the energy needs of low income
households.
A. Levels and Types of Energy Insecurity
The study finds that the Energy Insecurity questions administered in the 2005 RECS offer a
much more comprehensive understanding of the energy problems faced by low income
households than did the more limited set of questions included in prior RECS surveys.
Findings from the analysis include:
Heating and Cooling Service Interruptions - Tracking the levels and types of home
heating and cooling service interruptions continues to be an important purpose of the
RECS survey. The 2005 RECS showed during 2005 that 9.1 percent of low income
households had heating interruptions during the heating season and 7.0 percent had
air conditioning interruptions during the cooling season. The space heating
interruption rate was the highest measured since the question was added to the RECS
in 1984 (note: The air conditioning interruption questions were new for 2005).
LIHEAP’s Role in Restoring Service – Adding questions on whether LIHEAP was
successful in helping to restore heating and air conditioning service to RECS
provides the ability to document one important performance indicator for LIHEAP.
The statistics from the 2005 RECS show that LIHEAP helped to restore home
www.appriseinc.org Study Implications
APPRISE Incorporated Page 58
heating for 59 percent of LIHEAP recipient households with heating interruptions
and 17 percent of all low income households with heating interruptions.21
The 2005
RECS also showed that LIHEAP helped to restore air conditioning for 40 percent of
LIHEAP recipient households with air conditioning interruptions and 8 percent of all
low income households with air conditioning interruptions. LIHEAP was able to
restore service for a relatively lower percentage of households having air
conditioning interruptions compared to households having heat interruptions because
there are relatively fewer States that provide home cooling/air conditioning
equipment repair assistance.
Financial Energy Insecurity – The inclusion of questions that document financial
Energy Insecurity for low income households provides a much better understanding
of the extent to which energy costs affect low income households; the statistics show
that almost 60 percent of low income households face financial Energy Insecurity
and that about one-fourth of those households face financial Energy Insecurity
“almost every month.” Moreover, the analysis also found that financial Energy
Insecurity is an indicator of an increased risk for heating and air conditioning service
interruptions.
Health and Safety Energy Insecurity – The inclusion of questions that document
health and safety Energy Insecurity for low income households gives additional
information on the other ways that energy affordability problems can affect low
income households. For example, it showed that, in 2005, almost 10 percent of low
income households kept their home at a temperature that they thought was unsafe to
deal with energy affordability problems. Overall, about one-fourth of low income
households experienced health and safety Energy Insecurity. Moreover, about 90
percent of the households that reported health and safety Energy Insecurity did not
report heating or air conditioning interruptions, indicating that the questions from
previous RECS surveys on interruptions were not capturing the entire set of risks
faced by low income households because of energy affordability problems.
The analysis suggests that the questions added to the 2005 RECS represent an important
contribution to the ability to document and understand the energy needs of low income
households.
B. Factors Related to Energy Insecurity
The study finds that there are certain factors that are associated with Energy Insecurity.
These findings suggest that States may be able to increase the effectiveness of LIHEAP by
considering these factors when they target households for LIHEAP outreach and when they
set LIHEAP benefit levels. Relevant findings from the analysis include:
21
Helpfulness of LIHEAP in restoring service is self-reported. Because service shutoff is a major problem for the
household, the respondent would remember it and report correctly. However, service restoration cannot be
attributed to LIHEAP with certainty, as the respondent may confuse LIHEAP with other fuel assistance programs in
the State.
www.appriseinc.org Study Implications
APPRISE Incorporated Page 59
Poverty Level – It is clear from the analysis that poverty level, rather than income
level, is associated with all types of Energy Insecurity. This shows that household
size plays an important role. When developing benefit assignment procedures, States
might be able to increase the effectiveness of LIHEAP if they group households by
poverty level, rather than income level.
Energy Burden – Residential energy burden is associated with Energy Insecurity
while home energy burden is very weakly associated; States might be able to
increase the effectiveness of their LIHEAP programs by using actual residential
energy bills to help set benefit levels.
Vulnerable Groups – It is important for States to consider all types of Energy
Insecurity in setting benefits. While low income elderly households have lower rates
of service interruptions and financial Energy Insecurity, they report similar rates of
health and safety Energy Insecurity. Since it is harder to directly observe health and
safety Energy Insecurity, local LIHEAP intake offices may need to conduct more
extensive outreach to identify such households.
In general, the analysis shows it is appropriate to target LIHEAP to the households with the
highest needs. However, the analysis also shows that subtle changes in targeting (i.e.,
focusing on residential energy burden rather than home energy burden) may be appropriate.
C. Home Energy Insecurity Scale
The 2005 RECS furnishes the first opportunity to estimate Energy Insecurity for all low
income households. This study furnishes the following three important findings with respect
to the scale and its uses
1. LIHEAP Targeting – The Home Energy Insecurity Scale makes it easier for
LIHEAP program managers to see what groups of households are at greater risk
for problems resulting from energy affordability. By targeting such households,
program managers may be able to increase the effectiveness of LIHEAP.
2. Performance Measurement – It is clear that some low income households have a
higher level of Energy Insecurity than others. It may be appropriate for LIHEAP
to use the reduction in Energy Insecurity as a performance measure for LIHEAP.
3. Study and Analysis – However, there are some important questions about the
Home Energy Insecurity Scale. In particular, it is important to measure how the
different levels of Home Energy Insecurity relate to the long term health and well-
being of low income households. For that reason, it would be appropriate for
OCS to continue to study the Home Energy Insecurity Scale and its policy
implications.
The 2005 RECS furnishes a rich database of information on the energy needs of low income
households. By supplementing heat interruptions questions with questions on the broader

www.appriseinc.org Study Implications
APPRISE Incorporated Page 60
range of energy problems, the survey has given policymakers much better information on
the impacts of energy affordability.
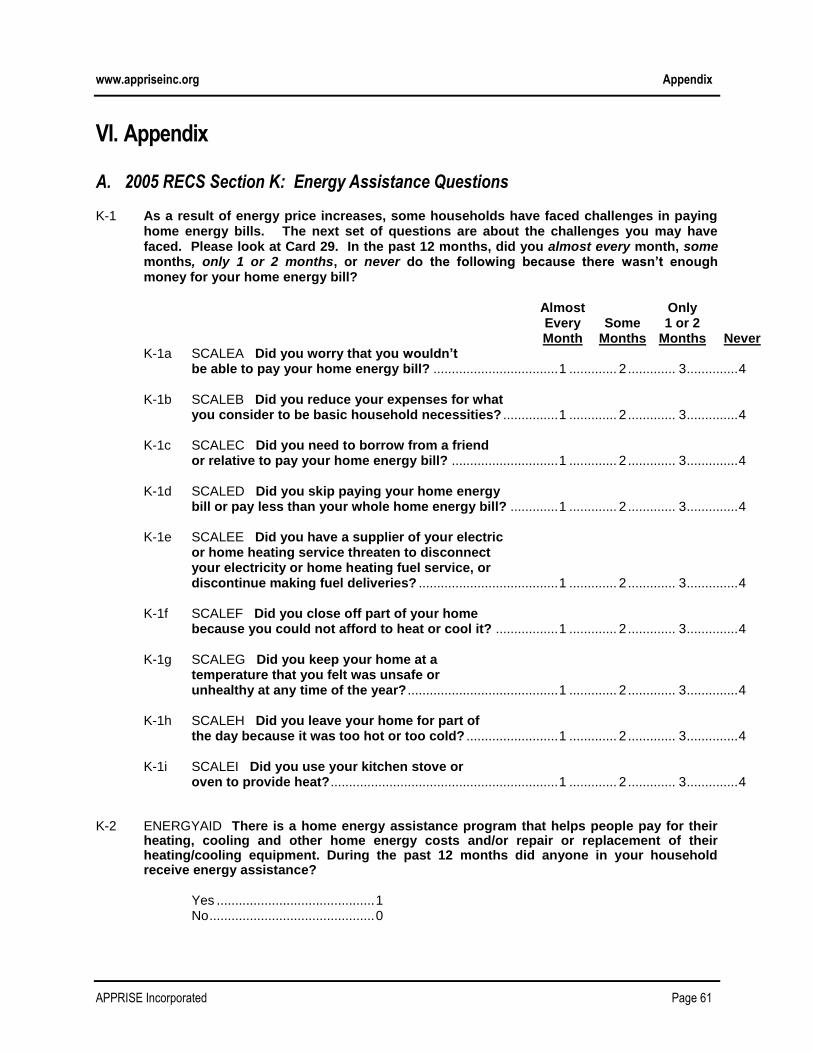
www.appriseinc.org Appendix
APPRISE Incorporated Page 61
VI. Appendix
A. 2005 RECS Section K: Energy Assistance Questions
K-1 As a result of energy price increases, some households have faced challenges in paying home energy bills. The next set of questions are about the challenges you may have faced. Please look at Card 29. In the past 12 months, did you almost every month, some months, only 1 or 2 months, or never do the following because there wasn’t enough money for your home energy bill?
Almost Only Every Some 1 or 2 Month Months Months Never
K-1a SCALEA Did you worry that you wouldn’t be able to pay your home energy bill? .................................. 1 ............. 2 ............. 3 .............. 4
K-1b SCALEB Did you reduce your expenses for what
you consider to be basic household necessities? ............... 1 ............. 2 ............. 3 .............. 4
K-1c SCALEC Did you need to borrow from a friend or relative to pay your home energy bill? ............................. 1 ............. 2 ............. 3 .............. 4
K-1d SCALED Did you skip paying your home energy
bill or pay less than your whole home energy bill? ............. 1 ............. 2 ............. 3 .............. 4
K-1e SCALEE Did you have a supplier of your electric or home heating service threaten to disconnect your electricity or home heating fuel service, or discontinue making fuel deliveries? ...................................... 1 ............. 2 ............. 3 .............. 4 K-1f SCALEF Did you close off part of your home because you could not afford to heat or cool it? ................. 1 ............. 2 ............. 3 .............. 4
K-1g SCALEG Did you keep your home at a temperature that you felt was unsafe or unhealthy at any time of the year? ......................................... 1 ............. 2 ............. 3 .............. 4
K-1h SCALEH Did you leave your home for part of the day because it was too hot or too cold? ......................... 1 ............. 2 ............. 3 .............. 4
K-1i SCALEI Did you use your kitchen stove or
oven to provide heat? .............................................................. 1 ............. 2 ............. 3 .............. 4 K-2 ENERGYAID There is a home energy assistance program that helps people pay for their
heating, cooling and other home energy costs and/or repair or replacement of their heating/cooling equipment. During the past 12 months did anyone in your household receive energy assistance?
Yes ........................................... 1 No ............................................. 0
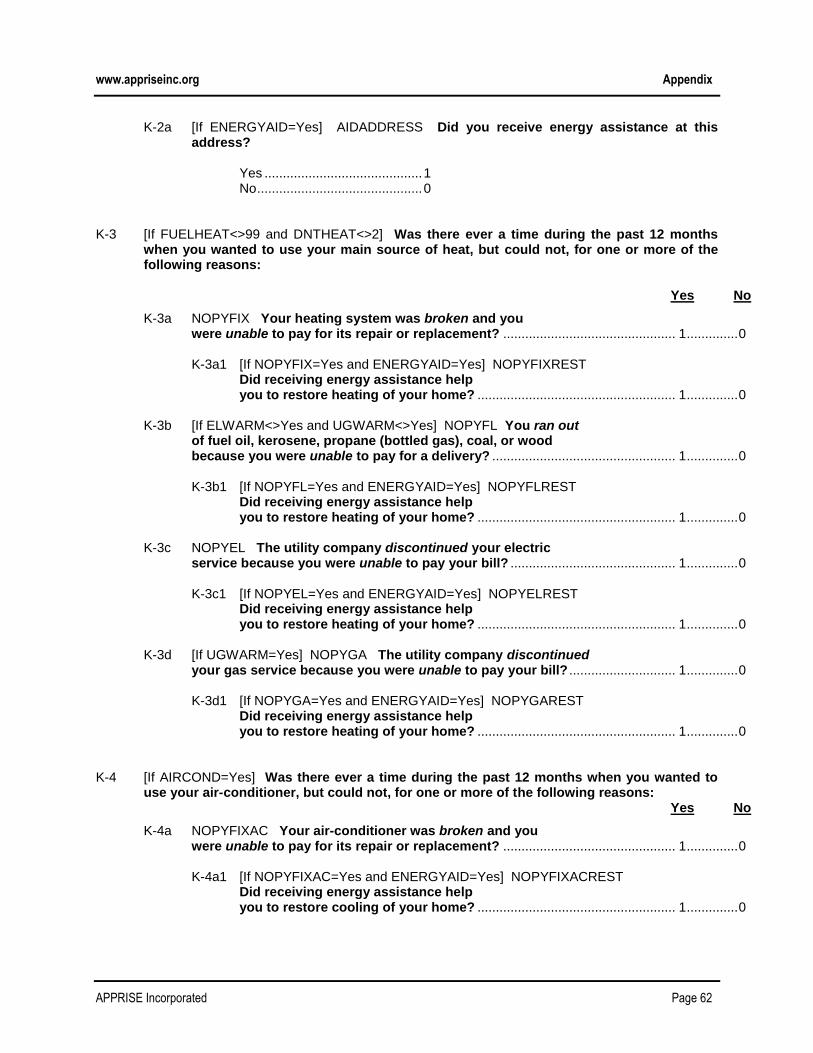
www.appriseinc.org Appendix
APPRISE Incorporated Page 62
K-2a [If ENERGYAID=Yes] AIDADDRESS Did you receive energy assistance at this address?
Yes ........................................... 1 No ............................................. 0
K-3 [If FUELHEAT<>99 and DNTHEAT<>2] Was there ever a time during the past 12 months
when you wanted to use your main source of heat, but could not, for one or more of the following reasons:
Yes No
K-3a NOPYFIX Your heating system was broken and you were unable to pay for its repair or replacement? ............................................... 1 .............. 0 K-3a1 [If NOPYFIX=Yes and ENERGYAID=Yes] NOPYFIXREST Did receiving energy assistance help you to restore heating of your home? ...................................................... 1 .............. 0
K-3b [If ELWARM<>Yes and UGWARM<>Yes] NOPYFL You ran out of fuel oil, kerosene, propane (bottled gas), coal, or wood
because you were unable to pay for a delivery? .................................................. 1 .............. 0 K-3b1 [If NOPYFL=Yes and ENERGYAID=Yes] NOPYFLREST
Did receiving energy assistance help you to restore heating of your home? ...................................................... 1 .............. 0
K-3c NOPYEL The utility company discontinued your electric
service because you were unable to pay your bill? ............................................. 1 .............. 0 K-3c1 [If NOPYEL=Yes and ENERGYAID=Yes] NOPYELREST Did receiving energy assistance help you to restore heating of your home? ...................................................... 1 .............. 0
K-3d [If UGWARM=Yes] NOPYGA The utility company discontinued
your gas service because you were unable to pay your bill? ............................. 1 .............. 0 K-3d1 [If NOPYGA=Yes and ENERGYAID=Yes] NOPYGAREST Did receiving energy assistance help you to restore heating of your home? ...................................................... 1 .............. 0
K-4 [If AIRCOND=Yes] Was there ever a time during the past 12 months when you wanted to
use your air-conditioner, but could not, for one or more of the following reasons: Yes No
K-4a NOPYFIXAC Your air-conditioner was broken and you were unable to pay for its repair or replacement? ............................................... 1 .............. 0 K-4a1 [If NOPYFIXAC=Yes and ENERGYAID=Yes] NOPYFIXACREST Did receiving energy assistance help you to restore cooling of your home? ...................................................... 1 .............. 0

www.appriseinc.org Appendix
APPRISE Incorporated Page 63
K-4b NOPYELAC The utility company discontinued your electric service because you were unable to pay your bill? ............................................. 1 .............. 0 K-4b1 [If NOPYELAC=Yes and ENERGYAID=Yes] NOPYELACREST Did receiving energy assistance help you to restore cooling of your home? ...................................................... 1 .............. 0
K-5 [If NOPYEL=Yes or NOPYELAC=Yes, GO TO QUESTION K-7] SOMEPY In the past 12
months, has there been a time when your household did not pay the full amount due for an electric bill?
Yes ......................................... 1 No ............................................ 0
K-6 NOPY In the past 12 months was your electricity ever discontinued because you were
unable to pay your electric bill?
Yes ......................................... 1 No ............................................ 0
K-6a [If NOPY=Yes] MTHSNOPY In which months was your electricity discontinued?
(Mark all that apply.)
January . ………………1 July ............................ 7 February ...................... 2 August ......................... 8 March . ………………3 September .................. 9 April ....................... 4 October ..................... 10 May ....................... 5 November ................. 11 June ....................... 6 December ................. 12
K-6b [If NOPY=Yes] NTIMEWOEL How many separate times were you without electricity because your electric service was discontinued?
Enter the number of times ..........
K-6c [If NOPY=Yes] NDAYSWOEL Altogether, how many days were you without electricity in the past 12 months because your electric service was discontinued?
Enter the number of whole days .............