Embed Size (px)
Citation preview
Like Daughter, Like Father: How Women’s Wages Change When CEOs Have Daughters
Michael S. Dahl Aalborg University
Fibigerstræde 4 9220 Aalborg Ø
Denmark +45-9940-8268
Cristian L. Dezső University of Maryland
Robert H. Smith School of Business 3347 Van Munching Hall College Park, MD 20742
301-405-7832 [email protected]
David Gaddis Ross Columbia Business School
Uris Hall, Room 726 New York, NY 10027
212-854-5606 [email protected]
Keywords: women’s wages, discrimination, CEOs
1
Like Daughter, Like Father: How Women’s Wages Change When CEOs Have Daughters
Abstract
Drawing on research in sociology and economics suggesting that fathers’ gender-related attitudes and behaviors are shaped by the gender of their children, we hypothesize that having daughters prompts male CEOs to implement wage policies that are more equitable to female employees. To test this hypothesis, we use a 12-year panel of Danish workforce data and an empirical specification with CEO–employee fixed effects, creating a quasi-experimental setting whereby the gender of a CEO’s child is effectively exogenous. We observe that when a daughter was born to a male CEO, wages paid to the CEO’s female employees rose relative to the wages paid to male employees. The effect was stronger for the first daughter, and stronger still if the first daughter was also the first child. The birth of a daughter to a male CEO particularly benefitted women who were more educated or who worked for smaller firms. These results have implications for our understanding not only of the origins of discrimination and the gender gap in wages but also of social preferences and the influence of managerial style on firm policies.

2
I. INTRODUCTION
Women have made significant progress over the last several decades toward reducing
gender differences in education, labor market experience, and the industries and
occupations in which they work (Goldin 2006; Goldin, Katz, and Kuzimenko 2006; Blau
and Kahn 2007).1 Despite these advances, “unequal pay for equal work” persists, with
women’s wages lagging an estimated 9% to 18% behind men’s wages for comparable
work (Blau and Kahn 2000; Bayard, Hellerstein, Neumark, and Troske 2003; Blau and
Kahn 2006).
What explains this disparity? The literature proposes an array of factors, including,
most notably, unobserved employee characteristics and employer discrimination. In
particular, consistent with Becker’s (1957) proposition that employers have a taste for
discrimination, which they indulge in less competitive settings, Black and Strahan (2001)
and Black and Brainerd (2004) use banking deregulation and the globalization of
manufacturing to show that increased competition leads to a more equitable gender
distribution of wages. However, this literature has not specifically analyzed the potential
influence of a chief executive officer (CEO) on a firm’s gender-related wage policies. We
address that gap here. We argue that CEOs’ concepts of fairness and attitudes about
gender in the workplace will impact a firm’s gender-related wage policies, and that these
attitudes are influenced by the gender of CEOs’ children. Specifically, based on research
showing that daughters influence fathers to adopt more feminist attitudes and behaviors
(Warner 1991; Washington 2008), we hypothesize that having daughters prompts male
1 Women, however, remain greatly underrepresented in some occupations, including the senior and top executive ranks in the corporate and financial sectors (Bertrand and Hallock 2001; Dezső and Ross 2010; Bertrand, Goldin, and Katz 2010).

3
CEOs to implement wage policies that ultimately increase the wages of female
employees relative to those of male employees. We find strong confirmatory evidence for
this hypothesis using a comprehensive panel dataset on the employees, CEOs, and
families of CEOs in Danish firms, and a research design that provides a quasi-
experimental setting in which the gender of a CEO’s child is effectively exogenous. (See
Section III for more detail.)
The reasoning underlying our hypothesis is as follows. Scholars in management and
economics have provided ample evidence that CEOs have a “style”, that is, that CEO
traits impact a wide array of corporate policies (Barnard 1938; Bertrand and Schoar 2003;
Malmendier and Tate 2005, 2008), including those associated with wages (Bertrand and
Mullainathan 1999, 2003; Bastos and Monteiro 2010; Cardoso and Winter-Ebmer 2010).
In addition, like people generally, CEOs might consider the well-being of others when
making decisions. In other words, CEOs may at times exhibit pro-social behavior (Fehr
and List 2004), reflecting their concepts of fairness and their attitudes toward women’s
issues. A number of models of social preferences could be related to gender and,
specifically, to the real or perceived inequitable treatment of women. In particular, CEOs
might have a taste for discrimination against women (Becker 1957), might care about
fairness in gender issues (Fehr and Schmidt 1999; Bolton and Ockenfels 2000), might be
inclined to help the least well-off (Charness and Rabin 2002), or might identify more or
less strongly with women (Akerlof and Kranton 2000; Chen and Li 2009). Thus, CEOs’
preferences and attitudes toward women’s issues might be salient in matters related to
gender equity in the workplace and, in particular, women’s wages relative to men’s
wages.

4
What would influence these preferences and attitudes? Research in sociology and
economics points toward the gender of a CEO’s children, among other factors. In an early
and pioneering work, Warner (1991) argued that if parents care about the life experiences
of their children or live vicariously through them, having daughters should make parents
more sensitive to gender inequality and women’s issues. This mechanism should be
particularly relevant for men, who, unlike women, are unable to develop such sensitivity
through identity and personal experience. In support of these hypotheses, Warner (1991)
and Warner and Steel (1999) found that having daughters makes parents more likely to
adopt feminist views and more supportive of policies designed to address gender equity.
In a more recent study, Washington (2008) found evidence that having daughters
influences U.S. legislators to vote more liberally on women’s issues, especially
reproductive rights.2 It follows, then, that having a daughter will increase a male CEO’s
awareness of women’s issues and prime a CEO’s interest in fairness for women in the
workplace. We would expect these male CEOs to be more attentive to gender equity –
consciously or subconsciously – while managing their firms’ gender-related wage policies.
Thus, we hypothesize that when a daughter is born to a male CEO, wages paid to female
employees in the CEO’s firm will rise relative to wages paid to male employees.
There are only a few studies that investigate the effect of top managers on women’s
wages relative to men’s wages. Bastos and Monteiro (2010) showed that manager fixed
effects explain a significant amount of the variation in firms’ wage policies, including the
2 A range of parental decisions have been linked to child gender. Examples include labor supply and wages (Angrist and Evans 1998; Lundberg and Rose 2002), investment (Bogan 2010), marital stability (Dahl and Moretti 2004), and party affiliation (Oswald and Powdthavee 2010; Conley and Rauscher 2010). Research on family firms also investigates the impact of the gender of CEOs’ children on CEO succession as well as other governance and performance attributes (Peréz-Gonzaléz 2006; Bennedsen, Nielsen, Peréz-Gonzaléz, and Wolfenzon 2007; Bertrand, Johnson, Samphantharak, and Schoar 2008).

5
gender distribution of firm-wide wages. Cardoso and Winter-Ebmer (2010) showed that
female-led firms have more gender-equitable wage policies. These studies are, however,
unable to address the usual concerns associated with endogenous managerial selection,
whereby firms that seek to implement more-equitable wage policies might appoint CEOs
whose attitudes are more attuned to women’s issues, possibly as a result of the gender of
their children.
In our research design, we used Denmark’s Integrated Database for Labor Market
Research to construct a matched employer–employee dataset that (i) contains wage and
demographic information for the entire workforce employed in Denmark’s private sector
in 1995-2006, (ii) identifies each employee’s employer and CEO, and (iii) contains
information on each CEO’s family structure, including the gender and age of a CEO’s
children. In our empirical specifications, we included a separate fixed effect for each
CEO–employee relationship that appears in our data. These fixed effects account not only
for unobservable heterogeneity associated with each CEO–employee relationship itself
but also with each CEO, each employee,3 and the firm for which they both work, as fixed
effects for these higher level elements are linear combinations of the CEO–employee
fixed effects. We also employed fixed effects for the total number of children a CEO has.
Finally, we note that gender-related abortion is extremely rare in Denmark. As a
consequence, we have a quasi-experimental setting in which the gender of a child is
effectively exogenous even though the decision to have a child is in principle endogenous.
Using this fairly demanding empirical specification, we obtained the main result of
our paper: Conditional on the number of children a CEO already has, the birth of a 3 Unobservable employee heterogeneity has been identified as a key element of wages and the gender wage gap (Abowd, Kramarz, and Margolis 1999; Blau and Kahn 2000).

6
daughter to a male CEO resulted in a 1.3% increase in women’s wages and a 0.8%
increase in men’s wages, thereby reducing the gender wage gap by approximately 0.5%.4
We examined whether this effect differed according to daughters’ rank order at birth and
found that the birth of a first daughter to a male CEO resulted in a 1.4% increase in
women’s wages, and an approximately 0.8% decrease in the gender wage gap. If the first
daughter was also a first child, the gender wage gap decreased by roughly 2.8%. The
birth of the second daughter, on the other hand, did not result in a significant reduction in
the gender wage gap. Thus, our results suggest that the first daughter “flips a switch” in
the mind of a male CEO, causing him to attend more to equity in gender-related wage
policies. Having additional daughters does not, however, prompt a CEO to continue
raising the wages of female employees, as it were, to the point of reverse discrimination.
Evidence exists that children’s educational attainment is determined, in part, by their
parents’ income, education, and aspirations for them (Haveman and Wolfe 1995; Solon
1999; Black and Devereaux 2010). Thus, CEOs may experience greater social
identification with more-educated women or, more colloquially, may experience a kind
of vicarious identification by implicitly likening their daughters to more-educated female
employees. Consistent with this idea, we found that the wage effect caused by the birth of
a daughter to a male CEO is stronger when employees are more educated. Specifically,
the gender wage gap decreased by about 1% among the most educated employees and by
4 Conceivably, some of the increase in the relative wages of women employees following the birth of a daughter to a male CEO may reflect promotions to higher occupational ranks. To account for this possibility, we controlled for employee rank in the regressions, rather than conduct separate analyses on the probability of promotions, because the data on rank are limited to four broad categories. In addition, we repeated our analyses without controls for employee rank, and the results were virtually identical, suggesting that the changes in relative wages we observe following the birth of daughters to male CEOs are driven by changes within rather than across occupational rank categories.

7
0.6% among the second-most educated employees. The wage gap reduction among the
remaining employees was statistically insignificant.
Lastly, it is intuitive that the CEOs of small firms take a more direct role in their firms’
wage policies than the CEOs of larger firms. In general, small firms may also be subject
to less monitoring by outside investors, leaving CEOs with more opportunity to shape
their companies’ policies to reflect their personal biases. One would then expect the
gender of a CEO’s children to have a greater impact on wage policies in smaller firms. In
fact, we found that the birth of a daughter to a male CEO resulted in a statistically
significant decrease in the gender wage gap only in firms with 10-50 employees (which
account for roughly one-third of our employee–year observations).
These results contribute to the literature on the gender wage gap, and particularly to
the literature on discrimination. There are only a few studies that link firms’ top
managers to gender-related wage policies (Bastos and Monteiro 2010; Cardoso and
Winter-Ebmer 2010) and similarly few that rely on experimental settings to provide
evidence of the role of gender discrimination in the workplace (Neumark 1996; Goldin
and Rouse 2000; Black and Strahan 2001). Using a quasi-experimental setting in which
the gender of a CEO’s child is effectively exogenous, we bridge these two lines of
research and establish the first causal link between CEOs and the gender-related wage
policies of their firms. Specifically, we provide evidence that having daughters prompts
male CEOs to implement wage policies that ultimately increase the wages of female
employees relative to the wages of male employees. More broadly, our paper contributes
to the literature on how CEOs influence corporate policies, particularly the more recent
line of research relying on exogenous shocks during CEOs’ careers (Bennedsen et al.

8
2006; Schoar 2007; Malmendier and Tate 2009; Malmendier, Tate, and Yan 2010).
Finally, despite extensive evidence from laboratory experiments in support of social
preference models, it remains an open question how much these results apply outside the
laboratory, particularly with regard to attitudes and behaviors in commercial settings and
to important social issues like the gender gap in wages (Levitt and List 2007). Our paper
provides robust, albeit indirect, evidence that, indeed, social preferences play an
important role in economic life.
The rest of the paper is organized as follows. Section II describes the data and
presents summary statistics. Section III describes our empirical approach. Section IV
presents the results of the paper. Section V concludes.
II. DATA AND SUMMARY STATISTICS
We use Denmark’s Integrated Database for Labor Market Research (most commonly
referred to by its Danish acronym IDA) as the source of our data. The IDA contains
demographic information on all firms, plants, and individuals in the Danish economy.
The IDA is compiled by Statistics Denmark, a governmental agency, using the
identification numbers assigned at birth to each Dane as part of maintaining Denmark’s
extensive social security system. The IDA notably includes detailed information about
the family histories and wages of individuals and has been widely used for social science
research.5
Our data are a panel of the 6,321 firms in private sector industries that had more than
10 employees in every year they were present in the data, from 1995-2006 (see below).
5 See Albæk & Sørensen (1998), Sørensen & Sorenson (2007), Bennedsen et.al. (2007), and Dahl (2010) for other research using this database.

9
We excluded firms in industries with a high degree of public sector involvement (e.g.,
schools, energy, renovation, etc.) and heavily regulated primary sector activities (e.g.,
farming, mining, fisheries, etc.) because the wage dynamics and autonomy of CEOs are
quite different in such firms.
We used the IDA to identify the CEO based on employees’ occupational ranks. If
there was more than one person listed in the most highly ranked category, we assigned
the CEO title to the person with the highest salary in this rank. By this method of
classification, our data have 15,565 different CEOs, of which 1,619 are women. We
excluded firms that had less than 10 employees in any year during their presence in the
data because the occupation rank variable is incomplete for a large share of these smaller
firms.
The IDA contains detailed information on the families of all individuals. We used this
information to generate our main variables of interest: the gender, birth year, and number
of children of the CEO. We also collected information on CEOs’ ages. At the employee
level, we collected data on wages (in 2010 kroner), gender, age, education, marital status,
number of children and their ages, full time work status, firm tenure, and occupational
rank (blue collar, white collar, management, and top management). Finally, at the firm
level, we collected information on firm size and profitability. Table 1 provides summary
statistics.
Insert Table I about here
10
Our data contain 834,885 employee-year observations for 256,332 unique female
employees, and 1,910,765 employee-year observations for 477,870 unique male
employees. Female employees earned, on average, 228,205 kroner (approximately
$39,855) compared to an average of 290,686 kroner (approximately $50,777) for their
male colleagues, resulting in a 21.5% unadjusted gender gap in wages. Both female and
male employees were, on average, 38 years old and both had an average of 12 years of
schooling. Roughly 63% of female employees and 59% of male employees were married.
Slightly more women had children under 5 years old, but significantly more had children
between 5 and 17 years old. Slightly fewer women than men had full-time positions, and
there were only slight differences in the average tenure of female and male employees,
which was about 4 years. Lastly, we note that the proportion of women employed in the
blue collar, management, and top management ranks was smaller than the proportion of
men in the same positions, while the proportion of women employed in the white collar
ranks were higher. In particular, women occupied about 29% of the blue-collar positions,
45% of the white-collar positions, 26% of the management positions, and 13% of the top
management positions.
Our data contain 3,183 CEO-year observations for 1,610 unique female CEOs, and
42,960 CEO-year observations for 13,946 unique male CEOs. Female CEOs were, on
average, 41 years old, while male CEOs were on average 47 years old. In our sample,
there were 91 births to female CEOs, of which 43 were daughters, and 1,175 births to
male CEOs, of which 590 were daughters. As detailed below, the coefficients in our
regressions – and thus our results – are identified based on these events. 28% of female
CEOs had no children, 18% had only one child, 38% had two children, 15% had three

11
children, and the rest had more than three children. About 11% of male CEOs had no
children, 14% had one child, 49% had two children, 21% had three children, and the rest
had more than three children. Female CEOs tended to manage smaller firms, with an
average size of 27.5 employees, while male CEOs tended to manage slightly larger firms,
with an average size of 34 employees. There were no differences in the profitability of
firms managed by female and male CEOs.
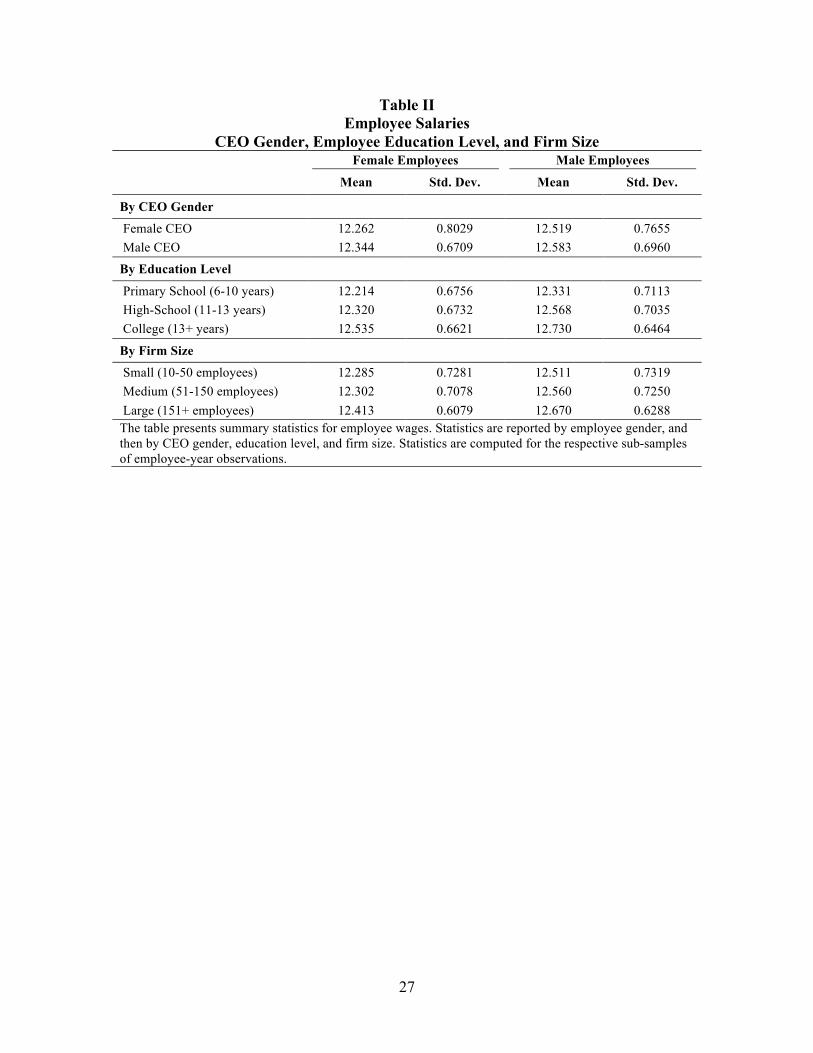
In Table II, we report the wages of female and male employees broken down by the
gender of the CEO they work for, employees’ education level and by the size of the firms
in which they work.
Insert Table II about here
The gender gap in wages among employees working for female CEOs is 22.7%,
similar to the 21.3% gap among employees working for male CEOs. At 11%, the gender
gap in wages among employees with a primary school education is significantly smaller
than the 22% gap among employees with a high school education, and the 18% gap
among employees with a college/university education. Finally, we do not observe major
differences in the gender gap in wages across firms of different sizes, which stands at 20%
in small firms, and 23% in medium and large firms.
III. EMPIRICAL SPECIFICATION
An essential aspect of our approach involves accounting for unobservable attributes
associated with firms, CEOs, and employees. We control for unobservable firm and CEO
attributes using CEO fixed effects (with firm fixed effects effectively subsumed by CEO

12
fixed effects) and we control for unobservable employee attributes using employee fixed
effects. Combining these fixed effects yielded a set of CEO–employee fixed effects, that
account not only for unobservable heterogeneity associated with each CEO–employee
relationship itself but also with each CEO, each employee, and the firm for which they
both work. We also followed Washington (2008) and included fixed effects for CEOs’
total number of children to separate the effect of having an additional daughter from the
effects associated with overall family size.
As argued by Abowd et al. (1999) the specification using CEO-employee fixed
effects (firm–employee fixed effects in their case) is the most robust statistical method,
yielding consistent and unbiased estimators for the parameters of interest. In fact, even
the drawback of this specification – namely that the coefficients are identified solely
based on changes within CEO–employee matches – represents a strength in our case:
Gender-related abortion is extremely rare in Denmark, and thus our data offer a quasi-
experimental setting whereby the gender of a newborn child is effectively exogenous.
In summary, we estimated the following linear regression model:
(1) Yijt = α + βCEO Number of Daughtersjt
+ βCCjt + βEEit + βFFijt+ γCChildrenjt + γRRankit + φij + φt + εijt
where Yijt is the natural log of real (2010 kroner) wages of employee i working for CEO j
in year t and CEO Number of Daughtersjt is the number of daughters of CEO j in year t.
Cjt, Eit, and Fijt, are vectors of observable characteristics for CEO j, Employee i, and the
firm where CEO j and Employee i work in year t. Childrenjt and Rankit are fixed effects
for, respectively, the total number of children of CEO j in period t and the occupational

13
rank of Employee i in period t. φij represent fixed effects for the match between employee
i and CEO j, and φt are year fixed effects. εijt is a random error associated with each
observation.
The starting point of our empirical study is the coefficient β. Given the presence of
fixed effect for the CEO–employee match and the CEO’s total number of children, the
coefficient β is identified from births of daughters to CEOs. Consequently, and
conditional on having an additional child, β represents the effect of an additional daughter
(as opposed to an additional son) to CEO j on employee i’s wages. Our interest, however,
is in the effect of daughters differentiated by the gender of the CEO and employee.
Therefore, over the course of our analysis, we modify Equation (1) by splitting CEO
Number of Daughtersjt into orthogonal categories in which, for example, (i) the CEO is
male or female, (ii) the employee is male or female, or (iii) these categories interact.
We note that, except for CEO and employee age, employee tenure, and firm size and
profitability, the coefficients on the control variables are also identified solely based on
changes within the match between CEO and employee. Thus, workers whose education
did not change throughout the sample period will not contribute to identifying the
coefficient on the control for education, as this would be subsumed by the associated
CEO–employee fixed effect.
We calculate robust standard errors to account for any unobservable heterogeneity not
captured by the CEO–employee fixed effects, including arbitrary correlation within and
across the panels defined by the CEO–employee fixed effects.

14
IV. RESULTS
IV.A. Base Case Analysis: The Effect of Daughters on Employee Wages
We present our main analysis in Table III. Column (1) reports the results of a
regression of wages on CEO Number of Daughters, the control variables, and the fixed
effects described above.
Insert Table III about here
All controls are highly significant and have the expected signs. At the CEO level, we
note that older CEOs tended to pay lower wages. At the employee level, older employees
were compensated better. Education was associated with higher wages, as was marriage,
although the effect was highly gender-specific as shown by the interaction term between
marital status and the gender of the employee. Having children was associated with lower
wages, particularly if the children were less than 5 years of age and if the employee was
female, evidence of the well-known motherhood penalty. At the firm level, we see that
larger and more profitable firms paid their employees higher wages.
More germane for our purposes, the coefficient on CEO Number of Daughters is
positive and significant at the 1% level; the birth of a daughter to a CEO was associated
with a 0.9% average increase in employee wages. In column (2), we split CEO Number of
Daughters by the gender of the CEO. We see that male CEOs were more sensitive to the
birth of daughters in that they tended to raise their employees’ wages by 1%, compared to
an increase of only 0.5% by female CEOs. In column (3) we split CEO Number of
Daughters by the gender of the employee. We see that female employees benefitted more

15
from the birth of a daughter to their CEO: their wages rose by 1.2% on average,
compared to an increase of only 0.8% for male employees. Wald tests confirm that, in
both cases, the coefficients are significantly different from each other.
Our hypothesis specifically relates to the birth of a daughter to a male CEO and its
effect on the wages of female employees relative to the wages of male employees.
Accordingly, in column (4), we split CEO Number of Daughters by both the gender of
the CEO and the gender of the employee, for a total of four orthogonal categories. We see
that the birth of a daughter to a female CEO did not have a statistically significant
differential effect on the relative wages of female and male employees. By contrast, we
see that the birth of a daughter to a male CEO resulted in a 1.3% increase in the wages of
female employees and an increase of only 0.8% for male employees. A Wald test
confirms that these effects are highly statistically different from one another. We thus
have the main result of our paper: The birth of a daughter to a male CEO resulted in a
gender wage gap reduction of approximately 0.5%. [We note that this percentage (1.3% –
0.8%) is an approximation because the base wages upon which these percentages are
calculated are similar but not exactly the same.] We now unpack the contingencies that
make this effect larger or smaller.
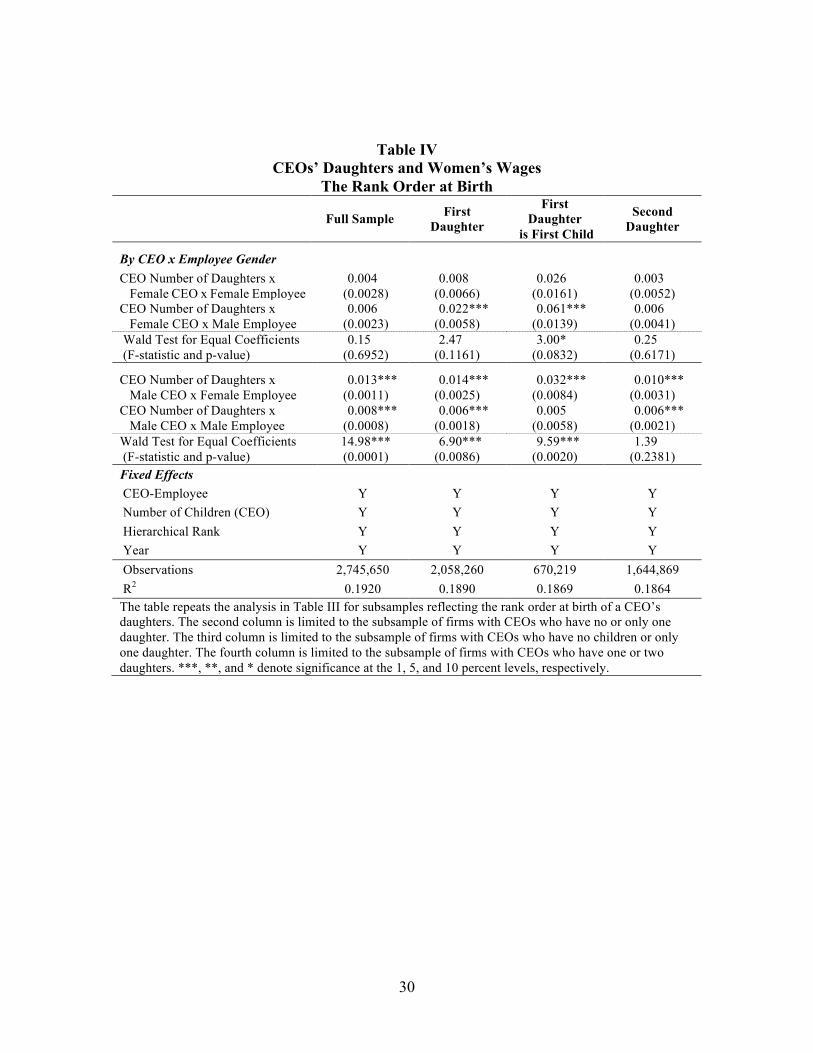
IV.B. Is the Daughter Effect Stronger for First Daughters and First-Born Children?
If the effect of having a daughter on the wages of female employees relative to the
wages of male employees is a result of a change in the attitudes of (male) CEOs toward
gender equity in wage policies, we would intuitively expect that the effect would be
stronger for the first daughter than for subsequent daughters. In addition, recent research
found that the first child increases parents’ well-being but the second child does not

16
(Kohler, Behrman, and Skytthe 2005), and that parents invest more in the parental care of
their first children, an effect that is especially strong for wealthier and more educated
fathers (Lawson and Mace 2009), such as the CEOs in our sample. It is thus possible that
the first daughter effect is stronger still if she is also a first child.6
To examine the effect of the first daughter, we replicated the regression in column (4)
of Table III for the sample of CEOs with no daughters and only one daughter. To
examine the effect of the first daughter when she is also the first child we replicated the
regression in column (4) from Table III for the sample of CEOs with no children and only
one child. The effect of second daughters is based on the sample of CEOs with one or
two daughters. The results are reported in Table IV, together with the results for the full
sample. When the daughter born to a CEO was also the first daughter, female employees
experienced a 1.4% increase in wages – more than double the increase experienced by
male employees – and a 0.8% reduction in the gender wage gap. When the daughter was
also the first child, the effect was significantly stronger. Female employees experienced a
3.2% increase in wages, an effect nearly 7 times larger than the one for male employees.
In essence, the gender wage gap fell by about 2.8%. We observe that in the case of
second daughters, female employees experienced a 1% increase in wages, compared to a
0.6% increase in the wages of male employees. However, these effects are not
significantly different from one another. We conclude that the effect observed in the full
sample was mostly driven by the birth of first daughters to male CEOs.
6 Prior research (Washington 2008; Oswald and Powdthavee 2010) points out that parents might follow endogenous family stopping rules, creating a form of reverse causality. Thus, CEOs with certain attitudes toward women’s issues might stop having children after achieving a desired gender mix of their children. We note, however, that this is much less of an issue in our panel setting where we use CEO fixed effects that account for CEOs’ attitudes and preferences for the gender mix of their children. Moreover, limiting our analysis to the birth of first-born daughters, as we do in this section, rules out endogenous family stopping as a mechanism underlying our results.

17
Insert Table IV about here
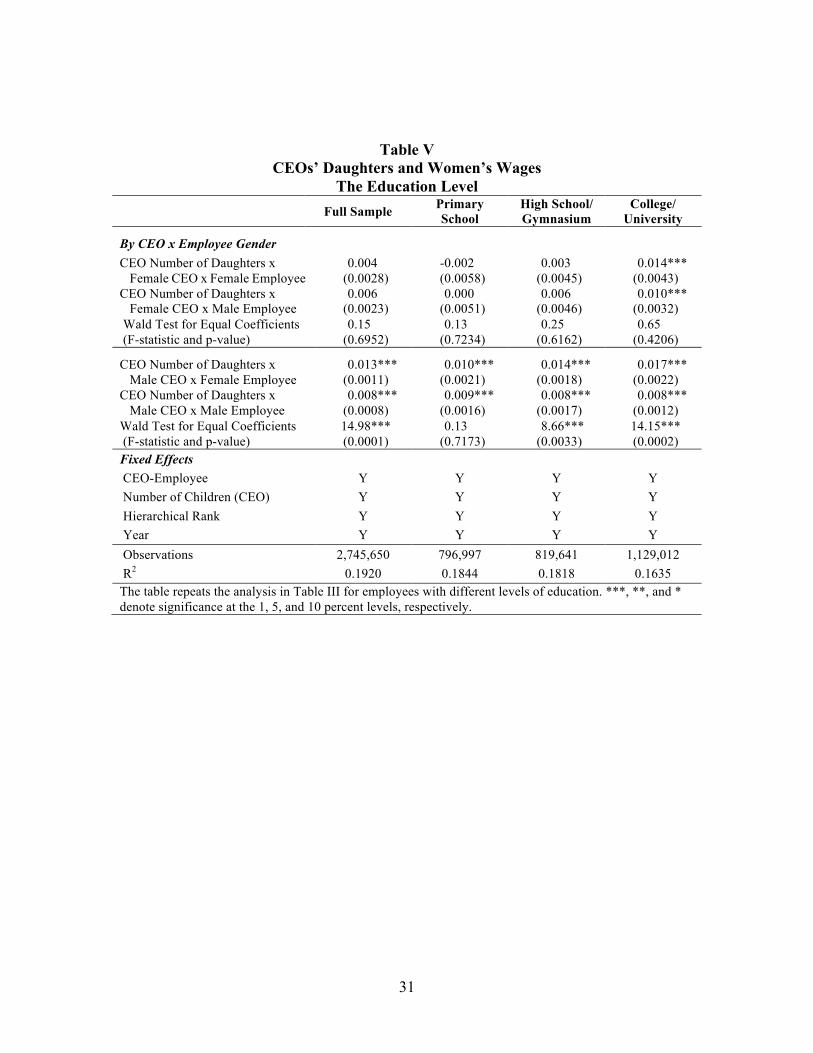
IV.C. Which Employees Benefit More? The Effect of Education
In what follows, we seek to understand whether some female employees might
benefit more than others when their male CEO has a daughter. As argued above, a male
CEO may identify more strongly with educated women or have aspirations that his
daughter will attain a good education. We therefore expected that any change in the
attitudes and behaviors of male CEOs toward gender-related wage policies would have a
more pronounced effect on the wages of educated employees.
To test this hypothesis, we divided employees into three groups by their educational
level: those with a primary school education (between 6 and 10 years of schooling), those
with a high school/gymnasium education (between 11 and 13 years of schooling), and
those with a college/university education (14 or more years of schooling). We then
replicated column (4) from Table III for each educational group.
Table V reports the results, which are telling. Among employees with only a primary
school education, the birth of a daughter to a male CEO had no differential effect on the
relative wages of female and male employees. However, for employees with a high
school/gymnasium education, we observe that the wages of female employees increased
by 1.4% after the birth of a daughter to a male CEO, while wages for male employees
increased by 0.8% – a statistically significant difference. In the case of employees with a
college/university-level education, we observe an even stronger differential effect. The
wages of female employees increased by 1.7% after the birth of a daughter to male CEOs,
an increase that is almost twice as large as, and statistically significantly different from,

18
the 0.8% increase experienced by male employees. Among the most highly educated
employees, then, the gender wage gap decreased by about 1% as a result of the birth of a
daughter to a male CEO. In contrast, we do not observe differential effects in any
education group following the birth of daughters to female CEOs.
Insert Table V about here
IV.D. Which Employees Benefit More? The Effect of Firm Size
Our final analysis concerns how the effects we observe vary by firm size. We
hypothesized that CEOs in smaller firms have more autonomy and discretion to influence
their firms’ pay structures. The influence of CEOs might be reduced in larger firms,
where organizational structures and human resource systems are more established and
solidified. To test this hypothesis, we divided the firms into three groups by the number
of employees: those with 10 to 50 employees, those with 51 to 150 employees, and those
with more than 150 employees. We then replicated column (4) from Table III for each
group of firms. We report those results in Table VI.
The results are in line with our hypothesis. In small firms, female employees
experienced a 1.5% wage increase after the birth of a daughter to a male CEO, while the
wages of male employees did not change. These effects are significantly different from
each other. As a result, the gender wage gap fell by roughly 1.5%. (Intriguingly, there
was a similar but smaller effect from the birth of a daughter to a female CEO, resulting in
an apparent decrease in the gender wage gap of about 1%. However, the differential
impact on wages is not statistically significant in the Wald test of equality.) In medium-

19
sized and large firms, in contrast, the relative wages of female and male employees did
not change to a statistically significant degree.
Insert Table VI about here
V. CONCLUSION
What explains the gender gap in wages? This question has received a significant
amount of attention across the social sciences and discrimination has been shown to be an
important explanatory factor. Yet, this literature has not specifically analyzed the potential
influence of the chief executive officer (CEO) on a firm’s gender-related wage policies.
In this paper, we drew on research in sociology and economics showing that
daughters induce fathers to adopt more feminist attitudes and behaviors (Warner 1991;
Washington 2008) and hypothesized that having daughters prompts male CEOs to
implement gender-related wage policies that are more favorable to female employees. We
tested this hypothesis using a comprehensive panel dataset on Danish firms, their
employees and CEOs, and their CEOs’ families. We used fixed effects at the level of the
match between CEO and employee, creating a quasi-experimental research design in
which the gender of a CEO’s child is effectively exogenous even if the child’s birth is not.
Our main result provides strong support for our hypothesis: Conditional on the number of
children a CEO already has, the birth of a daughter to a male CEO resulted in an
approximately 0.5% reduction of the gender wage gap. The effect was significantly
stronger for the first daughter, resulting in a 0.8% reduction of the gender wage gap,
compared to a statistically insignificant 0.4% reduction after the birth of a second
20
daughter. In addition, if the first daughter was also the first child, the effect was stronger
still, with the gender wage gap decreasing by roughly 2.8%.
We also observe that the birth of a daughter to a male CEO affected classes of
employees differently. The most educated employees experienced a 1% decrease in the
gender wage gap while the least educated employees experienced no effect, perhaps
because CEOs experience a higher degree of social identification with more-educated
women, who they believe their daughters are likely to resemble. Finally, we found that
female employees in small firms experienced the greatest wage increase relative to their
male colleagues, consistent with the idea that the CEOs of small firms have more
autonomy in determining their firms’ wage policies.
Our results have implications for the literature on the gender wage gap and the role
played by discrimination as an underlying mechanism, as well as for the literatures on
social preferences and CEOs’ impact on corporate policies. Our results also raise
important questions. If firms’ gender-related wage policies are influenced by CEOs’
attitudes toward women’s issues, as our results seem to indicate, what other factors
besides family experience might influence CEOs’ attitudes? Could our results be linked
to appropriate interventions that might similarly affect the attitudes of CEOs? We hope
this research will spur interest in addressing these and other related questions.
21
REFERENCES Abowd, John M., Francis Kramarz, and David N. Margolis, “High Wage Workers and
High Wage Firms,” Econometrica, 67 (1999), 251-333.
Akerlof, George A., and Rachel E. Kranton, “Economics and Identity,” Quarterly Journal of Economics, 115 (2000), 715-753.
Albæk, Karsten, and Bent E. Sørensen, “Worker flows and job flows in Danish manufacturing,” The Economic Journal, 108 (1998), 1750–1771.
Angrist, Joshua D., and William N. Evans, “Children and Their Parents’ Labor Supply: Evidence from Exogenous Variation in Family Size,” American Economic Review, 99 (1998), 450-477.
Barnard, Chester I., The Functions of the Executive, (Cambridge, MA: Harvard University Press, 1938)
Bastos, Paulo and Natália P. Monteiro, “Managers and Wage Policies,” Working Paper (2010).
Bayard, Kimberly, Judith Hellerstein, David Neumark, and Kenneth Troske, “New Evidence on Sex Segregation and Sex Differences in Wages from Matched Employer-Employee Data,” Journal of Labor Economics, 21 (2003), 887-922.
Becker, Gary S., The Economics of Discrimination, (Chicago, IL: University of Chicago Press, 1957)
Bennedsen, Morten, Kasper Meisner Nielsen, Francisco Peréz-Gonzaléz, and Daniel Wolfenzon, “Inside the Family Firm: The Role of Families in Succession Decisions and Performance,” Quarterly Journal of Economics, 122 (2007), 647-691.
Bertrand, Marianne, Claudia Goldin, and Lawrence F. Katz, “Dynamics of the Gender Gap for Young Professionals in the Financial and Corporate Sectors,” American Economic Review: Applied Economics, 2 (2010), 228-255.
Bertrand, Marianne, and Kevin F. Hallock, “The Gender Gap in Top Corporate Jobs,” Industrial and Labor Relations Review, 55 (2001), 3-21.
Bertrand, Marianne, Simon Johnson, Krislert Samphantharak, and Antoinette Schoar, “Mixing family with Business: A Study of Thai Business Groups and the Families behind Them,” Journal of Financial Economics, 88 (2008) 466-498.
Bertrand, Marianne, and Sendhil Mullainathan, “Is There Discretion in Wage Setting? A Test Using Takeover Legislation,” Rand Journal of Economics, 30 (1999), 535-554.

22
Bertrand, Marianne, and Sendhil Mullainathan, “Enjoying the Quiet Life? Corporate Governance and Managerial Preferences,” Journal of Political Economy, 111 (2003), 1043-1075.
Bertrand, Marianne, and Antoinette Schoar, “Managing with Style: The Effect of Managers on Firm Policies,” Quarterly Journal of Economics, 118 (2003), 1169-1208.
Black, Sandra E., and Philip E. Strahan, “The Division of Spoils: Rent-Sharing and Discrimination in a Regulated Industry,” American Economic Review, 91 (2001), 814-831.
Black, Sandra E., and Elizabeth Brainerd, “Importing Equality? The Impact of Globalization on Gender Discrimination,” Industrial and Labor Relations Review, 57 (2004), 540-559.
Black, Sandra E., and Paul J. Devereaux, “Recent Developments in Intergenerational Mobility,” NBER Working Paper, (2010).
Blau, Francine D., and Lawrence M. Kahn, “Gender Differences in Pay,” Journal of Economic Perspectives, 14 (2000), 75-99.
Blau, Francine D., and Lawrence M. Kahn, “The US Gender Pay Gap in the 90s: Slowing Convergence,” Industrial and Labor Relations Review, 60 (2006), 45-66.
Blau, Francine D., and Lawrence M. Kahn, “The Gender Pay Gap: Have Women Gone as far as They Can?,” Academy of Management Perspectives, 21 (2007), 7-23.
Bogan, Vicki, “Household Investment Decisions and Offspring Gender: Parental Accounting,” Working Paper (2010).
Bolton, Gary E., and Axel Ockenfels, “ERC – A Theory of Equity, Reciprocity, and Competition,” American Economic Review, 90 (2000), 166-193.
Cardoso, Ana Rute, and Rudolf Winter-Ebmer, “Female-Led Firms and Gender Wage Policies,” Industrial and Labor Relations Review, 64 (2010), 143-163.
Charness, Gary, and Matthew Rabin, “Understanding Social Preferences with Simple Tests,” Quarterly Journal of Economics, 117 (2002), 817-869.
Chen, Yan, and Sherry Xin Li, “Group Identity and Social Preferences,” American Economic Review, 99 (2009), 431-457.
Conley, Dalton, and Emily Rauscher, “The Effect of Daughters on Partisanship,” NBER Working Paper No. 15873, (2010).
Dahl, Gordon B., and Enrico Moretti, “The Demand for Sons,” Review of Economic Studies, 75 (2008), 1085-1120.

23
Dahl, Michael S., “Organizational Change and Employee Stress,” Management Science, (2010), forthcoming.
Dezső, Cristan L., and David Gaddis Ross, “Does Female Representation in Top Management Improve Firm Performance? A Panel Data Investigation,” Working Paper (2010).
Fehr, Ernst, and John A. List, “The Hidden Costs and Returns of Incentives – Trust and Trustworthiness among CEOs,” Journal of the European Economic Association, 2 (2004), 743-771.
Fehr, Ernst, and Klaus M. Schmidt, “A Theory of Fairness, Competition, and Cooperation,” Quarterly Journal of Economics, 114 (1999), 817-868.
Goldin, Claudia, “The Quiet Revolution That Transformed Women’s Employment, Education, and Family,” American Economic Review, Papers and Proceedings, 96 (2006), 1-21.
Goldin, Claudia, Lawrence F. Katz, and Ilyana Kuziemko, “The Homecoming of American College Women: The Reversal of the Gender Gap in College,” Journal of Economic Perspectives, 20 (2006), 133-156.
Goldin, Claudia, and Cecilia Rouse, “Orchestrating Impartiality: The Impact of “Blind” Auditions on Female Musicians,” American Economic Review, 90 (2000), 715-741.
Haveman, Robert, and Barbara Wolfe, “The Determinants of Children’s Attainments: A Review of Methods and Findings,” Journal of Economic Literature, 53, (1995), 1829-1878.
Kohler, Hans-Peter, Jere R. Behrman, and Axel Skytthe, “Partner + Children = Happiness? The Effects of Partnership and Fertility on Well-Being,” Population and Development Review, 31, (2005), 407-445.
Lawson, David W., and Ruth Mace, “Trade-offs in Modern Parenting: A Longitudinal Study of Sibling Competition for Parental Care,” Evolution and Human Behavior, 30, (2009), 170-183.
Levitt, Steven D., and John A. List, “What Do Laboratory Experiments Measuring Social Preferences Reveal About the Real World?,” Journal of Economic Perspectives, 21 (2007), 153-174.
Lundberg, Shelly, and Elaina Rose, “The Effects of Sons and Daughters on Men’s Labor Supply and Wages.” Review of Economics and Statistics, 84 (2002), 251-268.
Malmendier, Ulrike, and Geoffrey Tate, “CEO Overconfidence and Corporate Investment,” Journal of Finance, 60 (2005), 2661-2700.

24
Malmendier, Ulrike, and Geoffrey Tate, “Who Makes Acquisitions? CEO Overconfidence and the Market’s Reaction,” Journal of Financial Economics, 89 (2008), 20-53.
Malmendier, Ulrike, and Geoffrey Tate, “Superstar CEOs,” Quarterly Journal of Economics, 124 (2009), 1593-1638.
Malmendier, Ulrike, Geoffrey Tate, and Jon Yan, “Overconfidence and Early-life Experiences: The Impact of Managerial Traits on Corporate Financial Policies,” Journal of Financial Economics, (2010), forthcoming.
Neumark, David M., “Sex Discrimination in Restaurant Hiring: an Audit Study” Quarterly Journal of Economics, 111 (1996), 915–41.
Oswald, Andrew J., and Natttavudh Powdthavee, “Daughters and Left-Wing Voting,” Review of Economics and Statistics, 92 (2010), 213-227.
Peréz-Gonzaléz, Francisco, “Inherited Control and Firm Performance,” American Economic Review, 96 (2006), 1559-1588.
Schoar, Antoinette, “CEO Careers and Styles,” Working Paper, (2007).
Solon, Gary, “Intergenerational Mobility in the Labor Market,” in: Orley Ashenfelter and David Card, eds., Handbook of Labor Economics, Vol. III (Amsterdam: North Holland 1999), 1761-1800.
Sørensen, Jesper B. and Olav Sorenson, “Corporate demography and income inequality,” American Sociological Review, 72 (2007), 766–783.
Warner, Rebecca L., “Does the Sex of Your Child Matter? Support for Feminism among Women and Men in the United States and Canada,” Journal of Marriage and the Family, 53 (1991), 1051-1056.
Warner, Rebecca L., and Brent S. Steel, “Child Rearing as a Mechanism for Social Change: The Relationship of Child Gender to Parents’ Commitment to Gender Equity,” Gender and Society, 13 (1999), 503-517.
Washington, Ebonya L., “Female Socialization: How Daughters Affect Their Legislator Fathers’ Voting on Women’s Issues,” American Economic Review, 98 (2008), 311-332.

25
Table I
Summary Statistics Female Employees Male Employees
Employee-Year Level Variables Mean Std. Dev. Mean Std. Dev.
Employee-Year Observations 834,885 1,910,765 Dependent Variable Wages (ln; 2010 kroner) 12.338 0.6819 12.580 0.6991 Demographic Characteristics Age (ln) 3.635 0.2884 3.634 0.3149 Years of Education (ln) 2.460 0.2276 2.488 0.2275 Marital Status (Married = 1) 0.630 0.4829 0.590 0.4918 Children under 5 years 0.280 0.5775 0.261 0.5748 Children between 5 and 17 years 0.525 0.8223 0.446 0.7960 Employment Characteristics Full Time Status (Full Time = 1) 0.926 0.2611 0.957 0.2036 Years of Firm Tenure (ln) 1.306 0.9971 1.371 1.0081 Blue Collar Rank 0.694 0.4607 0.740 0.4387 White Collar Rank 0.217 0.4124 0.116 0.3204 Management Rank 0.070 0.2544 0.088 0.2840 Top Management Rank 0.019 0.1362 0.056 0.2291

26
Table I - Continued Summary Statistics
Female CEOs Male CEOs
CEO-Year Level Variables Mean Std. Dev. Mean Std. Dev.
CEO-Year Observations 3,183 42,960 Demographic Characteristics Age (ln) 3.710 0.2841 3.852 0.2024 Number of Daughters 0.712 0.8286 0.955 0.8599 Daughter Births 0.014 0.1155 0.014 0.1164 Number of Children 1.449 1.1152 1.967 1.0106 Child Births 0.029 0.1667 0.027 0.1631 Distribution of Children Zero 0.280 0.4492 0.106 0.3080 One 0.175 0.3803 0.139 0.3464 Two 0.384 0.4865 0.493 0.5000 Three 0.145 0.3517 0.213 0.4095 Four 0.008 0.0883 0.041 0.1983 Five or more 0.008 0.0883 0.007 0.0855 Female CEOs Male CEOs
Firm-Level Variables Mean Std. Dev. Mean Std. Dev.
Size (ln, number of employees) 3.314 0.7278 3.527 0.8307 Profitability (Profit/Sales) 0.033 0.1956 0.032 0.1493 The table presents summary statistics for the variables used in the analysis of employee wages. Statistics for employee-level variables are reported by employee gender and are computed for the respective sub-samples of employee-year observations. Statistics for CEO- and firm-level variables are reported by CEO gender and are computed for the respective sub-samples of CEO-year observations.
27
Table II Employee Salaries
CEO Gender, Employee Education Level, and Firm Size Female Employees Male Employees
Mean Std. Dev. Mean Std. Dev.
By CEO Gender Female CEO 12.262 0.8029 12.519 0.7655 Male CEO 12.344 0.6709 12.583 0.6960
By Education Level
Primary School (6-10 years) 12.214 0.6756 12.331 0.7113 High-School (11-13 years) 12.320 0.6732 12.568 0.7035 College (13+ years) 12.535 0.6621 12.730 0.6464
By Firm Size Small (10-50 employees) 12.285 0.7281 12.511 0.7319 Medium (51-150 employees) 12.302 0.7078 12.560 0.7250 Large (151+ employees) 12.413 0.6079 12.670 0.6288 The table presents summary statistics for employee wages. Statistics are reported by employee gender, and then by CEO gender, education level, and firm size. Statistics are computed for the respective sub-samples of employee-year observations.

28
Table III CEOs’ Daughters and Women’s Wages
(1) (2) (3) (4) CEO Number of Daughters
0.009*** (0.001)
By CEO Gender CEO Number of Daughters x Female CEO 0.005***
(0.0018)
CEO Number of Daughters x Male CEO 0.010***
(0.0007)
Wald Test for Equal Coefficients (F-statistic and p-value) 6.86***
(0.0088)
By Employee Gender CEO Number of Daughters x Female Employee 0.012***
(0.0011)
CEO Number of Daughters x Male Employee 0.008***
(0.0008)
Wald Test for Equal Coefficients (F-statistic and p-value) 11.84***
(0.0006)
By CEO x Employee Gender CEO Number of Daughters x Female CEO x Female Employee 0.004
(0.0028) CEO Number of Daughters x Female CEO x Male Employee
0.006**
(0.0023) Wald Test for Equal Coefficients (F-statistic and p-value) 0.15
(0.6952) CEO Number of Daughters x Male CEO x Female Employee 0.013***
(0.0011) CEO Number of Daughters x Male CEO x Male Employee 0.008***
(0.0008) Wald Test for Equal Coefficients (F-statistic and p-value) 14.98***
(0.0001)

29
Table III – continued CEOs’ Daughters and Women’s Wages
(1) (2) (3) (4) Employee Controls Age (ln)
3.082*** (0.0223)
3.082*** (0.0223)
3.082*** (0.0223)
3.082*** (0.0223)
Years of Education (ln)
0.892*** (0.0125)
0.892*** (0.0125)
0.892*** (0.0125)
0.892*** (0.0125)
Married
0.020*** (0.0020)
0.020*** (0.0020)
0.020*** (0.0020)
0.020*** (0.0020)
Married x Female
-0.066*** (0.0036)
-0.067*** (0.0036)
-0.067*** (0.0036)
-0.066*** (0.0036)
Children under 5
-0.023*** (0.0012)
-0.023*** (0.0012)
-0.023*** (0.0012)
-0.023*** (0.0012)
Children under 5 x Female
-0.093*** (0.0022)
-0.093*** (0.0022)
-0.093*** (0.0022)
-0.093*** (0.0022)
Children between 5 and 17
-0.033*** (0.0009)
-0.034*** (0.0009)
-0.033*** (0.0009)
-0.033*** (0.0009)
Full Time
0.292*** (0.0026)
0.292*** (0.0026)
0.292*** (0.0026)
0.292*** (0.0026)
Tenure
0.274*** (0.0009)
0.274*** (0.0009)
0.274*** (0.0009)
0.274*** (0.0009)
CEO Controls Age
0.292*** (0.0026)
0.292*** (0.0026)
0.292*** (0.0026)
0.292*** (0.0026)
Firm Controls Firm Size
0.054*** (0.0011)
0.054*** (0.0011)
0.054*** (0.0011)
0.054*** (0.0011)
Firm Profitability
0.013*** (0.0015)
0.013*** (0.0015)
0.013*** (0.0015)
0.013*** (0.0015)
Fixed Effects CEO-Employee Y Y Y Y Number of Children (CEO) Y Y Y Y Hierarchical Rank Y Y Y Y Year Y Y Y Y Observations 2,745,650 2,745,650 2,745,650 2,745,650 R2 0.1920 0.1920 0.1920 0.1920 The table presents least squares regressions of employee wages on the number of daughters of the CEO, with fixed effects for the CEO-employee match, the CEO’s total number of children, the employee’s hierarchical rank, and year. In Columns (2) – (4), the effect of the number of daughters of the CEO is differentiated by, respectively, the CEO’s gender, the employee’s gender, and the gender of both the CEO and employee. Standard errors are in parentheses under each coefficient and are robust to heteroskedasticity and arbitrary within- and across-panel correlation. Wald tests for the equality of coefficients are presented in Columns (2) – (4). ***, **, and * denote significance at the 1, 5, and 10 percent levels, respectively.
30
Table IV CEOs’ Daughters and Women’s Wages
The Rank Order at Birth
Full Sample First Daughter
First Daughter
is First Child
Second Daughter
By CEO x Employee Gender CEO Number of Daughters x Female CEO x Female Employee
0.004 (0.0028)
0.008 (0.0066)
0.026 (0.0161)
0.003 (0.0052)
CEO Number of Daughters x Female CEO x Male Employee
0.006 (0.0023)
0.022*** (0.0058)
0.061*** (0.0139)
0.006 (0.0041)
Wald Test for Equal Coefficients (F-statistic and p-value)
0.15 (0.6952)
2.47 (0.1161)
3.00* (0.0832)
0.25 (0.6171)
CEO Number of Daughters x Male CEO x Female Employee
0.013*** (0.0011)
0.014*** (0.0025)
0.032*** (0.0084)
0.010*** (0.0031)
CEO Number of Daughters x Male CEO x Male Employee
0.008*** (0.0008)
0.006*** (0.0018)
0.005 (0.0058)
0.006*** (0.0021)
Wald Test for Equal Coefficients (F-statistic and p-value)
14.98*** (0.0001)
6.90*** (0.0086)
9.59*** (0.0020)
1.39 (0.2381)
Fixed Effects CEO-Employee Y Y Y Y Number of Children (CEO) Y Y Y Y Hierarchical Rank Y Y Y Y Year Y Y Y Y Observations 2,745,650 2,058,260 670,219 1,644,869 R2 0.1920 0.1890 0.1869 0.1864 The table repeats the analysis in Table III for subsamples reflecting the rank order at birth of a CEO’s daughters. The second column is limited to the subsample of firms with CEOs who have no or only one daughter. The third column is limited to the subsample of firms with CEOs who have no children or only one daughter. The fourth column is limited to the subsample of firms with CEOs who have one or two daughters. ***, **, and * denote significance at the 1, 5, and 10 percent levels, respectively.
31
Table V CEOs’ Daughters and Women’s Wages
The Education Level Full Sample Primary
School High School/ Gymnasium
College/ University
By CEO x Employee Gender CEO Number of Daughters x Female CEO x Female Employee
0.004 (0.0028)
-0.002 (0.0058)
0.003 (0.0045)
0.014*** (0.0043)
CEO Number of Daughters x Female CEO x Male Employee
0.006 (0.0023)
0.000 (0.0051)
0.006 (0.0046)
0.010*** (0.0032)
Wald Test for Equal Coefficients (F-statistic and p-value)
0.15 (0.6952)
0.13 (0.7234)
0.25 (0.6162)
0.65 (0.4206)
CEO Number of Daughters x Male CEO x Female Employee
0.013*** (0.0011)
0.010*** (0.0021)
0.014*** (0.0018)
0.017*** (0.0022)
CEO Number of Daughters x Male CEO x Male Employee
0.008*** (0.0008)
0.009*** (0.0016)
0.008*** (0.0017)
0.008*** (0.0012)
Wald Test for Equal Coefficients (F-statistic and p-value)
14.98*** (0.0001)
0.13 (0.7173)
8.66*** (0.0033)
14.15*** (0.0002)
Fixed Effects CEO-Employee Y Y Y Y Number of Children (CEO) Y Y Y Y Hierarchical Rank Y Y Y Y Year Y Y Y Y Observations 2,745,650 796,997 819,641 1,129,012 R2 0.1920 0.1844 0.1818 0.1635 The table repeats the analysis in Table III for employees with different levels of education. ***, **, and * denote significance at the 1, 5, and 10 percent levels, respectively.

32
Table VI CEOs’ Daughters and Women’s Wages
The Firm Size Full Sample Small Firms Medium-
Sized Firms Large Firms
By CEO x Employee Gender CEO Number of Daughters x Female CEO x Female Employee
0.004 (0.0028)
0.013** (0.0059)
0.011 (0.0073)
-0.006 (0.0036)
CEO Number of Daughters x Female CEO x Male Employee
0.006 (0.0023)
0.004 (0.0050)
0.013*** (0.0045)
0.000 (0.0030)
Wald Test for Equal Coefficients (F-statistic and p-value)
0.15 (0.6952)
1.66 (0.1971)
0.10 (0.7567)
1.76 (0.1845)
CEO Number of Daughters x Male CEO x Female Employee
0.013*** (0.0011)
0.015*** (0.0025)
0.004 (0.0025)
0.013*** (0.0014)
CEO Number of Daughters x Male CEO x Male Employee
0.008*** (0.0008)
0.001 (0.0019)
0.007*** (0.0016)
0.012*** (0.0010)
Wald Test for Equal Coefficients (F-statistic and p-value)
14.98*** (0.0001)
27.76*** (0.0000)
1.35 (0.2456)
0.33 (0.5640)
Fixed Effects CEO-Employee Y Y Y Y Number of Children (CEO) Y Y Y Y Hierarchical Rank Y Y Y Y Year Y Y Y Y Observations 2,745,650 955,546 818,924 971,180 R2 0.1920 0.2280 0.1637 0.1937 The table repeats the analysis in Table III for employees of firms of different sizes. ***, **, and * denote significance at the 1, 5, and 10 percent levels, respectively.