Embed Size (px)
Citation preview

TOPLINE
Monthly Harvard-Harris Poll: March 2018
Limited Release: Approval, Favorability, and Midterm Ballot Question
This survey was conducted online within the United States from March 27-29, 2018 among
1,340 registered voters by The Harris Poll.
The results reflect a nationally representative sample. Results were weighted for age within
gender, region, race/ethnicity, marital status, household size, income, employment,
political party, political ideology, and education where necessary to align them with their
actual proportions in the population. Propensity score weighting was also used to adjust for
respondents’ propensity to be online.

Base n=1340
AGE*
18-34 26%
35-49 25%
50-64 29%
65+ 21%
SEX*
Male 49%
Female 51%
EDUCATION*
Less than high school degree 8% High school degree to less than 4 year college degree 57% 4 year college degree or more 35% RACE/ETHNICITY*
White 68%
Black/African American 12%
Hispanic 12%
Asian 4%
Other 3%
*Denotes weighting variable
Base n=1340
POLITICAL PARTY*
Democrat 37%
Republican 32%
Independent 29%
Other 2%
LOCALE
Urban 33%
Suburban 47%
Rural 20%
POLITICAL IDEOLOGY*
Liberal 27%
Moderate 42%
Conservative 31%

Page 1
Fielding Period: March 27-29, 2018
HCAPS (Filtered on Registered Voters)
Weighted To The U.S. General Adult Population - Propensity
30 Mar 2018
Table 1
D1 What is your age?
Base: All Respondents
Presidential
Election Candidate
Gender Age Ethnicity Political Party Political Ideology Voted For Education Locale Income
_____________ ______________________ _______________________ ____________________ ____________________ _____________________ _____________ ________________ _________
Colle- Some
Cons- ge Gr- Colle- $75K Less
Hisp- Black Repub- Democ- Indep- Libe- Mode- erva- 3rd ad And ge Or Urb- Subu- Or Than
Total Male Female 18-34 35-49 50-64 65+ White anic /AA Other lican rat endent ral rate tive Clinton Trump Party Higher Less an rban Rural More $75K
______ _____ _______ _____ _____ _____ ____ _____ _____ _____ _____ ______ ______ ______ ______ ______ ______ ________ ______ _____ ______ ______ ____ _____ _____ ____ ____
Unweighted Base 1340 538 802 296 337 392 315 1078 68 123 27 415 478 384 366 551 423 491 511 106 452 888 398 633 309 404 868
Weighted Base 1340 658 682 343 329 387 282 910 161 165 45 429 496 389 364 558 418 514 507 90 469 871 442 636 263 563 715
Effective Base 720 324 402 155 187 207 184 611 48 79 16 232 261 206 197 299 225 269 285 62 260 461 224 340 160 251 466
18-34 343 156 187 343 - - - 182 64 49 10 102 135 99 113 156 74 101 102 26 123 220 164 131 48 131 189
26% 24% 27% 100% - - - 20% 40% 29% 22% 24% 27% 26% 31% 28% 18% 20% 20% 29% 26% 25% 37% 21% 18% 23% 26%
35-49 329 155 174 - 329 - - 219 41 41 16 114 111 95 97 137 95 132 129 20 135 193 106 160 62 159 163
25% 24% 25% - 100% - - 24% 26% 25% 37% 27% 22% 24% 27% 25% 23% 26% 25% 23% 29% 22% 24% 25% 24% 28% 23%
50-64 387 212 175 - - 387 - 272 41 54 10 114 148 120 87 165 135 179 148 24 124 263 101 193 93 163 210
29% 32% 26% - - 100% - 30% 26% 33% 22% 26% 30% 31% 24% 29% 32% 35% 29% 26% 26% 30% 23% 30% 35% 29% 29%
65+ 282 135 147 - - - 282 237 14 21 9 100 102 75 68 100 114 102 127 20 88 195 70 153 59 109 153
21% 20% 22% - - - 100% 26% 9% 13% 19% 23% 20% 19% 19% 18% 27% 20% 25% 22% 19% 22% 16% 24% 23% 19% 21%
Mean 48.5 49.1 48.0 27.1 41.9 56.8 71.0 51.1 42.0 46.5 45.8 49.2 48.3 48.2 46.4 47.3 52.1 50.2 50.8 48.2 47.0 49.4 43.8 50.6 51.5 48.0 48.9
Std. Dev. 16.63 16.21 17.02 5.09 4.51 4.24 4.88 16.37 15.11 15.92 16.17 16.90 16.76 16.15 16.76 16.28 16.43 15.31 16.22 16.90 15.83 16.99 16.49 16.4115.6715.9716.59
Std. Err. 0.45 0.70 0.60 0.30 0.25 0.21 0.27 0.50 1.83 1.44 3.11 0.83 0.77 0.82 0.88 0.69 0.80 0.69 0.72 1.64 0.74 0.57 0.83 0.65 0.89 0.79 0.56
Sigma 1340 658 682 343 329 387 282 910 161 165 45 429 496 389 364 558 418 514 507 90 469 871 442 636 263 563 715
100% 100% 100% 100% 100% 100% 100% 100% 100% 100% 100% 100% 100% 100% 100% 100% 100% 100% 100% 100% 100% 100% 100% 100% 100% 100% 100%

Page 2
Fielding Period: March 27-29, 2018
HCAPS (Filtered on Registered Voters)
Weighted To The U.S. General Adult Population - Propensity
30 Mar 2018
Table 2
D2 What is your gender?
Base: All Respondents
Presidential
Election Candidate
Gender Age Ethnicity Political Party Political Ideology Voted For Education Locale Income
_____________ ______________________ _______________________ ____________________ ____________________ _____________________ _____________ ________________ _________
Colle- Some
Cons- ge Gr- Colle- $75K Less
Hisp- Black Repub- Democ- Indep- Libe- Mode- erva- 3rd ad And ge Or Urb- Subu- Or Than
Total Male Female 18-34 35-49 50-64 65+ White anic /AA Other lican rat endent ral rate tive Clinton Trump Party Higher Less an rban Rural More $75K
______ _____ _______ _____ _____ _____ ____ _____ _____ _____ _____ ______ ______ ______ ______ ______ ______ ________ ______ _____ ______ ______ ____ _____ _____ ____ ____
Unweighted Base 1340 538 802 296 337 392 315 1078 68 123 27 415 478 384 366 551 423 491 511 106 452 888 398 633 309 404 868
Weighted Base 1340 658 682 343 329 387 282 910 161 165 45 429 496 389 364 558 418 514 507 90 469 871 442 636 263 563 715
Effective Base 720 324 402 155 187 207 184 611 48 79 16 232 261 206 197 299 225 269 285 62 260 461 224 340 160 251 466
Male 658 658 - 156 155 212 135 482 59 67 19 239 209 203 172 254 233 240 295 51 273 385 233 305 120 340 290
49% 100% - 46% 47% 55% 48% 53% 37% 41% 42% 56% 42% 52% 47% 45% 56% 47% 58% 56% 58% 44% 53% 48% 46% 60% 41%
Female 682 - 682 187 174 175 147 428 102 98 26 190 286 186 193 304 185 274 212 39 196 486 209 331 143 223 425
51% - 100% 54% 53% 45% 52% 47% 63% 59% 58% 44% 58% 48% 53% 55% 44% 53% 42% 44% 42% 56% 47% 52% 54% 40% 59%
Sigma 1340 658 682 343 329 387 282 910 161 165 45 429 496 389 364 558 418 514 507 90 469 871 442 636 263 563 715
100% 100% 100% 100% 100% 100% 100% 100% 100% 100% 100% 100% 100% 100% 100% 100% 100% 100% 100% 100% 100% 100% 100% 100% 100% 100% 100%

Page 3
Fielding Period: March 27-29, 2018
HCAPS (Filtered on Registered Voters)
Weighted To The U.S. General Adult Population - Propensity
30 Mar 2018
Table 3
S2 In which state do you reside?
Base: All Respondents
Presidential
Election Candidate
Gender Age Ethnicity Political Party Political Ideology Voted For Education Locale Income
_____________ ______________________ _______________________ ____________________ ____________________ _____________________ _____________ ________________ _________
Colle- Some
Cons- ge Gr- Colle- $75K Less
Hisp- Black Repub- Democ- Indep- Libe- Mode- erva- 3rd ad And ge Or Urb- Subu- Or Than
Total Male Female 18-34 35-49 50-64 65+ White anic /AA Other lican rat endent ral rate tive Clinton Trump Party Higher Less an rban Rural More $75K
______ _____ _______ _____ _____ _____ ____ _____ _____ _____ _____ ______ ______ ______ ______ ______ ______ ________ ______ _____ ______ ______ ____ _____ _____ ____ ____
Unweighted Base 1340 538 802 296 337 392 315 1078 68 123 27 415 478 384 366 551 423 491 511 106 452 888 398 633 309 404 868
Weighted Base 1340 658 682 343 329 387 282 910 161 165 45 429 496 389 364 558 418 514 507 90 469 871 442 636 263 563 715
Effective Base 720 324 402 155 187 207 184 611 48 79 16 232 261 206 197 299 225 269 285 62 260 461 224 340 160 251 466
Alabama 9 4 5 3 2 3 1 6 - 2 - 3 2 4 * 4 5 2 7 - 4 5 1 6 2 3 5
1% 1% 1% 1% 1% 1% * 1% - 1% - 1% * 1% * 1% 1% * 1% - 1% 1% * 1% 1% 1% 1%
Alaska 5 5 - - - 5 - - 5 - - - - 5 - - 5 - 5 - - 5 - 5 - 5 -
* 1% - - - 1% - - 3% - - - - 1% - - 1% - 1% - - 1% - 1% - 1% -
Arizona 30 15 14 9 6 10 5 19 9 - 1 9 8 11 6 19 5 12 7 4 15 14 11 16 2 11 18
2% 2% 2% 3% 2% 3% 2% 2% 6% - 2% 2% 2% 3% 2% 3% 1% 2% 1% 5% 3% 2% 3% 3% 1% 2% 2%
Arkansas 7 3 4 - - 7 - 4 - 3 - * 5 1 3 4 * 5 1 1 4 3 - 2 4 1 6
* * 1% - - 2% - * - 2% - * 1% * 1% 1% * 1% * 1% 1% * - * 2% * 1%
California 159 85 75 51 30 54 25 78 51 8 10 37 73 46 57 71 32 71 44 8 55 104 84 64 11 87 72
12% 13% 11% 15% 9% 14% 9% 9% 32% 5% 22% 9% 15% 12% 16% 13% 8% 14% 9% 9% 12% 12% 19% 10% 4% 15% 10%
Colorado 16 11 5 3 4 7 2 14 - 1 - 9 4 3 5 5 6 4 12 - 11 5 6 9 1 10 6
1% 2% 1% 1% 1% 2% 1% 2% - 1% - 2% 1% 1% 1% 1% 1% 1% 2% - 2% 1% 1% 1% * 2% 1%
Connecticut 17 12 6 1 9 4 2 17 - - - 5 8 5 7 7 3 8 8 - 5 13 1 14 2 12 5
1% 2% 1% * 3% 1% 1% 2% - - - 1% 2% 1% 2% 1% 1% 2% 1% - 1% 1% * 2% 1% 2% 1%
Delaware 3 2 1 1 * - 2 1 - - 2 - 3 * 1 - 2 1 2 - 1 2 2 1 - 1 2
* * * * * - 1% * - - 4% - 1% * * - * * * - * * * * - * *
District of Columbia 3 3 1 3 - 1 - 3 - 1 - 2 1 - 1 3 - 1 3 - 3 1 3 - - 3 1
* * * 1% - * - * - * - * * - * * - * 1% - 1% * 1% - - * *
Florida 103 35 68 25 32 20 27 75 22 6 - 34 29 37 16 52 35 34 35 6 32 71 44 49 10 38 55
8% 5% 10% 7% 10% 5% 9% 8% 14% 3% - 8% 6% 10% 4% 9% 8% 7% 7% 7% 7% 8% 10% 8% 4% 7% 8%
Georgia 68 31 36 26 14 18 9 28 12 18 6 23 33 11 18 34 16 26 18 1 14 54 15 33 20 26 29
5% 5% 5% 8% 4% 5% 3% 3% 7% 11% 14% 5% 7% 3% 5% 6% 4% 5% 4% 1% 3% 6% 3% 5% 8% 5% 4%
Hawaii 6 5 1 1 1 3 1 4 - - - 3 1 2 2 1 3 1 2 1 3 3 1 3 2 3 3
* 1% * * * 1% * * - - - 1% * * 1% * 1% * * 1% 1% * * * 1% * *
Idaho 3 3 * - 3 - * 3 - - - - * 3 - 2 1 - * 2 3 * - 3 * 3 *
* * * - 1% - * * - - - - * 1% - * * - * 3% 1% * - * * 1% *

Page 4
Fielding Period: March 27-29, 2018
HCAPS (Filtered on Registered Voters)
Weighted To The U.S. General Adult Population - Propensity
30 Mar 2018
Table 3
S2 In which state do you reside?
Base: All Respondents
Presidential
Election Candidate
Gender Age Ethnicity Political Party Political Ideology Voted For Education Locale Income
_____________ ______________________ _______________________ ____________________ ____________________ _____________________ _____________ ________________ _________
Colle- Some
Cons- ge Gr- Colle- $75K Less
Hisp- Black Repub- Democ- Indep- Libe- Mode- erva- 3rd ad And ge Or Urb- Subu- Or Than
Total Male Female 18-34 35-49 50-64 65+ White anic /AA Other lican rat endent ral rate tive Clinton Trump Party Higher Less an rban Rural More $75K
______ _____ _______ _____ _____ _____ ____ _____ _____ _____ _____ ______ ______ ______ ______ ______ ______ ________ ______ _____ ______ ______ ____ _____ _____ ____ ____
Weighted Base 1340 658 682 343 329 387 282 910 161 165 45 429 496 389 364 558 418 514 507 90 469 871 442 636 263 563 715
Illinois 40 18 23 8 12 12 10 35 2 2 - 11 16 12 7 18 15 17 11 5 9 31 7 22 12 12 28
3% 3% 3% 2% 4% 3% 4% 4% 1% 1% - 3% 3% 3% 2% 3% 4% 3% 2% 5% 2% 4% 2% 3% 4% 2% 4%
Indiana 22 12 10 4 4 7 7 17 3 - - 7 10 5 3 7 11 5 10 - 5 17 8 5 8 5 16
2% 2% 1% 1% 1% 2% 3% 2% 2% - - 2% 2% 1% 1% 1% 3% 1% 2% - 1% 2% 2% 1% 3% 1% 2%
Iowa 11 6 5 3 5 1 1 9 1 * - 1 4 6 5 4 2 6 3 * 3 8 3 1 6 1 10
1% 1% 1% 1% 2% * * 1% 1% * - * 1% 2% 1% 1% * 1% 1% 1% 1% 1% 1% * 2% * 1%
Kansas 15 5 10 7 2 1 4 10 2 2 1 4 7 3 5 9 1 6 3 1 6 9 5 7 3 5 10
1% 1% 1% 2% 1% * 2% 1% 1% 1% 2% 1% 1% 1% 1% 2% * 1% 1% 1% 1% 1% 1% 1% 1% 1% 1%
Kentucky 23 13 9 5 7 5 7 21 - 2 - 5 9 8 6 12 5 10 9 2 6 16 3 14 6 5 17
2% 2% 1% 1% 2% 1% 2% 2% - 1% - 1% 2% 2% 2% 2% 1% 2% 2% 2% 1% 2% 1% 2% 2% 1% 2%
Louisiana 13 4 9 3 2 7 1 12 - 1 - 11 1 1 * 5 8 1 8 - 2 12 * 7 6 6 7
1% 1% 1% 1% 1% 2% * 1% - 1% - 3% * * * 1% 2% * 2% - * 1% * 1% 2% 1% 1%
Maine 5 1 4 3 * 1 - 5 - - - 1 3 1 3 2 - 1 1 * 2 3 1 2 2 1 4
* * 1% 1% * * - 1% - - - * 1% * 1% * - * * * * * * * 1% * 1%
Maryland 38 22 16 12 11 9 6 18 - 16 4 7 19 10 12 18 8 25 11 1 22 16 15 22 1 26 11
3% 3% 2% 4% 3% 2% 2% 2% - 10% 8% 2% 4% 3% 3% 3% 2% 5% 2% 1% 5% 2% 3% 3% * 5% 2%
Massachusetts 23 8 15 2 4 7 11 20 3 - - * 9 13 9 9 6 7 8 1 8 15 8 14 2 8 13
2% 1% 2% 1% 1% 2% 4% 2% 2% - - * 2% 3% 2% 2% 1% 1% 2% 1% 2% 2% 2% 2% 1% 1% 2%
Michigan 42 22 20 5 10 17 10 36 3 2 - 12 13 17 15 15 12 20 16 3 20 22 10 24 8 18 24
3% 3% 3% 2% 3% 4% 3% 4% 2% 1% - 3% 3% 4% 4% 3% 3% 4% 3% 3% 4% 3% 2% 4% 3% 3% 3%
Minnesota 14 10 4 1 3 4 6 14 - - - 6 5 3 2 5 7 3 10 - 5 9 5 6 3 9 5
1% 1% 1% * 1% 1% 2% 2% - - - 1% 1% 1% * 1% 2% 1% 2% - 1% 1% 1% 1% 1% 2% 1%
Mississippi 11 5 6 6 2 2 1 3 2 5 - 4 4 3 2 4 5 1 5 - 4 7 5 3 3 3 8
1% 1% 1% 2% 1% 1% * * 1% 3% - 1% 1% 1% 1% 1% 1% * 1% - 1% 1% 1% * 1% * 1%
Missouri 20 7 12 5 6 6 3 17 1 1 - 4 5 11 5 6 9 5 5 3 6 14 5 10 4 8 11
1% 1% 2% 2% 2% 2% 1% 2% * * - 1% 1% 3% 1% 1% 2% 1% 1% 3% 1% 2% 1% 2% 2% 1% 2%
Montana * - * - - * - * - - - * - - - - * - * - - * - - * - *
* - * - - * - * - - - * - - - - * - * - - * - - * - *
Nebraska 6 2 4 * 3 1 2 4 - 2 - 3 2 2 3 1 3 2 2 - 2 4 1 3 2 1 5
* * 1% * 1% * 1% * - 1% - 1% * * 1% * 1% * * - 1% * * * 1% * 1%

Page 5
Fielding Period: March 27-29, 2018
HCAPS (Filtered on Registered Voters)
Weighted To The U.S. General Adult Population - Propensity
30 Mar 2018
Table 3
S2 In which state do you reside?
Base: All Respondents
Presidential
Election Candidate
Gender Age Ethnicity Political Party Political Ideology Voted For Education Locale Income
_____________ ______________________ _______________________ ____________________ ____________________ _____________________ _____________ ________________ _________
Colle- Some
Cons- ge Gr- Colle- $75K Less
Hisp- Black Repub- Democ- Indep- Libe- Mode- erva- 3rd ad And ge Or Urb- Subu- Or Than
Total Male Female 18-34 35-49 50-64 65+ White anic /AA Other lican rat endent ral rate tive Clinton Trump Party Higher Less an rban Rural More $75K
______ _____ _______ _____ _____ _____ ____ _____ _____ _____ _____ ______ ______ ______ ______ ______ ______ ________ ______ _____ ______ ______ ____ _____ _____ ____ ____
Weighted Base 1340 658 682 343 329 387 282 910 161 165 45 429 496 389 364 558 418 514 507 90 469 871 442 636 263 563 715
Nevada 17 8 9 4 6 4 3 14 1 - - 4 8 5 8 7 3 3 10 1 2 15 10 6 2 4 14
1% 1% 1% 1% 2% 1% 1% 2% 1% - - 1% 2% 1% 2% 1% 1% * 2% 1% * 2% 2% 1% 1% 1% 2%
New Hampshire 7 2 5 2 4 1 1 5 - - 2 1 2 4 4 1 2 3 3 1 3 5 1 4 2 2 5
1% * 1% * 1% * * 1% - - 4% * * 1% 1% * * 1% 1% 1% 1% 1% * 1% 1% * 1%
New Jersey 43 24 19 10 12 10 11 37 3 2 - 13 19 9 20 10 13 23 15 * 22 21 7 29 7 29 13
3% 4% 3% 3% 4% 3% 4% 4% 2% 1% - 3% 4% 2% 5% 2% 3% 4% 3% * 5% 2% 2% 5% 3% 5% 2%
New Mexico 16 11 5 8 - 5 3 13 3 - - 8 6 2 2 7 8 4 8 3 8 8 10 5 1 9 7
1% 2% 1% 2% - 1% 1% 1% 2% - - 2% 1% 1% * 1% 2% 1% 1% 4% 2% 1% 2% 1% * 2% 1%
New York 95 47 49 21 30 24 21 57 10 15 6 23 40 29 28 48 19 43 33 7 42 53 48 34 13 51 41
7% 7% 7% 6% 9% 6% 7% 6% 6% 9% 14% 5% 8% 7% 8% 9% 5% 8% 6% 8% 9% 6% 11% 5% 5% 9% 6%
North Carolina 33 11 22 7 5 10 10 19 1 10 1 10 13 11 8 16 9 16 13 - 6 28 5 18 10 8 24
2% 2% 3% 2% 2% 3% 4% 2% 1% 6% 3% 2% 3% 3% 2% 3% 2% 3% 3% - 1% 3% 1% 3% 4% 1% 3%
North Dakota - - - - - - - - - - - - - - - - - - - - - - - - - - -
- - - - - - - - - - - - - - - - - - - - - - - - - - -
Ohio 73 43 29 20 17 26 10 55 - 10 * 25 25 22 19 34 20 25 34 4 25 48 24 36 13 29 44
5% 7% 4% 6% 5% 7% 4% 6% - 6% 1% 6% 5% 6% 5% 6% 5% 5% 7% 4% 5% 5% 5% 6% 5% 5% 6%
Oklahoma 8 3 5 1 2 5 - 7 - - 1 4 3 1 2 3 3 2 3 - * 7 4 1 3 4 3
1% * 1% * 1% 1% - 1% - - 3% 1% 1% * * * 1% * 1% - * 1% 1% * 1% 1% *
Oregon 13 5 8 4 4 3 2 11 2 - - 3 6 4 5 6 2 7 4 1 5 8 4 5 4 4 8
1% 1% 1% 1% 1% 1% 1% 1% 1% - - 1% 1% 1% 1% 1% 1% 1% 1% 1% 1% 1% 1% 1% 1% 1% 1%
Pennsylvania 48 23 26 13 12 17 7 42 2 3 1 25 15 8 9 14 25 16 19 6 17 31 14 14 20 18 28
4% 3% 4% 4% 4% 4% 2% 5% 1% 2% 2% 6% 3% 2% 3% 2% 6% 3% 4% 7% 4% 4% 3% 2% 8% 3% 4%
Rhode Island 4 1 3 1 * 1 1 4 - - - - 1 2 2 2 * 1 1 1 * 4 1 3 1 * 3
* * * * * * * * - - - - * 1% * * * * * 1% * * * * * * *
South Carolina 18 13 5 5 6 3 4 7 - 11 - 5 4 9 7 5 6 9 6 1 8 10 6 5 7 2 12
1% 2% 1% 1% 2% 1% 1% 1% - 7% - 1% 1% 2% 2% 1% 1% 2% 1% 1% 2% 1% 1% 1% 3% * 2%
South Dakota 3 - 3 1 1 - - 3 - - - 2 - 1 - 1 2 1 2 - - 3 - 3 - 2 1
* - * * * - - * - - - * - * - * * * * - - * - * - * *
Tennessee 36 21 15 8 12 5 11 27 6 3 - 23 5 7 8 9 19 9 22 1 17 19 14 16 6 16 19
3% 3% 2% 2% 4% 1% 4% 3% 4% 2% - 5% 1% 2% 2% 2% 5% 2% 4% 2% 4% 2% 3% 3% 2% 3% 3%

Page 6
Fielding Period: March 27-29, 2018
HCAPS (Filtered on Registered Voters)
Weighted To The U.S. General Adult Population - Propensity
30 Mar 2018
Table 3
S2 In which state do you reside?
Base: All Respondents
Presidential
Election Candidate
Gender Age Ethnicity Political Party Political Ideology Voted For Education Locale Income
_____________ ______________________ _______________________ ____________________ ____________________ _____________________ _____________ ________________ _________
Colle- Some
Cons- ge Gr- Colle- $75K Less
Hisp- Black Repub- Democ- Indep- Libe- Mode- erva- 3rd ad And ge Or Urb- Subu- Or Than
Total Male Female 18-34 35-49 50-64 65+ White anic /AA Other lican rat endent ral rate tive Clinton Trump Party Higher Less an rban Rural More $75K
______ _____ _______ _____ _____ _____ ____ _____ _____ _____ _____ ______ ______ ______ ______ ______ ______ ________ ______ _____ ______ ______ ____ _____ _____ ____ ____
Weighted Base 1340 658 682 343 329 387 282 910 161 165 45 429 496 389 364 558 418 514 507 90 469 871 442 636 263 563 715
Texas 82 37 44 20 16 25 21 38 12 26 3 34 35 10 25 35 22 35 29 8 23 59 23 45 13 24 55
6% 6% 6% 6% 5% 6% 8% 4% 8% 16% 7% 8% 7% 3% 7% 6% 5% 7% 6% 9% 5% 7% 5% 7% 5% 4% 8%
Utah 10 2 9 6 2 2 1 5 - - - 2 6 2 2 6 2 2 6 2 2 8 1 9 1 7 3
1% * 1% 2% * * * 1% - - - * 1% 1% 1% 1% 1% * 1% 2% * 1% * 1% * 1% *
Vermont 4 3 1 * 2 2 - 4 - - - 3 1 - 1 - 3 * 3 - * 3 - 1 2 3 1
* * * * 1% * - * - - - 1% * - * - 1% * 1% - * * - * 1% 1% *
Virginia 41 19 21 7 12 13 8 23 - 11 4 17 12 11 11 14 17 14 14 11 17 24 5 28 7 22 17
3% 3% 3% 2% 4% 3% 3% 2% - 7% 10% 4% 2% 3% 3% 2% 4% 3% 3% 12% 4% 3% 1% 4% 3% 4% 2%
Washington 23 9 14 5 7 3 7 19 - 2 1 6 6 10 7 9 6 10 9 2 11 12 9 10 4 8 13
2% 1% 2% 2% 2% 1% 2% 2% - 1% 3% 1% 1% 3% 2% 2% 2% 2% 2% 2% 2% 1% 2% 2% 1% 1% 2%
West Virginia 10 7 3 - * 2 7 10 - - - 7 1 2 - 3 7 - 9 - * 9 1 1 8 * 3
1% 1% * - * 1% 3% 1% - - - 2% * * - * 2% - 2% - * 1% * * 3% * *
Wisconsin 40 18 21 11 5 13 11 30 5 3 1 10 12 16 7 13 20 17 12 2 11 28 7 15 17 13 26
3% 3% 3% 3% 1% 3% 4% 3% 3% 2% 3% 2% 3% 4% 2% 2% 5% 3% 2% 2% 2% 3% 2% 2% 7% 2% 4%
Wyoming 5 2 3 * 2 2 1 5 - - - 5 * * - 1 4 * 4 1 1 4 * 1 4 * 5
* * * * 1% * * 1% - - - 1% * * - * 1% * 1% 1% * * * * 2% * 1%
Sigma 1340 658 682 343 329 387 282 910 161 165 45 429 496 389 364 558 418 514 507 90 469 871 442 636 263 563 715
100% 100% 100% 100% 100% 100% 100% 100% 100% 100% 100% 100% 100% 100% 100% 100% 100% 100% 100% 100% 100% 100% 100% 100% 100% 100% 100%

Page 7
Fielding Period: March 27-29, 2018
HCAPS (Filtered on Registered Voters)
Weighted To The U.S. General Adult Population - Propensity
30 Mar 2018
Table 4
S1 Are you over 18 years of age and registered to vote?
Base: All Respondents
Presidential
Election Candidate
Gender Age Ethnicity Political Party Political Ideology Voted For Education Locale Income
_____________ ______________________ _______________________ ____________________ ____________________ _____________________ _____________ ________________ _________
Colle- Some
Cons- ge Gr- Colle- $75K Less
Hisp- Black Repub- Democ- Indep- Libe- Mode- erva- 3rd ad And ge Or Urb- Subu- Or Than
Total Male Female 18-34 35-49 50-64 65+ White anic /AA Other lican rat endent ral rate tive Clinton Trump Party Higher Less an rban Rural More $75K
______ _____ _______ _____ _____ _____ ____ _____ _____ _____ _____ ______ ______ ______ ______ ______ ______ ________ ______ _____ ______ ______ ____ _____ _____ ____ ____
Unweighted Base 1340 538 802 296 337 392 315 1078 68 123 27 415 478 384 366 551 423 491 511 106 452 888 398 633 309 404 868
Weighted Base 1340 658 682 343 329 387 282 910 161 165 45 429 496 389 364 558 418 514 507 90 469 871 442 636 263 563 715
Effective Base 720 324 402 155 187 207 184 611 48 79 16 232 261 206 197 299 225 269 285 62 260 461 224 340 160 251 466
Yes 1340 658 682 343 329 387 282 910 161 165 45 429 496 389 364 558 418 514 507 90 469 871 442 636 263 563 715
100% 100% 100% 100% 100% 100% 100% 100% 100% 100% 100% 100% 100% 100% 100% 100% 100% 100% 100% 100% 100% 100% 100% 100% 100% 100% 100%
No - - - - - - - - - - - - - - - - - - - - - - - - - - -
- - - - - - - - - - - - - - - - - - - - - - - - - - -
Sigma 1340 658 682 343 329 387 282 910 161 165 45 429 496 389 364 558 418 514 507 90 469 871 442 636 263 563 715
100% 100% 100% 100% 100% 100% 100% 100% 100% 100% 100% 100% 100% 100% 100% 100% 100% 100% 100% 100% 100% 100% 100% 100% 100% 100% 100%
Page 8
Fielding Period: March 27-29, 2018
HCAPS (Filtered on Registered Voters)
Weighted To The U.S. General Adult Population - Propensity
30 Mar 2018
Table 5
M1 In general, do you think the country is on the right track or is it off on the wrong track?
Base: All Respondents
Presidential
Election Candidate
Gender Age Ethnicity Political Party Political Ideology Voted For Education Locale Income
_____________ ______________________ _______________________ ____________________ ____________________ _____________________ _____________ ________________ _________
Colle- Some
Cons- ge Gr- Colle- $75K Less
Hisp- Black Repub- Democ- Indep- Libe- Mode- erva- 3rd ad And ge Or Urb- Subu- Or Than
Total Male Female 18-34 35-49 50-64 65+ White anic /AA Other lican rat endent ral rate tive Clinton Trump Party Higher Less an rban Rural More $75K
______ _____ _______ _____ _____ _____ ____ _____ _____ _____ _____ ______ ______ ______ ______ ______ ______ ________ ______ _____ ______ ______ ____ _____ _____ ____ ____
Unweighted Base 1340 538 802 296 337 392 315 1078 68 123 27 415 478 384 366 551 423 491 511 106 452 888 398 633 309 404 868
Weighted Base 1340 658 682 343 329 387 282 910 161 165 45 429 496 389 364 558 418 514 507 90 469 871 442 636 263 563 715
Effective Base 720 324 402 155 187 207 184 611 48 79 16 232 261 206 197 299 225 269 285 62 260 461 224 340 160 251 466
Right track 490 306 184 118 121 142 110 381 55 27 15 301 84 101 73 155 262 65 367 14 203 286 175 218 96 264 209
37% 47% 27% 34% 37% 37% 39% 42% 34% 16% 34% 70% 17% 26% 20% 28% 63% 13% 72% 16% 43% 33% 40% 34% 37% 47% 29%
Wrong track 711 297 414 176 184 207 143 430 85 129 25 91 364 239 273 319 118 423 91 70 237 474 234 344 133 264 425
53% 45% 61% 51% 56% 54% 51% 47% 53% 78% 55% 21% 73% 61% 75% 57% 28% 82% 18% 77% 50% 54% 53% 54% 51% 47% 59%
Don't know / Unsure 139 55 85 49 24 38 29 99 22 9 5 37 48 49 18 84 38 26 48 6 29 110 33 74 33 35 82
10% 8% 12% 14% 7% 10% 10% 11% 14% 5% 11% 9% 10% 13% 5% 15% 9% 5% 10% 7% 6% 13% 7% 12% 13% 6% 11%
Sigma 1340 658 682 343 329 387 282 910 161 165 45 429 496 389 364 558 418 514 507 90 469 871 442 636 263 563 715
100% 100% 100% 100% 100% 100% 100% 100% 100% 100% 100% 100% 100% 100% 100% 100% 100% 100% 100% 100% 100% 100% 100% 100% 100% 100% 100%

Page 9
Fielding Period: March 27-29, 2018
HCAPS (Filtered on Registered Voters)
Weighted To The U.S. General Adult Population - Propensity
30 Mar 2018
Table 6
M2 In general, do you think the American economy is on the right track or is it off on the wrong track?
Base: All Respondents
Presidential
Election Candidate
Gender Age Ethnicity Political Party Political Ideology Voted For Education Locale Income
_____________ ______________________ _______________________ ____________________ ____________________ _____________________ _____________ ________________ _________
Colle- Some
Cons- ge Gr- Colle- $75K Less
Hisp- Black Repub- Democ- Indep- Libe- Mode- erva- 3rd ad And ge Or Urb- Subu- Or Than
Total Male Female 18-34 35-49 50-64 65+ White anic /AA Other lican rat endent ral rate tive Clinton Trump Party Higher Less an rban Rural More $75K
______ _____ _______ _____ _____ _____ ____ _____ _____ _____ _____ ______ ______ ______ ______ ______ ______ ________ ______ _____ ______ ______ ____ _____ _____ ____ ____
Unweighted Base 1340 538 802 296 337 392 315 1078 68 123 27 415 478 384 366 551 423 491 511 106 452 888 398 633 309 404 868
Weighted Base 1340 658 682 343 329 387 282 910 161 165 45 429 496 389 364 558 418 514 507 90 469 871 442 636 263 563 715
Effective Base 720 324 402 155 187 207 184 611 48 79 16 232 261 206 197 299 225 269 285 62 260 461 224 340 160 251 466
Right track 611 374 238 149 143 188 131 459 64 52 21 332 133 141 108 216 287 121 392 28 242 369 212 279 120 315 271
46% 57% 35% 44% 43% 49% 47% 50% 40% 32% 47% 77% 27% 36% 30% 39% 69% 24% 77% 31% 52% 42% 48% 44% 46% 56% 38%
Wrong track 512 204 309 138 134 140 100 311 66 86 17 59 247 189 199 230 83 291 67 48 162 350 174 236 103 169 324
38% 31% 45% 40% 41% 36% 36% 34% 41% 52% 37% 14% 50% 49% 55% 41% 20% 57% 13% 53% 35% 40% 39% 37% 39% 30% 45%
Don't know / Unsure 216 81 136 55 52 59 50 140 31 27 7 38 116 59 57 112 48 102 47 15 64 152 55 121 40 78 120
16% 12% 20% 16% 16% 15% 18% 15% 19% 16% 16% 9% 23% 15% 16% 20% 11% 20% 9% 16% 14% 17% 12% 19% 15% 14% 17%
Sigma 1340 658 682 343 329 387 282 910 161 165 45 429 496 389 364 558 418 514 507 90 469 871 442 636 263 563 715
100% 100% 100% 100% 100% 100% 100% 100% 100% 100% 100% 100% 100% 100% 100% 100% 100% 100% 100% 100% 100% 100% 100% 100% 100% 100% 100%

Page 10
Fielding Period: March 27-29, 2018
HCAPS (Filtered on Registered Voters)
Weighted To The U.S. General Adult Population - Propensity
30 Mar 2018
Table 7
I3 How strong do you think the U.S. economy is today?
Base: All Respondents
Presidential
Election Candidate
Gender Age Ethnicity Political Party Political Ideology Voted For Education Locale Income
_____________ ______________________ _______________________ ____________________ ____________________ _____________________ _____________ ________________ _________
Colle- Some
Cons- ge Gr- Colle- $75K Less
Hisp- Black Repub- Democ- Indep- Libe- Mode- erva- 3rd ad And ge Or Urb- Subu- Or Than
Total Male Female 18-34 35-49 50-64 65+ White anic /AA Other lican rat endent ral rate tive Clinton Trump Party Higher Less an rban Rural More $75K
______ _____ _______ _____ _____ _____ ____ _____ _____ _____ _____ ______ ______ ______ ______ ______ ______ ________ ______ _____ ______ ______ ____ _____ _____ ____ ____
Unweighted Base 1340 538 802 296 337 392 315 1078 68 123 27 415 478 384 366 551 423 491 511 106 452 888 398 633 309 404 868
Weighted Base 1340 658 682 343 329 387 282 910 161 165 45 429 496 389 364 558 418 514 507 90 469 871 442 636 263 563 715
Effective Base 720 324 402 155 187 207 184 611 48 79 16 232 261 206 197 299 225 269 285 62 260 461 224 340 160 251 466
Very/Somewhat Strong (Net) 925 522 403 224 222 275 204 672 88 97 32 371 308 235 218 367 339 307 448 56 361 564 307 448 170 438 440
69% 79% 59% 65% 68% 71% 72% 74% 54% 59% 72% 87% 62% 60% 60% 66% 81% 60% 88% 62% 77% 65% 70% 70% 65% 78% 61%
Very strong 222 155 67 90 52 44 37 180 14 22 1 145 50 25 58 70 94 36 160 7 113 109 117 73 32 136 78
17% 24% 10% 26% 16% 11% 13% 20% 8% 14% 3% 34% 10% 6% 16% 13% 23% 7% 32% 8% 24% 12% 26% 11% 12% 24% 11%
Somewhat strong 702 367 336 134 170 231 167 492 74 75 31 226 258 210 160 298 245 271 287 49 247 455 190 375 137 302 362
52% 56% 49% 39% 52% 60% 59% 54% 46% 46% 69% 53% 52% 54% 44% 53% 59% 53% 57% 54% 53% 52% 43% 59% 52% 54% 51%
Very/Somewhat Weak (Net) 415 136 279 119 107 112 78 238 73 67 13 57 188 154 146 190 79 207 59 35 108 307 134 188 93 125 276
31% 21% 41% 35% 32% 29% 28% 26% 46% 41% 28% 13% 38% 40% 40% 34% 19% 40% 12% 38% 23% 35% 30% 30% 35% 22% 39%
Somewhat weak 351 123 229 91 92 101 67 209 60 50 11 46 167 126 127 161 63 182 52 26 89 262 109 164 79 105 235
26% 19% 34% 27% 28% 26% 24% 23% 37% 30% 25% 11% 34% 32% 35% 29% 15% 35% 10% 29% 19% 30% 25% 26% 30% 19% 33%
Very weak 64 14 50 28 15 11 11 28 13 18 1 12 22 28 19 30 15 25 7 8 19 45 26 24 14 20 41
5% 2% 7% 8% 4% 3% 4% 3% 8% 11% 3% 3% 4% 7% 5% 5% 4% 5% 1% 9% 4% 5% 6% 4% 5% 4% 6%
Sigma 1340 658 682 343 329 387 282 910 161 165 45 429 496 389 364 558 418 514 507 90 469 871 442 636 263 563 715
100% 100% 100% 100% 100% 100% 100% 100% 100% 100% 100% 100% 100% 100% 100% 100% 100% 100% 100% 100% 100% 100% 100% 100% 100% 100% 100%

Page 11
Fielding Period: March 27-29, 2018
HCAPS (Filtered on Registered Voters)
Weighted To The U.S. General Adult Population - Propensity
30 Mar 2018
Table 8
I4 Would you say that your personal financial situation is improving or getting worse?
Base: All Respondents
Presidential
Election Candidate
Gender Age Ethnicity Political Party Political Ideology Voted For Education Locale Income
_____________ ______________________ _______________________ ____________________ ____________________ _____________________ _____________ ________________ _________
Colle- Some
Cons- ge Gr- Colle- $75K Less
Hisp- Black Repub- Democ- Indep- Libe- Mode- erva- 3rd ad And ge Or Urb- Subu- Or Than
Total Male Female 18-34 35-49 50-64 65+ White anic /AA Other lican rat endent ral rate tive Clinton Trump Party Higher Less an rban Rural More $75K
______ _____ _______ _____ _____ _____ ____ _____ _____ _____ _____ ______ ______ ______ ______ ______ ______ ________ ______ _____ ______ ______ ____ _____ _____ ____ ____
Unweighted Base 1340 538 802 296 337 392 315 1078 68 123 27 415 478 384 366 551 423 491 511 106 452 888 398 633 309 404 868
Weighted Base 1340 658 682 343 329 387 282 910 161 165 45 429 496 389 364 558 418 514 507 90 469 871 442 636 263 563 715
Effective Base 720 324 402 155 187 207 184 611 48 79 16 232 261 206 197 299 225 269 285 62 260 461 224 340 160 251 466
Improving 457 264 194 162 114 121 61 326 38 56 16 207 133 112 95 173 190 139 235 26 203 254 192 193 73 255 181
34% 40% 28% 47% 35% 31% 22% 36% 24% 34% 36% 48% 27% 29% 26% 31% 45% 27% 46% 28% 43% 29% 44% 30% 28% 45% 25%
Getting worse 323 133 190 84 74 103 62 220 36 28 21 73 140 100 95 154 74 142 84 30 99 224 97 161 65 110 205
24% 20% 28% 24% 23% 27% 22% 24% 22% 17% 47% 17% 28% 26% 26% 28% 18% 28% 17% 33% 21% 26% 22% 25% 25% 20% 29%
Just as well off 476 232 243 72 120 144 139 326 69 57 7 131 183 154 151 190 135 203 170 31 159 316 115 250 110 176 279
35% 35% 36% 21% 37% 37% 49% 36% 43% 34% 16% 30% 37% 40% 41% 34% 32% 39% 34% 35% 34% 36% 26% 39% 42% 31% 39%
No opinion 84 30 55 26 20 19 20 38 17 24 * 18 39 23 24 41 20 30 18 3 8 77 38 32 15 22 50
6% 5% 8% 7% 6% 5% 7% 4% 11% 14% 1% 4% 8% 6% 7% 7% 5% 6% 3% 4% 2% 9% 9% 5% 6% 4% 7%
Sigma 1340 658 682 343 329 387 282 910 161 165 45 429 496 389 364 558 418 514 507 90 469 871 442 636 263 563 715
100% 100% 100% 100% 100% 100% 100% 100% 100% 100% 100% 100% 100% 100% 100% 100% 100% 100% 100% 100% 100% 100% 100% 100% 100% 100% 100%

Page 12
Fielding Period: March 27-29, 2018
HCAPS (Filtered on Registered Voters)
Weighted To The U.S. General Adult Population - Propensity
30 Mar 2018
Table 9
M3 Do you approve or disapprove of the job Donald Trump is doing as President of the United States?
Base: All Respondents
Presidential
Election Candidate
Gender Age Ethnicity Political Party Political Ideology Voted For Education Locale Income
_____________ ______________________ _______________________ ____________________ ____________________ _____________________ _____________ ________________ _________
Colle- Some
Cons- ge Gr- Colle- $75K Less
Hisp- Black Repub- Democ- Indep- Libe- Mode- erva- 3rd ad And ge Or Urb- Subu- Or Than
Total Male Female 18-34 35-49 50-64 65+ White anic /AA Other lican rat endent ral rate tive Clinton Trump Party Higher Less an rban Rural More $75K
______ _____ _______ _____ _____ _____ ____ _____ _____ _____ _____ ______ ______ ______ ______ ______ ______ ________ ______ _____ ______ ______ ____ _____ _____ ____ ____
Unweighted Base 1340 538 802 296 337 392 315 1078 68 123 27 415 478 384 366 551 423 491 511 106 452 888 398 633 309 404 868
Weighted Base 1340 658 682 343 329 387 282 910 161 165 45 429 496 389 364 558 418 514 507 90 469 871 442 636 263 563 715
Effective Base 720 324 402 155 187 207 184 611 48 79 16 232 261 206 197 299 225 269 285 62 260 461 224 340 160 251 466
Strongly/Somewhat Approve 587 346 242 142 146 167 132 478 51 27 13 357 88 135 68 197 323 49 441 21 215 373 196 260 132 284 275
(Net) 44% 53% 35% 41% 44% 43% 47% 53% 32% 16% 29% 83% 18% 35% 19% 35% 77% 10% 87% 23% 46% 43% 44% 41% 50% 50% 38%
Strongly approve 289 193 96 64 66 82 76 241 26 7 11 210 32 44 37 75 177 18 247 3 105 184 108 109 72 144 126
22% 29% 14% 19% 20% 21% 27% 26% 16% 4% 24% 49% 6% 11% 10% 13% 42% 3% 49% 4% 22% 21% 24% 17% 28% 26% 18%
Somewhat approve 299 153 146 78 79 85 56 237 25 19 2 147 56 91 31 122 145 31 195 17 110 189 88 151 60 140 149
22% 23% 21% 23% 24% 22% 20% 26% 15% 12% 5% 34% 11% 24% 9% 22% 35% 6% 38% 19% 23% 22% 20% 24% 23% 25% 21%
Strongly/Somewhat Disapprove 753 312 440 201 183 219 150 432 110 138 32 72 408 253 297 361 95 465 65 70 254 498 246 376 130 279 440
(Net) 56% 47% 65% 59% 56% 57% 53% 47% 68% 84% 71% 17% 82% 65% 81% 65% 23% 90% 13% 77% 54% 57% 56% 59% 50% 50% 62%
Somewhat disapprove 217 92 125 58 58 57 43 141 28 27 8 40 92 76 39 134 43 91 48 24 59 158 65 115 37 70 136
16% 14% 18% 17% 18% 15% 15% 15% 18% 16% 17% 9% 19% 19% 11% 24% 10% 18% 10% 27% 13% 18% 15% 18% 14% 12% 19%
Strongly disapprove 536 221 315 143 124 162 106 291 82 111 24 32 316 177 257 226 52 374 17 46 195 341 181 261 94 209 305
40% 34% 46% 42% 38% 42% 38% 32% 51% 68% 54% 7% 64% 46% 71% 41% 12% 73% 3% 50% 42% 39% 41% 41% 36% 37% 43%
Sigma 1340 658 682 343 329 387 282 910 161 165 45 429 496 389 364 558 418 514 507 90 469 871 442 636 263 563 715
100% 100% 100% 100% 100% 100% 100% 100% 100% 100% 100% 100% 100% 100% 100% 100% 100% 100% 100% 100% 100% 100% 100% 100% 100% 100% 100%
Page 13
Fielding Period: March 27-29, 2018
HCAPS (Filtered on Registered Voters)
Weighted To The U.S. General Adult Population - Propensity
30 Mar 2018
Table 10
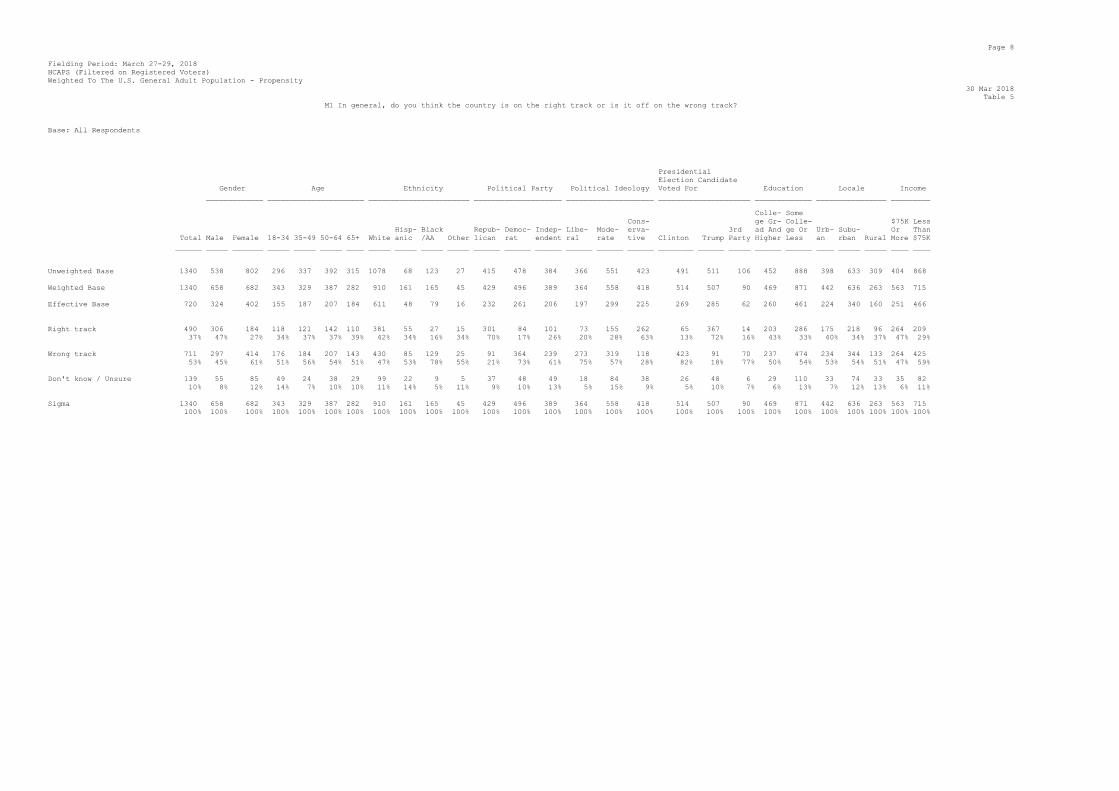
M3A Do you approve or disapprove of the job President Trump is doing on ...?
Summary Of Approve
Base: All Respondents
Presidential
Election Candidate
Gender Age Ethnicity Political Party Political Ideology Voted For Education Locale Income
_____________ ______________________ _______________________ ____________________ ____________________ _____________________ _____________ ________________ _________
Colle- Some
Cons- ge Gr- Colle- $75K Less
Hisp- Black Repub- Democ- Indep- Libe- Mode- erva- 3rd ad And ge Or Urb- Subu- Or Than
Total Male Female 18-34 35-49 50-64 65+ White anic /AA Other lican rat endent ral rate tive Clinton Trump Party Higher Less an rban Rural More $75K
______ _____ _______ _____ _____ _____ ____ _____ _____ _____ _____ ______ ______ ______ ______ ______ ______ ________ ______ _____ ______ ______ ____ _____ _____ ____ ____
Unweighted Base 1340 538 802 296 337 392 315 1078 68 123 27 415 478 384 366 551 423 491 511 106 452 888 398 633 309 404 868
Weighted Base 1340 658 682 343 329 387 282 910 161 165 45 429 496 389 364 558 418 514 507 90 469 871 442 636 263 563 715
Effective Base 720 324 402 155 187 207 184 611 48 79 16 232 261 206 197 299 225 269 285 62 260 461 224 340 160 251 466
Stimulating jobs 724 413 311 178 183 199 163 565 71 48 19 381 150 184 102 270 351 115 461 42 272 451 236 332 156 330 357
54% 63% 46% 52% 56% 51% 58% 62% 44% 29% 42% 89% 30% 47% 28% 48% 84% 22% 91% 47% 58% 52% 53% 52% 60% 59% 50%
Fighting terrorism 711 424 287 164 180 204 162 564 57 44 20 377 138 187 96 269 347 127 456 39 253 458 219 335 157 332 348
53% 64% 42% 48% 55% 53% 58% 62% 35% 27% 44% 88% 28% 48% 26% 48% 83% 25% 90% 43% 54% 53% 50% 53% 60% 59% 49%
The economy 693 413 281 155 172 210 156 548 59 42 19 366 130 189 106 262 325 116 459 35 255 438 207 336 150 328 331
52% 63% 41% 45% 52% 54% 55% 60% 37% 25% 42% 85% 26% 49% 29% 47% 78% 23% 91% 39% 54% 50% 47% 53% 57% 58% 46%
Immigration 615 359 256 129 159 183 144 498 56 24 14 358 104 146 70 221 325 79 438 20 215 401 202 263 150 297 290
46% 55% 38% 38% 49% 47% 51% 55% 34% 15% 31% 83% 21% 38% 19% 40% 78% 15% 87% 22% 46% 46% 46% 41% 57% 53% 40%
Foreign affairs 562 336 226 129 135 167 131 456 51 21 14 336 97 122 67 186 308 61 414 17 207 355 192 246 123 266 269
42% 51% 33% 38% 41% 43% 46% 50% 32% 13% 31% 78% 20% 31% 18% 33% 74% 12% 82% 19% 44% 41% 44% 39% 47% 47% 38%
Administering the government 540 315 226 119 137 157 128 441 50 22 14 344 78 112 56 177 308 47 410 15 198 342 177 243 120 267 245
40% 48% 33% 35% 42% 41% 45% 48% 31% 13% 31% 80% 16% 29% 15% 32% 74% 9% 81% 16% 42% 39% 40% 38% 46% 47% 34%

Page 14
Fielding Period: March 27-29, 2018
HCAPS (Filtered on Registered Voters)
Weighted To The U.S. General Adult Population - Propensity
30 Mar 2018
Table 11
M3A Do you approve or disapprove of the job President Trump is doing on ...?
Summary Of Disapprove
Base: All Respondents
Presidential
Election Candidate
Gender Age Ethnicity Political Party Political Ideology Voted For Education Locale Income
_____________ ______________________ _______________________ ____________________ ____________________ _____________________ _____________ ________________ _________
Colle- Some
Cons- ge Gr- Colle- $75K Less
Hisp- Black Repub- Democ- Indep- Libe- Mode- erva- 3rd ad And ge Or Urb- Subu- Or Than
Total Male Female 18-34 35-49 50-64 65+ White anic /AA Other lican rat endent ral rate tive Clinton Trump Party Higher Less an rban Rural More $75K
______ _____ _______ _____ _____ _____ ____ _____ _____ _____ _____ ______ ______ ______ ______ ______ ______ ________ ______ _____ ______ ______ ____ _____ _____ ____ ____
Unweighted Base 1340 538 802 296 337 392 315 1078 68 123 27 415 478 384 366 551 423 491 511 106 452 888 398 633 309 404 868
Weighted Base 1340 658 682 343 329 387 282 910 161 165 45 429 496 389 364 558 418 514 507 90 469 871 442 636 263 563 715
Effective Base 720 324 402 155 187 207 184 611 48 79 16 232 261 206 197 299 225 269 285 62 260 461 224 340 160 251 466
Administering the government 800 343 456 224 192 230 155 469 111 143 31 85 418 277 308 381 110 467 97 76 271 529 264 393 143 296 470
60% 52% 67% 65% 58% 59% 55% 52% 69% 87% 69% 20% 84% 71% 85% 68% 26% 91% 19% 84% 58% 61% 60% 62% 54% 53% 66%
Foreign affairs 778 322 456 214 193 220 151 454 110 144 31 93 399 266 297 371 109 453 93 73 262 516 249 389 139 297 446
58% 49% 67% 62% 59% 57% 54% 50% 68% 87% 69% 22% 80% 69% 82% 67% 26% 88% 18% 81% 56% 59% 56% 61% 53% 53% 62%
Immigration 725 299 426 214 169 203 138 412 105 140 31 71 392 242 295 337 93 435 68 70 255 470 239 373 112 266 426
54% 45% 62% 62% 51% 53% 49% 45% 66% 85% 69% 17% 79% 62% 81% 60% 22% 85% 13% 78% 54% 54% 54% 59% 43% 47% 60%
The economy 647 245 401 187 157 177 126 362 102 123 26 63 365 200 258 296 92 398 48 56 214 432 234 300 112 235 385
48% 37% 59% 55% 48% 46% 45% 40% 63% 75% 58% 15% 74% 51% 71% 53% 22% 77% 9% 61% 46% 50% 53% 47% 43% 42% 54%
Fighting terrorism 629 234 395 179 148 182 120 346 104 120 25 52 357 202 269 289 71 387 51 52 216 413 222 301 106 231 368
47% 36% 58% 52% 45% 47% 42% 38% 65% 73% 56% 12% 72% 52% 74% 52% 17% 75% 10% 57% 46% 47% 50% 47% 40% 41% 51%
Stimulating jobs 616 245 371 164 146 188 119 345 90 117 26 48 346 205 262 287 67 399 46 48 197 420 206 304 106 233 359
46% 37% 54% 48% 44% 49% 42% 38% 56% 71% 58% 11% 70% 53% 72% 52% 16% 78% 9% 53% 42% 48% 47% 48% 40% 41% 50%

Page 15
Fielding Period: March 27-29, 2018
HCAPS (Filtered on Registered Voters)
Weighted To The U.S. General Adult Population - Propensity
30 Mar 2018
Table 12
M3A_1 Do you approve or disapprove of the job President Trump is doing on ...?
The economy
Base: All Respondents
Presidential
Election Candidate
Gender Age Ethnicity Political Party Political Ideology Voted For Education Locale Income
_____________ ______________________ _______________________ ____________________ ____________________ _____________________ _____________ ________________ _________
Colle- Some
Cons- ge Gr- Colle- $75K Less
Hisp- Black Repub- Democ- Indep- Libe- Mode- erva- 3rd ad And ge Or Urb- Subu- Or Than
Total Male Female 18-34 35-49 50-64 65+ White anic /AA Other lican rat endent ral rate tive Clinton Trump Party Higher Less an rban Rural More $75K
______ _____ _______ _____ _____ _____ ____ _____ _____ _____ _____ ______ ______ ______ ______ ______ ______ ________ ______ _____ ______ ______ ____ _____ _____ ____ ____
Unweighted Base 1340 538 802 296 337 392 315 1078 68 123 27 415 478 384 366 551 423 491 511 106 452 888 398 633 309 404 868
Weighted Base 1340 658 682 343 329 387 282 910 161 165 45 429 496 389 364 558 418 514 507 90 469 871 442 636 263 563 715
Effective Base 720 324 402 155 187 207 184 611 48 79 16 232 261 206 197 299 225 269 285 62 260 461 224 340 160 251 466
Approve (Net) 693 413 281 155 172 210 156 548 59 42 19 366 130 189 106 262 325 116 459 35 255 438 207 336 150 328 331
52% 63% 41% 45% 52% 54% 55% 60% 37% 25% 42% 85% 26% 49% 29% 47% 78% 23% 91% 39% 54% 50% 47% 53% 57% 58% 46%
Strongly approve 350 225 125 68 85 104 92 287 28 16 13 238 46 63 36 97 218 22 285 10 128 222 112 162 76 187 142
26% 34% 18% 20% 26% 27% 33% 31% 17% 10% 28% 56% 9% 16% 10% 17% 52% 4% 56% 11% 27% 26% 25% 25% 29% 33% 20%
Somewhat approve 343 188 156 87 86 106 64 261 32 26 6 128 84 126 70 165 108 94 174 25 127 216 95 174 74 141 188
26% 29% 23% 25% 26% 27% 23% 29% 20% 16% 14% 30% 17% 33% 19% 30% 26% 18% 34% 28% 27% 25% 21% 27% 28% 25% 26%
Disapprove (Net) 647 245 401 187 157 177 126 362 102 123 26 63 365 200 258 296 92 398 48 56 214 432 234 300 112 235 385
48% 37% 59% 55% 48% 46% 45% 40% 63% 75% 58% 15% 74% 51% 71% 53% 22% 77% 9% 61% 46% 50% 53% 47% 43% 42% 54%
Somewhat disapprove 289 108 181 87 73 75 53 172 51 43 12 42 147 90 72 153 65 144 32 28 101 188 115 134 40 102 174
22% 16% 27% 25% 22% 19% 19% 19% 32% 26% 27% 10% 30% 23% 20% 27% 16% 28% 6% 31% 21% 22% 26% 21% 15% 18% 24%
Strongly disapprove 357 137 220 100 83 102 72 190 51 80 14 21 218 110 187 143 28 253 16 28 113 244 120 166 72 134 211
27% 21% 32% 29% 25% 26% 26% 21% 32% 49% 31% 5% 44% 28% 51% 26% 7% 49% 3% 31% 24% 28% 27% 26% 27% 24% 29%
Sigma 1340 658 682 343 329 387 282 910 161 165 45 429 496 389 364 558 418 514 507 90 469 871 442 636 263 563 715
100% 100% 100% 100% 100% 100% 100% 100% 100% 100% 100% 100% 100% 100% 100% 100% 100% 100% 100% 100% 100% 100% 100% 100% 100% 100% 100%

Page 16
Fielding Period: March 27-29, 2018
HCAPS (Filtered on Registered Voters)
Weighted To The U.S. General Adult Population - Propensity
30 Mar 2018
Table 13
M3A_2 Do you approve or disapprove of the job President Trump is doing on ...?
Foreign affairs
Base: All Respondents
Presidential
Election Candidate
Gender Age Ethnicity Political Party Political Ideology Voted For Education Locale Income
_____________ ______________________ _______________________ ____________________ ____________________ _____________________ _____________ ________________ _________
Colle- Some
Cons- ge Gr- Colle- $75K Less
Hisp- Black Repub- Democ- Indep- Libe- Mode- erva- 3rd ad And ge Or Urb- Subu- Or Than
Total Male Female 18-34 35-49 50-64 65+ White anic /AA Other lican rat endent ral rate tive Clinton Trump Party Higher Less an rban Rural More $75K
______ _____ _______ _____ _____ _____ ____ _____ _____ _____ _____ ______ ______ ______ ______ ______ ______ ________ ______ _____ ______ ______ ____ _____ _____ ____ ____
Unweighted Base 1340 538 802 296 337 392 315 1078 68 123 27 415 478 384 366 551 423 491 511 106 452 888 398 633 309 404 868
Weighted Base 1340 658 682 343 329 387 282 910 161 165 45 429 496 389 364 558 418 514 507 90 469 871 442 636 263 563 715
Effective Base 720 324 402 155 187 207 184 611 48 79 16 232 261 206 197 299 225 269 285 62 260 461 224 340 160 251 466
Approve (Net) 562 336 226 129 135 167 131 456 51 21 14 336 97 122 67 186 308 61 414 17 207 355 192 246 123 266 269
42% 51% 33% 38% 41% 43% 46% 50% 32% 13% 31% 78% 20% 31% 18% 33% 74% 12% 82% 19% 44% 41% 44% 39% 47% 47% 38%
Strongly approve 274 172 102 49 68 79 78 218 35 6 10 193 28 48 26 77 170 17 222 7 94 180 88 115 70 137 118
20% 26% 15% 14% 21% 20% 28% 24% 22% 3% 23% 45% 6% 12% 7% 14% 41% 3% 44% 8% 20% 21% 20% 18% 27% 24% 16%
Somewhat approve 288 164 124 80 67 88 53 238 16 15 4 143 69 74 41 109 138 44 192 11 113 175 104 131 53 129 151
22% 25% 18% 23% 21% 23% 19% 26% 10% 9% 9% 33% 14% 19% 11% 20% 33% 9% 38% 12% 24% 20% 24% 21% 20% 23% 21%
Disapprove (Net) 778 322 456 214 193 220 151 454 110 144 31 93 399 266 297 371 109 453 93 73 262 516 249 389 139 297 446
58% 49% 67% 62% 59% 57% 54% 50% 68% 87% 69% 22% 80% 69% 82% 67% 26% 88% 18% 81% 56% 59% 56% 61% 53% 53% 62%
Somewhat disapprove 245 99 145 74 67 58 45 164 36 25 5 53 83 101 37 159 48 78 74 26 72 172 74 127 44 95 135
18% 15% 21% 22% 20% 15% 16% 18% 22% 15% 10% 12% 17% 26% 10% 29% 12% 15% 15% 29% 15% 20% 17% 20% 17% 17% 19%
Strongly disapprove 533 223 310 140 126 162 106 290 74 119 26 40 316 166 260 212 61 375 20 47 190 344 175 263 95 203 311
40% 34% 45% 41% 38% 42% 37% 32% 46% 72% 59% 9% 64% 43% 71% 38% 15% 73% 4% 52% 40% 39% 40% 41% 36% 36% 44%
Sigma 1340 658 682 343 329 387 282 910 161 165 45 429 496 389 364 558 418 514 507 90 469 871 442 636 263 563 715
100% 100% 100% 100% 100% 100% 100% 100% 100% 100% 100% 100% 100% 100% 100% 100% 100% 100% 100% 100% 100% 100% 100% 100% 100% 100% 100%

Page 17
Fielding Period: March 27-29, 2018
HCAPS (Filtered on Registered Voters)
Weighted To The U.S. General Adult Population - Propensity
30 Mar 2018
Table 14
M3A_3 Do you approve or disapprove of the job President Trump is doing on ...?
Fighting terrorism
Base: All Respondents
Presidential
Election Candidate
Gender Age Ethnicity Political Party Political Ideology Voted For Education Locale Income
_____________ ______________________ _______________________ ____________________ ____________________ _____________________ _____________ ________________ _________
Colle- Some
Cons- ge Gr- Colle- $75K Less
Hisp- Black Repub- Democ- Indep- Libe- Mode- erva- 3rd ad And ge Or Urb- Subu- Or Than
Total Male Female 18-34 35-49 50-64 65+ White anic /AA Other lican rat endent ral rate tive Clinton Trump Party Higher Less an rban Rural More $75K
______ _____ _______ _____ _____ _____ ____ _____ _____ _____ _____ ______ ______ ______ ______ ______ ______ ________ ______ _____ ______ ______ ____ _____ _____ ____ ____
Unweighted Base 1340 538 802 296 337 392 315 1078 68 123 27 415 478 384 366 551 423 491 511 106 452 888 398 633 309 404 868
Weighted Base 1340 658 682 343 329 387 282 910 161 165 45 429 496 389 364 558 418 514 507 90 469 871 442 636 263 563 715
Effective Base 720 324 402 155 187 207 184 611 48 79 16 232 261 206 197 299 225 269 285 62 260 461 224 340 160 251 466
Approve (Net) 711 424 287 164 180 204 162 564 57 44 20 377 138 187 96 269 347 127 456 39 253 458 219 335 157 332 348
53% 64% 42% 48% 55% 53% 58% 62% 35% 27% 44% 88% 28% 48% 26% 48% 83% 25% 90% 43% 54% 53% 50% 53% 60% 59% 49%
Strongly approve 358 233 125 74 87 104 93 294 28 14 8 239 51 64 40 109 209 29 273 8 131 228 119 147 93 175 160
27% 35% 18% 22% 27% 27% 33% 32% 17% 8% 17% 56% 10% 16% 11% 20% 50% 6% 54% 9% 28% 26% 27% 23% 35% 31% 22%
Somewhat approve 353 191 162 89 93 101 69 270 29 31 12 139 87 123 56 159 137 98 183 31 122 230 101 188 64 157 187
26% 29% 24% 26% 28% 26% 24% 30% 18% 19% 26% 32% 18% 32% 15% 29% 33% 19% 36% 34% 26% 26% 23% 30% 24% 28% 26%
Disapprove (Net) 629 234 395 179 148 182 120 346 104 120 25 52 357 202 269 289 71 387 51 52 216 413 222 301 106 231 368
47% 36% 58% 52% 45% 47% 42% 38% 65% 73% 56% 12% 72% 52% 74% 52% 17% 75% 10% 57% 46% 47% 50% 47% 40% 41% 51%
Somewhat disapprove 236 102 133 54 65 80 36 155 27 31 9 26 111 88 64 139 33 122 35 28 81 154 83 113 39 89 137
18% 16% 20% 16% 20% 21% 13% 17% 17% 19% 21% 6% 22% 23% 17% 25% 8% 24% 7% 31% 17% 18% 19% 18% 15% 16% 19%
Strongly disapprove 394 132 262 125 83 102 83 191 77 90 16 25 246 114 205 151 38 265 16 24 135 259 139 188 67 142 231
29% 20% 38% 37% 25% 26% 30% 21% 48% 54% 35% 6% 50% 29% 56% 27% 9% 51% 3% 27% 29% 30% 32% 30% 25% 25% 32%
Sigma 1340 658 682 343 329 387 282 910 161 165 45 429 496 389 364 558 418 514 507 90 469 871 442 636 263 563 715
100% 100% 100% 100% 100% 100% 100% 100% 100% 100% 100% 100% 100% 100% 100% 100% 100% 100% 100% 100% 100% 100% 100% 100% 100% 100% 100%

Page 18
Fielding Period: March 27-29, 2018
HCAPS (Filtered on Registered Voters)
Weighted To The U.S. General Adult Population - Propensity
30 Mar 2018
Table 15
M3A_4 Do you approve or disapprove of the job President Trump is doing on ...?
Administering the government
Base: All Respondents
Presidential
Election Candidate
Gender Age Ethnicity Political Party Political Ideology Voted For Education Locale Income
_____________ ______________________ _______________________ ____________________ ____________________ _____________________ _____________ ________________ _________
Colle- Some
Cons- ge Gr- Colle- $75K Less
Hisp- Black Repub- Democ- Indep- Libe- Mode- erva- 3rd ad And ge Or Urb- Subu- Or Than
Total Male Female 18-34 35-49 50-64 65+ White anic /AA Other lican rat endent ral rate tive Clinton Trump Party Higher Less an rban Rural More $75K
______ _____ _______ _____ _____ _____ ____ _____ _____ _____ _____ ______ ______ ______ ______ ______ ______ ________ ______ _____ ______ ______ ____ _____ _____ ____ ____
Unweighted Base 1340 538 802 296 337 392 315 1078 68 123 27 415 478 384 366 551 423 491 511 106 452 888 398 633 309 404 868
Weighted Base 1340 658 682 343 329 387 282 910 161 165 45 429 496 389 364 558 418 514 507 90 469 871 442 636 263 563 715
Effective Base 720 324 402 155 187 207 184 611 48 79 16 232 261 206 197 299 225 269 285 62 260 461 224 340 160 251 466
Approve (Net) 540 315 226 119 137 157 128 441 50 22 14 344 78 112 56 177 308 47 410 15 198 342 177 243 120 267 245
40% 48% 33% 35% 42% 41% 45% 48% 31% 13% 31% 80% 16% 29% 15% 32% 74% 9% 81% 16% 42% 39% 40% 38% 46% 47% 34%
Strongly approve 218 126 92 43 59 55 61 184 14 6 10 170 23 23 26 59 133 15 176 3 75 143 75 85 57 109 89
16% 19% 13% 13% 18% 14% 22% 20% 8% 4% 22% 40% 5% 6% 7% 11% 32% 3% 35% 3% 16% 16% 17% 13% 22% 19% 12%
Somewhat approve 322 188 134 76 78 101 67 257 36 16 4 174 55 88 30 118 175 32 234 12 123 199 102 157 62 158 156
24% 29% 20% 22% 24% 26% 24% 28% 22% 9% 9% 41% 11% 23% 8% 21% 42% 6% 46% 13% 26% 23% 23% 25% 24% 28% 22%
Disapprove (Net) 800 343 456 224 192 230 155 469 111 143 31 85 418 277 308 381 110 467 97 76 271 529 264 393 143 296 470
60% 52% 67% 65% 58% 59% 55% 52% 69% 87% 69% 20% 84% 71% 85% 68% 26% 91% 19% 84% 58% 61% 60% 62% 54% 53% 66%
Somewhat disapprove 216 89 127 71 54 53 38 145 25 27 5 42 99 67 38 127 51 73 59 21 54 162 76 96 43 55 149
16% 14% 19% 21% 16% 14% 14% 16% 16% 16% 12% 10% 20% 17% 10% 23% 12% 14% 12% 23% 12% 19% 17% 15% 16% 10% 21%
Strongly disapprove 584 254 329 153 138 177 116 324 86 116 25 43 319 210 271 254 59 394 38 55 217 367 188 297 99 240 321
44% 39% 48% 45% 42% 46% 41% 36% 54% 71% 57% 10% 64% 54% 74% 46% 14% 77% 7% 61% 46% 42% 43% 47% 38% 43% 45%
Sigma 1340 658 682 343 329 387 282 910 161 165 45 429 496 389 364 558 418 514 507 90 469 871 442 636 263 563 715
100% 100% 100% 100% 100% 100% 100% 100% 100% 100% 100% 100% 100% 100% 100% 100% 100% 100% 100% 100% 100% 100% 100% 100% 100% 100% 100%

Page 19
Fielding Period: March 27-29, 2018
HCAPS (Filtered on Registered Voters)
Weighted To The U.S. General Adult Population - Propensity
30 Mar 2018
Table 16
M3A_5 Do you approve or disapprove of the job President Trump is doing on ...?
Stimulating jobs
Base: All Respondents
Presidential
Election Candidate
Gender Age Ethnicity Political Party Political Ideology Voted For Education Locale Income
_____________ ______________________ _______________________ ____________________ ____________________ _____________________ _____________ ________________ _________
Colle- Some
Cons- ge Gr- Colle- $75K Less
Hisp- Black Repub- Democ- Indep- Libe- Mode- erva- 3rd ad And ge Or Urb- Subu- Or Than
Total Male Female 18-34 35-49 50-64 65+ White anic /AA Other lican rat endent ral rate tive Clinton Trump Party Higher Less an rban Rural More $75K
______ _____ _______ _____ _____ _____ ____ _____ _____ _____ _____ ______ ______ ______ ______ ______ ______ ________ ______ _____ ______ ______ ____ _____ _____ ____ ____
Unweighted Base 1340 538 802 296 337 392 315 1078 68 123 27 415 478 384 366 551 423 491 511 106 452 888 398 633 309 404 868
Weighted Base 1340 658 682 343 329 387 282 910 161 165 45 429 496 389 364 558 418 514 507 90 469 871 442 636 263 563 715
Effective Base 720 324 402 155 187 207 184 611 48 79 16 232 261 206 197 299 225 269 285 62 260 461 224 340 160 251 466
Approve (Net) 724 413 311 178 183 199 163 565 71 48 19 381 150 184 102 270 351 115 461 42 272 451 236 332 156 330 357
54% 63% 46% 52% 56% 51% 58% 62% 44% 29% 42% 89% 30% 47% 28% 48% 84% 22% 91% 47% 58% 52% 53% 52% 60% 59% 50%
Strongly approve 337 213 124 66 78 95 98 269 37 9 13 229 45 60 32 93 212 26 264 6 103 234 105 156 77 163 151
25% 32% 18% 19% 24% 25% 35% 30% 23% 5% 28% 53% 9% 15% 9% 17% 51% 5% 52% 7% 22% 27% 24% 25% 29% 29% 21%
Somewhat approve 386 199 187 113 105 104 65 296 34 39 6 152 105 124 70 177 139 89 197 36 170 217 131 176 80 167 205
29% 30% 27% 33% 32% 27% 23% 33% 21% 24% 14% 36% 21% 32% 19% 32% 33% 17% 39% 40% 36% 25% 30% 28% 30% 30% 29%
Disapprove (Net) 616 245 371 164 146 188 119 345 90 117 26 48 346 205 262 287 67 399 46 48 197 420 206 304 106 233 359
46% 37% 54% 48% 44% 49% 42% 38% 56% 71% 58% 11% 70% 53% 72% 52% 16% 78% 9% 53% 42% 48% 47% 48% 40% 41% 50%
Somewhat disapprove 260 103 156 68 70 81 40 155 44 33 12 28 133 88 75 150 35 142 32 20 83 176 83 130 46 107 142
19% 16% 23% 20% 21% 21% 14% 17% 27% 20% 27% 7% 27% 23% 21% 27% 8% 28% 6% 23% 18% 20% 19% 20% 18% 19% 20%
Strongly disapprove 357 142 215 96 75 107 79 190 46 84 14 20 213 117 187 138 32 257 13 28 113 244 123 174 60 126 217
27% 22% 31% 28% 23% 28% 28% 21% 29% 51% 31% 5% 43% 30% 51% 25% 8% 50% 3% 31% 24% 28% 28% 27% 23% 22% 30%
Sigma 1340 658 682 343 329 387 282 910 161 165 45 429 496 389 364 558 418 514 507 90 469 871 442 636 263 563 715
100% 100% 100% 100% 100% 100% 100% 100% 100% 100% 100% 100% 100% 100% 100% 100% 100% 100% 100% 100% 100% 100% 100% 100% 100% 100% 100%

Page 20
Fielding Period: March 27-29, 2018
HCAPS (Filtered on Registered Voters)
Weighted To The U.S. General Adult Population - Propensity
30 Mar 2018
Table 17
M3A_6 Do you approve or disapprove of the job President Trump is doing on ...?
Immigration
Base: All Respondents
Presidential
Election Candidate
Gender Age Ethnicity Political Party Political Ideology Voted For Education Locale Income
_____________ ______________________ _______________________ ____________________ ____________________ _____________________ _____________ ________________ _________
Colle- Some
Cons- ge Gr- Colle- $75K Less
Hisp- Black Repub- Democ- Indep- Libe- Mode- erva- 3rd ad And ge Or Urb- Subu- Or Than
Total Male Female 18-34 35-49 50-64 65+ White anic /AA Other lican rat endent ral rate tive Clinton Trump Party Higher Less an rban Rural More $75K
______ _____ _______ _____ _____ _____ ____ _____ _____ _____ _____ ______ ______ ______ ______ ______ ______ ________ ______ _____ ______ ______ ____ _____ _____ ____ ____
Unweighted Base 1340 538 802 296 337 392 315 1078 68 123 27 415 478 384 366 551 423 491 511 106 452 888 398 633 309 404 868
Weighted Base 1340 658 682 343 329 387 282 910 161 165 45 429 496 389 364 558 418 514 507 90 469 871 442 636 263 563 715
Effective Base 720 324 402 155 187 207 184 611 48 79 16 232 261 206 197 299 225 269 285 62 260 461 224 340 160 251 466
Approve (Net) 615 359 256 129 159 183 144 498 56 24 14 358 104 146 70 221 325 79 438 20 215 401 202 263 150 297 290
46% 55% 38% 38% 49% 47% 51% 55% 34% 15% 31% 83% 21% 38% 19% 40% 78% 15% 87% 22% 46% 46% 46% 41% 57% 53% 40%
Strongly approve 337 223 114 59 86 100 91 281 27 7 10 236 35 62 30 102 205 21 273 5 125 212 118 132 86 169 146
25% 34% 17% 17% 26% 26% 32% 31% 17% 4% 21% 55% 7% 16% 8% 18% 49% 4% 54% 6% 27% 24% 27% 21% 33% 30% 20%
Somewhat approve 279 137 142 69 73 83 53 217 29 17 4 122 69 84 40 118 120 57 166 15 90 189 84 130 64 128 144
21% 21% 21% 20% 22% 21% 19% 24% 18% 10% 10% 28% 14% 22% 11% 21% 29% 11% 33% 16% 19% 22% 19% 20% 25% 23% 20%
Disapprove (Net) 725 299 426 214 169 203 138 412 105 140 31 71 392 242 295 337 93 435 68 70 255 470 239 373 112 266 426
54% 45% 62% 62% 51% 53% 49% 45% 66% 85% 69% 17% 79% 62% 81% 60% 22% 85% 13% 78% 54% 54% 54% 59% 43% 47% 60%
Somewhat disapprove 198 83 115 62 47 51 38 129 27 27 2 49 70 72 33 121 44 71 52 26 76 122 63 115 20 63 130
15% 13% 17% 18% 14% 13% 14% 14% 17% 16% 5% 11% 14% 19% 9% 22% 11% 14% 10% 29% 16% 14% 14% 18% 8% 11% 18%
Strongly disapprove 527 216 311 152 122 152 100 283 78 113 29 22 322 170 261 216 49 364 16 44 178 348 176 258 92 203 296
39% 33% 46% 44% 37% 39% 36% 31% 49% 69% 64% 5% 65% 44% 72% 39% 12% 71% 3% 49% 38% 40% 40% 41% 35% 36% 41%
Sigma 1340 658 682 343 329 387 282 910 161 165 45 429 496 389 364 558 418 514 507 90 469 871 442 636 263 563 715
100% 100% 100% 100% 100% 100% 100% 100% 100% 100% 100% 100% 100% 100% 100% 100% 100% 100% 100% 100% 100% 100% 100% 100% 100% 100% 100%

Page 21
Fielding Period: March 27-29, 2018
HCAPS (Filtered on Registered Voters)
Weighted To The U.S. General Adult Population - Propensity
30 Mar 2018
Table 18
M4 Do you approve or disapprove of the way the Republican Party is handling its job?
Base: All Respondents
Presidential
Election Candidate
Gender Age Ethnicity Political Party Political Ideology Voted For Education Locale Income
_____________ ______________________ _______________________ ____________________ ____________________ _____________________ _____________ ________________ _________
Colle- Some
Cons- ge Gr- Colle- $75K Less
Hisp- Black Repub- Democ- Indep- Libe- Mode- erva- 3rd ad And ge Or Urb- Subu- Or Than
Total Male Female 18-34 35-49 50-64 65+ White anic /AA Other lican rat endent ral rate tive Clinton Trump Party Higher Less an rban Rural More $75K
______ _____ _______ _____ _____ _____ ____ _____ _____ _____ _____ ______ ______ ______ ______ ______ ______ ________ ______ _____ ______ ______ ____ _____ _____ ____ ____
Unweighted Base 1340 538 802 296 337 392 315 1078 68 123 27 415 478 384 366 551 423 491 511 106 452 888 398 633 309 404 868
Weighted Base 1340 658 682 343 329 387 282 910 161 165 45 429 496 389 364 558 418 514 507 90 469 871 442 636 263 563 715
Effective Base 720 324 402 155 187 207 184 611 48 79 16 232 261 206 197 299 225 269 285 62 260 461 224 340 160 251 466
Strongly/Somewhat Approve 497 290 207 141 127 130 100 396 46 26 8 306 88 100 68 179 251 65 343 20 193 305 181 207 109 248 225
(Net) 37% 44% 30% 41% 39% 34% 35% 44% 29% 16% 17% 71% 18% 26% 19% 32% 60% 13% 68% 22% 41% 35% 41% 33% 42% 44% 31%
Strongly approve 122 87 34 49 40 17 15 109 2 8 1 91 21 8 34 33 54 14 96 2 78 44 81 28 12 80 40
9% 13% 5% 14% 12% 4% 5% 12% 1% 5% 3% 21% 4% 2% 9% 6% 13% 3% 19% 3% 17% 5% 18% 4% 5% 14% 6%
Somewhat approve 376 203 173 91 87 113 85 287 44 18 6 215 67 92 34 145 197 51 247 17 115 261 100 179 97 168 185
28% 31% 25% 27% 26% 29% 30% 32% 27% 11% 14% 50% 14% 24% 9% 26% 47% 10% 49% 19% 25% 30% 23% 28% 37% 30% 26%
Strongly/Somewhat Disapprove 843 368 475 202 202 257 182 514 115 139 37 123 407 289 296 379 167 449 164 71 276 566 261 428 153 315 490
(Net) 63% 56% 70% 59% 61% 66% 65% 56% 71% 84% 83% 29% 82% 74% 81% 68% 40% 87% 32% 78% 59% 65% 59% 67% 58% 56% 69%
Somewhat disapprove 348 138 209 83 80 104 80 244 43 33 15 83 126 125 53 187 107 123 117 25 92 255 86 186 75 112 219
26% 21% 31% 24% 24% 27% 28% 27% 27% 20% 34% 19% 25% 32% 15% 34% 26% 24% 23% 27% 20% 29% 20% 29% 29% 20% 31%
Strongly disapprove 495 229 266 119 121 152 102 270 72 106 22 40 282 163 243 192 60 326 47 46 184 311 175 242 78 203 272
37% 35% 39% 35% 37% 39% 36% 30% 45% 64% 49% 9% 57% 42% 67% 34% 14% 63% 9% 51% 39% 36% 40% 38% 30% 36% 38%
Sigma 1340 658 682 343 329 387 282 910 161 165 45 429 496 389 364 558 418 514 507 90 469 871 442 636 263 563 715
100% 100% 100% 100% 100% 100% 100% 100% 100% 100% 100% 100% 100% 100% 100% 100% 100% 100% 100% 100% 100% 100% 100% 100% 100% 100% 100%
Page 22
Fielding Period: March 27-29, 2018
HCAPS (Filtered on Registered Voters)
Weighted To The U.S. General Adult Population - Propensity
30 Mar 2018
Table 19
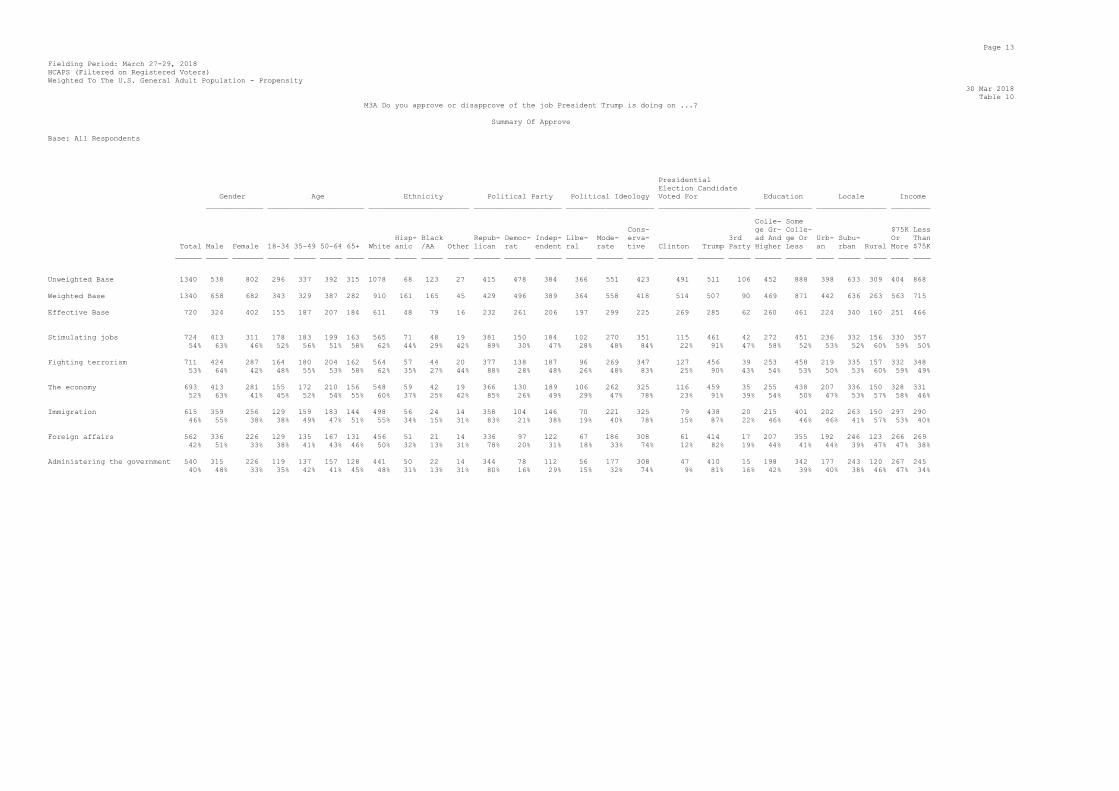
M5 Do you approve or disapprove of the way the Democratic Party is handling its job?
Base: All Respondents
Presidential
Election Candidate
Gender Age Ethnicity Political Party Political Ideology Voted For Education Locale Income
_____________ ______________________ _______________________ ____________________ ____________________ _____________________ _____________ ________________ _________
Colle- Some
Cons- ge Gr- Colle- $75K Less
Hisp- Black Repub- Democ- Indep- Libe- Mode- erva- 3rd ad And ge Or Urb- Subu- Or Than
Total Male Female 18-34 35-49 50-64 65+ White anic /AA Other lican rat endent ral rate tive Clinton Trump Party Higher Less an rban Rural More $75K
______ _____ _______ _____ _____ _____ ____ _____ _____ _____ _____ ______ ______ ______ ______ ______ ______ ________ ______ _____ ______ ______ ____ _____ _____ ____ ____
Unweighted Base 1340 538 802 296 337 392 315 1078 68 123 27 415 478 384 366 551 423 491 511 106 452 888 398 633 309 404 868
Weighted Base 1340 658 682 343 329 387 282 910 161 165 45 429 496 389 364 558 418 514 507 90 469 871 442 636 263 563 715
Effective Base 720 324 402 155 187 207 184 611 48 79 16 232 261 206 197 299 225 269 285 62 260 461 224 340 160 251 466
Strongly/Somewhat Approve 585 281 304 199 145 155 86 371 62 105 24 109 350 121 246 246 93 335 138 22 238 347 256 249 81 262 303
(Net) 44% 43% 45% 58% 44% 40% 31% 41% 38% 64% 53% 25% 71% 31% 68% 44% 22% 65% 27% 24% 51% 40% 58% 39% 31% 46% 42%
Strongly approve 152 102 50 65 42 28 17 105 4 38 - 51 85 15 78 48 26 75 68 5 76 76 93 48 11 94 57
11% 16% 7% 19% 13% 7% 6% 11% 3% 23% - 12% 17% 4% 21% 9% 6% 15% 13% 5% 16% 9% 21% 8% 4% 17% 8%
Somewhat approve 433 179 254 134 103 127 69 266 58 67 24 59 265 106 168 198 67 260 70 17 163 271 163 200 69 168 246
32% 27% 37% 39% 31% 33% 25% 29% 36% 41% 53% 14% 53% 27% 46% 36% 16% 51% 14% 19% 35% 31% 37% 32% 26% 30% 34%
Strongly/Somewhat Disapprove 755 376 378 144 184 232 196 539 99 60 21 320 145 267 118 311 325 178 369 68 231 524 186 387 182 301 412
(Net) 56% 57% 55% 42% 56% 60% 69% 59% 62% 36% 47% 75% 29% 69% 32% 56% 78% 35% 73% 76% 49% 60% 42% 61% 69% 54% 58%
Somewhat disapprove 367 165 203 90 90 103 84 250 45 40 10 91 114 153 94 186 88 152 111 29 119 249 92 189 87 132 216
27% 25% 30% 26% 28% 27% 30% 28% 28% 24% 23% 21% 23% 39% 26% 33% 21% 30% 22% 32% 25% 29% 21% 30% 33% 23% 30%
Strongly disapprove 387 212 175 54 93 128 112 289 55 19 11 229 31 114 24 126 237 26 258 40 112 275 94 198 95 170 197
29% 32% 26% 16% 28% 33% 40% 32% 34% 12% 24% 53% 6% 29% 7% 23% 57% 5% 51% 44% 24% 32% 21% 31% 36% 30% 28%
Sigma 1340 658 682 343 329 387 282 910 161 165 45 429 496 389 364 558 418 514 507 90 469 871 442 636 263 563 715
100% 100% 100% 100% 100% 100% 100% 100% 100% 100% 100% 100% 100% 100% 100% 100% 100% 100% 100% 100% 100% 100% 100% 100% 100% 100% 100%

Page 23
Fielding Period: March 27-29, 2018
HCAPS (Filtered on Registered Voters)
Weighted To The U.S. General Adult Population - Propensity
30 Mar 2018
Table 20
M9 Which of the following should be the top priority for President Trump and Republicans in Congress?
Base: All Respondents
Presidential
Election Candidate
Gender Age Ethnicity Political Party Political Ideology Voted For Education Locale Income
_____________ ______________________ _______________________ ____________________ ____________________ _____________________ _____________ ________________ _________
Colle- Some
Cons- ge Gr- Colle- $75K Less
Hisp- Black Repub- Democ- Indep- Libe- Mode- erva- 3rd ad And ge Or Urb- Subu- Or Than
Total Male Female 18-34 35-49 50-64 65+ White anic /AA Other lican rat endent ral rate tive Clinton Trump Party Higher Less an rban Rural More $75K
______ _____ _______ _____ _____ _____ ____ _____ _____ _____ _____ ______ ______ ______ ______ ______ ______ ________ ______ _____ ______ ______ ____ _____ _____ ____ ____
Unweighted Base 1340 538 802 296 337 392 315 1078 68 123 27 415 478 384 366 551 423 491 511 106 452 888 398 633 309 404 868
Weighted Base 1340 658 682 343 329 387 282 910 161 165 45 429 496 389 364 558 418 514 507 90 469 871 442 636 263 563 715
Effective Base 720 324 402 155 187 207 184 611 48 79 16 232 261 206 197 299 225 269 285 62 260 461 224 340 160 251 466
Stimulating American jobs 394 184 211 120 100 106 68 233 53 69 19 94 154 138 100 191 103 169 106 25 120 275 132 191 72 138 243
29% 28% 31% 35% 30% 27% 24% 26% 33% 42% 42% 22% 31% 35% 27% 34% 25% 33% 21% 28% 26% 32% 30% 30% 27% 24% 34%
Passing an infrastructure 202 112 91 22 50 68 61 151 16 18 12 42 93 62 101 68 33 124 45 19 106 96 64 103 35 101 95
spending bill 15% 17% 13% 6% 15% 18% 22% 17% 10% 11% 27% 10% 19% 16% 28% 12% 8% 24% 9% 21% 23% 11% 14% 16% 13% 18% 13%
Destroying ISIS 150 64 86 57 30 31 32 105 13 20 1 55 68 25 37 65 49 58 54 5 50 101 55 70 25 67 71
11% 10% 13% 17% 9% 8% 11% 12% 8% 12% 3% 13% 14% 6% 10% 12% 12% 11% 11% 5% 11% 12% 13% 11% 10% 12% 10%
Repealing and replacing the 140 70 70 28 46 46 20 105 15 12 4 73 32 34 15 53 72 20 83 13 43 98 37 67 36 62 75
Affordable Care Act (also 10% 11% 10% 8% 14% 12% 7% 11% 9% 7% 10% 17% 7% 9% 4% 10% 17% 4% 16% 14% 9% 11% 8% 11% 14% 11% 10%
known as "Obamacare")
Passing a comprehensive tax 125 67 58 37 29 40 18 71 26 18 2 23 48 51 37 60 28 46 41 17 43 81 36 68 20 63 55
reform bill 9% 10% 8% 11% 9% 10% 6% 8% 16% 11% 4% 5% 10% 13% 10% 11% 7% 9% 8% 18% 9% 9% 8% 11% 8% 11% 8%
Reducing the total amount of 105 41 64 18 20 31 35 91 7 3 2 65 19 20 12 29 64 12 81 3 24 82 34 42 29 36 67
immigrants allowed in the 8% 6% 9% 5% 6% 8% 13% 10% 4% 2% 4% 15% 4% 5% 3% 5% 15% 2% 16% 4% 5% 9% 8% 7% 11% 6% 9%
United States
Renegotiating trade deals 100 54 46 11 26 39 23 62 19 12 3 25 43 30 26 46 27 45 31 5 30 69 30 49 20 39 53
with other countries 7% 8% 7% 3% 8% 10% 8% 7% 12% 7% 7% 6% 9% 8% 7% 8% 7% 9% 6% 6% 6% 8% 7% 8% 8% 7% 7%
Building a wall between the 55 33 21 17 9 14 15 49 1 2 1 42 3 8 9 15 30 3 46 3 18 37 22 19 14 28 26
United States and Mexico 4% 5% 3% 5% 3% 4% 5% 5% 1% 1% 2% 10% 1% 2% 2% 3% 7% 1% 9% 3% 4% 4% 5% 3% 5% 5% 4%
Expanding family leave 52 24 28 28 14 7 2 28 10 10 * 4 34 12 28 20 4 36 6 1 29 23 28 16 8 22 23
policies 4% 4% 4% 8% 4% 2% 1% 3% 6% 6% 1% 1% 7% 3% 8% 4% 1% 7% 1% 1% 6% 3% 6% 3% 3% 4% 3%
Undoing the Iran deal 17 9 7 3 3 3 7 15 2 * - 7 2 8 - 9 7 1 14 - 7 10 3 10 3 7 8
1% 1% 1% 1% 1% 1% 3% 2% 1% * - 2% * 2% - 2% 2% * 3% - 1% 1% 1% 2% 1% 1% 1%
Sigma 1340 658 682 343 329 387 282 910 161 165 45 429 496 389 364 558 418 514 507 90 469 871 442 636 263 563 715
100% 100% 100% 100% 100% 100% 100% 100% 100% 100% 100% 100% 100% 100% 100% 100% 100% 100% 100% 100% 100% 100% 100% 100% 100% 100% 100%

Page 24
Fielding Period: March 27-29, 2018
HCAPS (Filtered on Registered Voters)
Weighted To The U.S. General Adult Population - Propensity
30 Mar 2018
Table 21
QMIDTERMS1 If the 2018 midterms were held today, would you vote for the Democratic or Republican candidate in your district?
Base: All Respondents
Presidential
Election Candidate
Gender Age Ethnicity Political Party Political Ideology Voted For Education Locale Income
_____________ ______________________ _______________________ ____________________ ____________________ _____________________ _____________ ________________ _________
Colle- Some
Cons- ge Gr- Colle- $75K Less
Hisp- Black Repub- Democ- Indep- Libe- Mode- erva- 3rd ad And ge Or Urb- Subu- Or Than
Total Male Female 18-34 35-49 50-64 65+ White anic /AA Other lican rat endent ral rate tive Clinton Trump Party Higher Less an rban Rural More $75K
______ _____ _______ _____ _____ _____ ____ _____ _____ _____ _____ ______ ______ ______ ______ ______ ______ ________ ______ _____ ______ ______ ____ _____ _____ ____ ____
Unweighted Base 1340 538 802 296 337 392 315 1078 68 123 27 415 478 384 366 551 423 491 511 106 452 888 398 633 309 404 868
Weighted Base 1340 658 682 343 329 387 282 910 161 165 45 429 496 389 364 558 418 514 507 90 469 871 442 636 263 563 715
Effective Base 720 324 402 155 187 207 184 611 48 79 16 232 261 206 197 299 225 269 285 62 260 461 224 340 160 251 466
Democratic candidate 604 268 337 162 142 182 118 346 74 130 26 17 439 141 302 260 42 447 51 26 217 387 233 275 97 242 339
45% 41% 49% 47% 43% 47% 42% 38% 46% 79% 57% 4% 89% 36% 83% 47% 10% 87% 10% 29% 46% 44% 53% 43% 37% 43% 47%
Republican candidate 454 276 178 100 115 128 110 380 45 13 10 362 17 72 34 115 305 15 367 23 171 283 145 198 111 224 207
34% 42% 26% 29% 35% 33% 39% 42% 28% 8% 21% 84% 3% 19% 9% 21% 73% 3% 72% 26% 36% 33% 33% 31% 42% 40% 29%
Other 67 35 32 17 18 23 9 38 1 8 7 8 5 50 12 45 10 11 15 22 22 44 16 40 10 26 39
5% 5% 5% 5% 5% 6% 3% 4% 1% 5% 16% 2% 1% 13% 3% 8% 2% 2% 3% 25% 5% 5% 4% 6% 4% 5% 5%
Unsure 215 80 135 64 53 53 45 146 41 13 2 43 36 125 16 138 61 42 73 19 58 156 48 123 45 70 130
16% 12% 20% 19% 16% 14% 16% 16% 26% 8% 5% 10% 7% 32% 4% 25% 15% 8% 14% 21% 12% 18% 11% 19% 17% 13% 18%
Sigma 1340 658 682 343 329 387 282 910 161 165 45 429 496 389 364 558 418 514 507 90 469 871 442 636 263 563 715
100% 100% 100% 100% 100% 100% 100% 100% 100% 100% 100% 100% 100% 100% 100% 100% 100% 100% 100% 100% 100% 100% 100% 100% 100% 100% 100%

Page 25
Fielding Period: March 27-29, 2018
HCAPS (Filtered on Registered Voters)
Weighted To The U.S. General Adult Population - Propensity
30 Mar 2018
Table 22
QMIDTERMS2 If the 2018 midterm elections were today, would you want to see the Republican Party or the Democratic
Party win control of the United States House of Representatives?
Base: All Respondents
Presidential
Election Candidate
Gender Age Ethnicity Political Party Political Ideology Voted For Education Locale Income
_____________ ______________________ _______________________ ____________________ ____________________ _____________________ _____________ ________________ _________
Colle- Some
Cons- ge Gr- Colle- $75K Less
Hisp- Black Repub- Democ- Indep- Libe- Mode- erva- 3rd ad And ge Or Urb- Subu- Or Than
Total Male Female 18-34 35-49 50-64 65+ White anic /AA Other lican rat endent ral rate tive Clinton Trump Party Higher Less an rban Rural More $75K
______ _____ _______ _____ _____ _____ ____ _____ _____ _____ _____ ______ ______ ______ ______ ______ ______ ________ ______ _____ ______ ______ ____ _____ _____ ____ ____
Unweighted Base 1340 538 802 296 337 392 315 1078 68 123 27 415 478 384 366 551 423 491 511 106 452 888 398 633 309 404 868
Weighted Base 1340 658 682 343 329 387 282 910 161 165 45 429 496 389 364 558 418 514 507 90 469 871 442 636 263 563 715
Effective Base 720 324 402 155 187 207 184 611 48 79 16 232 261 206 197 299 225 269 285 62 260 461 224 340 160 251 466
Democratic Party 765 338 427 221 182 223 138 427 105 150 34 28 470 250 323 374 68 492 74 49 266 498 275 371 118 291 439
57% 51% 63% 65% 56% 58% 49% 47% 65% 91% 76% 6% 95% 64% 89% 67% 16% 96% 15% 55% 57% 57% 62% 58% 45% 52% 61%
Republican Party 575 320 255 121 146 164 144 483 56 15 11 401 26 139 42 183 350 22 433 41 203 373 166 265 144 272 276
43% 49% 37% 35% 44% 42% 51% 53% 35% 9% 24% 94% 5% 36% 11% 33% 84% 4% 85% 45% 43% 43% 38% 42% 55% 48% 39%
Sigma 1340 658 682 343 329 387 282 910 161 165 45 429 496 389 364 558 418 514 507 90 469 871 442 636 263 563 715
100% 100% 100% 100% 100% 100% 100% 100% 100% 100% 100% 100% 100% 100% 100% 100% 100% 100% 100% 100% 100% 100% 100% 100% 100% 100% 100%

Page 26
Fielding Period: March 27-29, 2018
HCAPS (Filtered on Registered Voters)
Weighted To The U.S. General Adult Population - Propensity
30 Mar 2018
Table 23
QMIDTERMS3 If the election were today, would you want to see the Republican Party or the Democratic
Party win control of the United States Senate?
Base: All Respondents
Presidential
Election Candidate
Gender Age Ethnicity Political Party Political Ideology Voted For Education Locale Income
_____________ ______________________ _______________________ ____________________ ____________________ _____________________ _____________ ________________ _________
Colle- Some
Cons- ge Gr- Colle- $75K Less
Hisp- Black Repub- Democ- Indep- Libe- Mode- erva- 3rd ad And ge Or Urb- Subu- Or Than
Total Male Female 18-34 35-49 50-64 65+ White anic /AA Other lican rat endent ral rate tive Clinton Trump Party Higher Less an rban Rural More $75K
______ _____ _______ _____ _____ _____ ____ _____ _____ _____ _____ ______ ______ ______ ______ ______ ______ ________ ______ _____ ______ ______ ____ _____ _____ ____ ____
Unweighted Base 1340 538 802 296 337 392 315 1078 68 123 27 415 478 384 366 551 423 491 511 106 452 888 398 633 309 404 868
Weighted Base 1340 658 682 343 329 387 282 910 161 165 45 429 496 389 364 558 418 514 507 90 469 871 442 636 263 563 715
Effective Base 720 324 402 155 187 207 184 611 48 79 16 232 261 206 197 299 225 269 285 62 260 461 224 340 160 251 466
Democratic Party 761 334 427 224 182 220 135 424 105 150 32 26 468 250 321 373 67 491 75 48 263 498 277 366 119 289 439
57% 51% 63% 65% 55% 57% 48% 47% 65% 91% 72% 6% 94% 64% 88% 67% 16% 96% 15% 53% 56% 57% 63% 58% 45% 51% 61%
Republican Party 579 324 255 118 146 167 147 486 56 15 13 403 27 139 43 184 351 23 432 43 206 373 165 270 143 274 276
43% 49% 37% 35% 45% 43% 52% 53% 35% 9% 28% 94% 6% 36% 12% 33% 84% 4% 85% 47% 44% 43% 37% 42% 55% 49% 39%
Sigma 1340 658 682 343 329 387 282 910 161 165 45 429 496 389 364 558 418 514 507 90 469 871 442 636 263 563 715
100% 100% 100% 100% 100% 100% 100% 100% 100% 100% 100% 100% 100% 100% 100% 100% 100% 100% 100% 100% 100% 100% 100% 100% 100% 100% 100%

Page 27
Fielding Period: March 27-29, 2018
HCAPS (Filtered on Registered Voters)
Weighted To The U.S. General Adult Population - Propensity
30 Mar 2018
Table 24
QPHILIBUSTER Passing most legislation in the Senate requires 60 votes. Do you think that this 60 vote
requirement should be continued or should passing legislation only require 51 votes?
Base: All Respondents
Presidential
Election Candidate
Gender Age Ethnicity Political Party Political Ideology Voted For Education Locale Income
_____________ ______________________ _______________________ ____________________ ____________________ _____________________ _____________ ________________ _________
Colle- Some
Cons- ge Gr- Colle- $75K Less
Hisp- Black Repub- Democ- Indep- Libe- Mode- erva- 3rd ad And ge Or Urb- Subu- Or Than
Total Male Female 18-34 35-49 50-64 65+ White anic /AA Other lican rat endent ral rate tive Clinton Trump Party Higher Less an rban Rural More $75K
______ _____ _______ _____ _____ _____ ____ _____ _____ _____ _____ ______ ______ ______ ______ ______ ______ ________ ______ _____ ______ ______ ____ _____ _____ ____ ____
Unweighted Base 1340 538 802 296 337 392 315 1078 68 123 27 415 478 384 366 551 423 491 511 106 452 888 398 633 309 404 868
Weighted Base 1340 658 682 343 329 387 282 910 161 165 45 429 496 389 364 558 418 514 507 90 469 871 442 636 263 563 715
Effective Base 720 324 402 155 187 207 184 611 48 79 16 232 261 206 197 299 225 269 285 62 260 461 224 340 160 251 466
Continue the current 904 447 456 258 221 251 174 617 114 104 32 263 357 266 292 361 251 368 300 67 341 563 322 412 170 412 454
requirement of 60 votes 67% 68% 67% 75% 67% 65% 62% 68% 71% 63% 70% 61% 72% 68% 80% 65% 60% 72% 59% 74% 73% 65% 73% 65% 65% 73% 64%
Passing most legislation 436 211 226 85 107 136 108 293 47 61 13 166 139 123 73 197 167 146 206 23 128 308 119 224 93 151 261
should only require 51 votes 33% 32% 33% 25% 33% 35% 38% 32% 29% 37% 30% 39% 28% 32% 20% 35% 40% 28% 41% 26% 27% 35% 27% 35% 35% 27% 36%
Sigma 1340 658 682 343 329 387 282 910 161 165 45 429 496 389 364 558 418 514 507 90 469 871 442 636 263 563 715
100% 100% 100% 100% 100% 100% 100% 100% 100% 100% 100% 100% 100% 100% 100% 100% 100% 100% 100% 100% 100% 100% 100% 100% 100% 100% 100%

Page 28
Fielding Period: March 27-29, 2018
HCAPS (Filtered on Registered Voters)
Weighted To The U.S. General Adult Population - Propensity
30 Mar 2018
Table 25
Q1903 Regardless of how you may vote, what do you usually consider yourself?
Base: All Respondents
Presidential
Election Candidate
Gender Age Ethnicity Political Party Political Ideology Voted For Education Locale Income
_____________ ______________________ _______________________ ____________________ ____________________ _____________________ _____________ ________________ _________
Colle- Some
Cons- ge Gr- Colle- $75K Less
Hisp- Black Repub- Democ- Indep- Libe- Mode- erva- 3rd ad And ge Or Urb- Subu- Or Than
Total Male Female 18-34 35-49 50-64 65+ White anic /AA Other lican rat endent ral rate tive Clinton Trump Party Higher Less an rban Rural More $75K
______ _____ _______ _____ _____ _____ ____ _____ _____ _____ _____ ______ ______ ______ ______ ______ ______ ________ ______ _____ ______ ______ ____ _____ _____ ____ ____
Unweighted Base 1340 538 802 296 337 392 315 1078 68 123 27 415 478 384 366 551 423 491 511 106 452 888 398 633 309 404 868
Weighted Base 1340 658 682 343 329 387 282 910 161 165 45 429 496 389 364 558 418 514 507 90 469 871 442 636 263 563 715
Effective Base 720 324 402 155 187 207 184 611 48 79 16 232 261 206 197 299 225 269 285 62 260 461 224 340 160 251 466
Democrat 496 209 286 135 111 148 102 258 68 119 22 - 496 - 237 219 39 353 52 11 141 354 193 232 71 172 303
37% 32% 42% 39% 34% 38% 36% 28% 42% 72% 48% - 100% - 65% 39% 9% 69% 10% 12% 30% 41% 44% 36% 27% 31% 42%
Republican 429 239 190 102 114 114 100 371 37 8 9 429 - - 39 94 295 14 335 28 168 260 142 175 111 216 190
32% 36% 28% 30% 35% 29% 35% 41% 23% 5% 20% 100% - - 11% 17% 71% 3% 66% 31% 36% 30% 32% 28% 42% 38% 27%
Independent 389 203 186 99 95 120 75 266 51 36 10 - - 389 80 231 78 143 117 44 150 238 98 218 73 165 207
29% 31% 27% 29% 29% 31% 26% 29% 32% 22% 21% - - 100% 22% 41% 19% 28% 23% 48% 32% 27% 22% 34% 28% 29% 29%
Other 27 7 20 6 9 5 6 14 5 2 5 - - - 8 13 6 4 3 7 9 18 9 11 7 9 15
2% 1% 3% 2% 3% 1% 2% 2% 3% 1% 10% - - - 2% 2% 1% 1% 1% 8% 2% 2% 2% 2% 3% 2% 2%
Sigma 1340 658 682 343 329 387 282 910 161 165 45 429 496 389 364 558 418 514 507 90 469 871 442 636 263 563 715
100% 100% 100% 100% 100% 100% 100% 100% 100% 100% 100% 100% 100% 100% 100% 100% 100% 100% 100% 100% 100% 100% 100% 100% 100% 100% 100%

Page 29
Fielding Period: March 27-29, 2018
HCAPS (Filtered on Registered Voters)
Weighted To The U.S. General Adult Population - Propensity
30 Mar 2018
Table 26
Q1905 Would you call yourself a strong Republican or a not-so-strong Republican?
Base: Republican
Presidential
Election Candidate
Gender Age Ethnicity Political Party Political Ideology Voted For Education Locale Income
_____________ ______________________ _______________________ ____________________ ____________________ _____________________ _____________ ________________ _________
Colle- Some
Cons- ge Gr- Colle- $75K Less
Hisp- Black Repub- Democ- Indep- Libe- Mode- erva- 3rd ad And ge Or Urb- Subu- Or Than
Total Male Female 18-34 35-49 50-64 65+ White anic /AA Other lican rat endent ral rate tive Clinton Trump Party Higher Less an rban Rural More $75K
______ _____ _______ _____ _____ _____ ____ _____ _____ _____ _____ ______ ______ ______ ______ ______ ______ ________ ______ _____ ______ ______ ____ _____ _____ ____ ____
Unweighted Base 415 186 229 77 107 123 108 387 14 3 6 415 - - 29 96 290 17 332 24 137 278 110 181 124 139 254
Weighted Base 429 239 190 102 114 114 100 371 37 8 9 429 - - 39 94 295 14 335 28 168 260 142 175 111 216 190
Effective Base 232 118 117 43 60 77 59 226 11 2 3 232 - - 20 56 156 12 188 15 82 151 68 97 70 95 152
Strong Republican 268 158 109 61 74 71 61 248 13 3 2 268 - - 26 43 199 1 239 10 113 155 113 85 70 149 108
62% 66% 58% 60% 65% 62% 62% 67% 36% 40% 23% 62% - - 66% 45% 68% 7% 71% 34% 67% 60% 79% 49% 63% 69% 56%
Not-so-strong Republican 161 80 80 40 40 43 38 123 24 5 7 161 - - 13 52 96 13 96 19 56 105 30 90 41 67 83
38% 34% 42% 40% 35% 38% 38% 33% 64% 60% 77% 38% - - 34% 55% 32% 93% 29% 66% 33% 40% 21% 51% 37% 31% 44%
Sigma 429 239 190 102 114 114 100 371 37 8 9 429 - - 39 94 295 14 335 28 168 260 142 175 111 216 190
100% 100% 100% 100% 100% 100% 100% 100% 100% 100% 100% 100% - - 100% 100% 100% 100% 100% 100% 100% 100% 100% 100% 100% 100% 100%
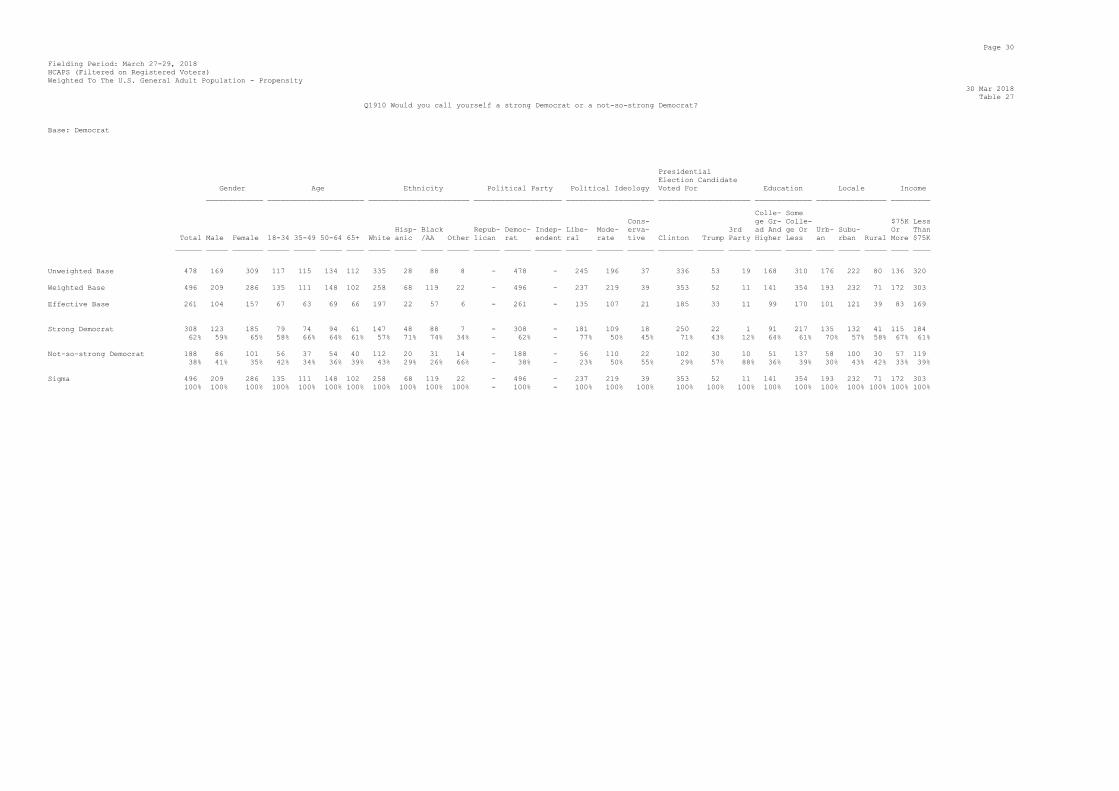
Page 30
Fielding Period: March 27-29, 2018
HCAPS (Filtered on Registered Voters)
Weighted To The U.S. General Adult Population - Propensity
30 Mar 2018
Table 27
Q1910 Would you call yourself a strong Democrat or a not-so-strong Democrat?
Base: Democrat
Presidential
Election Candidate
Gender Age Ethnicity Political Party Political Ideology Voted For Education Locale Income
_____________ ______________________ _______________________ ____________________ ____________________ _____________________ _____________ ________________ _________
Colle- Some
Cons- ge Gr- Colle- $75K Less
Hisp- Black Repub- Democ- Indep- Libe- Mode- erva- 3rd ad And ge Or Urb- Subu- Or Than
Total Male Female 18-34 35-49 50-64 65+ White anic /AA Other lican rat endent ral rate tive Clinton Trump Party Higher Less an rban Rural More $75K
______ _____ _______ _____ _____ _____ ____ _____ _____ _____ _____ ______ ______ ______ ______ ______ ______ ________ ______ _____ ______ ______ ____ _____ _____ ____ ____
Unweighted Base 478 169 309 117 115 134 112 335 28 88 8 - 478 - 245 196 37 336 53 19 168 310 176 222 80 136 320
Weighted Base 496 209 286 135 111 148 102 258 68 119 22 - 496 - 237 219 39 353 52 11 141 354 193 232 71 172 303
Effective Base 261 104 157 67 63 69 66 197 22 57 6 - 261 - 135 107 21 185 33 11 99 170 101 121 39 83 169
Strong Democrat 308 123 185 79 74 94 61 147 48 88 7 - 308 - 181 109 18 250 22 1 91 217 135 132 41 115 184
62% 59% 65% 58% 66% 64% 61% 57% 71% 74% 34% - 62% - 77% 50% 45% 71% 43% 12% 64% 61% 70% 57% 58% 67% 61%
Not-so-strong Democrat 188 86 101 56 37 54 40 112 20 31 14 - 188 - 56 110 22 102 30 10 51 137 58 100 30 57 119
38% 41% 35% 42% 34% 36% 39% 43% 29% 26% 66% - 38% - 23% 50% 55% 29% 57% 88% 36% 39% 30% 43% 42% 33% 39%
Sigma 496 209 286 135 111 148 102 258 68 119 22 - 496 - 237 219 39 353 52 11 141 354 193 232 71 172 303
100% 100% 100% 100% 100% 100% 100% 100% 100% 100% 100% - 100% - 100% 100% 100% 100% 100% 100% 100% 100% 100% 100% 100% 100% 100%

Page 31
Fielding Period: March 27-29, 2018
HCAPS (Filtered on Registered Voters)
Weighted To The U.S. General Adult Population - Propensity
30 Mar 2018
Table 28
Q1912 Insert text assignment
Base: Independent/Other
Presidential
Election Candidate
Gender Age Ethnicity Political Party Political Ideology Voted For Education Locale Income
_____________ ______________________ _______________________ ____________________ ____________________ _____________________ _____________ ________________ _________
Colle- Some
Cons- ge Gr- Colle- $75K Less
Hisp- Black Repub- Democ- Indep- Libe- Mode- erva- 3rd ad And ge Or Urb- Subu- Or Than
Total Male Female 18-34 35-49 50-64 65+ White anic /AA Other lican rat endent ral rate tive Clinton Trump Party Higher Less an rban Rural More $75K
______ _____ _______ _____ _____ _____ ____ _____ _____ _____ _____ ______ ______ ______ ______ ______ ______ ________ ______ _____ ______ ______ ____ _____ _____ ____ ____
Unweighted Base 447 183 264 102 115 135 95 356 26 32 13 - - 384 92 259 96 138 126 63 147 300 112 230 105 129 294
Weighted Base 415 210 206 106 104 125 81 281 56 38 14 - - 389 88 244 83 147 120 51 159 256 106 229 80 175 222
Effective Base 228 102 129 46 65 66 60 194 16 21 8 - - 206 43 138 48 74 65 40 85 143 56 122 51 74 155
Republican/Democratic 223 115 108 59 64 65 36 142 39 21 4 - - 210 48 134 40 84 63 23 89 134 54 120 50 87 129
54% 55% 53% 55% 61% 52% 44% 51% 68% 56% 27% - - 54% 55% 55% 49% 57% 53% 46% 56% 52% 50% 52% 62% 50% 58%
Democratic/Republican 192 95 97 47 40 60 45 138 18 17 10 - - 179 40 110 43 63 57 27 70 122 53 109 30 88 93
46% 45% 47% 45% 39% 48% 56% 49% 32% 44% 73% - - 46% 45% 45% 51% 43% 47% 54% 44% 48% 50% 48% 38% 50% 42%
Sigma 415 210 206 106 104 125 81 281 56 38 14 - - 389 88 244 83 147 120 51 159 256 106 229 80 175 222
100% 100% 100% 100% 100% 100% 100% 100% 100% 100% 100% - - 100% 100% 100% 100% 100% 100% 100% 100% 100% 100% 100% 100% 100% 100%

Page 32
Fielding Period: March 27-29, 2018
HCAPS (Filtered on Registered Voters)
Weighted To The U.S. General Adult Population - Propensity
30 Mar 2018
Table 29
Q1915 Do you lean more toward the Republican Party or toward the Democratic Party/the Democratic Party or toward the Republican Party?
Base: Independent/Other
Presidential
Election Candidate
Gender Age Ethnicity Political Party Political Ideology Voted For Education Locale Income
_____________ ______________________ _______________________ ____________________ ____________________ _____________________ _____________ ________________ _________
Colle- Some
Cons- ge Gr- Colle- $75K Less
Hisp- Black Repub- Democ- Indep- Libe- Mode- erva- 3rd ad And ge Or Urb- Subu- Or Than
Total Male Female 18-34 35-49 50-64 65+ White anic /AA Other lican rat endent ral rate tive Clinton Trump Party Higher Less an rban Rural More $75K
______ _____ _______ _____ _____ _____ ____ _____ _____ _____ _____ ______ ______ ______ ______ ______ ______ ________ ______ _____ ______ ______ ____ _____ _____ ____ ____
Unweighted Base 447 183 264 102 115 135 95 356 26 32 13 - - 384 92 259 96 138 126 63 147 300 112 230 105 129 294
Weighted Base 415 210 206 106 104 125 81 281 56 38 14 - - 389 88 244 83 147 120 51 159 256 106 229 80 175 222
Effective Base 228 102 129 46 65 66 60 194 16 21 8 - - 206 43 138 48 74 65 40 85 143 56 122 51 74 155
Lean Republican 94 54 40 14 24 34 21 67 17 4 1 - - 89 4 47 43 8 65 10 30 63 16 59 19 41 51
23% 26% 19% 14% 23% 27% 26% 24% 30% 12% 7% - - 23% 4% 19% 51% 6% 55% 19% 19% 25% 15% 26% 24% 23% 23%
Lean Democrat 152 86 66 55 34 40 24 94 18 23 5 - - 148 68 67 18 108 7 14 64 88 44 75 34 62 85
37% 41% 32% 52% 32% 32% 30% 33% 31% 59% 33% - - 38% 77% 27% 22% 73% 6% 28% 40% 34% 42% 33% 42% 35% 38%
Do not lean either way 169 70 100 36 46 51 36 120 22 11 8 - - 151 17 130 23 32 47 27 65 105 46 96 27 72 86
41% 33% 48% 34% 44% 41% 44% 43% 39% 29% 60% - - 39% 19% 53% 27% 21% 39% 53% 41% 41% 44% 42% 34% 41% 39%
Sigma 415 210 206 106 104 125 81 281 56 38 14 - - 389 88 244 83 147 120 51 159 256 106 229 80 175 222
100% 100% 100% 100% 100% 100% 100% 100% 100% 100% 100% - - 100% 100% 100% 100% 100% 100% 100% 100% 100% 100% 100% 100% 100% 100%

Page 33
Fielding Period: March 27-29, 2018
HCAPS (Filtered on Registered Voters)
Weighted To The U.S. General Adult Population - Propensity
30 Mar 2018
Table 30
F1 Now we will show you some names. Please indicate if you have a favorable
or unfavorable view of that person - or if you've never heard of them.
Summary Of Ever Heard Of
Base: All Respondents
Presidential
Election Candidate
Gender Age Ethnicity Political Party Political Ideology Voted For Education Locale Income
_____________ ______________________ _______________________ ____________________ ____________________ _____________________ _____________ ________________ _________
Colle- Some
Cons- ge Gr- Colle- $75K Less
Hisp- Black Repub- Democ- Indep- Libe- Mode- erva- 3rd ad And ge Or Urb- Subu- Or Than
Total Male Female 18-34 35-49 50-64 65+ White anic /AA Other lican rat endent ral rate tive Clinton Trump Party Higher Less an rban Rural More $75K
______ _____ _______ _____ _____ _____ ____ _____ _____ _____ _____ ______ ______ ______ ______ ______ ______ ________ ______ _____ ______ ______ ____ _____ _____ ____ ____
Unweighted Base 1340 538 802 296 337 392 315 1078 68 123 27 415 478 384 366 551 423 491 511 106 452 888 398 633 309 404 868
Weighted Base 1340 658 682 343 329 387 282 910 161 165 45 429 496 389 364 558 418 514 507 90 469 871 442 636 263 563 715
Effective Base 720 324 402 155 187 207 184 611 48 79 16 232 261 206 197 299 225 269 285 62 260 461 224 340 160 251 466
Donald Trump 1281 641 640 329 312 363 277 885 149 148 44 419 469 370 359 515 407 491 495 86 459 822 428 600 253 552 674
96% 97% 94% 96% 95% 94% 98% 97% 92% 90% 99% 98% 95% 95% 99% 92% 97% 96% 98% 95% 98% 94% 97% 94% 96% 98% 94%
Hillary Clinton 1248 616 633 311 304 358 275 869 142 143 41 414 461 351 346 497 405 483 491 84 452 797 412 583 254 542 654
93% 94% 93% 91% 93% 93% 98% 95% 88% 87% 91% 97% 93% 90% 95% 89% 97% 94% 97% 93% 96% 91% 93% 92% 97% 96% 91%
Mike Pence 1128 596 532 274 279 317 257 789 129 121 44 388 414 308 341 424 364 440 456 77 428 700 377 525 227 506 571
84% 91% 78% 80% 85% 82% 91% 87% 80% 73% 97% 90% 83% 79% 94% 76% 87% 86% 90% 85% 91% 80% 85% 83% 86% 90% 80%
Paul Ryan 1077 569 508 251 260 306 260 758 119 116 39 345 397 319 324 420 333 440 424 76 418 659 353 518 206 484 548
80% 86% 74% 73% 79% 79% 92% 83% 74% 71% 88% 81% 80% 82% 89% 75% 80% 86% 84% 84% 89% 76% 80% 81% 79% 86% 77%
Nancy Pelosi 1072 588 484 230 269 323 250 765 116 119 34 370 367 321 300 406 366 425 442 78 423 650 345 518 209 492 537
80% 89% 71% 67% 82% 84% 89% 84% 72% 72% 75% 86% 74% 83% 82% 73% 88% 83% 87% 86% 90% 75% 78% 82% 80% 87% 75%
Mark Zuckerberg 1056 551 505 278 269 285 224 735 123 112 41 345 380 315 314 423 319 419 407 76 400 656 363 489 203 489 528
79% 84% 74% 81% 82% 74% 79% 81% 77% 68% 91% 80% 77% 81% 86% 76% 76% 82% 80% 83% 85% 75% 82% 77% 77% 87% 74%
Mitch McConnell 930 522 407 215 227 258 231 652 96 102 34 292 345 280 297 345 288 400 373 59 389 541 332 429 169 439 456
69% 79% 60% 63% 69% 67% 82% 72% 60% 62% 76% 68% 70% 72% 82% 62% 69% 78% 74% 65% 83% 62% 75% 67% 64% 78% 64%
Jeff Sessions 925 518 407 222 223 265 215 638 88 113 40 283 355 273 309 343 273 408 355 66 376 549 333 417 175 439 448
69% 79% 60% 65% 68% 69% 76% 70% 54% 68% 89% 66% 72% 70% 85% 62% 65% 79% 70% 73% 80% 63% 75% 66% 67% 78% 63%
Robert Mueller 906 524 382 198 221 261 226 637 95 105 32 301 332 261 286 326 294 398 358 61 381 525 320 423 163 435 434
68% 80% 56% 58% 67% 67% 80% 70% 59% 64% 71% 70% 67% 67% 78% 59% 70% 77% 71% 67% 81% 60% 73% 67% 62% 77% 61%
Chuck Schumer 859 498 361 186 212 251 210 607 91 90 32 292 307 247 267 314 277 356 360 62 354 504 313 406 140 420 402
64% 76% 53% 54% 65% 65% 74% 67% 57% 54% 71% 68% 62% 64% 73% 56% 66% 69% 71% 68% 76% 58% 71% 64% 53% 75% 56%
Rex Tillerson 791 461 330 182 201 228 180 563 80 94 19 247 315 221 274 285 233 367 315 48 339 453 295 355 141 391 373
59% 70% 48% 53% 61% 59% 64% 62% 50% 57% 42% 58% 64% 57% 75% 51% 56% 71% 62% 53% 72% 52% 67% 56% 54% 69% 52%
John Kelly 735 434 301 193 171 196 175 514 81 79 25 224 286 214 247 288 200 330 276 52 314 422 264 344 128 368 337
55% 66% 44% 56% 52% 51% 62% 57% 50% 48% 56% 52% 58% 55% 68% 52% 48% 64% 55% 58% 67% 48% 60% 54% 49% 65% 47%
John Bolton 670 408 262 158 161 185 166 478 66 72 25 216 238 207 230 240 200 295 276 43 293 377 265 291 115 335 311
50% 62% 38% 46% 49% 48% 59% 53% 41% 44% 56% 50% 48% 53% 63% 43% 48% 57% 54% 48% 63% 43% 60% 46% 44% 59% 43%
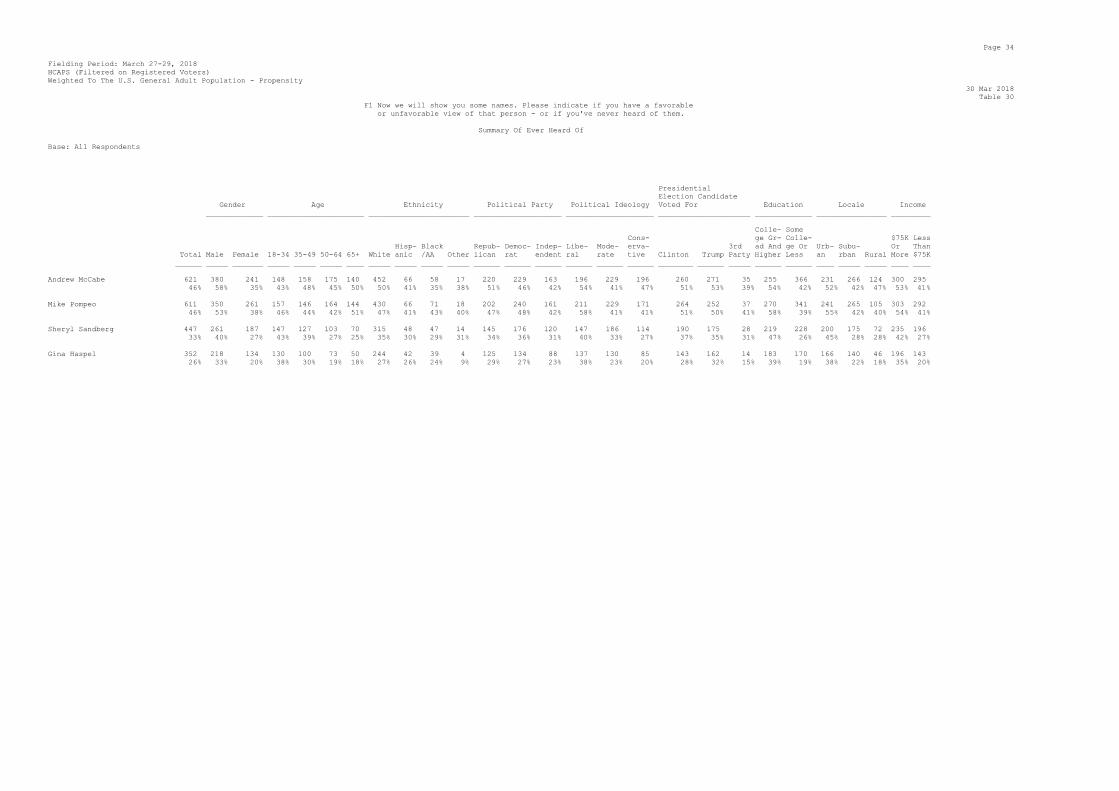
Page 34
Fielding Period: March 27-29, 2018
HCAPS (Filtered on Registered Voters)
Weighted To The U.S. General Adult Population - Propensity
30 Mar 2018
Table 30
F1 Now we will show you some names. Please indicate if you have a favorable
or unfavorable view of that person - or if you've never heard of them.
Summary Of Ever Heard Of
Base: All Respondents
Presidential
Election Candidate
Gender Age Ethnicity Political Party Political Ideology Voted For Education Locale Income
_____________ ______________________ _______________________ ____________________ ____________________ _____________________ _____________ ________________ _________
Colle- Some
Cons- ge Gr- Colle- $75K Less
Hisp- Black Repub- Democ- Indep- Libe- Mode- erva- 3rd ad And ge Or Urb- Subu- Or Than
Total Male Female 18-34 35-49 50-64 65+ White anic /AA Other lican rat endent ral rate tive Clinton Trump Party Higher Less an rban Rural More $75K
______ _____ _______ _____ _____ _____ ____ _____ _____ _____ _____ ______ ______ ______ ______ ______ ______ ________ ______ _____ ______ ______ ____ _____ _____ ____ ____
Andrew McCabe 621 380 241 148 158 175 140 452 66 58 17 220 229 163 196 229 196 260 271 35 255 366 231 266 124 300 295
46% 58% 35% 43% 48% 45% 50% 50% 41% 35% 38% 51% 46% 42% 54% 41% 47% 51% 53% 39% 54% 42% 52% 42% 47% 53% 41%
Mike Pompeo 611 350 261 157 146 164 144 430 66 71 18 202 240 161 211 229 171 264 252 37 270 341 241 265 105 303 292
46% 53% 38% 46% 44% 42% 51% 47% 41% 43% 40% 47% 48% 42% 58% 41% 41% 51% 50% 41% 58% 39% 55% 42% 40% 54% 41%
Sheryl Sandberg 447 261 187 147 127 103 70 315 48 47 14 145 176 120 147 186 114 190 175 28 219 228 200 175 72 235 196
33% 40% 27% 43% 39% 27% 25% 35% 30% 29% 31% 34% 36% 31% 40% 33% 27% 37% 35% 31% 47% 26% 45% 28% 28% 42% 27%
Gina Haspel 352 218 134 130 100 73 50 244 42 39 4 125 134 88 137 130 85 143 162 14 183 170 166 140 46 196 143
26% 33% 20% 38% 30% 19% 18% 27% 26% 24% 9% 29% 27% 23% 38% 23% 20% 28% 32% 15% 39% 19% 38% 22% 18% 35% 20%
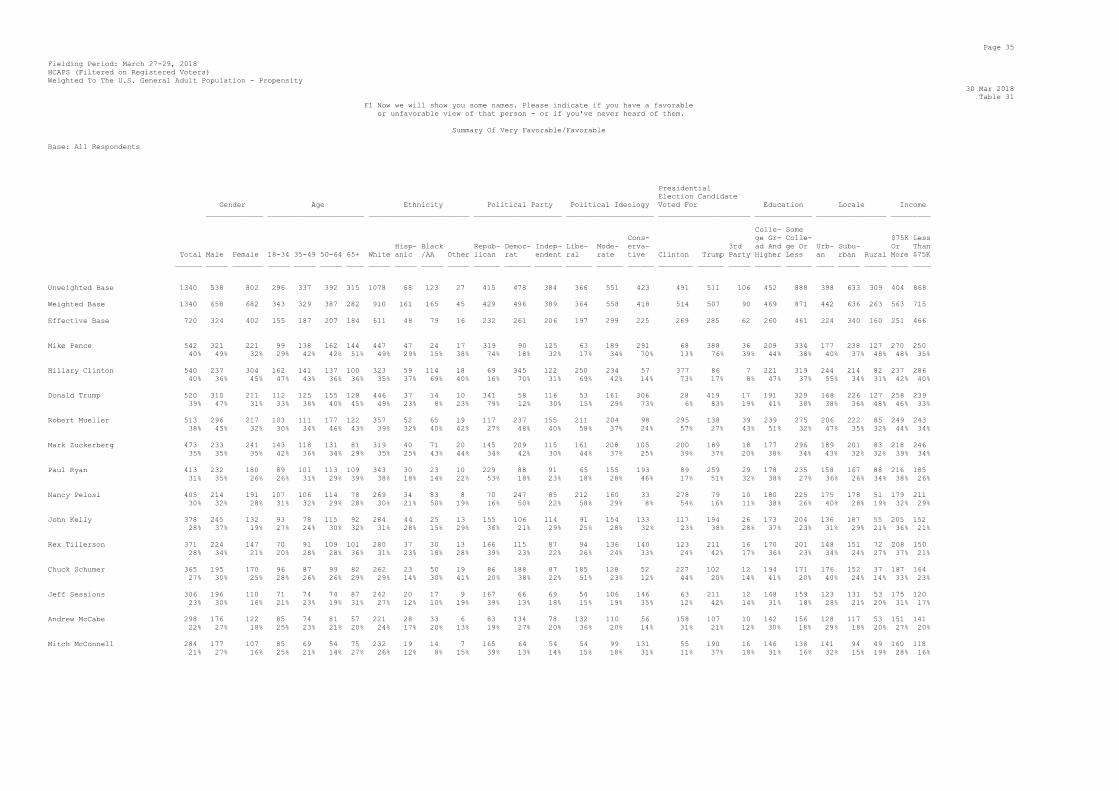
Page 35
Fielding Period: March 27-29, 2018
HCAPS (Filtered on Registered Voters)
Weighted To The U.S. General Adult Population - Propensity
30 Mar 2018
Table 31
F1 Now we will show you some names. Please indicate if you have a favorable
or unfavorable view of that person - or if you've never heard of them.
Summary Of Very Favorable/Favorable
Base: All Respondents
Presidential
Election Candidate
Gender Age Ethnicity Political Party Political Ideology Voted For Education Locale Income
_____________ ______________________ _______________________ ____________________ ____________________ _____________________ _____________ ________________ _________
Colle- Some
Cons- ge Gr- Colle- $75K Less
Hisp- Black Repub- Democ- Indep- Libe- Mode- erva- 3rd ad And ge Or Urb- Subu- Or Than
Total Male Female 18-34 35-49 50-64 65+ White anic /AA Other lican rat endent ral rate tive Clinton Trump Party Higher Less an rban Rural More $75K
______ _____ _______ _____ _____ _____ ____ _____ _____ _____ _____ ______ ______ ______ ______ ______ ______ ________ ______ _____ ______ ______ ____ _____ _____ ____ ____
Unweighted Base 1340 538 802 296 337 392 315 1078 68 123 27 415 478 384 366 551 423 491 511 106 452 888 398 633 309 404 868
Weighted Base 1340 658 682 343 329 387 282 910 161 165 45 429 496 389 364 558 418 514 507 90 469 871 442 636 263 563 715
Effective Base 720 324 402 155 187 207 184 611 48 79 16 232 261 206 197 299 225 269 285 62 260 461 224 340 160 251 466
Mike Pence 542 321 221 99 138 162 144 447 47 24 17 319 90 125 63 189 291 68 388 36 209 334 177 238 127 270 250
40% 49% 32% 29% 42% 42% 51% 49% 29% 15% 38% 74% 18% 32% 17% 34% 70% 13% 76% 39% 44% 38% 40% 37% 48% 48% 35%
Hillary Clinton 540 237 304 162 141 137 100 323 59 114 18 69 345 122 250 234 57 377 86 7 221 319 244 214 82 237 286
40% 36% 45% 47% 43% 36% 36% 35% 37% 69% 40% 16% 70% 31% 69% 42% 14% 73% 17% 8% 47% 37% 55% 34% 31% 42% 40%
Donald Trump 520 310 211 112 125 155 128 446 37 14 10 341 58 116 53 161 306 28 419 17 191 329 168 226 127 258 239
39% 47% 31% 33% 38% 40% 45% 49% 23% 8% 23% 79% 12% 30% 15% 29% 73% 6% 83% 19% 41% 38% 38% 36% 48% 46% 33%
Robert Mueller 513 296 217 103 111 177 122 357 52 65 19 117 237 155 211 204 98 295 138 39 239 275 206 222 85 249 243
38% 45% 32% 30% 34% 46% 43% 39% 32% 40% 42% 27% 48% 40% 58% 37% 24% 57% 27% 43% 51% 32% 47% 35% 32% 44% 34%
Mark Zuckerberg 473 233 241 143 118 131 81 319 40 71 20 145 209 115 161 208 105 200 189 18 177 296 189 201 83 218 246
35% 35% 35% 42% 36% 34% 29% 35% 25% 43% 44% 34% 42% 30% 44% 37% 25% 39% 37% 20% 38% 34% 43% 32% 32% 39% 34%
Paul Ryan 413 232 180 89 101 113 109 343 30 23 10 229 88 91 65 155 193 89 259 29 178 235 158 167 88 216 185
31% 35% 26% 26% 31% 29% 39% 38% 18% 14% 22% 53% 18% 23% 18% 28% 46% 17% 51% 32% 38% 27% 36% 26% 34% 38% 26%
Nancy Pelosi 405 214 191 107 106 114 78 269 34 83 8 70 247 85 212 160 33 278 79 10 180 225 175 178 51 179 211
30% 32% 28% 31% 32% 29% 28% 30% 21% 50% 19% 16% 50% 22% 58% 29% 8% 54% 16% 11% 38% 26% 40% 28% 19% 32% 29%
John Kelly 378 245 132 93 78 115 92 284 44 25 13 155 106 114 91 154 133 117 194 26 173 204 136 187 55 205 152
28% 37% 19% 27% 24% 30% 32% 31% 28% 15% 29% 36% 21% 29% 25% 28% 32% 23% 38% 28% 37% 23% 31% 29% 21% 36% 21%
Rex Tillerson 371 224 147 70 91 109 101 280 37 30 13 166 115 87 94 136 140 123 211 16 170 201 148 151 72 208 150
28% 34% 21% 20% 28% 28% 36% 31% 23% 18% 28% 39% 23% 22% 26% 24% 33% 24% 42% 17% 36% 23% 34% 24% 27% 37% 21%
Chuck Schumer 365 195 170 96 87 99 82 262 23 50 19 86 188 87 185 128 52 227 102 12 194 171 176 152 37 187 164
27% 30% 25% 28% 26% 26% 29% 29% 14% 30% 41% 20% 38% 22% 51% 23% 12% 44% 20% 14% 41% 20% 40% 24% 14% 33% 23%
Jeff Sessions 306 196 110 71 74 74 87 242 20 17 9 167 66 69 54 106 146 63 211 12 148 159 123 131 53 175 120
23% 30% 16% 21% 23% 19% 31% 27% 12% 10% 19% 39% 13% 18% 15% 19% 35% 12% 42% 14% 31% 18% 28% 21% 20% 31% 17%
Andrew McCabe 298 176 122 85 74 81 57 221 28 33 6 83 134 78 132 110 56 158 107 10 142 156 128 117 53 151 141
22% 27% 18% 25% 23% 21% 20% 24% 17% 20% 13% 19% 27% 20% 36% 20% 14% 31% 21% 12% 30% 18% 29% 18% 20% 27% 20%
Mitch McConnell 284 177 107 85 69 54 75 232 19 14 7 165 64 54 54 99 131 55 190 16 146 138 141 94 49 160 118
21% 27% 16% 25% 21% 14% 27% 26% 12% 8% 15% 39% 13% 14% 15% 18% 31% 11% 37% 18% 31% 16% 32% 15% 19% 28% 16%

Page 36
Fielding Period: March 27-29, 2018
HCAPS (Filtered on Registered Voters)
Weighted To The U.S. General Adult Population - Propensity
30 Mar 2018
Table 31
F1 Now we will show you some names. Please indicate if you have a favorable
or unfavorable view of that person - or if you've never heard of them.
Summary Of Very Favorable/Favorable
Base: All Respondents
Presidential
Election Candidate
Gender Age Ethnicity Political Party Political Ideology Voted For Education Locale Income
_____________ ______________________ _______________________ ____________________ ____________________ _____________________ _____________ ________________ _________
Colle- Some
Cons- ge Gr- Colle- $75K Less
Hisp- Black Repub- Democ- Indep- Libe- Mode- erva- 3rd ad And ge Or Urb- Subu- Or Than
Total Male Female 18-34 35-49 50-64 65+ White anic /AA Other lican rat endent ral rate tive Clinton Trump Party Higher Less an rban Rural More $75K
______ _____ _______ _____ _____ _____ ____ _____ _____ _____ _____ ______ ______ ______ ______ ______ ______ ________ ______ _____ ______ ______ ____ _____ _____ ____ ____
John Bolton 260 173 88 63 66 56 75 219 11 11 10 149 53 55 51 88 121 37 198 8 121 139 116 105 40 146 107
19% 26% 13% 18% 20% 15% 27% 24% 7% 6% 22% 35% 11% 14% 14% 16% 29% 7% 39% 9% 26% 16% 26% 16% 15% 26% 15%
Mike Pompeo 248 154 94 70 54 59 65 191 22 21 7 126 67 53 61 94 93 56 168 11 113 135 112 97 38 146 97
19% 23% 14% 20% 16% 15% 23% 21% 14% 13% 17% 29% 14% 14% 17% 17% 22% 11% 33% 12% 24% 16% 25% 15% 15% 26% 14%
Sheryl Sandberg 244 141 103 92 73 46 33 179 18 27 8 89 98 56 95 100 49 99 110 9 138 107 128 88 28 140 97
18% 21% 15% 27% 22% 12% 12% 20% 11% 17% 17% 21% 20% 14% 26% 18% 12% 19% 22% 10% 29% 12% 29% 14% 11% 25% 14%
Gina Haspel 142 100 43 58 43 33 8 112 9 12 2 69 38 35 47 53 42 37 99 2 88 54 79 54 9 96 44
11% 15% 6% 17% 13% 9% 3% 12% 5% 7% 5% 16% 8% 9% 13% 10% 10% 7% 19% 2% 19% 6% 18% 9% 3% 17% 6%

Page 37
Fielding Period: March 27-29, 2018
HCAPS (Filtered on Registered Voters)
Weighted To The U.S. General Adult Population - Propensity
30 Mar 2018
Table 32
F1 Now we will show you some names. Please indicate if you have a favorable
or unfavorable view of that person - or if you've never heard of them.
Summary Of Very Unfavorable/Unfavorable
Base: All Respondents
Presidential
Election Candidate
Gender Age Ethnicity Political Party Political Ideology Voted For Education Locale Income
_____________ ______________________ _______________________ ____________________ ____________________ _____________________ _____________ ________________ _________
Colle- Some
Cons- ge Gr- Colle- $75K Less
Hisp- Black Repub- Democ- Indep- Libe- Mode- erva- 3rd ad And ge Or Urb- Subu- Or Than
Total Male Female 18-34 35-49 50-64 65+ White anic /AA Other lican rat endent ral rate tive Clinton Trump Party Higher Less an rban Rural More $75K
______ _____ _______ _____ _____ _____ ____ _____ _____ _____ _____ ______ ______ ______ ______ ______ ______ ________ ______ _____ ______ ______ ____ _____ _____ ____ ____
Unweighted Base 1340 538 802 296 337 392 315 1078 68 123 27 415 478 384 366 551 423 491 511 106 452 888 398 633 309 404 868
Weighted Base 1340 658 682 343 329 387 282 910 161 165 45 429 496 389 364 558 418 514 507 90 469 871 442 636 263 563 715
Effective Base 720 324 402 155 187 207 184 611 48 79 16 232 261 206 197 299 225 269 285 62 260 461 224 340 160 251 466
Donald Trump 761 331 430 217 187 208 150 438 111 135 34 79 411 253 306 354 101 463 75 68 267 493 260 374 127 294 435
57% 50% 63% 63% 57% 54% 53% 48% 69% 82% 76% 18% 83% 65% 84% 63% 24% 90% 15% 76% 57% 57% 59% 59% 48% 52% 61%
Hillary Clinton 708 379 329 149 164 221 175 546 82 29 23 345 117 229 97 263 349 106 405 77 231 477 167 369 172 305 368
53% 58% 48% 43% 50% 57% 62% 60% 51% 18% 51% 80% 24% 59% 27% 47% 83% 21% 80% 85% 49% 55% 38% 58% 66% 54% 51%
Nancy Pelosi 668 375 293 123 164 209 171 496 82 36 25 300 120 236 88 246 333 147 364 68 243 425 170 340 158 313 326
50% 57% 43% 36% 50% 54% 61% 55% 51% 22% 56% 70% 24% 61% 24% 44% 80% 29% 72% 76% 52% 49% 38% 53% 60% 56% 46%
Paul Ryan 664 337 327 161 159 193 151 415 90 94 30 117 309 228 259 265 140 350 165 48 240 424 195 351 118 268 363
50% 51% 48% 47% 48% 50% 53% 46% 56% 57% 66% 27% 62% 59% 71% 47% 34% 68% 33% 53% 51% 49% 44% 55% 45% 48% 51%
Mitch McConnell 646 345 301 129 157 204 156 419 77 88 27 127 281 227 243 246 157 346 183 43 242 404 191 335 120 279 339
48% 53% 44% 38% 48% 53% 55% 46% 48% 54% 60% 30% 57% 58% 67% 44% 38% 67% 36% 48% 52% 46% 43% 53% 46% 50% 47%
Jeff Sessions 619 322 297 151 149 191 128 396 68 96 31 116 289 204 255 237 127 345 144 54 229 390 210 286 122 264 329
46% 49% 43% 44% 45% 49% 45% 44% 42% 58% 70% 27% 58% 52% 70% 42% 30% 67% 28% 59% 49% 45% 48% 45% 47% 47% 46%
Mike Pence 586 275 311 176 141 155 114 342 82 97 27 69 323 183 278 235 73 372 69 42 220 366 199 287 100 236 321
44% 42% 46% 51% 43% 40% 40% 38% 51% 59% 59% 16% 65% 47% 76% 42% 17% 72% 14% 46% 47% 42% 45% 45% 38% 42% 45%
Mark Zuckerberg 583 318 264 134 151 155 143 415 83 41 21 200 171 200 154 215 214 220 218 58 222 360 174 288 120 271 282
43% 48% 39% 39% 46% 40% 51% 46% 52% 25% 47% 47% 34% 52% 42% 39% 51% 43% 43% 64% 47% 41% 40% 45% 46% 48% 39%
Chuck Schumer 494 303 191 89 126 151 128 345 68 40 13 207 119 160 83 186 226 129 259 49 161 333 137 254 103 233 238
37% 46% 28% 26% 38% 39% 45% 38% 42% 24% 30% 48% 24% 41% 23% 33% 54% 25% 51% 55% 34% 38% 31% 40% 39% 41% 33%
Rex Tillerson 421 237 184 112 110 119 79 283 44 64 6 80 200 134 180 148 93 244 104 32 169 252 147 205 69 182 223
31% 36% 27% 33% 34% 31% 28% 31% 27% 39% 14% 19% 40% 35% 49% 27% 22% 47% 20% 35% 36% 29% 33% 32% 26% 32% 31%
John Bolton 410 235 175 95 95 129 91 259 55 61 16 67 185 151 179 152 79 257 77 35 172 238 149 186 75 188 204
31% 36% 26% 28% 29% 33% 32% 28% 34% 37% 35% 16% 37% 39% 49% 27% 19% 50% 15% 39% 37% 27% 34% 29% 29% 33% 29%
Robert Mueller 393 228 164 95 110 83 104 280 43 39 13 185 94 106 75 123 195 104 221 22 142 250 114 201 78 186 192
29% 35% 24% 28% 33% 22% 37% 31% 27% 24% 28% 43% 19% 27% 20% 22% 47% 20% 44% 24% 30% 29% 26% 32% 30% 33% 27%
Mike Pompeo 363 196 167 87 92 105 79 239 44 50 11 76 173 108 150 135 78 207 84 26 157 206 129 167 67 157 195
27% 30% 25% 25% 28% 27% 28% 26% 27% 31% 24% 18% 35% 28% 41% 24% 19% 40% 17% 28% 33% 24% 29% 26% 25% 28% 27%

Page 38
Fielding Period: March 27-29, 2018
HCAPS (Filtered on Registered Voters)
Weighted To The U.S. General Adult Population - Propensity
30 Mar 2018
Table 32
F1 Now we will show you some names. Please indicate if you have a favorable
or unfavorable view of that person - or if you've never heard of them.
Summary Of Very Unfavorable/Unfavorable
Base: All Respondents
Presidential
Election Candidate
Gender Age Ethnicity Political Party Political Ideology Voted For Education Locale Income
_____________ ______________________ _______________________ ____________________ ____________________ _____________________ _____________ ________________ _________
Colle- Some
Cons- ge Gr- Colle- $75K Less
Hisp- Black Repub- Democ- Indep- Libe- Mode- erva- 3rd ad And ge Or Urb- Subu- Or Than
Total Male Female 18-34 35-49 50-64 65+ White anic /AA Other lican rat endent ral rate tive Clinton Trump Party Higher Less an rban Rural More $75K
______ _____ _______ _____ _____ _____ ____ _____ _____ _____ _____ ______ ______ ______ ______ ______ ______ ________ ______ _____ ______ ______ ____ _____ _____ ____ ____
John Kelly 358 189 169 101 93 81 83 230 36 54 12 69 180 100 157 134 67 213 82 26 141 217 127 157 73 162 185
27% 29% 25% 29% 28% 21% 30% 25% 23% 33% 27% 16% 36% 26% 43% 24% 16% 41% 16% 29% 30% 25% 29% 25% 28% 29% 26%
Andrew McCabe 323 204 120 63 83 94 83 231 38 26 11 137 95 86 64 120 140 102 163 25 113 210 103 149 71 150 154
24% 31% 18% 18% 25% 24% 29% 25% 24% 16% 25% 32% 19% 22% 17% 21% 33% 20% 32% 28% 24% 24% 23% 23% 27% 27% 21%
Gina Haspel 210 119 91 72 57 40 42 132 33 27 2 56 96 52 90 77 43 107 63 12 95 115 87 86 37 100 99
16% 18% 13% 21% 17% 10% 15% 15% 20% 17% 4% 13% 19% 13% 25% 14% 10% 21% 13% 13% 20% 13% 20% 14% 14% 18% 14%
Sheryl Sandberg 203 120 83 54 55 57 38 136 30 20 6 56 78 64 52 87 64 91 65 19 82 121 72 87 44 95 98
15% 18% 12% 16% 17% 15% 13% 15% 19% 12% 14% 13% 16% 17% 14% 16% 15% 18% 13% 21% 17% 14% 16% 14% 17% 17% 14%
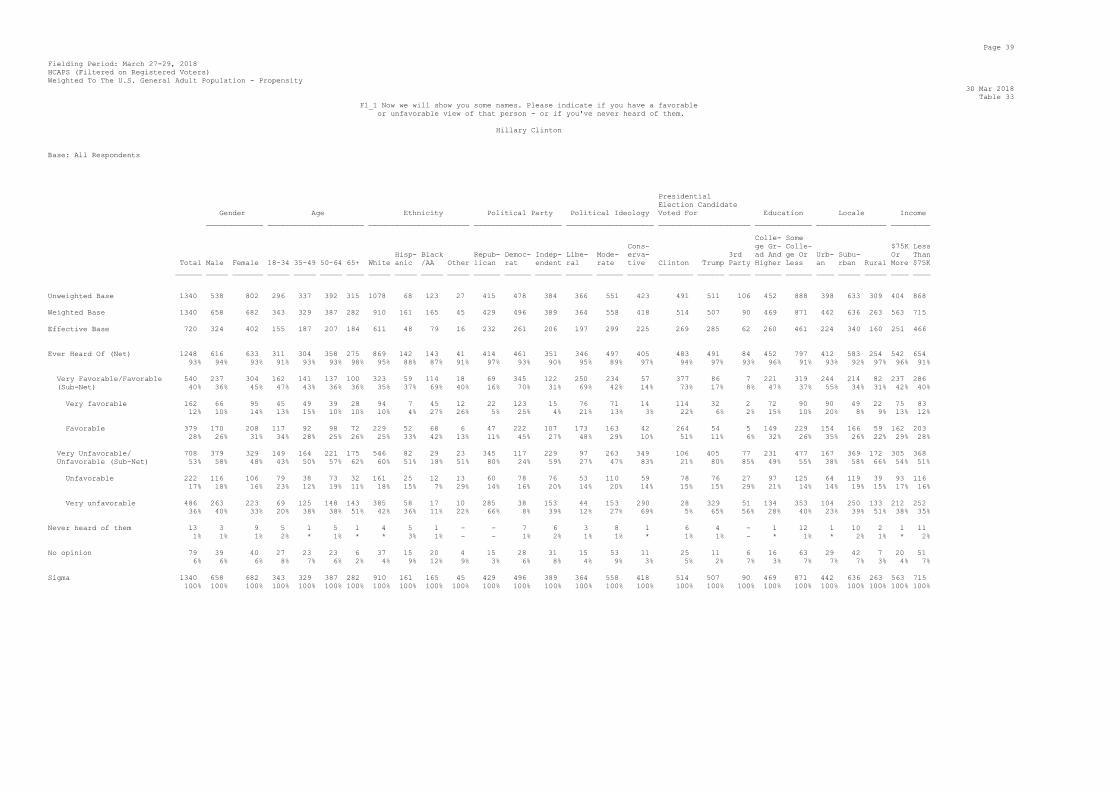
Page 39
Fielding Period: March 27-29, 2018
HCAPS (Filtered on Registered Voters)
Weighted To The U.S. General Adult Population - Propensity
30 Mar 2018
Table 33
F1_1 Now we will show you some names. Please indicate if you have a favorable
or unfavorable view of that person - or if you've never heard of them.
Hillary Clinton
Base: All Respondents
Presidential
Election Candidate
Gender Age Ethnicity Political Party Political Ideology Voted For Education Locale Income
_____________ ______________________ _______________________ ____________________ ____________________ _____________________ _____________ ________________ _________
Colle- Some
Cons- ge Gr- Colle- $75K Less
Hisp- Black Repub- Democ- Indep- Libe- Mode- erva- 3rd ad And ge Or Urb- Subu- Or Than
Total Male Female 18-34 35-49 50-64 65+ White anic /AA Other lican rat endent ral rate tive Clinton Trump Party Higher Less an rban Rural More $75K
______ _____ _______ _____ _____ _____ ____ _____ _____ _____ _____ ______ ______ ______ ______ ______ ______ ________ ______ _____ ______ ______ ____ _____ _____ ____ ____
Unweighted Base 1340 538 802 296 337 392 315 1078 68 123 27 415 478 384 366 551 423 491 511 106 452 888 398 633 309 404 868
Weighted Base 1340 658 682 343 329 387 282 910 161 165 45 429 496 389 364 558 418 514 507 90 469 871 442 636 263 563 715
Effective Base 720 324 402 155 187 207 184 611 48 79 16 232 261 206 197 299 225 269 285 62 260 461 224 340 160 251 466
Ever Heard Of (Net) 1248 616 633 311 304 358 275 869 142 143 41 414 461 351 346 497 405 483 491 84 452 797 412 583 254 542 654
93% 94% 93% 91% 93% 93% 98% 95% 88% 87% 91% 97% 93% 90% 95% 89% 97% 94% 97% 93% 96% 91% 93% 92% 97% 96% 91%
Very Favorable/Favorable 540 237 304 162 141 137 100 323 59 114 18 69 345 122 250 234 57 377 86 7 221 319 244 214 82 237 286
(Sub-Net) 40% 36% 45% 47% 43% 36% 36% 35% 37% 69% 40% 16% 70% 31% 69% 42% 14% 73% 17% 8% 47% 37% 55% 34% 31% 42% 40%
Very favorable 162 66 95 45 49 39 28 94 7 45 12 22 123 15 76 71 14 114 32 2 72 90 90 49 22 75 83
12% 10% 14% 13% 15% 10% 10% 10% 4% 27% 26% 5% 25% 4% 21% 13% 3% 22% 6% 2% 15% 10% 20% 8% 9% 13% 12%
Favorable 379 170 208 117 92 98 72 229 52 68 6 47 222 107 173 163 42 264 54 5 149 229 154 166 59 162 203
28% 26% 31% 34% 28% 25% 26% 25% 33% 42% 13% 11% 45% 27% 48% 29% 10% 51% 11% 6% 32% 26% 35% 26% 22% 29% 28%
Very Unfavorable/ 708 379 329 149 164 221 175 546 82 29 23 345 117 229 97 263 349 106 405 77 231 477 167 369 172 305 368
Unfavorable (Sub-Net) 53% 58% 48% 43% 50% 57% 62% 60% 51% 18% 51% 80% 24% 59% 27% 47% 83% 21% 80% 85% 49% 55% 38% 58% 66% 54% 51%
Unfavorable 222 116 106 79 38 73 32 161 25 12 13 60 78 76 53 110 59 78 76 27 97 125 64 119 39 93 116
17% 18% 16% 23% 12% 19% 11% 18% 15% 7% 29% 14% 16% 20% 14% 20% 14% 15% 15% 29% 21% 14% 14% 19% 15% 17% 16%
Very unfavorable 486 263 223 69 125 148 143 385 58 17 10 285 38 153 44 153 290 28 329 51 134 353 104 250 133 212 252
36% 40% 33% 20% 38% 38% 51% 42% 36% 11% 22% 66% 8% 39% 12% 27% 69% 5% 65% 56% 28% 40% 23% 39% 51% 38% 35%
Never heard of them 13 3 9 5 1 5 1 4 5 1 - - 7 6 3 8 1 6 4 - 1 12 1 10 2 1 11
1% 1% 1% 2% * 1% * * 3% 1% - - 1% 2% 1% 1% * 1% 1% - * 1% * 2% 1% * 2%
No opinion 79 39 40 27 23 23 6 37 15 20 4 15 28 31 15 53 11 25 11 6 16 63 29 42 7 20 51
6% 6% 6% 8% 7% 6% 2% 4% 9% 12% 9% 3% 6% 8% 4% 9% 3% 5% 2% 7% 3% 7% 7% 7% 3% 4% 7%
Sigma 1340 658 682 343 329 387 282 910 161 165 45 429 496 389 364 558 418 514 507 90 469 871 442 636 263 563 715
100% 100% 100% 100% 100% 100% 100% 100% 100% 100% 100% 100% 100% 100% 100% 100% 100% 100% 100% 100% 100% 100% 100% 100% 100% 100% 100%

Page 40
Fielding Period: March 27-29, 2018
HCAPS (Filtered on Registered Voters)
Weighted To The U.S. General Adult Population - Propensity
30 Mar 2018
Table 34
F1_2 Now we will show you some names. Please indicate if you have a favorable
or unfavorable view of that person - or if you've never heard of them.
Donald Trump
Base: All Respondents
Presidential
Election Candidate
Gender Age Ethnicity Political Party Political Ideology Voted For Education Locale Income
_____________ ______________________ _______________________ ____________________ ____________________ _____________________ _____________ ________________ _________
Colle- Some
Cons- ge Gr- Colle- $75K Less
Hisp- Black Repub- Democ- Indep- Libe- Mode- erva- 3rd ad And ge Or Urb- Subu- Or Than
Total Male Female 18-34 35-49 50-64 65+ White anic /AA Other lican rat endent ral rate tive Clinton Trump Party Higher Less an rban Rural More $75K
______ _____ _______ _____ _____ _____ ____ _____ _____ _____ _____ ______ ______ ______ ______ ______ ______ ________ ______ _____ ______ ______ ____ _____ _____ ____ ____
Unweighted Base 1340 538 802 296 337 392 315 1078 68 123 27 415 478 384 366 551 423 491 511 106 452 888 398 633 309 404 868
Weighted Base 1340 658 682 343 329 387 282 910 161 165 45 429 496 389 364 558 418 514 507 90 469 871 442 636 263 563 715
Effective Base 720 324 402 155 187 207 184 611 48 79 16 232 261 206 197 299 225 269 285 62 260 461 224 340 160 251 466
Ever Heard Of (Net) 1281 641 640 329 312 363 277 885 149 148 44 419 469 370 359 515 407 491 495 86 459 822 428 600 253 552 674
96% 97% 94% 96% 95% 94% 98% 97% 92% 90% 99% 98% 95% 95% 99% 92% 97% 96% 98% 95% 98% 94% 97% 94% 96% 98% 94%
Very Favorable/Favorable 520 310 211 112 125 155 128 446 37 14 10 341 58 116 53 161 306 28 419 17 191 329 168 226 127 258 239
(Sub-Net) 39% 47% 31% 33% 38% 40% 45% 49% 23% 8% 23% 79% 12% 30% 15% 29% 73% 6% 83% 19% 41% 38% 38% 36% 48% 46% 33%
Very favorable 274 170 104 64 56 75 79 241 20 5 3 204 18 50 25 74 175 6 243 3 101 173 95 110 70 144 118
20% 26% 15% 19% 17% 20% 28% 27% 13% 3% 8% 48% 4% 13% 7% 13% 42% 1% 48% 4% 22% 20% 21% 17% 27% 26% 16%
Favorable 246 139 107 48 69 80 49 205 17 9 7 137 40 66 29 86 131 22 176 14 90 156 73 116 57 114 121
18% 21% 16% 14% 21% 21% 17% 23% 11% 5% 15% 32% 8% 17% 8% 15% 31% 4% 35% 15% 19% 18% 16% 18% 22% 20% 17%
Very Unfavorable/ 761 331 430 217 187 208 150 438 111 135 34 79 411 253 306 354 101 463 75 68 267 493 260 374 127 294 435
Unfavorable (Sub-Net) 57% 50% 63% 63% 57% 54% 53% 48% 69% 82% 76% 18% 83% 65% 84% 63% 24% 90% 15% 76% 57% 57% 59% 59% 48% 52% 61%
Unfavorable 162 76 86 46 41 38 38 108 18 16 10 43 57 59 31 96 35 57 56 19 63 99 49 92 21 64 88
12% 12% 13% 13% 12% 10% 14% 12% 11% 10% 22% 10% 11% 15% 9% 17% 8% 11% 11% 21% 14% 11% 11% 14% 8% 11% 12%
Very unfavorable 598 255 343 171 147 169 111 330 94 118 24 36 355 195 275 258 66 406 20 49 204 394 211 282 105 231 347
45% 39% 50% 50% 45% 44% 39% 36% 58% 72% 54% 8% 72% 50% 75% 46% 16% 79% 4% 55% 43% 45% 48% 44% 40% 41% 48%
Never heard of them 11 1 9 3 2 6 - 1 6 1 - 2 7 2 - 9 2 8 2 - 2 9 3 5 2 4 5
1% * 1% 1% * 2% - * 4% 1% - * 1% 1% - 2% * 1% * - * 1% 1% 1% 1% 1% 1%
No opinion 48 16 33 11 15 18 5 24 6 15 1 8 20 17 5 34 9 15 11 5 9 39 10 31 7 7 36
4% 2% 5% 3% 5% 5% 2% 3% 4% 9% 1% 2% 4% 4% 1% 6% 2% 3% 2% 5% 2% 5% 2% 5% 3% 1% 5%
Sigma 1340 658 682 343 329 387 282 910 161 165 45 429 496 389 364 558 418 514 507 90 469 871 442 636 263 563 715
100% 100% 100% 100% 100% 100% 100% 100% 100% 100% 100% 100% 100% 100% 100% 100% 100% 100% 100% 100% 100% 100% 100% 100% 100% 100% 100%
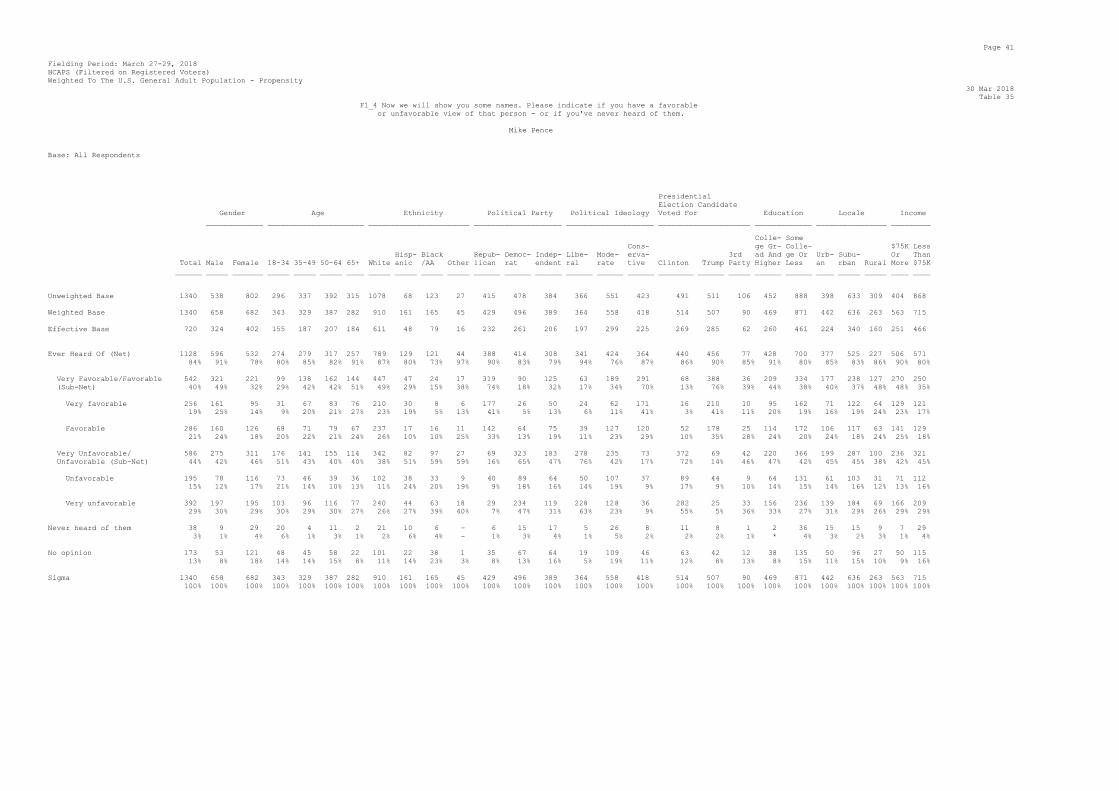
Page 41
Fielding Period: March 27-29, 2018
HCAPS (Filtered on Registered Voters)
Weighted To The U.S. General Adult Population - Propensity
30 Mar 2018
Table 35
F1_4 Now we will show you some names. Please indicate if you have a favorable
or unfavorable view of that person - or if you've never heard of them.
Mike Pence
Base: All Respondents
Presidential
Election Candidate
Gender Age Ethnicity Political Party Political Ideology Voted For Education Locale Income
_____________ ______________________ _______________________ ____________________ ____________________ _____________________ _____________ ________________ _________
Colle- Some
Cons- ge Gr- Colle- $75K Less
Hisp- Black Repub- Democ- Indep- Libe- Mode- erva- 3rd ad And ge Or Urb- Subu- Or Than
Total Male Female 18-34 35-49 50-64 65+ White anic /AA Other lican rat endent ral rate tive Clinton Trump Party Higher Less an rban Rural More $75K
______ _____ _______ _____ _____ _____ ____ _____ _____ _____ _____ ______ ______ ______ ______ ______ ______ ________ ______ _____ ______ ______ ____ _____ _____ ____ ____
Unweighted Base 1340 538 802 296 337 392 315 1078 68 123 27 415 478 384 366 551 423 491 511 106 452 888 398 633 309 404 868
Weighted Base 1340 658 682 343 329 387 282 910 161 165 45 429 496 389 364 558 418 514 507 90 469 871 442 636 263 563 715
Effective Base 720 324 402 155 187 207 184 611 48 79 16 232 261 206 197 299 225 269 285 62 260 461 224 340 160 251 466
Ever Heard Of (Net) 1128 596 532 274 279 317 257 789 129 121 44 388 414 308 341 424 364 440 456 77 428 700 377 525 227 506 571
84% 91% 78% 80% 85% 82% 91% 87% 80% 73% 97% 90% 83% 79% 94% 76% 87% 86% 90% 85% 91% 80% 85% 83% 86% 90% 80%
Very Favorable/Favorable 542 321 221 99 138 162 144 447 47 24 17 319 90 125 63 189 291 68 388 36 209 334 177 238 127 270 250
(Sub-Net) 40% 49% 32% 29% 42% 42% 51% 49% 29% 15% 38% 74% 18% 32% 17% 34% 70% 13% 76% 39% 44% 38% 40% 37% 48% 48% 35%
Very favorable 256 161 95 31 67 83 76 210 30 8 6 177 26 50 24 62 171 16 210 10 95 162 71 122 64 129 121
19% 25% 14% 9% 20% 21% 27% 23% 19% 5% 13% 41% 5% 13% 6% 11% 41% 3% 41% 11% 20% 19% 16% 19% 24% 23% 17%
Favorable 286 160 126 68 71 79 67 237 17 16 11 142 64 75 39 127 120 52 178 25 114 172 106 117 63 141 129
21% 24% 18% 20% 22% 21% 24% 26% 10% 10% 25% 33% 13% 19% 11% 23% 29% 10% 35% 28% 24% 20% 24% 18% 24% 25% 18%
Very Unfavorable/ 586 275 311 176 141 155 114 342 82 97 27 69 323 183 278 235 73 372 69 42 220 366 199 287 100 236 321
Unfavorable (Sub-Net) 44% 42% 46% 51% 43% 40% 40% 38% 51% 59% 59% 16% 65% 47% 76% 42% 17% 72% 14% 46% 47% 42% 45% 45% 38% 42% 45%
Unfavorable 195 78 116 73 46 39 36 102 38 33 9 40 89 64 50 107 37 89 44 9 64 131 61 103 31 71 112
15% 12% 17% 21% 14% 10% 13% 11% 24% 20% 19% 9% 18% 16% 14% 19% 9% 17% 9% 10% 14% 15% 14% 16% 12% 13% 16%
Very unfavorable 392 197 195 103 96 116 77 240 44 63 18 29 234 119 228 128 36 282 25 33 156 236 139 184 69 166 209
29% 30% 29% 30% 29% 30% 27% 26% 27% 39% 40% 7% 47% 31% 63% 23% 9% 55% 5% 36% 33% 27% 31% 29% 26% 29% 29%
Never heard of them 38 9 29 20 4 11 2 21 10 6 - 6 15 17 5 26 8 11 8 1 2 36 15 15 9 7 29
3% 1% 4% 6% 1% 3% 1% 2% 6% 4% - 1% 3% 4% 1% 5% 2% 2% 2% 1% * 4% 3% 2% 3% 1% 4%
No opinion 173 53 121 48 45 58 22 101 22 38 1 35 67 64 19 109 46 63 42 12 38 135 50 96 27 50 115
13% 8% 18% 14% 14% 15% 8% 11% 14% 23% 3% 8% 13% 16% 5% 19% 11% 12% 8% 13% 8% 15% 11% 15% 10% 9% 16%
Sigma 1340 658 682 343 329 387 282 910 161 165 45 429 496 389 364 558 418 514 507 90 469 871 442 636 263 563 715
100% 100% 100% 100% 100% 100% 100% 100% 100% 100% 100% 100% 100% 100% 100% 100% 100% 100% 100% 100% 100% 100% 100% 100% 100% 100% 100%

Page 42
Fielding Period: March 27-29, 2018
HCAPS (Filtered on Registered Voters)
Weighted To The U.S. General Adult Population - Propensity
30 Mar 2018
Table 36
F1_8 Now we will show you some names. Please indicate if you have a favorable
or unfavorable view of that person - or if you've never heard of them.
Paul Ryan
Base: All Respondents
Presidential
Election Candidate
Gender Age Ethnicity Political Party Political Ideology Voted For Education Locale Income
_____________ ______________________ _______________________ ____________________ ____________________ _____________________ _____________ ________________ _________
Colle- Some
Cons- ge Gr- Colle- $75K Less
Hisp- Black Repub- Democ- Indep- Libe- Mode- erva- 3rd ad And ge Or Urb- Subu- Or Than
Total Male Female 18-34 35-49 50-64 65+ White anic /AA Other lican rat endent ral rate tive Clinton Trump Party Higher Less an rban Rural More $75K
______ _____ _______ _____ _____ _____ ____ _____ _____ _____ _____ ______ ______ ______ ______ ______ ______ ________ ______ _____ ______ ______ ____ _____ _____ ____ ____
Unweighted Base 1340 538 802 296 337 392 315 1078 68 123 27 415 478 384 366 551 423 491 511 106 452 888 398 633 309 404 868
Weighted Base 1340 658 682 343 329 387 282 910 161 165 45 429 496 389 364 558 418 514 507 90 469 871 442 636 263 563 715
Effective Base 720 324 402 155 187 207 184 611 48 79 16 232 261 206 197 299 225 269 285 62 260 461 224 340 160 251 466
Ever Heard Of (Net) 1077 569 508 251 260 306 260 758 119 116 39 345 397 319 324 420 333 440 424 76 418 659 353 518 206 484 548
80% 86% 74% 73% 79% 79% 92% 83% 74% 71% 88% 81% 80% 82% 89% 75% 80% 86% 84% 84% 89% 76% 80% 81% 79% 86% 77%
Very Favorable/Favorable 413 232 180 89 101 113 109 343 30 23 10 229 88 91 65 155 193 89 259 29 178 235 158 167 88 216 185
(Sub-Net) 31% 35% 26% 26% 31% 29% 39% 38% 18% 14% 22% 53% 18% 23% 18% 28% 46% 17% 51% 32% 38% 27% 36% 26% 34% 38% 26%
Very favorable 87 52 35 29 27 17 14 73 10 2 * 57 13 17 18 28 41 9 67 2 45 42 48 29 11 52 31
7% 8% 5% 8% 8% 4% 5% 8% 6% 1% 1% 13% 3% 4% 5% 5% 10% 2% 13% 2% 10% 5% 11% 5% 4% 9% 4%
Favorable 326 180 145 60 74 96 95 270 19 20 9 172 75 74 47 127 152 80 192 27 132 193 110 138 78 164 154
24% 27% 21% 18% 22% 25% 34% 30% 12% 12% 21% 40% 15% 19% 13% 23% 36% 16% 38% 30% 28% 22% 25% 22% 30% 29% 21%
Very Unfavorable/ 664 337 327 161 159 193 151 415 90 94 30 117 309 228 259 265 140 350 165 48 240 424 195 351 118 268 363
Unfavorable (Sub-Net) 50% 51% 48% 47% 48% 50% 53% 46% 56% 57% 66% 27% 62% 59% 71% 47% 34% 68% 33% 53% 51% 49% 44% 55% 45% 48% 51%
Unfavorable 286 148 138 76 66 82 62 176 57 24 15 81 100 101 56 137 93 96 113 17 102 184 63 180 42 114 153
21% 22% 20% 22% 20% 21% 22% 19% 35% 15% 33% 19% 20% 26% 15% 25% 22% 19% 22% 19% 22% 21% 14% 28% 16% 20% 21%
Very unfavorable 378 189 189 86 93 111 89 239 33 69 15 36 209 127 203 128 48 255 52 31 138 240 132 171 76 155 211
28% 29% 28% 25% 28% 29% 31% 26% 20% 42% 34% 8% 42% 33% 56% 23% 11% 50% 10% 34% 29% 28% 30% 27% 29% 27% 29%
Never heard of them 68 28 41 36 13 16 4 40 16 8 - 22 36 8 16 26 26 20 15 4 14 54 23 32 14 15 48
5% 4% 6% 10% 4% 4% 1% 4% 10% 5% - 5% 7% 2% 4% 5% 6% 4% 3% 4% 3% 6% 5% 5% 5% 3% 7%
No opinion 195 61 134 56 56 64 18 111 26 40 5 62 63 61 24 112 59 54 67 11 37 158 66 86 42 63 120
15% 9% 20% 16% 17% 17% 6% 12% 16% 24% 12% 14% 13% 16% 7% 20% 14% 10% 13% 12% 8% 18% 15% 14% 16% 11% 17%
Sigma 1340 658 682 343 329 387 282 910 161 165 45 429 496 389 364 558 418 514 507 90 469 871 442 636 263 563 715
100% 100% 100% 100% 100% 100% 100% 100% 100% 100% 100% 100% 100% 100% 100% 100% 100% 100% 100% 100% 100% 100% 100% 100% 100% 100% 100%

Page 43
Fielding Period: March 27-29, 2018
HCAPS (Filtered on Registered Voters)
Weighted To The U.S. General Adult Population - Propensity
30 Mar 2018
Table 37
F1_9 Now we will show you some names. Please indicate if you have a favorable
or unfavorable view of that person - or if you've never heard of them.
Nancy Pelosi
Base: All Respondents
Presidential
Election Candidate
Gender Age Ethnicity Political Party Political Ideology Voted For Education Locale Income
_____________ ______________________ _______________________ ____________________ ____________________ _____________________ _____________ ________________ _________
Colle- Some
Cons- ge Gr- Colle- $75K Less
Hisp- Black Repub- Democ- Indep- Libe- Mode- erva- 3rd ad And ge Or Urb- Subu- Or Than
Total Male Female 18-34 35-49 50-64 65+ White anic /AA Other lican rat endent ral rate tive Clinton Trump Party Higher Less an rban Rural More $75K
______ _____ _______ _____ _____ _____ ____ _____ _____ _____ _____ ______ ______ ______ ______ ______ ______ ________ ______ _____ ______ ______ ____ _____ _____ ____ ____
Unweighted Base 1340 538 802 296 337 392 315 1078 68 123 27 415 478 384 366 551 423 491 511 106 452 888 398 633 309 404 868
Weighted Base 1340 658 682 343 329 387 282 910 161 165 45 429 496 389 364 558 418 514 507 90 469 871 442 636 263 563 715
Effective Base 720 324 402 155 187 207 184 611 48 79 16 232 261 206 197 299 225 269 285 62 260 461 224 340 160 251 466
Ever Heard Of (Net) 1072 588 484 230 269 323 250 765 116 119 34 370 367 321 300 406 366 425 442 78 423 650 345 518 209 492 537
80% 89% 71% 67% 82% 84% 89% 84% 72% 72% 75% 86% 74% 83% 82% 73% 88% 83% 87% 86% 90% 75% 78% 82% 80% 87% 75%
Very Favorable/Favorable 405 214 191 107 106 114 78 269 34 83 8 70 247 85 212 160 33 278 79 10 180 225 175 178 51 179 211
(Sub-Net) 30% 32% 28% 31% 32% 29% 28% 30% 21% 50% 19% 16% 50% 22% 58% 29% 8% 54% 16% 11% 38% 26% 40% 28% 19% 32% 29%
Very favorable 102 57 45 25 34 22 21 66 7 24 3 21 65 15 62 31 9 62 33 3 51 51 52 41 9 48 52
8% 9% 7% 7% 10% 6% 8% 7% 4% 14% 7% 5% 13% 4% 17% 6% 2% 12% 6% 4% 11% 6% 12% 6% 3% 8% 7%
Favorable 303 157 146 82 72 92 57 203 27 59 5 49 181 70 151 128 24 216 46 6 129 174 123 137 42 132 159
23% 24% 21% 24% 22% 24% 20% 22% 17% 36% 12% 11% 37% 18% 41% 23% 6% 42% 9% 7% 28% 20% 28% 22% 16% 23% 22%
Very Unfavorable/ 668 375 293 123 164 209 171 496 82 36 25 300 120 236 88 246 333 147 364 68 243 425 170 340 158 313 326
Unfavorable (Sub-Net) 50% 57% 43% 36% 50% 54% 61% 55% 51% 22% 56% 70% 24% 61% 24% 44% 80% 29% 72% 76% 52% 49% 38% 53% 60% 56% 46%
Unfavorable 237 127 110 67 55 70 44 157 32 16 17 48 74 110 65 109 63 111 62 25 108 129 75 106 56 109 124
18% 19% 16% 20% 17% 18% 16% 17% 20% 10% 38% 11% 15% 28% 18% 19% 15% 22% 12% 27% 23% 15% 17% 17% 21% 19% 17%
Very unfavorable 431 248 183 56 109 139 127 339 50 20 8 253 47 125 22 138 271 36 301 44 135 296 95 234 102 204 202
32% 38% 27% 16% 33% 36% 45% 37% 31% 12% 18% 59% 9% 32% 6% 25% 65% 7% 59% 48% 29% 34% 21% 37% 39% 36% 28%
Never heard of them 61 12 49 37 4 12 7 28 13 10 - 12 31 16 13 40 8 15 16 6 3 58 21 29 11 18 40
5% 2% 7% 11% 1% 3% 2% 3% 8% 6% - 3% 6% 4% 4% 7% 2% 3% 3% 7% 1% 7% 5% 4% 4% 3% 6%
No opinion 207 58 149 75 55 51 26 117 31 36 11 47 98 51 51 111 44 75 48 6 43 164 75 89 43 53 138
15% 9% 22% 22% 17% 13% 9% 13% 20% 22% 25% 11% 20% 13% 14% 20% 11% 15% 9% 7% 9% 19% 17% 14% 16% 9% 19%
Sigma 1340 658 682 343 329 387 282 910 161 165 45 429 496 389 364 558 418 514 507 90 469 871 442 636 263 563 715
100% 100% 100% 100% 100% 100% 100% 100% 100% 100% 100% 100% 100% 100% 100% 100% 100% 100% 100% 100% 100% 100% 100% 100% 100% 100% 100%

Page 44
Fielding Period: March 27-29, 2018
HCAPS (Filtered on Registered Voters)
Weighted To The U.S. General Adult Population - Propensity
30 Mar 2018
Table 38
F1_10 Now we will show you some names. Please indicate if you have a favorable
or unfavorable view of that person - or if you've never heard of them.
Mitch McConnell
Base: All Respondents
Presidential
Election Candidate
Gender Age Ethnicity Political Party Political Ideology Voted For Education Locale Income
_____________ ______________________ _______________________ ____________________ ____________________ _____________________ _____________ ________________ _________
Colle- Some
Cons- ge Gr- Colle- $75K Less
Hisp- Black Repub- Democ- Indep- Libe- Mode- erva- 3rd ad And ge Or Urb- Subu- Or Than
Total Male Female 18-34 35-49 50-64 65+ White anic /AA Other lican rat endent ral rate tive Clinton Trump Party Higher Less an rban Rural More $75K
______ _____ _______ _____ _____ _____ ____ _____ _____ _____ _____ ______ ______ ______ ______ ______ ______ ________ ______ _____ ______ ______ ____ _____ _____ ____ ____
Unweighted Base 1340 538 802 296 337 392 315 1078 68 123 27 415 478 384 366 551 423 491 511 106 452 888 398 633 309 404 868
Weighted Base 1340 658 682 343 329 387 282 910 161 165 45 429 496 389 364 558 418 514 507 90 469 871 442 636 263 563 715
Effective Base 720 324 402 155 187 207 184 611 48 79 16 232 261 206 197 299 225 269 285 62 260 461 224 340 160 251 466
Ever Heard Of (Net) 930 522 407 215 227 258 231 652 96 102 34 292 345 280 297 345 288 400 373 59 389 541 332 429 169 439 456
69% 79% 60% 63% 69% 67% 82% 72% 60% 62% 76% 68% 70% 72% 82% 62% 69% 78% 74% 65% 83% 62% 75% 67% 64% 78% 64%
Very Favorable/Favorable 284 177 107 85 69 54 75 232 19 14 7 165 64 54 54 99 131 55 190 16 146 138 141 94 49 160 118
(Sub-Net) 21% 27% 16% 25% 21% 14% 27% 26% 12% 8% 15% 39% 13% 14% 15% 18% 31% 11% 37% 18% 31% 16% 32% 15% 19% 28% 16%
Very favorable 52 37 16 22 12 5 13 42 2 4 - 36 10 6 20 12 21 5 40 1 36 16 32 16 4 33 18
4% 6% 2% 7% 4% 1% 5% 5% 1% 2% - 8% 2% 2% 5% 2% 5% 1% 8% 1% 8% 2% 7% 2% 2% 6% 2%
Favorable 231 140 91 63 57 49 62 191 17 10 7 129 54 48 34 88 110 49 149 15 110 122 108 78 45 127 100
17% 21% 13% 18% 17% 13% 22% 21% 11% 6% 15% 30% 11% 12% 9% 16% 26% 10% 29% 16% 23% 14% 24% 12% 17% 23% 14%
Very Unfavorable/ 646 345 301 129 157 204 156 419 77 88 27 127 281 227 243 246 157 346 183 43 242 404 191 335 120 279 339
Unfavorable (Sub-Net) 48% 53% 44% 38% 48% 53% 55% 46% 48% 54% 60% 30% 57% 58% 67% 44% 38% 67% 36% 48% 52% 46% 43% 53% 46% 50% 47%
Unfavorable 299 155 144 63 70 96 70 195 48 31 13 84 99 111 56 144 99 117 124 15 110 189 91 164 44 133 152
22% 24% 21% 18% 21% 25% 25% 21% 30% 19% 30% 20% 20% 29% 15% 26% 24% 23% 25% 16% 23% 22% 21% 26% 17% 24% 21%
Very unfavorable 347 190 157 67 87 108 86 224 29 57 14 43 182 115 187 102 59 229 59 28 133 214 100 171 76 146 186
26% 29% 23% 19% 26% 28% 30% 25% 18% 35% 30% 10% 37% 30% 51% 18% 14% 45% 12% 31% 28% 25% 23% 27% 29% 26% 26%
Never heard of them 129 29 100 51 29 39 11 79 36 7 1 34 49 40 26 61 42 31 40 16 24 105 29 66 34 38 86
10% 4% 15% 15% 9% 10% 4% 9% 22% 4% 2% 8% 10% 10% 7% 11% 10% 6% 8% 17% 5% 12% 7% 10% 13% 7% 12%
No opinion 281 107 175 77 73 90 41 179 29 56 10 102 102 69 41 152 88 82 93 16 56 225 81 140 60 86 173
21% 16% 26% 22% 22% 23% 14% 20% 18% 34% 22% 24% 20% 18% 11% 27% 21% 16% 18% 18% 12% 26% 18% 22% 23% 15% 24%
Sigma 1340 658 682 343 329 387 282 910 161 165 45 429 496 389 364 558 418 514 507 90 469 871 442 636 263 563 715
100% 100% 100% 100% 100% 100% 100% 100% 100% 100% 100% 100% 100% 100% 100% 100% 100% 100% 100% 100% 100% 100% 100% 100% 100% 100% 100%

Page 45
Fielding Period: March 27-29, 2018
HCAPS (Filtered on Registered Voters)
Weighted To The U.S. General Adult Population - Propensity
30 Mar 2018
Table 39
F1_11 Now we will show you some names. Please indicate if you have a favorable
or unfavorable view of that person - or if you've never heard of them.
Chuck Schumer
Base: All Respondents
Presidential
Election Candidate
Gender Age Ethnicity Political Party Political Ideology Voted For Education Locale Income
_____________ ______________________ _______________________ ____________________ ____________________ _____________________ _____________ ________________ _________
Colle- Some
Cons- ge Gr- Colle- $75K Less
Hisp- Black Repub- Democ- Indep- Libe- Mode- erva- 3rd ad And ge Or Urb- Subu- Or Than
Total Male Female 18-34 35-49 50-64 65+ White anic /AA Other lican rat endent ral rate tive Clinton Trump Party Higher Less an rban Rural More $75K
______ _____ _______ _____ _____ _____ ____ _____ _____ _____ _____ ______ ______ ______ ______ ______ ______ ________ ______ _____ ______ ______ ____ _____ _____ ____ ____
Unweighted Base 1340 538 802 296 337 392 315 1078 68 123 27 415 478 384 366 551 423 491 511 106 452 888 398 633 309 404 868
Weighted Base 1340 658 682 343 329 387 282 910 161 165 45 429 496 389 364 558 418 514 507 90 469 871 442 636 263 563 715
Effective Base 720 324 402 155 187 207 184 611 48 79 16 232 261 206 197 299 225 269 285 62 260 461 224 340 160 251 466
Ever Heard Of (Net) 859 498 361 186 212 251 210 607 91 90 32 292 307 247 267 314 277 356 360 62 354 504 313 406 140 420 402
64% 76% 53% 54% 65% 65% 74% 67% 57% 54% 71% 68% 62% 64% 73% 56% 66% 69% 71% 68% 76% 58% 71% 64% 53% 75% 56%
Very Favorable/Favorable 365 195 170 96 87 99 82 262 23 50 19 86 188 87 185 128 52 227 102 12 194 171 176 152 37 187 164
(Sub-Net) 27% 30% 25% 28% 26% 26% 29% 29% 14% 30% 41% 20% 38% 22% 51% 23% 12% 44% 20% 14% 41% 20% 40% 24% 14% 33% 23%
Very favorable 97 57 39 21 24 28 23 60 6 23 5 18 59 20 61 28 8 69 23 * 49 48 48 42 7 54 38
7% 9% 6% 6% 7% 7% 8% 7% 4% 14% 11% 4% 12% 5% 17% 5% 2% 14% 4% * 10% 6% 11% 7% 3% 10% 5%
Favorable 268 137 131 75 63 71 59 201 17 27 14 68 129 67 124 101 44 158 79 12 145 123 128 110 30 133 126
20% 21% 19% 22% 19% 18% 21% 22% 10% 16% 30% 16% 26% 17% 34% 18% 10% 31% 16% 13% 31% 14% 29% 17% 12% 24% 18%
Very Unfavorable/ 494 303 191 89 126 151 128 345 68 40 13 207 119 160 83 186 226 129 259 49 161 333 137 254 103 233 238
Unfavorable (Sub-Net) 37% 46% 28% 26% 38% 39% 45% 38% 42% 24% 30% 48% 24% 41% 23% 33% 54% 25% 51% 55% 34% 38% 31% 40% 39% 41% 33%
Unfavorable 211 122 89 51 54 63 43 141 39 19 5 58 71 78 57 97 57 84 77 20 76 135 72 102 37 95 111
16% 19% 13% 15% 16% 16% 15% 16% 24% 12% 11% 14% 14% 20% 16% 17% 14% 16% 15% 22% 16% 16% 16% 16% 14% 17% 15%
Very unfavorable 283 181 102 38 72 88 85 204 30 21 8 148 48 82 26 89 168 45 182 30 85 198 65 152 66 138 127
21% 28% 15% 11% 22% 23% 30% 22% 18% 13% 19% 35% 10% 21% 7% 16% 40% 9% 36% 33% 18% 23% 15% 24% 25% 25% 18%
Never heard of them 173 39 133 78 35 34 26 103 34 25 4 37 80 50 50 72 51 61 39 14 39 134 50 79 43 43 121
13% 6% 20% 23% 11% 9% 9% 11% 21% 15% 8% 9% 16% 13% 14% 13% 12% 12% 8% 16% 8% 15% 11% 12% 16% 8% 17%
No opinion 308 120 188 79 81 102 46 200 36 50 9 99 109 91 48 171 90 97 107 14 76 233 78 150 80 99 192
23% 18% 28% 23% 25% 26% 16% 22% 22% 30% 21% 23% 22% 23% 13% 31% 21% 19% 21% 16% 16% 27% 18% 24% 30% 18% 27%
Sigma 1340 658 682 343 329 387 282 910 161 165 45 429 496 389 364 558 418 514 507 90 469 871 442 636 263 563 715
100% 100% 100% 100% 100% 100% 100% 100% 100% 100% 100% 100% 100% 100% 100% 100% 100% 100% 100% 100% 100% 100% 100% 100% 100% 100% 100%

Page 46
Fielding Period: March 27-29, 2018
HCAPS (Filtered on Registered Voters)
Weighted To The U.S. General Adult Population - Propensity
30 Mar 2018
Table 40
F1_21 Now we will show you some names. Please indicate if you have a favorable
or unfavorable view of that person - or if you've never heard of them.
Jeff Sessions
Base: All Respondents
Presidential
Election Candidate
Gender Age Ethnicity Political Party Political Ideology Voted For Education Locale Income
_____________ ______________________ _______________________ ____________________ ____________________ _____________________ _____________ ________________ _________
Colle- Some
Cons- ge Gr- Colle- $75K Less
Hisp- Black Repub- Democ- Indep- Libe- Mode- erva- 3rd ad And ge Or Urb- Subu- Or Than
Total Male Female 18-34 35-49 50-64 65+ White anic /AA Other lican rat endent ral rate tive Clinton Trump Party Higher Less an rban Rural More $75K
______ _____ _______ _____ _____ _____ ____ _____ _____ _____ _____ ______ ______ ______ ______ ______ ______ ________ ______ _____ ______ ______ ____ _____ _____ ____ ____
Unweighted Base 1340 538 802 296 337 392 315 1078 68 123 27 415 478 384 366 551 423 491 511 106 452 888 398 633 309 404 868
Weighted Base 1340 658 682 343 329 387 282 910 161 165 45 429 496 389 364 558 418 514 507 90 469 871 442 636 263 563 715
Effective Base 720 324 402 155 187 207 184 611 48 79 16 232 261 206 197 299 225 269 285 62 260 461 224 340 160 251 466
Ever Heard Of (Net) 925 518 407 222 223 265 215 638 88 113 40 283 355 273 309 343 273 408 355 66 376 549 333 417 175 439 448
69% 79% 60% 65% 68% 69% 76% 70% 54% 68% 89% 66% 72% 70% 85% 62% 65% 79% 70% 73% 80% 63% 75% 66% 67% 78% 63%
Very Favorable/Favorable 306 196 110 71 74 74 87 242 20 17 9 167 66 69 54 106 146 63 211 12 148 159 123 131 53 175 120
(Sub-Net) 23% 30% 16% 21% 23% 19% 31% 27% 12% 10% 19% 39% 13% 18% 15% 19% 35% 12% 42% 14% 31% 18% 28% 21% 20% 31% 17%
Very favorable 63 42 21 22 20 5 16 48 6 7 1 40 13 9 19 14 30 9 52 1 41 22 39 21 3 44 17
5% 6% 3% 6% 6% 1% 6% 5% 4% 4% 2% 9% 3% 2% 5% 3% 7% 2% 10% 1% 9% 3% 9% 3% 1% 8% 2%
Favorable 243 154 89 49 54 69 71 194 14 10 8 127 53 60 35 92 116 54 159 12 107 136 84 109 50 131 103
18% 23% 13% 14% 17% 18% 25% 21% 9% 6% 17% 30% 11% 15% 10% 17% 28% 11% 31% 13% 23% 16% 19% 17% 19% 23% 14%
Very Unfavorable/ 619 322 297 151 149 191 128 396 68 96 31 116 289 204 255 237 127 345 144 54 229 390 210 286 122 264 329
Unfavorable (Sub-Net) 46% 49% 43% 44% 45% 49% 45% 44% 42% 58% 70% 27% 58% 52% 70% 42% 30% 67% 28% 59% 49% 45% 48% 45% 47% 47% 46%
Unfavorable 255 133 121 70 56 81 47 177 32 25 15 81 85 85 60 110 85 91 110 22 101 153 84 125 45 115 129
19% 20% 18% 20% 17% 21% 17% 19% 20% 15% 34% 19% 17% 22% 16% 20% 20% 18% 22% 25% 22% 18% 19% 20% 17% 21% 18%
Very unfavorable 364 189 175 81 92 110 81 219 36 71 16 36 204 119 195 127 42 254 34 31 128 237 126 161 77 149 200
27% 29% 26% 24% 28% 29% 29% 24% 22% 43% 36% 8% 41% 31% 53% 23% 10% 49% 7% 35% 27% 27% 28% 25% 29% 26% 28%
Never heard of them 106 20 87 50 22 19 15 61 31 8 - 28 49 24 20 48 38 28 30 2 19 88 34 48 25 26 75
8% 3% 13% 15% 7% 5% 5% 7% 19% 5% - 6% 10% 6% 6% 9% 9% 6% 6% 3% 4% 10% 8% 8% 9% 5% 10%
No opinion 308 120 189 71 83 102 52 211 43 44 5 118 91 92 35 167 106 78 122 22 74 235 75 171 63 98 192
23% 18% 28% 21% 25% 26% 18% 23% 26% 27% 11% 27% 18% 24% 10% 30% 25% 15% 24% 24% 16% 27% 17% 27% 24% 17% 27%
Sigma 1340 658 682 343 329 387 282 910 161 165 45 429 496 389 364 558 418 514 507 90 469 871 442 636 263 563 715
100% 100% 100% 100% 100% 100% 100% 100% 100% 100% 100% 100% 100% 100% 100% 100% 100% 100% 100% 100% 100% 100% 100% 100% 100% 100% 100%

Page 47
Fielding Period: March 27-29, 2018
HCAPS (Filtered on Registered Voters)
Weighted To The U.S. General Adult Population - Propensity
30 Mar 2018
Table 41
F1_24 Now we will show you some names. Please indicate if you have a favorable
or unfavorable view of that person - or if you've never heard of them.
Rex Tillerson
Base: All Respondents
Presidential
Election Candidate
Gender Age Ethnicity Political Party Political Ideology Voted For Education Locale Income
_____________ ______________________ _______________________ ____________________ ____________________ _____________________ _____________ ________________ _________
Colle- Some
Cons- ge Gr- Colle- $75K Less
Hisp- Black Repub- Democ- Indep- Libe- Mode- erva- 3rd ad And ge Or Urb- Subu- Or Than
Total Male Female 18-34 35-49 50-64 65+ White anic /AA Other lican rat endent ral rate tive Clinton Trump Party Higher Less an rban Rural More $75K
______ _____ _______ _____ _____ _____ ____ _____ _____ _____ _____ ______ ______ ______ ______ ______ ______ ________ ______ _____ ______ ______ ____ _____ _____ ____ ____
Unweighted Base 1340 538 802 296 337 392 315 1078 68 123 27 415 478 384 366 551 423 491 511 106 452 888 398 633 309 404 868
Weighted Base 1340 658 682 343 329 387 282 910 161 165 45 429 496 389 364 558 418 514 507 90 469 871 442 636 263 563 715
Effective Base 720 324 402 155 187 207 184 611 48 79 16 232 261 206 197 299 225 269 285 62 260 461 224 340 160 251 466
Ever Heard Of (Net) 791 461 330 182 201 228 180 563 80 94 19 247 315 221 274 285 233 367 315 48 339 453 295 355 141 391 373
59% 70% 48% 53% 61% 59% 64% 62% 50% 57% 42% 58% 64% 57% 75% 51% 56% 71% 62% 53% 72% 52% 67% 56% 54% 69% 52%
Very Favorable/Favorable 371 224 147 70 91 109 101 280 37 30 13 166 115 87 94 136 140 123 211 16 170 201 148 151 72 208 150
(Sub-Net) 28% 34% 21% 20% 28% 28% 36% 31% 23% 18% 28% 39% 23% 22% 26% 24% 33% 24% 42% 17% 36% 23% 34% 24% 27% 37% 21%
Very favorable 66 43 23 14 15 18 19 53 7 5 - 26 16 23 17 27 22 14 48 3 36 30 29 30 7 40 21
5% 7% 3% 4% 5% 5% 7% 6% 4% 3% - 6% 3% 6% 5% 5% 5% 3% 9% 3% 8% 3% 7% 5% 3% 7% 3%
Favorable 305 181 124 57 76 92 81 227 30 25 13 141 99 63 77 110 118 108 163 13 134 171 119 120 65 168 130
23% 28% 18% 16% 23% 24% 29% 25% 18% 15% 28% 33% 20% 16% 21% 20% 28% 21% 32% 14% 28% 20% 27% 19% 25% 30% 18%
Very Unfavorable/ 421 237 184 112 110 119 79 283 44 64 6 80 200 134 180 148 93 244 104 32 169 252 147 205 69 182 223
Unfavorable (Sub-Net) 31% 36% 27% 33% 34% 31% 28% 31% 27% 39% 14% 19% 40% 35% 49% 27% 22% 47% 20% 35% 36% 29% 33% 32% 26% 32% 31%
Unfavorable 236 137 99 60 55 76 46 167 29 27 4 57 96 83 87 89 60 125 65 21 93 143 94 113 29 95 136
18% 21% 15% 17% 17% 20% 16% 18% 18% 16% 9% 13% 19% 21% 24% 16% 14% 24% 13% 23% 20% 16% 21% 18% 11% 17% 19%
Very unfavorable 185 100 84 52 56 43 34 116 14 38 3 24 105 52 93 59 33 119 39 12 76 109 53 92 39 87 87
14% 15% 12% 15% 17% 11% 12% 13% 9% 23% 6% 6% 21% 13% 25% 11% 8% 23% 8% 13% 16% 12% 12% 14% 15% 16% 12%
Never heard of them 196 45 151 74 46 44 32 126 37 20 9 63 69 59 44 81 71 46 62 13 41 155 61 74 60 53 129
15% 7% 22% 22% 14% 11% 11% 14% 23% 12% 19% 15% 14% 15% 12% 15% 17% 9% 12% 14% 9% 18% 14% 12% 23% 9% 18%
No opinion 353 152 201 86 81 115 71 221 44 51 17 119 112 109 47 192 114 101 130 30 89 264 85 206 61 119 213
26% 23% 29% 25% 25% 30% 25% 24% 27% 31% 39% 28% 23% 28% 13% 34% 27% 20% 26% 33% 19% 30% 19% 32% 23% 21% 30%
Sigma 1340 658 682 343 329 387 282 910 161 165 45 429 496 389 364 558 418 514 507 90 469 871 442 636 263 563 715
100% 100% 100% 100% 100% 100% 100% 100% 100% 100% 100% 100% 100% 100% 100% 100% 100% 100% 100% 100% 100% 100% 100% 100% 100% 100% 100%

Page 48
Fielding Period: March 27-29, 2018
HCAPS (Filtered on Registered Voters)
Weighted To The U.S. General Adult Population - Propensity
30 Mar 2018
Table 42
F1_34 Now we will show you some names. Please indicate if you have a favorable
or unfavorable view of that person - or if you've never heard of them.
Robert Mueller
Base: All Respondents
Presidential
Election Candidate
Gender Age Ethnicity Political Party Political Ideology Voted For Education Locale Income
_____________ ______________________ _______________________ ____________________ ____________________ _____________________ _____________ ________________ _________
Colle- Some
Cons- ge Gr- Colle- $75K Less
Hisp- Black Repub- Democ- Indep- Libe- Mode- erva- 3rd ad And ge Or Urb- Subu- Or Than
Total Male Female 18-34 35-49 50-64 65+ White anic /AA Other lican rat endent ral rate tive Clinton Trump Party Higher Less an rban Rural More $75K
______ _____ _______ _____ _____ _____ ____ _____ _____ _____ _____ ______ ______ ______ ______ ______ ______ ________ ______ _____ ______ ______ ____ _____ _____ ____ ____
Unweighted Base 1340 538 802 296 337 392 315 1078 68 123 27 415 478 384 366 551 423 491 511 106 452 888 398 633 309 404 868
Weighted Base 1340 658 682 343 329 387 282 910 161 165 45 429 496 389 364 558 418 514 507 90 469 871 442 636 263 563 715
Effective Base 720 324 402 155 187 207 184 611 48 79 16 232 261 206 197 299 225 269 285 62 260 461 224 340 160 251 466
Ever Heard Of (Net) 906 524 382 198 221 261 226 637 95 105 32 301 332 261 286 326 294 398 358 61 381 525 320 423 163 435 434
68% 80% 56% 58% 67% 67% 80% 70% 59% 64% 71% 70% 67% 67% 78% 59% 70% 77% 71% 67% 81% 60% 73% 67% 62% 77% 61%
Very Favorable/Favorable 513 296 217 103 111 177 122 357 52 65 19 117 237 155 211 204 98 295 138 39 239 275 206 222 85 249 243
(Sub-Net) 38% 45% 32% 30% 34% 46% 43% 39% 32% 40% 42% 27% 48% 40% 58% 37% 24% 57% 27% 43% 51% 32% 47% 35% 32% 44% 34%
Very favorable 242 135 107 31 52 92 66 163 16 41 16 28 143 71 127 86 30 178 31 20 114 128 101 105 37 126 108
18% 21% 16% 9% 16% 24% 24% 18% 10% 25% 36% 7% 29% 18% 35% 15% 7% 35% 6% 22% 24% 15% 23% 17% 14% 22% 15%
Favorable 271 161 110 72 59 85 55 194 36 24 3 88 95 84 85 118 69 117 106 19 124 147 105 117 49 123 135
20% 24% 16% 21% 18% 22% 20% 21% 23% 14% 7% 21% 19% 22% 23% 21% 16% 23% 21% 21% 27% 17% 24% 18% 19% 22% 19%
Very Unfavorable/ 393 228 164 95 110 83 104 280 43 39 13 185 94 106 75 123 195 104 221 22 142 250 114 201 78 186 192
Unfavorable (Sub-Net) 29% 35% 24% 28% 33% 22% 37% 31% 27% 24% 28% 43% 19% 27% 20% 22% 47% 20% 44% 24% 30% 29% 26% 32% 30% 33% 27%
Unfavorable 212 126 86 59 62 39 52 151 21 19 12 96 58 54 41 71 100 55 121 11 78 135 73 101 38 103 106
16% 19% 13% 17% 19% 10% 19% 17% 13% 11% 27% 22% 12% 14% 11% 13% 24% 11% 24% 12% 17% 15% 17% 16% 15% 18% 15%
Very unfavorable 180 102 78 36 48 44 52 128 22 21 1 88 36 52 33 52 95 49 100 11 64 116 41 99 39 83 86
13% 16% 11% 11% 15% 11% 18% 14% 14% 13% 2% 21% 7% 13% 9% 9% 23% 9% 20% 12% 14% 13% 9% 16% 15% 15% 12%
Never heard of them 130 24 106 55 33 29 13 76 33 10 - 42 44 40 22 68 40 29 45 11 28 102 38 55 36 41 83
10% 4% 16% 16% 10% 7% 5% 8% 21% 6% - 10% 9% 10% 6% 12% 10% 6% 9% 12% 6% 12% 9% 9% 14% 7% 12%
No opinion 304 110 194 89 74 97 44 198 32 50 13 86 121 87 56 164 84 87 103 19 60 244 83 158 63 86 198
23% 17% 29% 26% 23% 25% 15% 22% 20% 30% 29% 20% 24% 22% 15% 29% 20% 17% 20% 21% 13% 28% 19% 25% 24% 15% 28%
Sigma 1340 658 682 343 329 387 282 910 161 165 45 429 496 389 364 558 418 514 507 90 469 871 442 636 263 563 715
100% 100% 100% 100% 100% 100% 100% 100% 100% 100% 100% 100% 100% 100% 100% 100% 100% 100% 100% 100% 100% 100% 100% 100% 100% 100% 100%

Page 49
Fielding Period: March 27-29, 2018
HCAPS (Filtered on Registered Voters)
Weighted To The U.S. General Adult Population - Propensity
30 Mar 2018
Table 43
F1_38 Now we will show you some names. Please indicate if you have a favorable
or unfavorable view of that person - or if you've never heard of them.
John Kelly
Base: All Respondents
Presidential
Election Candidate
Gender Age Ethnicity Political Party Political Ideology Voted For Education Locale Income
_____________ ______________________ _______________________ ____________________ ____________________ _____________________ _____________ ________________ _________
Colle- Some
Cons- ge Gr- Colle- $75K Less
Hisp- Black Repub- Democ- Indep- Libe- Mode- erva- 3rd ad And ge Or Urb- Subu- Or Than
Total Male Female 18-34 35-49 50-64 65+ White anic /AA Other lican rat endent ral rate tive Clinton Trump Party Higher Less an rban Rural More $75K
______ _____ _______ _____ _____ _____ ____ _____ _____ _____ _____ ______ ______ ______ ______ ______ ______ ________ ______ _____ ______ ______ ____ _____ _____ ____ ____
Unweighted Base 1340 538 802 296 337 392 315 1078 68 123 27 415 478 384 366 551 423 491 511 106 452 888 398 633 309 404 868
Weighted Base 1340 658 682 343 329 387 282 910 161 165 45 429 496 389 364 558 418 514 507 90 469 871 442 636 263 563 715
Effective Base 720 324 402 155 187 207 184 611 48 79 16 232 261 206 197 299 225 269 285 62 260 461 224 340 160 251 466
Ever Heard Of (Net) 735 434 301 193 171 196 175 514 81 79 25 224 286 214 247 288 200 330 276 52 314 422 264 344 128 368 337
55% 66% 44% 56% 52% 51% 62% 57% 50% 48% 56% 52% 58% 55% 68% 52% 48% 64% 55% 58% 67% 48% 60% 54% 49% 65% 47%
Very Favorable/Favorable 378 245 132 93 78 115 92 284 44 25 13 155 106 114 91 154 133 117 194 26 173 204 136 187 55 205 152
(Sub-Net) 28% 37% 19% 27% 24% 30% 32% 31% 28% 15% 29% 36% 21% 29% 25% 28% 32% 23% 38% 28% 37% 23% 31% 29% 21% 36% 21%
Very favorable 82 60 22 19 25 15 23 75 1 4 1 50 14 17 23 18 41 10 61 7 48 34 37 33 12 57 25
6% 9% 3% 5% 8% 4% 8% 8% * 2% 2% 12% 3% 4% 6% 3% 10% 2% 12% 7% 10% 4% 8% 5% 5% 10% 3%
Favorable 296 186 110 74 53 100 69 209 44 20 12 106 92 97 68 136 92 107 133 19 125 171 99 154 43 148 127
22% 28% 16% 22% 16% 26% 24% 23% 27% 12% 27% 25% 19% 25% 19% 24% 22% 21% 26% 21% 27% 20% 22% 24% 16% 26% 18%
Very Unfavorable/ 358 189 169 101 93 81 83 230 36 54 12 69 180 100 157 134 67 213 82 26 141 217 127 157 73 162 185
Unfavorable (Sub-Net) 27% 29% 25% 29% 28% 21% 30% 25% 23% 33% 27% 16% 36% 26% 43% 24% 16% 41% 16% 29% 30% 25% 29% 25% 28% 29% 26%
Unfavorable 194 102 92 68 49 38 39 142 24 9 7 47 74 66 73 74 46 92 60 16 88 106 73 88 33 98 92
14% 15% 14% 20% 15% 10% 14% 16% 15% 5% 16% 11% 15% 17% 20% 13% 11% 18% 12% 18% 19% 12% 16% 14% 13% 17% 13%
Very unfavorable 164 87 77 33 44 43 44 88 12 45 5 22 106 34 83 60 21 121 22 10 53 111 55 69 40 64 92
12% 13% 11% 10% 13% 11% 16% 10% 8% 28% 11% 5% 21% 9% 23% 11% 5% 23% 4% 11% 11% 13% 12% 11% 15% 11% 13%
Never heard of them 225 77 147 68 57 63 37 148 37 30 3 73 76 70 51 83 91 62 85 23 63 162 69 95 61 67 145
17% 12% 22% 20% 17% 16% 13% 16% 23% 18% 6% 17% 15% 18% 14% 15% 22% 12% 17% 25% 13% 19% 16% 15% 23% 12% 20%
No opinion 380 147 233 82 100 128 70 247 43 56 17 131 134 105 66 187 127 122 145 16 93 287 109 198 73 128 234
28% 22% 34% 24% 30% 33% 25% 27% 27% 34% 38% 31% 27% 27% 18% 33% 30% 24% 29% 17% 20% 33% 25% 31% 28% 23% 33%
Sigma 1340 658 682 343 329 387 282 910 161 165 45 429 496 389 364 558 418 514 507 90 469 871 442 636 263 563 715
100% 100% 100% 100% 100% 100% 100% 100% 100% 100% 100% 100% 100% 100% 100% 100% 100% 100% 100% 100% 100% 100% 100% 100% 100% 100% 100%

Page 50
Fielding Period: March 27-29, 2018
HCAPS (Filtered on Registered Voters)
Weighted To The U.S. General Adult Population - Propensity
30 Mar 2018
Table 44
F1_46 Now we will show you some names. Please indicate if you have a favorable
or unfavorable view of that person - or if you've never heard of them.
Gina Haspel
Base: All Respondents
Presidential
Election Candidate
Gender Age Ethnicity Political Party Political Ideology Voted For Education Locale Income
_____________ ______________________ _______________________ ____________________ ____________________ _____________________ _____________ ________________ _________
Colle- Some
Cons- ge Gr- Colle- $75K Less
Hisp- Black Repub- Democ- Indep- Libe- Mode- erva- 3rd ad And ge Or Urb- Subu- Or Than
Total Male Female 18-34 35-49 50-64 65+ White anic /AA Other lican rat endent ral rate tive Clinton Trump Party Higher Less an rban Rural More $75K
______ _____ _______ _____ _____ _____ ____ _____ _____ _____ _____ ______ ______ ______ ______ ______ ______ ________ ______ _____ ______ ______ ____ _____ _____ ____ ____
Unweighted Base 1340 538 802 296 337 392 315 1078 68 123 27 415 478 384 366 551 423 491 511 106 452 888 398 633 309 404 868
Weighted Base 1340 658 682 343 329 387 282 910 161 165 45 429 496 389 364 558 418 514 507 90 469 871 442 636 263 563 715
Effective Base 720 324 402 155 187 207 184 611 48 79 16 232 261 206 197 299 225 269 285 62 260 461 224 340 160 251 466
Ever Heard Of (Net) 352 218 134 130 100 73 50 244 42 39 4 125 134 88 137 130 85 143 162 14 183 170 166 140 46 196 143
26% 33% 20% 38% 30% 19% 18% 27% 26% 24% 9% 29% 27% 23% 38% 23% 20% 28% 32% 15% 39% 19% 38% 22% 18% 35% 20%
Very Favorable/Favorable 142 100 43 58 43 33 8 112 9 12 2 69 38 35 47 53 42 37 99 2 88 54 79 54 9 96 44
(Sub-Net) 11% 15% 6% 17% 13% 9% 3% 12% 5% 7% 5% 16% 8% 9% 13% 10% 10% 7% 19% 2% 19% 6% 18% 9% 3% 17% 6%
Very favorable 45 39 7 15 20 7 4 32 4 9 - 24 14 7 21 13 11 11 33 - 26 20 25 19 2 30 15
3% 6% 1% 5% 6% 2% 1% 3% 2% 5% - 6% 3% 2% 6% 2% 3% 2% 7% - 5% 2% 6% 3% 1% 5% 2%
Favorable 97 61 36 42 24 26 5 80 5 3 2 44 24 28 26 41 30 26 65 2 62 34 54 36 7 66 29
7% 9% 5% 12% 7% 7% 2% 9% 3% 2% 5% 10% 5% 7% 7% 7% 7% 5% 13% 2% 13% 4% 12% 6% 3% 12% 4%
Very Unfavorable/ 210 119 91 72 57 40 42 132 33 27 2 56 96 52 90 77 43 107 63 12 95 115 87 86 37 100 99
Unfavorable (Sub-Net) 16% 18% 13% 21% 17% 10% 15% 15% 20% 17% 4% 13% 19% 13% 25% 14% 10% 21% 13% 13% 20% 13% 20% 14% 14% 18% 14%
Unfavorable 107 61 46 34 30 23 21 64 17 20 1 24 51 30 43 49 14 55 29 5 45 62 48 45 14 51 56
8% 9% 7% 10% 9% 6% 7% 7% 10% 12% 2% 6% 10% 8% 12% 9% 3% 11% 6% 5% 10% 7% 11% 7% 5% 9% 8%
Very unfavorable 103 58 45 38 27 17 21 68 16 7 1 32 45 22 47 27 29 52 35 7 50 53 39 41 23 49 43
8% 9% 7% 11% 8% 4% 7% 8% 10% 4% 2% 8% 9% 6% 13% 5% 7% 10% 7% 7% 11% 6% 9% 6% 9% 9% 6%
Never heard of them 612 276 336 138 149 192 133 427 71 75 18 187 210 201 155 244 213 221 219 57 188 424 154 310 148 237 351
46% 42% 49% 40% 45% 50% 47% 47% 44% 46% 40% 44% 42% 52% 43% 44% 51% 43% 43% 63% 40% 49% 35% 49% 56% 42% 49%
No opinion 376 164 212 75 80 121 100 239 48 50 23 116 152 100 72 184 120 150 125 20 99 277 122 186 69 129 221
28% 25% 31% 22% 24% 31% 35% 26% 30% 31% 52% 27% 31% 26% 20% 33% 29% 29% 25% 22% 21% 32% 28% 29% 26% 23% 31%
Sigma 1340 658 682 343 329 387 282 910 161 165 45 429 496 389 364 558 418 514 507 90 469 871 442 636 263 563 715
100% 100% 100% 100% 100% 100% 100% 100% 100% 100% 100% 100% 100% 100% 100% 100% 100% 100% 100% 100% 100% 100% 100% 100% 100% 100% 100%

Page 51
Fielding Period: March 27-29, 2018
HCAPS (Filtered on Registered Voters)
Weighted To The U.S. General Adult Population - Propensity
30 Mar 2018
Table 45
F1_47 Now we will show you some names. Please indicate if you have a favorable
or unfavorable view of that person - or if you've never heard of them.
Mike Pompeo
Base: All Respondents
Presidential
Election Candidate
Gender Age Ethnicity Political Party Political Ideology Voted For Education Locale Income
_____________ ______________________ _______________________ ____________________ ____________________ _____________________ _____________ ________________ _________
Colle- Some
Cons- ge Gr- Colle- $75K Less
Hisp- Black Repub- Democ- Indep- Libe- Mode- erva- 3rd ad And ge Or Urb- Subu- Or Than
Total Male Female 18-34 35-49 50-64 65+ White anic /AA Other lican rat endent ral rate tive Clinton Trump Party Higher Less an rban Rural More $75K
______ _____ _______ _____ _____ _____ ____ _____ _____ _____ _____ ______ ______ ______ ______ ______ ______ ________ ______ _____ ______ ______ ____ _____ _____ ____ ____
Unweighted Base 1340 538 802 296 337 392 315 1078 68 123 27 415 478 384 366 551 423 491 511 106 452 888 398 633 309 404 868
Weighted Base 1340 658 682 343 329 387 282 910 161 165 45 429 496 389 364 558 418 514 507 90 469 871 442 636 263 563 715
Effective Base 720 324 402 155 187 207 184 611 48 79 16 232 261 206 197 299 225 269 285 62 260 461 224 340 160 251 466
Ever Heard Of (Net) 611 350 261 157 146 164 144 430 66 71 18 202 240 161 211 229 171 264 252 37 270 341 241 265 105 303 292
46% 53% 38% 46% 44% 42% 51% 47% 41% 43% 40% 47% 48% 42% 58% 41% 41% 51% 50% 41% 58% 39% 55% 42% 40% 54% 41%
Very Favorable/Favorable 248 154 94 70 54 59 65 191 22 21 7 126 67 53 61 94 93 56 168 11 113 135 112 97 38 146 97
(Sub-Net) 19% 23% 14% 20% 16% 15% 23% 21% 14% 13% 17% 29% 14% 14% 17% 17% 22% 11% 33% 12% 24% 16% 25% 15% 15% 26% 14%
Very favorable 61 45 16 20 16 14 11 50 8 3 - 38 14 10 18 13 30 6 52 2 37 24 34 23 4 43 17
5% 7% 2% 6% 5% 4% 4% 5% 5% 2% - 9% 3% 2% 5% 2% 7% 1% 10% 2% 8% 3% 8% 4% 2% 8% 2%
Favorable 187 109 78 50 38 45 54 141 14 18 7 88 54 43 43 81 63 51 116 9 76 111 78 75 34 103 79
14% 17% 11% 15% 12% 12% 19% 16% 9% 11% 17% 21% 11% 11% 12% 15% 15% 10% 23% 10% 16% 13% 18% 12% 13% 18% 11%
Very Unfavorable/ 363 196 167 87 92 105 79 239 44 50 11 76 173 108 150 135 78 207 84 26 157 206 129 167 67 157 195
Unfavorable (Sub-Net) 27% 30% 25% 25% 28% 27% 28% 26% 27% 31% 24% 18% 35% 28% 41% 24% 19% 40% 17% 28% 33% 24% 29% 26% 25% 28% 27%
Unfavorable 193 98 96 48 50 57 38 129 31 21 7 49 75 65 63 83 47 92 64 8 85 108 77 80 37 84 106
14% 15% 14% 14% 15% 15% 13% 14% 19% 13% 16% 11% 15% 17% 17% 15% 11% 18% 13% 9% 18% 12% 17% 13% 14% 15% 15%
Very unfavorable 170 98 72 40 42 48 41 110 13 29 3 26 97 43 87 52 31 116 21 17 71 98 52 88 30 73 89
13% 15% 11% 12% 13% 12% 14% 12% 8% 18% 8% 6% 20% 11% 24% 9% 7% 23% 4% 19% 15% 11% 12% 14% 12% 13% 12%
Never heard of them 310 141 169 96 71 91 52 195 48 42 8 94 101 110 80 123 107 104 96 30 97 213 89 155 66 110 178
23% 21% 25% 28% 22% 23% 18% 21% 30% 25% 19% 22% 20% 28% 22% 22% 26% 20% 19% 33% 21% 24% 20% 24% 25% 20% 25%
No opinion 419 167 252 89 111 132 87 284 47 52 18 133 155 118 73 206 140 146 158 24 102 316 112 216 91 150 245
31% 25% 37% 26% 34% 34% 31% 31% 29% 31% 41% 31% 31% 30% 20% 37% 34% 28% 31% 26% 22% 36% 25% 34% 35% 27% 34%
Sigma 1340 658 682 343 329 387 282 910 161 165 45 429 496 389 364 558 418 514 507 90 469 871 442 636 263 563 715
100% 100% 100% 100% 100% 100% 100% 100% 100% 100% 100% 100% 100% 100% 100% 100% 100% 100% 100% 100% 100% 100% 100% 100% 100% 100% 100%

Page 52
Fielding Period: March 27-29, 2018
HCAPS (Filtered on Registered Voters)
Weighted To The U.S. General Adult Population - Propensity
30 Mar 2018
Table 46
F1_48 Now we will show you some names. Please indicate if you have a favorable
or unfavorable view of that person - or if you've never heard of them.
Andrew McCabe
Base: All Respondents
Presidential
Election Candidate
Gender Age Ethnicity Political Party Political Ideology Voted For Education Locale Income
_____________ ______________________ _______________________ ____________________ ____________________ _____________________ _____________ ________________ _________
Colle- Some
Cons- ge Gr- Colle- $75K Less
Hisp- Black Repub- Democ- Indep- Libe- Mode- erva- 3rd ad And ge Or Urb- Subu- Or Than
Total Male Female 18-34 35-49 50-64 65+ White anic /AA Other lican rat endent ral rate tive Clinton Trump Party Higher Less an rban Rural More $75K
______ _____ _______ _____ _____ _____ ____ _____ _____ _____ _____ ______ ______ ______ ______ ______ ______ ________ ______ _____ ______ ______ ____ _____ _____ ____ ____
Unweighted Base 1340 538 802 296 337 392 315 1078 68 123 27 415 478 384 366 551 423 491 511 106 452 888 398 633 309 404 868
Weighted Base 1340 658 682 343 329 387 282 910 161 165 45 429 496 389 364 558 418 514 507 90 469 871 442 636 263 563 715
Effective Base 720 324 402 155 187 207 184 611 48 79 16 232 261 206 197 299 225 269 285 62 260 461 224 340 160 251 466
Ever Heard Of (Net) 621 380 241 148 158 175 140 452 66 58 17 220 229 163 196 229 196 260 271 35 255 366 231 266 124 300 295
46% 58% 35% 43% 48% 45% 50% 50% 41% 35% 38% 51% 46% 42% 54% 41% 47% 51% 53% 39% 54% 42% 52% 42% 47% 53% 41%
Very Favorable/Favorable 298 176 122 85 74 81 57 221 28 33 6 83 134 78 132 110 56 158 107 10 142 156 128 117 53 151 141
(Sub-Net) 22% 27% 18% 25% 23% 21% 20% 24% 17% 20% 13% 19% 27% 20% 36% 20% 14% 31% 21% 12% 30% 18% 29% 18% 20% 27% 20%
Very favorable 65 44 21 18 17 17 14 56 2 5 - 24 27 14 36 21 8 34 26 2 40 26 37 20 9 36 26
5% 7% 3% 5% 5% 4% 5% 6% 1% 3% - 6% 5% 4% 10% 4% 2% 7% 5% 3% 8% 3% 8% 3% 3% 6% 4%
Favorable 233 132 100 68 58 64 44 164 26 28 6 59 107 64 96 88 48 124 81 8 102 131 91 98 44 114 115
17% 20% 15% 20% 18% 16% 16% 18% 16% 17% 13% 14% 22% 16% 26% 16% 12% 24% 16% 9% 22% 15% 21% 15% 17% 20% 16%
Very Unfavorable/ 323 204 120 63 83 94 83 231 38 26 11 137 95 86 64 120 140 102 163 25 113 210 103 149 71 150 154
Unfavorable (Sub-Net) 24% 31% 18% 18% 25% 24% 29% 25% 24% 16% 25% 32% 19% 22% 17% 21% 33% 20% 32% 28% 24% 24% 23% 23% 27% 27% 21%
Unfavorable 136 86 50 29 46 36 26 100 20 9 5 58 43 33 24 64 49 44 66 10 50 86 46 67 23 70 60
10% 13% 7% 8% 14% 9% 9% 11% 12% 5% 12% 14% 9% 9% 6% 11% 12% 9% 13% 11% 11% 10% 10% 11% 9% 13% 8%
Very unfavorable 187 117 70 34 38 58 56 130 19 17 6 79 52 52 40 56 91 58 97 15 63 124 57 82 48 79 94
14% 18% 10% 10% 11% 15% 20% 14% 12% 10% 14% 18% 10% 13% 11% 10% 22% 11% 19% 17% 13% 14% 13% 13% 18% 14% 13%
Never heard of them 306 117 189 113 71 80 42 195 41 41 6 79 117 103 87 134 86 113 86 26 95 211 96 143 67 111 179
23% 18% 28% 33% 22% 21% 15% 21% 25% 25% 14% 18% 24% 27% 24% 24% 21% 22% 17% 29% 20% 24% 22% 22% 26% 20% 25%
No opinion 413 161 252 82 100 131 100 263 54 65 22 129 150 122 82 194 136 141 150 29 119 294 114 227 72 151 241
31% 24% 37% 24% 30% 34% 35% 29% 33% 39% 48% 30% 30% 31% 23% 35% 33% 27% 30% 32% 25% 34% 26% 36% 27% 27% 34%
Sigma 1340 658 682 343 329 387 282 910 161 165 45 429 496 389 364 558 418 514 507 90 469 871 442 636 263 563 715
100% 100% 100% 100% 100% 100% 100% 100% 100% 100% 100% 100% 100% 100% 100% 100% 100% 100% 100% 100% 100% 100% 100% 100% 100% 100% 100%
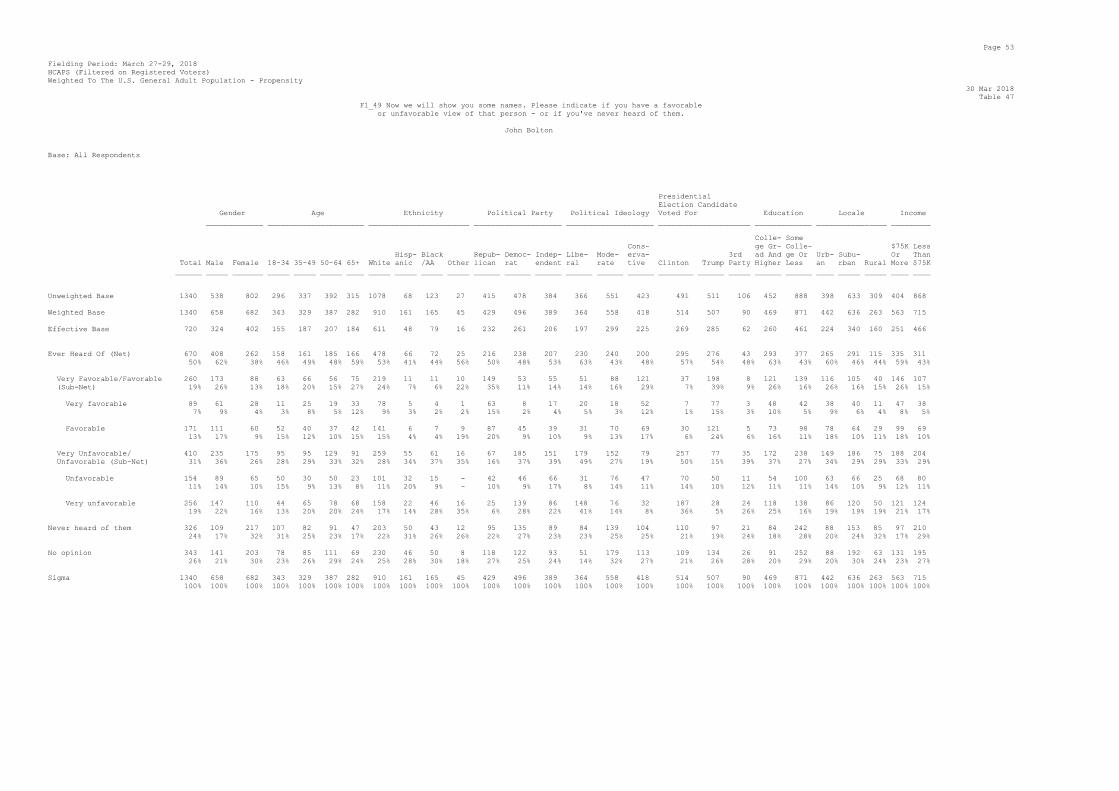
Page 53
Fielding Period: March 27-29, 2018
HCAPS (Filtered on Registered Voters)
Weighted To The U.S. General Adult Population - Propensity
30 Mar 2018
Table 47
F1_49 Now we will show you some names. Please indicate if you have a favorable
or unfavorable view of that person - or if you've never heard of them.
John Bolton
Base: All Respondents
Presidential
Election Candidate
Gender Age Ethnicity Political Party Political Ideology Voted For Education Locale Income
_____________ ______________________ _______________________ ____________________ ____________________ _____________________ _____________ ________________ _________
Colle- Some
Cons- ge Gr- Colle- $75K Less
Hisp- Black Repub- Democ- Indep- Libe- Mode- erva- 3rd ad And ge Or Urb- Subu- Or Than
Total Male Female 18-34 35-49 50-64 65+ White anic /AA Other lican rat endent ral rate tive Clinton Trump Party Higher Less an rban Rural More $75K
______ _____ _______ _____ _____ _____ ____ _____ _____ _____ _____ ______ ______ ______ ______ ______ ______ ________ ______ _____ ______ ______ ____ _____ _____ ____ ____
Unweighted Base 1340 538 802 296 337 392 315 1078 68 123 27 415 478 384 366 551 423 491 511 106 452 888 398 633 309 404 868
Weighted Base 1340 658 682 343 329 387 282 910 161 165 45 429 496 389 364 558 418 514 507 90 469 871 442 636 263 563 715
Effective Base 720 324 402 155 187 207 184 611 48 79 16 232 261 206 197 299 225 269 285 62 260 461 224 340 160 251 466
Ever Heard Of (Net) 670 408 262 158 161 185 166 478 66 72 25 216 238 207 230 240 200 295 276 43 293 377 265 291 115 335 311
50% 62% 38% 46% 49% 48% 59% 53% 41% 44% 56% 50% 48% 53% 63% 43% 48% 57% 54% 48% 63% 43% 60% 46% 44% 59% 43%
Very Favorable/Favorable 260 173 88 63 66 56 75 219 11 11 10 149 53 55 51 88 121 37 198 8 121 139 116 105 40 146 107
(Sub-Net) 19% 26% 13% 18% 20% 15% 27% 24% 7% 6% 22% 35% 11% 14% 14% 16% 29% 7% 39% 9% 26% 16% 26% 16% 15% 26% 15%
Very favorable 89 61 28 11 25 19 33 78 5 4 1 63 8 17 20 18 52 7 77 3 48 42 38 40 11 47 38
7% 9% 4% 3% 8% 5% 12% 9% 3% 2% 2% 15% 2% 4% 5% 3% 12% 1% 15% 3% 10% 5% 9% 6% 4% 8% 5%
Favorable 171 111 60 52 40 37 42 141 6 7 9 87 45 39 31 70 69 30 121 5 73 98 78 64 29 99 69
13% 17% 9% 15% 12% 10% 15% 15% 4% 4% 19% 20% 9% 10% 9% 13% 17% 6% 24% 6% 16% 11% 18% 10% 11% 18% 10%
Very Unfavorable/ 410 235 175 95 95 129 91 259 55 61 16 67 185 151 179 152 79 257 77 35 172 238 149 186 75 188 204
Unfavorable (Sub-Net) 31% 36% 26% 28% 29% 33% 32% 28% 34% 37% 35% 16% 37% 39% 49% 27% 19% 50% 15% 39% 37% 27% 34% 29% 29% 33% 29%
Unfavorable 154 89 65 50 30 50 23 101 32 15 - 42 46 66 31 76 47 70 50 11 54 100 63 66 25 68 80
11% 14% 10% 15% 9% 13% 8% 11% 20% 9% - 10% 9% 17% 8% 14% 11% 14% 10% 12% 11% 11% 14% 10% 9% 12% 11%
Very unfavorable 256 147 110 44 65 78 68 158 22 46 16 25 139 86 148 76 32 187 28 24 118 138 86 120 50 121 124
19% 22% 16% 13% 20% 20% 24% 17% 14% 28% 35% 6% 28% 22% 41% 14% 8% 36% 5% 26% 25% 16% 19% 19% 19% 21% 17%
Never heard of them 326 109 217 107 82 91 47 203 50 43 12 95 135 89 84 139 104 110 97 21 84 242 88 153 85 97 210
24% 17% 32% 31% 25% 23% 17% 22% 31% 26% 26% 22% 27% 23% 23% 25% 25% 21% 19% 24% 18% 28% 20% 24% 32% 17% 29%
No opinion 343 141 203 78 85 111 69 230 46 50 8 118 122 93 51 179 113 109 134 26 91 252 88 192 63 131 195
26% 21% 30% 23% 26% 29% 24% 25% 28% 30% 18% 27% 25% 24% 14% 32% 27% 21% 26% 28% 20% 29% 20% 30% 24% 23% 27%
Sigma 1340 658 682 343 329 387 282 910 161 165 45 429 496 389 364 558 418 514 507 90 469 871 442 636 263 563 715
100% 100% 100% 100% 100% 100% 100% 100% 100% 100% 100% 100% 100% 100% 100% 100% 100% 100% 100% 100% 100% 100% 100% 100% 100% 100% 100%

Page 54
Fielding Period: March 27-29, 2018
HCAPS (Filtered on Registered Voters)
Weighted To The U.S. General Adult Population - Propensity
30 Mar 2018
Table 48
F1_50 Now we will show you some names. Please indicate if you have a favorable
or unfavorable view of that person - or if you've never heard of them.
Mark Zuckerberg
Base: All Respondents
Presidential
Election Candidate
Gender Age Ethnicity Political Party Political Ideology Voted For Education Locale Income
_____________ ______________________ _______________________ ____________________ ____________________ _____________________ _____________ ________________ _________
Colle- Some
Cons- ge Gr- Colle- $75K Less
Hisp- Black Repub- Democ- Indep- Libe- Mode- erva- 3rd ad And ge Or Urb- Subu- Or Than
Total Male Female 18-34 35-49 50-64 65+ White anic /AA Other lican rat endent ral rate tive Clinton Trump Party Higher Less an rban Rural More $75K
______ _____ _______ _____ _____ _____ ____ _____ _____ _____ _____ ______ ______ ______ ______ ______ ______ ________ ______ _____ ______ ______ ____ _____ _____ ____ ____
Unweighted Base 1340 538 802 296 337 392 315 1078 68 123 27 415 478 384 366 551 423 491 511 106 452 888 398 633 309 404 868
Weighted Base 1340 658 682 343 329 387 282 910 161 165 45 429 496 389 364 558 418 514 507 90 469 871 442 636 263 563 715
Effective Base 720 324 402 155 187 207 184 611 48 79 16 232 261 206 197 299 225 269 285 62 260 461 224 340 160 251 466
Ever Heard Of (Net) 1056 551 505 278 269 285 224 735 123 112 41 345 380 315 314 423 319 419 407 76 400 656 363 489 203 489 528
79% 84% 74% 81% 82% 74% 79% 81% 77% 68% 91% 80% 77% 81% 86% 76% 76% 82% 80% 83% 85% 75% 82% 77% 77% 87% 74%
Very Favorable/Favorable 473 233 241 143 118 131 81 319 40 71 20 145 209 115 161 208 105 200 189 18 177 296 189 201 83 218 246
(Sub-Net) 35% 35% 35% 42% 36% 34% 29% 35% 25% 43% 44% 34% 42% 30% 44% 37% 25% 39% 37% 20% 38% 34% 43% 32% 32% 39% 34%
Very favorable 96 50 46 45 29 12 10 70 6 9 7 31 45 20 27 55 14 36 47 1 44 52 53 28 16 46 49
7% 8% 7% 13% 9% 3% 3% 8% 4% 6% 15% 7% 9% 5% 7% 10% 3% 7% 9% 1% 9% 6% 12% 4% 6% 8% 7%
Favorable 377 183 195 98 89 119 71 250 34 62 13 114 165 95 133 153 91 164 142 17 133 244 136 174 67 172 197
28% 28% 29% 29% 27% 31% 25% 27% 21% 38% 29% 27% 33% 24% 37% 27% 22% 32% 28% 19% 28% 28% 31% 27% 26% 31% 28%
Very Unfavorable/ 583 318 264 134 151 155 143 415 83 41 21 200 171 200 154 215 214 220 218 58 222 360 174 288 120 271 282
Unfavorable (Sub-Net) 43% 48% 39% 39% 46% 40% 51% 46% 52% 25% 47% 47% 34% 52% 42% 39% 51% 43% 43% 64% 47% 41% 40% 45% 46% 48% 39%
Unfavorable 344 170 173 83 98 77 86 241 47 26 20 100 120 118 118 128 98 159 115 26 134 210 112 167 64 162 168
26% 26% 25% 24% 30% 20% 30% 27% 29% 16% 45% 23% 24% 30% 32% 23% 23% 31% 23% 29% 29% 24% 25% 26% 24% 29% 23%
Very unfavorable 239 148 91 51 53 78 57 174 36 15 1 100 51 82 36 87 116 61 103 32 89 151 62 121 56 108 113
18% 22% 13% 15% 16% 20% 20% 19% 22% 9% 2% 23% 10% 21% 10% 16% 28% 12% 20% 35% 19% 17% 14% 19% 21% 19% 16%
Never heard of them 44 12 32 14 7 15 7 21 15 5 - 14 20 9 5 27 12 11 16 * * 43 18 19 7 10 29
3% 2% 5% 4% 2% 4% 3% 2% 9% 3% - 3% 4% 2% 1% 5% 3% 2% 3% 1% * 5% 4% 3% 3% 2% 4%
No opinion 240 95 145 51 52 86 51 154 23 47 4 70 95 64 45 107 88 84 84 14 69 171 60 128 53 64 159
18% 14% 21% 15% 16% 22% 18% 17% 14% 29% 9% 16% 19% 16% 12% 19% 21% 16% 17% 16% 15% 20% 14% 20% 20% 11% 22%
Sigma 1340 658 682 343 329 387 282 910 161 165 45 429 496 389 364 558 418 514 507 90 469 871 442 636 263 563 715
100% 100% 100% 100% 100% 100% 100% 100% 100% 100% 100% 100% 100% 100% 100% 100% 100% 100% 100% 100% 100% 100% 100% 100% 100% 100% 100%

Page 55
Fielding Period: March 27-29, 2018
HCAPS (Filtered on Registered Voters)
Weighted To The U.S. General Adult Population - Propensity
30 Mar 2018
Table 49
F1_51 Now we will show you some names. Please indicate if you have a favorable
or unfavorable view of that person - or if you've never heard of them.
Sheryl Sandberg
Base: All Respondents
Presidential
Election Candidate
Gender Age Ethnicity Political Party Political Ideology Voted For Education Locale Income
_____________ ______________________ _______________________ ____________________ ____________________ _____________________ _____________ ________________ _________
Colle- Some
Cons- ge Gr- Colle- $75K Less
Hisp- Black Repub- Democ- Indep- Libe- Mode- erva- 3rd ad And ge Or Urb- Subu- Or Than
Total Male Female 18-34 35-49 50-64 65+ White anic /AA Other lican rat endent ral rate tive Clinton Trump Party Higher Less an rban Rural More $75K
______ _____ _______ _____ _____ _____ ____ _____ _____ _____ _____ ______ ______ ______ ______ ______ ______ ________ ______ _____ ______ ______ ____ _____ _____ ____ ____
Unweighted Base 1340 538 802 296 337 392 315 1078 68 123 27 415 478 384 366 551 423 491 511 106 452 888 398 633 309 404 868
Weighted Base 1340 658 682 343 329 387 282 910 161 165 45 429 496 389 364 558 418 514 507 90 469 871 442 636 263 563 715
Effective Base 720 324 402 155 187 207 184 611 48 79 16 232 261 206 197 299 225 269 285 62 260 461 224 340 160 251 466
Ever Heard Of (Net) 447 261 187 147 127 103 70 315 48 47 14 145 176 120 147 186 114 190 175 28 219 228 200 175 72 235 196
33% 40% 27% 43% 39% 27% 25% 35% 30% 29% 31% 34% 36% 31% 40% 33% 27% 37% 35% 31% 47% 26% 45% 28% 28% 42% 27%
Very Favorable/Favorable 244 141 103 92 73 46 33 179 18 27 8 89 98 56 95 100 49 99 110 9 138 107 128 88 28 140 97
(Sub-Net) 18% 21% 15% 27% 22% 12% 12% 20% 11% 17% 17% 21% 20% 14% 26% 18% 12% 19% 22% 10% 29% 12% 29% 14% 11% 25% 14%
Very favorable 50 33 18 17 18 15 1 35 2 8 5 13 27 11 25 24 1 21 24 - 31 20 32 15 3 30 18
4% 5% 3% 5% 5% 4% * 4% 1% 5% 11% 3% 6% 3% 7% 4% * 4% 5% - 7% 2% 7% 2% 1% 5% 3%
Favorable 194 108 85 75 55 31 32 144 16 20 3 77 70 45 70 76 48 78 86 9 107 87 96 73 25 110 79
14% 16% 13% 22% 17% 8% 11% 16% 10% 12% 7% 18% 14% 12% 19% 14% 11% 15% 17% 10% 23% 10% 22% 11% 9% 20% 11%
Very Unfavorable/ 203 120 83 54 55 57 38 136 30 20 6 56 78 64 52 87 64 91 65 19 82 121 72 87 44 95 98
Unfavorable (Sub-Net) 15% 18% 12% 16% 17% 15% 13% 15% 19% 12% 14% 13% 16% 17% 14% 16% 15% 18% 13% 21% 17% 14% 16% 14% 17% 17% 14%
Unfavorable 116 58 58 32 35 29 20 75 21 13 2 27 52 34 36 58 22 64 26 9 53 63 54 47 15 54 58
9% 9% 9% 9% 11% 7% 7% 8% 13% 8% 4% 6% 11% 9% 10% 10% 5% 12% 5% 10% 11% 7% 12% 7% 6% 10% 8%
Very unfavorable 87 62 25 22 20 28 17 60 10 7 4 29 26 30 17 29 42 27 39 10 29 58 18 40 29 40 40
7% 9% 4% 6% 6% 7% 6% 7% 6% 4% 10% 7% 5% 8% 5% 5% 10% 5% 8% 11% 6% 7% 4% 6% 11% 7% 6%
Never heard of them 486 213 273 122 112 137 115 320 63 62 23 163 171 142 119 203 164 165 184 41 116 370 122 248 117 173 285
36% 32% 40% 36% 34% 35% 41% 35% 39% 38% 50% 38% 35% 36% 33% 36% 39% 32% 36% 45% 25% 42% 28% 39% 44% 31% 40%
No opinion 406 184 222 74 89 147 97 275 51 55 8 120 148 127 97 168 141 159 148 22 133 273 120 213 74 156 235
30% 28% 33% 22% 27% 38% 34% 30% 31% 34% 19% 28% 30% 33% 27% 30% 34% 31% 29% 24% 28% 31% 27% 33% 28% 28% 33%
Sigma 1340 658 682 343 329 387 282 910 161 165 45 429 496 389 364 558 418 514 507 90 469 871 442 636 263 563 715
100% 100% 100% 100% 100% 100% 100% 100% 100% 100% 100% 100% 100% 100% 100% 100% 100% 100% 100% 100% 100% 100% 100% 100% 100% 100% 100%
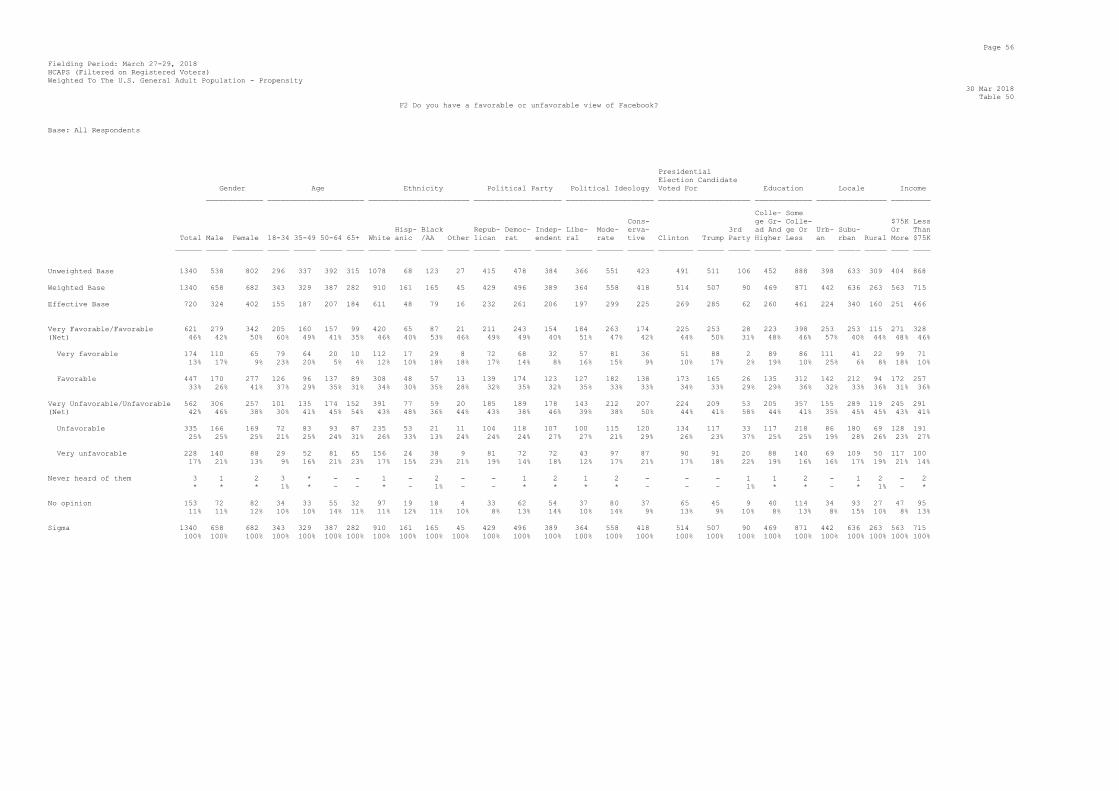
Page 56
Fielding Period: March 27-29, 2018
HCAPS (Filtered on Registered Voters)
Weighted To The U.S. General Adult Population - Propensity
30 Mar 2018
Table 50
F2 Do you have a favorable or unfavorable view of Facebook?
Base: All Respondents
Presidential
Election Candidate
Gender Age Ethnicity Political Party Political Ideology Voted For Education Locale Income
_____________ ______________________ _______________________ ____________________ ____________________ _____________________ _____________ ________________ _________
Colle- Some
Cons- ge Gr- Colle- $75K Less
Hisp- Black Repub- Democ- Indep- Libe- Mode- erva- 3rd ad And ge Or Urb- Subu- Or Than
Total Male Female 18-34 35-49 50-64 65+ White anic /AA Other lican rat endent ral rate tive Clinton Trump Party Higher Less an rban Rural More $75K
______ _____ _______ _____ _____ _____ ____ _____ _____ _____ _____ ______ ______ ______ ______ ______ ______ ________ ______ _____ ______ ______ ____ _____ _____ ____ ____
Unweighted Base 1340 538 802 296 337 392 315 1078 68 123 27 415 478 384 366 551 423 491 511 106 452 888 398 633 309 404 868
Weighted Base 1340 658 682 343 329 387 282 910 161 165 45 429 496 389 364 558 418 514 507 90 469 871 442 636 263 563 715
Effective Base 720 324 402 155 187 207 184 611 48 79 16 232 261 206 197 299 225 269 285 62 260 461 224 340 160 251 466
Very Favorable/Favorable 621 279 342 205 160 157 99 420 65 87 21 211 243 154 184 263 174 225 253 28 223 398 253 253 115 271 328
(Net) 46% 42% 50% 60% 49% 41% 35% 46% 40% 53% 46% 49% 49% 40% 51% 47% 42% 44% 50% 31% 48% 46% 57% 40% 44% 48% 46%
Very favorable 174 110 65 79 64 20 10 112 17 29 8 72 68 32 57 81 36 51 88 2 89 86 111 41 22 99 71
13% 17% 9% 23% 20% 5% 4% 12% 10% 18% 18% 17% 14% 8% 16% 15% 9% 10% 17% 2% 19% 10% 25% 6% 8% 18% 10%
Favorable 447 170 277 126 96 137 89 308 48 57 13 139 174 123 127 182 138 173 165 26 135 312 142 212 94 172 257
33% 26% 41% 37% 29% 35% 31% 34% 30% 35% 28% 32% 35% 32% 35% 33% 33% 34% 33% 29% 29% 36% 32% 33% 36% 31% 36%
Very Unfavorable/Unfavorable 562 306 257 101 135 174 152 391 77 59 20 185 189 178 143 212 207 224 209 53 205 357 155 289 119 245 291
(Net) 42% 46% 38% 30% 41% 45% 54% 43% 48% 36% 44% 43% 38% 46% 39% 38% 50% 44% 41% 58% 44% 41% 35% 45% 45% 43% 41%
Unfavorable 335 166 169 72 83 93 87 235 53 21 11 104 118 107 100 115 120 134 117 33 117 218 86 180 69 128 191
25% 25% 25% 21% 25% 24% 31% 26% 33% 13% 24% 24% 24% 27% 27% 21% 29% 26% 23% 37% 25% 25% 19% 28% 26% 23% 27%
Very unfavorable 228 140 88 29 52 81 65 156 24 38 9 81 72 72 43 97 87 90 91 20 88 140 69 109 50 117 100
17% 21% 13% 9% 16% 21% 23% 17% 15% 23% 21% 19% 14% 18% 12% 17% 21% 17% 18% 22% 19% 16% 16% 17% 19% 21% 14%
Never heard of them 3 1 2 3 * - - 1 - 2 - - 1 2 1 2 - - - 1 1 2 - 1 2 - 2
* * * 1% * - - * - 1% - - * * * * - - - 1% * * - * 1% - *
No opinion 153 72 82 34 33 55 32 97 19 18 4 33 62 54 37 80 37 65 45 9 40 114 34 93 27 47 95
11% 11% 12% 10% 10% 14% 11% 11% 12% 11% 10% 8% 13% 14% 10% 14% 9% 13% 9% 10% 8% 13% 8% 15% 10% 8% 13%
Sigma 1340 658 682 343 329 387 282 910 161 165 45 429 496 389 364 558 418 514 507 90 469 871 442 636 263 563 715
100% 100% 100% 100% 100% 100% 100% 100% 100% 100% 100% 100% 100% 100% 100% 100% 100% 100% 100% 100% 100% 100% 100% 100% 100% 100% 100%

Page 57
Fielding Period: March 27-29, 2018
HCAPS (Filtered on Registered Voters)
Weighted To The U.S. General Adult Population - Propensity
30 Mar 2018
Table 51
I1 What would you say are the most important issues facing the country today? Please select three.
Base: All Respondents
Presidential
Election Candidate
Gender Age Ethnicity Political Party Political Ideology Voted For Education Locale Income
_____________ ______________________ _______________________ ____________________ ____________________ _____________________ _____________ ________________ _________
Colle- Some
Cons- ge Gr- Colle- $75K Less
Hisp- Black Repub- Democ- Indep- Libe- Mode- erva- 3rd ad And ge Or Urb- Subu- Or Than
Total Male Female 18-34 35-49 50-64 65+ White anic /AA Other lican rat endent ral rate tive Clinton Trump Party Higher Less an rban Rural More $75K
______ _____ _______ _____ _____ _____ ____ _____ _____ _____ _____ ______ ______ ______ ______ ______ ______ ________ ______ _____ ______ ______ ____ _____ _____ ____ ____
Unweighted Base 1340 538 802 296 337 392 315 1078 68 123 27 415 478 384 366 551 423 491 511 106 452 888 398 633 309 404 868
Weighted Base 1340 658 682 343 329 387 282 910 161 165 45 429 496 389 364 558 418 514 507 90 469 871 442 636 263 563 715
Effective Base 720 324 402 155 187 207 184 611 48 79 16 232 261 206 197 299 225 269 285 62 260 461 224 340 160 251 466
Health care 402 178 224 95 103 125 79 282 48 45 11 122 169 103 134 151 118 177 134 30 140 262 138 196 68 145 241
30% 27% 33% 28% 31% 32% 28% 31% 30% 27% 24% 29% 34% 26% 37% 27% 28% 34% 26% 33% 30% 30% 31% 31% 26% 26% 34%
Terrorism/national security 343 170 173 75 73 99 97 275 29 26 5 182 75 80 51 120 172 75 196 11 122 222 106 162 75 154 170
26% 26% 25% 22% 22% 26% 34% 30% 18% 16% 11% 42% 15% 21% 14% 22% 41% 14% 39% 13% 26% 25% 24% 26% 29% 27% 24%
Guns 331 140 191 111 81 88 52 196 35 63 12 55 189 78 122 162 47 181 74 10 116 215 122 154 55 126 195
25% 21% 28% 32% 25% 23% 18% 22% 22% 39% 26% 13% 38% 20% 33% 29% 11% 35% 15% 12% 25% 25% 28% 24% 21% 22% 27%
Immigration 311 172 139 89 67 75 80 231 36 22 6 181 58 70 35 115 161 47 203 9 105 206 115 125 70 137 165
23% 26% 20% 26% 20% 19% 29% 25% 23% 13% 13% 42% 12% 18% 10% 21% 39% 9% 40% 9% 22% 24% 26% 20% 27% 24% 23%
Economy and jobs 299 163 135 72 79 84 63 211 37 30 5 93 87 113 66 130 102 94 126 26 104 195 90 149 59 130 158
22% 25% 20% 21% 24% 22% 22% 23% 23% 18% 10% 22% 18% 29% 18% 23% 24% 18% 25% 29% 22% 22% 20% 23% 23% 23% 22%
National debt/ federal 258 156 101 24 59 94 80 203 25 13 11 106 44 100 28 106 123 53 139 33 90 167 59 140 59 127 124
budget deficits 19% 24% 15% 7% 18% 24% 28% 22% 16% 8% 24% 25% 9% 26% 8% 19% 30% 10% 27% 37% 19% 19% 13% 22% 22% 23% 17%
School safety 233 79 154 69 65 62 37 151 36 29 13 71 103 54 50 119 64 86 72 12 58 176 72 114 48 70 156
17% 12% 23% 20% 20% 16% 13% 17% 22% 18% 28% 16% 21% 14% 14% 21% 15% 17% 14% 13% 12% 20% 16% 18% 18% 12% 22%
Crime and drugs 211 89 122 32 59 69 51 144 33 23 3 74 62 72 27 111 73 56 101 11 60 152 64 114 34 84 112
16% 14% 18% 9% 18% 18% 18% 16% 21% 14% 6% 17% 13% 18% 8% 20% 18% 11% 20% 13% 13% 17% 14% 18% 13% 15% 16%
Corruption 200 102 98 43 58 56 43 140 25 16 12 49 75 71 66 79 55 90 64 13 63 137 55 81 64 87 98
15% 15% 14% 13% 18% 14% 15% 15% 16% 10% 27% 11% 15% 18% 18% 14% 13% 18% 13% 14% 13% 16% 13% 13% 24% 15% 14%
Environment/ climate change 173 73 100 56 33 49 35 122 29 11 4 17 93 58 96 54 23 100 23 19 71 102 43 95 34 71 95
13% 11% 15% 16% 10% 13% 12% 13% 18% 7% 8% 4% 19% 15% 26% 10% 6% 19% 5% 21% 15% 12% 10% 15% 13% 13% 13%
Race relations 172 76 96 58 41 48 24 69 17 60 9 34 99 36 64 81 26 99 36 4 38 134 62 71 39 44 109
13% 11% 14% 17% 13% 13% 8% 8% 11% 37% 21% 8% 20% 9% 18% 15% 6% 19% 7% 4% 8% 15% 14% 11% 15% 8% 15%
Cybersecurity 165 89 76 34 38 46 46 133 10 10 8 50 56 57 43 78 43 71 55 13 71 94 59 79 27 89 68
12% 13% 11% 10% 12% 12% 16% 15% 6% 6% 17% 12% 11% 15% 12% 14% 10% 14% 11% 14% 15% 11% 13% 12% 10% 16% 9%
Education 148 78 70 51 45 29 23 98 19 18 9 31 61 51 64 57 27 80 31 14 70 78 48 67 33 70 75
11% 12% 10% 15% 14% 7% 8% 11% 12% 11% 20% 7% 12% 13% 17% 10% 7% 16% 6% 16% 15% 9% 11% 11% 12% 12% 10%

Page 58
Fielding Period: March 27-29, 2018
HCAPS (Filtered on Registered Voters)
Weighted To The U.S. General Adult Population - Propensity
30 Mar 2018
Table 51
I1 What would you say are the most important issues facing the country today? Please select three.
Base: All Respondents
Presidential
Election Candidate
Gender Age Ethnicity Political Party Political Ideology Voted For Education Locale Income
_____________ ______________________ _______________________ ____________________ ____________________ _____________________ _____________ ________________ _________
Colle- Some
Cons- ge Gr- Colle- $75K Less
Hisp- Black Repub- Democ- Indep- Libe- Mode- erva- 3rd ad And ge Or Urb- Subu- Or Than
Total Male Female 18-34 35-49 50-64 65+ White anic /AA Other lican rat endent ral rate tive Clinton Trump Party Higher Less an rban Rural More $75K
______ _____ _______ _____ _____ _____ ____ _____ _____ _____ _____ ______ ______ ______ ______ ______ ______ ________ ______ _____ ______ ______ ____ _____ _____ ____ ____
Weighted Base 1340 658 682 343 329 387 282 910 161 165 45 429 496 389 364 558 418 514 507 90 469 871 442 636 263 563 715
Taxes 138 61 76 41 39 41 17 82 28 19 2 50 52 33 32 50 56 42 55 18 36 101 47 63 27 66 70
10% 9% 11% 12% 12% 10% 6% 9% 18% 11% 5% 12% 10% 8% 9% 9% 13% 8% 11% 20% 8% 12% 11% 10% 10% 12% 10%
Income inequality 131 70 61 36 44 36 16 71 17 27 9 7 68 52 67 57 7 91 9 10 59 72 59 61 11 62 67
10% 11% 9% 10% 13% 9% 5% 8% 10% 16% 19% 2% 14% 13% 18% 10% 2% 18% 2% 11% 13% 8% 13% 10% 4% 11% 9%
Criminal justice (policing, 115 60 55 46 21 38 9 53 15 29 8 22 55 37 25 69 21 44 38 5 37 78 43 52 20 38 71
courts, prisons) 9% 9% 8% 14% 6% 10% 3% 6% 10% 18% 18% 5% 11% 9% 7% 12% 5% 9% 7% 5% 8% 9% 10% 8% 8% 7% 10%
Defense 107 64 44 20 24 36 27 87 10 8 2 58 31 17 29 30 48 27 68 4 52 55 41 48 18 62 41
8% 10% 6% 6% 7% 9% 10% 10% 6% 5% 5% 14% 6% 4% 8% 5% 11% 5% 13% 5% 11% 6% 9% 8% 7% 11% 6%
Foreign policy 93 53 41 29 15 31 18 54 13 7 3 27 33 30 27 36 30 44 27 15 49 44 45 41 7 41 44
7% 8% 6% 9% 5% 8% 6% 6% 8% 4% 8% 6% 7% 8% 7% 6% 7% 9% 5% 17% 10% 5% 10% 6% 3% 7% 6%
Political correctness 86 73 13 14 20 25 27 69 7 7 2 45 18 22 20 21 45 21 52 5 31 55 24 45 17 51 27
6% 11% 2% 4% 6% 6% 9% 8% 4% 4% 4% 11% 4% 6% 5% 4% 11% 4% 10% 6% 7% 6% 5% 7% 7% 9% 4%
Women's rights 68 11 57 27 18 18 5 35 12 19 1 3 50 15 36 30 2 47 7 2 22 46 24 30 13 19 43
5% 2% 8% 8% 5% 5% 2% 4% 7% 11% 2% 1% 10% 4% 10% 5% 1% 9% 1% 2% 5% 5% 6% 5% 5% 3% 6%
Other 37 18 19 7 3 11 16 23 1 12 2 9 8 17 11 18 8 16 9 7 15 22 10 19 8 18 16
3% 3% 3% 2% 1% 3% 6% 3% 1% 7% 3% 2% 2% 4% 3% 3% 2% 3% 2% 7% 3% 3% 2% 3% 3% 3% 2%
Sigma 4020 1974 2046 1028 986 1160 846 2730 483 494 135 1286 1487 1166 1093 1673 1254 1542 1520 271 1407 2613 1325 1908 788 1689 2146
300% 300% 300% 300% 300% 300% 300% 300% 300% 300% 300% 300% 300% 300% 300% 300% 300% 300% 300% 300% 300% 300% 300% 300% 300% 300% 300%

Page 59
Fielding Period: March 27-29, 2018
HCAPS (Filtered on Registered Voters)
Weighted To The U.S. General Adult Population - Propensity
30 Mar 2018
Table 52
IM11 Would you favor or oppose a congressional deal that gives undocumented immigrants brought here by their parents work permits and a path to
citizenship in exchange for increasing merit preference over preference for relatives, eliminating the diversity visa lottery, and
funding barrier security on the U.S.-Mexico border?
Base: All Respondents
Presidential
Election Candidate
Gender Age Ethnicity Political Party Political Ideology Voted For Education Locale Income
_____________ ______________________ _______________________ ____________________ ____________________ _____________________ _____________ ________________ _________
Colle- Some
Cons- ge Gr- Colle- $75K Less
Hisp- Black Repub- Democ- Indep- Libe- Mode- erva- 3rd ad And ge Or Urb- Subu- Or Than
Total Male Female 18-34 35-49 50-64 65+ White anic /AA Other lican rat endent ral rate tive Clinton Trump Party Higher Less an rban Rural More $75K
______ _____ _______ _____ _____ _____ ____ _____ _____ _____ _____ ______ ______ ______ ______ ______ ______ ________ ______ _____ ______ ______ ____ _____ _____ ____ ____
Unweighted Base 1340 538 802 296 337 392 315 1078 68 123 27 415 478 384 366 551 423 491 511 106 452 888 398 633 309 404 868
Weighted Base 1340 658 682 343 329 387 282 910 161 165 45 429 496 389 364 558 418 514 507 90 469 871 442 636 263 563 715
Effective Base 720 324 402 155 187 207 184 611 48 79 16 232 261 206 197 299 225 269 285 62 260 461 224 340 160 251 466
Favor 868 430 438 239 207 235 186 593 106 107 30 298 301 251 218 381 269 312 347 62 337 531 294 436 138 375 452
65% 65% 64% 70% 63% 61% 66% 65% 66% 65% 68% 70% 61% 65% 60% 68% 64% 61% 69% 69% 72% 61% 67% 69% 53% 67% 63%
Oppose 472 228 244 103 121 152 96 317 55 58 14 131 195 138 147 176 149 202 159 28 132 340 147 200 125 187 264
35% 35% 36% 30% 37% 39% 34% 35% 34% 35% 32% 30% 39% 35% 40% 32% 36% 39% 31% 31% 28% 39% 33% 31% 47% 33% 37%
Sigma 1340 658 682 343 329 387 282 910 161 165 45 429 496 389 364 558 418 514 507 90 469 871 442 636 263 563 715
100% 100% 100% 100% 100% 100% 100% 100% 100% 100% 100% 100% 100% 100% 100% 100% 100% 100% 100% 100% 100% 100% 100% 100% 100% 100% 100%

Page 60
Fielding Period: March 27-29, 2018
HCAPS (Filtered on Registered Voters)
Weighted To The U.S. General Adult Population - Propensity
30 Mar 2018
Table 53
IM15 California recently passed laws that forbid local law enforcement to cooperate with immigration authorities and made it
illegal for employers to call immigration authorities. Do you favor or oppose the California law?
Base: All Respondents
Presidential
Election Candidate
Gender Age Ethnicity Political Party Political Ideology Voted For Education Locale Income
_____________ ______________________ _______________________ ____________________ ____________________ _____________________ _____________ ________________ _________
Colle- Some
Cons- ge Gr- Colle- $75K Less
Hisp- Black Repub- Democ- Indep- Libe- Mode- erva- 3rd ad And ge Or Urb- Subu- Or Than
Total Male Female 18-34 35-49 50-64 65+ White anic /AA Other lican rat endent ral rate tive Clinton Trump Party Higher Less an rban Rural More $75K
______ _____ _______ _____ _____ _____ ____ _____ _____ _____ _____ ______ ______ ______ ______ ______ ______ ________ ______ _____ ______ ______ ____ _____ _____ ____ ____
Unweighted Base 1340 538 802 296 337 392 315 1078 68 123 27 415 478 384 366 551 423 491 511 106 452 888 398 633 309 404 868
Weighted Base 1340 658 682 343 329 387 282 910 161 165 45 429 496 389 364 558 418 514 507 90 469 871 442 636 263 563 715
Effective Base 720 324 402 155 187 207 184 611 48 79 16 232 261 206 197 299 225 269 285 62 260 461 224 340 160 251 466
Favor 635 298 338 218 170 149 98 363 98 119 25 111 345 167 283 263 89 375 126 35 258 378 264 277 94 266 343
47% 45% 49% 64% 52% 39% 35% 40% 61% 72% 55% 26% 69% 43% 78% 47% 21% 73% 25% 39% 55% 43% 60% 44% 36% 47% 48%
Oppose 705 360 344 124 159 238 184 546 63 46 20 318 151 221 81 294 329 139 381 56 212 493 177 359 169 297 372
53% 55% 51% 36% 48% 61% 65% 60% 39% 28% 45% 74% 31% 57% 22% 53% 79% 27% 75% 61% 45% 57% 40% 56% 64% 53% 52%
Sigma 1340 658 682 343 329 387 282 910 161 165 45 429 496 389 364 558 418 514 507 90 469 871 442 636 263 563 715
100% 100% 100% 100% 100% 100% 100% 100% 100% 100% 100% 100% 100% 100% 100% 100% 100% 100% 100% 100% 100% 100% 100% 100% 100% 100% 100%

Page 61
Fielding Period: March 27-29, 2018
HCAPS (Filtered on Registered Voters)
Weighted To The U.S. General Adult Population - Propensity
30 Mar 2018
Table 54
SB1 Do you favor or oppose the $1.3 trillion omnibus spending bill that passed Congress increasing both domestic and
military spending?
Base: All Respondents
Presidential
Election Candidate
Gender Age Ethnicity Political Party Political Ideology Voted For Education Locale Income
_____________ ______________________ _______________________ ____________________ ____________________ _____________________ _____________ ________________ _________
Colle- Some
Cons- ge Gr- Colle- $75K Less
Hisp- Black Repub- Democ- Indep- Libe- Mode- erva- 3rd ad And ge Or Urb- Subu- Or Than
Total Male Female 18-34 35-49 50-64 65+ White anic /AA Other lican rat endent ral rate tive Clinton Trump Party Higher Less an rban Rural More $75K
______ _____ _______ _____ _____ _____ ____ _____ _____ _____ _____ ______ ______ ______ ______ ______ ______ ________ ______ _____ ______ ______ ____ _____ _____ ____ ____
Unweighted Base 1340 538 802 296 337 392 315 1078 68 123 27 415 478 384 366 551 423 491 511 106 452 888 398 633 309 404 868
Weighted Base 1340 658 682 343 329 387 282 910 161 165 45 429 496 389 364 558 418 514 507 90 469 871 442 636 263 563 715
Effective Base 720 324 402 155 187 207 184 611 48 79 16 232 261 206 197 299 225 269 285 62 260 461 224 340 160 251 466
Favor 637 324 312 149 150 203 134 461 77 59 14 284 184 161 129 262 245 173 329 34 232 405 223 282 131 282 327
48% 49% 46% 44% 46% 53% 47% 51% 48% 36% 31% 66% 37% 41% 36% 47% 59% 34% 65% 38% 49% 47% 51% 44% 50% 50% 46%
Oppose 703 334 370 193 178 184 149 449 85 106 31 145 312 228 235 296 173 341 178 56 238 466 218 353 132 281 389
52% 51% 54% 56% 54% 47% 53% 49% 52% 64% 69% 34% 63% 59% 64% 53% 41% 66% 35% 62% 51% 53% 49% 56% 50% 50% 54%
Sigma 1340 658 682 343 329 387 282 910 161 165 45 429 496 389 364 558 418 514 507 90 469 871 442 636 263 563 715
100% 100% 100% 100% 100% 100% 100% 100% 100% 100% 100% 100% 100% 100% 100% 100% 100% 100% 100% 100% 100% 100% 100% 100% 100% 100% 100%

Page 62
Fielding Period: March 27-29, 2018
HCAPS (Filtered on Registered Voters)
Weighted To The U.S. General Adult Population - Propensity
30 Mar 2018
Table 55
SB2 Do you think President Trump was right to sign it or should he have vetoed it, even if it shut down the government?
Base: All Respondents
Presidential
Election Candidate
Gender Age Ethnicity Political Party Political Ideology Voted For Education Locale Income
_____________ ______________________ _______________________ ____________________ ____________________ _____________________ _____________ ________________ _________
Colle- Some
Cons- ge Gr- Colle- $75K Less
Hisp- Black Repub- Democ- Indep- Libe- Mode- erva- 3rd ad And ge Or Urb- Subu- Or Than
Total Male Female 18-34 35-49 50-64 65+ White anic /AA Other lican rat endent ral rate tive Clinton Trump Party Higher Less an rban Rural More $75K
______ _____ _______ _____ _____ _____ ____ _____ _____ _____ _____ ______ ______ ______ ______ ______ ______ ________ ______ _____ ______ ______ ____ _____ _____ ____ ____
Unweighted Base 1340 538 802 296 337 392 315 1078 68 123 27 415 478 384 366 551 423 491 511 106 452 888 398 633 309 404 868
Weighted Base 1340 658 682 343 329 387 282 910 161 165 45 429 496 389 364 558 418 514 507 90 469 871 442 636 263 563 715
Effective Base 720 324 402 155 187 207 184 611 48 79 16 232 261 206 197 299 225 269 285 62 260 461 224 340 160 251 466
Right to sign it 754 391 363 177 184 222 171 556 76 76 15 308 237 199 199 291 265 254 354 44 296 458 245 349 160 337 380
56% 59% 53% 52% 56% 58% 61% 61% 47% 46% 32% 72% 48% 51% 55% 52% 63% 49% 70% 49% 63% 53% 56% 55% 61% 60% 53%
Should have vetoed it 586 267 319 166 145 164 111 354 85 88 30 121 259 190 166 267 153 260 153 47 173 413 196 287 102 226 336
44% 41% 47% 48% 44% 42% 39% 39% 53% 54% 68% 28% 52% 49% 45% 48% 37% 51% 30% 51% 37% 47% 44% 45% 39% 40% 47%
Sigma 1340 658 682 343 329 387 282 910 161 165 45 429 496 389 364 558 418 514 507 90 469 871 442 636 263 563 715
100% 100% 100% 100% 100% 100% 100% 100% 100% 100% 100% 100% 100% 100% 100% 100% 100% 100% 100% 100% 100% 100% 100% 100% 100% 100% 100%

Page 249
Fielding Period: March 27-29, 2018
HCAPS (Filtered on Registered Voters)
Weighted To The U.S. General Adult Population - Propensity
30 Mar 2018
Table 239
Q398_2 Next, we have a few employment and economic questions.
Are you employed part time for pay with an organization or company?
Base: Ask Sequential Employment
Presidential
Election Candidate
Gender Age Ethnicity Political Party Political Ideology Voted For Education Locale Income
_____________ ______________________ _______________________ ____________________ ____________________ _____________________ _____________ ________________ _________
Colle- Some
Cons- ge Gr- Colle- $75K Less
Hisp- Black Repub- Democ- Indep- Libe- Mode- erva- 3rd ad And ge Or Urb- Subu- Or Than
Total Male Female 18-34 35-49 50-64 65+ White anic /AA Other lican rat endent ral rate tive Clinton Trump Party Higher Less an rban Rural More $75K
______ _____ _______ _____ _____ _____ ____ _____ _____ _____ _____ ______ ______ ______ ______ ______ ______ ________ ______ _____ ______ ______ ____ _____ _____ ____ ____
Unweighted Base 1340 538 802 296 337 392 315 1078 68 123 27 415 478 384 366 551 423 491 511 106 452 888 398 633 309 404 868
Weighted Base 1340 658 682 343 329 387 282 910 161 165 45 429 496 389 364 558 418 514 507 90 469 871 442 636 263 563 715
Effective Base 720 324 402 155 187 207 184 611 48 79 16 232 261 206 197 299 225 269 285 62 260 461 224 340 160 251 466
Yes 185 60 125 73 37 43 32 109 27 36 6 50 79 52 54 93 39 72 53 11 52 133 51 104 30 52 120
14% 9% 18% 21% 11% 11% 11% 12% 17% 22% 12% 12% 16% 13% 15% 17% 9% 14% 10% 13% 11% 15% 12% 16% 11% 9% 17%
No 1155 598 557 270 291 343 250 801 134 129 39 379 417 336 310 465 379 442 454 79 417 738 390 532 233 511 595
86% 91% 82% 79% 89% 89% 89% 88% 83% 78% 88% 88% 84% 87% 85% 83% 91% 86% 90% 87% 89% 85% 88% 84% 89% 91% 83%
Sigma 1340 658 682 343 329 387 282 910 161 165 45 429 496 389 364 558 418 514 507 90 469 871 442 636 263 563 715
100% 100% 100% 100% 100% 100% 100% 100% 100% 100% 100% 100% 100% 100% 100% 100% 100% 100% 100% 100% 100% 100% 100% 100% 100% 100% 100%
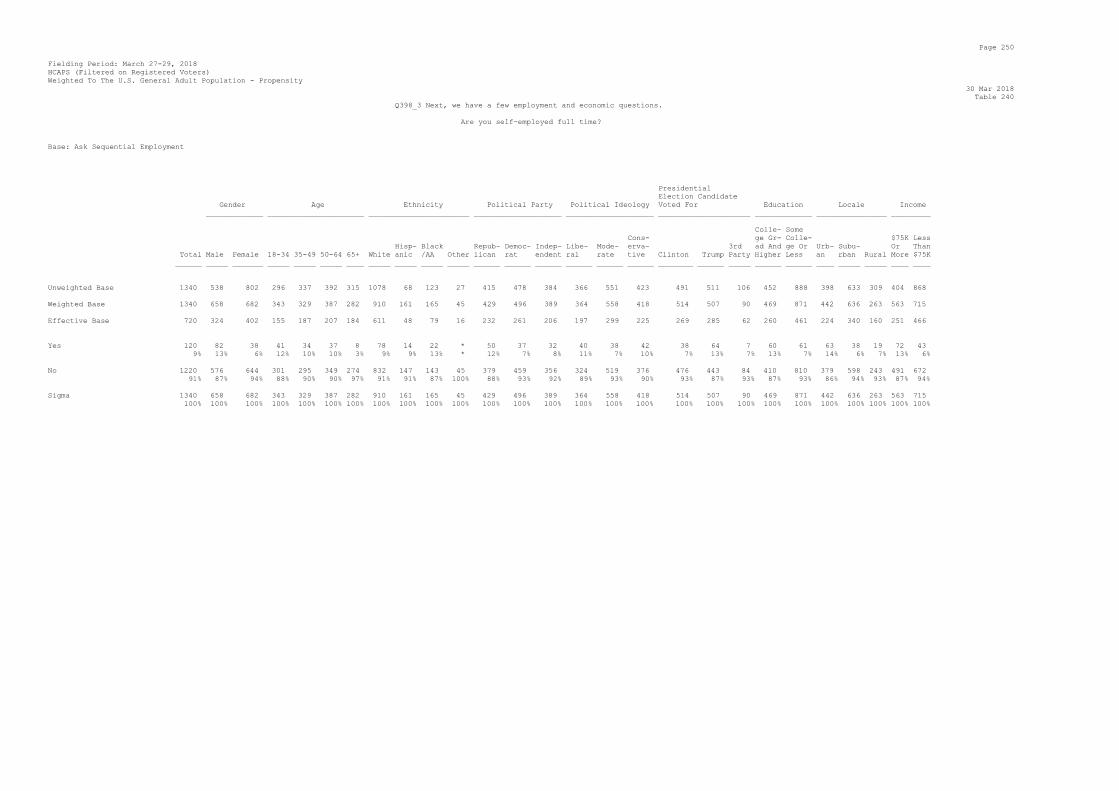
Page 250
Fielding Period: March 27-29, 2018
HCAPS (Filtered on Registered Voters)
Weighted To The U.S. General Adult Population - Propensity
30 Mar 2018
Table 240
Q398_3 Next, we have a few employment and economic questions.
Are you self-employed full time?
Base: Ask Sequential Employment
Presidential
Election Candidate
Gender Age Ethnicity Political Party Political Ideology Voted For Education Locale Income
_____________ ______________________ _______________________ ____________________ ____________________ _____________________ _____________ ________________ _________
Colle- Some
Cons- ge Gr- Colle- $75K Less
Hisp- Black Repub- Democ- Indep- Libe- Mode- erva- 3rd ad And ge Or Urb- Subu- Or Than
Total Male Female 18-34 35-49 50-64 65+ White anic /AA Other lican rat endent ral rate tive Clinton Trump Party Higher Less an rban Rural More $75K
______ _____ _______ _____ _____ _____ ____ _____ _____ _____ _____ ______ ______ ______ ______ ______ ______ ________ ______ _____ ______ ______ ____ _____ _____ ____ ____
Unweighted Base 1340 538 802 296 337 392 315 1078 68 123 27 415 478 384 366 551 423 491 511 106 452 888 398 633 309 404 868
Weighted Base 1340 658 682 343 329 387 282 910 161 165 45 429 496 389 364 558 418 514 507 90 469 871 442 636 263 563 715
Effective Base 720 324 402 155 187 207 184 611 48 79 16 232 261 206 197 299 225 269 285 62 260 461 224 340 160 251 466
Yes 120 82 38 41 34 37 8 78 14 22 * 50 37 32 40 38 42 38 64 7 60 61 63 38 19 72 43
9% 13% 6% 12% 10% 10% 3% 9% 9% 13% * 12% 7% 8% 11% 7% 10% 7% 13% 7% 13% 7% 14% 6% 7% 13% 6%
No 1220 576 644 301 295 349 274 832 147 143 45 379 459 356 324 519 376 476 443 84 410 810 379 598 243 491 672
91% 87% 94% 88% 90% 90% 97% 91% 91% 87% 100% 88% 93% 92% 89% 93% 90% 93% 87% 93% 87% 93% 86% 94% 93% 87% 94%
Sigma 1340 658 682 343 329 387 282 910 161 165 45 429 496 389 364 558 418 514 507 90 469 871 442 636 263 563 715
100% 100% 100% 100% 100% 100% 100% 100% 100% 100% 100% 100% 100% 100% 100% 100% 100% 100% 100% 100% 100% 100% 100% 100% 100% 100% 100%

Page 251
Fielding Period: March 27-29, 2018
HCAPS (Filtered on Registered Voters)
Weighted To The U.S. General Adult Population - Propensity
30 Mar 2018
Table 241
Q398_4 Next, we have a few employment and economic questions.
Are you self-employed part time?
Base: Ask Sequential Employment
Presidential
Election Candidate
Gender Age Ethnicity Political Party Political Ideology Voted For Education Locale Income
_____________ ______________________ _______________________ ____________________ ____________________ _____________________ _____________ ________________ _________
Colle- Some
Cons- ge Gr- Colle- $75K Less
Hisp- Black Repub- Democ- Indep- Libe- Mode- erva- 3rd ad And ge Or Urb- Subu- Or Than
Total Male Female 18-34 35-49 50-64 65+ White anic /AA Other lican rat endent ral rate tive Clinton Trump Party Higher Less an rban Rural More $75K
______ _____ _______ _____ _____ _____ ____ _____ _____ _____ _____ ______ ______ ______ ______ ______ ______ ________ ______ _____ ______ ______ ____ _____ _____ ____ ____
Unweighted Base 1340 538 802 296 337 392 315 1078 68 123 27 415 478 384 366 551 423 491 511 106 452 888 398 633 309 404 868
Weighted Base 1340 658 682 343 329 387 282 910 161 165 45 429 496 389 364 558 418 514 507 90 469 871 442 636 263 563 715
Effective Base 720 324 402 155 187 207 184 611 48 79 16 232 261 206 197 299 225 269 285 62 260 461 224 340 160 251 466
Yes 87 46 41 22 16 37 13 62 10 11 1 23 34 28 20 35 32 25 32 9 36 51 25 46 16 40 43
6% 7% 6% 6% 5% 9% 5% 7% 6% 7% 2% 5% 7% 7% 5% 6% 8% 5% 6% 10% 8% 6% 6% 7% 6% 7% 6%
No 1253 612 641 321 313 350 269 848 151 154 44 406 461 360 345 522 386 489 475 81 433 820 417 590 246 523 672
94% 93% 94% 94% 95% 91% 95% 93% 94% 93% 98% 95% 93% 93% 95% 94% 92% 95% 94% 90% 92% 94% 94% 93% 94% 93% 94%
Sigma 1340 658 682 343 329 387 282 910 161 165 45 429 496 389 364 558 418 514 507 90 469 871 442 636 263 563 715
100% 100% 100% 100% 100% 100% 100% 100% 100% 100% 100% 100% 100% 100% 100% 100% 100% 100% 100% 100% 100% 100% 100% 100% 100% 100% 100%

Page 252
Fielding Period: March 27-29, 2018
HCAPS (Filtered on Registered Voters)
Weighted To The U.S. General Adult Population - Propensity
30 Mar 2018
Table 242
Q402 Which of the following best describes your current situation?
Base: Not At All Employed
Presidential
Election Candidate
Gender Age Ethnicity Political Party Political Ideology Voted For Education Locale Income
_____________ ______________________ _______________________ ____________________ ____________________ _____________________ _____________ ________________ _________
Colle- Some
Cons- ge Gr- Colle- $75K Less
Hisp- Black Repub- Democ- Indep- Libe- Mode- erva- 3rd ad And ge Or Urb- Subu- Or Than
Total Male Female 18-34 35-49 50-64 65+ White anic /AA Other lican rat endent ral rate tive Clinton Trump Party Higher Less an rban Rural More $75K
______ _____ _______ _____ _____ _____ ____ _____ _____ _____ _____ ______ ______ ______ ______ ______ ______ ________ ______ _____ ______ ______ ____ _____ _____ ____ ____
Unweighted Base 619 222 397 78 95 188 258 511 32 45 13 200 207 182 150 259 210 213 246 41 131 488 149 301 169 110 466
Weighted Base 475 195 281 82 70 117 207 326 68 42 15 147 186 130 129 190 156 164 177 27 90 385 125 242 108 119 324
Effective Base 304 114 192 35 47 93 144 278 23 27 7 105 98 98 70 129 108 108 122 26 75 234 74 151 82 56 247
Looking for work 82 27 55 27 34 20 2 30 26 13 1 18 30 29 24 45 13 21 21 3 7 75 33 37 12 20 58
17% 14% 20% 32% 49% 17% 1% 9% 39% 32% 10% 12% 16% 22% 18% 24% 8% 13% 12% 10% 8% 19% 26% 15% 11% 17% 18%
Not looking for work 289 124 166 39 17 53 180 226 26 21 8 97 115 73 76 104 109 112 115 20 71 219 62 162 66 87 176
61% 64% 59% 48% 25% 45% 87% 69% 38% 50% 56% 66% 62% 56% 59% 55% 70% 68% 65% 73% 79% 57% 49% 67% 61% 73% 54%
Unable to work due to a 104 44 60 16 19 44 25 70 15 7 5 32 40 29 29 41 34 32 41 5 12 92 30 43 30 12 90
disability or illness 22% 23% 21% 19% 27% 38% 12% 22% 23% 18% 34% 22% 22% 22% 23% 21% 22% 19% 23% 17% 14% 24% 24% 18% 28% 10% 28%
Sigma 475 195 281 82 70 117 207 326 68 42 15 147 186 130 129 190 156 164 177 27 90 385 125 242 108 119 324
100% 100% 100% 100% 100% 100% 100% 100% 100% 100% 100% 100% 100% 100% 100% 100% 100% 100% 100% 100% 100% 100% 100% 100% 100% 100% 100%

Page 253
Fielding Period: March 27-29, 2018
HCAPS (Filtered on Registered Voters)
Weighted To The U.S. General Adult Population - Propensity
30 Mar 2018
Table 243
Q404 Do any of the following describe you? Please select all that apply.
Base: Ask Sequential Employment
Presidential
Election Candidate
Gender Age Ethnicity Political Party Political Ideology Voted For Education Locale Income
_____________ ______________________ _______________________ ____________________ ____________________ _____________________ _____________ ________________ _________
Colle- Some
Cons- ge Gr- Colle- $75K Less
Hisp- Black Repub- Democ- Indep- Libe- Mode- erva- 3rd ad And ge Or Urb- Subu- Or Than
Total Male Female 18-34 35-49 50-64 65+ White anic /AA Other lican rat endent ral rate tive Clinton Trump Party Higher Less an rban Rural More $75K
______ _____ _______ _____ _____ _____ ____ _____ _____ _____ _____ ______ ______ ______ ______ ______ ______ ________ ______ _____ ______ ______ ____ _____ _____ ____ ____
Unweighted Base 1340 538 802 296 337 392 315 1078 68 123 27 415 478 384 366 551 423 491 511 106 452 888 398 633 309 404 868
Weighted Base 1340 658 682 343 329 387 282 910 161 165 45 429 496 389 364 558 418 514 507 90 469 871 442 636 263 563 715
Effective Base 720 324 402 155 187 207 184 611 48 79 16 232 261 206 197 299 225 269 285 62 260 461 224 340 160 251 466
Retired and collecting 302 163 139 4 7 72 219 246 24 25 4 111 112 75 77 98 128 118 141 20 88 214 74 160 68 119 160
retirement benefits/pension 23% 25% 20% 1% 2% 19% 78% 27% 15% 15% 9% 26% 23% 19% 21% 18% 31% 23% 28% 22% 19% 25% 17% 25% 26% 21% 22%
A stay-at-home spouse or 117 33 84 43 36 32 5 80 17 11 3 43 42 29 28 45 43 37 48 9 22 95 38 48 31 28 84
partner 9% 5% 12% 13% 11% 8% 2% 9% 10% 7% 7% 10% 8% 8% 8% 8% 10% 7% 9% 10% 5% 11% 9% 8% 12% 5% 12%
A student 91 35 57 76 10 6 - 29 28 16 8 16 45 28 25 49 18 34 5 7 16 76 32 42 18 18 61
7% 5% 8% 22% 3% 2% - 3% 18% 10% 17% 4% 9% 7% 7% 9% 4% 7% 1% 8% 3% 9% 7% 7% 7% 3% 8%
None of these 836 431 405 222 276 279 60 560 92 113 30 263 298 256 235 368 232 327 317 57 345 491 300 389 148 399 415
62% 65% 59% 65% 84% 72% 21% 62% 57% 69% 67% 61% 60% 66% 65% 66% 56% 64% 62% 63% 74% 56% 68% 61% 56% 71% 58%
Sigma 1347 661 686 345 329 389 284 915 161 166 45 433 498 389 366 560 421 516 510 92 471 876 444 639 264 565 720
101% 100% 101% 101% 100% 101% 101% 101% 100% 101% 100% 101% 100% 100% 100% 100% 101% 100% 101% 101% 100% 101% 101% 100% 101% 100% 101%

Page 254
Fielding Period: March 27-29, 2018
HCAPS (Filtered on Registered Voters)
Weighted To The U.S. General Adult Population - Propensity
30 Mar 2018
Table 244
Q406 What is your employment status?
Base: All Respondents
Presidential
Election Candidate
Gender Age Ethnicity Political Party Political Ideology Voted For Education Locale Income
_____________ ______________________ _______________________ ____________________ ____________________ _____________________ _____________ ________________ _________
Colle- Some
Cons- ge Gr- Colle- $75K Less
Hisp- Black Repub- Democ- Indep- Libe- Mode- erva- 3rd ad And ge Or Urb- Subu- Or Than
Total Male Female 18-34 35-49 50-64 65+ White anic /AA Other lican rat endent ral rate tive Clinton Trump Party Higher Less an rban Rural More $75K
______ _____ _______ _____ _____ _____ ____ _____ _____ _____ _____ ______ ______ ______ ______ ______ ______ ________ ______ _____ ______ ______ ____ _____ _____ ____ ____
Unweighted Base 1340 538 802 296 337 392 315 1078 68 123 27 415 478 384 366 551 423 491 511 106 452 888 398 633 309 404 868
Weighted Base 1340 658 682 343 329 387 282 910 161 165 45 429 496 389 364 558 418 514 507 90 469 871 442 636 263 563 715
Effective Base 720 324 402 155 187 207 184 611 48 79 16 232 261 206 197 299 225 269 285 62 260 461 224 340 160 251 466
Employed full time 686 400 286 204 230 214 38 469 69 93 25 240 230 204 186 276 225 283 277 49 330 356 270 292 124 383 287
51% 61% 42% 59% 70% 55% 13% 52% 43% 57% 55% 56% 46% 53% 51% 49% 54% 55% 55% 55% 70% 41% 61% 46% 47% 68% 40%
Employed part time 245 94 150 82 49 72 41 158 30 41 7 64 100 76 67 119 60 91 79 18 75 170 66 139 40 82 149
18% 14% 22% 24% 15% 19% 15% 17% 18% 25% 15% 15% 20% 19% 18% 21% 14% 18% 16% 20% 16% 20% 15% 22% 15% 15% 21%
Self-employed full time 120 82 38 41 34 37 8 78 14 22 * 50 37 32 40 38 42 38 64 7 60 61 63 38 19 72 43
9% 13% 6% 12% 10% 10% 3% 9% 9% 13% * 12% 7% 8% 11% 7% 10% 7% 13% 7% 13% 7% 14% 6% 7% 13% 6%
Not employed, but looking 82 27 55 27 34 20 2 30 26 13 1 18 30 29 24 45 13 21 21 3 7 75 33 37 12 20 58
for work 6% 4% 8% 8% 10% 5% 1% 3% 16% 8% 3% 4% 6% 7% 6% 8% 3% 4% 4% 3% 2% 9% 7% 6% 5% 4% 8%
Not employed and not looking 289 124 166 39 17 53 180 226 26 21 8 97 115 73 76 104 109 112 115 20 71 219 62 162 66 87 176
for work 22% 19% 24% 12% 5% 14% 64% 25% 16% 13% 18% 23% 23% 19% 21% 19% 26% 22% 23% 22% 15% 25% 14% 26% 25% 15% 25%
Not employed, unable to work 104 44 60 16 19 44 25 70 15 7 5 32 40 29 29 41 34 32 41 5 12 92 30 43 30 12 90
due to a disability or 8% 7% 9% 5% 6% 11% 9% 8% 10% 5% 11% 7% 8% 7% 8% 7% 8% 6% 8% 5% 3% 11% 7% 7% 12% 2% 13%
illness
Retired 302 163 139 4 7 72 219 246 24 25 4 111 112 75 77 98 128 118 141 20 88 214 74 160 68 119 160
23% 25% 20% 1% 2% 19% 78% 27% 15% 15% 9% 26% 23% 19% 21% 18% 31% 23% 28% 22% 19% 25% 17% 25% 26% 21% 22%
Student 91 35 57 76 10 6 - 29 28 16 8 16 45 28 25 49 18 34 5 7 16 76 32 42 18 18 61
7% 5% 8% 22% 3% 2% - 3% 18% 10% 17% 4% 9% 7% 7% 9% 4% 7% 1% 8% 3% 9% 7% 7% 7% 3% 8%
Stay-at-home spouse or 117 33 84 43 36 32 5 80 17 11 3 43 42 29 28 45 43 37 48 9 22 95 38 48 31 28 84
partner 9% 5% 12% 13% 11% 8% 2% 9% 10% 7% 7% 10% 8% 8% 8% 8% 10% 7% 9% 10% 5% 11% 9% 8% 12% 5% 12%
Self-employed part time 87 46 41 22 16 37 13 62 10 11 1 23 34 28 20 35 32 25 32 9 36 51 25 46 16 40 43
6% 7% 6% 6% 5% 9% 5% 7% 6% 7% 2% 5% 7% 7% 5% 6% 8% 5% 6% 10% 8% 6% 6% 7% 6% 7% 6%
Sigma 2124 1047 1077 554 451 588 531 1448 260 261 62 694 787 604 571 850 703 790 822 145 716 1408 693 1007 424 862 1151
158% 159% 158% 162% 137% 152% 188% 159% 161% 158% 138% 162% 159% 155% 157% 152% 168% 154% 162% 160% 153% 162% 157% 158% 161% 153% 161%

Page 255
Fielding Period: March 27-29, 2018
HCAPS (Filtered on Registered Voters)
Weighted To The U.S. General Adult Population - Propensity
30 Mar 2018
Table 245
Q410 Which one of the following best describes your employment status?
Base: 18 Years Old Or Older And (Single Employment Item Selected And More Than 1 Valid Code From Q406)
Presidential
Election Candidate
Gender Age Ethnicity Political Party Political Ideology Voted For Education Locale Income
_____________ ______________________ _______________________ ____________________ ____________________ _____________________ _____________ ________________ _________
Colle- Some
Cons- ge Gr- Colle- $75K Less
Hisp- Black Repub- Democ- Indep- Libe- Mode- erva- 3rd ad And ge Or Urb- Subu- Or Than
Total Male Female 18-34 35-49 50-64 65+ White anic /AA Other lican rat endent ral rate tive Clinton Trump Party Higher Less an rban Rural More $75K
______ _____ _______ _____ _____ _____ ____ _____ _____ _____ _____ ______ ______ ______ ______ ______ ______ ________ ______ _____ ______ ______ ____ _____ _____ ____ ____
Unweighted Base 1340 538 802 296 337 392 315 1078 68 123 27 415 478 384 366 551 423 491 511 106 452 888 398 633 309 404 868
Weighted Base 1340 658 682 343 329 387 282 910 161 165 45 429 496 389 364 558 418 514 507 90 469 871 442 636 263 563 715
Effective Base 720 324 402 155 187 207 184 611 48 79 16 232 261 206 197 299 225 269 285 62 260 461 224 340 160 251 466
Employed full time 628 365 263 195 220 181 32 429 60 83 24 217 217 183 175 261 192 265 251 47 314 314 253 265 110 357 260
47% 55% 39% 57% 67% 47% 11% 47% 37% 50% 55% 51% 44% 47% 48% 47% 46% 52% 49% 52% 67% 36% 57% 42% 42% 63% 36%
Employed part time 119 40 79 31 26 34 28 80 7 23 6 31 52 33 34 57 27 54 37 9 32 87 34 64 20 33 81
9% 6% 12% 9% 8% 9% 10% 9% 4% 14% 12% 7% 11% 8% 9% 10% 7% 10% 7% 10% 7% 10% 8% 10% 8% 6% 11%
Self-employed full time 48 29 19 6 10 28 4 32 6 8 * 18 11 19 13 13 22 17 21 2 14 34 11 26 12 26 21
4% 4% 3% 2% 3% 7% 2% 4% 4% 5% * 4% 2% 5% 4% 2% 5% 3% 4% 2% 3% 4% 3% 4% 4% 5% 3%
Not employed, but looking 62 23 39 15 26 17 3 27 19 10 1 15 22 22 18 34 10 15 21 1 5 57 21 29 13 17 42
for work 5% 4% 6% 5% 8% 4% 1% 3% 12% 6% 2% 4% 4% 6% 5% 6% 2% 3% 4% 1% 1% 7% 5% 4% 5% 3% 6%
Not employed and not looking 19 2 16 5 4 3 7 12 - 6 - 8 4 5 4 8 7 5 4 1 2 17 4 7 8 2 15
for work 1% * 2% 1% 1% 1% 2% 1% - 4% - 2% 1% 1% 1% 1% 2% 1% 1% 2% * 2% 1% 1% 3% * 2%
Not employed, unable to work 68 23 45 14 14 32 8 47 10 4 3 20 30 18 19 30 19 17 25 3 6 62 23 28 18 6 60
due to a disability or 5% 4% 7% 4% 4% 8% 3% 5% 6% 2% 7% 5% 6% 5% 5% 5% 5% 3% 5% 4% 1% 7% 5% 4% 7% 1% 8%
illness
Retired 246 132 114 - 3 50 194 198 23 20 3 81 97 65 65 80 101 103 113 14 70 176 56 135 56 83 140
18% 20% 17% - 1% 13% 69% 22% 14% 12% 7% 19% 20% 17% 18% 14% 24% 20% 22% 15% 15% 20% 13% 21% 21% 15% 20%
Student 43 17 26 39 3 1 - 14 14 3 5 10 20 11 8 27 8 4 * 2 4 39 16 24 3 10 22
3% 3% 4% 11% 1% * - 2% 9% 2% 12% 2% 4% 3% 2% 5% 2% 1% * 2% 1% 4% 4% 4% 1% 2% 3%
Stay-at-home spouse or 70 9 61 29 18 21 2 45 14 3 2 23 25 20 16 31 23 23 22 8 6 65 18 33 19 14 56
partner 5% 1% 9% 8% 5% 5% 1% 5% 9% 2% 5% 5% 5% 5% 5% 6% 6% 4% 4% 9% 1% 7% 4% 5% 7% 2% 8%
Self-employed part time 37 18 19 9 3 20 5 25 7 5 - 6 18 12 11 18 7 12 13 4 15 21 5 26 5 15 20
3% 3% 3% 2% 1% 5% 2% 3% 4% 3% - 1% 4% 3% 3% 3% 2% 2% 3% 4% 3% 2% 1% 4% 2% 3% 3%
Sigma 1340 658 682 343 329 387 282 910 161 165 45 429 496 389 364 558 418 514 507 90 469 871 442 636 263 563 715
100% 100% 100% 100% 100% 100% 100% 100% 100% 100% 100% 100% 100% 100% 100% 100% 100% 100% 100% 100% 100% 100% 100% 100% 100% 100% 100%
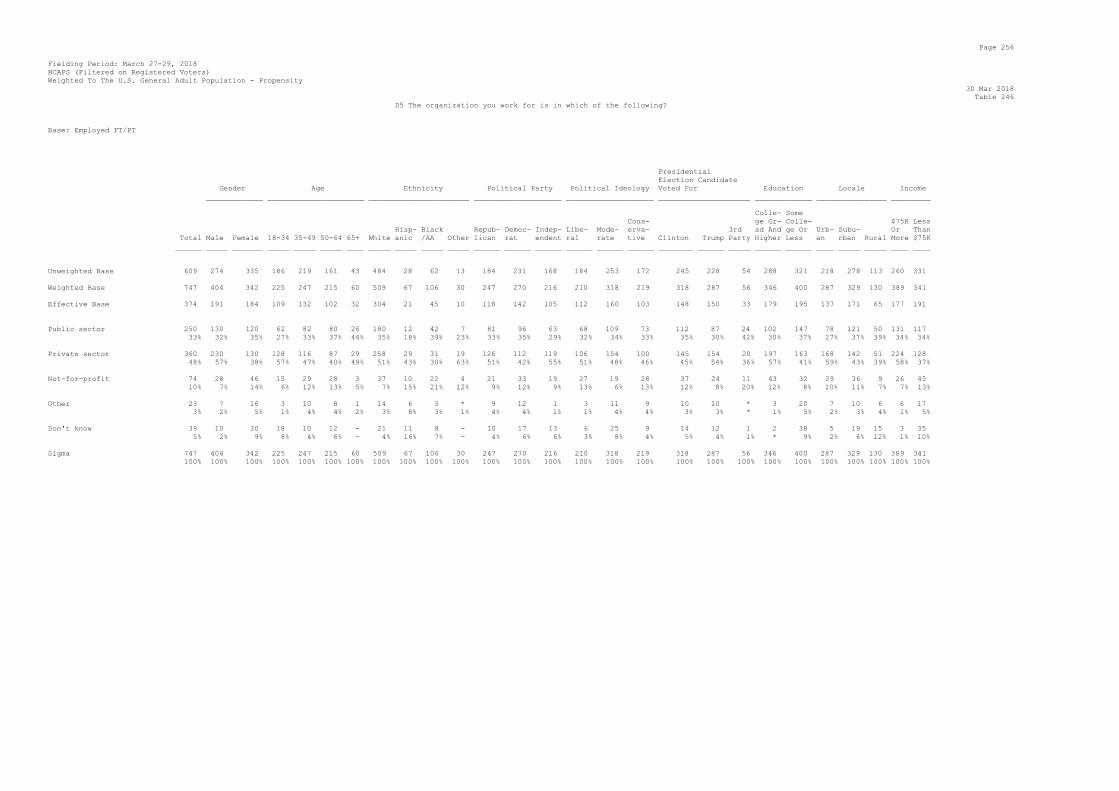
Page 256
Fielding Period: March 27-29, 2018
HCAPS (Filtered on Registered Voters)
Weighted To The U.S. General Adult Population - Propensity
30 Mar 2018
Table 246
D5 The organization you work for is in which of the following?
Base: Employed FT/PT
Presidential
Election Candidate
Gender Age Ethnicity Political Party Political Ideology Voted For Education Locale Income
_____________ ______________________ _______________________ ____________________ ____________________ _____________________ _____________ ________________ _________
Colle- Some
Cons- ge Gr- Colle- $75K Less
Hisp- Black Repub- Democ- Indep- Libe- Mode- erva- 3rd ad And ge Or Urb- Subu- Or Than
Total Male Female 18-34 35-49 50-64 65+ White anic /AA Other lican rat endent ral rate tive Clinton Trump Party Higher Less an rban Rural More $75K
______ _____ _______ _____ _____ _____ ____ _____ _____ _____ _____ ______ ______ ______ ______ ______ ______ ________ ______ _____ ______ ______ ____ _____ _____ ____ ____
Unweighted Base 609 274 335 186 219 161 43 484 28 62 13 184 231 168 184 253 172 245 228 54 288 321 218 278 113 260 331
Weighted Base 747 404 342 225 247 215 60 509 67 106 30 247 270 216 210 318 219 318 287 56 346 400 287 329 130 389 341
Effective Base 374 191 184 109 132 102 32 304 21 45 10 118 142 105 112 160 103 148 150 33 179 195 137 171 65 177 191
Public sector 250 130 120 62 82 80 26 180 12 42 7 81 96 63 68 109 73 112 87 24 102 147 78 121 50 131 117
33% 32% 35% 27% 33% 37% 44% 35% 18% 39% 23% 33% 35% 29% 32% 34% 33% 35% 30% 42% 30% 37% 27% 37% 39% 34% 34%
Private sector 360 230 130 128 116 87 29 258 29 31 19 126 112 119 106 154 100 145 154 20 197 163 168 142 51 224 128
48% 57% 38% 57% 47% 40% 49% 51% 43% 30% 63% 51% 42% 55% 51% 48% 46% 45% 54% 36% 57% 41% 59% 43% 39% 58% 37%
Not-for-profit 74 28 46 15 29 28 3 37 10 22 4 21 33 19 27 19 28 37 24 11 43 32 29 36 9 26 45
10% 7% 14% 6% 12% 13% 5% 7% 15% 21% 12% 9% 12% 9% 13% 6% 13% 12% 8% 20% 12% 8% 10% 11% 7% 7% 13%
Other 23 7 16 3 10 8 1 14 6 3 * 9 12 1 3 11 9 10 10 * 3 20 7 10 6 6 17
3% 2% 5% 1% 4% 4% 2% 3% 8% 3% 1% 4% 4% 1% 1% 4% 4% 3% 3% * 1% 5% 2% 3% 4% 1% 5%
Don't know 39 10 30 18 10 12 - 21 11 8 - 10 17 13 6 25 9 14 12 1 2 38 5 19 15 3 35
5% 2% 9% 8% 4% 6% - 4% 16% 7% - 4% 6% 6% 3% 8% 4% 5% 4% 1% * 9% 2% 6% 12% 1% 10%
Sigma 747 404 342 225 247 215 60 509 67 106 30 247 270 216 210 318 219 318 287 56 346 400 287 329 130 389 341
100% 100% 100% 100% 100% 100% 100% 100% 100% 100% 100% 100% 100% 100% 100% 100% 100% 100% 100% 100% 100% 100% 100% 100% 100% 100% 100%
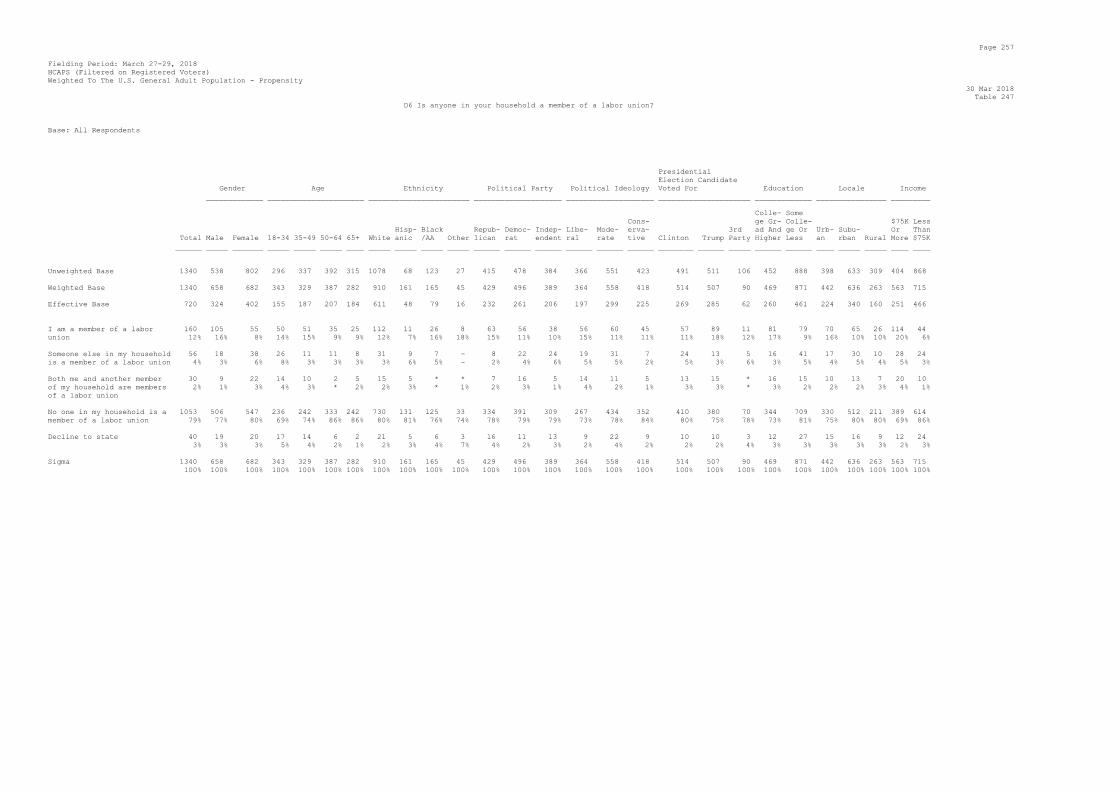
Page 257
Fielding Period: March 27-29, 2018
HCAPS (Filtered on Registered Voters)
Weighted To The U.S. General Adult Population - Propensity
30 Mar 2018
Table 247
D6 Is anyone in your household a member of a labor union?
Base: All Respondents
Presidential
Election Candidate
Gender Age Ethnicity Political Party Political Ideology Voted For Education Locale Income
_____________ ______________________ _______________________ ____________________ ____________________ _____________________ _____________ ________________ _________
Colle- Some
Cons- ge Gr- Colle- $75K Less
Hisp- Black Repub- Democ- Indep- Libe- Mode- erva- 3rd ad And ge Or Urb- Subu- Or Than
Total Male Female 18-34 35-49 50-64 65+ White anic /AA Other lican rat endent ral rate tive Clinton Trump Party Higher Less an rban Rural More $75K
______ _____ _______ _____ _____ _____ ____ _____ _____ _____ _____ ______ ______ ______ ______ ______ ______ ________ ______ _____ ______ ______ ____ _____ _____ ____ ____
Unweighted Base 1340 538 802 296 337 392 315 1078 68 123 27 415 478 384 366 551 423 491 511 106 452 888 398 633 309 404 868
Weighted Base 1340 658 682 343 329 387 282 910 161 165 45 429 496 389 364 558 418 514 507 90 469 871 442 636 263 563 715
Effective Base 720 324 402 155 187 207 184 611 48 79 16 232 261 206 197 299 225 269 285 62 260 461 224 340 160 251 466
I am a member of a labor 160 105 55 50 51 35 25 112 11 26 8 63 56 38 56 60 45 57 89 11 81 79 70 65 26 114 44
union 12% 16% 8% 14% 15% 9% 9% 12% 7% 16% 18% 15% 11% 10% 15% 11% 11% 11% 18% 12% 17% 9% 16% 10% 10% 20% 6%
Someone else in my household 56 18 38 26 11 11 8 31 9 7 - 8 22 24 19 31 7 24 13 5 16 41 17 30 10 28 24
is a member of a labor union 4% 3% 6% 8% 3% 3% 3% 3% 6% 5% - 2% 4% 6% 5% 5% 2% 5% 3% 6% 3% 5% 4% 5% 4% 5% 3%
Both me and another member 30 9 22 14 10 2 5 15 5 * * 7 16 5 14 11 5 13 15 * 16 15 10 13 7 20 10
of my household are members 2% 1% 3% 4% 3% * 2% 2% 3% * 1% 2% 3% 1% 4% 2% 1% 3% 3% * 3% 2% 2% 2% 3% 4% 1%
of a labor union
No one in my household is a 1053 506 547 236 242 333 242 730 131 125 33 334 391 309 267 434 352 410 380 70 344 709 330 512 211 389 614
member of a labor union 79% 77% 80% 69% 74% 86% 86% 80% 81% 76% 74% 78% 79% 79% 73% 78% 84% 80% 75% 78% 73% 81% 75% 80% 80% 69% 86%
Decline to state 40 19 20 17 14 6 2 21 5 6 3 16 11 13 9 22 9 10 10 3 12 27 15 16 9 12 24
3% 3% 3% 5% 4% 2% 1% 2% 3% 4% 7% 4% 2% 3% 2% 4% 2% 2% 2% 4% 3% 3% 3% 3% 3% 2% 3%
Sigma 1340 658 682 343 329 387 282 910 161 165 45 429 496 389 364 558 418 514 507 90 469 871 442 636 263 563 715
100% 100% 100% 100% 100% 100% 100% 100% 100% 100% 100% 100% 100% 100% 100% 100% 100% 100% 100% 100% 100% 100% 100% 100% 100% 100% 100%

Page 258
Fielding Period: March 27-29, 2018
HCAPS (Filtered on Registered Voters)
Weighted To The U.S. General Adult Population - Propensity
30 Mar 2018
Table 248
Q2146 What is the highest level of education you have completed or the highest degree you have received?
Base: All Respondents
Presidential
Election Candidate
Gender Age Ethnicity Political Party Political Ideology Voted For Education Locale Income
_____________ ______________________ _______________________ ____________________ ____________________ _____________________ _____________ ________________ _________
Colle- Some
Cons- ge Gr- Colle- $75K Less
Hisp- Black Repub- Democ- Indep- Libe- Mode- erva- 3rd ad And ge Or Urb- Subu- Or Than
Total Male Female 18-34 35-49 50-64 65+ White anic /AA Other lican rat endent ral rate tive Clinton Trump Party Higher Less an rban Rural More $75K
______ _____ _______ _____ _____ _____ ____ _____ _____ _____ _____ ______ ______ ______ ______ ______ ______ ________ ______ _____ ______ ______ ____ _____ _____ ____ ____
Unweighted Base 1340 538 802 296 337 392 315 1078 68 123 27 415 478 384 366 551 423 491 511 106 452 888 398 633 309 404 868
Weighted Base 1340 658 682 343 329 387 282 910 161 165 45 429 496 389 364 558 418 514 507 90 469 871 442 636 263 563 715
Effective Base 720 324 402 155 187 207 184 611 48 79 16 232 261 206 197 299 225 269 285 62 260 461 224 340 160 251 466
Less than high school 8 - 8 - 2 - 6 8 - - - 2 6 - 7 - 1 3 2 - - 8 7 - 1 - 8
1% - 1% - 1% - 2% 1% - - - * 1% - 2% - * 1% * - - 1% 2% - * - 1%
Completed some high school 98 27 71 33 21 21 23 69 5 11 5 31 46 18 19 46 33 24 40 2 - 98 23 39 36 16 71
7% 4% 10% 10% 6% 5% 8% 8% 3% 7% 10% 7% 9% 5% 5% 8% 8% 5% 8% 2% - 11% 5% 6% 14% 3% 10%
High school graduate or 215 80 135 48 43 69 55 130 33 37 3 57 89 59 50 102 63 71 80 10 - 215 66 93 56 53 156
equivalent (e.g., GED) 16% 12% 20% 14% 13% 18% 20% 14% 20% 23% 6% 13% 18% 15% 14% 18% 15% 14% 16% 12% - 25% 15% 15% 21% 9% 22%
Job-specific training 55 24 31 11 12 21 11 35 10 4 5 18 20 16 16 21 19 14 26 2 - 55 10 32 13 13 40
programs after high school 4% 4% 5% 3% 4% 5% 4% 4% 6% 2% 10% 4% 4% 4% 4% 4% 5% 3% 5% 3% - 6% 2% 5% 5% 2% 6%
Completed some college, but 342 184 159 93 82 102 66 208 61 46 11 104 126 108 84 152 107 148 108 22 - 342 95 172 75 110 209
no degree 26% 28% 23% 27% 25% 26% 23% 23% 38% 28% 24% 24% 25% 28% 23% 27% 26% 29% 21% 25% - 39% 21% 27% 29% 19% 29%
Associate's degree 153 70 82 35 34 51 33 86 24 34 6 47 67 37 34 68 51 52 64 12 - 153 50 68 35 55 94
11% 11% 12% 10% 10% 13% 12% 10% 15% 20% 14% 11% 13% 10% 9% 12% 12% 10% 13% 14% - 18% 11% 11% 13% 10% 13%
College graduate (e.g., 228 128 100 67 53 72 37 182 15 15 8 74 70 81 68 87 73 99 89 17 228 - 83 125 20 141 82
B.A., A.B., B.S.) 17% 19% 15% 19% 16% 19% 13% 20% 10% 9% 18% 17% 14% 21% 19% 16% 17% 19% 18% 19% 49% - 19% 20% 8% 25% 11%
Completed some graduate 56 31 25 10 9 24 12 37 3 8 5 18 19 17 20 16 21 27 8 16 56 - 17 33 6 31 21
school, but no degree 4% 5% 4% 3% 3% 6% 4% 4% 2% 5% 12% 4% 4% 4% 5% 3% 5% 5% 2% 18% 12% - 4% 5% 2% 6% 3%
Completed graduate school 185 114 71 46 72 28 39 154 9 10 3 77 52 52 67 67 51 75 90 8 185 - 90 73 22 144 34
(e.g., M.S., M.D., Ph.D.) 14% 17% 10% 13% 22% 7% 14% 17% 6% 6% 6% 18% 10% 13% 18% 12% 12% 15% 18% 9% 39% - 20% 11% 8% 26% 5%
Sigma 1340 658 682 343 329 387 282 910 161 165 45 429 496 389 364 558 418 514 507 90 469 871 442 636 263 563 715
100% 100% 100% 100% 100% 100% 100% 100% 100% 100% 100% 100% 100% 100% 100% 100% 100% 100% 100% 100% 100% 100% 100% 100% 100% 100% 100%

Page 259
Fielding Period: March 27-29, 2018
HCAPS (Filtered on Registered Voters)
Weighted To The U.S. General Adult Population - Propensity
30 Mar 2018
Table 249
Q2135 What is your marital status?
Base: All Respondents
Presidential
Election Candidate
Gender Age Ethnicity Political Party Political Ideology Voted For Education Locale Income
_____________ ______________________ _______________________ ____________________ ____________________ _____________________ _____________ ________________ _________
Colle- Some
Cons- ge Gr- Colle- $75K Less
Hisp- Black Repub- Democ- Indep- Libe- Mode- erva- 3rd ad And ge Or Urb- Subu- Or Than
Total Male Female 18-34 35-49 50-64 65+ White anic /AA Other lican rat endent ral rate tive Clinton Trump Party Higher Less an rban Rural More $75K
______ _____ _______ _____ _____ _____ ____ _____ _____ _____ _____ ______ ______ ______ ______ ______ ______ ________ ______ _____ ______ ______ ____ _____ _____ ____ ____
Unweighted Base 1340 538 802 296 337 392 315 1078 68 123 27 415 478 384 366 551 423 491 511 106 452 888 398 633 309 404 868
Weighted Base 1340 658 682 343 329 387 282 910 161 165 45 429 496 389 364 558 418 514 507 90 469 871 442 636 263 563 715
Effective Base 720 324 402 155 187 207 184 611 48 79 16 232 261 206 197 299 225 269 285 62 260 461 224 340 160 251 466
Married or civil union 683 390 293 139 186 202 156 530 78 37 17 292 188 190 161 261 261 204 358 51 308 375 219 338 126 409 247
51% 59% 43% 40% 57% 52% 55% 58% 48% 23% 38% 68% 38% 49% 44% 47% 62% 40% 71% 56% 66% 43% 50% 53% 48% 73% 35%
Single, never married 346 163 184 177 77 69 24 159 58 81 18 52 173 112 115 166 64 165 53 23 97 250 130 157 60 82 235
26% 25% 27% 52% 23% 18% 9% 17% 36% 49% 40% 12% 35% 29% 32% 30% 15% 32% 10% 26% 21% 29% 29% 25% 23% 15% 33%
Divorced 180 65 115 7 41 82 49 129 11 28 6 54 71 52 47 77 56 81 57 9 45 134 54 77 49 45 132
13% 10% 17% 2% 13% 21% 17% 14% 7% 17% 13% 12% 14% 13% 13% 14% 13% 16% 11% 9% 10% 15% 12% 12% 19% 8% 18%
Separated 23 5 18 2 12 4 5 10 9 3 1 4 10 8 4 13 6 7 10 - 7 16 4 17 2 4 19
2% 1% 3% 1% 4% 1% 2% 1% 6% 2% 2% 1% 2% 2% 1% 2% 1% 1% 2% - 2% 2% 1% 3% 1% 1% 3%
Widowed/Widower 63 11 52 - 4 16 43 51 - 10 2 22 27 12 18 21 24 27 22 4 6 57 16 35 13 9 51
5% 2% 8% - 1% 4% 15% 6% - 6% 5% 5% 6% 3% 5% 4% 6% 5% 4% 5% 1% 7% 4% 5% 5% 2% 7%
Living with partner 45 24 21 18 9 14 4 31 5 6 1 5 26 13 19 19 7 29 6 3 6 39 19 13 13 14 30
3% 4% 3% 5% 3% 4% 1% 3% 3% 3% 2% 1% 5% 3% 5% 3% 2% 6% 1% 4% 1% 4% 4% 2% 5% 2% 4%
Sigma 1340 658 682 343 329 387 282 910 161 165 45 429 496 389 364 558 418 514 507 90 469 871 442 636 263 563 715
100% 100% 100% 100% 100% 100% 100% 100% 100% 100% 100% 100% 100% 100% 100% 100% 100% 100% 100% 100% 100% 100% 100% 100% 100% 100% 100%

Page 260
Fielding Period: March 27-29, 2018
HCAPS (Filtered on Registered Voters)
Weighted To The U.S. General Adult Population - Propensity
30 Mar 2018
Table 250
D9 How many children live in your household?
Base: All Respondents
Presidential
Election Candidate
Gender Age Ethnicity Political Party Political Ideology Voted For Education Locale Income
_____________ ______________________ _______________________ ____________________ ____________________ _____________________ _____________ ________________ _________
Colle- Some
Cons- ge Gr- Colle- $75K Less
Hisp- Black Repub- Democ- Indep- Libe- Mode- erva- 3rd ad And ge Or Urb- Subu- Or Than
Total Male Female 18-34 35-49 50-64 65+ White anic /AA Other lican rat endent ral rate tive Clinton Trump Party Higher Less an rban Rural More $75K
______ _____ _______ _____ _____ _____ ____ _____ _____ _____ _____ ______ ______ ______ ______ ______ ______ ________ ______ _____ ______ ______ ____ _____ _____ ____ ____
Unweighted Base 1340 538 802 296 337 392 315 1078 68 123 27 415 478 384 366 551 423 491 511 106 452 888 398 633 309 404 868
Weighted Base 1340 658 682 343 329 387 282 910 161 165 45 429 496 389 364 558 418 514 507 90 469 871 442 636 263 563 715
Effective Base 720 324 402 155 187 207 184 611 48 79 16 232 261 206 197 299 225 269 285 62 260 461 224 340 160 251 466
None 769 383 386 145 125 276 223 528 82 96 32 212 297 244 220 326 223 336 255 50 277 493 230 397 143 287 435
57% 58% 57% 42% 38% 71% 79% 58% 51% 58% 71% 49% 60% 63% 60% 59% 53% 65% 50% 55% 59% 57% 52% 62% 54% 51% 61%
One 257 130 127 71 81 68 36 192 21 30 1 97 88 67 72 101 85 76 113 18 84 173 80 114 63 114 136
19% 20% 19% 21% 25% 18% 13% 21% 13% 18% 2% 23% 18% 17% 20% 18% 20% 15% 22% 20% 18% 20% 18% 18% 24% 20% 19%
Two 203 92 111 90 80 20 12 122 42 24 9 79 71 50 58 77 68 62 94 14 73 130 100 71 31 114 88
15% 14% 16% 26% 24% 5% 4% 13% 26% 15% 19% 18% 14% 13% 16% 14% 16% 12% 19% 16% 16% 15% 23% 11% 12% 20% 12%
Three 78 36 42 30 30 13 5 51 9 7 4 24 34 18 13 43 22 33 32 2 23 55 29 32 17 34 43
6% 6% 6% 9% 9% 3% 2% 6% 6% 4% 8% 6% 7% 5% 4% 8% 5% 6% 6% 3% 5% 6% 7% 5% 6% 6% 6%
Four or more 33 17 16 6 12 10 5 17 7 7 - 17 5 10 1 10 22 7 13 5 12 21 2 21 9 14 13
2% 3% 2% 2% 4% 2% 2% 2% 4% 4% - 4% 1% 3% * 2% 5% 1% 2% 6% 3% 2% 1% 3% 3% 3% 2%
Sigma 1340 658 682 343 329 387 282 910 161 165 45 429 496 389 364 558 418 514 507 90 469 871 442 636 263 563 715
100% 100% 100% 100% 100% 100% 100% 100% 100% 100% 100% 100% 100% 100% 100% 100% 100% 100% 100% 100% 100% 100% 100% 100% 100% 100% 100%

Page 261
Fielding Period: March 27-29, 2018
HCAPS (Filtered on Registered Voters)
Weighted To The U.S. General Adult Population - Propensity
30 Mar 2018
Table 251
M12 Which best describes your political ideology?
Base: All Respondents
Presidential
Election Candidate
Gender Age Ethnicity Political Party Political Ideology Voted For Education Locale Income
_____________ ______________________ _______________________ ____________________ ____________________ _____________________ _____________ ________________ _________
Colle- Some
Cons- ge Gr- Colle- $75K Less
Hisp- Black Repub- Democ- Indep- Libe- Mode- erva- 3rd ad And ge Or Urb- Subu- Or Than
Total Male Female 18-34 35-49 50-64 65+ White anic /AA Other lican rat endent ral rate tive Clinton Trump Party Higher Less an rban Rural More $75K
______ _____ _______ _____ _____ _____ ____ _____ _____ _____ _____ ______ ______ ______ ______ ______ ______ ________ ______ _____ ______ ______ ____ _____ _____ ____ ____
Unweighted Base 1340 538 802 296 337 392 315 1078 68 123 27 415 478 384 366 551 423 491 511 106 452 888 398 633 309 404 868
Weighted Base 1340 658 682 343 329 387 282 910 161 165 45 429 496 389 364 558 418 514 507 90 469 871 442 636 263 563 715
Effective Base 720 324 402 155 187 207 184 611 48 79 16 232 261 206 197 299 225 269 285 62 260 461 224 340 160 251 466
Strong/Lean Liberal (Net) 364 172 193 113 97 87 68 233 46 57 7 39 237 80 364 - - 259 50 13 155 210 140 160 64 163 192
27% 26% 28% 33% 29% 22% 24% 26% 28% 34% 16% 9% 48% 21% 100% - - 50% 10% 15% 33% 24% 32% 25% 24% 29% 27%
Strong liberal 184 91 93 65 53 31 35 110 25 37 4 18 133 28 184 - - 131 26 4 75 108 73 82 30 72 103
14% 14% 14% 19% 16% 8% 12% 12% 15% 22% 9% 4% 27% 7% 50% - - 25% 5% 5% 16% 12% 16% 13% 11% 13% 14%
Lean liberal 181 81 100 48 43 56 33 123 21 20 3 21 103 52 181 - - 128 24 9 79 101 67 79 35 90 89
13% 12% 15% 14% 13% 14% 12% 14% 13% 12% 7% 5% 21% 14% 50% - - 25% 5% 10% 17% 12% 15% 12% 13% 16% 12%
Moderate 558 254 304 156 137 165 100 342 67 90 26 94 219 231 - 558 - 218 163 44 170 388 193 285 80 210 313
42% 39% 45% 45% 42% 43% 36% 38% 42% 55% 58% 22% 44% 59% - 100% - 42% 32% 48% 36% 45% 44% 45% 31% 37% 44%
Strong/Lean Conservative 418 233 185 74 95 135 114 335 48 18 12 295 39 78 - - 418 36 293 33 144 274 109 191 118 190 210
(Net) 31% 35% 27% 22% 29% 35% 40% 37% 30% 11% 26% 69% 8% 20% - - 100% 7% 58% 37% 31% 31% 25% 30% 45% 34% 29%
Lean conservative 207 118 89 45 40 69 53 155 32 7 8 122 24 58 - - 207 27 128 19 68 139 56 95 56 95 106
15% 18% 13% 13% 12% 18% 19% 17% 20% 4% 18% 28% 5% 15% - - 49% 5% 25% 21% 14% 16% 13% 15% 21% 17% 15%
Strong conservative 211 115 96 29 54 66 61 180 16 11 3 173 16 19 - - 211 10 165 14 77 134 54 96 62 95 104
16% 18% 14% 9% 17% 17% 22% 20% 10% 7% 7% 40% 3% 5% - - 51% 2% 33% 15% 16% 15% 12% 15% 24% 17% 15%
Sigma 1340 658 682 343 329 387 282 910 161 165 45 429 496 389 364 558 418 514 507 90 469 871 442 636 263 563 715
100% 100% 100% 100% 100% 100% 100% 100% 100% 100% 100% 100% 100% 100% 100% 100% 100% 100% 100% 100% 100% 100% 100% 100% 100% 100% 100%
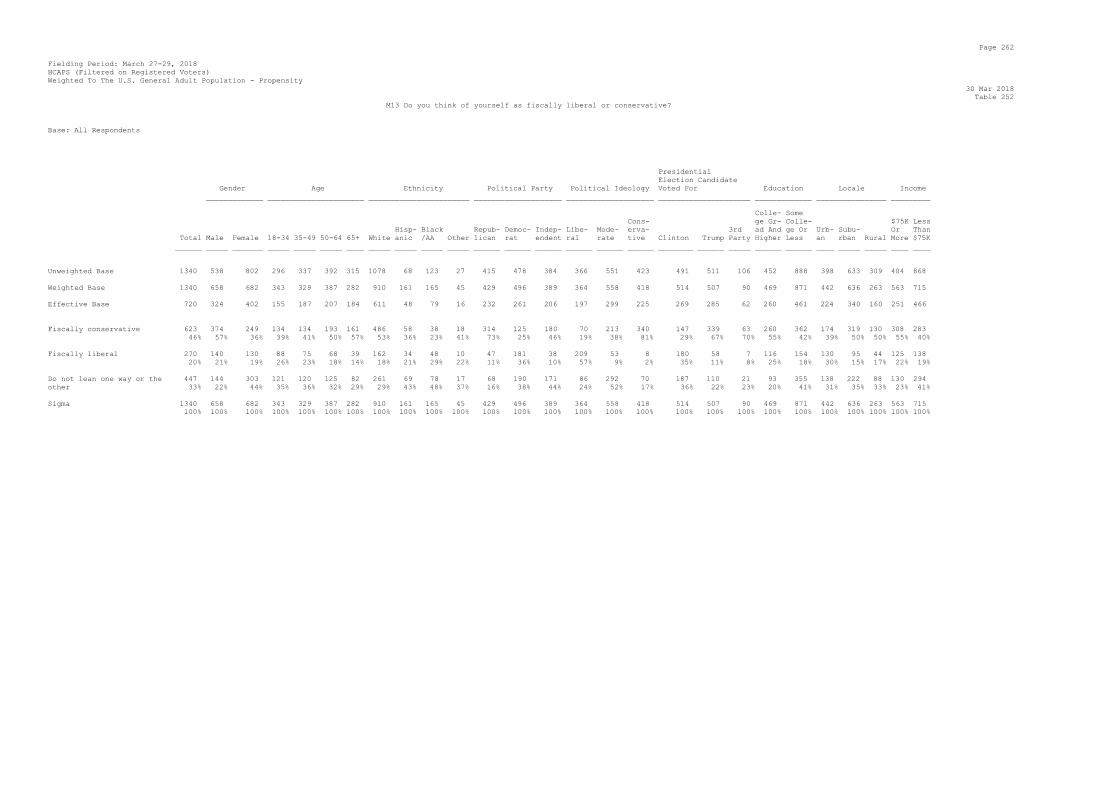
Page 262
Fielding Period: March 27-29, 2018
HCAPS (Filtered on Registered Voters)
Weighted To The U.S. General Adult Population - Propensity
30 Mar 2018
Table 252
M13 Do you think of yourself as fiscally liberal or conservative?
Base: All Respondents
Presidential
Election Candidate
Gender Age Ethnicity Political Party Political Ideology Voted For Education Locale Income
_____________ ______________________ _______________________ ____________________ ____________________ _____________________ _____________ ________________ _________
Colle- Some
Cons- ge Gr- Colle- $75K Less
Hisp- Black Repub- Democ- Indep- Libe- Mode- erva- 3rd ad And ge Or Urb- Subu- Or Than
Total Male Female 18-34 35-49 50-64 65+ White anic /AA Other lican rat endent ral rate tive Clinton Trump Party Higher Less an rban Rural More $75K
______ _____ _______ _____ _____ _____ ____ _____ _____ _____ _____ ______ ______ ______ ______ ______ ______ ________ ______ _____ ______ ______ ____ _____ _____ ____ ____
Unweighted Base 1340 538 802 296 337 392 315 1078 68 123 27 415 478 384 366 551 423 491 511 106 452 888 398 633 309 404 868
Weighted Base 1340 658 682 343 329 387 282 910 161 165 45 429 496 389 364 558 418 514 507 90 469 871 442 636 263 563 715
Effective Base 720 324 402 155 187 207 184 611 48 79 16 232 261 206 197 299 225 269 285 62 260 461 224 340 160 251 466
Fiscally conservative 623 374 249 134 134 193 161 486 58 38 18 314 125 180 70 213 340 147 339 63 260 362 174 319 130 308 283
46% 57% 36% 39% 41% 50% 57% 53% 36% 23% 41% 73% 25% 46% 19% 38% 81% 29% 67% 70% 55% 42% 39% 50% 50% 55% 40%
Fiscally liberal 270 140 130 88 75 68 39 162 34 48 10 47 181 38 209 53 8 180 58 7 116 154 130 95 44 125 138
20% 21% 19% 26% 23% 18% 14% 18% 21% 29% 22% 11% 36% 10% 57% 9% 2% 35% 11% 8% 25% 18% 30% 15% 17% 22% 19%
Do not lean one way or the 447 144 303 121 120 125 82 261 69 78 17 68 190 171 86 292 70 187 110 21 93 355 138 222 88 130 294
other 33% 22% 44% 35% 36% 32% 29% 29% 43% 48% 37% 16% 38% 44% 24% 52% 17% 36% 22% 23% 20% 41% 31% 35% 33% 23% 41%
Sigma 1340 658 682 343 329 387 282 910 161 165 45 429 496 389 364 558 418 514 507 90 469 871 442 636 263 563 715
100% 100% 100% 100% 100% 100% 100% 100% 100% 100% 100% 100% 100% 100% 100% 100% 100% 100% 100% 100% 100% 100% 100% 100% 100% 100% 100%

Page 263
Fielding Period: March 27-29, 2018
HCAPS (Filtered on Registered Voters)
Weighted To The U.S. General Adult Population - Propensity
30 Mar 2018
Table 253
M14 Do you think of yourself as socially liberal or conservative?
Base: All Respondents
Presidential
Election Candidate
Gender Age Ethnicity Political Party Political Ideology Voted For Education Locale Income
_____________ ______________________ _______________________ ____________________ ____________________ _____________________ _____________ ________________ _________
Colle- Some
Cons- ge Gr- Colle- $75K Less
Hisp- Black Repub- Democ- Indep- Libe- Mode- erva- 3rd ad And ge Or Urb- Subu- Or Than
Total Male Female 18-34 35-49 50-64 65+ White anic /AA Other lican rat endent ral rate tive Clinton Trump Party Higher Less an rban Rural More $75K
______ _____ _______ _____ _____ _____ ____ _____ _____ _____ _____ ______ ______ ______ ______ ______ ______ ________ ______ _____ ______ ______ ____ _____ _____ ____ ____
Unweighted Base 1340 538 802 296 337 392 315 1078 68 123 27 415 478 384 366 551 423 491 511 106 452 888 398 633 309 404 868
Weighted Base 1340 658 682 343 329 387 282 910 161 165 45 429 496 389 364 558 418 514 507 90 469 871 442 636 263 563 715
Effective Base 720 324 402 155 187 207 184 611 48 79 16 232 261 206 197 299 225 269 285 62 260 461 224 340 160 251 466
Socially conservative 508 283 225 121 110 155 122 373 74 29 14 300 103 100 21 160 328 82 321 38 169 339 152 234 123 231 253
38% 43% 33% 35% 33% 40% 43% 41% 46% 18% 32% 70% 21% 26% 6% 29% 78% 16% 63% 42% 36% 39% 34% 37% 47% 41% 35%
Socially liberal 469 235 235 149 119 123 79 303 46 76 21 57 270 136 320 124 25 315 75 33 222 248 179 220 70 219 232
35% 36% 34% 44% 36% 32% 28% 33% 28% 46% 47% 13% 54% 35% 88% 22% 6% 61% 15% 37% 47% 28% 41% 35% 27% 39% 32%
Do not lean one way or the 362 140 223 72 100 109 81 234 42 59 10 72 123 153 24 274 65 118 111 19 78 284 111 182 70 113 230
other 27% 21% 33% 21% 30% 28% 29% 26% 26% 36% 21% 17% 25% 39% 6% 49% 16% 23% 22% 21% 17% 33% 25% 29% 26% 20% 32%
Sigma 1340 658 682 343 329 387 282 910 161 165 45 429 496 389 364 558 418 514 507 90 469 871 442 636 263 563 715
100% 100% 100% 100% 100% 100% 100% 100% 100% 100% 100% 100% 100% 100% 100% 100% 100% 100% 100% 100% 100% 100% 100% 100% 100% 100% 100%

Page 264
Fielding Period: March 27-29, 2018
HCAPS (Filtered on Registered Voters)
Weighted To The U.S. General Adult Population - Propensity
30 Mar 2018
Table 254
S3 Some people had the chance to vote in this year's presidential election on November
8, 2016. Others did not. Did you vote in November's presidential election?
Base: All Respondents
Presidential
Election Candidate
Gender Age Ethnicity Political Party Political Ideology Voted For Education Locale Income
_____________ ______________________ _______________________ ____________________ ____________________ _____________________ _____________ ________________ _________
Colle- Some
Cons- ge Gr- Colle- $75K Less
Hisp- Black Repub- Democ- Indep- Libe- Mode- erva- 3rd ad And ge Or Urb- Subu- Or Than
Total Male Female 18-34 35-49 50-64 65+ White anic /AA Other lican rat endent ral rate tive Clinton Trump Party Higher Less an rban Rural More $75K
______ _____ _______ _____ _____ _____ ____ _____ _____ _____ _____ ______ ______ ______ ______ ______ ______ ________ ______ _____ ______ ______ ____ _____ _____ ____ ____
Unweighted Base 1340 538 802 296 337 392 315 1078 68 123 27 415 478 384 366 551 423 491 511 106 452 888 398 633 309 404 868
Weighted Base 1340 658 682 343 329 387 282 910 161 165 45 429 496 389 364 558 418 514 507 90 469 871 442 636 263 563 715
Effective Base 720 324 402 155 187 207 184 611 48 79 16 232 261 206 197 299 225 269 285 62 260 461 224 340 160 251 466
Yes 1147 600 547 242 288 361 256 815 104 146 39 382 427 322 326 454 367 514 507 90 440 706 369 546 231 528 577
86% 91% 80% 70% 88% 93% 91% 90% 65% 89% 87% 89% 86% 83% 89% 81% 88% 100% 100% 100% 94% 81% 84% 86% 88% 94% 81%
No 193 58 135 101 40 26 27 95 57 19 6 47 69 66 39 104 50 - - - 29 164 72 90 31 35 139
14% 9% 20% 30% 12% 7% 9% 10% 35% 11% 13% 11% 14% 17% 11% 19% 12% - - - 6% 19% 16% 14% 12% 6% 19%
Sigma 1340 658 682 343 329 387 282 910 161 165 45 429 496 389 364 558 418 514 507 90 469 871 442 636 263 563 715
100% 100% 100% 100% 100% 100% 100% 100% 100% 100% 100% 100% 100% 100% 100% 100% 100% 100% 100% 100% 100% 100% 100% 100% 100% 100% 100%

Page 265
Fielding Period: March 27-29, 2018
HCAPS (Filtered on Registered Voters)
Weighted To The U.S. General Adult Population - Propensity
30 Mar 2018
Table 255
S4 Confidentially and for statistical purposes only which candidate did you vote for in the presidential election on Nov. 8, 2016?
Base: Voted In Presidential Election
Presidential
Election Candidate
Gender Age Ethnicity Political Party Political Ideology Voted For Education Locale Income
_____________ ______________________ _______________________ ____________________ ____________________ _____________________ _____________ ________________ _________
Colle- Some
Cons- ge Gr- Colle- $75K Less
Hisp- Black Repub- Democ- Indep- Libe- Mode- erva- 3rd ad And ge Or Urb- Subu- Or Than
Total Male Female 18-34 35-49 50-64 65+ White anic /AA Other lican rat endent ral rate tive Clinton Trump Party Higher Less an rban Rural More $75K
______ _____ _______ _____ _____ _____ ____ _____ _____ _____ _____ ______ ______ ______ ______ ______ ______ ________ ______ _____ ______ ______ ____ _____ _____ ____ ____
Unweighted Base 1149 491 658 215 283 356 295 947 49 101 23 377 420 317 324 443 382 491 511 106 424 725 336 549 264 382 715
Weighted Base 1147 600 547 242 288 361 256 815 104 146 39 382 427 322 326 454 367 514 507 90 440 706 369 546 231 528 577
Effective Base 635 299 346 123 159 189 173 543 34 67 15 214 233 175 182 247 206 269 285 62 244 391 196 304 136 241 397
Hillary Clinton 514 240 274 101 132 179 102 294 57 121 17 14 353 143 259 218 36 514 - - 201 313 184 235 95 210 288
45% 40% 50% 42% 46% 49% 40% 36% 55% 83% 44% 4% 83% 44% 80% 48% 10% 100% - - 46% 44% 50% 43% 41% 40% 50%
Donald Trump 507 295 212 102 129 148 127 436 33 13 10 335 52 117 50 163 293 - 507 - 187 320 156 231 119 262 225
44% 49% 39% 42% 45% 41% 50% 53% 32% 9% 27% 88% 12% 36% 15% 36% 80% - 100% - 42% 45% 42% 42% 52% 50% 39%
Gary Johnson 42 29 14 8 11 15 9 36 1 5 - 18 3 19 2 20 20 - - 42 23 20 8 30 4 26 16
4% 5% 2% 3% 4% 4% 3% 4% 1% 4% - 5% 1% 6% 1% 4% 5% - - 47% 5% 3% 2% 6% 2% 5% 3%
Jill Stein 11 5 6 4 3 3 1 6 2 1 - - 1 9 7 5 - - - 11 7 5 3 6 3 4 8
1% 1% 1% 2% 1% 1% * 1% 2% 1% - - * 3% 2% 1% - - - 13% 2% 1% 1% 1% 1% 1% 1%
Other 37 17 20 14 6 6 11 21 7 1 7 10 8 15 5 19 13 - - 37 12 25 13 19 5 14 23
3% 3% 4% 6% 2% 2% 4% 3% 7% 1% 18% 3% 2% 5% 2% 4% 4% - - 41% 3% 4% 3% 4% 2% 3% 4%
Prefer not to answer 36 14 22 13 7 10 6 22 3 3 4 5 11 19 3 28 5 - - - 11 25 6 25 4 14 17
3% 2% 4% 5% 2% 3% 2% 3% 3% 2% 11% 1% 2% 6% 1% 6% 1% - - - 2% 4% 2% 5% 2% 3% 3%
Sigma 1147 600 547 242 288 361 256 815 104 146 39 382 427 322 326 454 368 514 507 90 440 706 369 546 231 528 577
100% 100% 100% 100% 100% 100% 100% 100% 100% 100% 100% 100% 100% 100% 100% 100% 100% 100% 100% 100% 100% 100% 100% 100% 100% 100% 100%
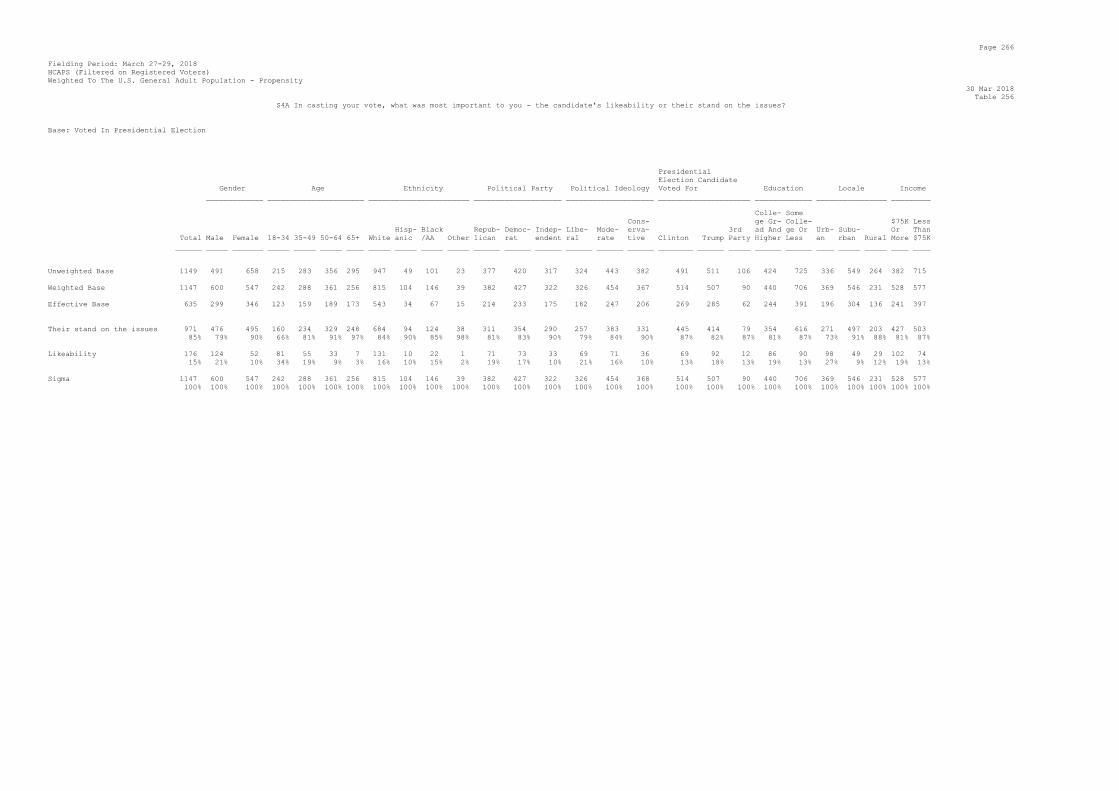
Page 266
Fielding Period: March 27-29, 2018
HCAPS (Filtered on Registered Voters)
Weighted To The U.S. General Adult Population - Propensity
30 Mar 2018
Table 256
S4A In casting your vote, what was most important to you - the candidate's likeability or their stand on the issues?
Base: Voted In Presidential Election
Presidential
Election Candidate
Gender Age Ethnicity Political Party Political Ideology Voted For Education Locale Income
_____________ ______________________ _______________________ ____________________ ____________________ _____________________ _____________ ________________ _________
Colle- Some
Cons- ge Gr- Colle- $75K Less
Hisp- Black Repub- Democ- Indep- Libe- Mode- erva- 3rd ad And ge Or Urb- Subu- Or Than
Total Male Female 18-34 35-49 50-64 65+ White anic /AA Other lican rat endent ral rate tive Clinton Trump Party Higher Less an rban Rural More $75K
______ _____ _______ _____ _____ _____ ____ _____ _____ _____ _____ ______ ______ ______ ______ ______ ______ ________ ______ _____ ______ ______ ____ _____ _____ ____ ____
Unweighted Base 1149 491 658 215 283 356 295 947 49 101 23 377 420 317 324 443 382 491 511 106 424 725 336 549 264 382 715
Weighted Base 1147 600 547 242 288 361 256 815 104 146 39 382 427 322 326 454 367 514 507 90 440 706 369 546 231 528 577
Effective Base 635 299 346 123 159 189 173 543 34 67 15 214 233 175 182 247 206 269 285 62 244 391 196 304 136 241 397
Their stand on the issues 971 476 495 160 234 329 248 684 94 124 38 311 354 290 257 383 331 445 414 79 354 616 271 497 203 427 503
85% 79% 90% 66% 81% 91% 97% 84% 90% 85% 98% 81% 83% 90% 79% 84% 90% 87% 82% 87% 81% 87% 73% 91% 88% 81% 87%
Likeability 176 124 52 81 55 33 7 131 10 22 1 71 73 33 69 71 36 69 92 12 86 90 98 49 29 102 74
15% 21% 10% 34% 19% 9% 3% 16% 10% 15% 2% 19% 17% 10% 21% 16% 10% 13% 18% 13% 19% 13% 27% 9% 12% 19% 13%
Sigma 1147 600 547 242 288 361 256 815 104 146 39 382 427 322 326 454 368 514 507 90 440 706 369 546 231 528 577
100% 100% 100% 100% 100% 100% 100% 100% 100% 100% 100% 100% 100% 100% 100% 100% 100% 100% 100% 100% 100% 100% 100% 100% 100% 100% 100%

Page 267
Fielding Period: March 27-29, 2018
HCAPS (Filtered on Registered Voters)
Weighted To The U.S. General Adult Population - Propensity
30 Mar 2018
Table 257
D10 Are you registered to vote at your present address?
Base: All Respondents
Presidential
Election Candidate
Gender Age Ethnicity Political Party Political Ideology Voted For Education Locale Income
_____________ ______________________ _______________________ ____________________ ____________________ _____________________ _____________ ________________ _________
Colle- Some
Cons- ge Gr- Colle- $75K Less
Hisp- Black Repub- Democ- Indep- Libe- Mode- erva- 3rd ad And ge Or Urb- Subu- Or Than
Total Male Female 18-34 35-49 50-64 65+ White anic /AA Other lican rat endent ral rate tive Clinton Trump Party Higher Less an rban Rural More $75K
______ _____ _______ _____ _____ _____ ____ _____ _____ _____ _____ ______ ______ ______ ______ ______ ______ ________ ______ _____ ______ ______ ____ _____ _____ ____ ____
Unweighted Base 1340 538 802 296 337 392 315 1078 68 123 27 415 478 384 366 551 423 491 511 106 452 888 398 633 309 404 868
Weighted Base 1340 658 682 343 329 387 282 910 161 165 45 429 496 389 364 558 418 514 507 90 469 871 442 636 263 563 715
Effective Base 720 324 402 155 187 207 184 611 48 79 16 232 261 206 197 299 225 269 285 62 260 461 224 340 160 251 466
Yes 1223 620 603 288 301 370 265 848 135 152 44 406 450 350 337 498 388 499 490 87 457 766 397 583 243 537 628
91% 94% 88% 84% 92% 96% 94% 93% 84% 92% 97% 95% 91% 90% 93% 89% 93% 97% 97% 96% 97% 88% 90% 92% 93% 95% 88%
No 88 32 56 44 23 10 11 46 23 12 1 20 31 29 22 40 26 13 8 3 9 79 34 36 18 20 66
7% 5% 8% 13% 7% 3% 4% 5% 14% 8% 2% 5% 6% 8% 6% 7% 6% 3% 2% 3% 2% 9% 8% 6% 7% 4% 9%
Not Sure 29 6 23 11 5 7 7 16 3 - 1 3 15 9 5 20 4 2 8 * 3 26 11 16 1 6 22
2% 1% 3% 3% 2% 2% 2% 2% 2% - 1% 1% 3% 2% 1% 4% 1% * 2% * 1% 3% 3% 3% 1% 1% 3%
Sigma 1340 658 682 343 329 387 282 910 161 165 45 429 496 389 364 558 418 514 507 90 469 871 442 636 263 563 715
100% 100% 100% 100% 100% 100% 100% 100% 100% 100% 100% 100% 100% 100% 100% 100% 100% 100% 100% 100% 100% 100% 100% 100% 100% 100% 100%

Page 268
Fielding Period: March 27-29, 2018
HCAPS (Filtered on Registered Voters)
Weighted To The U.S. General Adult Population - Propensity
30 Mar 2018
Table 258
D11 What is your religion?
Base: All Respondents
Presidential
Election Candidate
Gender Age Ethnicity Political Party Political Ideology Voted For Education Locale Income
_____________ ______________________ _______________________ ____________________ ____________________ _____________________ _____________ ________________ _________
Colle- Some
Cons- ge Gr- Colle- $75K Less
Hisp- Black Repub- Democ- Indep- Libe- Mode- erva- 3rd ad And ge Or Urb- Subu- Or Than
Total Male Female 18-34 35-49 50-64 65+ White anic /AA Other lican rat endent ral rate tive Clinton Trump Party Higher Less an rban Rural More $75K
______ _____ _______ _____ _____ _____ ____ _____ _____ _____ _____ ______ ______ ______ ______ ______ ______ ________ ______ _____ ______ ______ ____ _____ _____ ____ ____
Unweighted Base 1340 538 802 296 337 392 315 1078 68 123 27 415 478 384 366 551 423 491 511 106 452 888 398 633 309 404 868
Weighted Base 1340 658 682 343 329 387 282 910 161 165 45 429 496 389 364 558 418 514 507 90 469 871 442 636 263 563 715
Effective Base 720 324 402 155 187 207 184 611 48 79 16 232 261 206 197 299 225 269 285 62 260 461 224 340 160 251 466
Evangelical Protestant 172 96 76 45 29 49 48 131 10 24 3 105 36 27 33 31 108 34 101 15 66 106 68 53 51 73 96
13% 15% 11% 13% 9% 13% 17% 14% 6% 15% 7% 25% 7% 7% 9% 6% 26% 7% 20% 16% 14% 12% 15% 8% 19% 13% 13%
Non-Evangelical Protestant 126 69 57 23 16 50 37 88 9 25 3 38 50 36 35 53 38 50 42 12 42 84 34 54 38 43 71
9% 10% 8% 7% 5% 13% 13% 10% 5% 15% 7% 9% 10% 9% 10% 10% 9% 10% 8% 14% 9% 10% 8% 9% 15% 8% 10%
Roman Catholic 357 183 174 93 90 102 73 260 72 6 1 128 135 90 82 169 106 125 159 21 135 223 125 179 53 204 143
27% 28% 26% 27% 27% 26% 26% 29% 44% 4% 3% 30% 27% 23% 23% 30% 25% 24% 31% 23% 29% 26% 28% 28% 20% 36% 20%
Mormon 12 4 8 3 2 2 5 11 - * 1 10 1 1 1 1 10 1 4 4 5 7 4 3 5 4 7
1% 1% 1% 1% 1% 1% 2% 1% - * 3% 2% * * * * 3% * 1% 4% 1% 1% 1% 1% 2% 1% 1%
Other Christian 254 97 157 68 84 68 34 155 28 51 13 82 87 81 49 128 77 84 102 12 67 187 71 140 43 88 161
19% 15% 23% 20% 25% 17% 12% 17% 18% 31% 28% 19% 17% 21% 13% 23% 18% 16% 20% 14% 14% 21% 16% 22% 17% 16% 23%
Jewish 23 14 9 2 9 7 6 21 2 1 - 1 13 8 10 10 4 15 6 1 11 13 7 16 1 11 9
2% 2% 1% 1% 3% 2% 2% 2% 1% 1% - * 3% 2% 3% 2% 1% 3% 1% 1% 2% 1% 1% 3% * 2% 1%
Muslim 1 1 - - - 1 - 1 - - - 1 - - - - 1 - 1 - 1 - 1 - - 1 -
* * - - - * - * - - - * - - - - * - * - * - * - - * -
Hindu 2 2 * - 1 1 - - - - - - 2 - 1 1 - 2 - - 2 - 2 * - - 2
* * * - * * - - - - - - * - * * - * - - * - * * - - *
Buddhist 10 6 4 5 2 2 2 3 - 1 - 1 2 7 4 6 1 3 2 * 6 5 5 6 - 1 9
1% 1% 1% 1% * 1% 1% * - 1% - * * 2% 1% 1% * 1% * * 1% 1% 1% 1% - * 1%
Atheist/Agnostic 178 97 80 53 38 49 37 126 21 7 12 16 90 67 101 54 23 108 30 14 84 93 60 90 28 77 86
13% 15% 12% 15% 12% 13% 13% 14% 13% 4% 28% 4% 18% 17% 28% 10% 6% 21% 6% 16% 18% 11% 14% 14% 11% 14% 12%
Other 204 89 115 50 58 56 40 113 20 49 11 45 80 73 50 105 49 91 58 11 50 154 67 94 43 61 131
15% 14% 17% 14% 18% 15% 14% 12% 13% 30% 24% 10% 16% 19% 14% 19% 12% 18% 11% 12% 11% 18% 15% 15% 16% 11% 18%
Sigma 1340 658 682 343 329 387 282 910 161 165 45 429 496 389 364 558 418 514 507 90 469 871 442 636 263 563 715
100% 100% 100% 100% 100% 100% 100% 100% 100% 100% 100% 100% 100% 100% 100% 100% 100% 100% 100% 100% 100% 100% 100% 100% 100% 100% 100%

Page 269
Fielding Period: March 27-29, 2018
HCAPS (Filtered on Registered Voters)
Weighted To The U.S. General Adult Population - Propensity
30 Mar 2018
Table 259
D12 How often do you attend religion services, events, or gatherings?
Base: All Respondents
Presidential
Election Candidate
Gender Age Ethnicity Political Party Political Ideology Voted For Education Locale Income
_____________ ______________________ _______________________ ____________________ ____________________ _____________________ _____________ ________________ _________
Colle- Some
Cons- ge Gr- Colle- $75K Less
Hisp- Black Repub- Democ- Indep- Libe- Mode- erva- 3rd ad And ge Or Urb- Subu- Or Than
Total Male Female 18-34 35-49 50-64 65+ White anic /AA Other lican rat endent ral rate tive Clinton Trump Party Higher Less an rban Rural More $75K
______ _____ _______ _____ _____ _____ ____ _____ _____ _____ _____ ______ ______ ______ ______ ______ ______ ________ ______ _____ ______ ______ ____ _____ _____ ____ ____
Unweighted Base 1340 538 802 296 337 392 315 1078 68 123 27 415 478 384 366 551 423 491 511 106 452 888 398 633 309 404 868
Weighted Base 1340 658 682 343 329 387 282 910 161 165 45 429 496 389 364 558 418 514 507 90 469 871 442 636 263 563 715
Effective Base 720 324 402 155 187 207 184 611 48 79 16 232 261 206 197 299 225 269 285 62 260 461 224 340 160 251 466
Daily 57 45 12 28 14 13 2 35 - 19 - 30 22 5 18 18 21 18 30 6 39 17 36 19 2 37 19
4% 7% 2% 8% 4% 3% 1% 4% - 12% - 7% 4% 1% 5% 3% 5% 4% 6% 6% 8% 2% 8% 3% 1% 7% 3%
Weekly 356 173 183 83 88 100 85 243 42 46 8 161 107 83 80 118 158 101 180 30 135 221 120 166 70 164 179
27% 26% 27% 24% 27% 26% 30% 27% 26% 28% 17% 37% 22% 21% 22% 21% 38% 20% 35% 33% 29% 25% 27% 26% 27% 29% 25%
A few times per month 140 68 72 59 30 32 19 87 25 16 5 55 48 36 12 81 47 54 57 3 50 89 55 53 31 55 74
10% 10% 10% 17% 9% 8% 7% 10% 15% 10% 10% 13% 10% 9% 3% 14% 11% 11% 11% 4% 11% 10% 13% 8% 12% 10% 10%
Once a month 92 53 39 25 25 27 16 59 12 17 1 29 33 29 24 41 27 37 37 4 29 63 21 55 16 47 42
7% 8% 6% 7% 8% 7% 6% 6% 7% 10% 3% 7% 7% 8% 7% 7% 6% 7% 7% 4% 6% 7% 5% 9% 6% 8% 6%
Almost never 695 319 376 148 172 215 160 486 82 66 31 154 287 237 230 300 165 303 203 47 215 480 210 343 142 260 401
52% 49% 55% 43% 52% 56% 57% 53% 51% 40% 69% 36% 58% 61% 63% 54% 39% 59% 40% 52% 46% 55% 47% 54% 54% 46% 56%
Sigma 1340 658 682 343 329 387 282 910 161 165 45 429 496 389 364 558 418 514 507 90 469 871 442 636 263 563 715
100% 100% 100% 100% 100% 100% 100% 100% 100% 100% 100% 100% 100% 100% 100% 100% 100% 100% 100% 100% 100% 100% 100% 100% 100% 100% 100%

Page 270
Fielding Period: March 27-29, 2018
HCAPS (Filtered on Registered Voters)
Weighted To The U.S. General Adult Population - Propensity
30 Mar 2018
Table 260
D13 How important or unimportant is religion in your life?
Base: All Respondents
Presidential
Election Candidate
Gender Age Ethnicity Political Party Political Ideology Voted For Education Locale Income
_____________ ______________________ _______________________ ____________________ ____________________ _____________________ _____________ ________________ _________
Colle- Some
Cons- ge Gr- Colle- $75K Less
Hisp- Black Repub- Democ- Indep- Libe- Mode- erva- 3rd ad And ge Or Urb- Subu- Or Than
Total Male Female 18-34 35-49 50-64 65+ White anic /AA Other lican rat endent ral rate tive Clinton Trump Party Higher Less an rban Rural More $75K
______ _____ _______ _____ _____ _____ ____ _____ _____ _____ _____ ______ ______ ______ ______ ______ ______ ________ ______ _____ ______ ______ ____ _____ _____ ____ ____
Unweighted Base 1340 538 802 296 337 392 315 1078 68 123 27 415 478 384 366 551 423 491 511 106 452 888 398 633 309 404 868
Weighted Base 1340 658 682 343 329 387 282 910 161 165 45 429 496 389 364 558 418 514 507 90 469 871 442 636 263 563 715
Effective Base 720 324 402 155 187 207 184 611 48 79 16 232 261 206 197 299 225 269 285 62 260 461 224 340 160 251 466
Very/Somewhat Important 926 429 496 240 229 261 196 611 122 134 21 360 315 234 204 377 345 302 404 53 308 618 315 419 192 363 523
(Net) 69% 65% 73% 70% 70% 68% 70% 67% 76% 82% 46% 84% 64% 60% 56% 68% 82% 59% 80% 59% 66% 71% 71% 66% 73% 65% 73%
Very important 539 253 286 112 142 159 127 370 53 92 12 234 185 109 120 193 226 171 251 33 180 359 195 236 108 204 316
40% 38% 42% 33% 43% 41% 45% 41% 33% 56% 27% 54% 37% 28% 33% 35% 54% 33% 49% 37% 38% 41% 44% 37% 41% 36% 44%
Somewhat important 387 176 210 128 86 103 70 241 69 43 9 126 130 125 84 185 118 131 153 19 128 258 120 182 84 159 207
29% 27% 31% 37% 26% 27% 25% 27% 43% 26% 19% 29% 26% 32% 23% 33% 28% 25% 30% 22% 27% 30% 27% 29% 32% 28% 29%
Very/Somewhat Unimportant 414 229 186 103 100 126 86 298 39 30 24 69 181 155 161 180 73 212 103 38 161 253 126 217 71 200 192
(Net) 31% 35% 27% 30% 30% 32% 30% 33% 24% 18% 54% 16% 36% 40% 44% 32% 18% 41% 20% 41% 34% 29% 29% 34% 27% 35% 27%
Somewhat unimportant 145 74 71 34 44 43 25 96 20 11 15 35 59 48 39 76 31 61 44 13 40 105 34 85 26 68 72
11% 11% 10% 10% 13% 11% 9% 10% 13% 7% 33% 8% 12% 12% 11% 14% 7% 12% 9% 14% 9% 12% 8% 13% 10% 12% 10%
Very unimportant 269 155 115 69 56 83 61 203 19 19 9 34 122 107 122 105 43 151 59 25 121 148 92 132 45 132 121
20% 23% 17% 20% 17% 21% 22% 22% 12% 12% 21% 8% 25% 27% 33% 19% 10% 29% 12% 28% 26% 17% 21% 21% 17% 23% 17%
Sigma 1340 658 682 343 329 387 282 910 161 165 45 429 496 389 364 558 418 514 507 90 469 871 442 636 263 563 715
100% 100% 100% 100% 100% 100% 100% 100% 100% 100% 100% 100% 100% 100% 100% 100% 100% 100% 100% 100% 100% 100% 100% 100% 100% 100% 100%

Page 271
Fielding Period: March 27-29, 2018
HCAPS (Filtered on Registered Voters)
Weighted To The U.S. General Adult Population - Propensity
30 Mar 2018
Table 261
D14 Does anyone in your household own a gun?
Base: All Respondents
Presidential
Election Candidate
Gender Age Ethnicity Political Party Political Ideology Voted For Education Locale Income
_____________ ______________________ _______________________ ____________________ ____________________ _____________________ _____________ ________________ _________
Colle- Some
Cons- ge Gr- Colle- $75K Less
Hisp- Black Repub- Democ- Indep- Libe- Mode- erva- 3rd ad And ge Or Urb- Subu- Or Than
Total Male Female 18-34 35-49 50-64 65+ White anic /AA Other lican rat endent ral rate tive Clinton Trump Party Higher Less an rban Rural More $75K
______ _____ _______ _____ _____ _____ ____ _____ _____ _____ _____ ______ ______ ______ ______ ______ ______ ________ ______ _____ ______ ______ ____ _____ _____ ____ ____
Unweighted Base 1340 538 802 296 337 392 315 1078 68 123 27 415 478 384 366 551 423 491 511 106 452 888 398 633 309 404 868
Weighted Base 1340 658 682 343 329 387 282 910 161 165 45 429 496 389 364 558 418 514 507 90 469 871 442 636 263 563 715
Effective Base 720 324 402 155 187 207 184 611 48 79 16 232 261 206 197 299 225 269 285 62 260 461 224 340 160 251 466
Yes 448 256 192 109 97 151 91 328 52 41 17 186 115 142 86 178 184 121 239 32 157 291 100 220 128 199 223
33% 39% 28% 32% 29% 39% 32% 36% 32% 25% 37% 43% 23% 37% 24% 32% 44% 24% 47% 36% 34% 33% 23% 35% 49% 35% 31%
No 892 402 490 234 232 235 191 582 109 123 28 243 381 247 278 379 234 393 267 58 312 580 342 416 135 364 492
67% 61% 72% 68% 71% 61% 68% 64% 68% 75% 63% 57% 77% 63% 76% 68% 56% 76% 53% 64% 66% 67% 77% 65% 51% 65% 69%
Sigma 1340 658 682 343 329 387 282 910 161 165 45 429 496 389 364 558 418 514 507 90 469 871 442 636 263 563 715
100% 100% 100% 100% 100% 100% 100% 100% 100% 100% 100% 100% 100% 100% 100% 100% 100% 100% 100% 100% 100% 100% 100% 100% 100% 100% 100%

Page 272
Fielding Period: March 27-29, 2018
HCAPS (Filtered on Registered Voters)
Weighted To The U.S. General Adult Population - Propensity
30 Mar 2018
Table 262
Q2145 Which of the following best describes your current primary residence?
I/We live in...
Base: All Respondents
Presidential
Election Candidate
Gender Age Ethnicity Political Party Political Ideology Voted For Education Locale Income
_____________ ______________________ _______________________ ____________________ ____________________ _____________________ _____________ ________________ _________
Colle- Some
Cons- ge Gr- Colle- $75K Less
Hisp- Black Repub- Democ- Indep- Libe- Mode- erva- 3rd ad And ge Or Urb- Subu- Or Than
Total Male Female 18-34 35-49 50-64 65+ White anic /AA Other lican rat endent ral rate tive Clinton Trump Party Higher Less an rban Rural More $75K
______ _____ _______ _____ _____ _____ ____ _____ _____ _____ _____ ______ ______ ______ ______ ______ ______ ________ ______ _____ ______ ______ ____ _____ _____ ____ ____
Unweighted Base 1340 538 802 296 337 392 315 1078 68 123 27 415 478 384 366 551 423 491 511 106 452 888 398 633 309 404 868
Weighted Base 1340 658 682 343 329 387 282 910 161 165 45 429 496 389 364 558 418 514 507 90 469 871 442 636 263 563 715
Effective Base 720 324 402 155 187 207 184 611 48 79 16 232 261 206 197 299 225 269 285 62 260 461 224 340 160 251 466
A house that I/we own 761 422 340 174 175 229 184 587 74 51 22 286 249 215 199 288 275 263 343 54 298 463 197 405 160 403 322
57% 64% 50% 51% 53% 59% 65% 65% 46% 31% 49% 67% 50% 55% 55% 52% 66% 51% 68% 59% 64% 53% 45% 64% 61% 72% 45%
An apartment or condominium 73 30 44 19 8 32 14 39 7 17 7 23 30 20 13 44 16 34 23 5 44 30 42 30 1 33 37
that I/we own 5% 5% 6% 6% 3% 8% 5% 4% 4% 10% 16% 5% 6% 5% 3% 8% 4% 7% 5% 6% 9% 3% 10% 5% * 6% 5%
Another type of home that I/ 23 5 18 3 8 3 9 20 2 * 1 9 8 5 6 7 10 9 7 1 4 19 6 10 7 3 19
we own 2% 1% 3% 1% 2% 1% 3% 2% 1% * 2% 2% 2% 1% 2% 1% 2% 2% 1% 1% 1% 2% 1% 1% 3% 1% 3%
A house that I/we rent or 227 102 126 79 80 45 22 132 43 33 6 70 85 66 67 95 66 79 79 16 72 156 64 96 67 75 138
lease 17% 15% 18% 23% 24% 12% 8% 14% 27% 20% 12% 16% 17% 17% 18% 17% 16% 15% 16% 17% 15% 18% 15% 15% 26% 13% 19%
An apartment or condominium 203 80 123 50 47 60 47 103 26 56 9 33 105 58 62 102 39 108 45 11 46 157 111 74 19 35 165
that I/we rent or lease 15% 12% 18% 14% 14% 16% 17% 11% 16% 34% 21% 8% 21% 15% 17% 18% 9% 21% 9% 12% 10% 18% 25% 12% 7% 6% 23%
Another type of home that I/ 23 9 14 5 3 9 5 12 5 3 - 3 9 11 10 5 8 9 7 3 2 21 13 7 3 10 13
we rent or lease 2% 1% 2% 2% 1% 2% 2% 1% 3% 2% - 1% 2% 3% 3% 1% 2% 2% 1% 3% 1% 2% 3% 1% 1% 2% 2%
None of these 29 12 17 12 8 7 2 16 5 5 - 4 9 14 9 16 4 13 2 1 3 25 7 15 6 4 20
2% 2% 3% 3% 2% 2% 1% 2% 3% 3% - 1% 2% 4% 2% 3% 1% 2% * 1% 1% 3% 2% 2% 2% 1% 3%
Sigma 1340 658 682 343 329 387 282 910 161 165 45 429 496 389 364 558 418 514 507 90 469 871 442 636 263 563 715
100% 100% 100% 100% 100% 100% 100% 100% 100% 100% 100% 100% 100% 100% 100% 100% 100% 100% 100% 100% 100% 100% 100% 100% 100% 100% 100%
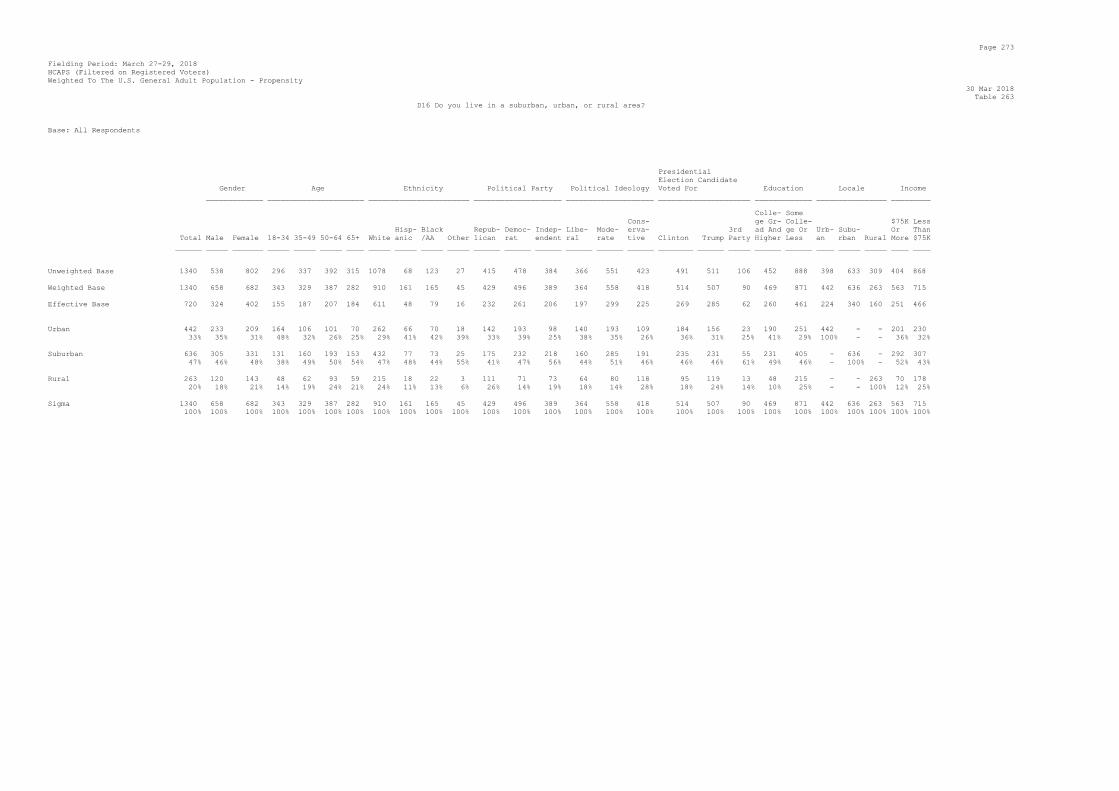
Page 273
Fielding Period: March 27-29, 2018
HCAPS (Filtered on Registered Voters)
Weighted To The U.S. General Adult Population - Propensity
30 Mar 2018
Table 263
D16 Do you live in a suburban, urban, or rural area?
Base: All Respondents
Presidential
Election Candidate
Gender Age Ethnicity Political Party Political Ideology Voted For Education Locale Income
_____________ ______________________ _______________________ ____________________ ____________________ _____________________ _____________ ________________ _________
Colle- Some
Cons- ge Gr- Colle- $75K Less
Hisp- Black Repub- Democ- Indep- Libe- Mode- erva- 3rd ad And ge Or Urb- Subu- Or Than
Total Male Female 18-34 35-49 50-64 65+ White anic /AA Other lican rat endent ral rate tive Clinton Trump Party Higher Less an rban Rural More $75K
______ _____ _______ _____ _____ _____ ____ _____ _____ _____ _____ ______ ______ ______ ______ ______ ______ ________ ______ _____ ______ ______ ____ _____ _____ ____ ____
Unweighted Base 1340 538 802 296 337 392 315 1078 68 123 27 415 478 384 366 551 423 491 511 106 452 888 398 633 309 404 868
Weighted Base 1340 658 682 343 329 387 282 910 161 165 45 429 496 389 364 558 418 514 507 90 469 871 442 636 263 563 715
Effective Base 720 324 402 155 187 207 184 611 48 79 16 232 261 206 197 299 225 269 285 62 260 461 224 340 160 251 466
Urban 442 233 209 164 106 101 70 262 66 70 18 142 193 98 140 193 109 184 156 23 190 251 442 - - 201 230
33% 35% 31% 48% 32% 26% 25% 29% 41% 42% 39% 33% 39% 25% 38% 35% 26% 36% 31% 25% 41% 29% 100% - - 36% 32%
Suburban 636 305 331 131 160 193 153 432 77 73 25 175 232 218 160 285 191 235 231 55 231 405 - 636 - 292 307
47% 46% 48% 38% 49% 50% 54% 47% 48% 44% 55% 41% 47% 56% 44% 51% 46% 46% 46% 61% 49% 46% - 100% - 52% 43%
Rural 263 120 143 48 62 93 59 215 18 22 3 111 71 73 64 80 118 95 119 13 48 215 - - 263 70 178
20% 18% 21% 14% 19% 24% 21% 24% 11% 13% 6% 26% 14% 19% 18% 14% 28% 18% 24% 14% 10% 25% - - 100% 12% 25%
Sigma 1340 658 682 343 329 387 282 910 161 165 45 429 496 389 364 558 418 514 507 90 469 871 442 636 263 563 715
100% 100% 100% 100% 100% 100% 100% 100% 100% 100% 100% 100% 100% 100% 100% 100% 100% 100% 100% 100% 100% 100% 100% 100% 100% 100% 100%

Page 274
Fielding Period: March 27-29, 2018
HCAPS (Filtered on Registered Voters)
Weighted To The U.S. General Adult Population - Propensity
30 Mar 2018
Table 264
D18 Are you a Citizen of the United States?
Base: All Respondents
Presidential
Election Candidate
Gender Age Ethnicity Political Party Political Ideology Voted For Education Locale Income
_____________ ______________________ _______________________ ____________________ ____________________ _____________________ _____________ ________________ _________
Colle- Some
Cons- ge Gr- Colle- $75K Less
Hisp- Black Repub- Democ- Indep- Libe- Mode- erva- 3rd ad And ge Or Urb- Subu- Or Than
Total Male Female 18-34 35-49 50-64 65+ White anic /AA Other lican rat endent ral rate tive Clinton Trump Party Higher Less an rban Rural More $75K
______ _____ _______ _____ _____ _____ ____ _____ _____ _____ _____ ______ ______ ______ ______ ______ ______ ________ ______ _____ ______ ______ ____ _____ _____ ____ ____
Unweighted Base 1340 538 802 296 337 392 315 1078 68 123 27 415 478 384 366 551 423 491 511 106 452 888 398 633 309 404 868
Weighted Base 1340 658 682 343 329 387 282 910 161 165 45 429 496 389 364 558 418 514 507 90 469 871 442 636 263 563 715
Effective Base 720 324 402 155 187 207 184 611 48 79 16 232 261 206 197 299 225 269 285 62 260 461 224 340 160 251 466
Yes 1332 652 680 336 328 385 282 909 157 163 45 428 489 389 361 555 417 513 506 90 468 864 435 634 263 563 708
99% 99% 100% 98% 100% 100% 100% 100% 98% 99% 100% 100% 99% 100% 99% 99% 100% 100% 100% 100% 100% 99% 99% 100% 100% 100% 99%
No 8 6 2 6 * 1 - 1 4 1 - 1 7 - 4 3 1 1 1 - 1 6 6 2 - - 8
1% 1% * 2% * * - * 2% 1% - * 1% - 1% 1% * * * - * 1% 1% * - - 1%
Sigma 1340 658 682 343 329 387 282 910 161 165 45 429 496 389 364 558 418 514 507 90 469 871 442 636 263 563 715
100% 100% 100% 100% 100% 100% 100% 100% 100% 100% 100% 100% 100% 100% 100% 100% 100% 100% 100% 100% 100% 100% 100% 100% 100% 100% 100%

Page 275
Fielding Period: March 27-29, 2018
HCAPS (Filtered on Registered Voters)
Weighted To The U.S. General Adult Population - Propensity
30 Mar 2018
Table 265
HO1 Do you have health insurance?
Base: All Respondents
Presidential
Election Candidate
Gender Age Ethnicity Political Party Political Ideology Voted For Education Locale Income
_____________ ______________________ _______________________ ____________________ ____________________ _____________________ _____________ ________________ _________
Colle- Some
Cons- ge Gr- Colle- $75K Less
Hisp- Black Repub- Democ- Indep- Libe- Mode- erva- 3rd ad And ge Or Urb- Subu- Or Than
Total Male Female 18-34 35-49 50-64 65+ White anic /AA Other lican rat endent ral rate tive Clinton Trump Party Higher Less an rban Rural More $75K
______ _____ _______ _____ _____ _____ ____ _____ _____ _____ _____ ______ ______ ______ ______ ______ ______ ________ ______ _____ ______ ______ ____ _____ _____ ____ ____
Unweighted Base 1340 538 802 296 337 392 315 1078 68 123 27 415 478 384 366 551 423 491 511 106 452 888 398 633 309 404 868
Weighted Base 1340 658 682 343 329 387 282 910 161 165 45 429 496 389 364 558 418 514 507 90 469 871 442 636 263 563 715
Effective Base 720 324 402 155 187 207 184 611 48 79 16 232 261 206 197 299 225 269 285 62 260 461 224 340 160 251 466
Yes 1243 609 634 311 302 351 279 854 150 146 43 410 459 351 330 512 401 481 479 83 456 787 405 599 239 547 636
93% 93% 93% 91% 92% 91% 99% 94% 93% 88% 97% 96% 93% 90% 91% 92% 96% 94% 95% 92% 97% 90% 92% 94% 91% 97% 89%
No 97 49 48 32 26 36 3 56 11 19 1 19 36 37 34 45 17 33 27 7 13 84 36 37 24 16 79
7% 7% 7% 9% 8% 9% 1% 6% 7% 12% 3% 4% 7% 10% 9% 8% 4% 6% 5% 8% 3% 10% 8% 6% 9% 3% 11%
Sigma 1340 658 682 343 329 387 282 910 161 165 45 429 496 389 364 558 418 514 507 90 469 871 442 636 263 563 715
100% 100% 100% 100% 100% 100% 100% 100% 100% 100% 100% 100% 100% 100% 100% 100% 100% 100% 100% 100% 100% 100% 100% 100% 100% 100% 100%

Page 276
Fielding Period: March 27-29, 2018
HCAPS (Filtered on Registered Voters)
Weighted To The U.S. General Adult Population - Propensity
30 Mar 2018
Table 266
Q2157 Which of the following income categories best describes your total 2017 household income before taxes?
Base: All Respondents
Presidential
Election Candidate
Gender Age Ethnicity Political Party Political Ideology Voted For Education Locale Income
_____________ ______________________ _______________________ ____________________ ____________________ _____________________ _____________ ________________ _________
Colle- Some
Cons- ge Gr- Colle- $75K Less
Hisp- Black Repub- Democ- Indep- Libe- Mode- erva- 3rd ad And ge Or Urb- Subu- Or Than
Total Male Female 18-34 35-49 50-64 65+ White anic /AA Other lican rat endent ral rate tive Clinton Trump Party Higher Less an rban Rural More $75K
______ _____ _______ _____ _____ _____ ____ _____ _____ _____ _____ ______ ______ ______ ______ ______ ______ ________ ______ _____ ______ ______ ____ _____ _____ ____ ____
Unweighted Base 1340 538 802 296 337 392 315 1078 68 123 27 415 478 384 366 551 423 491 511 106 452 888 398 633 309 404 868
Weighted Base 1340 658 682 343 329 387 282 910 161 165 45 429 496 389 364 558 418 514 507 90 469 871 442 636 263 563 715
Effective Base 720 324 402 155 187 207 184 611 48 79 16 232 261 206 197 299 225 269 285 62 260 461 224 340 160 251 466
Less than $15,000 109 33 77 40 22 27 21 67 10 24 4 22 48 37 37 45 27 32 31 4 8 102 45 35 30 - 109
8% 5% 11% 12% 7% 7% 8% 7% 6% 15% 8% 5% 10% 10% 10% 8% 7% 6% 6% 5% 2% 12% 10% 5% 12% - 15%
$15,000 to $24,999 110 29 81 34 27 30 19 64 20 17 4 31 48 28 25 56 29 44 26 4 15 95 43 32 35 - 110
8% 4% 12% 10% 8% 8% 7% 7% 12% 10% 9% 7% 10% 7% 7% 10% 7% 9% 5% 4% 3% 11% 10% 5% 13% - 15%
$25,000 to $34,999 114 47 67 19 25 46 24 61 26 23 2 29 54 27 20 56 37 44 44 7 18 96 39 52 22 - 114
8% 7% 10% 6% 8% 12% 8% 7% 16% 14% 4% 7% 11% 7% 6% 10% 9% 9% 9% 8% 4% 11% 9% 8% 8% - 16%
$35,000 to $49,999 159 71 88 41 27 51 41 107 24 24 2 40 75 42 47 59 53 79 40 12 24 135 36 80 42 - 159
12% 11% 13% 12% 8% 13% 15% 12% 15% 15% 4% 9% 15% 11% 13% 11% 13% 15% 8% 13% 5% 16% 8% 13% 16% - 22%
$50,000 to $74,999 223 109 113 57 62 56 48 134 26 38 7 68 77 74 62 98 63 89 84 20 72 151 67 108 48 - 223
17% 17% 17% 16% 19% 15% 17% 15% 16% 23% 15% 16% 16% 19% 17% 18% 15% 17% 17% 22% 15% 17% 15% 17% 18% - 31%
$75,000 to $99,999 175 101 74 47 56 35 37 126 17 10 13 61 63 50 50 68 57 65 67 18 77 99 53 97 26 175 -
13% 15% 11% 14% 17% 9% 13% 14% 11% 6% 28% 14% 13% 13% 14% 12% 14% 13% 13% 20% 16% 11% 12% 15% 10% 31% -
$100,000 to $124,999 164 96 68 44 41 53 26 134 14 6 - 68 48 47 32 77 55 58 85 6 86 78 55 93 16 164 -
12% 15% 10% 13% 12% 14% 9% 15% 9% 4% - 16% 10% 12% 9% 14% 13% 11% 17% 6% 18% 9% 12% 15% 6% 29% -
$125,000 to $149,999 105 64 41 12 36 27 30 82 12 9 2 37 31 34 46 21 38 49 49 2 64 41 35 54 16 105 -
8% 10% 6% 4% 11% 7% 11% 9% 7% 6% 4% 9% 6% 9% 13% 4% 9% 10% 10% 3% 14% 5% 8% 8% 6% 19% -
$150,000 to $199,999 52 32 20 8 11 22 10 47 - 3 - 18 9 22 12 25 14 15 24 9 32 20 17 26 8 52 -
4% 5% 3% 2% 3% 6% 4% 5% - 2% - 4% 2% 6% 3% 5% 3% 3% 5% 10% 7% 2% 4% 4% 3% 9% -
$200,000 to $249,999 14 12 2 3 2 6 3 14 - - - 3 9 2 8 4 2 10 4 - 12 3 7 5 3 14 -
1% 2% * 1% 1% 2% 1% 2% - - - 1% 2% * 2% 1% * 2% 1% - 2% * 2% 1% 1% 3% -
$250,000 or more 53 36 17 17 14 20 2 33 5 5 7 29 12 11 14 15 24 12 33 8 46 7 34 17 1 53 -
4% 5% 3% 5% 4% 5% 1% 4% 3% 3% 16% 7% 2% 3% 4% 3% 6% 2% 6% 9% 10% 1% 8% 3% 1% 9% -
Decline to answer 62 28 33 22 6 14 20 41 8 5 5 22 21 16 9 35 17 16 20 * 16 46 10 37 15 - -
5% 4% 5% 6% 2% 4% 7% 5% 5% 3% 12% 5% 4% 4% 3% 6% 4% 3% 4% * 3% 5% 2% 6% 6% - -
Sigma 1340 658 682 343 329 387 282 910 161 165 45 429 496 389 364 558 418 514 507 90 469 871 442 636 263 563 715
100% 100% 100% 100% 100% 100% 100% 100% 100% 100% 100% 100% 100% 100% 100% 100% 100% 100% 100% 100% 100% 100% 100% 100% 100% 100% 100%

Page 277
Fielding Period: March 27-29, 2018
HCAPS (Filtered on Registered Voters)
Weighted To The U.S. General Adult Population - Propensity
30 Mar 2018
Table 267
CA1 Which carrier do you subscribe to for mobile calling and data services?
Base: All Respondents
Presidential
Election Candidate
Gender Age Ethnicity Political Party Political Ideology Voted For Education Locale Income
_____________ ______________________ _______________________ ____________________ ____________________ _____________________ _____________ ________________ _________
Colle- Some
Cons- ge Gr- Colle- $75K Less
Hisp- Black Repub- Democ- Indep- Libe- Mode- erva- 3rd ad And ge Or Urb- Subu- Or Than
Total Male Female 18-34 35-49 50-64 65+ White anic /AA Other lican rat endent ral rate tive Clinton Trump Party Higher Less an rban Rural More $75K
______ _____ _______ _____ _____ _____ ____ _____ _____ _____ _____ ______ ______ ______ ______ ______ ______ ________ ______ _____ ______ ______ ____ _____ _____ ____ ____
Unweighted Base 1340 538 802 296 337 392 315 1078 68 123 27 415 478 384 366 551 423 491 511 106 452 888 398 633 309 404 868
Weighted Base 1340 658 682 343 329 387 282 910 161 165 45 429 496 389 364 558 418 514 507 90 469 871 442 636 263 563 715
Effective Base 720 324 402 155 187 207 184 611 48 79 16 232 261 206 197 299 225 269 285 62 260 461 224 340 160 251 466
AT&T 383 220 164 136 91 95 61 259 35 51 17 153 130 94 96 174 114 131 172 24 178 205 138 185 60 207 152
29% 33% 24% 40% 28% 25% 22% 28% 22% 31% 38% 36% 26% 24% 26% 31% 27% 26% 34% 26% 38% 24% 31% 29% 23% 37% 21%
Verizon 331 178 153 68 75 109 79 273 24 14 7 112 109 102 88 133 109 118 148 25 138 193 73 181 76 187 133
25% 27% 22% 20% 23% 28% 28% 30% 15% 9% 15% 26% 22% 26% 24% 24% 26% 23% 29% 27% 29% 22% 17% 28% 29% 33% 19%
Sprint 113 47 66 27 50 26 11 54 27 22 4 22 44 46 32 53 27 59 33 7 29 83 42 59 13 43 69
8% 7% 10% 8% 15% 7% 4% 6% 17% 13% 9% 5% 9% 12% 9% 10% 7% 11% 6% 8% 6% 10% 9% 9% 5% 8% 10%
T-Mobile 104 52 51 34 22 24 24 60 20 12 3 34 41 24 31 38 34 34 35 9 42 62 46 48 9 31 67
8% 8% 8% 10% 7% 6% 8% 7% 12% 7% 7% 8% 8% 6% 8% 7% 8% 7% 7% 10% 9% 7% 11% 8% 3% 6% 9%
TracFone 58 21 37 5 7 23 23 46 1 8 3 16 20 18 18 22 17 26 20 8 10 48 17 23 18 12 43
4% 3% 5% 1% 2% 6% 8% 5% 1% 5% 6% 4% 4% 5% 5% 4% 4% 5% 4% 9% 2% 6% 4% 4% 7% 2% 6%
Virgin Mobile 48 16 32 11 21 9 7 23 12 8 5 17 16 15 15 14 19 16 17 3 9 38 21 23 5 27 19
4% 2% 5% 3% 6% 2% 3% 3% 8% 5% 10% 4% 3% 4% 4% 3% 4% 3% 3% 4% 2% 4% 5% 4% 2% 5% 3%
MetroPCS 45 16 29 13 12 18 2 19 6 20 1 9 21 14 8 26 11 19 9 4 7 38 25 15 4 7 38
3% 2% 4% 4% 4% 5% 1% 2% 3% 12% 2% 2% 4% 4% 2% 5% 3% 4% 2% 4% 1% 4% 6% 2% 2% 1% 5%
Cricket 37 24 13 11 15 6 5 19 9 3 - 6 21 10 10 14 13 16 8 * 4 33 20 10 7 5 32
3% 4% 2% 3% 5% 1% 2% 2% 5% 2% - 1% 4% 2% 3% 3% 3% 3% 2% * 1% 4% 5% 2% 3% 1% 4%
Consumer Cellular 31 16 15 2 * 15 14 20 3 7 - 13 15 4 6 10 15 13 9 6 6 26 7 18 6 9 21
2% 2% 2% 1% * 4% 5% 2% 2% 4% - 3% 3% 1% 2% 2% 4% 3% 2% 6% 1% 3% 2% 3% 2% 2% 3%
Straight Talk 28 7 21 7 10 9 3 20 4 1 1 8 9 10 4 14 10 9 12 * 8 20 5 13 10 1 27
2% 1% 3% 2% 3% 2% 1% 2% 2% * 3% 2% 2% 3% 1% 3% 2% 2% 2% * 2% 2% 1% 2% 4% * 4%
Boost Mobile 21 4 17 8 4 9 - 13 2 6 1 2 11 8 5 11 6 12 5 1 1 20 10 7 4 2 19
2% 1% 3% 2% 1% 2% - 1% 1% 4% 2% * 2% 2% 1% 2% 1% 2% 1% 1% * 2% 2% 1% 2% * 3%
US Cellular 17 10 7 3 6 6 3 16 - 1 - 2 3 11 7 7 3 6 6 * 7 10 1 4 11 4 13
1% 1% 1% 1% 2% 1% 1% 2% - 1% - * 1% 3% 2% 1% 1% 1% 1% 1% 2% 1% * 1% 4% 1% 2%
Walmart FamilyMobile 5 1 4 2 * 3 - 1 - 4 - - 4 1 - 4 1 3 1 - 3 2 2 3 * 1 4
* * 1% 1% * 1% - * - 2% - - 1% * - 1% * 1% * - 1% * * * * * 1%

Page 278
Fielding Period: March 27-29, 2018
HCAPS (Filtered on Registered Voters)
Weighted To The U.S. General Adult Population - Propensity
30 Mar 2018
Table 267
CA1 Which carrier do you subscribe to for mobile calling and data services?
Base: All Respondents
Presidential
Election Candidate
Gender Age Ethnicity Political Party Political Ideology Voted For Education Locale Income
_____________ ______________________ _______________________ ____________________ ____________________ _____________________ _____________ ________________ _________
Colle- Some
Cons- ge Gr- Colle- $75K Less
Hisp- Black Repub- Democ- Indep- Libe- Mode- erva- 3rd ad And ge Or Urb- Subu- Or Than
Total Male Female 18-34 35-49 50-64 65+ White anic /AA Other lican rat endent ral rate tive Clinton Trump Party Higher Less an rban Rural More $75K
______ _____ _______ _____ _____ _____ ____ _____ _____ _____ _____ ______ ______ ______ ______ ______ ______ ________ ______ _____ ______ ______ ____ _____ _____ ____ ____
Weighted Base 1340 658 682 343 329 387 282 910 161 165 45 429 496 389 364 558 418 514 507 90 469 871 442 636 263 563 715
Net10 1 1 1 1 * - 1 1 - * 1 - 1 - 1 1 * 1 - - 1 1 1 - 1 - 1
* * * * * - * * - * 1% - * - * * * * - - * * * - * - *
Other 49 14 35 9 12 17 10 31 9 5 3 15 20 14 18 18 13 22 12 1 14 35 16 18 15 15 30
4% 2% 5% 3% 4% 4% 3% 3% 6% 3% 7% 3% 4% 4% 5% 3% 3% 4% 2% 1% 3% 4% 4% 3% 6% 3% 4%
None of the above 69 31 38 6 4 19 41 57 9 3 - 21 30 17 26 18 26 28 20 2 12 57 19 27 24 12 48
5% 5% 6% 2% 1% 5% 14% 6% 6% 2% - 5% 6% 4% 7% 3% 6% 5% 4% 2% 3% 7% 4% 4% 9% 2% 7%
Sigma 1340 658 682 343 329 387 282 910 161 165 45 429 496 389 364 558 418 514 507 90 469 871 442 636 263 563 715
100% 100% 100% 100% 100% 100% 100% 100% 100% 100% 100% 100% 100% 100% 100% 100% 100% 100% 100% 100% 100% 100% 100% 100% 100% 100% 100%

Page 279
Fielding Period: March 27-29, 2018
HCAPS (Filtered on Registered Voters)
Weighted To The U.S. General Adult Population - Propensity
30 Mar 2018
Table 268
CA2 Which internet service provider do you subscribe to for internet connectivity in your home?
Base: All Respondents
Presidential
Election Candidate
Gender Age Ethnicity Political Party Political Ideology Voted For Education Locale Income
_____________ ______________________ _______________________ ____________________ ____________________ _____________________ _____________ ________________ _________
Colle- Some
Cons- ge Gr- Colle- $75K Less
Hisp- Black Repub- Democ- Indep- Libe- Mode- erva- 3rd ad And ge Or Urb- Subu- Or Than
Total Male Female 18-34 35-49 50-64 65+ White anic /AA Other lican rat endent ral rate tive Clinton Trump Party Higher Less an rban Rural More $75K
______ _____ _______ _____ _____ _____ ____ _____ _____ _____ _____ ______ ______ ______ ______ ______ ______ ________ ______ _____ ______ ______ ____ _____ _____ ____ ____
Unweighted Base 1340 538 802 296 337 392 315 1078 68 123 27 415 478 384 366 551 423 491 511 106 452 888 398 633 309 404 868
Weighted Base 1340 658 682 343 329 387 282 910 161 165 45 429 496 389 364 558 418 514 507 90 469 871 442 636 263 563 715
Effective Base 720 324 402 155 187 207 184 611 48 79 16 232 261 206 197 299 225 269 285 62 260 461 224 340 160 251 466
AT&T 281 162 118 100 58 81 41 177 41 52 5 105 120 52 94 115 72 107 121 13 125 156 132 121 28 130 141
21% 25% 17% 29% 18% 21% 15% 19% 26% 32% 11% 25% 24% 13% 26% 21% 17% 21% 24% 14% 27% 18% 30% 19% 11% 23% 20%
Comcast 256 124 133 65 73 57 61 172 24 27 19 75 110 67 69 99 89 104 86 17 81 175 81 137 38 114 130
19% 19% 19% 19% 22% 15% 22% 19% 15% 16% 42% 18% 22% 17% 19% 18% 21% 20% 17% 18% 17% 20% 18% 22% 15% 20% 18%
Time Warner Cable 180 78 102 45 34 50 50 108 34 17 11 44 61 69 49 79 51 73 55 13 53 127 60 87 32 75 98
13% 12% 15% 13% 10% 13% 18% 12% 21% 10% 25% 10% 12% 18% 13% 14% 12% 14% 11% 14% 11% 15% 14% 14% 12% 13% 14%
Verizon 128 65 64 29 28 39 33 93 5 22 3 46 43 35 27 57 44 49 55 16 68 60 50 65 13 84 39
10% 10% 9% 8% 9% 10% 12% 10% 3% 14% 7% 11% 9% 9% 7% 10% 10% 10% 11% 17% 14% 7% 11% 10% 5% 15% 5%
Cox Cable Communications 71 43 29 6 30 20 15 59 4 2 1 25 22 24 20 30 21 28 32 6 28 43 18 38 15 33 37
5% 6% 4% 2% 9% 5% 5% 6% 3% 1% 2% 6% 4% 6% 6% 5% 5% 5% 6% 7% 6% 5% 4% 6% 6% 6% 5%
Charter 57 19 38 15 13 21 8 42 8 2 - 21 24 11 16 17 24 20 22 5 16 41 20 21 17 23 33
4% 3% 6% 4% 4% 5% 3% 5% 5% 1% - 5% 5% 3% 4% 3% 6% 4% 4% 6% 3% 5% 4% 3% 6% 4% 5%
CenturyLink 55 20 35 15 15 14 12 41 10 4 - 13 18 25 13 29 13 22 15 6 17 38 13 25 17 16 38
4% 3% 5% 4% 5% 4% 4% 4% 6% 3% - 3% 4% 6% 4% 5% 3% 4% 3% 7% 4% 4% 3% 4% 7% 3% 5%
Frontier 36 17 19 2 1 13 19 26 9 * - 14 12 8 9 6 21 13 17 2 7 28 3 18 14 11 19
3% 3% 3% 1% * 3% 7% 3% 6% * - 3% 2% 2% 3% 1% 5% 2% 3% 2% 2% 3% 1% 3% 5% 2% 3%
Bright House 30 9 21 7 7 9 8 21 6 3 - 4 9 17 5 21 4 10 13 1 10 20 7 23 * 7 20
2% 1% 3% 2% 2% 2% 3% 2% 4% 2% - 1% 2% 4% 1% 4% 1% 2% 3% 2% 2% 2% 2% 4% * 1% 3%
Cablevision 29 13 16 6 11 7 4 14 2 10 - 8 14 4 9 12 8 14 7 - 15 14 4 17 7 16 8
2% 2% 2% 2% 3% 2% 2% 2% 1% 6% - 2% 3% 1% 3% 2% 2% 3% 1% - 3% 2% 1% 3% 3% 3% 1%
Suddenlink 17 7 10 * 6 9 2 12 4 1 - 10 5 2 4 3 10 7 10 - 5 12 4 12 2 8 9
1% 1% 2% * 2% 2% 1% 1% 2% 1% - 2% 1% * 1% 1% 2% 1% 2% - 1% 1% 1% 2% 1% 1% 1%
Windstream 16 12 4 4 5 4 3 13 - 2 - 4 6 6 3 10 4 6 6 1 2 14 3 5 8 2 12
1% 2% 1% 1% 2% 1% 1% 1% - 1% - 1% 1% 2% 1% 2% 1% 1% 1% 1% * 2% 1% 1% 3% * 2%
Mediacom 9 2 8 1 4 4 - 8 - * 1 4 2 2 2 3 5 2 3 1 1 8 2 4 3 2 6
1% * 1% * 1% 1% - 1% - * 2% 1% * 1% * 1% 1% * 1% 1% * 1% * 1% 1% * 1%
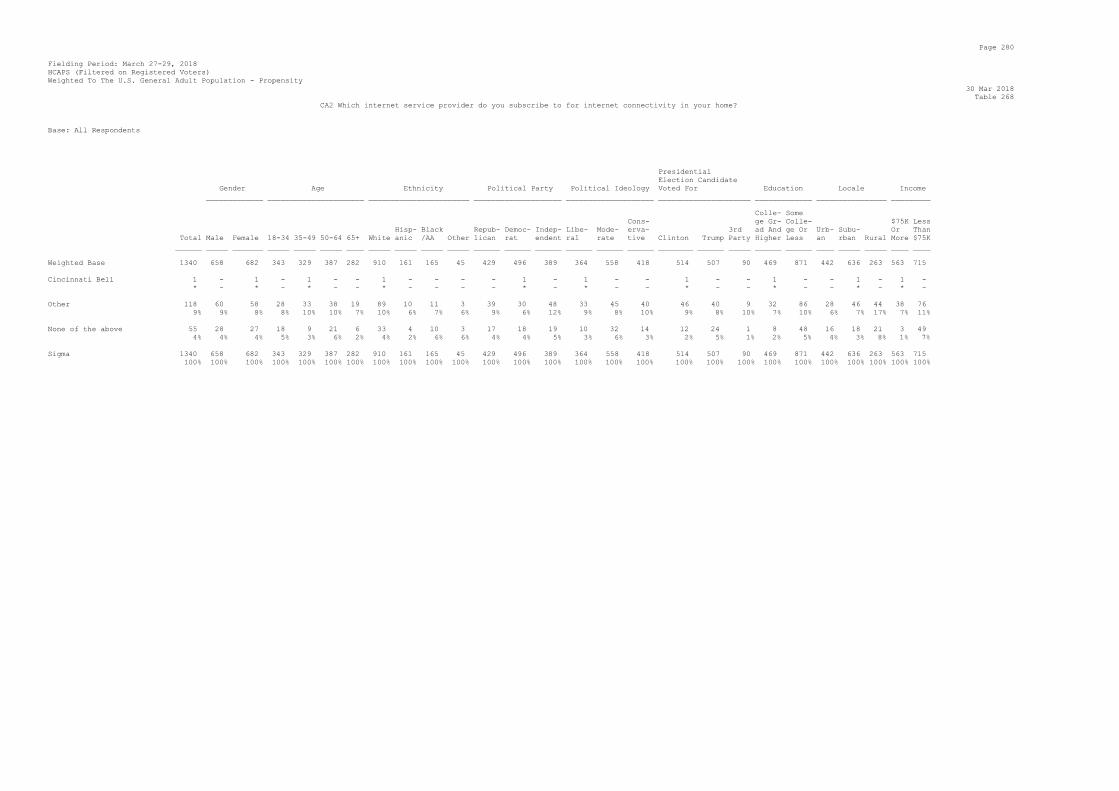
Page 280
Fielding Period: March 27-29, 2018
HCAPS (Filtered on Registered Voters)
Weighted To The U.S. General Adult Population - Propensity
30 Mar 2018
Table 268
CA2 Which internet service provider do you subscribe to for internet connectivity in your home?
Base: All Respondents
Presidential
Election Candidate
Gender Age Ethnicity Political Party Political Ideology Voted For Education Locale Income
_____________ ______________________ _______________________ ____________________ ____________________ _____________________ _____________ ________________ _________
Colle- Some
Cons- ge Gr- Colle- $75K Less
Hisp- Black Repub- Democ- Indep- Libe- Mode- erva- 3rd ad And ge Or Urb- Subu- Or Than
Total Male Female 18-34 35-49 50-64 65+ White anic /AA Other lican rat endent ral rate tive Clinton Trump Party Higher Less an rban Rural More $75K
______ _____ _______ _____ _____ _____ ____ _____ _____ _____ _____ ______ ______ ______ ______ ______ ______ ________ ______ _____ ______ ______ ____ _____ _____ ____ ____
Weighted Base 1340 658 682 343 329 387 282 910 161 165 45 429 496 389 364 558 418 514 507 90 469 871 442 636 263 563 715
Cincinnati Bell 1 - 1 - 1 - - 1 - - - - 1 - 1 - - 1 - - 1 - - 1 - 1 -
* - * - * - - * - - - - * - * - - * - - * - - * - * -
Other 118 60 58 28 33 38 19 89 10 11 3 39 30 48 33 45 40 46 40 9 32 86 28 46 44 38 76
9% 9% 8% 8% 10% 10% 7% 10% 6% 7% 6% 9% 6% 12% 9% 8% 10% 9% 8% 10% 7% 10% 6% 7% 17% 7% 11%
None of the above 55 28 27 18 9 21 6 33 4 10 3 17 18 19 10 32 14 12 24 1 8 48 16 18 21 3 49
4% 4% 4% 5% 3% 6% 2% 4% 2% 6% 6% 4% 4% 5% 3% 6% 3% 2% 5% 1% 2% 5% 4% 3% 8% 1% 7%
Sigma 1340 658 682 343 329 387 282 910 161 165 45 429 496 389 364 558 418 514 507 90 469 871 442 636 263 563 715
100% 100% 100% 100% 100% 100% 100% 100% 100% 100% 100% 100% 100% 100% 100% 100% 100% 100% 100% 100% 100% 100% 100% 100% 100% 100% 100%