Embed Size (px)
Citation preview

Lindorff presents: - European Credit Outlook 2015 - Solution rates and trends By Rune Ohlgren, Amsterdam,11.06.2015
Director for International, Lindorff Group
Agenda
● Introduction ● European Credit Outlook Survey 2015
• Background info • Question asked • Results of the analysis
● Lindorff International solution rates • High solution countries • Countries with very little solution • Trends
● Summary

Introduction
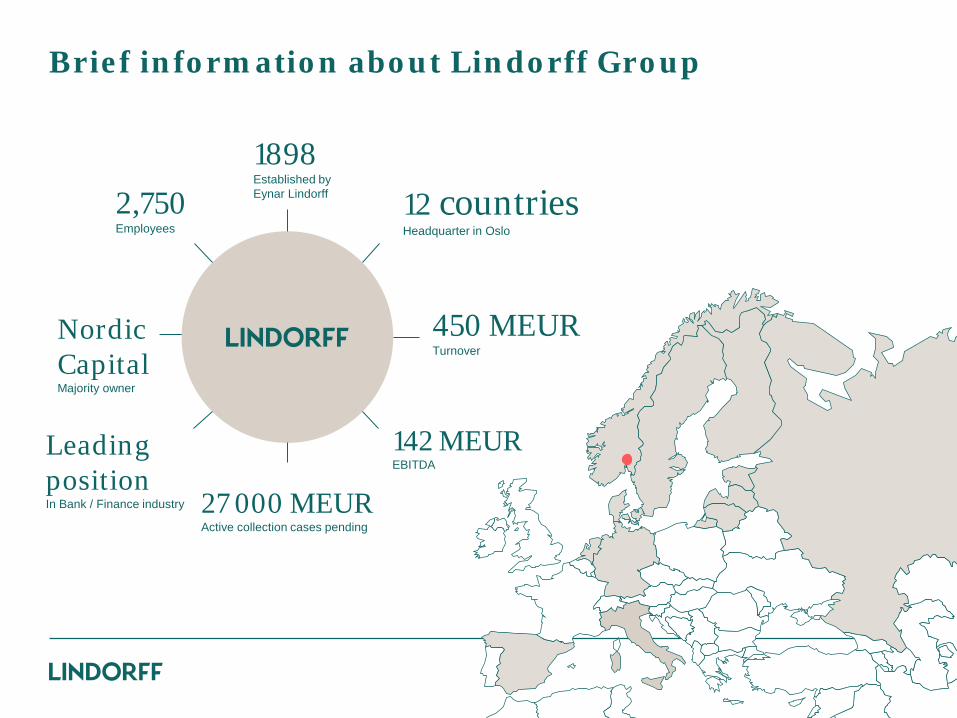
Brief information about Lindorff Group
2,750 Employees
12 countries Headquarter in Oslo
27 000 MEUR Active collection cases pending
142 MEUR EBITDA
450 MEUR Turnover
Nordic Capital Majority owner
1898 Established by Eynar Lindorff
Leading position In Bank / Finance industry
5
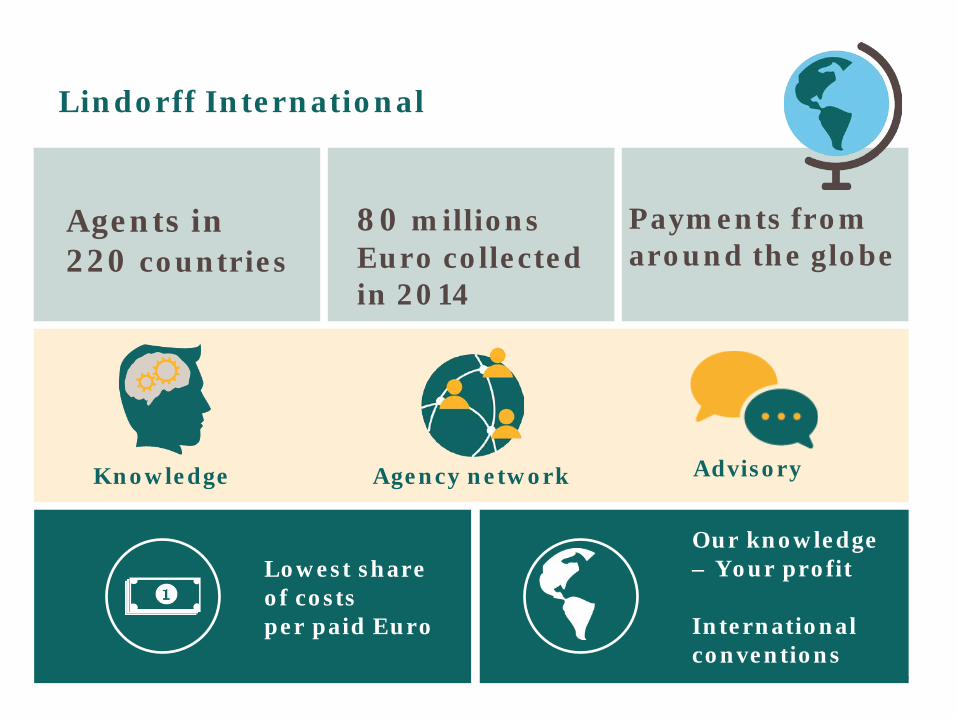
Agents in 220 countries
Lindorff International
Payments from around the globe
Knowledge Advisory
Lowest share of costs per paid Euro
Our knowledge – Your profit International conventions
80 millions Euro collected in 2014
Agency network

International in brief, pr. 01.01.2015:
220 Countries covered
COE in Oslo. Focus on quality, competence and revenue
55/45% 3PC / Capital (of Revenue)
1995 Started focus on International debt collection
10 countries / 35 FTEs Offices in Sweden, Denmark, Finland, Estonia, Latvia, Lithuania, Russia, The Netherlands Germany and Norway.
1.168 MEUR 152 000 active IC cases
COE 14 incl Rune
8 6
3
2 3
0
79 MEUR Actual 2014 Cash Collected (Target was 44 MEUR)

Center of Excellence (COE) in Oslo:
Europe’s leading international environment. 14 specialists with160 years of experience
220 / 180 / 164
13 languages / 15 currencies
Slogan: Our Knowledge – Your Profit

LIC FENCA FEBIS ALQ
LIC (League International for Creditors) + Board member
FEBIS (Federation of Business Information Services)
FENCA (Federation of European National Collection Associations)
NIF (Norges inkassobyråers Forening) (National Debt. Coll. Association)
ALQ (American Lawyers Company - Quarterly law list)
+ Independent agents (for several years) with references
= 220 countries covered
Our agent network:
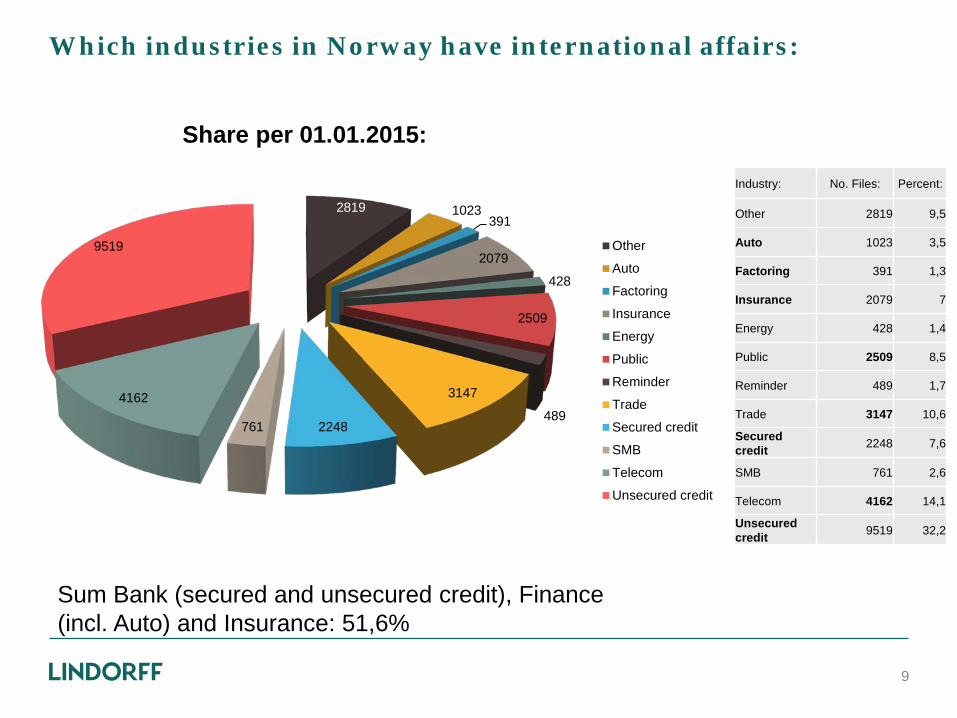
Which industries in Norway have international affairs:
9
2819 1023 391
2079
428
2509
489
3147
2248 761
4162
9519
Share per 01.01.2015:
Other
Auto
Factoring
Insurance
Energy
Public
Reminder
Trade
Secured credit
SMB
Telecom
Unsecured credit
Industry: No. Files: Percent:
Other 2819 9,5
Auto 1023 3,5
Factoring 391 1,3
Insurance 2079 7
Energy 428 1,4
Public 2509 8,5
Reminder 489 1,7
Trade 3147 10,6
Secured credit 2248 7,6
SMB 761 2,6
Telecom 4162 14,1
Unsecured credit 9519 32,2
Sum Bank (secured and unsecured credit), Finance (incl. Auto) and Insurance: 51,6%

Lindorff European Credit Outlook Survey 2015

Important parameters / Background figures:
11

Background for analysis
● For the third consecutive year published Lindorff European Credit Outlook (LECO). LECO includes a survey of executives and financial managers in European businesses about the expectations they have of the credit market in the coming year.
● The survey was conducted by TNS Gallup on behalf of Lindorff in Norway, Sweden, Denmark, Finland, Netherlands, England, Germany, France, Spain and Italy. Overall it's completed in 1094 interviews with CEOs, CFOs and other senior executives in a wide range of industries and sectors. Banking / finance, trade, utility and telecom
● Interviews were conducted Q4 / 2014
12

The questions posed in the analysis: ● Do you think that your company’s DSO (Days Sales Outstanding) will increase or decrease
in 2015?
● How do you see that your company’s credit losses (%) will develop in 2015 compared to this year?
● How likely is your company to tighten its credit policy on issuing credit or payment time in 2015?
● Compared to 2014, do you believe your customers will be more or less likely to pay on time in 2015?
● Thinking about your country specifically, do you believe corporate bankruptcies will increase or decrease in 2015 compared to 2014
● Do you believe consumer payment defaults will increase or decrease in your country in 2015 compared to 2014?
● How do you expect your company’s net revenues to change in 2015, compared to 2014?
● How do you expect your company’s profitability to change in 2015, compared to 2014?
● Do you expect your company’s financial costs to increase or decrease in 2015?
● Do you need to put resources into debt collection in 2015?
13

Pessimism in France and Finland, better in Spain, Denmark and the UK
● Weak faith in macro in most European countries
• France and Finland are the most pessimistic regarding developments in 2015
• Germany and Norway think the macro gets worse
• Spain, Denmark and the UK have the most positive expectations
● Strong faith in their own business in most countries
• Many seem to be too positive on their own behalf
14

-11
-1
3
-2
-19
-35
34
25
1
14
-100 0 100
All countries - forecast for 2015 – incl. questions
15
4
3
11
3
9
11
7
6
3
1
19
11
20
16
38
41
43
36
23
13
66
73
35
62
25
31
33
40
46
86
10
10
17
18
26
17
14
15
24
2
2
17
2
2
1
3
2
4
0 10 20 30 40 50 60 70 80 90 100
Do you think that your company’s DSO, days sales outstanding, will increase or decrease in <NEXT YEAR>?
How do you see that your company’s credit losses (%) will develop in <NEXT YEAR> compared to this year?
How likely is your company to tighten its credit policy on issuing creditor payment time in <NEXT YEAR>?
Compared to <THIS YEAR>, do you believe your customers will bemore or less likely to pay on time in <NEXT YEAR>?
Thinking about your country specifically, do you believe corporatebankruptcies will increase or decrease in <NEXT YEAR> compared…
Do you believe consumer’s payment defaults will increase or decrease in your country in <NEXT YEAR> compared to <THIS YEAR>?
How do you expect your company’s net revenues to change in <NEXT YEAR>, compared to <THIS YEAR>?
How do you expect your company’s profitability to change in <NEXT YEAR>, compared to <THIS YEAR>?
Do you expect your company’s financial costs to increase or decrease in <NEXT YEAR>?
Do you need to put more resources to debt collection in <NEXTYEAR>?
Increase significantly / Very likely / Much more likely Increase moderately / Likely / More likelyRemains as is Decrease moderately / Unlikely / Less likelyDecrease significantly / Very unlikely / Much less likely
Prosent (%)
Percent (%) positive answers minus percent
negative answers

Do you think your company’s DSO (days sales outstanding) will increase or decrease in 2015?
Country Very negative Negative Remain as is Positive Very Positive
Norway 1% 9% 76% 11% 3% Sweden 9% 85% 6% Denmark 19% 73% 6% 2% Finland 4% 38% 58% Germany 28% 62% 10% NL 1% 13% 67% 15% 4% England 28% 58% 11% 4% France 18% 18% 59% 3% 2% Spain 1% 12% 62% 21% 3% Italy 12% 13% 59% 12% 4%
16

How do you see that your company’s credit losses (%) will develop in 2015 compared to this year?
Country Very negative Negative Remain as is Positive Very Positive
Norway 1% 15% 68% 12% 4% Sweden 6% 87% 7% Denmark 1% 3% 91% 5% Finland 1% 22% 75% 2% Germany 14% 76% 8% 2% NL 3% 6% 71% 15% 5% England 1% 84% 14% 1% France 7% 21% 66% 2% 4% Spain 1% 6% 60% 32% 1% Italy 10% 16% 59% 8% 6%
17

How likely is your company to tighten its credit policy on issuing credit or payment time in 2015?
Country Very negative Negative Remain as is Positive Very Positive
Norway 7% 29% 41% 19% 8% Sweden 9% 19% 59% 5% 8% Denmark 3% 12% 38% 9% 38% Finland 9% 30% 14% 13% 34% Germany 8% 11% 35% 26% 20% NL 13% 19% 31% 19% 18% England 12% 9% 40% 16% 23% France 32% 19% 24% 12% 12% Spain 9% 28% 38% 18% 7% Italy 7% 22% 28% 35% 7%
18

Compared to 2014, do you believe your customers will be more or less likely to pay on time in 2015?
Country Very negative Negative Remain as is Positive Very Positive
Norway 2% 12% 68% 15% 2% Sweden 10% 79% 11% Denmark 3% 90% 7% Finland 3% 45% 41% 8% 2% Germany 2% 22% 38% 29% 9% NL 1% 20% 53% 25% 1% England 10% 65% 22% 2% France 8% 29% 58% 5% Spain 5% 69% 23% 3% Italy 6% 20% 54% 11% 9%
19

Thinking about your country specifically, do you believe corporate bankruptcies will increase or decrease in 2015 compared to 2014?
Country Very negative Negative Remain as is Positive Very Positive
Norway 4% 69% 23% 3% 1% Sweden 2% 48% 36% 13% 1% Denmark 12% 32% 57% Finland 5% 69% 19% 7% Germany 4% 60% 25% 11% NL 4% 21% 15% 56% 4% England 1% 21% 35% 41% 1% France 39% 30% 26% 5% 1% Spain 4% 12% 20% 56% 8% Italy 27% 33% 22% 13% 4%
20

Do you believe consumer payment defaults will increase or decrease in your country in 2015 compared to 2014?
Country Very negative Negative Remain as is Positive Very Positive
Norway 7% 56% 33% 3% 1% Sweden 4% 44% 43% 8% 1% Denmark 1% 26% 40% 33% Finland 6% 77% 15% 2% Germany 1% 55% 38% 6% NL 11% 48% 13% 34% 1% England 4% 23% 44% 28% France 33% 42% 19% 5% Spain 5% 14% 43% 37% 1% Italy 30% 31% 22% 15% 1%
21

Do you need to put resources into debt collection in 2015?
Country Very negative Negative Remain as is Positive Very Positive
Norway 1% 12% 87% Sweden 9% 91% Denmark 1% 3% 96% Finland 2% 29% 69% Germany 1% 6% 93% NL 12% 88% England 9% 91% France 24% 76% Spain 1% 11% 88% Italy 4% 14% 81%
22

Europa, country by country
23

Norwegian executives expect an increase in defaults among corporates and individuals,
● Due to the sharp drop in oil prices executives expect
• Lower investments in oil related projects
• More bankruptcies • More defaults among
consumers
● Stronger optimism on their own behalf
• Expect revenue growth and • Stronger bottom line
24
4
0
-13
3
-69
-59
40
37
16
13
Positive vs negative overweight
Change DSO (days sales outstanding)
Credit losses
Credit policy
Customers pay on time
Corporate bankruptcies
Consumer payment defaults
Company’s net revenuev
Company’s profitability
Company’s financial costs
Resources to debt collection

Norwegian executives also believe in revenue growth
25
1
1
7
2
4
7
1
1
0
1
9
15
29
12
69
56
13
12
13
12
76
68
41
68
23
33
32
37
58
87
11
12
15
15
3
3
47
38
27
0
3
4
8
2
1
1
7
12
2
0
0 10 20 30 40 50 60 70 80 90 100
Change DSO (Days sales outstanding)
Credit losses
Credit policy
Customers pay on time
Corporate bankruptcies
Consumer payment defaults
Company’s net revenue
Company’s profitability
Company’s financial costs
Resources to debt collection
Very negative Negative Remains as is Positive Very positive
Prosent (%)
8
11
-25
6
-1
-1
5
14
9
-4
-60 60
3
-6
5
-5
-9
-3
-8
-5
5
8
-60 60
Percentage point change in positive share of mentions 2014 compared to
previous years 2013 – 2015 2014 - 2015

Weak macroeconomic expectations in Sweden…
● Expect a worsening of the macro: • More bankruptcies • More defaults among
consumers
● Going to tighten credit policy
● Great faith in their own business • Expects Revenue Growth • And stronger bottom line
26
-2
1
-15
1
-36
-39
53
35
8
9
Positive vs negative overweight
Change DSO (days sales outstanding)
Credit losses
Credit policy
Customers pay on time
Corporate bankruptcies
Consumer payment defaults
Company’s net revenuev
Company’s profitability
Company’s financial costs
Resources to debt collection

-3
-6
-21
-7
-29
-13
-14
-18
3
-5
-60 60
Swedes have become more negative than they were last year:
27
0
0
9
0
2
4
0
1
2
0
9
6
19
10
48
44
9
13
17
9
85
87
59
79
36
43
29
37
54
91
6
7
5
11
13
8
50
42
24
0
0
8
0
1
1
12
7
3
0
0 10 20 30 40 50 60 70 80 90 100
Change DSO (Days sales outstanding)
Credit losses
Credit policy
Customers pay on time
Corporate bankruptcies
Consumer payment defaults
Company’s net revenue
Company’s profitability
Company’s financial costs
Resources to debt collection
Very negative Negative Remains as is Positive Very positive
Prosent (%)
Percentage point change in positive share of mentions 2014 compared to
previous years
2014 - 2015
2
-4
-12
0
11
3
25
11
8
13
-60 602013 - 2015

Positive expectations in Denmark
● Positive expectations in almost all areas:
• Fewer bankruptcies • Looser credit policy • Revenue growth • Improved bottom line
28
-10
1
32
4
45
5
52
40
5
4
Change DSO (days sales outstanding)
Credit losses
Credit policy
Customers pay on time
Corporate bankruptcies
Consumer payment defaults
Company’s net revenuev
Company’s profitability
Company’s financial costs
Resources to debt collection
Positive vs negative overweight

Denmark has a significant positive change in expectations last two years
29
0
1
3
0
0
1
0
0
1
1
19
3
12
3
12
26
12
9
23
3
73
91
38
90
32
40
24
41
47
96
6
5
9
7
57
33
58
46
28
0
2
0
38
0
0
0
6
3
1
0
0 10 20 30 40 50 60 70 80 90 100
Change DSO (Days sales outstanding)
Credit losses
Credit policy
Customers pay on time
Corporate bankruptcies
Consumer payment defaults
Company’s net revenue
Company’s profitability
Company’s financial costs
Resources to debt collection
Very negative Negative Remains as is Positive Very positive
Prosent (%)
Percentage point change in positive share of mentions 2014 compared to
previous years 2013 - 2015
0
-11
25
-3
42
21
13
11
9
8
-60 60

Depressive expectations in Finland
● Very negative expectations for 2015
● Large majority who expect that the macro will become weaker:
• More bankruptcies • More defaults among
consumers
● Expectations of more losses for own business
• Longer credit time • More defaults • Greater credit losses
30
-42
-21
8
-38
-67
-81
3
6
4
31
Change DSO (days sales outstanding)
Credit losses
Credit policy
Customers pay on time
Corporate bankruptcies
Consumer payment defaults
Company’s net revenuev
Company’s profitability
Company’s financial costs
Resources to debt collection
Positive vs negative overweight

Finland 2015: Nearly half of the Finnish executives believe their customers will be less likely to pay on time
31
4
1
9
3
5
6
2
0
0
2
38
22
30
45
69
77
24
24
18
29
58
75
14
41
19
15
44
45
60
69
0
2
13
8
7
2
27
26
16
0
0
0
34
2
0
0
3
5
6
0
0 10 20 30 40 50 60 70 80 90 100
Change DSO (Days sales outstanding)
Credit losses
Credit policy
Customers pay on time
Corporate bankruptcies
Consumer payment defaults
Company’s net revenue
Company’s profitability
Company’s financial costs
Resources to debt collection
Very negative Negative Remains as is Positive Very positive
Prosent (%)
Percentage point change in positive share of mentions 2014 compared to
previous years
-4
-5
3
-4
2
0
-15
-13
10
-6
-60 602013 – 2015 2014 - 2015
-8
-15
28
-1
7
2
-10
0
9
-27
-60 60

Germany: Belief in their own business, but …
● Expect a worsening of the macro economy:
• More bankruptcies • More defaults among
consumers
● Great faith in their own business • Expects increased turnover • Stronger bottom line
● Expecting looser credit policy
32
-18
-4
28
13
-53
-49
44
33
14
7
Change DSO (days sales outstanding)
Credit losses
Credit policy
Customers pay on time
Corporate bankruptcies
Consumer payment defaults
Company’s net revenuev
Company’s profitability
Company’s financial costs
Resources to debt collection
Positive vs negative overweight

Germany 2015
33
0
0
8
2
4
1
0
0
4
1
28
14
11
22
60
55
13
13
17
6
62
76
35
38
25
38
30
41
45
93
10
8
26
29
11
6
53
43
29
0
2
20
9
0
0
4
3
5
0
0 10 20 30 40 50 60 70 80 90 100
Change DSO (Days sales outstanding)
Credit losses
Credit policy
Customers pay on time
Corporate bankruptcies
Consumer payment defaults
Company’s net revenue
Company’s profitability
Company’s financial costs
Resources to debt collection
Very negative Negative Remains as is Positive Very positive
Prosent (%)
Percentage point change in positive share of mentions 2014 compared to
previous years 2013 - 2015 2014 - 2015
2
4
8
3
-15
-14
-9
-3
0
-2
-60 60
0
-8
29
15
-1
1
7
6
24
32
-60 60

Spain is most positive to 2015
● The country with the most positive expectations for 2015
● Positive expectations in 9 of 10 areas.
● Most importantly: • Fewer bankruptcies • Less credit • Less defaults • Turnover growth • Improved bottom line
● Expect a further tightening of credit policy
34
11
26
-12
21
48
18
45
32
15
12
Change DSO (days sales outstanding)
Credit losses
Credit policy
Customers pay on time
Corporate bankruptcies
Consumer payment defaults
Company’s net revenuev
Company’s profitability
Company’s financial costs
Resources to debt collection
Positive vs negative overweight

Spain – two years of growing optimism
35
1
1
9
0
4
5
2
1
2
1
12
6
28
5
12
14
7
11
20
11
62
60
38
69
20
43
36
44
40
88
21
32
18
23
56
37
49
40
31
0
3
1
7
3
8
1
5
4
6
0
0 10 20 30 40 50 60 70 80 90 100
Change DSO
Credit losses
Credit policy
Customers pay on time
Corporate bankruptcies
Consumer payment defaults
Company’s net revenue
Company’s profitability
Company’s financial costs
Resources to debt collection
Very negative Negative Remains as is Positive Very positive
Percent (%)
Percentage point change in positive share of mentions 2014 compared to
previous years 2013 - 2015 2014 - 2015
9
14
-28
-4
31
16
5
-1
15
0
-60 60
-10
12
17
7
56
27
14
7
16
52
-60 60

Belief in improvement in the UK
● Positive expectations in most areas.
● The following are the most important:
• Fewer bankruptcies • Looser credit policy • Lower credit losses • Turnover growth • Improved bottom line
● Two negative expectations: • Higher financial expenses • Longer credit period
36
-13
14
19
14
20
1
56
42
-30
9
Change DSO (days sales outstanding)
Credit losses
Credit policy
Customers pay on time
Corporate bankruptcies
Consumer payment defaults
Company’s net revenuev
Company’s profitability
Company’s financial costs
Resources to debt collection
Positive vs negative overweight

UK 2015:
37
0
0
12
0
1
4
4
2
3
0
28
1
9
10
21
23
8
11
43
9
58
84
40
66
35
44
19
31
37
91
11
14
16
22
41
28
61
42
14
0
4
1
23
2
1
0
8
13
2
0
0 10 20 30 40 50 60 70 80 90 100
Change DSO (Days sales outstanding)
Credit losses
Credit policy
Customers pay on time
Corporate bankruptcies
Consumer payment defaults
Company’s net revenue
Company’s profitability
Company’s financial costs
Resources to debt collection
Very negative Negative Remains as is Positive Very positive
Prosent (%)
Percentage point change in positive share of mentions 2014 compared to
previous years 2013 - 2015 2014 - 2015
-2
-4
9
-3
-4
-8
-5
-14
-1
-2
-60 60
6
-20
24
-19
24
13
3
-8
0
33
-60 60

Finance directors in France expect the greatest negative change
● Negative developments in all categories
● Large majority who expect that the macro will become weaker:
• More bankruptcies • More payment defaults among
consumers
● Expectations of more losses for own business
• Longer credit time • More defaults / major credit • Tighter credit policy • Higher financial expenses • Weaker results
38
-31
-22
-27
-32
-62
-71
-2
-26
-27
24
Change DSO (days sales outstanding)
Credit losses
Credit policy
Customers pay on time
Corporate bankruptcies
Consumer payment defaults
Company’s net revenuev
Company’s profitability
Company’s financial costs
Resources to debt collection
Positive vs negative overweight

And pessimism in France has increased
39
18
7
32
8
39
33
7
10
13
0
18
21
19
29
30
42
23
28
25
24
59
66
24
58
26
19
42
49
51
76
3
2
12
5
5
5
22
10
8
0
2
4
12
0
1
0
6
2
3
0
0 10 20 30 40 50 60 70 80 90 100
Change DSO (Days sales outstanding)
Credit losses
Credit policy
Customers pay on time
Corporate bankruptcies
Consumer payment defaults
Company’s net revenue
Company’s profitability
Company’s financial costs
Resources to debt collection
Very negative Negative Remains as is Positive Very positive
Prosent (%)
Percentage point change in positive share of mentions 2014 compared to
previous years 2013 - 2015 2014 - 2015
-1
1
-6
-4
0
4
-2
-9
-3
-5
-60 60
-4
-7
-7
-11
-3
0
-14
-32
-10
34
-60 60

The Nederlands is among the most positive countries
● Positive expectations in most areas.
● But some areas stand out: • Fewer bankruptcies • Turnover growth • Improved bottom line
● They expect at the same time more defaults among consumers
● Will spend more resources on debt collection
40
5
10
5
5
35
-17
39
38
3
12
Change DSO (days sales outstanding)
Credit losses
Credit policy
Customers pay on time
Corporate bankruptcies
Consumer payment defaults
Company’s net revenuev
Company’s profitability
Company’s financial costs
Resources to debt collection
Positive vs negative overweight

Strong improvement in the Netherlands last two years
41
1
3
13
1
4
11
2
0
3
0
13
6
19
20
21
40
15
13
32
12
67
71
31
53
15
13
27
36
26
88
15
15
19
25
56
34
46
45
33
0
4
5
18
1
4
1
10
6
5
0
0 10 20 30 40 50 60 70 80 90 100
Change DSO (days sales outstanding)
Credit losses
Credit policy
Customers pay on time
Corporate bankruptcies
Consumer payment defaults
Company’s net revenue
Company’s profitability
Company’s financial costs
Resources to debt collection
Very negative Negative Remains as is Positive Very positive
Percent (%)
7
3
0
0
2
8
1
5
9
6
-60 60
-9
-6
18
18
57
23
26
22
18
33
-60 60
Percentage point change in positive share of mentions 2014 compared to
previous years
2013 - 2015 2012 - 2015

Italy expects the macro gets worse
● Expect a worsening of the macro: • More bankruptcies • More defaults among
consumers
● Are going to slacken on credit policy
● Shared belief in their own business, but a majority expect
• Turnover growth • A stronger bottom line
42
-9
-11
14
-6
-43
-45
7
11
-5
19
Change DSO (days sales outstanding)
Credit losses
Credit policy
Customers pay on time
Corporate bankruptcies
Consumer payment defaults
Company’s net revenuev
Company’s profitability
Company’s financial costs
Resources to debt collection
Positive vs negative overweight

Italy 2015
43
12
10
7
6
27
30
7
7
6
4
13
16
22
20
33
31
15
16
28
14
59
59
28
54
22
22
47
42
36
81
12
8
35
11
13
15
23
26
25
0
4
6
7
9
4
1
7
8
4
0
0 10 20 30 40 50 60 70 80 90 100
Change DSO (Day sales outstanding)
Credit losses
Credit policy
Customers pay on time
Corporate bankruptcies
Consumer payment defaults
Company’s net revenue
Company’s profitability
Company’s financial costs
Resources to debt collection
Very negative Negative Remains as is Positive Very positive
Prosent (%)
Percentage point change in positive share of mentions 2014 compared to
previous years 2013 - 2015 2014 - 2015
4
-4
-2
-15
0
6
-5
-1
10
-12
-60 60
2
8
24
4
9
8
-5
-1
11
25
-60 60

-31
-22
-27
-32
-62
-71
-2
-26
-27
24
-13
14
19
14
20
1
56
42
-30
9
11
26
-12
21
48
18
45
32
15
12
-9
-11
14
-6
-43
-45
7
11
-5
19
-10
1
32
4
45
5
52
40
5
4
-42
-21
8
-38
-67
-81
3
6
4
31
4
0
-13
3
-69
-59
40
37
16
13
-2
1
-15
1
-36
-39
53
35
8
9
-11
-1
3
-2
-19
-35
34
25
1
14
5
10
5
5
35
-17
39
38
3
12
Positive vs negative overweight – all countries
44
Norway Sweden Denmark Finland Germany Italy Spain UK Netherlands France All countries
-18
-4
28
13
-53
-49
44
33
14
7
Change DSO (days sales outstanding)
Credit losses
Credit policy
Customers pay on time
Corporate bankruptcies
Consumer payment defaults
Company’s net revenuev
Company’s profitability
Company’s financial costs
Resources to debt collection

Lindorff International solution rates (Norwegian figures)

Developments in number of international files in Norway: (Per 1 March 2015)
1700 2300 2600 2400 3200 4200 4900
5800 7200
8600
15900 16400 16800
17400
20375
22301
26366
28413
29500 30100
0
5000
10000
15000
20000
25000
30000
35000
1996 1997 1998 1999 2000 2001 2002 2003 2004 2005 2006 2007 2008 2009 2010 2011 2012 2013 2014 2015
Spread in 164 countries

International Oslo, Solution rates. (Per. 01.01.2015):
20
40
60
80
100
Switzerland Belgium NL Singapore France Germany Poland UK USA Sweden Spain Denmark
B2C
B2B
Total
5 years
20
40
60
80
100
Switzerland Belgium NL Singapore France Germany Poland UK USA Sweden Spain Denmark
B2CB2BTotal
1 year

Countries with low solution rates, updated per 1 January 2015:
0 0 0 1,9 1,8 1,5
9,1
3,6 6,7 5,7
9,1 7 5,7
0 3,3
7,6 3,8
7,7
0 0 0 0
8
15,2 16,7 18,2 20 21,7 23,1 23,4 23,5 25 25,7 25,9
33,3 33,3
0
10
20
30
40
50
60
70
80
90
100Total 1 year solution Total 5 years solution
(Number of files in parentheses)

World in default - Trends. Countries with the largest change last 3 years (Per 01.01.2015)
Country Solution rates 07/2011
Solution rates 01 / 2012
Solution rates 07 / 2013
Solution rates 07/2014
Solution rates 01 / 2015
Change last 18 months
Change last 3 years 01/12-01/15.
Trend
Czech Rep. 64,0 62,1 74,7 71,9 77,9 3,2 15,8 Russia 50,6 53,7 66,4 70,9 68,8 2,4 15,1 Lithuania 69,6 72,9 82,1 84,9 85,5 3,4 12,6 Bulgaria 62,2 63,4 68,5 73,4 75,4 6,9 12,0 Iraq 6,3 8,1 14,6 16,4 15,2 0,6 7,1 Estonia 65,8 67,4 71,7 73,8 74,3 2,6 6,9 Ireland 69,0 71,4 71,8 74,4 77,4 5,6 6,0 Iceland 56,3 57,0 59,7 61,2 62,5 2,8 5,5 Malta 80 75,9 60,9 55,6 54,7 - 6,2 -21,2 Brazil 69,7 73,1 64,2 59,6 57,4 - 6,8 -15,7 Morocco 50,0 33,3 30,0 31,6 21,7 - 8,3 -11,6 Singapore 86,6 91,3 86,4 87,7 82,8 - 3,6 - 8,5 Austria 89,3 86,7 81,5 80,5 81,6 0,1 - 5,1 Portugal 70,6 69,8 73,0 66,9 64,9 - 8,1 - 4,9 Belgium 85,8 86,4 83,6 83,5 82,8 - 0,8 - 3,6 Cyprus 75,0 76,9 65,6 71,4 74,2 8,6 - 2,7 Poland 87,5 88,7 89,9 88,3 86,1 - 3,8 - 2,6

References

Nordea
Our experience with Lindorff's International is that they manage to combine a good solution rate with competitive prices. Presence in many countries is also of great importance for a business as Nordea, with customers in most countries. Vår erfaring med Lindorff’s International er at de greier å kombinere en god løsningsgrad med konkurransedyktige priser. Tilstedeværelse i mange land er også av stor betydning for en bedrift som Nordea, med kunder i de fleste land.
Merete Gaarder, Spesialengasjement PM, Nordea
‟
Advokat Schjødt
Law firm Schjødt is very satisfied with Lindorff International. As a proof of that we don’t care to speak with other debt collection suppliers (although they call an mails us frequently). You are also good to see the totality. We can therefore happily stand as a reference. Advokatfirmaet Schjødt er godt fornøyd med Lindorff International og vi bryr oss derfor ikke om å snakke med andre inkassoleverandører (selv om de ringer og mailer oss ofte). Dere er også flinke til å se helheten. Vi stiller derfor gjerne som referanse. Svein Olav Lien, CFO / Økonomidirektør, Advokatfirmaet Schjødt AS
‟

Sparebanken Vest
Sparebanken Vest recommends Lindorff International in Norway. A knowledgeable and professional partner through good solutions helps to limit bank losses. Sparebanken Vest anbefaler Lindorff International i Norge – en kunnskapsrik og profesjonell samarbeidspartner som gjennom gode løsninger bidrar til å begrense bankens tap.
Bente Tjore, Avdelingsleder Kreditt PM, Sparebanken Vest
‟

Summary

● Weak faith in macro in most European countries
• France and Finland are the most pessimistic regarding developments in 2015
• Germany and Norway think the macro gets worse
• Spain, Denmark and the UK have the most positive expectations
● Strong faith in their own business in most countries
• Many seem to be too positive on their own behalf
● Czech Rep and many other eat European countries has increased solution rates last 3 years
● Malta, Brazil and Morocco have the biggest drop in their solution rates last 3 years
55
Summary

Core values:
Professional
Customer oriented
Performance oriented
Caring
Thank you for your attention