Embed Size (px)
DESCRIPTION
Line Chart of Daily Close for Walt Disney Co. 2003 - 2007. Disney - Daily. Kirkpatrick & Dahlquist Chart 11.4. StockCharts.com. Line Chart of Weekly Closes for Walt Disney Co. 2003 - 2007. Disney - Weekly. Kirkpatrick & Dahlquist Chart 11..5. StockCharts.com. - PowerPoint PPT Presentation
Citation preview

MTA Educational Foundation University Course – Technical Analysis of the Financial Markets ©2010
Lecture 2 - Chart Construction1
This lecture series is produced by the Market Technicians Association
Educational Foundation, Inc. based on the detailed class notes
of Charles D. Kirkpatrick II, CMT Copyright © 2007.
All rights are reserved.
Kirkpatrick & Dahlquist Chart 11.4
Disney - Daily
StockCharts.com
Line Chart of Daily Close for Walt Disney Co.2003 - 2007

MTA Educational Foundation University Course – Technical Analysis of the Financial Markets ©2010
Lecture 2 - Chart Construction2
This lecture series is produced by the Market Technicians Association
Educational Foundation, Inc. based on the detailed class notes
of Charles D. Kirkpatrick II, CMT Copyright © 2007.
All rights are reserved.
Kirkpatrick & Dahlquist Chart 11..5
Disney - Weekly
StockCharts.com
Line Chart of Weekly Closes for Walt Disney Co.2003 - 2007

MTA Educational Foundation University Course – Technical Analysis of the Financial Markets ©2010
Lecture 2 - Chart Construction3
This lecture series is produced by the Market Technicians Association
Educational Foundation, Inc. based on the detailed class notes
of Charles D. Kirkpatrick II, CMT Copyright © 2007.
All rights are reserved.
Kirkpatrick & Dahlquist Chart 11.6
Disney - Monthly
StockCharts.com
Line Chart of Monthly Closes for Walt Disney2003 - 2007

MTA Educational Foundation University Course – Technical Analysis of the Financial Markets ©2010
Lecture 2 - Chart Construction4
This lecture series is produced by the Market Technicians Association
Educational Foundation, Inc. based on the detailed class notes
of Charles D. Kirkpatrick II, CMT Copyright © 2007.
All rights are reserved.
Kirkpatrick & Dahlquist Chart 11.7
Krispy Kreme - Daily
StockCharts.com
Daily Bar Chart for Krispy Kreme DoughnutsJune 1 - August 22, 2007

MTA Educational Foundation University Course – Technical Analysis of the Financial Markets ©2010
Lecture 2 - Chart Construction5
This lecture series is produced by the Market Technicians Association
Educational Foundation, Inc. based on the detailed class notes
of Charles D. Kirkpatrick II, CMT Copyright © 2007.
All rights are reserved.
Krispy Kreme - Weekly
StockCharts.com
Kirkpatrick & Dahlquist Chart 11.8
Weekly Bar Chart for Krispy Kreme DoughnutsDecember 1, 2002 - August 22, 2007
MTA Educational Foundation University Course – Technical Analysis of the Financial Markets ©2010
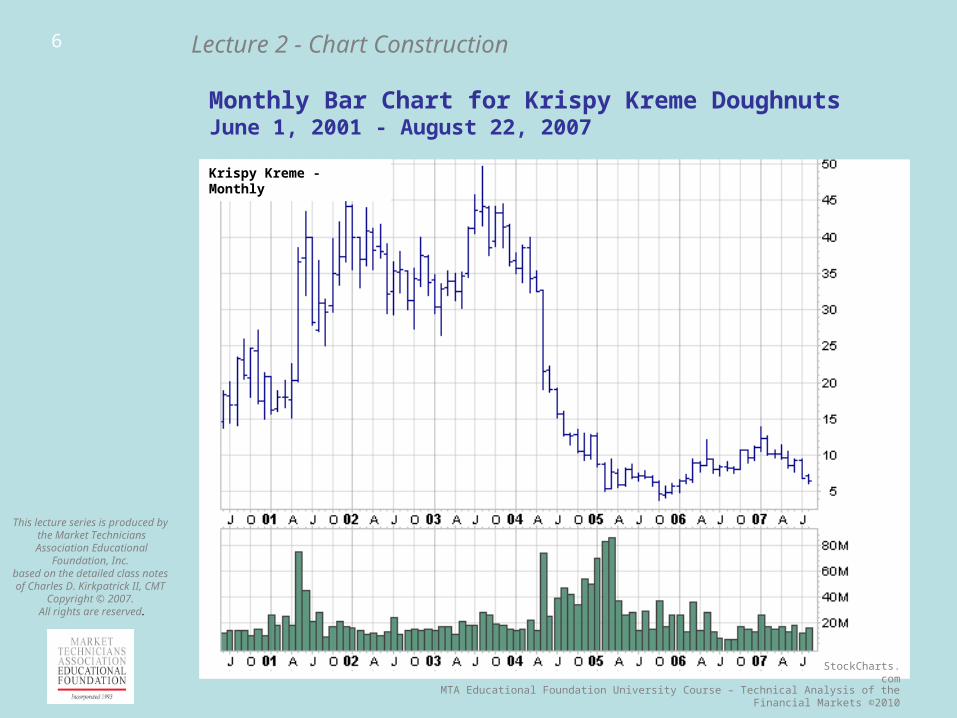
Lecture 2 - Chart Construction6
This lecture series is produced by the Market Technicians Association
Educational Foundation, Inc. based on the detailed class notes
of Charles D. Kirkpatrick II, CMT Copyright © 2007.
All rights are reserved.
Krispy Kreme - Monthly
StockCharts.com
Monthly Bar Chart for Krispy Kreme DoughnutsJune 1, 2001 - August 22, 2007

MTA Educational Foundation University Course – Technical Analysis of the Financial Markets ©2010
Lecture 2 - Chart Construction7
This lecture series is produced by the Market Technicians Association
Educational Foundation, Inc. based on the detailed class notes
of Charles D. Kirkpatrick II, CMT Copyright © 2007.
All rights are reserved.
Kirkpatrick & Dahlquist Chart 11.10
StockCharts.com
Monthly Bar Chart for Cisco Systems, Inc.1995-2005 (arithmetic scale)
Cisco - CSCO

MTA Educational Foundation University Course – Technical Analysis of the Financial Markets ©2010
Lecture 2 - Chart Construction8
This lecture series is produced by the Market Technicians Association
Educational Foundation, Inc. based on the detailed class notes
of Charles D. Kirkpatrick II, CMT Copyright © 2007.
All rights are reserved.
Kirkpatrick & Dahlquist Chart 11.11
StockCharts.com
Monthly Bar Chart for Cisco Systems, Inc.1995-2005 (logarithmic scale)
Cisco - CSCO

MTA Educational Foundation University Course – Technical Analysis of the Financial Markets ©2010
Lecture 2 - Chart Construction9
This lecture series is produced by the Market Technicians Association
Educational Foundation, Inc. based on the detailed class notes
of Charles D. Kirkpatrick II, CMT Copyright © 2007.
All rights are reserved.
Drawing the Candle Lines
Definition of Candle Terms

MTA Educational Foundation University Course – Technical Analysis of the Financial Markets ©2010
Lecture 2 - Chart Construction10
This lecture series is produced by the Market Technicians Association
Educational Foundation, Inc. based on the detailed class notes
of Charles D. Kirkpatrick II, CMT Copyright © 2007.
All rights are reserved.
Kirkpatrick & Dahlquist Chart 11.9
StockCharts.com
Krispy Kreme - Daily
Daily Candlestick Chart for Krispy Kreme DoughnutsJune 1 - August 22, 2007

MTA Educational Foundation University Course – Technical Analysis of the Financial Markets ©2010
Lecture 2 - Chart Construction11
This lecture series is produced by the Market Technicians Association
Educational Foundation, Inc. based on the detailed class notes
of Charles D. Kirkpatrick II, CMT Copyright © 2007.
All rights are reserved.
StockCharts.com
Daily Candle Chart for DIA (Diamonds)September 30, 2007 - January 16, 2008
MTA Educational Foundation University Course – Technical Analysis of the Financial Markets ©2010
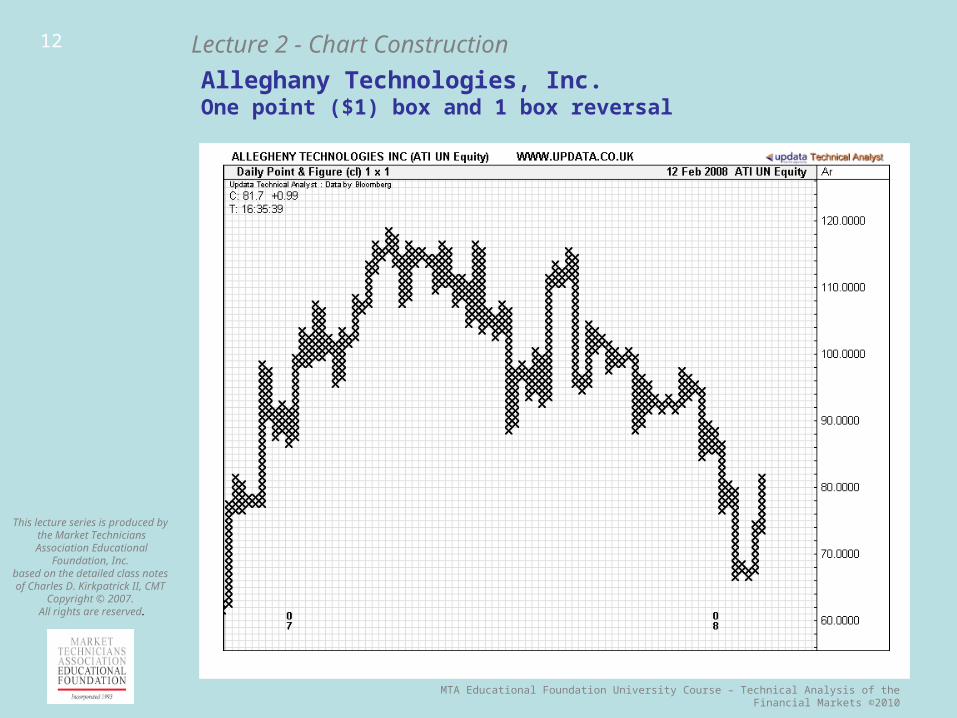
Lecture 2 - Chart Construction12
This lecture series is produced by the Market Technicians Association
Educational Foundation, Inc. based on the detailed class notes
of Charles D. Kirkpatrick II, CMT Copyright © 2007.
All rights are reserved.
Alleghany Technologies, Inc.One point ($1) box and 1 box reversal

MTA Educational Foundation University Course – Technical Analysis of the Financial Markets ©2010
Lecture 2 - Chart Construction13
This lecture series is produced by the Market Technicians Association
Educational Foundation, Inc. based on the detailed class notes
of Charles D. Kirkpatrick II, CMT Copyright © 2007.
All rights are reserved.
Alleghany Technologies, Inc.One point ($1) box and 3 box reversal

MTA Educational Foundation University Course – Technical Analysis of the Financial Markets ©2010
Lecture 2 - Chart Construction14
This lecture series is produced by the Market Technicians Association
Educational Foundation, Inc. based on the detailed class notes
of Charles D. Kirkpatrick II, CMT Copyright © 2007.
All rights are reserved.
Alleghany Technologies, Inc.Two point ($2) box and 1 box reversal

MTA Educational Foundation University Course – Technical Analysis of the Financial Markets ©2010
Lecture 2 - Chart Construction15
This lecture series is produced by the Market Technicians Association
Educational Foundation, Inc. based on the detailed class notes
of Charles D. Kirkpatrick II, CMT Copyright © 2007.
All rights are reserved.
Alleghany Technologies, Inc.Two point ($2) box and 3 box reversal

MTA Educational Foundation University Course – Technical Analysis of the Financial Markets ©2010
Lecture 2 - Chart Construction16
This lecture series is produced by the Market Technicians Association
Educational Foundation, Inc. based on the detailed class notes
of Charles D. Kirkpatrick II, CMT Copyright © 2007.
All rights are reserved. StockCharts.com
S&P 500 SPDRs (SPY)1 pt/box; 1 box reversal chart - daily

MTA Educational Foundation University Course – Technical Analysis of the Financial Markets ©2010
Lecture 2 - Chart Construction17
This lecture series is produced by the Market Technicians Association
Educational Foundation, Inc. based on the detailed class notes
of Charles D. Kirkpatrick II, CMT Copyright © 2007.
All rights are reserved.
SPY 2 pt. bare - missing
S&P 500 SPDRs (SPY)2 pt/box; 1 box reversal chart - daily
StockCharts.com
MTA Educational Foundation University Course – Technical Analysis of the Financial Markets ©2010
Lecture 2 - Chart Construction18
This lecture series is produced by the Market Technicians Association
Educational Foundation, Inc. based on the detailed class notes
of Charles D. Kirkpatrick II, CMT Copyright © 2007.
All rights are reserved.
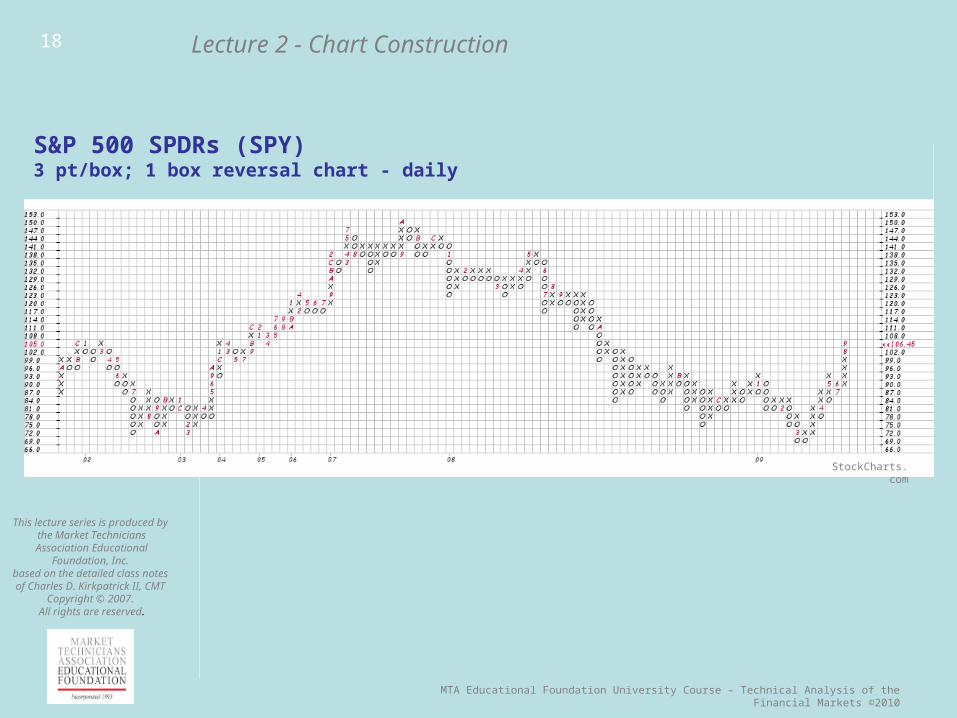
SPY 3 pt. bare - missing
S&P 500 SPDRs (SPY)3 pt/box; 1 box reversal chart - daily
StockCharts.com

MTA Educational Foundation University Course – Technical Analysis of the Financial Markets ©2010
Lecture 2 - Chart Construction19
This lecture series is produced by the Market Technicians Association
Educational Foundation, Inc. based on the detailed class notes
of Charles D. Kirkpatrick II, CMT Copyright © 2007.
All rights are reserved.
SPY 3 pt. - 1 ma - missing
S&P 500 SPDRs (SPY) 3 pt/box; 1 box reversal chart - daily
-- 10-column moving average
StockCharts.com

MTA Educational Foundation University Course – Technical Analysis of the Financial Markets ©2010
Lecture 2 - Chart Construction20
This lecture series is produced by the Market Technicians Association
Educational Foundation, Inc. based on the detailed class notes
of Charles D. Kirkpatrick II, CMT Copyright © 2007.
All rights are reserved.
StockCharts.com
S&P 500 SPDRs (SPY)P&F Pattern: Ascending Triple Top Breakout - Daily3 pts/box, 1 box reversal chart
-- 10-column moving average-- 20-column moving average

MTA Educational Foundation University Course – Technical Analysis of the Financial Markets ©2010
Lecture 2 - Chart Construction21
This lecture series is produced by the Market Technicians Association
Educational Foundation, Inc. based on the detailed class notes
of Charles D. Kirkpatrick II, CMT Copyright © 2007.
All rights are reserved.
StockCharts.com
S&P 500 SPDRs (SPY)P&F Pattern: Ascending Triple Top Breakout - Daily3 pts/box, 1 box reversal chart
-- 10-column moving average-- 20-column moving average
-- 50-column moving average
MTA Educational Foundation University Course – Technical Analysis of the Financial Markets ©2010
Lecture 2 - Chart Construction22
This lecture series is produced by the Market Technicians Association
Educational Foundation, Inc. based on the detailed class notes
of Charles D. Kirkpatrick II, CMT Copyright © 2007.
All rights are reserved. StockCharts.com
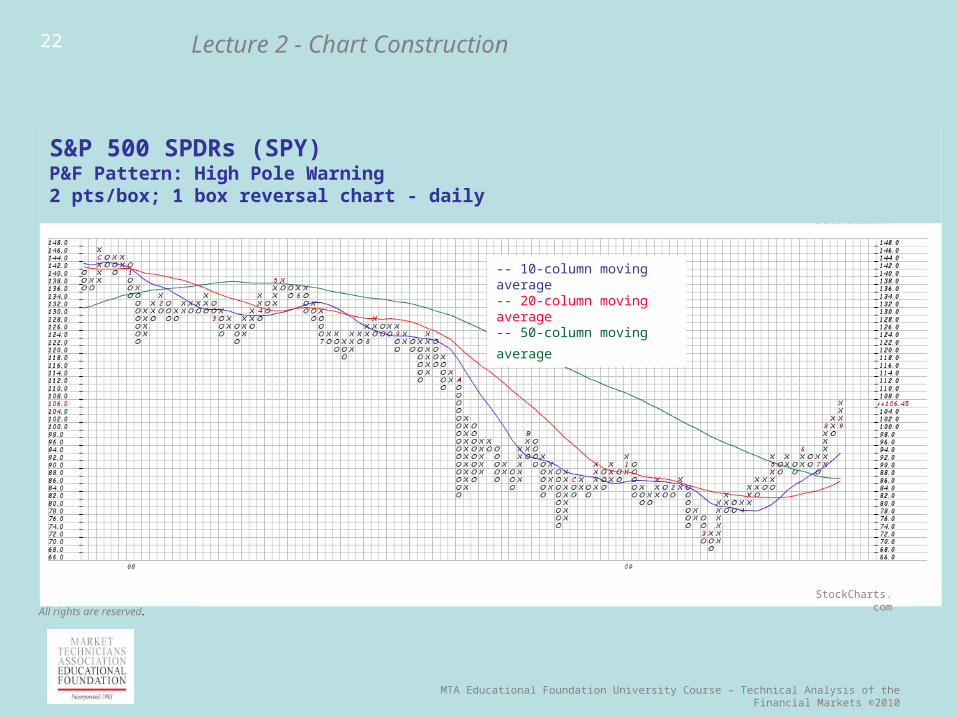
S&P 500 SPDRs (SPY)P&F Pattern: High Pole Warning2 pts/box; 1 box reversal chart - daily
-- 10-column moving average-- 20-column moving average
-- 50-column moving average

MTA Educational Foundation University Course – Technical Analysis of the Financial Markets ©2010
Lecture 2 - Chart Construction23
This lecture series is produced by the Market Technicians Association
Educational Foundation, Inc. based on the detailed class notes
of Charles D. Kirkpatrick II, CMT Copyright © 2007.
All rights are reserved.StockCharts.com
S&P 500 SPDRs (SPY)1 pt/box; 1 box reversal chart - daily
-- 10-column moving average-- 20-column moving average
-- 50-column moving average

MTA Educational Foundation University Course – Technical Analysis of the Financial Markets ©2010
Lecture 2 - Chart Construction24
This lecture series is produced by the Market Technicians Association
Educational Foundation, Inc. based on the detailed class notes
of Charles D. Kirkpatrick II, CMT Copyright © 2007.
All rights are reserved.
StockCharts.com
street TRACKS Gold Trust Shares (GLD)1 pt/box, 1 box reversal chart
-- 10-column moving average-- 20-column moving average
-- 50-column moving average

MTA Educational Foundation University Course – Technical Analysis of the Financial Markets ©2010
Lecture 2 - Chart Construction25
This lecture series is produced by the Market Technicians Association
Educational Foundation, Inc. based on the detailed class notes
of Charles D. Kirkpatrick II, CMT Copyright © 2007.
All rights are reserved.
StockCharts.com
street TRACKS Gold Trust Shares (GLD)P&F Pattern: High Pole Warning2 pts/box, 1 box reversal chart
-- 10-column moving average-- 20-column moving average
-- 50-column moving average

MTA Educational Foundation University Course – Technical Analysis of the Financial Markets ©2010
Lecture 2 - Chart Construction26
This lecture series is produced by the Market Technicians Association
Educational Foundation, Inc. based on the detailed class notes
of Charles D. Kirkpatrick II, CMT Copyright © 2007.
All rights are reserved.
Citigroup, Inc. (C)P&F Pattern: Quadruple Top BreakoutAverage True Range (120) - 1.24 pts/box, 1 box reversal chart
StockCharts.com
-- 10-column moving average-- 20-column moving average
-- 50-column moving average

MTA Educational Foundation University Course – Technical Analysis of the Financial Markets ©2010
Lecture 2 - Chart Construction27
This lecture series is produced by the Market Technicians Association
Educational Foundation, Inc. based on the detailed class notes
of Charles D. Kirkpatrick II, CMT Copyright © 2007.
All rights are reserved.
StockCharts.com
United States Oil Fund (USO)Average True Range (120) - 1.68 pts/box, 1 box reversal
StockCharts.com
-- 10-column moving average-- 20-column moving average
-- 50-column moving average

MTA Educational Foundation University Course – Technical Analysis of the Financial Markets ©2010
Lecture 2 - Chart Construction28
This lecture series is produced by the Market Technicians Association
Educational Foundation, Inc. based on the detailed class notes
of Charles D. Kirkpatrick II, CMT Copyright © 2007.
All rights are reserved.
StockCharts.com
Goldman Sachs Group, Inc. (GS)P&F Pattern: Ascending Triple Top Breakout - DailyAverage True Range (120) - 5.63 pts/box, 1 box reversal chart
Bollinger Bands