Embed Size (px)
Citation preview
Lineament Extraction using Gravity Data in the Citarum Watershed Gumilar Utamas Nugraha, Karit Lumban Gaol, Lina Handayani and Rachmat Fajar Lubis Research Center For Geotechnology, Indonesian Institute of Sciences, Indonesia
Abstract. Lineament is one of the most important features showing subsurface elements or structural weakness such as faults. is study aims to identify subsurface lineament patterns using automatic lineament in Citarum watershed with gravity data. Satellite gravity data were used to generate a sub-surface lineament. Satellite gravity data corrected using Bouguer and terrain correction to obtain a complete Bouguer anomaly value. Butterworth �lters were used to separate regional and residual anomaly from the complete Bouguer anomaly value. Residual anomaly gravity data used to analyze sub-surface lineament. Lineament generated using Line module in PCI Geomatica to obtain sub-surface lineament from gravity residual value. e orientations of lineaments and fault lines were created by using rose diagrams. e main trends observed in the lineament map could be recognized in these diagrams, showing a strongly major trend in NW-SE, and the subdominant directions were in N-S. Area with a high density of lineament located at the Southern part of the study area. High-density lineament might be correlated with fractured volcanic rock upstream of the Citarum watershed, meanwhile, low-density lineament is associated with low-density sediment. e high-density fracture might be associated with intensive tectonics and volcanism.
1. Introduction Area of approximately Seven thousand four hundred
square kilometers, divided into three parts; the upper part (1771 squared kilometer), the middle part (4242 km2), the lower part (1387 square kilometer) (Juwana et al., 2016a). e average watershed rainfall is 2300 mm/year, and the Citarum �ow measured by the Saguling Dam is around 5.7 billion m3/year (Juwana et al., 2016b). In 2008, there were just over 11 million people in the watershed. Most live on the Riverbanks and have used it directly in different domestic applications (Juwana et al., 2016b). e river runs through Jakarta and West, two central provinces. Water companies in the watershed also use the river as the raw water source for their water treatment plants(Juwana et al., 2016b).
A lot of Citarum researchers (Agaton et al., 2016; Djuangsih, 1993; Harashina et al., 2003; Herawati et al., 2016; Juwana et al., 2016a; Nastiti et al., 2015; Parikesit et al., 2001; Sunardi et al., 2012). None of them concerns the mapping of sub-surface geological structures. e mapping of geological structures in the area, particularly in areas with insufficient outcrop exposures, can take time and are difficult (Yeomans et al., 2019). Moreover, partial exposure and subtle topographic variation structures such as severe defects can be complicated to map a geologist on the �eld. Lineament detection can aid the mapping of geological structures (Yeomans et al., 2019). A lineament is a mappable rectilinear or curvilinear linear feature of a surface, distinct from adjacent patterns, representing a subsurface phenomenon (O'Leary et al., 1976). Lineaments are linear features evident at the land surface that express the underlying geological structure (Ibrahim & Mutua, 2012). It is a linear or
curvilinear mappable feature on a surface whose parts are aligned in a straight or somewhat curved relation due to a defect or other line defect (Ibrahim & Mutua, 2012). e surface characteristics that form a lineament can be geomorphological, i.e., relief or tonal differences i.e. (Hung et al., 2005, Haryono et al., 2016). Remotely sensed data, including satellite imaging, and airborne geophysical data, are usually used to map regionals (Yeomans et al., 2019). In addition, these lineaments may be used as a basis to infer the region's structural geology, with implications for mineral exploration (Moore and Camm, 1982; James et Moore, 1985; Ni et al., 2016; Verdiansyah, 2019), oil exploration (Peña and Abdelsalam, 2006). (Rutzinger et al., 2007). e conventional techniques of linear extraction include manual scanning of linear features. In addition, optical images are commonly used, but they take time, are subjective, and are reproductive inadequate (Masoud and Koike, 2006; Scheiberet al., 2015).
There are various applications for potential field methods (Zhdanov, 2002; Mehanee and Zhdanov, 2002; Abdelrahman et al., 2004; Zhdanov et al., 2004; Essa et al., 2008; Mehanee et al., 2011; Mehanee, 2014, Mehanee, 2015; Biswas, 2017; Zhang et al., 2018, Essa and Elhussein, 2018). In many geophysical prospect areas, particularly in the determination of the crystalline basement depth (Abdelrahman and Essa 2015a; Yangfan Deng et al., 2016), which define structural environments, gravity and magnetic processes have been presented as beneficial results (Abdelrahman and Essa, 2015b; Gabtni et al., 2016), Exploring and delineating gravity and magnetic resources on minerals, hydrocarbons and geothermals (Eseas, 2007 and 2011; Khazri and Gabtni, 2018)
ISSN 2354-9114 (online), ISSN 0024-9521 (print) Indonesian Journal of Geography Vol.53 , No. 1, 2021 (87– 94) DOI: http://dx.doi.org/10.22146/ijg.52402 website: https://jurnal.ugm.ac.id/ijg ©2021 Faculty of Geography UGM and e Indonesian Geographers Association
Received: 2020-02-03 Accepted: 2021-04-04 Keywords: Citarum Watershed; Lineament; Gravity Correspondent email: [email protected]
RESEARCH ARTICLE
©2021 by the authors. Licensee Indonesian Journal of Geography, Indonesia. is article is an open access article distributed under the terms and conditions of the Creative Commons Attribution(CC BY NC) licensehttps://creativecommons.org/licenses/by-nc/4.0/.
88
(Essa, 2014; Mehanee and Essa, 2015; Abo-Ezz and Essa, 2016; Essa and Elhussein, 2017). For many subsurface investigations, gravity methods have been used (Araffa et al., 2015; Fallatah et al., 2019; Kurniawan, 2012; Mansour et al., 2018; Mohamed, 2019; Mukherjee & Ramachandran, 2018; Yang et al., 2019). Some researchers have been using gravity satellite information in their research (Álvarez et al., 2013; Chambers 2015.; Chen et al., 2014.; Holzrichter & Ebbing, 2016; Noréus et al (1997); Publishers & Kingdom, 1991.
For several decades, the automation in structural geology of remotely sensed data geological mapping has served as a central research topic (Yeomans et al., 2019). Automation overcomes time and subjectivity issues that influence the manual approach. While fully automatic methods go beyond current computer algorithms, semi-automatic techniques rapidly improve (Yeomans et al., 2019). An early critique of semi-automatic methods included misconceptions about roads and field borders in specific environments, as well as the adverse effects of vegetative cover (Yeomans et al., 2019). More elaborate processing and non-optical datasets such as airborne geophysical data, in particular, magnetic data (Middleton et al., 2015), electromagnetic data (Paananen, 2013), radiometric data (Debeglia et al.,2006), and gravity data can now be circumvented (Lahti et al., 2014).
Satellite imagery and gravity datasets can detect lineaments (Francés et al., 2014; Nur et al., 2017). Application of Sobel and gradient are various techniques including. The second is an automated linear extraction, where the image is automatically processed by specifying different parameters, such as the curve length, the connection of distance, kernel size. There are two main methods of removing lineaments from satellite images: (Nur et al., 2017). LINE from PCI Geomatica has been the most popular processing tool in recent years. This study aims to identify sub-surface linear models in the Citarum watershed with gravity data using automatic lineaments. 2. Method is research was conducted in the Citarum watershed with the geographical location at coordinates 106°57’50.869” – 107°56’59.669” dan 5°54’53.468 – 7°14’38.517”. Gravity data obtained are from UCSD TOPEX satellite imagery. TOPEX has been used by many researchers (Bansal et al., 2005; Kurniawan, 2012; Noréus et al., 1997; Paolo & Molina, 2010). TOPEX UCSD has precision per unit second with a distance of 30-40 mm with a gravitational �eld resolution of 4-6 mGal. e basic concept of gravimetric satellites is detecting changes in Earth's gravity �eld by monitoring changes in distance that occur between pairs of 2 gravimetric satellites in their orbits (Chambers, 2015). The two satellites travel along an orbit path of approximately 220 kilometers between one and the second satellite. These satellites are connected to the exact distance by a K-band microwave link, and how significant the change is better than 1 micrometer per second with accuracy.
Both satellites feature a star camera and an accelerometer to see the exact movement and altitude because of the satellite's non-gravity force. In the meantime, a GPS installed in the two pairs of satellites determines satellite positions and speed. The accuracy of the gravimetric satellite is 1 cm in height, and one mGal in gravity anomalies is even less on the ground surface on the spatial grid of 100 kilometers (Chelton
et al., 2001). The data obtained in the form of the free air anomaly values is then processed by terrain correcting and correction of bouguers to generate a cross-section of regional anomalies and remaining anomalies. Finally, fortified fault structure estimation is done through quality analysis, namely sub-surface structure modeling. Complete Bouguer Anomaly Gravity According to Martín et al. (2011), Bouguer gravity anomalies were calculated with the equation that defines from Heiskanen and Moritz (1967), Figure 1.:
(1) Terrain correction tools provided by Geoso Oasis Montaj were used to obtain the C value (Terrain Correction). B is the Bouguer correction that can be calculated using this equation:
(2) ρ is the crustal density (2.67 gr/cm3) used in the Bouguer correction and H is the height of the point in meters and K were universal gravitational constant. Complete Bouguer Anomaly values have been gridded with the Minimum Curvature Gridding (MCG) module provided by Geosoft Oasis Montaj software. The minimum curvature gridding method used by Briggs (1974) was first employed according to Martínez-moreno et al. (2015). The algorithm was later drawn up by Swain (1976) and modified by Webring (1981). It is based on a two-dimensional differential equation for disassembling a thin sheet, which is equivalent to a third-
LINEAMENT EXTRACTION USING GRAVITY DATA Gumilar Utamas Nugraha, et al
Figure 1. Complete Bouguer Anomaly Gravity
89
Indonesian Journal of Geography, Vol. 53, No.1, 2021 : 87 – 94
order spline, under the influence of the point forces (Briggs, 1974). The gravity measurements were filtered over the field of study to calculate the regional trend (Mickus et al., 1991). The Complete Bouguer anomaly (CBA) value is the regional and residual anomaly accumulation value. Butterworth filter was used to distinguish between regional and residual anomaly. Butterworth Filter
Butterworth filters are known as maximally flat filters, according to Ellis (2012), because they have the sharpest possible roll-off without causing a peak in the Bode plot. The second-order Butterworth filter is the two-pole filter with a damping ratio of 0.707. Butterworth filters are used because of their ability to peak in control systems. It is conservative in removing all peaks from the filter. Allowing specific peaks may be advantageous as it allows an equal attenuation of lower frequencies with more minor phase delay. The Butterworth filter is nevertheless a natural choice in order to organize the many pole higher-order filter systems.
is is the equation for odd orders of butterworth:
(3) П it means the result (product), M its mean the orders of �lter Lineament
Various techniques have been developed to obtain the terrain's linear characteristics and geomorphology (Nur et al., 2017). This paper shows an automatic lineament with
edge enhancement, followed by a sharpening technique that gives the best outcome of non-human eye lines, and applies the PCI Geomatica V9.1 Line module to recognized lineaments. Edge-sharpening improvements make for analysis forms and details (Richards, 1986). The PCI Geomatics software package used edge sharpening. Finally, for automatic lineament extraction, final images from the study area were used. PCI geomatica have features of edge detection, thresholding, and curve extraction processes are part of the lineament extraction algorithm. There is some default parameter in the LINE feature of Geomatica software: RADI (Radius of filter in pixels), GTHR(Threshold for edge gradient), LTHR(Threshold for curve length), FTHR (Threshold for fitting line error), ATHR(Threshold for angular difference), and DTHR(Threshold for linking distance) (PCI Geomatica, 2001). Multiple line maps with different threshold values were generated. Those lineaments were considered default lines, and the best threshold values were selected (below). In order to determine threshold values, general characteristics were taken into account, such as length, curvature, segmentation, separation, and so on. 3. Result and Discussion
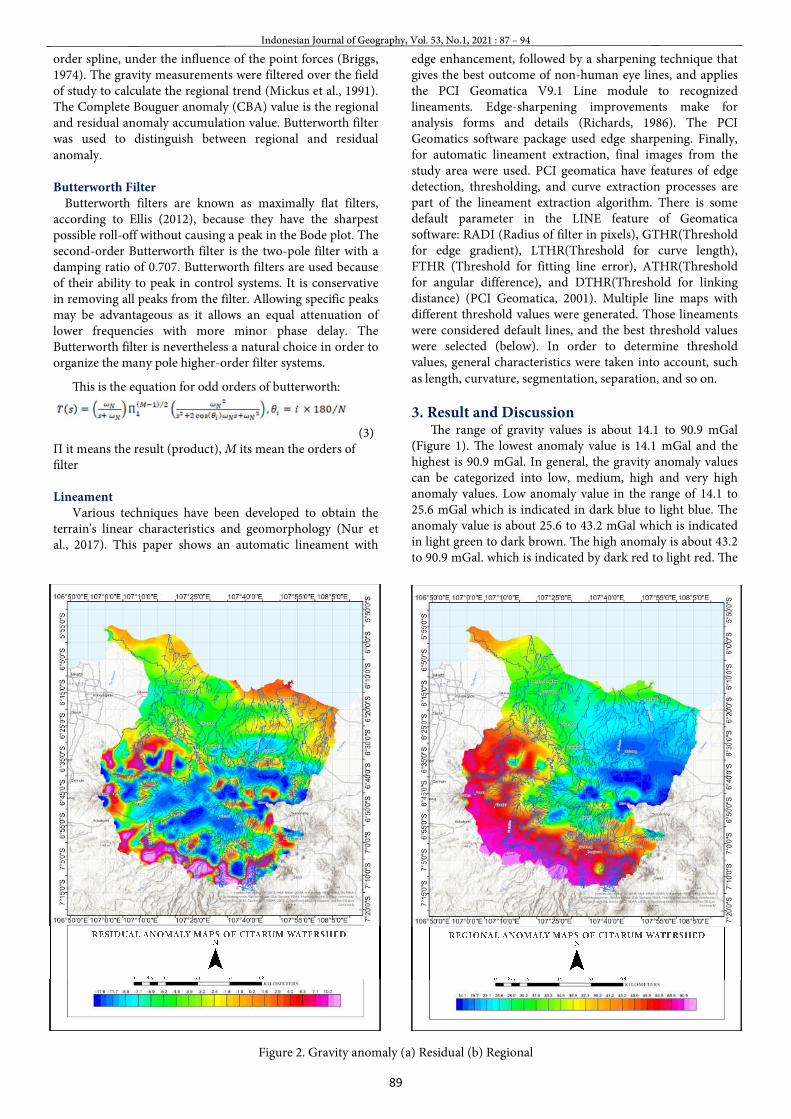
e range of gravity values is about 14.1 to 90.9 mGal (Figure 1). e lowest anomaly value is 14.1 mGal and the highest is 90.9 mGal. In general, the gravity anomaly values can be categorized into low, medium, high and very high anomaly values. Low anomaly value in the range of 14.1 to 25.6 mGal which is indicated in dark blue to light blue. e anomaly value is about 25.6 to 43.2 mGal which is indicated in light green to dark brown. e high anomaly is about 43.2 to 90.9 mGal. which is indicated by dark red to light red. e
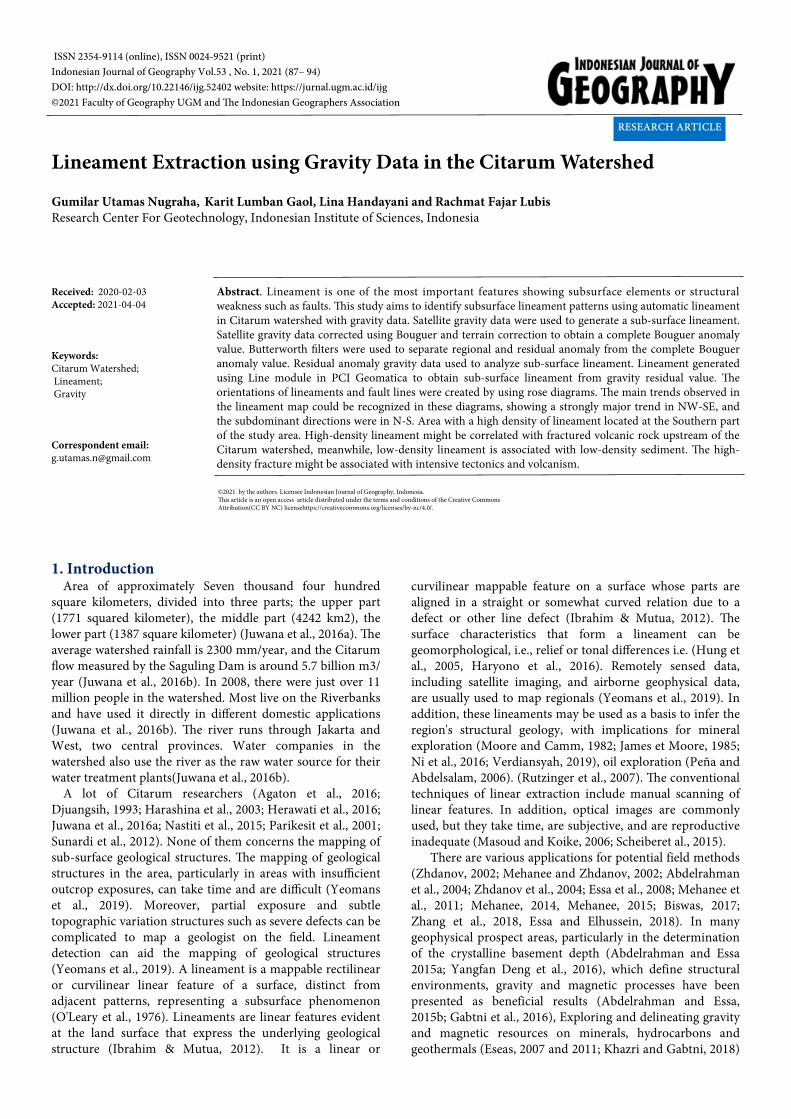
Figure 2. Gravity anomaly (a) Residual (b) Regional
90
residual anomaly map Figure 2(a), shows that the range of gravity values is about 17.6 to 10 mGal. e lowest anomaly value is -17.6 mGal and the highest is 10 mGal.
Regional anomaly maps re�ect intense subsurface conditions. In contrast, residual anomaly maps describe the shallow sub-surface information. Based on regional anomaly maps, the southern part of the study area tends to be dominated by high anomaly values (43.2 to 90.0 mGal). e northwestern study area also has a high anomaly, but not higher than the southern part of the study area (30 mGal to 50 mGal). Medium anomaly zones tend to �ll the central part of Citarum Watershed, northwestern and northeastern part of the regional anomaly map (28 mGal to 35.8 mGal). Low
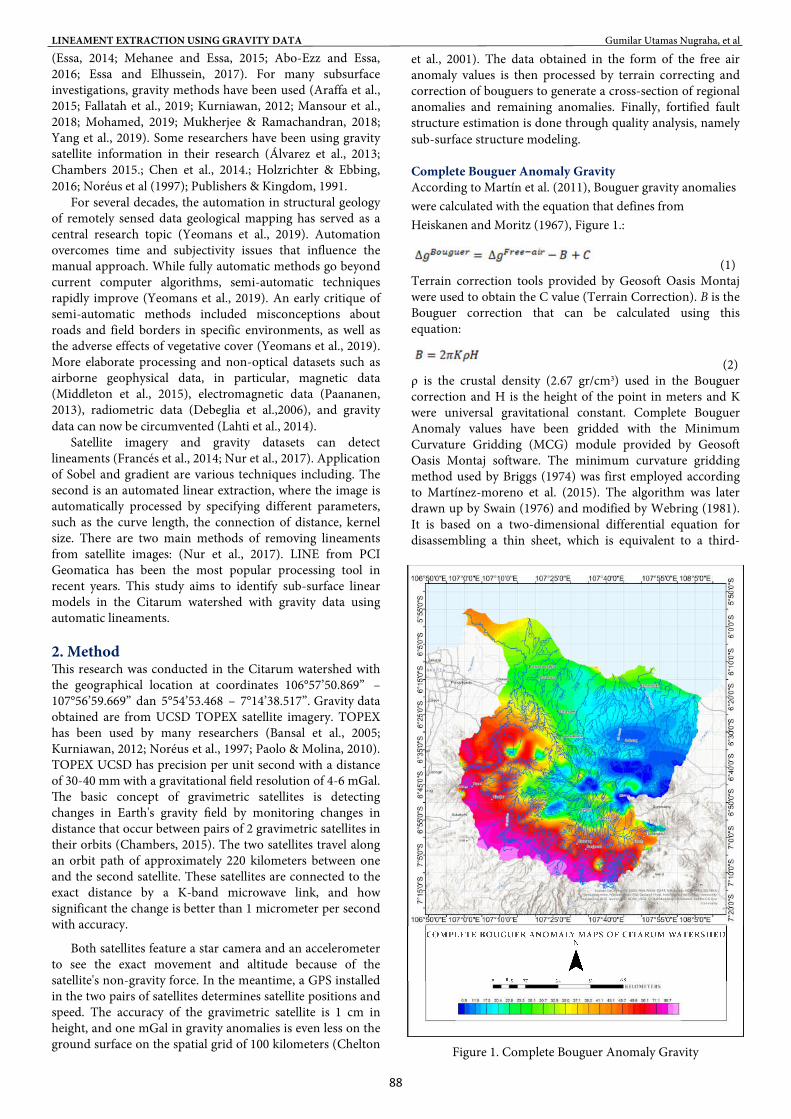
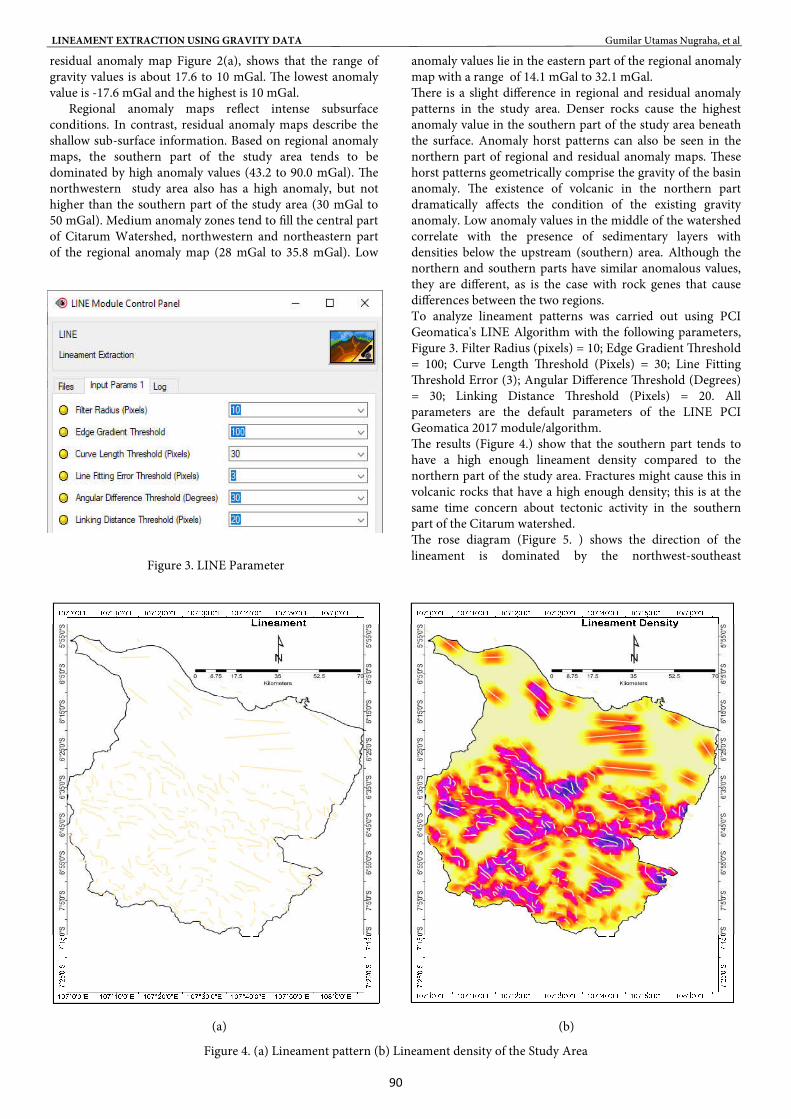
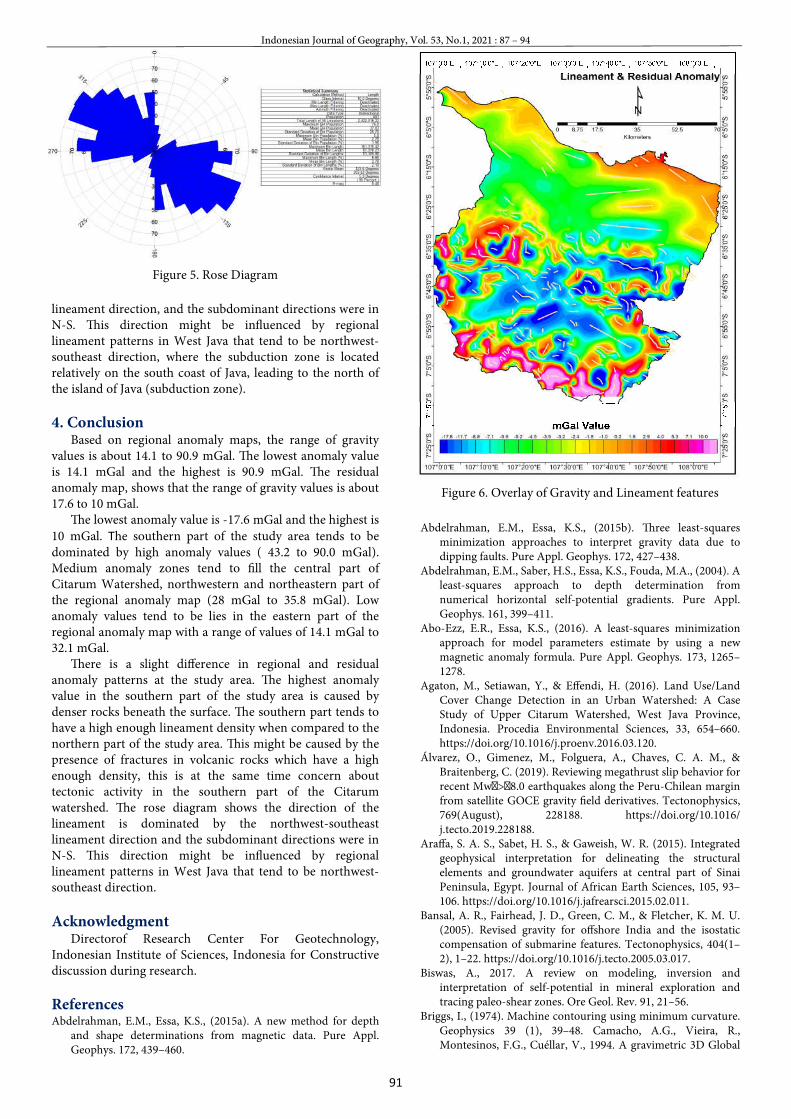
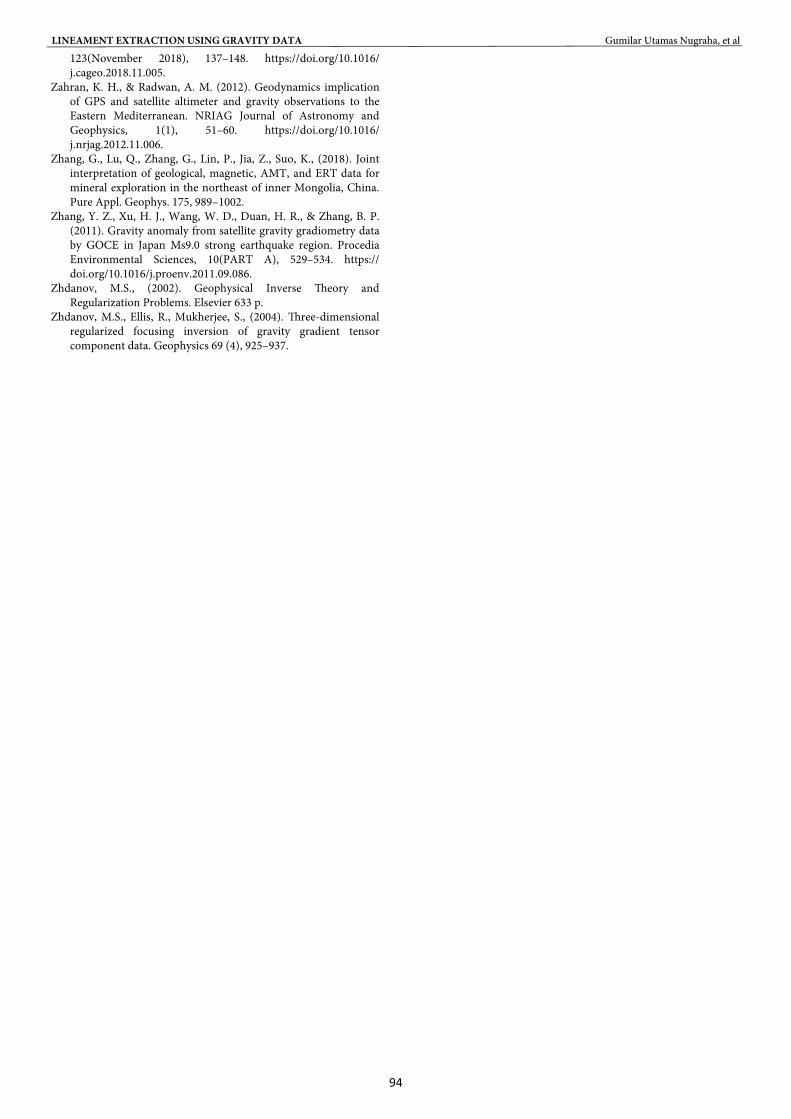
anomaly values lie in the eastern part of the regional anomaly map with a range of 14.1 mGal to 32.1 mGal. ere is a slight difference in regional and residual anomaly patterns in the study area. Denser rocks cause the highest anomaly value in the southern part of the study area beneath the surface. Anomaly horst patterns can also be seen in the northern part of regional and residual anomaly maps. ese horst patterns geometrically comprise the gravity of the basin anomaly. e existence of volcanic in the northern part dramatically affects the condition of the existing gravity anomaly. Low anomaly values in the middle of the watershed correlate with the presence of sedimentary layers with densities below the upstream (southern) area. Although the northern and southern parts have similar anomalous values, they are different, as is the case with rock genes that cause differences between the two regions. To analyze lineament patterns was carried out using PCI Geomatica's LINE Algorithm with the following parameters, Figure 3. Filter Radius (pixels) = 10; Edge Gradient reshold = 100; Curve Length reshold (Pixels) = 30; Line Fitting reshold Error (3); Angular Difference reshold (Degrees) = 30; Linking Distance reshold (Pixels) = 20. All parameters are the default parameters of the LINE PCI Geomatica 2017 module/algorithm. e results (Figure 4.) show that the southern part tends to have a high enough lineament density compared to the northern part of the study area. Fractures might cause this in volcanic rocks that have a high enough density; this is at the same time concern about tectonic activity in the southern part of the Citarum watershed. e rose diagram (Figure 5. ) shows the direction of the lineament is dominated by the northwest-southeast
Figure 3. LINE Parameter
(a) (b)
Figure 4. (a) Lineament pattern (b) Lineament density of the Study Area
LINEAMENT EXTRACTION USING GRAVITY DATA Gumilar Utamas Nugraha, et al
91
lineament direction, and the subdominant directions were in N-S. is direction might be in�uenced by regional lineament patterns in West Java that tend to be northwest-southeast direction, where the subduction zone is located relatively on the south coast of Java, leading to the north of the island of Java (subduction zone).
4. Conclusion
Based on regional anomaly maps, the range of gravity values is about 14.1 to 90.9 mGal. e lowest anomaly value is 14.1 mGal and the highest is 90.9 mGal. e residual anomaly map, shows that the range of gravity values is about 17.6 to 10 mGal.
e lowest anomaly value is -17.6 mGal and the highest is 10 mGal. The southern part of the study area tends to be dominated by high anomaly values ( 43.2 to 90.0 mGal). Medium anomaly zones tend to �ll the central part of Citarum Watershed, northwestern and northeastern part of the regional anomaly map (28 mGal to 35.8 mGal). Low anomaly values tend to be lies in the eastern part of the regional anomaly map with a range of values of 14.1 mGal to 32.1 mGal.
ere is a slight difference in regional and residual anomaly patterns at the study area. e highest anomaly value in the southern part of the study area is caused by denser rocks beneath the surface. e southern part tends to have a high enough lineament density when compared to the northern part of the study area. is might be caused by the presence of fractures in volcanic rocks which have a high enough density, this is at the same time concern about tectonic activity in the southern part of the Citarum watershed. e rose diagram shows the direction of the lineament is dominated by the northwest-southeast lineament direction and the subdominant directions were in N-S. is direction might be in�uenced by regional lineament patterns in West Java that tend to be northwest-southeast direction.
Acknowledgment Directorof Research Center For Geotechnology,
Indonesian Institute of Sciences, Indonesia for Constructive discussion during research.
References Abdelrahman, E.M., Essa, K.S., (2015a). A new method for depth
and shape determinations from magnetic data. Pure Appl. Geophys. 172, 439–460.
Abdelrahman, E.M., Essa, K.S., (2015b). ree least-squares minimization approaches to interpret gravity data due to dipping faults. Pure Appl. Geophys. 172, 427–438.
Abdelrahman, E.M., Saber, H.S., Essa, K.S., Fouda, M.A., (2004). A least-squares approach to depth determination from numerical horizontal self-potential gradients. Pure Appl. Geophys. 161, 399–411.
Abo-Ezz, E.R., Essa, K.S., (2016). A least-squares minimization approach for model parameters estimate by using a new magnetic anomaly formula. Pure Appl. Geophys. 173, 1265–1278.
Agaton, M., Setiawan, Y., & Effendi, H. (2016). Land Use/Land Cover Change Detection in an Urban Watershed: A Case Study of Upper Citarum Watershed, West Java Province, Indonesia. Procedia Environmental Sciences, 33, 654–660. https://doi.org/10.1016/j.proenv.2016.03.120.
Álvarez, O., Gimenez, M., Folguera, A., Chaves, C. A. M., & Braitenberg, C. (2019). Reviewing megathrust slip behavior for recent Mw > 8.0 earthquakes along the Peru-Chilean margin from satellite GOCE gravity �eld derivatives. Tectonophysics, 769(August), 228188. https://doi.org/10.1016/j.tecto.2019.228188.
Araffa, S. A. S., Sabet, H. S., & Gaweish, W. R. (2015). Integrated geophysical interpretation for delineating the structural elements and groundwater aquifers at central part of Sinai Peninsula, Egypt. Journal of African Earth Sciences, 105, 93–106. https://doi.org/10.1016/j.jafrearsci.2015.02.011.
Bansal, A. R., Fairhead, J. D., Green, C. M., & Fletcher, K. M. U. (2005). Revised gravity for offshore India and the isostatic compensation of submarine features. Tectonophysics, 404(1–2), 1–22. https://doi.org/10.1016/j.tecto.2005.03.017.
Biswas, A., 2017. A review on modeling, inversion and interpretation of self-potential in mineral exploration and tracing paleo-shear zones. Ore Geol. Rev. 91, 21–56.
Briggs, I., (1974). Machine contouring using minimum curvature. Geophysics 39 (1), 39–48. Camacho, A.G., Vieira, R., Montesinos, F.G., Cuéllar, V., 1994. A gravimetric 3D Global
Figure 5. Rose Diagram
Figure 6. Overlay of Gravity and Lineament features
Indonesian Journal of Geography, Vol. 53, No.1, 2021 : 87 – 94

92
inversion for cavity detection. Geophys. Prospect. 42 (2), 113–130.
Chambers, D. P. (2015). Gravimetric Methods - Satellite Altimeter Measurements. In Treatise on Geophysics: Second Edition (Vol. 3). Elsevier B.V. https://doi.org/10.1016/B978-0-444-53802-4.00063-4.
Chen, J., Li, J., Zhang, Z., & Ni, S. (2014). Long-term groundwater variations in Northwest India from satellite gravity measurements. Global and Planetary Change, 116, 130–138. https://doi.org/10.1016/j.gloplacha.2014.02.007.
Debeglia, N., Martelet, G., Perrin, J., Truffert, C., Ledru, P., Tourlie, B., aug 2006. Semiautomated structural analysis of high resolution magnetic and gamma-ray spectrometry airborne surveys. J. Appl. Geophys. 58 (1), 13–28. http://linkinghub.elsevier. com/retrieve/pii/S0926985105000273.
Deng, Yangfan, Chen, Yun, Wang, Peng, Essa, Khalid S., Xub, Tao, Liang, Xiaofeng, Badal, José, (2016). Magmatic underplating beneath the Emeishan large igneous province (South China) revealed by the COMGRA-ELIP experiment. Tectonophysics 672–673, 16–23.
Djuangsih, N. (1993). Understanding the state of river basin management from an environmental toxicology perspective: an example from water pollution at Citarum river basin, West Java, Indonesia. Science of the Total Environment, 134(SUPPL. 1), 283–292. https://doi.org/10.1016/S0048-9697(05)80029-4.
Ellis, G., (2012). Control System Design Guide: Using Your Computer to Understand and Diagnose Feedback Controllers (4th edition). Elsevier.
Essa, K.S., 2007. A simple formula for shape and depth determination from residual gravity anomalies. Acta Geophys. 55, 182–190.
Essa, K.S., (2011). A new algorithm for gravity or self-potential data interpretation. J. Geophys. Eng. 8, 434–446.
Essa, K.S., (2014). New fast least-squares algorithm for estimating the best-fitting parameters of some geometric-structures to measured gravity anomalies. J. Adv. Res. 5, 57–65.
Essa, K.S., Elhussein, M., (2017). A new approach for the interpretation of magnetic data by a 2-D dipping dike. J. Appl. Geophys. 136, 431–443.
Essa, K.S., Elhussein, M., (2018). PSO (particle swarm optimization) for interpretation of magnetic anomalies caused by simple geometrical structures. Pure Appl. Geophys. https://doi.org/10.1007/s00024-018-1867-0.
Essa, K.S., Mehanee, S., Smith, P., (2008). A new inversion algorithm for estimating the best fitting parameters of some geometrically simple body from measured self-potential anomalies. Explor. Geophys. 39, 155–163.
Essa, K.S., Nady, A.G., Elhussein, M., (2015). Recognition of mega structures of Sinai Peninsula using potential field data. EGS J. 13, 45–56.
Fallatah, O. A., Ahmed, M., Cardace, D., Boving, T., & Akanda, A. S. (2019). Assessment of modern recharge to arid region aquifers using an integrated geophysical, geochemical, and remote sensing approach. Journal of Hydrology, 569(March 2018), 600–611. https://doi.org/10.1016/j.jhydrol.2018.09.061.
Francés, A. P., Lubczynski, M. W., Roy, J., Santos, F. A. M., & Mahmoudzadeh Ardekani, M. R. (2014). Hydrogeophysics and remote sensing for the design of hydrogeological conceptual models in hard rocks - Sardón catchment (Spain). Journal of Applied Geophysics, 110, 63–81. https://doi.org/10.1016/j.jappgeo.2014.08.015.
Gabtni, H., Hajjia, O., Jalloulibc, C., 2016. Integrated application of gravity and seismic methods for determining the dip angle of a fault plane: case of Mahjouba fault(Central Tunisian Atlas Province, North Africa). J. Afr. Earth Sci. 119, 160–170.
Harashina, K., Takeuchi, K., Tsunekawa, A., & Ari�n, H. S. (2003). Nitrogen �ows due to human activities in the Cianjur-Cisokan watershed area in the middle Citarum drainage basin, West Java, Indonesia: A case study at hamlet scale. Agriculture,
Ecosystems and Environment, 100(1–3), 75–90. https://doi.org/10.1016/S0167-8809(03)00173-7.
Haryono, E., Widartono, B. S., Lukito, H., & Kusumayuda, S. B. (2016). A comparison of lineament and fracture trace extraction from LANDSAT ETM panchromatic band and panchromatic aerial photograph in Gunungsewu karst area, Java-Indonesia. IOP Conference Series: Earth and Environmental Science, 47, 12026. https://doi.org/10.1088/1755-1315/47/1/012026
Heiskanen, W.A., Moritz, H., (1967). Physical Geodesy. W.H. Freeman, San Francisco.
Herawati, T., Yustiati, A., Nurhayati, A., & Natadia, S. S. (2016). Domestication of Marble Goby [Oxyeleotris Marmorata (Bleeker, 1852)] Indogenous Fish of Citarum River, Indonesia. Aquatic Procedia, 7, 247–253. https://doi.org/10.1016/j.aqpro.2016.07.035.
Holzrichter, N., & Ebbing, J. (2016). A regional background model for the Arabian Peninsula from modeling satellite gravity gradients and their invariants. Tectonophysics, 692, 86–94. https://doi.org/10.1016/j.tecto.2016.06.002.
Hung, Q. L., Batelaan, O., & Smedt, F. D. (2005). Lineament extraction and analysis, comparison of LANDSAT ETM and ASTER imagery. Case study: Suoimuoi tropical karst catchment, Vietnam,” Remote Sensing for Environmental Monitoring, GIS Applications, and Geology.
Ibrahim, U., & Mutua, F. (2012). Lineament Extraction using Landsat 8 (OLI) in Gedo, Somalia. International Journal os Science and Research (IJSR):Vol.3:pp 291-296.
James, J.M., Moore, J.M., (1985). Multi-seasonal imagery studies for geological mapping and prospecting in cultivated terrain of S.W. England. In: Fourth ematic Conference: ”Remote Sensing for Exploration Geology”, San Francisco, California, April 1-4, 1985. April 1 - 4, 1985. San Francisco, California, pp. 475–484.
Juwana, I., Muttil, N., & Perera, B. J. C. (2016a). Application of west Java water sustainability index to three water catchments in west Java, Indonesia. Ecological Indicators, 70, 401–408. https://doi.org/10.1016/j.ecolind.2016.06.017.
Juwana, I., Muttil, N., & Perera, B. J. C. (2016b). Uncertainty and sensitivity analysis of West Java Water Sustainability Index - A case study on Citarum catchment in Indonesia. Ecological Indicators, 61, 170–178. https://doi.org/10.1016/j.ecolind.2015.08.034.
Khazri, D., Gabtni, H., (2018). Geophysical methods integration for deep aquifer reservoir characterization and modeling (Sidi Bouzid basin, central Tunisia). J. Afr. Earth Sci. 138, 289–308.
Kresic, N., (1995). Remote sensing of tectonic fabric controlling groundwater flow in Dinaric karst. Remote Sens. Environ. 53 (2), 85–90.
Kurniawan, F. A. (2012). Pemanfaatan Data Anomali Gravitasi Citra GEOSAT dan ERS-1 Satellite untuk Memodelkan Struktur Geologi Cekungan Bentarsari Brebes. 2(2).
Lahti, I., Nykänen, V., Niiranen, T., (2014). Gravity worms in the exploration of epigenetic gold deposits: new insights into the propectivity of the Central Lapland Greenstone Belt, Northern Finland. In: Niiranen, T., Lahti, I., Nykänen, V., Karinen, T. (Eds.), Central Lapland Greenstone Belt 3D Modelling Project Final Report. Geological Survey of Finland, pp. 8–17 Ch. Chapter 1.
Mallast, U., Gloaguen, R., Geyer, S., Rödiger, T., Siebert, C., (2011). Derivation of groundwater flow-paths based on semi-automatic extraction of lineaments from remote sensing data. Hydrol. Earth Syst. Sci. 15 (8), 2665–2678.
Mansour, K., Omar, K., Ali, K., & Abdel Zaher, M. (2018). Geophysical characterization of the role of fault and fracture systems for recharging groundwater aquifers from surface water of Lake Nasser. NRIAG Journal of Astronomy and Geophysics, 7(1), 99–106. https://doi.org/10.1016/j.nrjag.2018.02.001.
Martín, A., Núñez, M. A., Gili, J. A., & Anquela, A. B. (2011). A
LINEAMENT EXTRACTION USING GRAVITY DATA Gumilar Utamas Nugraha, et al

93
comparison of robust polynomial � tting , global geopotential model and spectral analysis for regional – residual gravity � eld separation in the Doñana National Park ( Spain ). Journal of Applied Geophysics, 75(2), 327–337. https://doi.org/10.1016/j.jappgeo.2011.06.037.
Martínez-moreno, F. J., Galindo-zaldívar, J., Pedrera, A., Teixidó, T., Peña, J. A., & González-castillo, L. (2015). Regional and residual anomaly separation in microgravity maps for cave detection : e case study of Gruta de las Maravillas ( SW Spain ). Journal of Applied Geophysics, 114, 1–11. https://doi.org/10.1016/j.jappgeo.2015.01.001.
Masoud, A., Koike, K., (2006). Tectonic architecture through Landsat-7 ETM+/SRTM DEM-derived lineaments and relationship to the hydrogeologic setting in Siwa region, NW Egypt. J. Afr. Earth Sci. 45 (4–5), 467–477.
Masoud, A., Koike, K., (2017). Applicability of computer-aided comprehensive tool (LINDA: LINeament Detection and Analysis) and shaded digital elevation model for characterizing and interpreting morphotectonic features from lineaments. Comput.Geosci. 106, 89–100.
Mehanee, S., Essa, K.S., (2015). A 2.5D regularized inversion scheme for the interpretation of residual gravity data by a dipping thin-sheet like target: numerical examples and case studies with an insight on sensitivity and non-uniqueness. Earth, Planets and Space 67, 130.
Mehanee, S., Essa, K.S., Smith, P., (2011). A rapid technique for estimating the depth and width of a two-dimensional plate from self-potential data. J. Geophys. Eng. 8, 447–456.
Mehanee, S., Zhdanov, M., (2002). Two-dimensional magnetotelluric inversion of blocky geoelectrical structures. J. Geophys. Res. Solid Earth 107 (B4) pp. EPM 2-1–EPM 2–11.
Mehanee, S.A., (2014). Accurate and efficient regularized inversion approach for the interpretation of isolated gravity anomalies. Pure Appl. Geophys. 171 (8), 1897–1937.
Mehanee, S.A., (2015). Tracing of paleo-shear zones using self-potential data inversion: case studies from the KTB, Rittsteig, and Grossensees graphite-bearing fault planes. Earth Planets Space 67, 14–47.
Mickus, K., Aiken, C., Kennedy, W., (1991). Regional–residual gravity anomaly separation using the minimum-curvature technique. Geophysics 56 (2), 279–283.
Middleton, M., Schnur, T., Sorjonen-Ward, P., Hyvönen, E., (2015). Geological lineament interpretation using the Object-Based Image Analysis approach: results of semi-automated analyses versus visual interpretation. Geol. Surv. Finland, Special Paper 57, 135–154.
Mohamed, A. (2019). Hydro-geophysical study of the groundwater storage variations over the Libyan area and its connection to the Dakhla basin in Egypt. Journal of African Earth Sciences, 157(December 2018), 103508. https://doi.org/10.1016/j.jafrearsci.2019.05.016.
Moore, J.M., Camm, S., (1982). Interactive enhancement of Landsat Imagery for structural mapping in tin-tungsten prospecting: a case history of the S.W. England Orefield (U.K.). In: International Symposium on Remote Sensing of Environment, Second.
Mukherjee, A., & Ramachandran, P. (2018). Prediction of GWL with the help of GRACE TWS for unevenly spaced time series data in India : Analysis of comparative performances of SVR, ANN and LRM. Journal of Hydrology, 558(August 2002), 647–658. https://doi.org/10.1016/j.jhydrol.2018.02.005.
Nastiti, K. D., Kim, Y., Jung, K., & An, H. (2015). e application of Rainfall-Runoff-Inundation (RRI) model for inundation case in upper Citarum Watershed, West Java-Indonesia. Procedia Engineering, 125, 166–172. https://doi.org/10.1016/j.proeng.2015.11.024.
Ni, C., Zhang, S., Liu, C., Yan, Y., Li, Y., (2016). Lineament length and density analyses based on the segment tracing algorithm: a case study of the gaosong field in gejiu tin mine, China. Math. Probl Eng. 2016, 1–7. https://www.hindawi.com/journals/mpe/
2016/5392453/. Noréus, J. P., Nyborg, M. R., & Hayling, K. L. (1997). e gravity
anomaly �eld in the Gulf of Bothnia spatially characterized from satellite altimetry and in situ measurements. Journal of Applied Geophysics, 37(2), 67–84. https://doi.org/10.1016/S0926-9851(97)00007-4.
Nur, A. A., Nugraha, G. U., & Pranantya, P. A. (2017). Interpretation of Groundwater Potential Zones Based on Lineament Pattern Data Analysis in Ambon Island , Moluccas Province , Indonesia. 12(17), 6941–6945.
O'Leary, D., Friedman, J., Pohn, H., (1976). Lineament, linear, lineation: some proposed new standards for old terms. Geol. Soc. Am. Bull. 87 (10), 1463–1469.
Paananen, M., (2013). Completed lineament interpretation of the olkiluoto region. Tech. Rep. October. Geol. Surv. Finland 1–112.
Paolo, F. S., & Molina, E. C. (2010). Integrated marine gravity �eld in the Brazilian coast from altimeter-derived sea surface gradient and shipborne gravity. Journal of Geodynamics, 50(5), 347–354. https://doi.org/10.1016/j.jog.2010.04.003.
Parikesit, Takeuchi, K., Tsunekawa, A., & Abdoellah, O. S. (2001). Non-forest fuelwood acquisition and transition in type of energy for domestic uses in the changing agricultural landscape of the Upper Citarum Watershed, Indonesia. Agriculture, Ecosystems and Environment, 84(3), 245–258. https://doi.org/10.1016/S0167-8809(00)00243-7.
Peña, S.A., Abdelsalam, M.G., 2006. Orbital remote sensing for geological mapping in southern Tunisia: implication for oil and gas exploration. J. Afr. Earth Sci. 44 (2), 203–219. Segment Tracing Algorithm (STA). Comput. Geosci. 21 (9), 1091–1104.
Publishers, E. S., & Kingdom, U. (1991). Differential opening of the Central and South Atlantic Oceans and the opening of the West African ri system. Tectonophysics, 187, 191–203.
Richards, J.A. (1986). Remote Sensing Digital Image Analysis. New York: Springer- Verlag.
Rutzinger, M., Maukisch, M., Petrini-Monteferri, F., (2007). Development of algorithms for the extraction of linear patterns (lineaments) from airborne laser scanning data. In: Proceedings of the Conference ’Geomorphology for the Future’, Obergurgl, pp. 1–82007.
Sunardi, Kaniawati, K., Husodo, T., Malini, D. M., & Astari, A. J. (2012). Distribution of Fish in the Upper Citarum River: an Adaptive Response to Physico-Chemical Properties. HAYATI Journal of Biosciences, 19(4), 191–196. https://doi.org/10.4308/hjb.19.4.191.
Swain, C.J., (1976). A FORTRAN IV program for interpolating irregularly spaced data using the difference equations for minimum curvature. Comput. Geosci. 1 (4), 231–240.
Verdiansyah, O. (2019), A Desktop Study to Determine Mineralization Using Lineament Density Analysis at Kulon Progo Mountains, Yogyakarta and Central Java Province, Indonesia. Indonesian Journal of Geography. 51 (1), 31-41. https://doi.org/10.22146/ijg.37442
Webring, M.E., (1981). Minc, a gridding program based on minimum curvature. U.S. Geol. Survey, Open-�le Rep., pp. 81–1224.
Xiang, L., Wang, H., Steffen, H., Wu, P., Jia, L., Jiang, L., & Shen, Q. (2016). Groundwater storage changes in the Tibetan Plateau and adjacent areas revealed from GRACE satellite gravity data. Earth and Planetary Science Letters, 449, 228–239. https://doi.org/10.1016/j.epsl.2016.06.002.
Yang, X., Buscheck, T. A., Mansoor, K., Wang, Z., Gao, K., Huang, L., Appriou, D., & Carroll, S. A. (2019). Assessment of geophysical monitoring methods for detection of brine and CO2 leakage in drinking water aquifers. International Journal of Greenhouse Gas Control, 90(July), 102803. https://doi.org/10.1016/j.ijggc.2019.102803.
Yeomans, C. M., Middleton, M., Shail, R. K., Grebby, S., & Lusty, P. A. J. (2019). Computers and Geosciences Integrated Object-Based Image Analysis for semi-automated geological lineament detection in southwest England. Computers and Geosciences,
Indonesian Journal of Geography, Vol. 53, No.1, 2021 : 87 – 94
94
123(November 2018), 137–148. https://doi.org/10.1016/j.cageo.2018.11.005.
Zahran, K. H., & Radwan, A. M. (2012). Geodynamics implication of GPS and satellite altimeter and gravity observations to the Eastern Mediterranean. NRIAG Journal of Astronomy and Geophysics, 1(1), 51–60. https://doi.org/10.1016/j.nrjag.2012.11.006.
Zhang, G., Lu, Q., Zhang, G., Lin, P., Jia, Z., Suo, K., (2018). Joint interpretation of geological, magnetic, AMT, and ERT data for mineral exploration in the northeast of inner Mongolia, China. Pure Appl. Geophys. 175, 989–1002.
Zhang, Y. Z., Xu, H. J., Wang, W. D., Duan, H. R., & Zhang, B. P. (2011). Gravity anomaly from satellite gravity gradiometry data by GOCE in Japan Ms9.0 strong earthquake region. Procedia Environmental Sciences, 10(PART A), 529–534. https://doi.org/10.1016/j.proenv.2011.09.086.
Zhdanov, M.S., (2002). Geophysical Inverse eory and Regularization Problems. Elsevier 633 p.
Zhdanov, M.S., Ellis, R., Mukherjee, S., (2004). ree-dimensional regularized focusing inversion of gravity gradient tensor component data. Geophysics 69 (4), 925–937.
LINEAMENT EXTRACTION USING GRAVITY DATA Gumilar Utamas Nugraha, et al