Embed Size (px)
Citation preview

Additional file 14. Table S1 – Table S22.
Table S1. Statistics for each DNA library. Ten categories of DNA libraries with various insert sizes for three platform sequencers were constructed.
Library Num. of Reads Num. of Sequences (bp)
Num. of Reads (Trimmed)
Num. of Sequences (Trimmed)
Num. of Reads(Trimmed&Used)
Num. of Sequences(Trimmed & Used)
Continuous Long Read Sum 2,640,379 4,805,268,872 2,415,333 2,318,055,976 2,415,333 2,318,055,976
Single 2,640,379 4,805,268,872 2,415,333 2,318,055,976 2,415,333 2,318,055,976 GS-FLX Paired-End Sum 5,065,150 1,666,509,204 7,744,289 2,004,270,538 5,730,680 1,185,467,442
20Kbp 2,498,260 786,807,325 3,651,379 961,518,075 2,562,596 519,300,012
3Kbp 1,394,475 497,726,608 2,219,982 588,231,416 1,717,362 373,634,593
8Kbp 1,172,415 381,975,271 1,872,928 454,521,047 1,450,722 292,532,837
Single 1,817,904 590,522,747 2,276,549 819,568,063 2,276,549 819,568,063 Illumina Paired-End Sum 854,317,848 216,986,699,496 750,458,264 69,977,287,701 498,912,642 47,163,704,155
150bp 61,274,520 12,377,453,040 100,000,000 9,878,047,259 100,000,000 9,878,047,259
300bp 109,793,542 22,178,295,484 107,380,330 10,195,484,757 81,144,366 7,807,711,630
350bp 76,775,928 23,186,330,256 62,310,018 5,852,739,210 62,310,018 5,852,739,210
500bp 239,104,844 48,299,178,488 219,171,362 20,557,364,296 90,915,794 8,661,654,674
600bp 367,369,014 110,945,442,228 261,596,554 23,493,652,179 164,542,464 14,963,551,382
Total 863,841,281 224,049,000,319 762,894,435 75,119,182,278 509,335,204 51,486,795,636
Coverage (folds)1 373.4 125.2 85.8 1Coverage is defined as the number of sequences divided by the genome size.
Table S2. Insert size of each paired-end libraries. The range of paired-end insert sizes was estimated by mapping the reads onto the assembled genome sequence.
Library Average of insert size (bases)1
Standard deviation of insert size (+/-)2
GS-FLX Paired-End 20Kbp 18,527.6 4,631.9
3Kbp 2,665.7 769.8
8Kbp 7,752.3 1,938.1
Illumina Paired-End 150bp 167.9 14.0
300bp 335.4 13.9
350bp 390.5 13.3
500bp 532.9 22.1
600bp 624.8 20.6 1Average of insert size reported by the Celera assembly program after assembly.2Starndard deviation of insert size reported by the Celera assembly program after assembly.

Table S3. Statistics of genome assembly and gap filling.
Celera assembler
(Version : 7.0)
GAPfiller(Version : 1.9)
Pbjelly(Version : 12.9.14)
Scaffold total scaffold length (bases) 602,295,735 636,049,014 636,793,288
the number of gaps 88,548 76,150 62,754
gap size (bases) 18,468,690 14,441,127 13,131,591
the number of scaffolds 38,062 38,062 38,062
N50 contig length (bases) 188,605 216,434 219,067
Max scaffold length (bases) 28,707,441 28,717,475 28,796,675
Contig total contig length (bases) 583,827,045 621,614,170 623,701,534
the number of contigs 127,598 115,200 100,606
N50 contig length (bases) 8,581 10,575 11,563
Max contig length (bases) 120,777 184,241 226,807

Table S4. Sequencing statistics of transcriptome analysis of each organ of N. coriiceps using two sequencer platforms.
Blood Egg Skin Kidney Muscle Stomach Brain
Illumina HiSeq 2000 Total num. of reads 8,335,794 93,923,026 67,504,452 60,161,028 88,281,852 5,077,628 33,616,256
Total num. of bases 841,915,194 9,486,225,626 6,817,949,652 6,076,263,828 8,916,467,052 512,840,428 3,395,241,856
Num. trimmed reads 8,335,794 50,000,000 67,501,898 60,161,028 60,000,000 5,077,628 33404860
Num. of trimmed bases 841,915,194 5,050,000,000 6,817,691,698 6,076,263,828 6,060,000,000 512,840,428 3,373,890,860
Pacbio RS Total num. of reads 160,667 128,900 118,476
Total num. of bases 142,223,519 114,991,009 103,676,744
Num. error-corrected reads 236,653 188,395 178,267
Num. error-corrected bases 119,291,958 96,875,119 84,127,846

Table S5. Assembly results of transcriptome analysis of each organ of N. coriiceps.
Platform Program Tissue Total num. of contigs
Total num. of bases
Average size of contigs
GS-FLX Newbler(Version : 2.5.3) Brain 9,532 5,547,624 582
Liver 24,510 23,676,660 966
Illumina HiSeq TOPHAT (Version : 2.0.6) Blood 14,848 17,759,115 1,196
Egg 29,954 41,949,443 1,400
Kidney 37,154 53,429,245 1,438
Muscle 23,897 31,883,937 1,334
Stomach 5,663 4,147,701 732
Brain 39,133 67,645,262 1,728
Skin 39,168 55,031,213 1,405
Pacbio RS PacbioToCA Egg 236,653 119,291,958 504
Skin 188,395 96,875,119 514
Muscle 178,267 84,127,846 472

Table S6. Genome annotation statics.
Number Base (base) Assembly (%)
Protein coding genes 32,260 47,712,235 7.4926%rRNA 59 6,460 0.0010%miRNA 1,740 171,141 0.0269%snoRNA 282 33,539 0.0053%snRNA 57 6,460 0.0010%tRNA 512 40,349 0.0063%miscRNA 28 3,186 0.0005%Sum 34,938 47,973,370 7.5336%

Table S7. General statistics of gene in N. coriiceps.
Number
The number of genes 32,260
The average mRNA length (bp) 1,478
The number of exons 214,650
The number of exons per genes 6.65The average coding sequence length (bp) 1,063

Table S8. Known repetitive and transposable elements in the N. coriiceps genome.
de novo repeat
TE element Length %
Retrotransposon
SINE1 1,873,487 0.29%
LINE2 13,262,368 2.08%
LTR3 2,282,209 0.36%
DNA transposon 35,353,051 5.55%Unknown 46,670,060 7.33%
Tandem repeatSatellites 528,057 0.08%
Simple repeats 11,962,350 1.88%Low complexity 3,629,184 0.57%Total 115,560,766 18.15%
1SINE : short interspersed nuclear element2LINE : long interspersed nuclear element33LTR : long terminal repeat
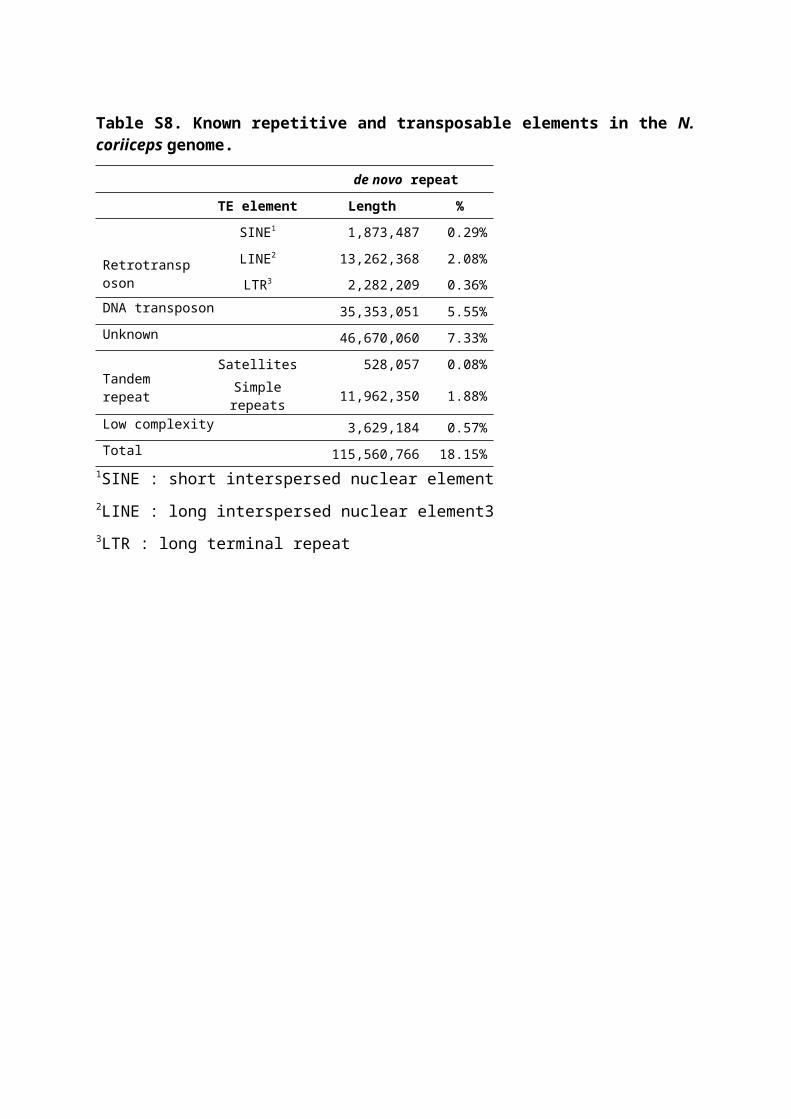
Table S9. Number of tRNA in the N. coriiceps nuclear genome.
Number of tRNAAla 34Arg 61Asn 9Asp 8Cys 17Gln 20Glu 37Gly 23His 4Ile 26Leu 48Lys 27Met 20Phe 17Pro 25Pseudo 3SeC(e) 1Ser 54Thr 48Trp 15Tyr 21Undet 1Val 10Sum 529

Table S10. Shared orthologous gene clusters among six fishes; Danio rerio, Gasterosteus aculeatus, Takifugu rubripes, Tetraodon nigroviridis, Gadus morhua and N. coriiceps genomes. For genes with multiple alternative transcripts, the transcript with the best alignment was selected. Genes with lengths less than 100 bp were discarded.
Group1 Number Group Number
A 3,820 NFTZS 366
AS 501 NFZ 89
F 6,234 NFZA 46
FA 47 NFZAS 502
FAS 77 NFZS 81
FS 181 NS 249
FT 328 NT 206
FTA 24 NTA 11
FTAS 180 NTAS 82
FTS 108 NTS 35
FTZ 137 NTZ 116
FTZA 65 NTZA 34
FTZAS 1,680 NTZAS 274
FTZS 200 NTZS 44
FZ 189 NZ 453
FZA 35 NZA 104
FZAS 190 NZAS 320
FZS 60 NZS 108
N 13,123 S 3,799
NA 133 T 2,642
NAS 251 TA 24
NF 176 TAS 38
NFA 12 TS 39
NFAS 86 TZ 91
NFS 48 TZA 28
NFT 78 TZAS 117
NFTA 43 TZS 34
NFTAS 426 Z 15,524
NFTS 131 ZA 144
NFTZ 178 ZAS 148
NFTZA 158 ZS 118
NFTZAS 8,974 1Z:Danio rerio, S:Gasterosteus aculeatus, F:Takifugu rubripes, T:Tetraodon nigroviridis, A:Gadus morhua and N: Notothenia coriiceps
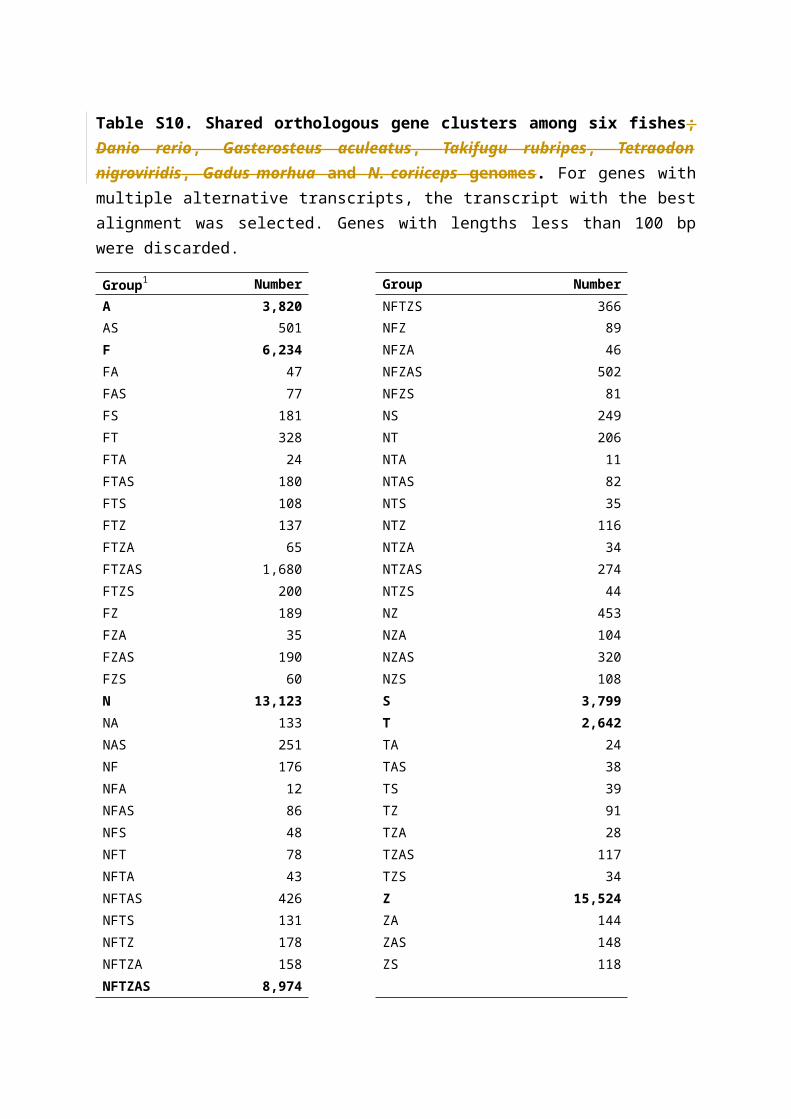
Table S11. GO terms overrepresented in dN/dS analysis.
GO term Ontology Description p-value FDR
GO:0006119 P oxidative phosphorylation 7.9E-10 2.8E-07
GO:0015986 P ATP synthesis coupled proton transport 4.1E-08 4.8E-06
GO:0015992 P proton transport 0.000015 0.001
GO:0006818 P hydrogen transport 0.000015 0.001
GO:0006754 P ATP biosynthetic process 0.00036 0.018
GO:0015078 F hydrogen ion transmembrane transporter activity 4.2E-08 5.4E-06
GO:0016491 F oxidoreductase activity 0.00047 0.015
GO:0004129 F cytochrome-c oxidase activity 0.00095 0.015
GO:0004364 F glutathione transferase activity 0.002 0.025
GO:0050254 F rhodopsin kinase activity 0.002 0.025
GO:0005344 F oxygen transporter activity 0.0041 0.048
GO:0000276 C mitochondrial proton-transporting ATP synthase complex, coupling factor F(o) 2.1E-07 0.000012
GO:0045263 C proton-transporting ATP synthase complex, coupling factor F(o) 1.4E-06 0.000032
GO:0005743 C mitochondrial inner membrane 0.000011 0.00016
GO:0005739 C mitochondrion 0.000057 0.00064
GO:0033177 C proton-transporting two-sector ATPase complex, proton-transporting domain 0.00011 0.00087
GO:0042612 C MHC class I protein complex 0.0002 0.0012

Table S12. Gene which is included in GO terms overrepresented in dN/dS analysis.
Locus tag Gene SpecificationRapid evolving gene1
N. coriiceps linegie-specific gene2
Gene under positive selection3
1 GEY_24462 G protein-coupled receptor kinase 7B-like R D PS
2 GEY_12112 beta globin (hbb2) blood R
3 GEY_14631 alpha globin (hba2) blood R
4 GEY_18816 beta-2 microglobulin blood R
5 GEY_13734 ATP synthase-coupling factor 6, mitochondrial mitochondrial R D
6 GEY_21250 ATP synthase subunit g, mitochondrial mitochondrial R
7 GEY_09861 ATP synthase subunit d, mitochondrial mitochondrial R
8 GEY_21396 ATP synthase subunit b, mitochondrial mitochondrial R D PS
9 GEY_17898 cytochrome c oxidase subunit 7A isoform mitochondrial mitochondrial R
10 GEY_27433 cytochrome c oxidase subunit 6c mitochondrial R
11 GEY_11261 cytochrome c oxidase subunit 4 isoform mitochondrial mitochondrial R D
12 GEY_32484 presenilins-associated rhomboid-like protein mitochondrial mitochondrial R D PS
13 GEY_18390dihydrolipoyllysine-residue succinyltransferase component of 2-oxoglutarate dehydrogenase mitochondrial-like protein
mitochondrial R
14 GEY_25926 Diablo homolog, mitochondrial mitochondrial R D
15 GEY_30467 mitochondrial coenzyme A transporter SLC25A42-like mitochondrial R D PS
16 GEY_06415 transcription elongation mitochondrial-like mitochondrial R D PS
17 GEY_30482 ATP synthase subunit delta,mitochondrial mitochondrial R D
18 GEY_06998 ATP synthase subunit gamma,mitochondrial mitochondrial R D PS
19 GEY_30910 D-beta-hydroxybutyrate dehydrogenase, mitochondrial mitochondrial R
20 GEY_15158 alpha-ketoglutarate-dependent dioxygenase alkB homolog 7, mitochondrial-like mitochondrial R D
21 GEY_01546 mitochondrial cardiolipin hydrolase-like isoform X1 mitochondrial R
22 GEY_26048 1,25-dihydroxyvitamin D(3) 24-hydroxylase, mitochondrial mitochondrial R D PS
23 GEY_13533 cytochrome b-c1 complex subunit 7-like mitochondrial R
24 GEY_19983 mitochondrial import inner membrane translocase subunit TIM44-lik mitochondrial R
25 GEY_31024 ERO1-like protein alpha-like R
26 GEY_26086 glutathione transferase omega-1 R
27 GEY_14238 glutathione s-transferase R
28 GEY_08735 inactive hydroxysteroid dehydrogenase-like protein 1-like R
29 GEY_22565 cytochrome c-type heme lyase isoform X1 R
30 GEY_31878 synaptic vesicle membrane protein VAT-1 homolog R D PS
31 GEY_12118 saccharopine dehydrogenase R D PS
32 GEY_27846 metalloreductase STEAP4-like R D
33 GEY_20265 hydroxysteroid 11-beta-dehydrogenase 1-like protein-like R
34 GEY_16351 FAD-dependent oxidoreductase domain-containing protein 1-like R
35 GEY_23235 dehydrogenase reductase SDR family member 13-like R D PS
36 GEY_03675 cholesterol desaturase daf-36-like R D PS

37 GEY_12202 small RNA 2'-O-methyltransferase-like R D
38 GEY_10737 piwi-like protein 1 R D PS
39 GEY_20705 H-2 class I histocompatibility L-D alpha chain-like R
40 GEY_26736 rhodopsin kinase R
41 GEY_30326 leukotriene-B(4) omega-hydroxylase 2-like R D PS
42 GEY_17335 malate dehydrogenase, cytoplasmic R D PS
43 GEY_12821 3-hydroxyanthranilate 3,4-dioxygenase-like R D
44 GEY_21692 3-oxo-5-alpha-steroid 4-dehydrogenase 1-like R D
45 GEY_22407 sulfiredoxin-1-like R
46 GEY_18585 3-hydroxy-3-methylglutaryl-coenzyme A reductase-like R D PS1R: rapidly evolving gene with dN in the upper 10% of N. coriiceps, 2D: N. coriiceps linege-
specific gene in tree (q < 0.05), 3PS: gene evolving under positive selection (q < 0.05)

Table S13. Sequencing reads used in analysis of RNA-Seq under stresses.
Sample ID Run Format Max ReadLength
Assembled into genome Trimmed reads Total reads
Blood Con 1 2x101 101bp 27,628,526 32,868,066 37,978,348
Blood Con 2 2x101 101bp 21,406,390 26,896,420 33,777,442
Blood Cold 2 2x101 101bp 24,455,254 29,902,570 37,743,234
Blood Cold 3 2x101 101bp 24,387,552 28,241,390 32,592,560
Blood Heat 1 2x101 101bp 25,688,242 33,101,200 38,834,040
Blood Heat 2 2x101 101bp 22,968,974 27,745,734 34,832,290
Brain Con 2 2x101 101bp 28,751,704 34,523,836 39,975,118
Brain Con 3 2x101 101bp 22,690,202 26,920,302 33,616,256
Brain Cold 2 2x101 101bp 24,071,220 28,815,132 33,196,790
Brain Cold 3 2x101 101bp 18,051,382 21,672,420 26,898,786
Brain Heat 1 2x101 101bp 25,975,718 31,544,428 36,471,762
Brain Heat 2 2x101 101bp 23,208,080 27,996,790 34,812,674

Table S14. The result of RNA-seq. Detail gene list are shown in Table S16 - S22.
Tissue Experiments Up Regulation Down Regulation Total
Blood Control vs Cold stress 46 180 226
Control vs Heat stress 31 206 237
Brain Control vs Cold stress 105 177 282
Control vs Heat stress 86 148 234

Table S15. Upregulated genes in blood under both cold and heat stress.
Locus tag Gene1 Fold change (log2)Heat Cold
GEY_06579 sam domain and hd domain-containing protein partial 8.15528 6.04577GEY_05781 endothelin-converting enzyme 2 7.48627 9.20282GEY_29601 endothelin-converting enzyme 2-like 6.76716 8.07018GEY_11487 inosine-uridine preferring nucleoside hydrolase-like 5.76777 4.56045GEY_28068 lysophospholipid acyltransferase lpcat4-like 5.30567 3.83440GEY_31044 heat shock protein ssb1 4.12787 4.42467GEY_31042 heat shock protein 70 3.89580 4.13861GEY_22197 c-binding protein 3.79243 3.49416GEY_24796 sam domain and hd domain-containing protein 1-like 2.94223 4.00708GEY_30844 hypothetical protein 2.77533 4.00278GEY_12222 tenascin r ( janusin)-like 2.74675 2.32422GEY_19772 heat shock protein 40 2.44724 2.30014GEY_08470 guanine deaminase-like 2.13688 3.34807
1Hsps related in HSR are presented with bold characters

Table S16. GO enrichment test in blood under heat stress.
GO term1 Ontology Description p-value FDR
GO:0006986 P response to unfolded protein 1.2E-44 5.1E-43
GO:0051789 P response to protein stimulus 1.1E-36 2.5E-35
GO:0009607 P response to biotic stimulus 1.4E-23 2E-22
GO:0006950 P response to stress 0.00000047
0.0000051
GO:0044248 P cellular catabolic process 0.00058 0.0051
GO:0009056 P catabolic process 0.0012 0.0074
GO:0050896 P response to stimulus 0.0012 0.0074
GO:0009143 P nucleoside triphosphate catabolic process 0.003 0.0078
GO:0009146 Ppurine nucleoside triphosphate catabolic process
0.003 0.0078
GO:0009207 Ppurine ribonucleoside triphosphate catabolic process
0.003 0.0078
GO:0009203 Pribonucleoside triphosphate catabolic process
0.003 0.0078
GO:0009154 P purine ribonucleotide catabolic process 0.003 0.0078
GO:0009261 P ribonucleotide catabolic process 0.003 0.0078
GO:0009117 P nucleotide metabolic process 0.0019 0.0078
GO:0010033 P response to organic substance 0.0018 0.0078
GO:0055086 Pnucleobase, nucleoside and nucleotide metabolic process
0.003 0.0078
GO:0006753 P nucleoside phosphate metabolic process 0.0019 0.0078
GO:0006195 P purine nucleotide catabolic process 0.0034 0.0083
GO:0009166 P nucleotide catabolic process 0.0038 0.0088
GO:0046700 P heterocycle catabolic process 0.0054 0.012
GO:0009141 P nucleoside triphosphate metabolic process 0.0068 0.013
GO:0009144 Ppurine nucleoside triphosphate metabolic process
0.0067 0.013
GO:0009199 Pribonucleoside triphosphate metabolic process
0.0068 0.013

GO:0009205 Ppurine ribonucleoside triphosphate metabolic process
0.0067 0.013
GO:0009150 P purine ribonucleotide metabolic process 0.0095 0.017
GO:0009259 P ribonucleotide metabolic process 0.011 0.019
GO:0006163 P purine nucleotide metabolic process 0.023 0.037
GO:0044281 P small molecule metabolic process 0.025 0.039
GO:0042221 P response to chemical stimulus 0.031 0.047
GO:0051082 F unfolded protein binding 1.1E-15 2.8E-141Shared GO terms under both cold stress and heat stress condition are presented with bold characters

Table S17. GO enrichment test in blood under cold stress.
GO term1 Ontology Description p-value FDR
GO:0006986 P response to unfolded protein 5.1E-30 3E-28
GO:0051789 P response to protein stimulus 1.1E-24 3.3E-23
GO:0009607 P response to biotic stimulus 9E-16 1.7E-14
GO:0006457 P protein folding 0.0000032 0.000046
GO:0006950 P response to stress 0.000004 0.000046
GO:0010033 P response to organic substance 0.00046 0.0044
GO:0050896 P response to stimulus 0.00053 0.0044
GO:0051082 F unfolded protein binding 1.1E-19 1.6E-18
GO:0046983 F protein dimerization activity 0.0019 0.0131Shared GO terms under both cold stress and heat stress condition are presented with bold characters

Table S18. Top blood-specific genes and their transcript percentages in whole blood transcriptomes.
Locus_taq gene% of the total transcripts from whole blood
1 GEY_14634 hemoglobin beta 2 14.2%2 GEY_14631 hemoglobin alpha 2 6.9%3 GEY_18816 beta-2 microglobulin 1.1%4 GEY_21714 ferritin high chain 1.0%5 GEY_01483 band 3 anion exchange 1.0%6 GEY_12383 hyaluronan and proteoglycan link protein 3 0.8%7 GEY_28517 mhc class ii antigen-associated invariant chain 0.8%8 GEY_14008 transmembrane protein 205 0.6%9 GEY_30148 hypothetical protein 0.6%
10 GEY_13157 ribosomal protein l6 0.5%11 GEY_19604 40s ribosomal protein s24 0.5%12 GEY_18726 60s ribosomal protein l23a 0.5%13 GEY_16957 carbonic anhydrase 0.5%14 GEY_29959 stress protein hsc70-1 0.4%15 GEY_12294 60s ribosomal protein l19 0.4%16 GEY_03612 5-aminolevulinate erythroid protein 0.4%17 GEY_22589 sushi domain-containing protein 1 0.4%18 GEY_28123 40s ribosomal protein s26 0.4%19 GEY_05071 60s ribosomal protein l32 0.4%20 GEY_15898 60s ribosomal protein l7 0.4%

Table S19. Down-regulated genes in blood under cold stress.
GO term1 Ontology Description p-value FDR
GO:0003779 F actin binding 0.00011 0.003
GO:0020037 F heme binding 0.00017 0.003
GO:0046906 F tetrapyrrole binding 0.00027 0.0032
GO:0008092 F cytoskeletal protein binding 0.00042 0.0038
GO:0005506 F iron ion binding 0.0018 0.013
GO:0070011 F peptidase activity, acting on L-amino acid peptides 0.0051 0.031
GO:0043169 F cation binding 0.0085 0.032
GO:0008233 F peptidase activity 0.0089 0.032
GO:0043167 F ion binding 0.0087 0.032
GO:0046872 F metal ion binding 0.0071 0.0321Shared GO terms under both cold stress and heat stress condition are presented with bold characters

Table S20. Downregulated genes in blood under heat stress.
GO term1 Ontology Description p-value FDR
GO:0032535 P regulation of cellular component size 0.0000021 0.00013
GO:0090066 P regulation of anatomical structure size 0.000011 0.00034
GO:0016049 P cell growth 0.00026 0.0053
GO:0008361 P regulation of cell size 0.00037 0.0056
GO:0020037 F heme binding 5.2E-10 0.000000023
GO:0046906 F tetrapyrrole binding 5.9E-09 0.00000013
GO:0005506 F iron ion binding 0.000011 0.00016
GO:0003779 F actin binding 0.00027 0.003
GO:0005085 F guanyl-nucleotide exchange factor activity 0.0034 0.025
GO:0008092 F cytoskeletal protein binding 0.0029 0.0251Shared GO terms under both cold stress and heat stress condition are presented with bold characters
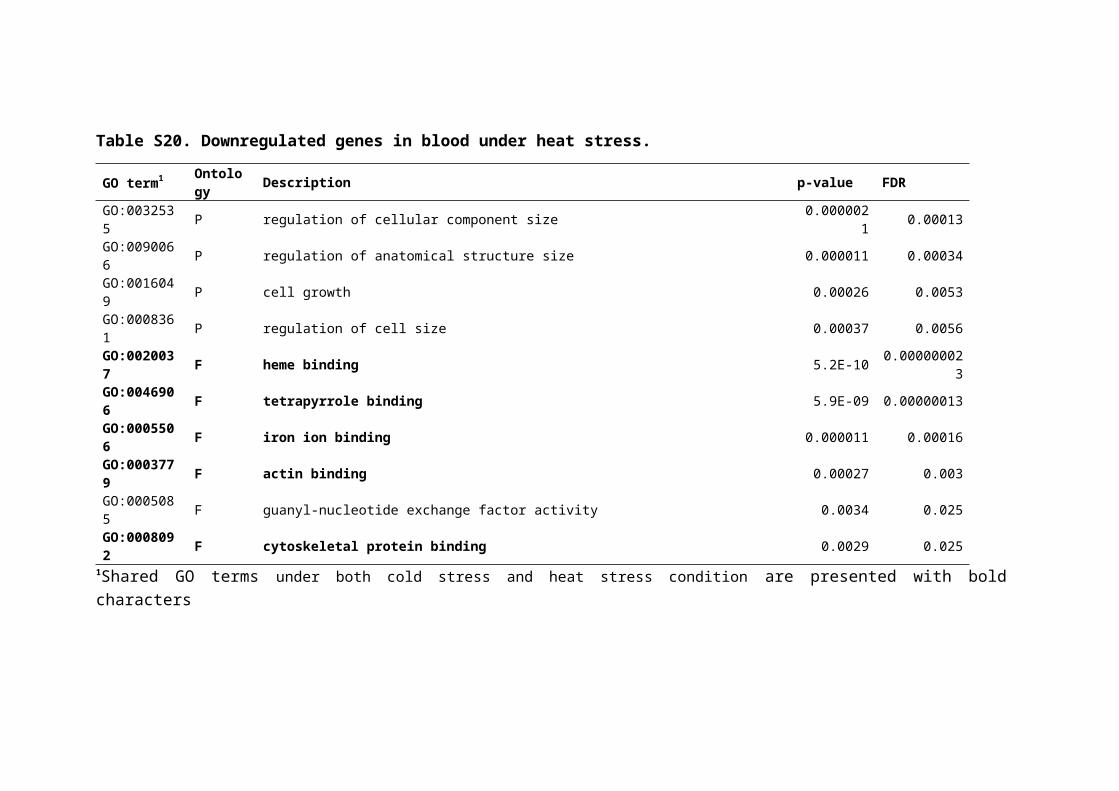
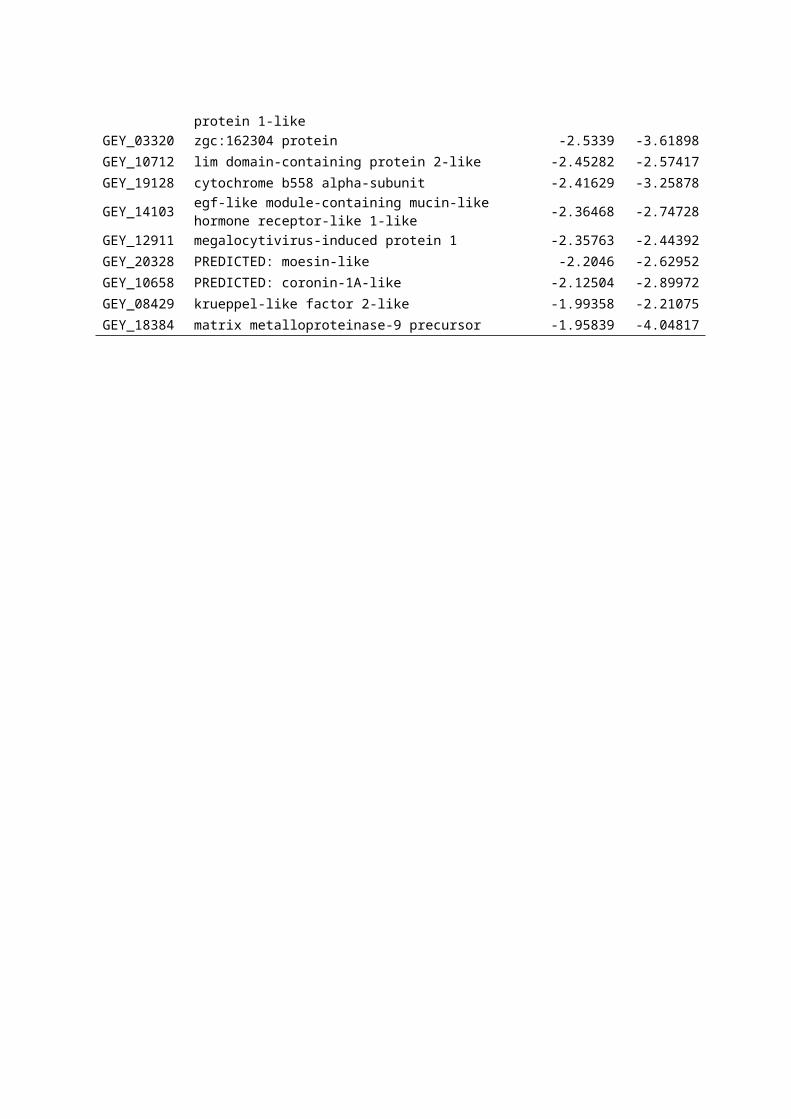
Table S21. Downregulated genes in blood under both cold and heat stress.
Locus tag GeneFold change (log2)
Heat ColdGEY_04391 PREDICTED: hypothetical protein LOC100705382 -1.83254 -1.9221GEY_24135 PREDICTED: myosin-9-like -2.02168 -1.96188GEY_15356 actin-related protein 2 3 complex subunit 1b-like -1.98999 -1.97255GEY_10076 neuronal nitric oxide synthase -6.56712 -3.39698
GEY_31431 pleckstrin homology sec7 and coiled-coil domains-binding protein -6.22671 -4.05701
GEY_18730 ---NA--- -6.1307 -3.96349GEY_17545 c-c chemokine receptor type 2-like -6.10662 -3.93707GEY_16698 probable tumor suppressor protein mn1 -5.92829 -3.75834GEY_07115 bactericidal permeability-increasing protein -5.8471 -4.41522GEY_32352 cd209 antigen-like -5.74014 -6.15595GEY_03512 loc733422 protein -5.59842 -3.20676GEY_23074 c-x-c chemokine receptor type 5-like -5.51174 -4.19058GEY_17563 neural cell adhesion molecule 1-like -5.24571 -4.98282GEY_31921 slit homolog 1 -5.16722 -3.16702GEY_15033 sh2 domain-containing protein 3c-like -5.0852 -3.17842GEY_21306 c-type lectin a -5.05457 -3.81764GEY_21755 b-cell receptor cd22 precursor -4.99296 -4.22162GEY_10031 proactivator polypeptide-like -4.97501 -3.9805GEY_11678 cd81 antigen-like -4.96388 -2.57192GEY_28138 nad (+)--arginine adp-ribosyltransferase 2-like -4.94426 -5.09755GEY_02813 cathepsin l-like -4.93305 -5.08506GEY_06662 type i cytoskeletal 18-like -4.89286 -2.72326GEY_06044 junctional adhesion molecule b-like -4.88152 -4.7125GEY_02494 phosphatidylinositol -trisphosphate 3-phosphatase tpte2-like -4.87446 -2.7662GEY_19148 pou domain class 2-associating factor 1 -4.73735 -4.73933GEY_31937 PREDICTED: uncharacterized protein LOC101163879 -4.72546 -2.60442GEY_16084 15-hydroxyprostaglandin dehydrogenase -4.70224 -4.12024
GEY_09695 b-cell antigen receptor complex-associated protein beta chain-like -4.67893 -4.09498
GEY_14681 interferon regulatory factor 4-like -4.66052 -4.24546GEY_09077 proactivator polypeptide-like -4.62646 -3.80577GEY_28632 endothelin b receptor-like -4.5759 -2.63733GEY_31184 neuropilin 1a -4.48935 -3.48929GEY_08714 mast cell protease 2-like -4.43055 -6.6543GEY_02416 inositol-trisphosphate 3-kinase a-like -4.42416 -3.83941GEY_27847 serum amyloid p-component precursor -4.3796 -3.53408GEY_18285 p2y purinoceptor 12-like -4.28293 -2.63903GEY_18014 cd9 antigen -4.18886 -4.60492GEY_16650 progranulin type i -4.17238 -3.39552

GEY_06042 ---NA--- -4.09978 -3.89456GEY_20160 inverted formin-2-like -4.08488 -2.6201GEY_21836 cathepsin h precursor -4.07283 -3.10149GEY_07198 leucine-rich repeat-containing protein 33-like -4.0567 -4.05686GEY_30801 neuron navigator 1 -4.04501 -4.3529GEY_12802 thrombopoietin receptor precursor -4.03733 -2.45252GEY_17058 ras-specific guanine nucleotide-releasing factor 2 -4.01341 -4.01402GEY_25491 p2y purinoceptor 10-like -3.92839 -3.53613GEY_32112 immunoglobulin heavy chain variable region -3.92574 -4.07927GEY_18232 cordon-bleu 1-like -3.92362 -4.66062GEY_15162 af437741_1 heavy chain secretory form -3.92255 -2.07544GEY_24787 lanosterol 14-alpha demethylase-like -3.90703 -2.77128GEY_29064 adenosine deaminase domain-containing protein 2-like -3.83084 -5.24613GEY_13722 b- and t-lymphocyte attenuator-like -3.82681 -4.56478
GEY_32240 b-cell antigen receptor complex-associated protein alpha chain-like -3.77796 -3.53972
GEY_04716 protein nlrc3-like -3.74646 -3.16146GEY_14922 thyroid hormone receptor-associated protein 3 -3.69841 -2.83808GEY_27006 monoglyceride lipase -3.69774 -4.33497GEY_03639 integrin beta-3-like -3.69494 -3.29659GEY_01588 filamin-a-like isoform 2 -3.66029 -3.15409GEY_23606 protein-glutamine gamma-glutamyltransferase k-like -3.65004 -4.28774GEY_27739 placenta-specific gene 8 -3.64578 -2.66706GEY_11900 protein s100-a1-like -3.63968 -3.05719GEY_18160 disabled homolog 2-interacting -3.62609 -3.58856GEY_15167 immunoglobulin delta heavy chain -3.62408 -4.06303GEY_26561 leucine-rich repeat-containing protein 32-like -3.61868 -2.86877GEY_14136 nuclear factor ovary-like -3.58532 -4.41734GEY_00829 myelin-associated glyco -3.54995 -5.18736GEY_13365 prostaglandin g h synthase 1-like -3.49773 -3.91298GEY_04743 15-hydroxyprostaglandin dehydrogenase -3.46137 -5.87947GEY_00783 annexin max3 -3.45512 -2.20892GEY_03045 kelch-like protein 13-like -3.43341 -3.77499GEY_25496 sh3 domain-binding glutamic acid-rich-like protein -3.40878 -3.15883GEY_22637 ---NA--- -3.33125 -3.16116GEY_20964 cytokine receptor common subunit beta-like -3.32005 -4.60995GEY_11730 transcription factor -like -3.30445 -3.92939GEY_16553 glypican 1 precursor -3.29513 -4.29504GEY_31713 phosphatidylinositol -trisphosphate 5-phosphatase 2b-like -3.29022 -2.95669GEY_10312 friend leukemia integration 1 transcription factor -3.25582 -3.25598GEY_30782 ---NA--- -3.23886 -3.01775GEY_28285 fh1 fh2 domain-containing protein 3-like -3.22503 -3.29897GEY_31426 death-associated 1-a-like -3.2103 -2.14022

GEY_20161 adenylosuccinate synthetase isozyme 1 c-like -3.14519 -3.0462GEY_15085 receptor-type tyrosine-protein phosphatase eta-like -3.13659 -2.43896GEY_01011 filamin-a-like isoform 2 -3.12333 -2.70811GEY_00971 matrix metalloproteinase-25-like -3.1148 -4.0928GEY_07238 sodium potassium-transporting atpase subunit beta-2-like -3.11293 -2.97534GEY_12894 vertebrate transmembrane 4 superfamily-like -3.08623 -4.23907GEY_23846 dedicator of cytokinesis protein 2-like -3.06672 -2.83557GEY_06100 amy-1-associating protein expressed in testis 1-like -3.01894 -3.19972GEY_26438 denn domain-containing protein 5a -3.00592 -2.81311GEY_27164 capping protein (actin filament) gelsolin-like -2.99159 -3.10774GEY_16873 lymphoid-restricted membrane protein maternal long form -2.98934 -3.79696GEY_12806 protein cyr61-like -2.89961 -2.83427GEY_21662 guanine nucleotide-binding protein g subunit alpha-2-like -2.88776 -2.71846GEY_04631 ras-related protein m-ras-like -2.85555 -2.85554GEY_04343 low quality protein: myosin-11 -2.8521 -2.05446GEY_23295 sam and sh3 domain-containing protein 3-like -2.77696 -3.19229GEY_19395 creatine testis isozyme -2.76187 -2.69679GEY_19374 phosphatidylinositol -trisphosphate 5-phosphatase 1-like -2.73041 -2.48083GEY_27217 cysteine-rich protein 1 -2.70219 -3.12016GEY_01109 tumor necrosis factor ligand superfamily member 13b-like -2.69366 -2.36561GEY_23211 leukocyte surface antigen cd53 -2.69208 -2.6035GEY_32142 coagulation factor xiii a chain -2.62851 -2.05728GEY_04586 synapse differentiation-inducing gene protein 1-like -2.60554 -3.07998GEY_03320 zgc:162304 protein -2.5339 -3.61898GEY_10712 lim domain-containing protein 2-like -2.45282 -2.57417GEY_19128 cytochrome b558 alpha-subunit -2.41629 -3.25878
GEY_14103 egf-like module-containing mucin-like hormone receptor-like 1-like -2.36468 -2.74728
GEY_12911 megalocytivirus-induced protein 1 -2.35763 -2.44392GEY_20328 PREDICTED: moesin-like -2.2046 -2.62952GEY_10658 PREDICTED: coronin-1A-like -2.12504 -2.89972GEY_08429 krueppel-like factor 2-like -1.99358 -2.21075GEY_18384 matrix metalloproteinase-9 precursor -1.95839 -4.04817

Table S22. Shared genes in downregulated group under heat and cold stress in the brain.
Locus taq Gene Fold change in cold p-value Fold change
in heat p-value In hypoxia
1 GEY_26613 protein cornichon homolog 2 -6.10336 0.00732137 -3.74311 0.0327655 +
2 GEY_11826
sarcoplasmic endoplasmic reticulum calcium atpase 2-like protein -2.90571 0.00706631 -3.15203 0.00733782
3 GEY_22240 cocaine- and amphetamine-regulated transcript -4.38574 0.000723486 -3.78289 0.0129315 +
4 GEY_29894 cgmp-specific 3 -cyclic phosphodiesterase-like protein -3.68775 0.000161136 -4.44665 3.79988E-05
5 GEY_20176 PREDICTED: opsin-5-like protein -4.51221 0.0029093 -5.73684 0.00212647
6 GEY_20769 unnamed protein product (syntaxin-1A-like) -3.59546 0.0037893 -3.73266 0.0198134 +
7 GEY_25692 glucagon family neuropeptides-like protein -2.86953 0.038564 -3.17225 0.0326696
8 GEY_20590 cocaine- and amphetamine-regulated transcript -6.21846 8.82471E-06 -5.44361 4.28593E-05 +
9 GEY_15195
pituitary adenylate cyclase-activating polypeptide type i receptor-like protein -3.77615 0.000671423 -3.66371 0.00275843 +
10 GEY_24480 neuropeptide b precursor -2.3551 0.111826 -3.90171 0.00281699 +
11 GEY_31706 sodium calcium exchanger 1-like protein -4.72879 7.30066E-06 -4.00589 0.000456884 +
12 GEY_31708 sodium calcium exchanger 1-like protein -5.02039 1.25842E-07 -4.21102 7.12194E-05 +
13 GEY_09968 cannabinoid receptor type 1b-like protein -3.35365 0.02 -4.09281 0.00687152
14 GEY_32082 sodium-driven chloride bicarbonate exchanger-like protein -3.16397 0.0243106 -5.50405 0.000778925
15 GEY_18501 vesicular glutamate transporter 2-like protein -4.682 1.25842E-07 -4.25708 3.38046E-05
16 GEY_29155 isotocin receptor-like protein -2.78655 0.0614428 -3.42618 0.0257937 +
17 GEY_17515 camk2a protein -6.20101 4.89793E-08 -5.10388 6.57316E-06 +
18 GEY_26917 muscarinic acetylcholine receptor m2-like protein -3.17459 0.0506308 -3.81422 0.0268612 +
19 GEY_07853 vesicular glutamate transporter 2-like protein -3.91389 6.32626E-05 -4.22594 9.46065E-05
20 GEY_22275 prepromelanin concentrating hormone -12.9749 0 -10.1997 0 +
21 GEY_04957 metabotropic glutamate receptor 5-like protein -4.53192 0.000028677 -4.05604 0.000774628 +
22 GEY_24878 g-protein coupled receptor 6-like protein -5.55508 0.0243106 -5.77969 0.0296731
23 GEY_23950 glucagon receptor-like protein -3.42843 0.0545029 -4.97496 0.0181517
24 GEY_08729 cannabinoid receptor type 1a-like protein -3.33718 0.00118466 -3.18561 0.00687152 +