Embed Size (px)
Citation preview
Environmental Research Letters
LETTER • OPEN ACCESS
Linkage between global sea surface temperatureand hydroclimatology of a major river basin ofIndia before and after 1980To cite this article: Sonali Pattanayak et al 2017 Environ. Res. Lett. 12 124002
View the article online for updates and enhancements.
Related contentAttribution of the 2015 record high seasurface temperatures over the centralequatorial Pacific and tropical IndianOceanIn-Hong Park, Seung-Ki Min, Sang-WookYeh et al.
-
Prediction of Indian rainfall during thesummer monsoon season on the basis oflinks with equatorial Pacific and IndianOcean climate indicesSajani Surendran, Sulochana Gadgil, P AFrancis et al.
-
Decreasing intensity of monsoon low-frequency intraseasonal variability overIndiaNirupam Karmakar, Arindam Chakrabortyand Ravi S Nanjundiah
-
This content was downloaded from IP address 14.139.128.16 on 23/11/2017 at 05:32
Environ. Res. Lett. 12 (2017) 124002 https://doi.org/10.1088/1748-9326/aa9664
LETTER
Linkage between global sea surface temperature andhydroclimatology of a major river basin of India beforeand after 1980
Sonali Pattanayak1,4 , Ravi S Nanjundiah1,2 and D Nagesh Kumar1,3
1 Divecha Centre for Climate Change, Indian Institute of Science, Bangalore, 560012, India2 Indian Institute of Tropical Meteorology (IITM), Pune, 411008, India3 Department of Civil Engineering, Indian Institute of Science, Bangalore, 560012, India4 Author to whom any correspondence should be addressed.
OPEN ACCESS
RECEIVED
8 July 2016
REVISED
28 September 2017
ACCEPTED FOR PUBLICATION
27 October 2017
PUBLISHED
22 November 2017
Original content fromthis work may be usedunder the terms of theCreative CommonsAttribution 3.0 licence.
Any further distributionof this work mustmaintain attribution tothe author(s) and thetitle of the work, journalcitation and DOI.
E-mail: [email protected]
Keywords: climate change and variability, hydroclimatology, ENSO indices, Mahanadi river basin, temperature, detection and attribution
Supplementary material for this article is available online
AbstractThe frequent occurrence of flood and drought worldwide has drawn attention to assessing whetherthe hydroclimatology of major river basins has changed. The Mahanadi river basin (MRB) is themajor source of fresh water for both Chattisgarh and Odisha states (71 million people approximately)in India. The MRB (141 600 km2 area) is one of the most vulnerable to climate change and variationsin temperature and precipitation. In recent years, it has repeatedly faced adverse hydrometeorologicalconditions. Large-scale ocean–atmospheric phenomena have a substantial influence on riverhydroclimatology. Hence global sea surface temperature (SST) linkage with the precipitation andsurface temperature of the MRB was analyzed over the period 1950–2012. Significant changes inseasonal correlation patterns were witnessed from 1950–1980 (PR-80) to 1981–2012 (PO-80). Thecorrelation was higher during PR-80 compared to PO-80 between the El Nino region SST versus themaximum temperature (Tmax) in all seasons except the pre-monsoon season and the minimumtemperature (Tmin) in all seasons except the monsoon season. However, precipitation correlationchanges are not prominent. Like the SST, the correlation patterns of sea level pressure withprecipitation, Tmax and Tmin shifted conspicuously from PR-80 to PO-80. These shifts could berelated to change in Pacific decadal SST patterns and anthropogenic effects. Fingerprint-baseddetection and attribution analysis revealed that the observed changes in Tmin (pre-monsoon andmonsoon season) during the second half of the 20th century cannot be explained solely by naturalvariability and can be attributed to an anthropogenic effect.
1. Introduction
Global warming is unequivocal and is mostly the majorcause for the recent increase in magnitude and fre-quency of extreme events (Seneviratne et al 2012).Hence, it is important to determine the impact ofclimate change on various sectors because of its sci-entific and societal importance. Extensive scientificresearch and evidence has revealed that the averageearth surface temperature increased significantly dur-ing 20th century and continues to have a substantialimpact on hydroclimatological variables such as pre-cipitation, evapotranspiration, etc (IPCC 2013). The
rate of increase in the minimum temperature (Tmin)was higher than the maximum temperature (Tmax)over the last three decades of the 20th century in India(Sonali and Nagesh Kumar 2013), leading to promi-nent changes in climate, similar to that on a globalscale (Easterling et al 1997). The changes in seasonalTmin over India during the second half of the 20th cen-tury were not part of its natural variability (Sonali andNagesh Kumar 2016).
The sea surface temperature (SST) impacts thehydrological cycle, the key components of whichare surface air temperature and precipitation. Warm(El Nino) and cool (La Nina) phases of the El
© 2017 IOP Publishing Ltd
Environ. Res. Lett. 12 (2017) 124002
Nino–Southern Oscillation (ENSO) have measurableinfluences on regional and global climate. ENSOinfluences the temperature and precipitation of Indiasignificantly (Panda and Kumar 2014, Panda et al2014, Dwivedi et al 2015). Dwivedi et al (2015) foundthat ENSO weakens (strengthens) the Indian summermonsoonrainfall through shortening (lengthening) thelength of the rainy season, respectively, in El Nino andLa Nina years over India.
Water availability and food security in most ofAsia’s major river basins are imperiled by climatechange (Immerzeel et al 2010). Per capita water avail-ability in India has lessened and will continue todecrease in the future, resulting in existing waterissues such as disputes for the inter-state water transferand hindrances to the socio-economic growth of thecountry. Spatio-temporal variation of temperature andprecipitation specifies the climate of each region andeffects water resources. There is little research in Indiaat riverbasin scaleon the long termchanges in tempera-ture and precipitation and their linkage with large-scaleatmospheric circulation, even though it would reflectseveral interesting changes more than that would haveoccurred circumstantially as a part of natural internalvariability (Mondal and Mujumdar 2012). Five recentconsecutive floods in Mahanadi (years: 2001, 2003,2006, 2008, and 2011) motivated us to analyze climatechange and variability impact on the hydroclimatologyof this basin.
Mahanadi is a major river basin and is a recog-nized climatically vulnerable region of India locatedin the east-central region. This basin is characterizedby tropical monsoon. The water availability undergoeslarge seasonal fluctuations. The average annual rainfallis 1572 mm, 70% of which occurs during the southwestmonsoon. The total basin area is about 1.42× 10⁵ km2
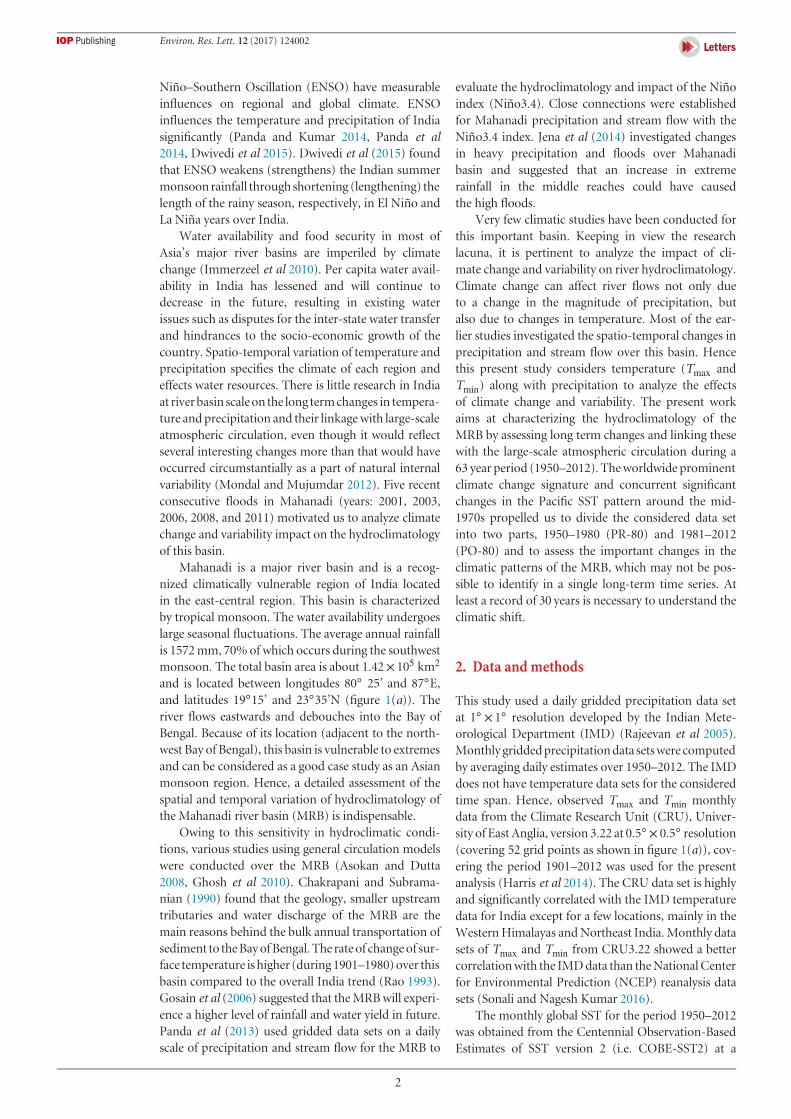
and is located between longitudes 80◦ 25’ and 87◦E,and latitudes 19◦15’ and 23◦35’N (figure 1(a)). Theriver flows eastwards and debouches into the Bay ofBengal. Because of its location (adjacent to the north-west Bay of Bengal), this basin is vulnerable to extremesand can be considered as a good case study as an Asianmonsoon region. Hence, a detailed assessment of thespatial and temporal variation of hydroclimatology ofthe Mahanadi river basin (MRB) is indispensable.
Owing to this sensitivity in hydroclimatic condi-tions, various studies using general circulation modelswere conducted over the MRB (Asokan and Dutta2008, Ghosh et al 2010). Chakrapani and Subrama-nian (1990) found that the geology, smaller upstreamtributaries and water discharge of the MRB are themain reasons behind the bulk annual transportation ofsediment to theBayofBengal.The rateof changeof sur-face temperature is higher (during 1901–1980)over thisbasin compared to the overall India trend (Rao 1993).Gosain et al (2006) suggested that the MRB will experi-ence a higher level of rainfall and water yield in future.Panda et al (2013) used gridded data sets on a dailyscale of precipitation and stream flow for the MRB to
evaluate the hydroclimatology and impact of the Ninoindex (Nino3.4). Close connections were establishedfor Mahanadi precipitation and stream flow with theNino3.4 index. Jena et al (2014) investigated changesin heavy precipitation and floods over Mahanadibasin and suggested that an increase in extremerainfall in the middle reaches could have causedthe high floods.
Very few climatic studies have been conducted forthis important basin. Keeping in view the researchlacuna, it is pertinent to analyze the impact of cli-mate change and variability on river hydroclimatology.Climate change can affect river flows not only dueto a change in the magnitude of precipitation, butalso due to changes in temperature. Most of the ear-lier studies investigated the spatio-temporal changes inprecipitation and stream flow over this basin. Hencethis present study considers temperature (Tmax andTmin) along with precipitation to analyze the effectsof climate change and variability. The present workaims at characterizing the hydroclimatology of theMRB by assessing long term changes and linking thesewith the large-scale atmospheric circulation during a63 year period (1950–2012). The worldwide prominentclimate change signature and concurrent significantchanges in the Pacific SST pattern around the mid-1970s propelled us to divide the considered data setinto two parts, 1950–1980 (PR-80) and 1981–2012(PO-80) and to assess the important changes in theclimatic patterns of the MRB, which may not be pos-sible to identify in a single long-term time series. Atleast a record of 30 years is necessary to understand theclimatic shift.
2. Data and methods
This study used a daily gridded precipitation data setat 1◦ × 1◦ resolution developed by the Indian Mete-orological Department (IMD) (Rajeevan et al 2005).Monthly griddedprecipitationdata setswere computedby averaging daily estimates over 1950–2012. The IMDdoes not have temperature data sets for the consideredtime span. Hence, observed Tmax and Tmin monthlydata from the Climate Research Unit (CRU), Univer-sity of East Anglia, version 3.22 at 0.5◦ × 0.5◦ resolution(covering 52 grid points as shown in figure 1(a)), cov-ering the period 1901–2012 was used for the presentanalysis (Harris et al 2014). The CRU data set is highlyand significantly correlated with the IMD temperaturedata for India except for a few locations, mainly in theWestern Himalayas and Northeast India. Monthly datasets of Tmax and Tmin from CRU3.22 showed a bettercorrelation with the IMD data than the National Centerfor Environmental Prediction (NCEP) reanalysis datasets (Sonali and Nagesh Kumar 2016).
The monthly global SST for the period 1950–2012was obtained from the Centennial Observation-BasedEstimates of SST version 2 (i.e. COBE-SST2) at a
2
Environ. Res. Lett. 12 (2017) 124002
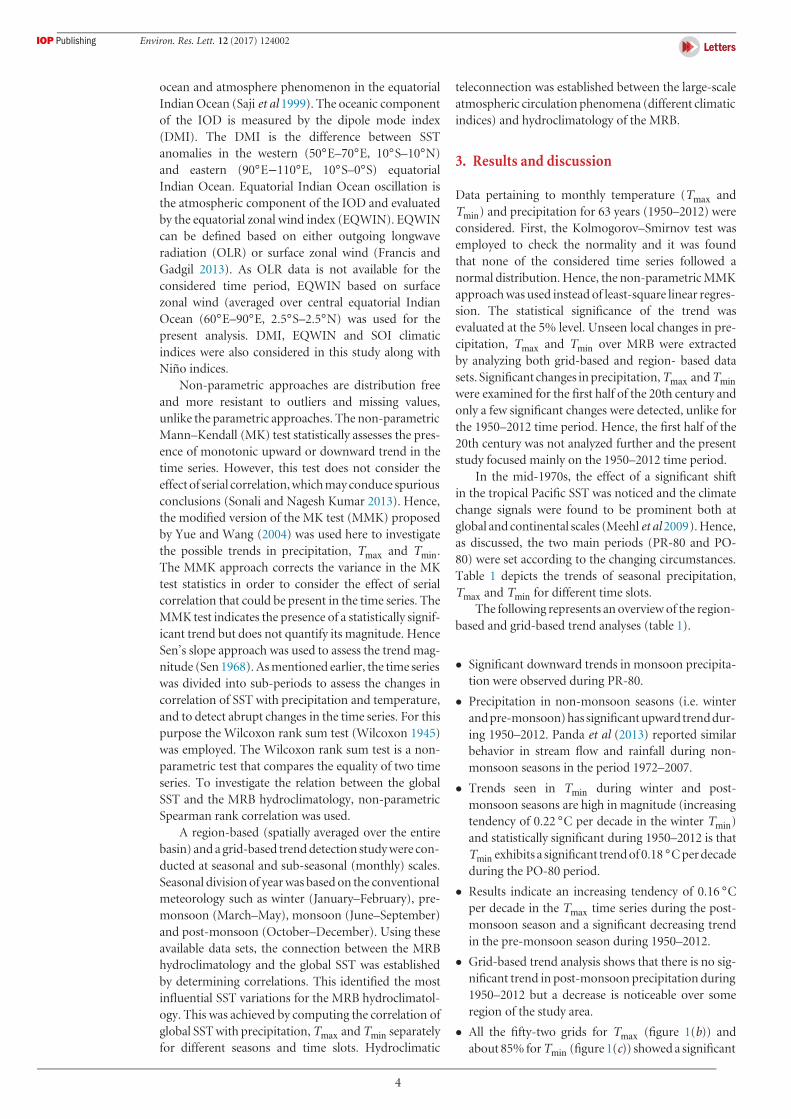
Figure 1. The MRB of India with considered grid points (a), trend in Tmax (b) and Tmin (c) in post-monsoon season, during 1950–2012.
resolution of 1◦ × 1◦. Descriptions of COBE-SST2 canbe found in Hirahara et al (2014). The COBE-SST2data was obtained from www.esrl.noaa.gov/psd/in. Foradditional analysis, monthly re-analyses of sea levelpressure (SLP), vertical pressure velocity at 500 hPa(Omega_500 hPa) and zonal wind (U-wind) data setsat 2.5◦ spatial resolution were obtained from NCEP(www.esrl.noaa.gov/psd/data/gridded/).
Nino1+2 (90◦W–80◦W, 10◦S–0◦), Nino3(150◦W–90◦W, 5◦S–5◦N), Nino4 (160◦E–150◦W,5◦S–5◦N) and Trans Nino indices were consid-ered to understand their association with the MRB
hydroclimatologyalongwithNino3.4 (170◦W–120◦W,5◦S–5◦N).
Nino indices were calculated as the area-averagedSST anomalies for the specified Nino region. TheSouthern Oscillation is the atmospheric component ofEl Nino. The Southern Oscillation Index (SOI) is basedon SLP differences between Tahiti and Darwin. It rep-resents the intensity of El Nino and La Nina events. TheSOI data for the considered time frame was obtainedfrom the National Climatic Data Center (NCDC)(www.ncdc.noaa.gov/teleconnections/enso/indicators/soi/). The Indian Ocean dipole (IOD) is a coupled
3
Environ. Res. Lett. 12 (2017) 124002
ocean and atmosphere phenomenon in the equatorialIndian Ocean (Saji et al 1999). The oceanic componentof the IOD is measured by the dipole mode index(DMI). The DMI is the difference between SSTanomalies in the western (50◦E–70◦E, 10◦S–10◦N)and eastern (90◦E−110◦E, 10◦S–0◦S) equatorialIndian Ocean. Equatorial Indian Ocean oscillation isthe atmospheric component of the IOD and evaluatedby the equatorial zonal wind index (EQWIN). EQWINcan be defined based on either outgoing longwaveradiation (OLR) or surface zonal wind (Francis andGadgil 2013). As OLR data is not available for theconsidered time period, EQWIN based on surfacezonal wind (averaged over central equatorial IndianOcean (60◦E–90◦E, 2.5◦S–2.5◦N) was used for thepresent analysis. DMI, EQWIN and SOI climaticindices were also considered in this study along withNino indices.
Non-parametric approaches are distribution freeand more resistant to outliers and missing values,unlike the parametric approaches. The non-parametricMann–Kendall (MK) test statistically assesses the pres-ence of monotonic upward or downward trend in thetime series. However, this test does not consider theeffect of serial correlation,whichmay conduce spuriousconclusions (Sonali and Nagesh Kumar 2013). Hence,the modified version of the MK test (MMK) proposedby Yue and Wang (2004) was used here to investigatethe possible trends in precipitation, Tmax and Tmin.The MMK approach corrects the variance in the MKtest statistics in order to consider the effect of serialcorrelation that could be present in the time series. TheMMK test indicates the presence of a statistically signif-icant trend but does not quantify its magnitude. HenceSen’s slope approach was used to assess the trend mag-nitude (Sen 1968). As mentioned earlier, the time serieswas divided into sub-periods to assess the changes incorrelation of SST with precipitation and temperature,and to detect abrupt changes in the time series. For thispurpose the Wilcoxon rank sum test (Wilcoxon 1945)was employed. The Wilcoxon rank sum test is a non-parametric test that compares the equality of two timeseries. To investigate the relation between the globalSST and the MRB hydroclimatology, non-parametricSpearman rank correlation was used.
A region-based (spatially averaged over the entirebasin) and a grid-based trend detection study were con-ducted at seasonal and sub-seasonal (monthly) scales.Seasonal division of year was based on the conventionalmeteorology such as winter (January–February), pre-monsoon (March–May), monsoon (June–September)and post-monsoon (October–December). Using theseavailable data sets, the connection between the MRBhydroclimatology and the global SST was establishedby determining correlations. This identified the mostinfluential SST variations for the MRB hydroclimatol-ogy. This was achieved by computing the correlation ofglobal SST with precipitation, Tmax and Tmin separatelyfor different seasons and time slots. Hydroclimatic
teleconnection was established between the large-scaleatmospheric circulation phenomena (different climaticindices) and hydroclimatology of the MRB.
3. Results and discussion
Data pertaining to monthly temperature (Tmax andTmin) and precipitation for 63 years (1950–2012) wereconsidered. First, the Kolmogorov–Smirnov test wasemployed to check the normality and it was foundthat none of the considered time series followed anormal distribution. Hence, the non-parametric MMKapproach was used instead of least-square linear regres-sion. The statistical significance of the trend wasevaluated at the 5% level. Unseen local changes in pre-cipitation, Tmax and Tmin over MRB were extractedby analyzing both grid-based and region- based datasets. Significant changes inprecipitation,Tmax andTminwere examined for the first half of the 20th century andonly a few significant changes were detected, unlike forthe 1950–2012 time period. Hence, the first half of the20th century was not analyzed further and the presentstudy focused mainly on the 1950–2012 time period.
In the mid-1970s, the effect of a significant shiftin the tropical Pacific SST was noticed and the climatechange signals were found to be prominent both atglobal and continental scales (Meehl et al 2009). Hence,as discussed, the two main periods (PR-80 and PO-80) were set according to the changing circumstances.Table 1 depicts the trends of seasonal precipitation,Tmax and Tmin for different time slots.
The following represents an overview of the region-based and grid-based trend analyses (table 1).
• Significant downward trends in monsoon precipita-tion were observed during PR-80.
• Precipitation in non-monsoon seasons (i.e. winterandpre-monsoon)has significantupward trenddur-ing 1950–2012. Panda et al (2013) reported similarbehavior in stream flow and rainfall during non-monsoon seasons in the period 1972–2007.
• Trends seen in Tmin during winter and post-monsoon seasons are high in magnitude (increasingtendency of 0.22 ◦C per decade in the winter Tmin)and statistically significant during 1950–2012 is thatTmin exhibits a significant trendof 0.18 ◦Cperdecadeduring the PO-80 period.
• Results indicate an increasing tendency of 0.16 ◦Cper decade in the Tmax time series during the post-monsoon season and a significant decreasing trendin the pre-monsoon season during 1950–2012.
• Grid-based trend analysis shows that there is no sig-nificant trend in post-monsoon precipitation during1950–2012 but a decrease is noticeable over someregion of the study area.
• All the fifty-two grids for Tmax (figure 1(b)) andabout 85% forTmin (figure 1(c)) showed a significant
4
Environ. Res. Lett. 12 (2017) 124002
Table 1. Trend detection results for the MRB Tmax, Tmin and precipitation in different seasons, using the MKK approach in different periods,viz. 1950–2012, 1950–1980 and 1981–2012. In the table, ‘0’ indicates no trend, ‘1’ upward positive trend and ‘−1’ downward trend. Resultsfrom the Wilcoxon rank sum test. The sign ‘≠’, indicates that two time series are significantly different.
Presence of significant trend
Time slot 1950–2012Seasons Winter Pre-monsoon Monsoon Post-monsoon
VariablesTmax 0 −1 0 1Tmin 1 0 0 1
Precipitation 1 1 0 0Time slot 1950–1980Season Winter Pre-monsoon Monsoon Post-monsoon
VariablesTmax 0 0 0 0Tmin 0 0 0 0
Precipitation 0 0 −1 0Time slot 1981–2012Seasons Winter Pre-monsoon Monsoon Post-monsoon
VariablesTmax 0 0 0 0Tmin 0 0 0 1
Precipitation 0 0 0 0
Time series significantly different (≠) from 1950–1980 to 1981–2012 period
Season Winter Pre-monsoon Monsoon Post-monsoonVariables
Tmax ≠
Tmin ≠ ≠
Precipitation
upward trend in the post-monsoon season during1950–2012
• Tmin increased significantly during all the monthsexcept April, May and June. Tmax showed a positivetrend during July to December and negative trendin January, whereas change in precipitation is seenin only two months, increasing in December anddecreasing in July.
• Inspectionof grid-based analyses shows that the totalnumber of grids with significant trend is greater dur-ing the PO-80 period compared to the PR-80 periodfor both Tmax and Tmin in the post-monsoon season.
Tmax and Tmin are characterized by an increasedtendency in most parts of the MRB over the entireperiod (i.e. 1950–2012). Post-monsoon Tmax over thisbasin showed significant warming trends with rela-tively higher magnitude compared to other seasons.Both region-based and grid-based analyses revealedthe rate of change in temperature is higher com-pared to precipitation. Significant positive trends inTmax and Tmin indicate an obvious warming over therecent three decades, suggesting local climate changeimpact (human-induced effect) on the MRB. Theconsequences of the climate change phenomena canbe alarming. Regional climate change affects variouscomponents of the hydrological cycle such as evap-otranspiration, stream flow and soil moisture. A fewstudieshave already shown thevulnerability of theMRBto climate change (Asokan and Dutta 2008, Gosainet al 2006). The mean total cloud cover has decreasedsignificantly in most parts of India at a seasonal scaleexcept for over the Indo-Gangetic plains and the north-east region (Jaswal 2017). Regional analyses by Warrenet al (2007) also indicated significant decreasing trends
of total cloud cover in India. Cloudiness is stronglyassociated with both Tmax and Tmin, which partiallyexplains the reason behind the significant changes intemperature. There is a huge impact on urbanization(which induces warming) in regional climatic trends(mainly temperature).
Fingerprint-based detection and attribution targetswhether observed climate changes are still consistentwith the range of natural climate variations or anindication of anthropogenic climate change. So far,detection and attribution studies over the MRB havemainly referred to precipitation and streamflow. Mon-dal and Mujumdar (2012) reported that the observedchanges in monsoon precipitation and streamflow inthe MRB are clearly distinguishable from natural inter-nal climate variability. Mondal and Mujumdar (2012)have already conducted a change detection and attri-bution study considering precipitation. Hence, thepresent study focused on temperature. A fingerprint-based detection and attribution technique was appliedto assess the changes in observed temperature (Tmaxand Tmin) duringdifferent seasons. Climate model sim-ulations of different experiments were obtained fromCMIP5 archives (Taylor et al 2012, Sonali et al 2016)and details are shown in table S1. Details about thefingerprint-based detection and attribution technique,their application and subsequent results and discus-sions are presented in the supplementary informationavailable at stacks.iop.org/ERL/12/124002/mmedia.Results indicated the observed changes in the caseof Tmin during pre-monsoon and monsoon sea-sons and Tmax during post-monsoon season aresignificantly different from natural internal climatevariability (at the 5% significance level) (table S2).However, the changes in Tmin during pre-monsoon
5
Environ. Res. Lett. 12 (2017) 124002
and monsoon seasons can be attributed confidently tohuman-inducedclimate change effects (mainly becauseof anthropogenic GHGs, aerosols and urbanization)(figures S1 and S2).
Trend analysis indicates a probable abrupt changein temperature in theMRBaround1980.The Wilcoxonrank sum test results indicated that during the monthsof May and August to December, Tmax changed signifi-cantly (step change) from PR-80 to PO-80. Similarly, inthemonthsofFebruary,August, September,Novemberand December step changes were detected in Tmin . Tminincreased from PR-80 to PO-80 during all months, butthe changes are not statistically significant every month.Greater skew and outliers in precipitation data are seencompared to Tmax and Tmin data sets. Analysis showedthat monthly mean precipitation has lessened fromthe PR-80 to PO-80 periods. However, the changesin precipitation from the PR-80 to PO-80 periods aresignificant only during May. At seasonal scale, Tmaxchanged significantly during post-monsoon and annu-ally from PR-80 to PO-80. Tmin changes are substantialduringwinter andpost-monsoonalongwith the annualscale in the same time frame. However, precipitationdid not change in any of the seasons. Annual cumula-tive precipitation remains approximately the same forboth the PR-80 and PO-80 periods. This analysis hasprovided convincing evidence that one of the India’smajor river basins, Mahanadi, experienced an alteredhydroclimatic condition after 1980. Additional analysisis required to interpret the test results.
In order to ascertain the significance of the vari-ability obtained from the PR-80 to PO-80 periods,statistical bootstrapping was performed. Based on theobserved data set (i.e. 1950–2012), 1000 bootstrappedsamples were generated. The Wilcoxon rank sum test (arank-based nonparametric statistical test to detect thestep change in a time series) was applied and test statis-tics were computed for all bootstrapped samples alongwith observed data. It was found that the observed teststatistic was more significant compared to all test statis-tics obtained from the bootstrapped samples. Hence,the changes in the hydroclimatological conditions ofthe MRB from the PR-80 to PO-80 periods are statisti-cally significant and not random.
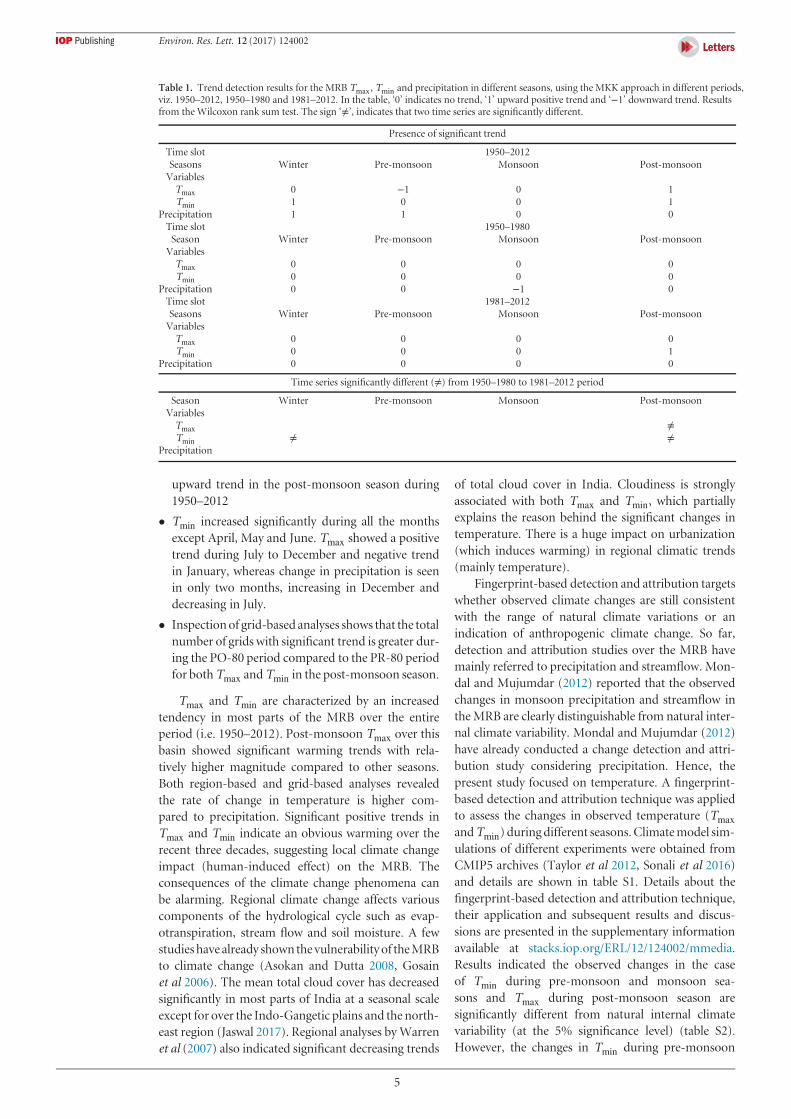
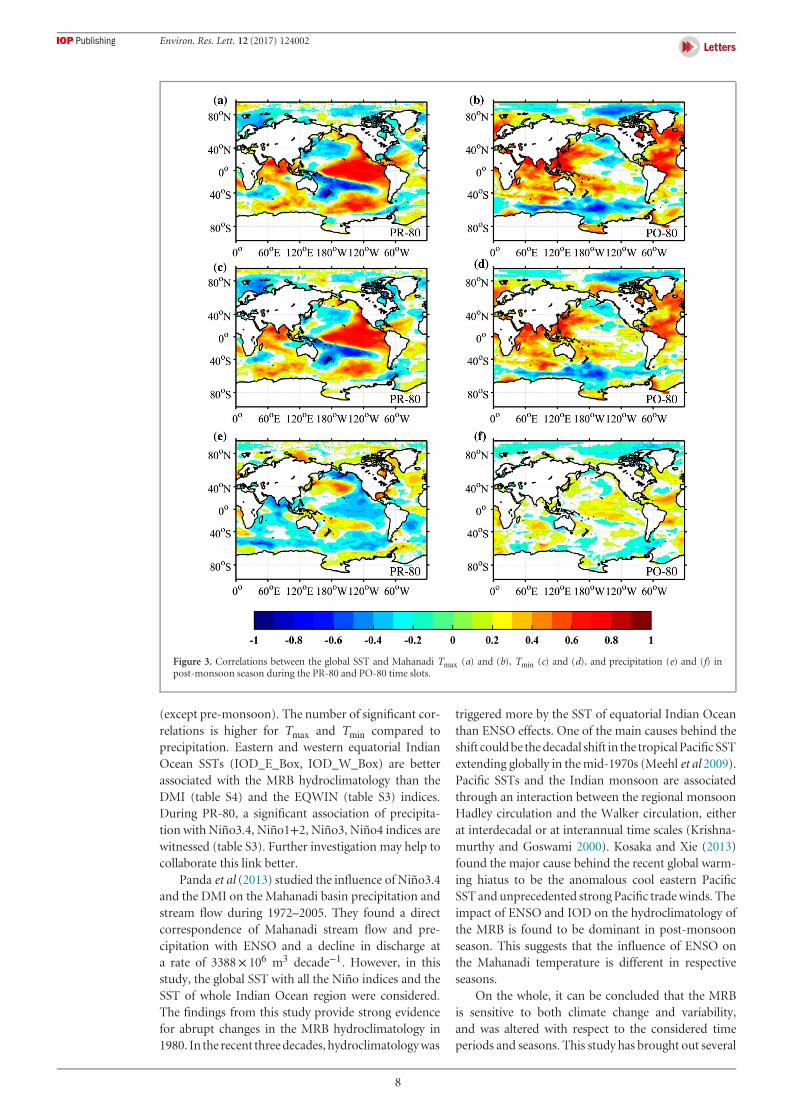
The climate of the MRB is strongly influenced bythe surrounding oceans. The correlation between theSST (grid-based, globally) and Tmax, Tmin and precip-itation in Mahanadi during PR-80 and PO-80 werecomputed for all seasons. Some of the important find-ingsaredepicted infigures2 and3.Contrastingpatternsof correlation are observed during PR-80 and PO-80(majorly in the cases of Tmax and Tmin). Figure 2 illus-trates the correlation of Tmax (figures 2(a) and (b)),Tmin (figures 2(c) and (d)) and precipitation (figures2(e) and 2(f)) with the global SST during PR-80 andPO-80 in monsoon season. Correlations of Tmaxand Tmin are prominent with the Nino region SST(figures 2(a) and (c)) compared to precipitation duringPR-80 in monsoon season (figure 2(e)). As discussed,
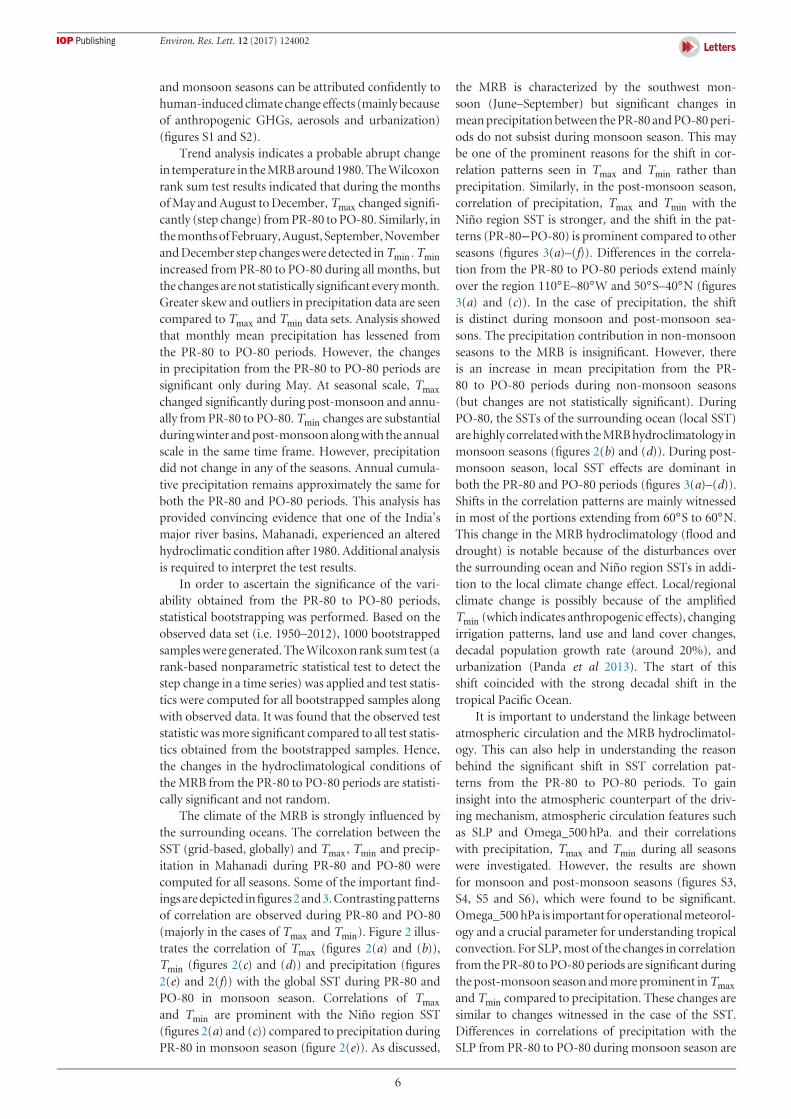
the MRB is characterized by the southwest mon-soon (June–September) but significant changes inmeanprecipitationbetween the PR-80 and PO-80 peri-ods do not subsist during monsoon season. This maybe one of the prominent reasons for the shift in cor-relation patterns seen in Tmax and Tmin rather thanprecipitation. Similarly, in the post-monsoon season,correlation of precipitation, Tmax and Tmin with theNino region SST is stronger, and the shift in the pat-terns (PR-80−PO-80) is prominent compared to otherseasons (figures 3(a)–(f)). Differences in the correla-tion from the PR-80 to PO-80 periods extend mainlyover the region 110◦E–80◦W and 50◦S–40◦N (figures3(a) and (c)). In the case of precipitation, the shiftis distinct during monsoon and post-monsoon sea-sons. The precipitation contribution in non-monsoonseasons to the MRB is insignificant. However, thereis an increase in mean precipitation from the PR-80 to PO-80 periods during non-monsoon seasons(but changes are not statistically significant). DuringPO-80, the SSTs of the surrounding ocean (local SST)arehighly correlatedwith theMRBhydroclimatology inmonsoon seasons (figures 2(b) and (d)). During post-monsoon season, local SST effects are dominant inboth the PR-80 and PO-80 periods (figures 3(a)–(d)).Shifts in the correlation patterns are mainly witnessedin most of the portions extending from 60◦S to 60◦N.This change in the MRB hydroclimatology (flood anddrought) is notable because of the disturbances overthe surrounding ocean and Nino region SSTs in addi-tion to the local climate change effect. Local/regionalclimate change is possibly because of the amplifiedTmin (which indicates anthropogenic effects), changingirrigation patterns, land use and land cover changes,decadal population growth rate (around 20%), andurbanization (Panda et al 2013). The start of thisshift coincided with the strong decadal shift in thetropical Pacific Ocean.
It is important to understand the linkage betweenatmospheric circulation and the MRB hydroclimatol-ogy. This can also help in understanding the reasonbehind the significant shift in SST correlation pat-terns from the PR-80 to PO-80 periods. To gaininsight into the atmospheric counterpart of the driv-ing mechanism, atmospheric circulation features suchas SLP and Omega_500 hPa. and their correlationswith precipitation, Tmax and Tmin during all seasonswere investigated. However, the results are shownfor monsoon and post-monsoon seasons (figures S3,S4, S5 and S6), which were found to be significant.Omega_500 hPa is important foroperationalmeteorol-ogy and a crucial parameter for understanding tropicalconvection. For SLP, most of the changes in correlationfrom the PR-80 to PO-80 periods are significant duringthe post-monsoon season and more prominent in Tmaxand Tmin compared to precipitation. These changes aresimilar to changes witnessed in the case of the SST.Differences in correlations of precipitation with theSLP from PR-80 to PO-80 during monsoon season are
6
Environ. Res. Lett. 12 (2017) 124002
Figure 2. Correlations between the global SST and Mahanadi Tmax (a) and (b), Tmin (c) and (d), and precipitation (e) and (f) inmonsoon season during the PR-80 and PO-80 time slots.
extended from the surrounding ocean regions of theMRB to Australia. Changes in the correlation betweenthe SLP and precipitation are significant in most ofthe portions over 20◦N–55◦S during monsoon and(more prominently) in post-monsoon seasons. Thedifference in correlations of SLP with Tmax and Tminfrom the PR-80 to PO-80 periods are more prominentduring post-monsoon season and covers most of theportions between 30◦N and 30◦S (figure S4). In thecase of Omega_500 hPa, correlation patterns are notcontinuous like SST and SLP. This may be becauseOmega_500 hPa is not a direct but a derived parame-ter and, hence, it is more noisy compared to SST andSLP. However, the shift in correlation patterns from thePR-80 to PO-80 periods in the case of Tmax and Tminwith Omega_500 hPa is still visualized and is promi-nent during post-monsoon season (figure S6). Thisadditional analysis showed that changes in the hydro-climatology of the MRB in the 1980s are most likely tobe contributed by both oceanic and atmospheric field,
and majorly because of the well-known decadal shift inthe Pacific.
To bring out the lead–lag relationship, concurrentlead (1–2 seasons) and lag (1–2 seasons) correla-tions of large-scale circulation indices (Nino indices,DMI, EQWIN, SOI, western and eastern equatorialIndian Ocean SST (IOD_E_Box, IOD_W_Box)) withTmax, Tmin and precipitation on a seasonal scale wereobtained. Table S3 and table S4 present the positive(▴) and negative (▾) correlations (lag-2, lag-1, lag-0, lead-1 and lead-2) at the 5% significance level,respectively, for the PR-80 and PO-80 periods. Thisanalysis helped in understanding the linkages withlarge-scale circulation indices. The most obvious differ-ence from PR-80 to PO-80 is the extent of associationof the MRB hydroclimatology with all Nino indices.During PR-80, associations of the MRB hydroclima-tology with all Nino indices (not Nino 3.4 alone),namely Nino1+2, Nino3, Nino3.4, Nino4, Trans-Nino and SOI are significant in most of the season
7
Environ. Res. Lett. 12 (2017) 124002
Figure 3. Correlations between the global SST and Mahanadi Tmax (a) and (b), Tmin (c) and (d), and precipitation (e) and (f) inpost-monsoon season during the PR-80 and PO-80 time slots.
(except pre-monsoon). The number of significant cor-relations is higher for Tmax and Tmin compared toprecipitation. Eastern and western equatorial IndianOcean SSTs (IOD_E_Box, IOD_W_Box) are betterassociated with the MRB hydroclimatology than theDMI (table S4) and the EQWIN (table S3) indices.During PR-80, a significant association of precipita-tion with Nino3.4, Nino1+2, Nino3, Nino4 indices arewitnessed (table S3). Further investigation may help tocollaborate this link better.
Panda et al (2013) studied the influence of Nino3.4and the DMI on the Mahanadi basin precipitation andstream flow during 1972–2005. They found a directcorrespondence of Mahanadi stream flow and pre-cipitation with ENSO and a decline in discharge ata rate of 3388× 106 m3 decade−1. However, in thisstudy, the global SST with all the Nino indices and theSST of whole Indian Ocean region were considered.The findings from this study provide strong evidencefor abrupt changes in the MRB hydroclimatology in1980. In the recent threedecades, hydroclimatologywas
triggered more by the SST of equatorial Indian Oceanthan ENSO effects. One of the main causes behind theshift couldbe thedecadal shift in the tropicalPacificSSTextending globally in the mid-1970s (Meehl et al 2009).Pacific SSTs and the Indian monsoon are associatedthrough an interaction between the regional monsoonHadley circulation and the Walker circulation, eitherat interdecadal or at interannual time scales (Krishna-murthy and Goswami 2000). Kosaka and Xie (2013)found the major cause behind the recent global warm-ing hiatus to be the anomalous cool eastern PacificSST and unprecedented strong Pacific trade winds. Theimpact of ENSO and IOD on the hydroclimatology ofthe MRB is found to be dominant in post-monsoonseason. This suggests that the influence of ENSO onthe Mahanadi temperature is different in respectiveseasons.
On the whole, it can be concluded that the MRBis sensitive to both climate change and variability,and was altered with respect to the considered timeperiods and seasons. This study has brought out several
8
Environ. Res. Lett. 12 (2017) 124002
interesting features about the changing characteristicsof the Mahanadi basin temperature and precipitationfrom the PR-80 to PO-80 periods. The mapping of theobserved temperature and precipitation changes andtheir parallelism to the large-scale circulation modes(such as ENSO and IOD) are anticipated to aid thepolicy makers to manage various strategies.
4. Conclusions
Climate change and variability assessment of theMRB reflected several interesting features. Theobserved trends in the post-monsoon Tmax and Tminwere significant over the MRB during 1950–2012.Fingerprint-based detection and attribution analysisrevealed that the observed pre-monsoon and mon-soon Tmin were consistent with the climate simulations,which include anthropogenic effects, and inconsistentwith the natural external factors (solar and volcanicactivities). It also indicated that thepost-monsoonTmaxchange is not because of natural internal variability.A marked increasing trend was detected in precipita-tion of non-monsoon season during the same period.Significant change was observed in Tmin during therecent three decades (PO-80) in post-monsoon sea-son. Anthropogenic effects probably caused the recentchanges in Tmin.
The MRB hydroclimatology characteristics andits association with the global SST and SLP wereobtained from seasonal correlation patterns. Post-monsoon season exhibited strong correlation patterns(for precipitation, Tmax and Tmin) compared to otherseasons and a major shift in correlation patterns waswitnessed around 1980. This shift from PR-80 toPO-80 is the most conspicuous change where the rever-sal of correlations from strongly positive to negativeoccurredovermost of theNino regions (post-monsoonTmax and Tmin being dominant).
Global and regional temperature variability wasinfluenced by the ENSO phenomenon (Kiladis andDiaz 1989). Lead-lag and concurrent correlations ofdifferent climatic indices (all Nino indices, SOI, DMIand EQWIN) with precipitation, Tmax and Tmin indifferent seasons were also obtained. Strong con-nections with all Nino indices and SOI were foundduring PR-80. The SST in the western equatorialIndian Ocean (IOD_W_Box) was highly correlatedwith post-monsoon Tmax and Tmin compared to DMIand EQWIN during PO-80. The Indian Ocean SSTplayed a more important causative role compared tothe Nino region SST during PO-80. The most strikingfeature of this study is the shifting of observed sig-nals after 1980. More analysis is required to unveil theplausible cause behind this shift. Both climate changeand variability are likely to impact the overall hydro-climatological changes in future. Hence this analysiswill help to predict better the likelihood of occurrenceof future events and in decision making about the
potential effect of natural climate variability. It needs tobe checked whether the effect is similar on the inflowof the Hirakud dam located in the MRB and should bea topic of future study.
Acknowledgments
This research has been supported by Divecha Centrefor Climate Change, Indian Institute of Science, Ban-galore. We acknowledge the World Climate ResearchProgramme’s Working Group on Coupled Modeling,which is responsible forCMIP, and thank all the climatemodeling groups for producing and making availabletheir model outputs. For CMIP, the US Departmentof Energy’s Program for Climate Model Diagnosis andIntercomparison provided coordinating support andled to the development of software infrastructure inpartnership with the Global Organization for EarthSystem Science Portals. We also thank the IMD forthe gridded temperature data set.
ORCID iDs
Sonali Pattanayak https://orcid.org/0000-0003-0938-0858Ravi S Nanjundiah https://orcid.org/0000-0002-3559-2654DNageshKumar https://orcid.org/0000-0002-5294-8501
References
Asokan S M and Dutta D 2008 Analysis of water resources in theMahanadi river basin, India under projected climateconditions Hydrol. Process. 22 3589–603
Chakrapani G J and Subramanian V 1990 Factors controllingsediment discharge in the Mahanadi river basin, IndiaJ. Hydrol. 117 169–85
Dwivedi S, Goswami B N and Kucharski F 2015 Unraveling themissing link of ENSO control over the Indian monsoonrainfall Geophys. Res. Lett. 42 8201–7
Easterling D R et al 1997 Maximum and minimum temperaturetrends for the globe Science 277 364–6
Francis P A and Gadgil S 2013 A note on new indices for theequatorial Indian Ocean Oscillation J. Earth Syst. Sci. 1221005–11
Ghosh S, Raje D and Mujumdar P P 2010 Mahanadi streamflow:climate change impact assessment and adaptive strategiesCurr. Sci. 98 1084–91
Gosain A K, Rao S and Basuray D 2006 Climate change impactassessment on hydrology of Indian river basins Curr. Sci. 90346–53
Harris I, Jones P, Osborn T and Lister D 2014 Updatedhigh-resolution grids of monthly climatic observations-theCRU TS3.10 dataset Int. J. Climatol. 34 623–42
Hirahara S, Ishii M and Fukuda Y 2014 Centennial-scale sea surfacetemperature analysis and its uncertainty J. Clim. 27 57–75
Immerzeel W W, Beek van L P H and Bierkens M F P 2010 Climatechange will affect the Asian water towers Science 328 1382–5
IPCC (Intergovernmental Panel on Climate Change) 2013 Climatechange 2013: the physical science basis Contribution ofWorking Group I to the Fifth Assessment Report of theIntergovernmental Panel on Climate Change (Cambridge:Cambridge University Press) p 1535
9
Environ. Res. Lett. 12 (2017) 124002
Jaswal A K 2017 Variability and changes in cloud cover over Indiaduring 1951–2010 Observed Climate Variability and Changeover the Indian Region (Singapore: Springer) p 107–27
Jena P P, Chatterjee C, Pradhan G and Mishra A 2014 Are recentfrequent high floods in Mahanadi basin in eastern India due toincrease in extreme rainfalls? J. Hydrol. 517 847–62
Kiladis G N and Diaz H F 1989 Global climatic anomalies associatedwith extremes in the Southern Oscillation J. Clim. 2 1069–90
Kosaka Y and Xie S P 2013 Recent global-warming hiatus tied toequatorial pacific surface cooling Nature 501 403–7
Krishnamurthy V and Goswami B N 2000 Indian monsoon-ENSOrelationship on inter decadal time scales J. Clim. 13 579–95
Meehl G A, Hu A and Santer B D 2009 The mid-1970s climate shiftin the Pacific and the relative roles of forced versus inherentdecadal variability J. Clim. 22 780–92
Mondal A and Mujumdar P P 2012 On the basin-scale detectionand attribution of human-induced climate change in monsoonprecipitation and stream flow Water Resour. Res. 48 W10520
Panda D K, Kumar A, Ghosh S and Mohanty R K 2013 Streamflowtrends in the Mahanadi river basin (India): linkages to tropicalclimate variability J. Hydrol. 495 135–49
Panda D K and Kumar A 2014 The changing characteristics ofmonsoon rainfall in India during 1971–2005 and links withlarge-scale circulation Int. J. Climatol. 34 3881–99
Panda D K, Mishra A, Kumar A, Mandal K G, Thakur A K andSrivastava R C 2014 Spatiotemporal patterns in the mean andextreme temperature indices of India 1971–2005 Int. J.Climatol. 34 3585–603
Rajeevan M, Bhate J, Kale J D and Lal B 2005 Development of ahigh resolution daily gridded rainfall data for the Indian regionMet. Monogr. Climatol. 22 2005
Rao P G 1993 Climatic changes and trends over a major river basinin India Clim. Res. 2 215–23
Saji N H, Goswami B N, Vinayachandran P N and Yamagata T1999 A dipole mode in the tropical Indian Ocean Nature 401360–3
Seneviratne S I et al 2012 Changes in climate extremes and theirimpacts on the natural physical environment Managing theRisks of Extreme Events and Disasters to Advance ClimateChange Adaptation A Special Report of Working Groups I andII of the Intergovernmental Panel on Climate Change (IPCC)(Cambridge: Cambridge University Press) p 109–230
Sen P K 1968 Estimates of the regression coefficient based onKendall’s tau J. Am. Stat. Assoc. 63 1379–89
Sonali P and Nagesh Kumar D 2013 Review of trend detectionmethods and their application to detect temperature changesin India J. Hydrol. 476 212–27
Sonali P and Nagesh Kumar D 2016 Detection and attribution ofseasonal temperature changes in India with climate models inthe CMIP5 Archive J. Water Clim. Change 7 83–102
Sonali P, Nagesh Kumar D and Nanjundiah R S 2016Intercomparison of CMIP5 and CMIP3 simulations of the20th century maximum and minimum temperatures overIndia and detection of climatic trends Theor. Appl. Climatol.128 465–89
Taylor K E, Stouffer R J and Meehl G A 2012 An overview ofCMIP5 and the experiment design Bull. Am. Meteorol. Soc. 93485–98
Warren S G, Eastman R M and Hahn C J 2007 A survey of changesin cloud cover and cloud types over land from surfaceobservations, 1971–96 J. Clim. 20 717–38
Wilcoxon F 1945 Individual comparisons by ranking methodsBiometr. Bull. 1 80–3
Yue S and Wang C 2004 The Mann-Kendall test modified byeffective sample size to detect trend in serially correlatedhydrological series Water Resour. Manage. 18 201–18
10


![Devi Mahatmya [in Markandeya Purana] Vyakhyana_4884-Nagesh Bhatta](https://img.pdfslide.net/doc/110x75/55cf8616550346484b942805/devi-mahatmya-in-markandeya-purana-vyakhyana4884-nagesh-bhatta.jpg)