Embed Size (px)
Citation preview

Linking Aquarius Salinity Measurements to River Discharges and Ocean Surface Carbon
Dioxide Fugacity
Xiaosu Xie and W. Timothy LiuJet Propulsion Laboratory
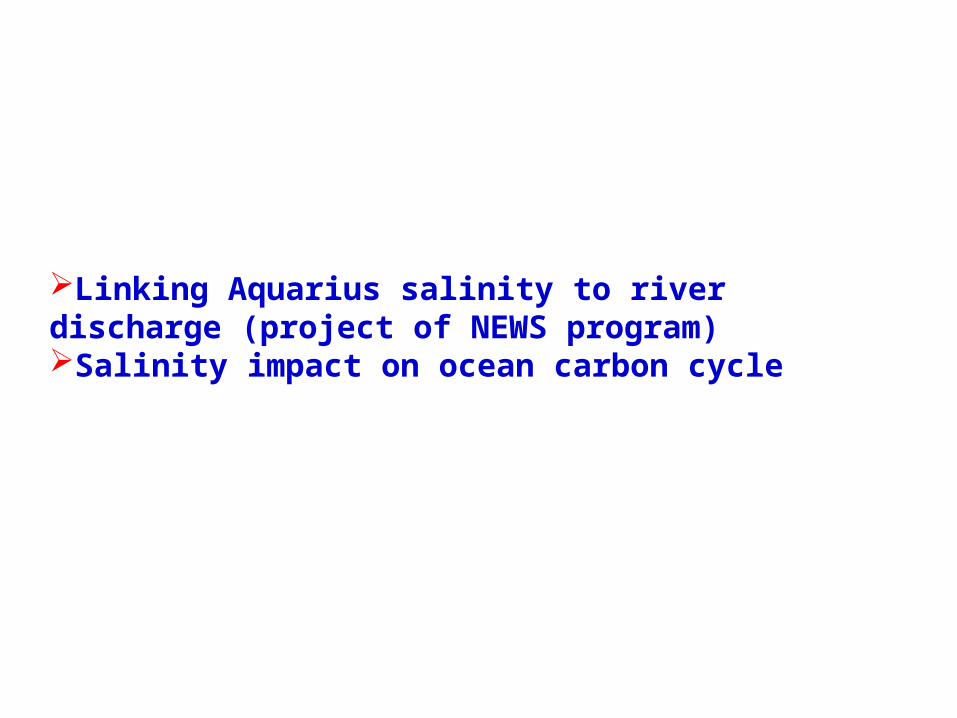
Linking Aquarius salinity to river discharge (project of NEWS program)Salinity impact on ocean carbon cycle
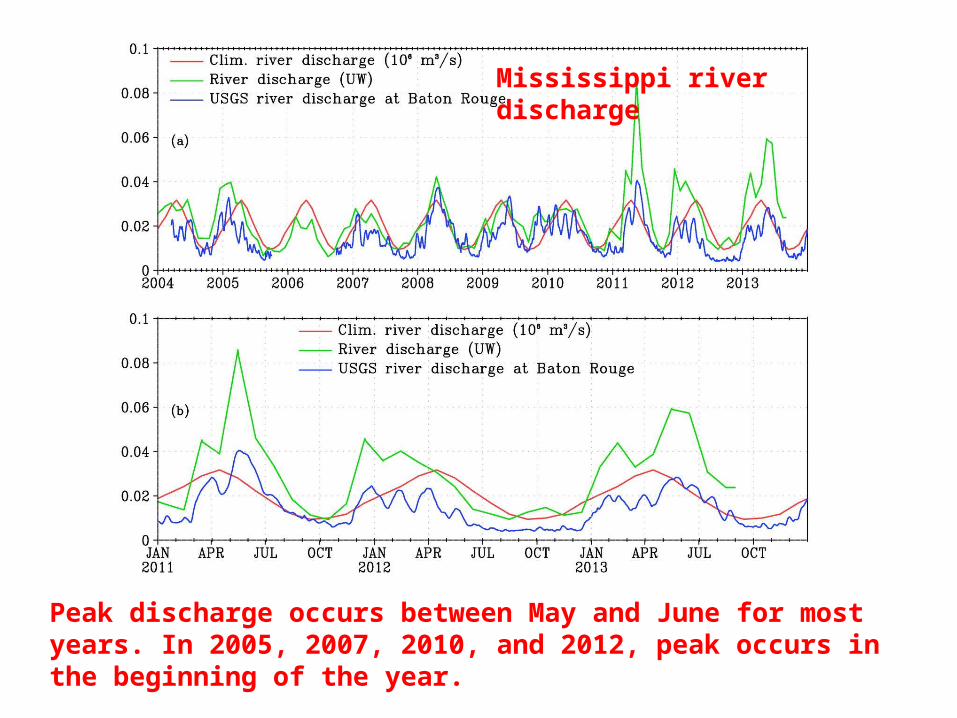
Mississippi river discharge
Peak discharge occurs between May and June for most years. In 2005, 2007, 2010, and 2012, peak occurs in the beginning of the year.
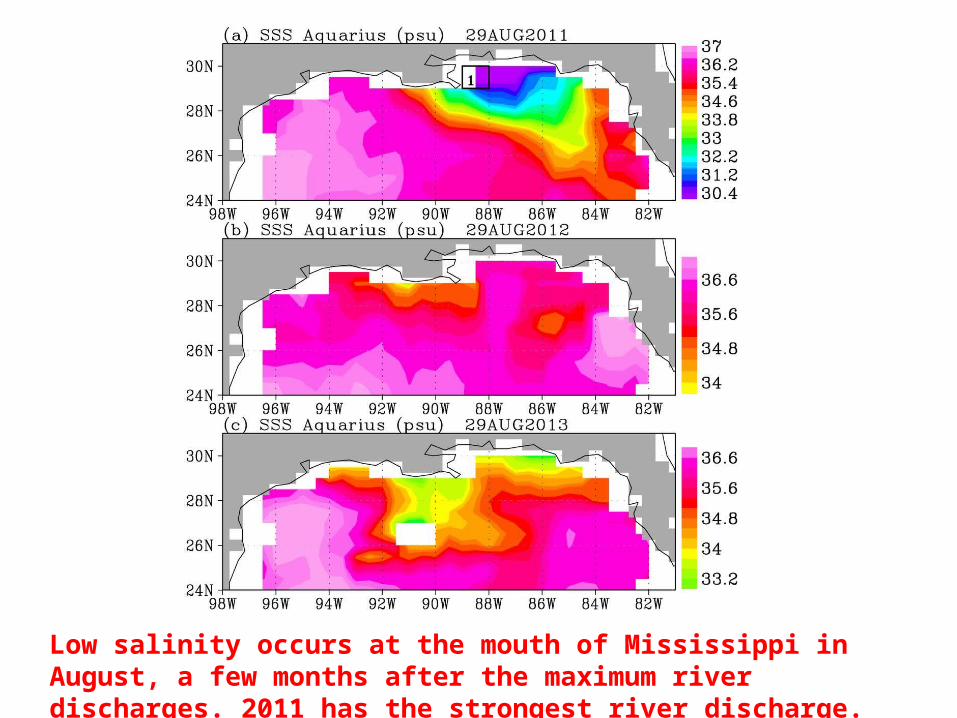
Low salinity occurs at the mouth of Mississippi in August, a few months after the maximum river discharges. 2011 has the strongest river discharge.
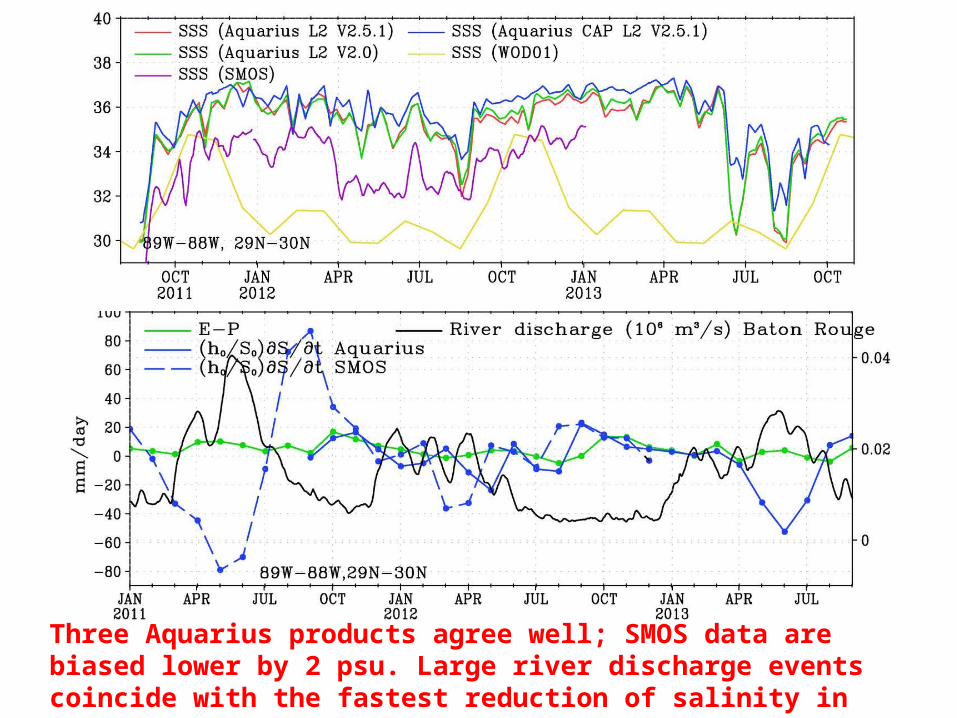
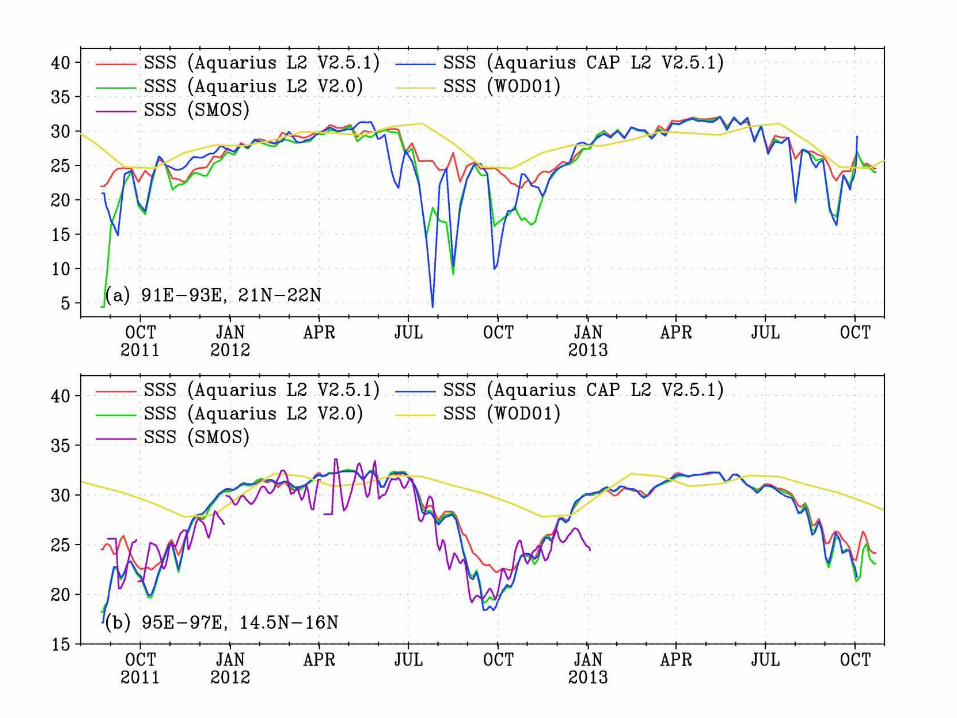
Three Aquarius products agree well; SMOS data are biased lower by 2 psu. Large river discharge events coincide with the fastest reduction of salinity in May/June 2011 and 2013.
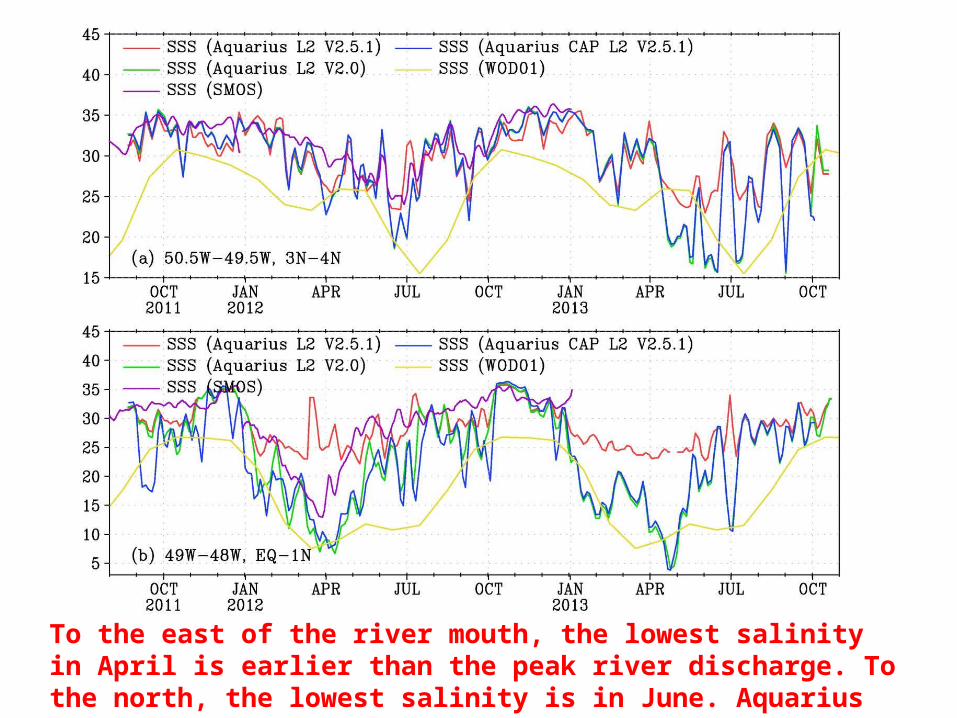
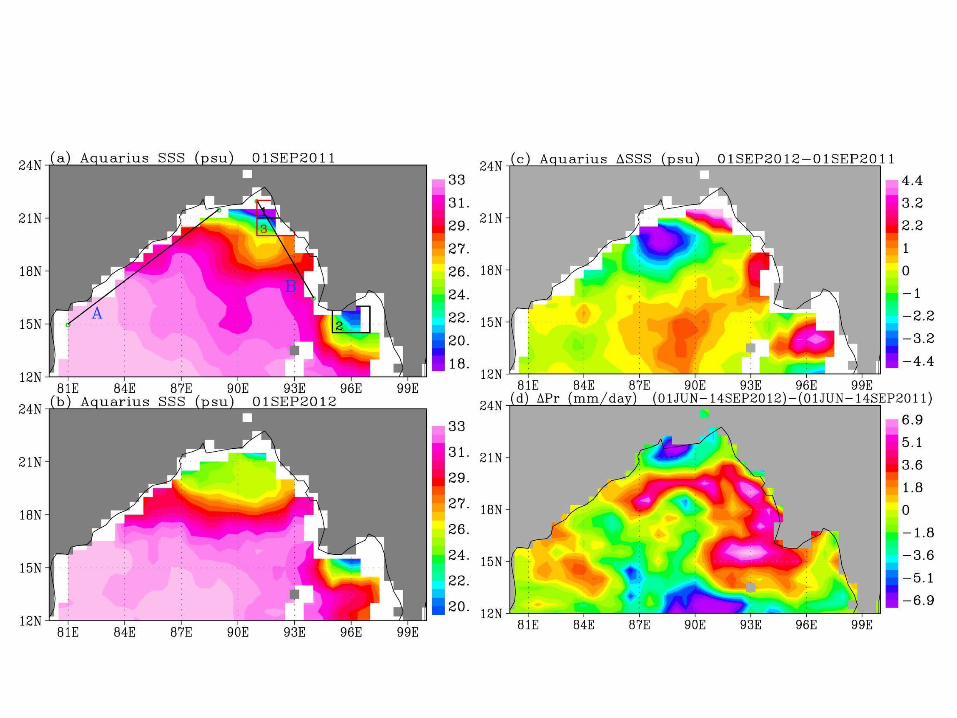
To the east of the river mouth, the lowest salinity in April is earlier than the peak river discharge. To the north, the lowest salinity is in June. Aquarius V2.5.1 is significantly saltier.
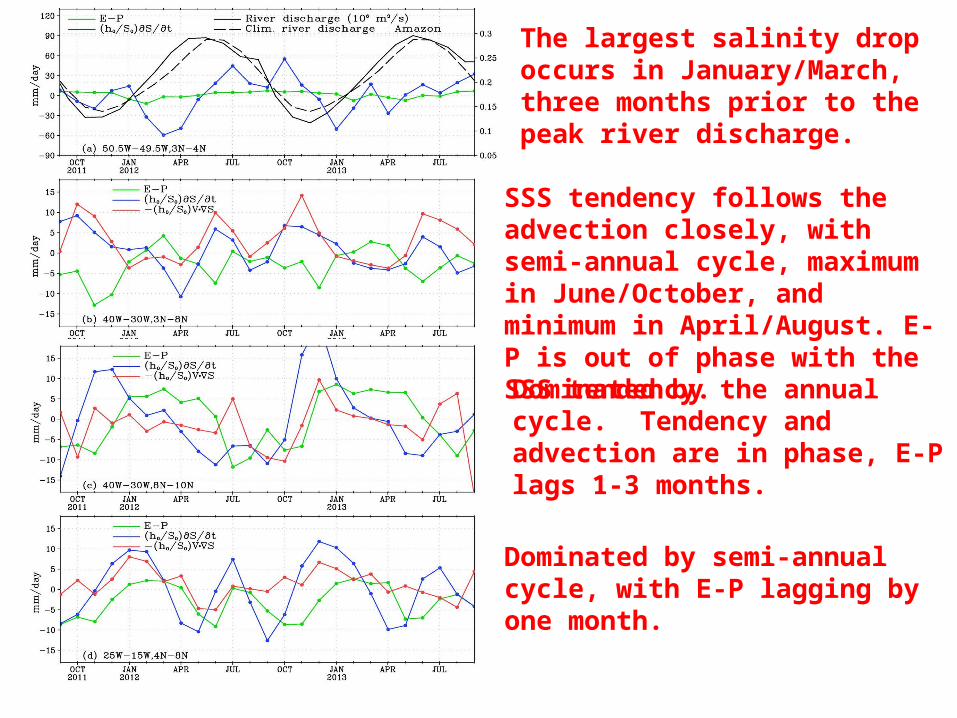
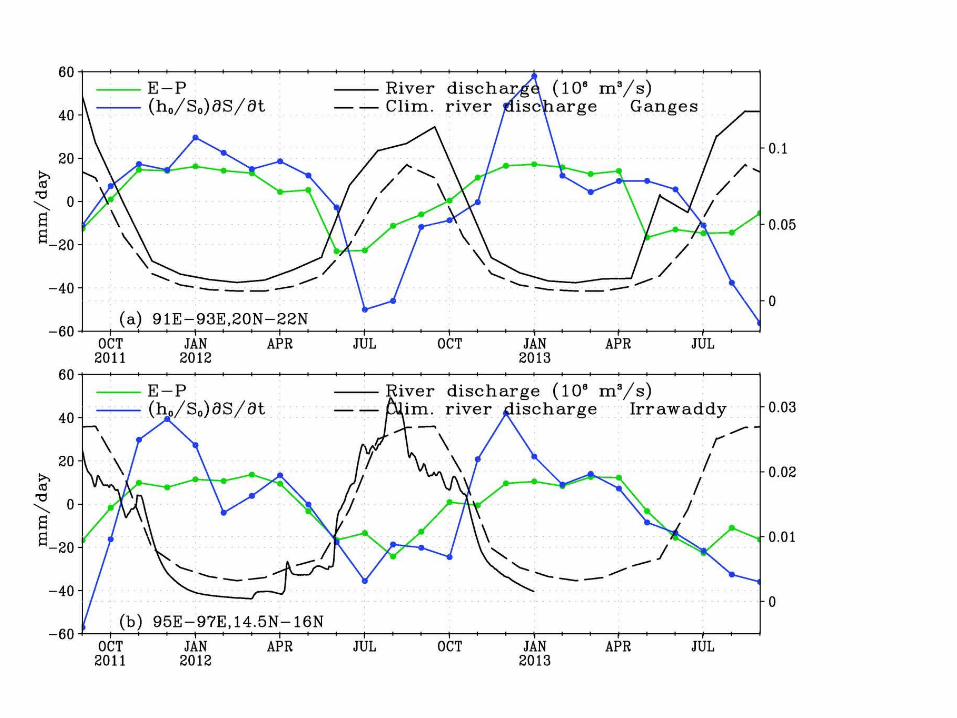
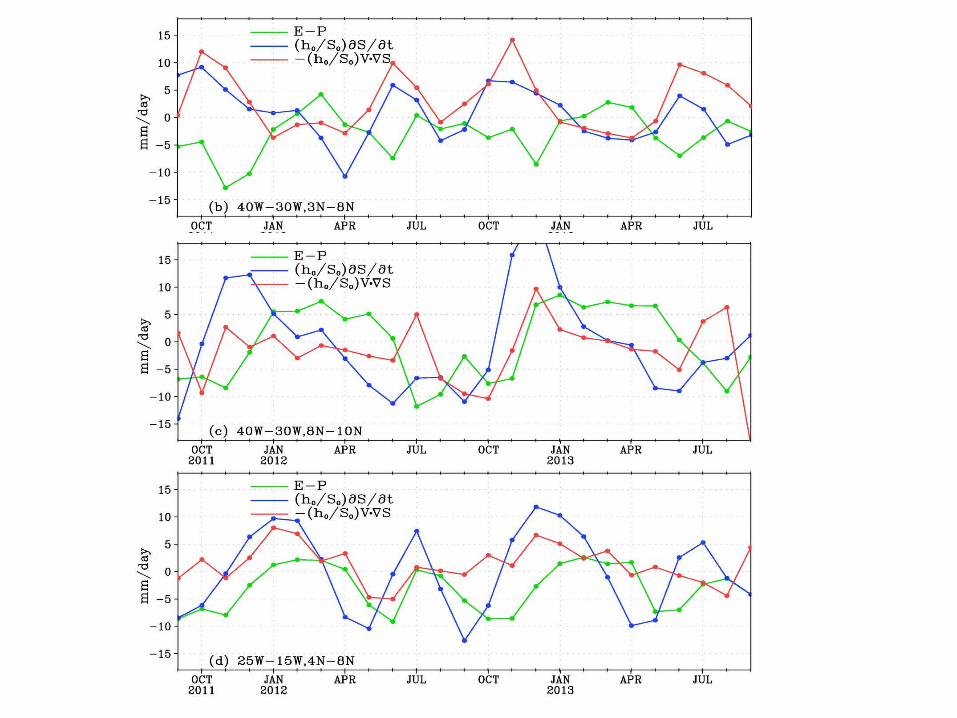
SSS tendency follows the advection closely, with semi-annual cycle, maximum in June/October, and minimum in April/August. E-P is out of phase with the SSS tendency.
The largest salinity drop occurs in January/March, three months prior to the peak river discharge.
Dominated by the annual cycle. Tendency and advection are in phase, E-P lags 1-3 months.
Dominated by semi-annual cycle, with E-P lagging by one month.
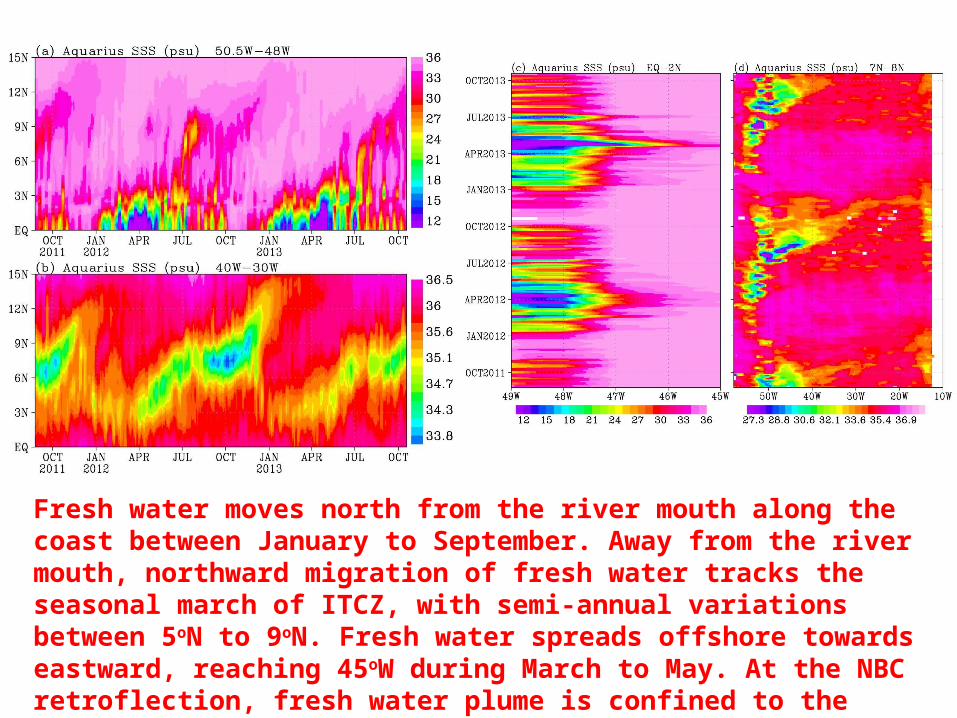
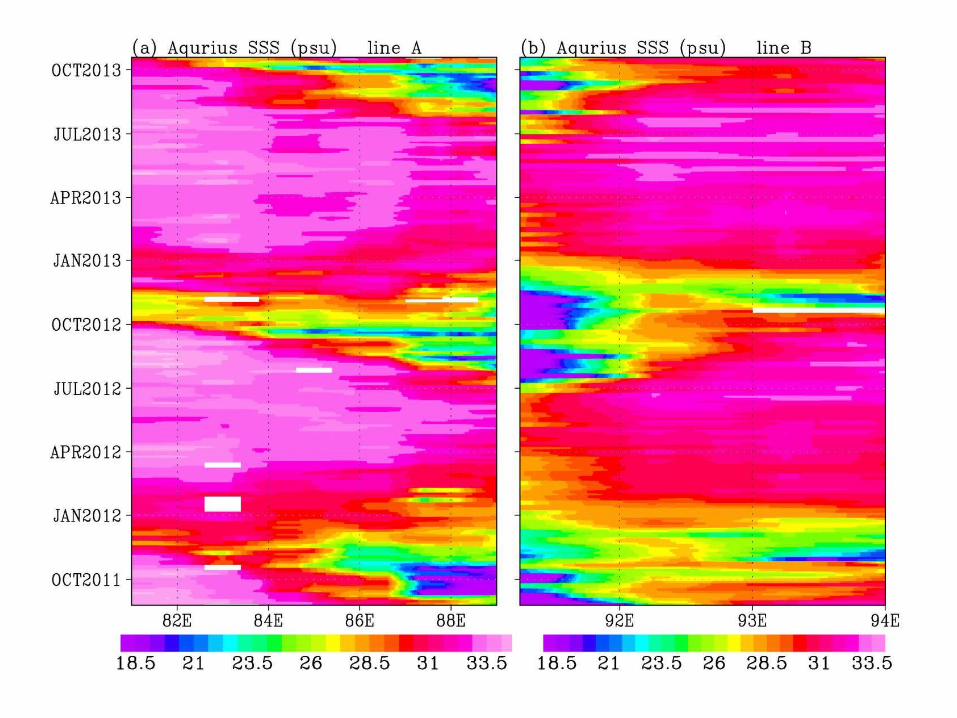
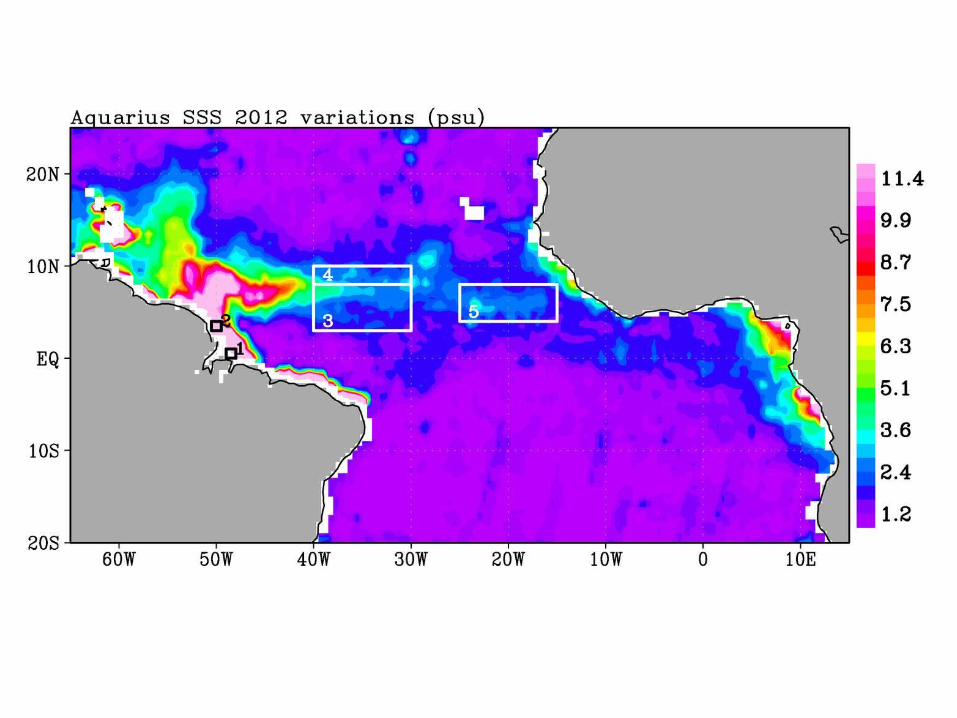
Fresh water moves north from the river mouth along the coast between January to September. Away from the river mouth, northward migration of fresh water tracks the seasonal march of ITCZ, with semi-annual variations between 5oN to 9oN. Fresh water spreads offshore towards eastward, reaching 45oW during March to May. At the NBC retroflection, fresh water plume is confined to the coastal area from January to June, and it moves eastward from July to December.
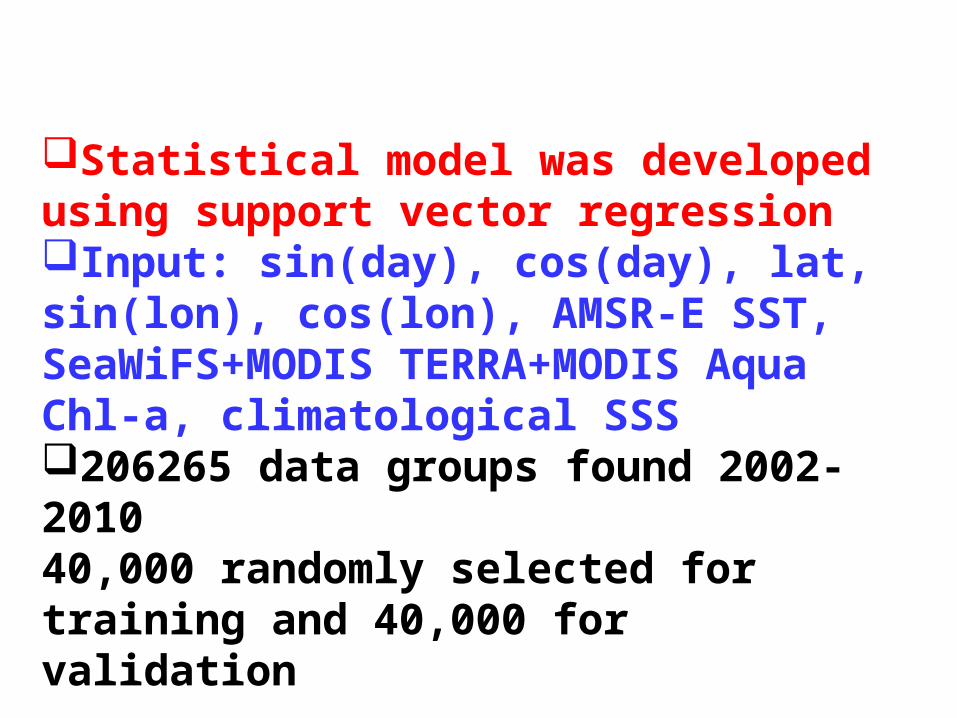
Statistical model was developed using support vector regressionInput: sin(day), cos(day), lat, sin(lon), cos(lon), AMSR-E SST, SeaWiFS+MODIS TERRA+MODIS Aqua Chl-a, climatological SSS206265 data groups found 2002-201040,000 randomly selected for training and 40,000 for validation
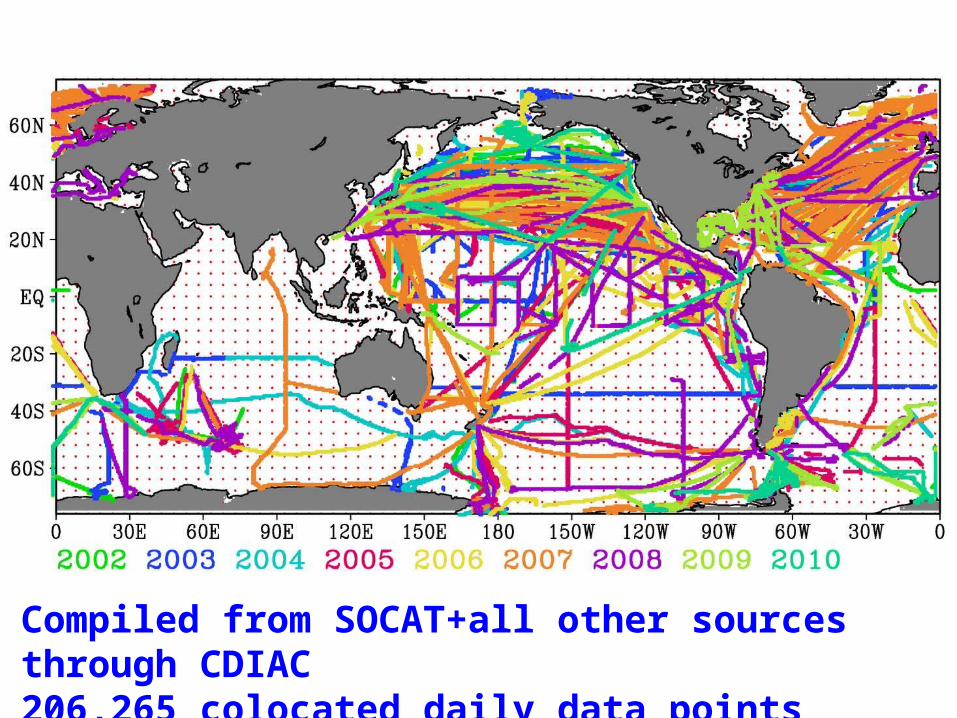
Compiled from SOCAT+all other sources through CDIAC 206,265 colocated daily data points
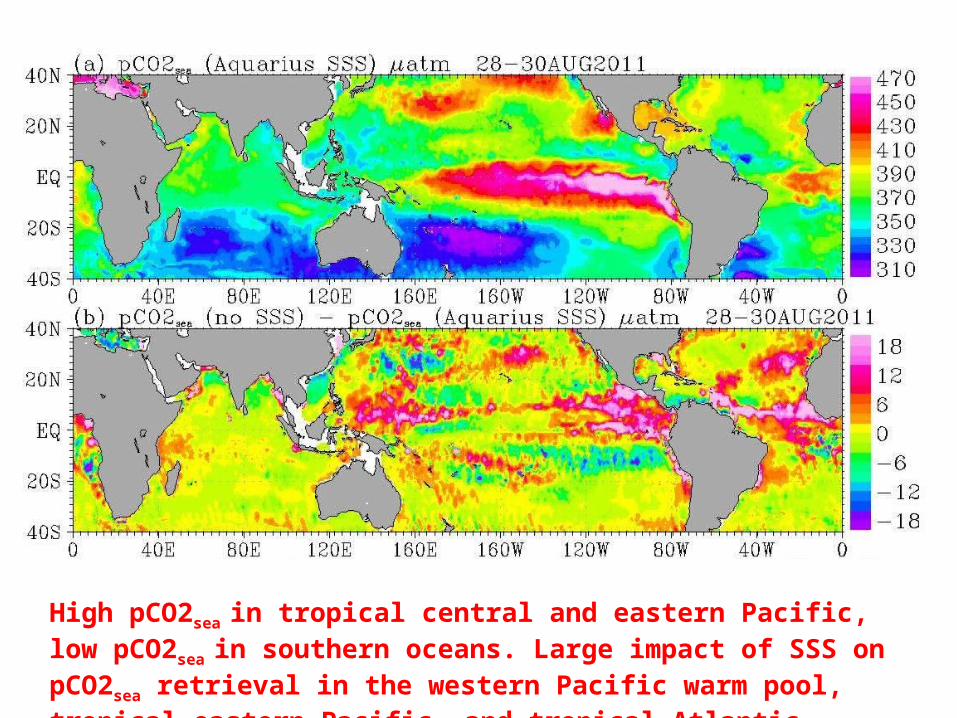
High pCO2sea in tropical central and eastern Pacific, low pCO2sea in southern oceans. Large impact of SSS on pCO2sea retrieval in the western Pacific warm pool, tropical eastern Pacific, and tropical Atlantic.
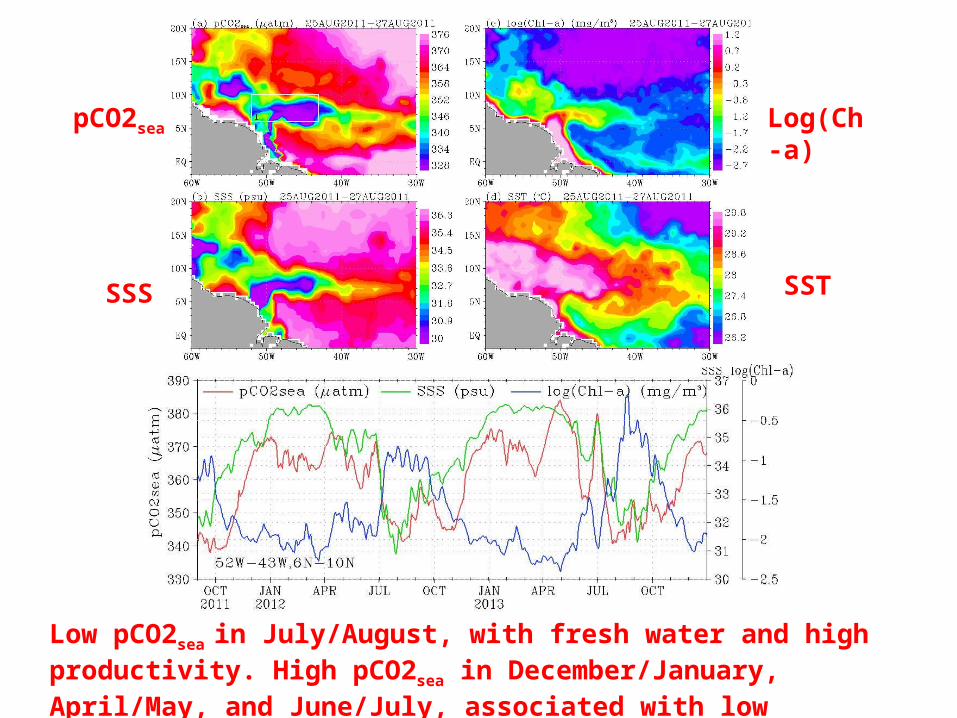
pCO2sea
SSTSSS
Log(Ch-a)
Low pCO2sea in July/August, with fresh water and high productivity. High pCO2sea in December/January, April/May, and June/July, associated with low nutrient saline water.
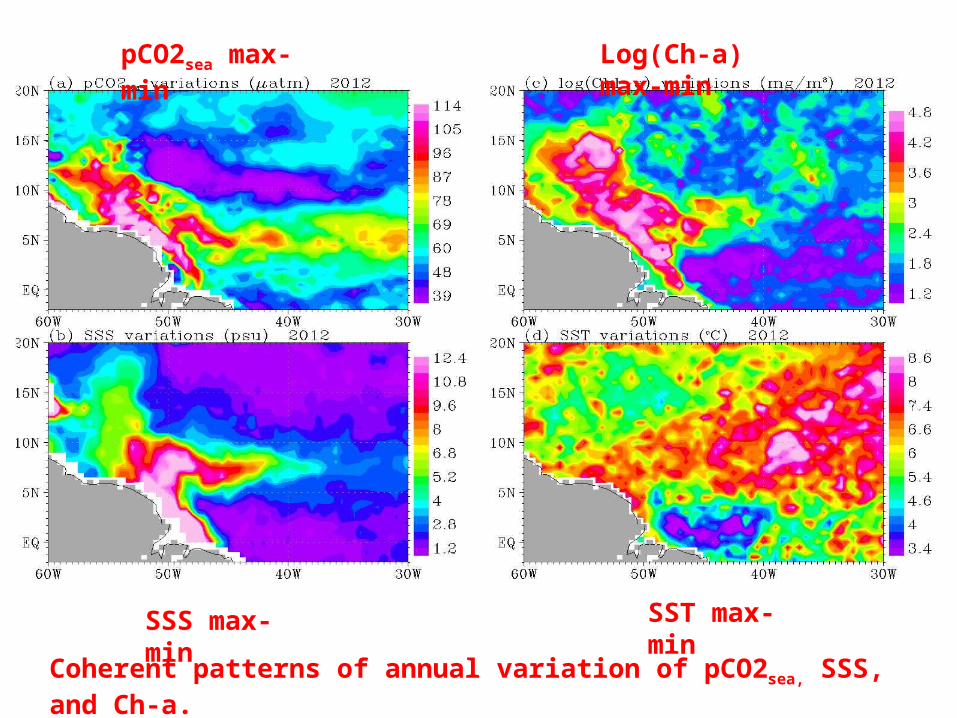
SST max-minSSS max-min
pCO2sea max-min Log(Ch-a) max-min
Coherent patterns of annual variation of pCO2sea, SSS, and Ch-a.
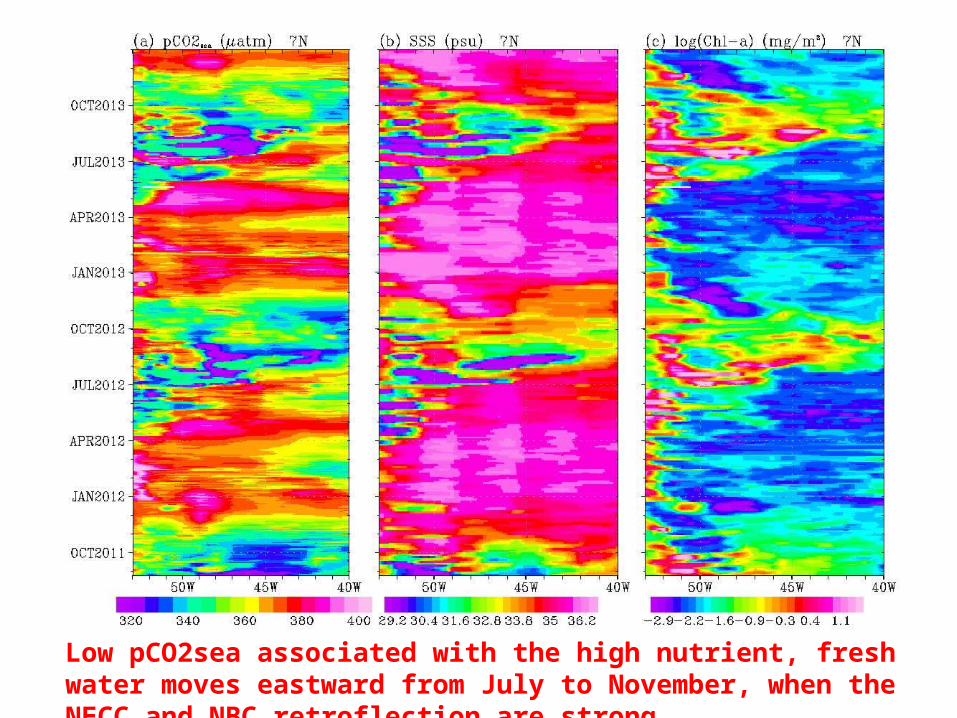
Low pCO2sea associated with the high nutrient, fresh water moves eastward from July to November, when the NECC and NBC retroflection are strong.
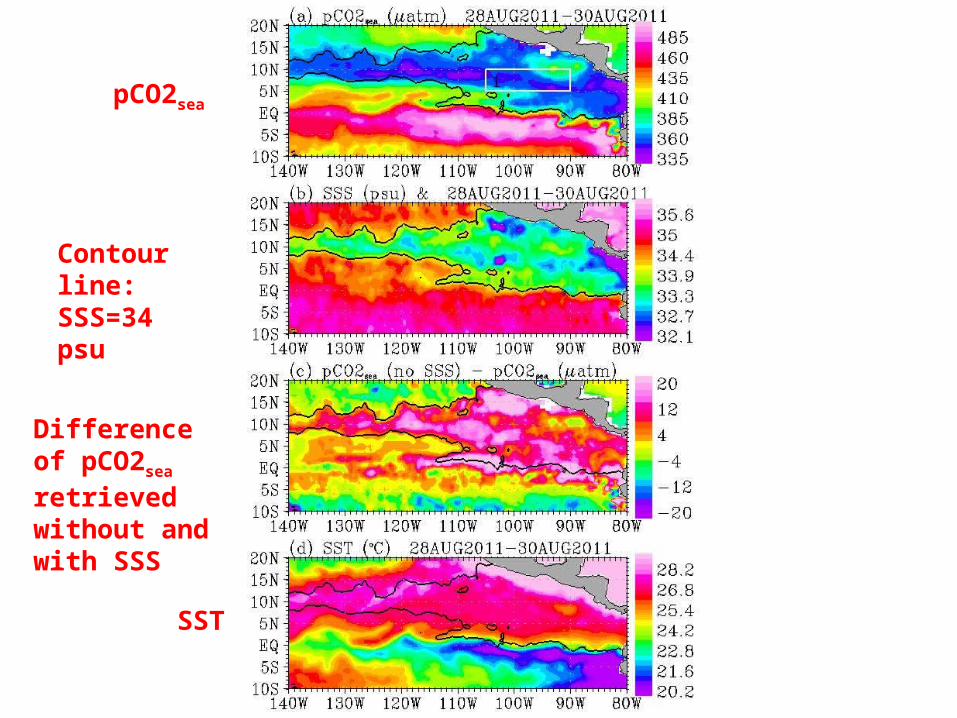
Contour line: SSS=34 psu
pCO2sea
Difference of pCO2sea retrieved without and with SSS
SST
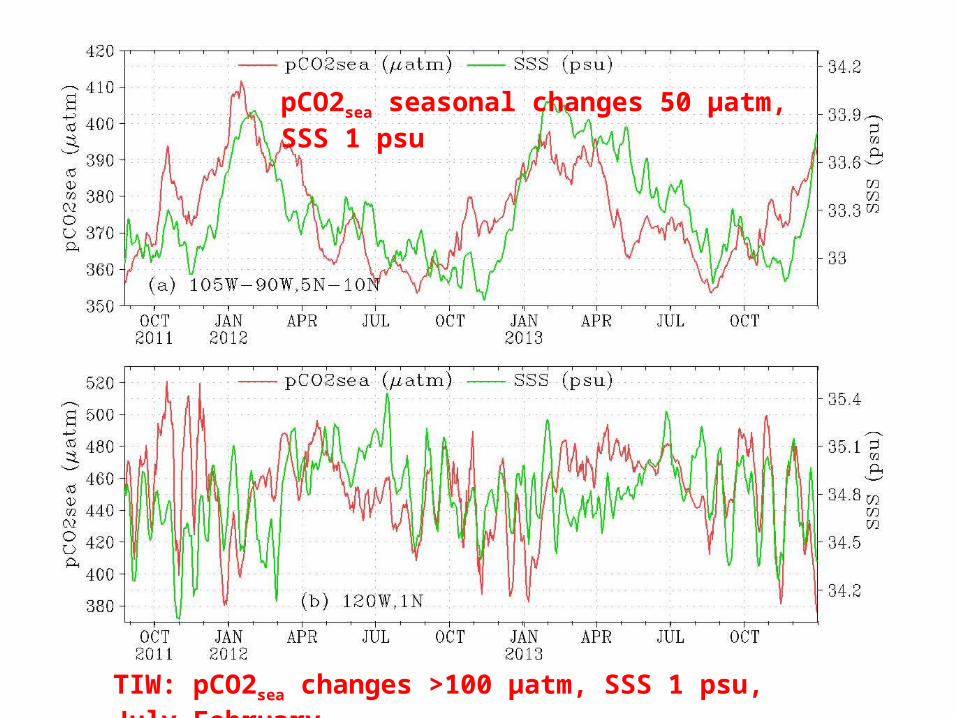
TIW: pCO2sea changes >100 µatm, SSS 1 psu, July-February
pCO2sea seasonal changes 50 µatm, SSS 1 psu
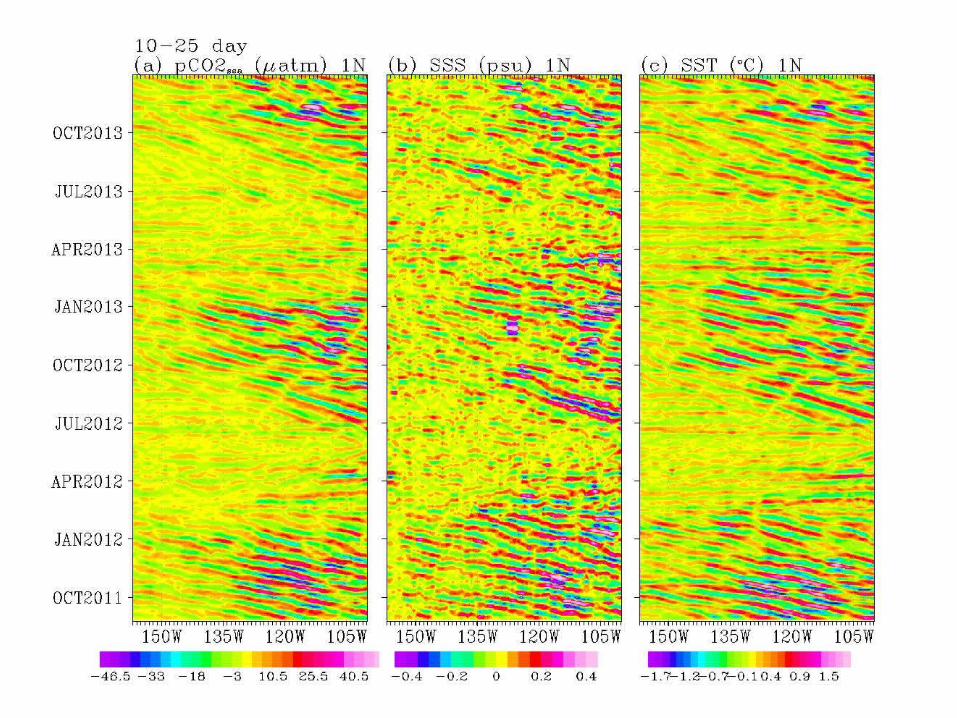
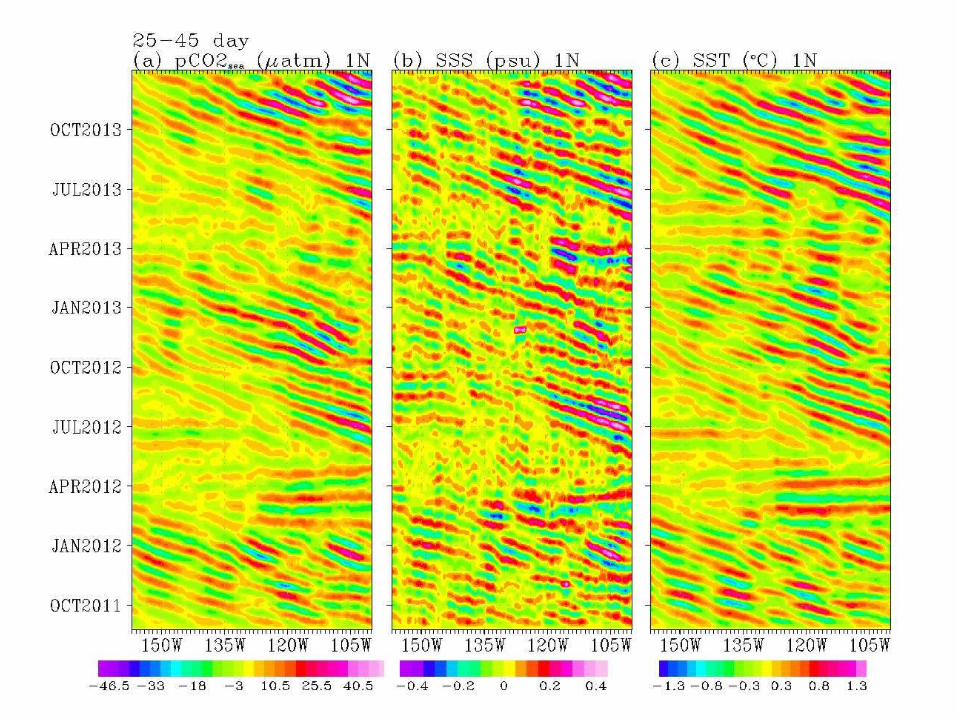
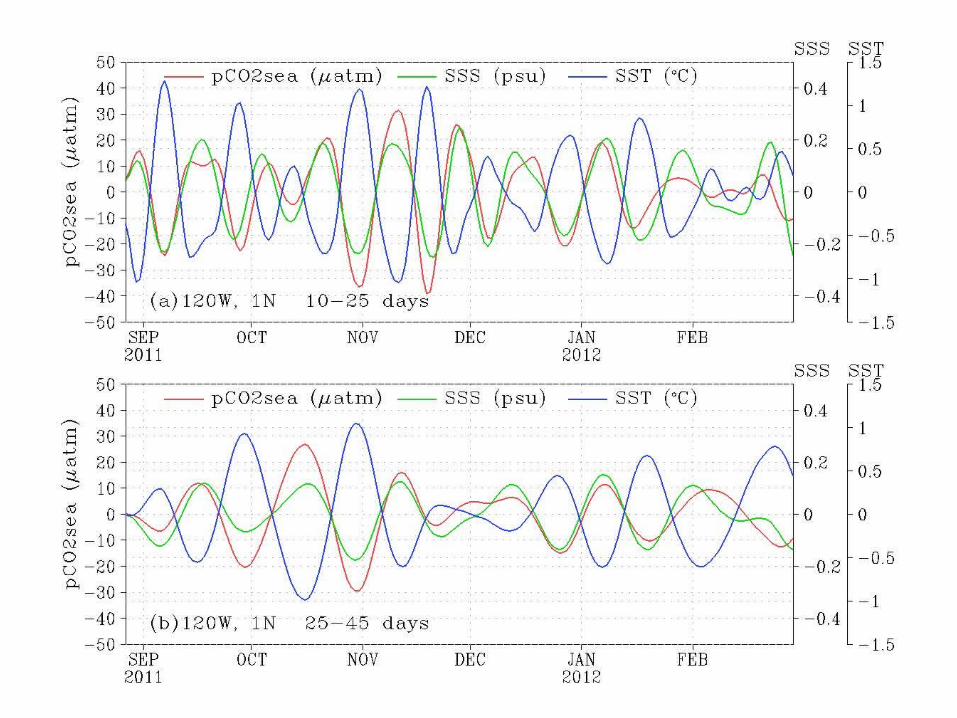
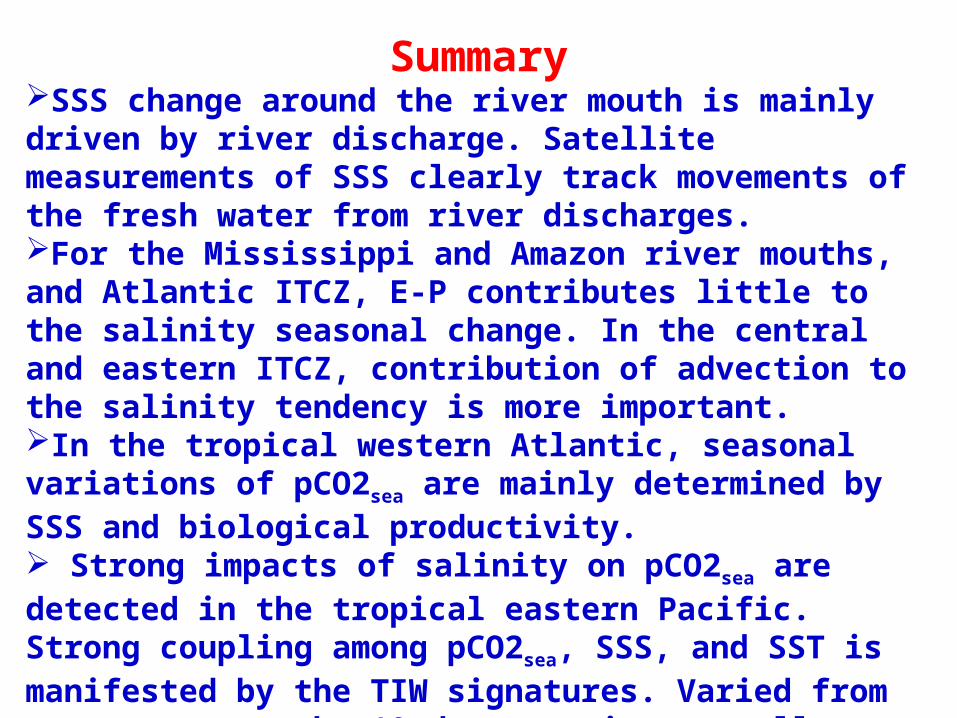
SummarySSS change around the river mouth is mainly driven by river discharge. Satellite measurements of SSS clearly track movements of the fresh water from river discharges. For the Mississippi and Amazon river mouths, and Atlantic ITCZ, E-P contributes little to the salinity seasonal change. In the central and eastern ITCZ, contribution of advection to the salinity tendency is more important. In the tropical western Atlantic, seasonal variations of pCO2sea are mainly determined by SSS and biological productivity. Strong impacts of salinity on pCO2sea are detected in the tropical eastern Pacific. Strong coupling among pCO2sea, SSS, and SST is manifested by the TIW signatures. Varied from year to year, the 19 day wave is generally strongest near 1oN for all three parameters. The 30 day wave illustrates distinguished signals from 0.5oN to 4oN.
Future work:Investigate the causes (such as wind driven local circulation) of inconsistency between the maximum freshening near the Amazon river mouth and the peak river discharge.Quantify the pCO2sea changes due to SSS and SST in the tropical eastern Pacific.Study the SSS impact on global air-sea carbon dioxide flux estimation.