Embed Size (px)
Citation preview
Linking plant traits and herbivory in grassland biodiversity-ecosystem
functioning research
Dan F.B. Flynn
Submitted in partial fulfillment of the
Requirements for the degree of
Doctor of Philosophy
in the Graduate School of Arts and Sciences
COLUMBIA UNIVERSITY
2011

© 2011
Dan F.B. Flynn
All Rights Reserved

ABSTRACT
LINKING PLANT TRAITS AND HERBIVORY IN GRASSLAND BIODIVERSITY-
ECOSYSTEM FUNCTIONING RESEARCH
Dan F.B. Flynn
Increased availability of data on morphological, physiological, and behavioral
traits of species has improved understanding of the processes driving community
assembly and the consequences of community disassembly for ecosystem functioning. In
addition, there has also been a call for advancing the multitrophic view of biodiversity-
ecosystem functioning. Here I propose a trait-based framework to merge plant-herbivore
interactions with biodiversity-ecosystem function relationships. This framework links
plant growth and defense strategies, herbivore feeding preferences, and primary
production in terrestrial plant communities. I empirically tested these proposed linkages
in laboratory and field experiments carried out in the understudied grasslands of Inner
Mongolia, China. I found that a dominant generalist grasshopper Oedaleus asiaticus
exhibits feeding preference for plants of high palatability when equally available, but in
the field feeds on nearly any graminoid which is dominant. This behavior potentially
allows subdominant plants to coexist, maintaining plant diversity.
To link feeding behavior to consequences for plant communities, I carried out
detailed measurements of plant morphological and physiological traits in the field and
experimentally manipulated grasshopper feeding intensity. Using a novel analytical tool,
I found that plant communities in these grasslands exhibit high niche overlap, regardless

of intensity of herbivory by grasshoppers or sheep. This result indicates that
environmental filtering structures these communities more than limiting similarity.
Extending the use of traits beyond the study system in Inner Mongolia, I test the
how both functional and phylogenetic diversity explain the biodiversity effect on
grassland ecosystem functioning. The promise for merging tools from evolutionary
biology and functional ecology is great, as these diversity metrics provide superior
explanatory power in a meta-analysis of biodiversity experiments. Future work should be
addressed at clarifying which functional traits are most strongly reflected in measures of
phylogenetic diversity, including strategies of compensating for or avoiding herbivory.

i
TABLE OF CONTENTS
Chapter 1. Incorporating herbivory and plant defense strategies into biodiversity-
ecosystem functioning research .................................................................................... 1
Introduction ................................................................................................................. 1
Top-down control of plant communities in a BEF framework ...................................... 2
Plant growth and defense strategies in BEF.................................................................. 7
The B in BEF: Diversity measurement in herbivore-structured plant communities ..... 12
Conclusions ............................................................................................................... 16
Chapter 2. Foraging behavior of a generalist grasshopper, Oedaleus asiaticus, in
response to plant community composition and plant traits....................................... 22
Summary ................................................................................................................... 22
Introduction ............................................................................................................... 23
Methods..................................................................................................................... 25
Results ....................................................................................................................... 31
Discussion ................................................................................................................. 33
Acknowledgments ..................................................................................................... 37
Tables and Figures..................................................................................................... 37
Chapter 3. High niche overlap in grassland plant communities irrespective of
herbivory in Inner Mongolia, China .......................................................................... 45
Summary ................................................................................................................... 45
Introduction ............................................................................................................... 46
Materials and methods ............................................................................................... 48
ii
Results ....................................................................................................................... 56
Discussion ................................................................................................................. 57
Acknowledgements.................................................................................................... 61
Tables and Figures..................................................................................................... 62
Chapter 4. Functional and phylogenetic diversity as predictors of biodiversity-
ecosystem function relationships ................................................................................ 69
Summary ................................................................................................................... 69
Introduction ............................................................................................................... 70
Methods..................................................................................................................... 72
Results ....................................................................................................................... 75
Discussion ................................................................................................................. 77
Acknowledgments ..................................................................................................... 79
Tables and Figures..................................................................................................... 80
Chapter 5. Summary................................................................................................... 88
BEF beyond Western grasslands ................................................................................ 90
Next steps .................................................................................................................. 91
References.................................................................................................................... 94
Appendix A................................................................................................................ 111
Appendix B................................................................................................................ 114
iii
LIST OF FIGURES AND TABLES
Chapter 1
Table 1.1. Selected biodiversity-ecosystem functioning experiments across trophic levels.
.............................................................................................................................. 17
Figure 1.1. Conceptual schematic of growth-defense tradeoffs affecting BEF
relationships........................................................................................................... 20
Figure 1.2. Hypothetical relationships between growth and defense. ............................. 21
Figure 1.3. Hypotheses linking growth-defense tradeoffs, herbivory, and plant
community biomass production.............................................................................. 21
Chapter 2
Table 2.1. Feeding preferences of Oedaleus asiaticus in a controlled environment. ....... 37
Table 2.2. Summary of general linear model of observed time spent eating one focal
species, Cleistogenes squarrosa, by the grasshopper Oedaleus asiaticus, with respect
to the composition of dominant plant species. ........................................................ 38
Table 2.3. Summary of general linear model of Leymus chinensis to experimental silica
addition, crossed with mechanical wounding or grasshopper herbivory in semi-
natural conditions................................................................................................... 38
Figure 2.1 Quantity of leaf tissue eaten by O. asiaticus in a controlled environment. ..... 40
Figure 2.2 Relative consumption preference of common plants of Inner Mongolia by O.
asiaticus................................................................................................................. 41
Fig. 2.3. Relative difference in consumption preference for each of six plant species by O.
asiaticus compared to difference in carbon and nitrogen concentrations in leaf tissue.
.............................................................................................................................. 41
iv
Figure 2.5. Silica concentrations in leaf tissue of Leymus chinensis under experimental Si
addition crossed with mechanical clipping and grasshopper feeding. ...................... 42
Fig. 2.6. Correlation between leaf traits, as well as aboveground biomass, under
experimental Si addition......................................................................................... 43
Chapter 3
Table 3.1. Summary of grassland plant species sampled for functional traits. ................ 62
Table 3.2. Summary of trait data. LMA: Leaf mass per unit area. .................................. 63
Table 3.3. Summary of community data. ....................................................................... 63
Table 3.4. Summary of mixed-effects models for niche overlap..................................... 64
Figure 3.1. Conceptual diagram of the abundance-weighted convex hull ....................... 66
Figure 3.2. Niche overlap and functional richness of plant communites under herbivory.
.............................................................................................................................. 67
Figure 3.3. Experimental treatments do not alter niche overlap...................................... 68
Chapter 4
Table 4.1. Model comparison results of linear mixed models......................................... 80
Table 4.2. Sources of species mean trait data for the 121 species in this analysis. .......... 82
Table 4.3. Summary of structural equation modeling results.......................................... 83
Table 4.4. Phylogenetic signal in the trait variation. ...................................................... 84
Figure 4.1. Comparison of diversity metrics. ................................................................. 86
Figure 4.2. Correlations between diversity metrics. ....................................................... 87
Figure 4.3. Structural equation model............................................................................ 87
v
ACKNOWLEDGMENTS
I owe many thanks to all who have supported my years of graduate studies. I am
grateful to my advisor, Shahid Naeem for giving me the opportunity to freely pursue
collaborations and research projects, as long as I eventually worked on my thesis. He also
constantly pushed me to see the big picture beyond every data point, a habit I will strive
to maintain. The extended Naeem Lab has given invaluable inspiration and feedback on
many of the project I undertook during my time at E3B, and has provided a supportive
research and writing environment. María Uriarte opened my eyes to new tools for
statistical analysis, and to the intriguing puzzles of secondary forests in Puerto Rico. Jim
Elser, Oswald Schmitz, and Kevin Griffin have been generous with their time in helping
me develop and refine this dissertation.
Yongfei Bai, director of the Inner Mongolian Grassland Ecosystem Research
Station, provided me with a home base during my research summers, and was generous
in giving me access to long-term field sites, data, and other resources. Many friends
helped make those summers fruitful and productive, especially Georgia Hart, Jing Xing,
Arianne Cease, Philipp Schönbach, Nicole Faneslow, Katerin Müller, Lü Xiaotao, Wei
Cunzheng, Zhang Guangming, and Guo Jingguo.
My parents have always been eager to hear about each milestone reached , which
has helped push me forward. With my partner and co-conspirator Mika at my side, every
step has been twice as much fun.
1
CHAPTER 1. INCORPORATING HERBIVORY AND PLANT DEFENSE
STRATEGIES INTO BIODIVERSITY-ECOSYSTEM FUNCTIONING RESEARCH
Introduction
The last two decades have witnessed an explosion of research demonstrating that
the diversity of a biota can influence ecosystem processes via a number of mechanisms
(Hooper et al. 2005; Spehn et al. 2005; Balvanera et al. 2006; Cardinale et al. 2006).
These studies were initially almost exclusively conducted in temperate grasslands, and
the vast majority of experimental and observation work on biodiversity-ecosystem
functioning (BEF) research remains focused on plant communities. Given that one of the
ultimate goals of biodiversity-ecosystem functioning research is to inform biodiversity
conservation for the better provisioning of ecosystem services (Naeem et al. 2009), there
is a need to move beyond a purely plant-centric approach to BEF research. Despite the
fact that herbivory strongly influences plant population composition and dynamics and
that plant defenses influence herbivore behavior, relatively little attention has been paid
to how feedbacks between herbivore and plant community dynamics fit into the BEF
framework. This deficiency is evident even for terrestrial ecosystems like grasslands
which have been a primary focus of BEF research. This review focuses on this issue of
how herbivory influences the relationship between plant biodiversity and terrestrial
ecosystem function.
Recently there have been calls to incorporate a food-web perspective in BEF
research (Duffy et al. 2007; Reiss et al. 2009), with recent evidence that biodiversity
effects cascade up trophic levels with a predictable level of attenuation (Scherber et al.
2
2010). However, there have still been few efforts to incorporate plant-herbivore
interactions, in particular how herbivore behavior shapes plant communities and how
variation in plant defense strategies may alter BEF relationships. As researchers move
toward a more nuanced understanding of how biodiversity loss is altering ecosystems, it
will no longer be sufficient to ignore how trophic interactions shape plant communities
and thus the ecosystems that provide supporting, regulating, and provisioning services to
society.
This review addresses three aspects of how plant-herbivore interactions affect
biodiversity-ecosystem functioning relationships. Herbivory in biodiversity-ecosystem
functioning research fits within a larger program of ecological research, ranging from the
dynamics of herbivore interactions to plant-soil interactions (Fig. 1), but for the purpose
of this review I focus on three elements of this research framework. First, I describe the
current evidence for top-down control of plant communities and consequences for plant
diversity ecosystem processes. Second, I detail how plant growth defense strategies differ
across species and how this diversity is likely to alter biodiversity-ecosystem functioning
relationships. Finally, I discuss the consequences of plant-herbivore interactions for
different aspects of plant community diversity, in particular the relative importance of
functional and phylogenetic diversity metrics as predictors of ecosystem functioning.
Top-down control of plant communities in a BEF framework
Ecology has a long history of examining how the abundance of a given trophic
level is determined by the abundances and number of connected trophic levels (Hairston
et al. 1960; Oksanen et al. 1981), as well as extensive research into how plant defense

3
strategies vary within and across species (Fritz & Simms 1992). Yet while biodiversity-
ecosystem function (BEF) research initially focused on complex food webs, including
several trophic levels (Naeem et al. 1995; Naeem & Li 1997), the field soon narrowed its
focus to examining the sign and shape of diversity-productivity relationships within the
producer trophic level. This line of research has uncovered a robust positive, saturating
relationship between species diversity and ecosystem properties ranging from net primary
production to invasion resistance (Balvanera et al. 2006). However, research across
trophic levels has been limited, strongly biased towards microbial and aquatic systems,
with a notable lack of research on terrestrial plant-herbivore interactions.
In order to examine how terrestrial plant-herbivore interactions may affect BEF
relationships, it is worth first reviewing evidence from multitrophic BEF research in
general. Focusing within producer, herbivore, decomposer, and predator trophic levels,
BEF relationships are consistently strong, in both terrestrial and aquatic systems
(Cardinale et al. 2006). However, to date no comprehensive review of multitrophic BEF
research has been conducted. As a first step, I compiled a list of studies which addressed
the question of how diversity manipulation at one trophic level alters the BEF
relationship at another level. These references were located from ISI Web of Science
using the search term "biodiv* AND ecosystem* AND (function* OR proces*) AND
(herbivor* OR predator* OR consumer*)", as well as from references cited in the most
comprehensive current review (Duffy et al. 2007). From these, I selected only those with
experimental manipulations of diversity, and where biodiversity-ecosystem functioning
relationships at an adjacent trophic level were assessed. This selection process resulted in
41 studies from 1997-2010, 19 terrestrial and 22 aquatic (Table 1.1). This summary

4
shows that while multitrophic BEF research had pursued more in aquatic systems
initially, now the research effort is more evenly divided among terrestrial and aquatic
systems. Niche complementarity has been identified as the mechanism driving the
observed BEF relationships in just over half the cases for both aquatic systems (12 / 20
studies for which a mechanism was proposed), and terrestrial systems (7 / 13 studies).
The central advance made by BEF research has been that species composition can
control ecosystem processes, by niche partitioning or by selection effects. This advance is
based principally of findings from studies of BEF relationships in terrestrial primary
producer communities, especially grassland plants. While such study systems are
tractable and easily manipulated, this focus on grasslands and primary production has
been acknowledged to have limited progress in this field (Loreau et al. 2001; Petchey et
al. 2004a). However, in multitrophic BEF empirical research, this trend is reversed:
progress has mostly been made in manipulating consumer diversity in aquatic systems
and soil and microbial systems, with very limited work in terrestrial systems. This
difference in the experimental focus is matched by a difference in conclusions about what
mechanism drives BEF relationships: niche partitioning effects are commonly seen at the
producer level, but selection effects dominate at consumer levels (Duffy 2002; Balvanera
et al. 2006; Cardinale et al. 2006; Duffy et al. 2007). Aquatic (primarily marine
mesocosm studies) and soil food web studies diverge in their manipulations of diversity
from terrestrial (primarily grassland) studies, with terrestrial studies almost always only
manipulating the producer trophic level. In addition, the mechanism driving the diversity-
function relationships across trophic levels is most often identified as selection effects,
5
while niche complementarity effects predominate in terrestrial producer-manipulation
BEF experiments.
When terrestrial ecologists have explicitly considered trophic structure in BEF
experiments, they have done so almost exclusively by examining herbivore abundance as
a function of plant richness, rather than by examining how herbivores alter producer
diversity and abundances, and therefore ecosystem function. This diverges from the top-
down approach considered by aquatic BEF experiments, but provides some indications of
how top-down influences of herbivores may influence terrestrial BEF relationships. In the
most common approach, researchers have used existing grassland BEF experiments
(Koricheva et al. 2000; Scherber et al. 2006) or natural plant diversity gradients (Moretti
et al. 2006; Unsicker et al. 2006; Harvey et al. 2008; Wenninger & Inouye 2008) to ask
whether herbivore abundance and net consumption of plants decreases as plant species
increases. For example, Koriecheva et al. (2000) surveyed arthropod diversity in two
combinatorial grassland BEF experiments in Sweden and Switzerland, finding that
generalist herbivores significantly decreased in abundance with plant species richness.
Similar results were found in a review of many studies of arthropod herbivory in forests,
where tree diversity reduced herbivory significantly, presumably because herbivore
abundances were decreased (Jactel & Brockerhoff 2007). Recent work integrating across
many measures of arthropod, small mammals, nematode, and other trophic level diversity
at a single BEF experiment has shown that manipulations of plant diversity have
cascading "bottom-up" effects, with herbivore abundance and diversity declining with
reduced plant diversity (Scherber et al. 2010).
6
These outcomes of declining herbivore abundance with increased plant diversity
provide some support for the concept of associational resistance (Callaway 1995). In
associational resistance, producers benefit from having a diversity of neighbors with
varying palatabilities, or varying apparency, where greater diversity decreases consumer
efficiency by increasing the search time it takes specialist herbivores to find their
preferred producer species (Chew & Courtney 1991; Milchunas & Noy-Meir 2002).
Associational resistance has also been found in many manipulations of aquatic producer
diversity, where susceptibility to herbivory was reduced by higher producer richness
(Hillebrand & Cardinale 2004; Long et al. 2007); this is a rare case of agreement between
terrestrial and aquatic BEF research. For either associational resistance or apparency
effects, species richness per se is secondary in importance to variation in plant resistance
and tolerance to herbivory, an important point which highlights the importance of
focusing on traits of species rather than simply species richness in BEF research.
While this review focuses on the effects of herbivory and plant defense strategies
in BEF research, it is worth noting that manipulations of consumer or predator diversity
in terrestrial trophic BEF experiments remain nearly nonexistent. One of the only
examples of this type of study comes from Schmitz (2006), who manipulated presence of
predatory spiders in field mesocosms, showing that predator effects on herbivorous
arthropods altered plant diversity and thus nitrogen cycling and light penetration to the
soil. Previous studies have shown increased nutrient cycling due to grasshopper
herbivory, but only through changes in leaf litter abundance (Belovsky & Slade 2000),
not plant species composition. Schmitz (2008) extended this work to demonstrate that not
just predator presence but the hunting strategy controlled this tri-trophic relationship. In

7
particular, variation in hunting mode of the predator altered herbivore behavior, leading
to dramatic reductions in both the abundance of a dominant plant species and plant
diversity, with corresponding changes in aboveground net primary production, nitrogen
mineralization, and litter carbon:nitrogen content (Schmitz 2009). Similarly, Steffan &
Snyder (2010) found that greater diversity of predators, even when consumption of prey
was prevented, lead to greater plant biomass via greater disruption of herbivory. Little
comparable work linking individual behavior, diversity, and ecosystem functioning exists
in aquatic systems for comparison, and more work in terrestrial systems is needed to
extend the generality of this work.
Plant growth and defense strategies in BEF
In assessing top-down effects of herbivores on plant communities, a crucial aspect
is the strategies employed by plants in resisting herbivory. Producers are not necessarily
passive casualties of herbivory. Producers have a variety of strategies within the broad
categories of resistance and tolerance to herbivory (Fritz & Simms 1992). Strategies to
resist herbivory range from mechanical defenses of spines and leaf toughness (Lucas et
al. 2000), to indirect defenses such as reduced nutritional quality (Coley et al. 1985).
Plants can also employ highly targeted indirect defenses, for example where root
herbivory on cotton leads to increased extra-floral nectary production, recruiting
predators to feed on the herbivore (Wackers & Bezemer 2003). There are many examples
of such strategies and a large, well-developed literature on when and how plants employ
herbivore defense strategies and how they affect fitness (Mattson 1980; Herms &
Mattson 1992).

8
These strategies have generally been conceived of as falling along a trade-off axis
where plants vary investment in growth to investment in defense. From the perspective of
herbivores, this variation in plant strategies places feeding preferences in a general
framework of balancing the search for nutrition from fast-growing plant tissues and
avoiding toxicity from well-defended plant tissues. This search for nutrition and
avoidance of toxicity clearly has the potential to alter plant community structure, and
thereby alter ecosystem functioning.
Herbivores are known to alter their feeding patterns in order to address nutrient
deficiencies (Raubenheimer & Simpson 1997), leading in some cases to generalist
herbivores partitioning plant resources into nutritional niches, promoting coexistence
(Behmer & Joern 2008). The emphasis on nutritional preferences of herbivores leads
naturally to examinations of the plant nutrients which affect plant growth, in particular
nitrogen or protein content. For example, two generalist vole species were found to have
similar food preferences across 20 plant species, both preferring plants which had high
regrowth ability and nitrogen content, even though these plant varied broadly in
morphology and defensive compounds (Hjalten et al. 1996). Such evidence supports the
notion that plant growth strategies are linked with palatability to herbivores, with
particularly strong evidence for high nitrogen, fast-growing or regrowing plant species
being more highly preferred by ungulate herbivores (Bryant et al. 1989; Augustine &
McNaughton 1998).
The converse of herbivore preferences for fast-growing, high nutrient content plants
is avoidance of toxic plant defenses. In some cases, evidence shows that avoidance of
defensive compounds clearly predict food preferences of herbivores, and nutrient content

9
of plants does not (Bryant & Kuropat 1980). Other evidence shows that the effectiveness
of a defensive compound, tannic acid, deterred feeding by an insect herbivore only in
certain experimental diets, indicating a complex interaction between nutrition, toxicity,
and feeding (Behmer et al. 2002). Promising work from a mathematical model has shown
that in the absence of variation in palatability, herbivory can promote plant species
coexistence, but when palatabilities vary, herbivores shift plant communities towards
dominance by a few unpalatable species (Feng et al. 2009).
This variation in growth and defense strategies, and the resulting herbivore
feeding preferences, presents an opportunity for a more trophically-explicity BEF
research framework. As an example of how to incorporate consideration of plant defenses
into trophic BEF research, Chapman and colleagues (2003) demonstrated that pinyon
pines (Pinus edulis) vary genetically in susceptibility to herbivory from a scale insect and
a stem-borer, and that litter from more susceptible trees decomposed faster, "super-
charging" the nutrient acceleration effect of herbivores in this system. The amount of
intraspecific diversity in resistance to herbivory therefore influenced a key ecosystem
process.
Theoretical studies on the impact of variation in growth-defense tradeoffs for
communities have followed the tradition established by May (1973), focusing on the
consequences of evolution of defense strategies for the relationship between species
richness and community stability. Such work has been based on Lotka-Volterra models
with the tradeoff represented by inverse relationship between changes in interaction
coefficients α and population growth rates r, such that an innovation which reduces the
negative effect of another species also reduces population growth rates. Such work has
10
demonstrated that increased ability to allocate resources to defense can destabilize
communities (Abrams 2000), but in low diversity communities can promote stabilization
of both plant and herbivore populations (Loeuille 2010). Recent empirical evidence in
plankton communities shows that increased stability as a result of stronger allocation to
defense mechanisms is possible (Aránguiz-Acuña et al. 2010). Theoretical work has not
been advanced to link the growth-defense tradeoff in plants to ecosystem functioning.
These examples demonstrate that future work remains necessary incorporating plant
defense strategies in trophic BEF research.
In order to envision how to more generally incorporate variation in plant defense
strategies into BEF research, I make several simplifying assumptions. First, I assume that
the major tradeoff axis in plant defense strategies is between growth and defense at the
level of the individual organism; thus, variation in reproductive investment is not directly
accounted for here. Plants often exhibit this regrowth-defense tradeoff (van der Meijden
et al. 1988), and some plants regrow so successfully from grazing by ungulate herbivores
that it has been proposed that there is a class of plants for which grazing stimulates
overcompensatory growth (McNaughton 1983). However, later work demonstrated that
such overcompensation is rare and occurs mainly when interspecific competition is weak
(Belsky 1986). Regardless, it is well established that there is a continuum of responses to
herbivory, along the regrowth-defense axis (Herms & Mattson 1992; Alward & Joern
1993).
Second, I assume that this tradeoff is strongest between species, rather than
between individuals of a species, such that variation in species composition will alter the
balance of growth and defense strategies in the community. This assumption means that
11
communities may be composed mainly of "defenders", which grow slowly and lose little
biomass to herbivory (Fig. 2, Group I), mainly of "regrowers", which may lose biomass
readily to herbivory but recover quickly (Group II), or a wide range spanning both types
(Group III). The consequences of variation in these strategies can then be envisioned.
For a community of "defenders", the relationship between plant diversity and
primary production may be steeper than expected when compared to a null community, if
the moderate investment in defense mechanisms means that little biomass is removed by
herbivory. Therefore any gains in primary production attributable to an increase in
diversity (either via selection or complementarity) are kept. Conversely, under high
herbivory a great degree of resources are shifted to defense, not growth, making the BEF
relationship weaker than expected (Fig. 1.3, top panels). Communities composed of
"regrowers" would show the opposite pattern, with BEF relationships weaker than
expected under minimal herbivory, but greater than expected under high herbivory. The
latter would result from compensatory or even overcompensatory growth being the
primary strategy for responding to herbivory (Fig. 2, middle panels). Finally, considering
communities composed of a range of defense strategies, there is no clear a priori
hypothesis for how herbivory should alter the biodiversity-ecosystem functioning
relationship (Fig. 1.2, bottom panels).
Herbivore feeding preferences depend in part on the balance between nutrition
and toxicity of plant tissues. While debate remains about how to properly place
nutritional ecology in a theoretical framework (Raubenheimer et al. 2009), it is clear that
herbivores can structure plant communities, thereby altering the producer diversity and
presumably ecosystem functioning. Ideally, these hypotheses could be tested by

12
manipulating plant community composition to create experimental communities ranging
from pure "defenders", to a mix, to pure "growers". By manipulating species richness
within each of these mixes, and overlaying that with intensity of herbivory, the shape of
these relationships could be elucidated. To date no field experiment has been designed
that fits these requirements. However, in the following chapters I describe results of a
series of observational and experimental studies to first clarify what strategies exists in
grassland plant communities of Inner Mongolia, China, and also examine how intensity
of herbivory shapes the plant community assembly. An ideal next step would be to design
an experiment based on these studies with a range of community, varying the identity and
richness of species within each community type.
The B in BEF: Diversity measurement in herbivore-structured plant
communities
Extending the plant-herbivore interactions to the ecosystem level is the goal of
this review. In addition to incorporating top-down effects of herbivores on plant
communities in combination with variation in plant strategies for dealing with herbivory,
a complete trophic BEF research agenda must also be explicitly about how to connect
plant diversity with ecosystem functioning. In particular, which facet of biodiversity most
strongly influences ecosystem functioning remains a subject of debate. The limitations of
simply counting taxonomic units has long been recognized (e.g., Wilsey 2005), and in
recent years an flurry of new metrics for assessing biodiversity have been proposed,
largely using some combination of species traits to calculate a measure of functional
diversity (Petchey et al. 2009). Other noteworthy metrics include the functional group

13
richness and summarizing the evolutionary history of a community using a measure of
phylogenetic diversity. For plant communities under herbivory, how should these
different metrics perform as predictors of biodiversity-ecosystem functioning
relationships? This question is relevant because if the top-down effects of herbivores
strongly structure plant communities, then a diversity measure which reflects variation in
plant defense strategies may be more relevant to ecosystem functioning than species
richness alone.
A tradition from the earliest BEF studies has been to focus on species richness, both
in experiments and observational studies. Early criticism from other ecologists has
focused on the fact that as in experiments, the higher species richness levels were more
likely to include the species with the greatest influence on ecosystem processes by chance
alone (Huston 1997; Wardle 1999). Thus, rather than greater number of species resulting
in more effective partitioning of resources (niche complementarity), this sampling or
selection effect shows that particular species or species combinations can drive
ecosystem processes. Selection effects are common in BEF experiments, particularly for
consumer or predator diversity effects (Cardinale et al. 2006), although strong evidence
for niche complementarity exists (Hooper et al. 2005), particularly for producer diversity
effects (Spehn et al. 2005).
The predominance of selection effects in multitrophic BEF studies (Table 1) may
be resolved in part by appropriate choice of a biodiversity metric, functional diversity in
particular. Many researchers accept that the selection effect can be a legitimate biological
mechanism by which reductions in biodiversity are likely to impair ecosystem
functioning (Loreau 2000; Hector et al. 2002; Fox 2005), acting on community
14
composition at larger spatial scales (Loreau et al. 2001) or longer temporal scales (Pacala
& Tilman 2001) than niche complementarity. A growing focus on the diversity and
values of functional traits that influence ecosystem functioning, as a tool for explaining
the role of organisms in ecosystems and the ecological impacts of their loss (Petchey &
Gaston 2006).
For plant communities structured by herbivores, functional traits such as specific
leaf area (correlated with leaf toughness, a mechanical defense against herbivory) can
have reduced range (Díaz et al. 2001). Reduction in the diversity of this trait would be
revealed by a metric of functional diversity, but not species richness. In addition, the
presence of particular species which could thrive under herbivory would likely have a
unique combination of functional traits, meaning that a functional diversity metric would
capture this increase in diversity in ways relevant to ecosystem functioning.
Phylogenetic diversity has recently been proposed to be a stronger predictor of
grassland biodiversity-ecosystem functioning relationships (Cadotte et al. 2008). In that
work, Cadotte et al. (2008) conducted a meta-analysis of biodiversity-ecosystem
functioning studies, finding that phylogenetic diversity (PD) predicted the biodiversity
effect on grassland biomass accumulation stronger than species richness or functional
group richness. The authors suggested evolutionary diversification has generated trait
diversification for these species, which in turn may result in greater niche
complementarity. This suggests that PD (the distinct evolutionary history in a
community) can be an effective proxy for functional diversity, the functional trait
distinctiveness in a community). If variation in plant defense strategies is highly tied to
15
variation in evolutionary history, then PD will be a strong predictor of biodiversity-
ecosystem function relationships for plant communities under herbivory.
The use of phylogenetic diversity to predict ecosystem function assumes
phylogeny accurately represents functional differences (Maherali & Klironomos 2007).
This assumption will only be true if there is a strong phylogenetic signal in the ecological
relationships between species. Unrelated species can easily exhibit similar functional trait
phenotypes, particularly traits related to resource capture like height and photosynthetic
rate. However, for traits reflecting plant defense against herbivory there is a vast
literature on coevolutionary relationships between plants and their herbivores (Karban &
Agrawal 2002; Agrawal et al. 2006). However, such studies have historically focused on
particular pairs of plant and insect herbivore species, rather than examining how defense
traits are predicted by phylogeny across a plant community. This remains an unanswered
question.
An additional consideration with respect to phylogenetic diversity is that
knowledge of which traits are important to ecosystem functioning and access to high-
quality trait data are lacking for most species and ecosystem functions of interest; PD
could be quite valuable as a proxy for FD. Data on plant ecophysiology and life history
are copious, but data on defense strategies across communities have not been compiled.
Research in grassland communities has underscored the importance of leaf traits for net
primary production, in particular leaf mass per unit area (Garnier et al. 2004; McIntyre
2008), leaf percent nitrogen (Kahmen et al. 2006), belowground traits such as root
thickness (Craine et al. 2002) and nitrogen-fixation (Lee et al. 2003), and whole-plant
traits such as height (Díaz et al. 2007) in controlling ecosystem processes. In a meta-
16
analysis, the functional diversity of these traits was a better predictor of biodiversity
effects on grassland primary production than phylogenetic diversity, although both were
dramatic improvements over species richness or functional group richness (see Chapter
4). However, little phylogenetic signal was detected for variation in any of those traits,
suggesting that it must be variation in other traits related to plant diversity effects,
perhaps variation in plant defense strategies, which gives phylogenetic diversity such
high predictive power.
Conclusions
In order to better understand how continuing species losses will affect the world's
ecosystems, biodiversity-ecosystem functioning research should revisit its origins as a
multitrophic research framework. For terrestrial ecosystems, a long tradition of plant-
herbivore interaction work at the community level provides a basis for researchers to
incorporate top-down effects of herbivores on plant communities. Parallel research into
the causes and consequences of herbivore feeding preferences, notably on variation in
plant strategies along a growth-defense axis, provide a starting place for this effort.
Finally, in order to extend the work to the ecosystem scale, appropriate measures of plant
biodiversity need to be considered.

17
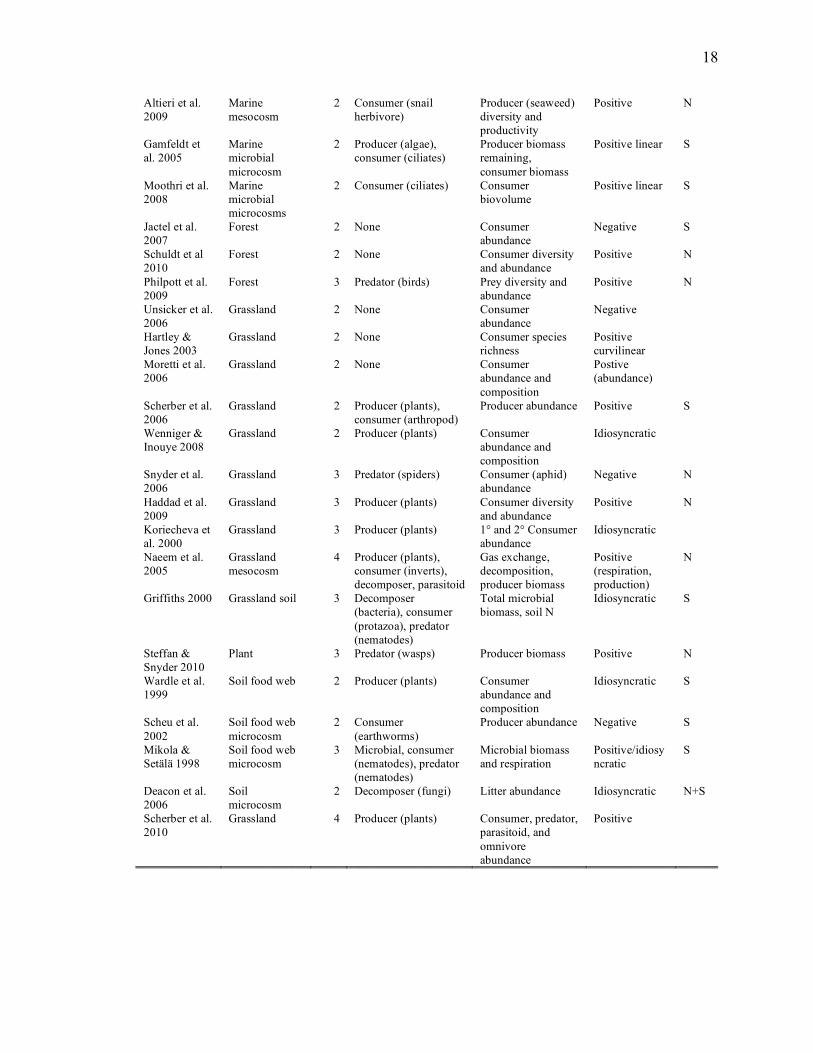
Table 1.1. Selected biodiversity-ecosystem functioning experiments across trophic levels.
Diversity-response relationships are summarized according to the aims of the study.
Proposed mechanism (Mech) summarizes what the authors concluded drove the observed
relationship, if any: N = niche, S = selection effect.
Study System Tr. levs
Trophic level manipulated
Response Diversity-response relationship
Mech
Aoki 2003 Freshwater lake
3 None Producer biomass Positive linar
Jaschinski et al 2009
Freshwater mesocosm
2 Consumer (mesograzers)
Producer diversity and biomass
Positive/Idiosyncratic
N
Downing 2005
Freshwater mesocosm
3 Producers (macrophytes), consumers (gastropods), predators (macroinvertd)
Producer and consumer abundance
Idiosyncratic S
Steiner 2001 Freshwater microcosm
2 Producer (algae), consumer (crustaceans)
Producer and consumer biomass
Negative (prod. on cons., vice versa)
S
Naeem et al. 2000
Freshwater microcosm
2 Producer (algae), decomposer (bacteria)
Resource use Positive N
Srivastava & Bell 2009
Freshwater microcosm
4 Consumer (detritivores)
Predator and other consumer diversity and abundance
Positive N
Naeem & Li 1997
Freshwater microscosm
6 Producer, decomposer, consumer
Producer biomass Positive linear N
Bastian et al. 2008
Freshwater stream
2 Leaf litter, decomposer (leaf shredding larvae)
Decomposition Idiodsyncartic S
Jonsson & Malmqvist 2000
Freshwater stream
2 Decomposer (leaf shredders)
Decomposition Positive linear N
Raberg & Kautsky 2007
Marine mesocosms
2 Consumer (invertebrates)
Producer biomass and diversity
Idiosyncratic S
Duffy et al. 2001
Marine mesocosm
2 Grazer Producer biomass consumed
Idiosyncratic S
O'Gorman et al. 2008
Marine food web
3 Predator (fish) 1° and 2° Consumer abundance
Negative (2°), positive (2°)
Bruno & O'Connor 2005
Marine food web
3 Predator (crabs, fish) Producer biomass and diversity
Negative N+S
Douglass et al. 2008
Marine food web
3 Producers consumer, predator
Abundances of each level
Negative (on graz), positive (on prod.)
N+S
Griffin et al. 2008
Marine food web
3 Predator (crabs) Resource capture rate
Positive N
Bruno et al. 2008
Marine food web mesocosm
2 Producer (algae), consumer (invertebrates, fish)
Producer and consumer biomass
Negative (cons. on prod., vice versa)
N+S
Burkpile & Hay 2008
Marine food web mesocosm
2 Consumer (fish, urchin)
Producer abundance Negative N
Byrnes et al. 2006
Marine food web mesocosm
3 Predator (crabs) Producer (kelp) biomass
Positive N
O'Connor & Bruno 2009
Marine foodweb
3 Predator (crabs, shrimp, fish)
Prey and producer abundance
Idiosyncratic S
18
Altieri et al. 2009
Marine mesocosm
2 Consumer (snail herbivore)
Producer (seaweed) diversity and productivity
Positive N
Gamfeldt et al. 2005
Marine microbial microcosm
2 Producer (algae), consumer (ciliates)
Producer biomass remaining, consumer biomass
Positive linear S
Moothri et al. 2008
Marine microbial microcosms
2 Consumer (ciliates) Consumer biovolume
Positive linear S
Jactel et al. 2007
Forest 2 None Consumer abundance
Negative S
Schuldt et al 2010
Forest 2 None Consumer diversity and abundance
Positive N
Philpott et al. 2009
Forest 3 Predator (birds) Prey diversity and abundance
Positive N
Unsicker et al. 2006
Grassland 2 None Consumer abundance
Negative
Hartley & Jones 2003
Grassland 2 None Consumer species richness
Positive curvilinear
Moretti et al. 2006
Grassland 2 None Consumer abundance and composition
Postive (abundance)
Scherber et al. 2006
Grassland 2 Producer (plants), consumer (arthropod)
Producer abundance Positive S
Wenniger & Inouye 2008
Grassland 2 Producer (plants) Consumer abundance and composition
Idiosyncratic
Snyder et al. 2006
Grassland 3 Predator (spiders) Consumer (aphid) abundance
Negative N
Haddad et al. 2009
Grassland 3 Producer (plants) Consumer diversity and abundance
Positive N
Koriecheva et al. 2000
Grassland 3 Producer (plants) 1° and 2° Consumer abundance
Idiosyncratic
Naeem et al. 2005
Grassland mesocosm
4 Producer (plants), consumer (inverts), decomposer, parasitoid
Gas exchange, decomposition, producer biomass
Positive (respiration, production)
N
Griffiths 2000 Grassland soil 3 Decomposer (bacteria), consumer (protazoa), predator (nematodes)
Total microbial biomass, soil N
Idiosyncratic S
Steffan & Snyder 2010
Plant 3 Predator (wasps) Producer biomass Positive N
Wardle et al. 1999
Soil food web 2 Producer (plants) Consumer abundance and composition
Idiosyncratic S
Scheu et al. 2002
Soil food web microcosm
2 Consumer (earthworms)
Producer abundance Negative S
Mikola & Setälä 1998
Soil food web microcosm
3 Microbial, consumer (nematodes), predator (nematodes)
Microbial biomass and respiration
Positive/idiosyncratic
S
Deacon et al. 2006
Soil microcosm
2 Decomposer (fungi) Litter abundance Idiosyncratic N+S
Scherber et al. 2010
Grassland 4 Producer (plants) Consumer, predator, parasitoid, and omnivore abundance
Positive
(Deacon et al. 2006)(Deacon et al. 2006) (Scheu et al. 2002)(Scheu et al. 2002) (Mikola & Setala 1998)(Miko la and Setala 1998) (Wardle et al. 1999)(Wardle et al. 1999) (Jactel & Brockerhoff 2007)(Jactel and Brockerhoff 2007) (Griffiths et al. 2000)(Griffiths et al. 2000) (Naeem et al. 1995)(Naeem et al. 1995) (Koricheva et al. 2000)(Koricheva et al. 2000) (Wenninger & Inouye 2008)(Wennin ger and Inouye 2008) (Morett i et al. 2006)(Moretti et al . 2006) (Aok i 2003)(Aok i 2003) (Hartley & Jones 2003)(Hartley and Jones 2003)
(Unsicker et al. 2006)(Unsicker et al. 2006) (Snyder et al. 2006)(Snyder et al. 2006) (Scherber et al. 2006)(Scherber et al. 2006a) (Moor thi et al. 2008)(Moorthi et al. 2008) (Gamfeldt et al. 2005)(Gamfeldt et al. 2005) (Byrnes et al. 2006)(Byrnes et al. 2006) (Burkepile & Hay 2008)(Burkepile and Hay 2008) (Bruno et al. 2008)(Bruno et al. 2008) (Griffin et al. 2008)(Griffin et al. 2008) (O’Gorman et al. 2008)(O’Gorman et al. 2008) (Douglass et al. 2008)(Douglass et al. 2008) (Bruno & O 'Connor 2005)(Bruno and O 'Connor 2005)
(Duffy et al. 2001)(Duffy et al. 2001) (Raberg & Kautsky 2007)(Raberg and Kautsky 2007) (Jonsson & Malmqv ist 2000)(Jonsson and Malmqv ist 2000) (Bast ian et al. 2008)(Bastian et al. 2008) (Naeem & Li 1997)(Naeem and Li 199 7) (Steiner 2001)(Steiner 2001) (Naeem et al. 2000)(Naeem et al. 2000) ( Downing 2005)(Downing(Jaschinski et al. 2009) 2005) (Philp ott et al. 2008 ; Alt ieri et al. 2009 ; O'Connor & Bruno 2009 ; Srivastava & Bell 2009; Schuld t et al. 2010; Steffan & Snyder 2010 ; Stein et al. 2010)

19
Figure 1.1. Conceptual schematic of how physiological tradeoffs in herbivores and plants
affect herbivore and plant communities in terms of biodiversity, the interaction between
herbivores and plants, and the resulting stocks of herbivore, plant, and nutrient mass. The
foci of this review are in bold: 1. top-down effects of herbivore communities on plant
biodiversity, 2. role of tradeoffs between growth and defense affecting plant communities
under herbivory, and 3. how the biodiversity of resulting plant communities affects
ecosystem functioning in terms of biomass production.
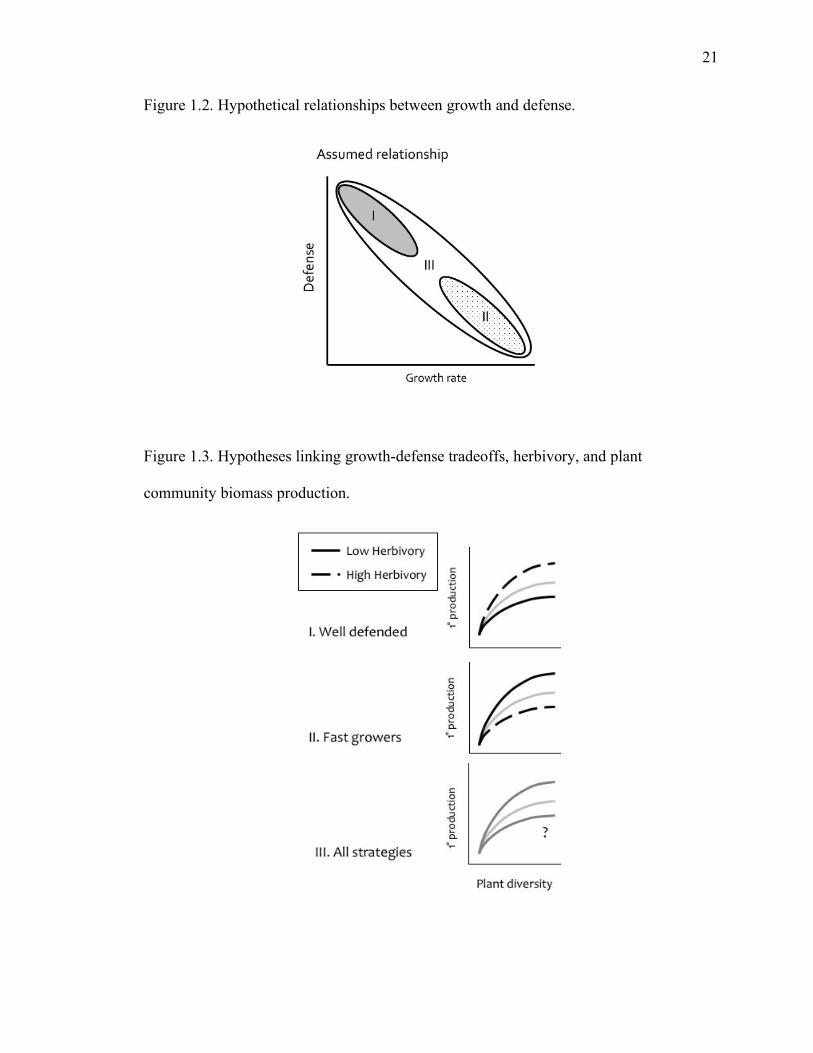
Figure 1.2. Three hypothetical cases of variation along a tradeoff of two general plant
functional traits, defense and growth. I. All species well-defended and slow-growing; II.
all species poorly-defended and fast-growing; III. wide range of allocation to defense and
growth.
Figure 1.3. Hypotheses of how variation in plant defense and herbivory interact in
determining biodiversity-ecosystem function (BEF) relationships. Light curves show
typical BEF relationships without considering the effect of either plant defense strategy
or herbivory. Black curves show hypotheses for how BEF relationships may be modified
under the three cases of variation in plant defense strategy presented in Fig. 1 and under
either low or high herbivory. For case III, no a priori hypothesis is immediately clear. All
hypotheses make the simplifying assumptions of constant resource supply, no
interactions among herbivores, only generalist herbivory, and no predators. See text for
details.

20
Figure 1.1. Conceptual schematic of growth-defense tradeoffs affecting BEF
relationships.
21
Figure 1.2. Hypothetical relationships between growth and defense.
Figure 1.3. Hypotheses linking growth-defense tradeoffs, herbivory, and plant
community biomass production.

22
CHAPTER 2. FORAGING BEHAVIOR OF A GENERALIST GRASSHOPPER,
OEDALEUS ASIATICUS, IN RESPONSE TO PLANT COMMUNITY COMPOSITION
AND PLANT TRAITS
Summary
Integrating herbivory into a biodiversity-ecosystem functioning research
framework requires assessing how top-down effects of herbivory may play out for plant
communities, namely assessing the feeding behavior of the key herbivores. Here, I use a
series of experiments to assess 1. the feeding preferences of a dominant grasshopper,
Oedaleus asiaticus on grassland plant species in Inner Mongolia, China; 2. observed
feeding behavior in the field for this grasshopper; and 3. how these preferences and
behavior relate to plant nutrient and antiherbivore characteristics.
I found that in controlled laboratory settings the grasshopper Oedaleus asiaticus
has a strong preference for a thin-leaved, short-statured plant, Cleistogenes squarrosa.
However, the preferences observed in the lab were not detectable in the field. Increases in
leaf silica of the co-dominant rhizomegrass Leymus chinensis and decreases in leaf silica
of the co-dominant bunchgrass Stipa grandis in response to herbivory, as well as the
strong avoidance of the fairly N-rich grass Achnatherum sibericum, demonstrated that
antiherbivore defenses may explain feeding preferences of grasshopper in this grassland
system. Extending this work will help to understand the top-down effects of herbivory on
grasslands, and integrate herbivory more fully into research on terrestrial biodiversity-
ecosystem functioning relationship.

23
Introduction
Translating herbivore behavior to ecosystem functioning requires an
understanding of the factors shaping foraging decisions in herbivores. That is,
understanding the effects of individual herbivores on plant communities at the local scale
is the basis for more broadly understanding how herbivores shape ecosystem functioning.
Research frameworks for investigating factors shaping the decisions of individual
herbivores fit within the field of nutritional ecology, which includes the geometric and
ecological stoichiometric frameworks (Raubenheimer et al. 2009). These research
frameworks differ in their details, but all seek to relate herbivore feeding behavior to the
search for nutrients and/or the avoidance of toxic compounds.
In order to address the question of how herbivore behavior shapes plant
community composition and structure, I investigated the feeding preferences of the band-
winged grasshopper, Oedaleus asiaticus, in Inner Mongolia, China. This research asks
the related questions: What are the feeding preferences of a dominant generalist
grasshopper in Inner Mongolia? How do feeding preferences assessed in controlled
settings compare to feeding behavior observed in the field? And how do nutritional and
toxic components of the dominant plant species related to feeding preferences of O.
asiaticus?
O. asiaticus is a large and common grasshopper in Inner Mongolia, typically
peaking in density in mid-July (Kang & Chen 1992). This species is considered a serious
economic pest and is a graminivorous generalist which separates its niche from the
forbivorous and omnivorous grasshopper species with which it coexists (Kang & Chen
1994). Substantial research efforts have been directed at understanding grasshopper

24
community and population dynamics at this site, but there has been surprisingly little
investigation into the feeding preferences of O. asiaticus in the field, a notable omission
given the importance of this species in the Inner Mongolian grasslands. O. asiaticus
To address these research questions, I conducted three experiments. First, I
evaluated feeding preferences of O. asiaticus in laboratory settings, provisioning plant
material from two species at a time out of a pool of six common species. Second, I
observed feeding behavior of O. asiaticus individuals in a range of plant communities in
the field, at both immature and mature life stages. Third, I assessed the degree of
investment in chemical defenses of selected common plant species, focusing on
investment in silica in leaf tissues, under conditions of feeding by O. asiaticus and
experimental clipping.
In order to understand the feeding preferences of O. asiaticus, determining the
nutrient and toxin concentrations of key food items is a crucial step. In response to
graminivorous grasshoppers like O. asiaticus, plants may demonstrate a range of
responses along the growth/defense tradeoff, which in turn may determine feeding
preferences. Grasses have been shown to employ both phenolics (Rhoades 1985) and
silica (Vicari & Bazely 1993) as defensive compounds in response to leaf-chewing
herbivores. Silica has been shown to be an effective anti-herbivore compound, acting
both as a mechanical defense against chewing (Massey et al. 2009) and reducing
digestibility of leaf tissues by grasshoppers (Hunt et al. 2008). Silica often represents an
inducible defense in which concentrations in plant tissues can increase after the plant is
fed upon (Massey et al. 2007a), with greater concentrations observed in plant species
which have lower growth rates (Massey et al. 2007b). In addition to avoiding defenses,

25
generalist grasshoppers also actively modify their intake of protein and carbohydrates to
maintain a balanced nutrient intake (Behmer et al. 2002). Thus, both responses to plant
defenses and plant quality shape herbivore feeding.
Compared to other grasshoppers at this site, O. asiaticus feeds on plants with a
much wider range of height (Yan & Chen 1997). Previous work on feeding preferences of
grasshoppers in Inner Mongolia has generally identified grasses as the preferred food items
of O. asiaticus (Li & Chen 1985), but has not investigated relative preferences between
these species, related these preferences to behavior in the field, or related these preferences
to plant traits. In this study, in addition to examining grasshopper response to defenses and
plant quality, I will examine relative preferences in relation to field behavior and plant traits.
Methods
Study Site
The study was carried out near the Inner Mongolia Grassland Research Station
(43°38'N, 116°42'E) of the Institute of Botany in the Chinese Academy of Sciences.
Located in the Xilin River catchment. This area has a continental, semi-arid climate, with
mean annual precipitation of 334 mm and mean annual temperature of 0.7°C. The typical
steppe ecosystem is dominated by C3 grasses, particularly the perennial rhizome grass
Leymus chinensis and the perennial bunchgrass Stipa grandis (Bai et al. 2004). Given the
relatively simple plant community structure, with fewer than 20 common plant species,
this community is an ideal test case for examining how functional traits reflect the
processes of habitat filtering or limiting similarity in structuring communities.
26
Two experiments were established to investigate the feeding preferences of the O.
asiaticus. A third experiment was designed to evaluate the underlying mechanisms
driving the feeding behavior in response to plant growth and defense strategies.
Experiment 1: Pairwise preferences
To establish the relative feeding preferences of O. asiaticus, I first addressed
relative preferences in a pairwise comparison. I sought to establish the rank order and the
relative preference for the dominant plant species. I assessed feeding preferences of O.
asiaticus in an experiment where female grasshoppers were provided with small, equal
samples of a pair of plant species, drawn from a pool of six species: Achnatherum
sibericum, Agropyron cristatum, Carex duriuscula, Cleistogenes squarrosa, Leymus
chinensis, and Stipa grandis.
Ten replicates of the 15 pairwise combinations of 6 dominant species were run
over three days in 2009. Leaf tissue was collected from the field site by clipping plants at
the ground and transporting bundled plants of each species back to the field station. Fresh
tissue was collected late afternoon on the day prior to the day of each trial. Sections of
leaf tissue approximately 5 cm were cut and weighed on a fine-scale balance, then
inserted vertically into a covered Petri dish with small holes drilled for plant samples.
This experimental set-up ensured that equal portions of leaf tissue of each species were
available, with freshness partially maintained by the water in the Petri dishes, and with
plant samples arranged vertically and with equal distance from one another. Fifth-instar
black morph female grasshoppers were collected from the field and maintained in cages

27
in the field near the field station. Grasshoppers were weighed and kept without food for
12 hours prior to the feeding trials to minimize the effect of prior feeding.
Analysis of feeding preference was carried out on a dry-mass basis. Concurrent
with each set of feeding trials, five samples of fresh leaf tissue for each species of equal
size to those used in the trials were weighed and placed in dishes adjacent to the feeding
arenas. Then these samples were re-weighed at the end of the feeding trials (ca. 7 hrs).
These weights were used to establish the average percent moisture for each species,
allowing the conversion of the fresh leaf weights used in trials to dry weights. Relative
feeding preference could then be assessed several ways. First, absolute total leaf mass
consumed was assessed using a one-way analysis of variance (ANOVA) with focal
species as the treatment variable. Second, relative preference of a focal species with
respect to each comparison species was assessed using general linear models. Models
were of the form Pref = f(Focal/Comparison), where Pref is the relative preference of the
focal species, expressed as the difference in the percent dry mass consumed of the focal
species versus the comparison species:
Pref = % DM Focal Sp Eaten - % DM Comparison Sp Eaten
calculated for each experimental pair. The nested explanatory term allows comparison of
the focal species relative to each of the five other comparison species. Finally, leaf trait
data collected from the field (see Chapter 3) were used to test how feeding preferences
relate to difference in leaf element concentrations, leaf thickness, and other traits
considered influential for grasshopper feeding.

28
Experiment 2: Feeding behavior in the field
Using an experimental setup designed to test the effects of herbivory on plant
community composition, I observed the behavior of 62 individual grasshoppers, both
green (solitary) and black (gregarious) color morphs, in both immature and mature life
stages. The two color morphs demonstrate significantly different metabolic rates and
jumping ability (Cease et al. 2010), and may therefore be expected to have different
effects on plant communities. Specifically, the larger, gregarious black morph may
consume more and less selectively compared to the smaller, solitary green morph.
Grasshoppers were placed in 0.25 m2 x 1 m tall mesh cages in placed across a range of
initial plant community compositions in June 2009. With one male and one female
grasshopper in each cage, individuals could be tracked throughout the experiment. All
activity was noted every minute for 30 minutes for a given cage, focusing on which plant
species were eaten and how long each feeding bout lasted. A total of 87 observation
hours were logged on a cage basis over eight days in July 2009. Observers were shielded
by cloth coverings on the cage, and sat immobile for at least three minutes prior to
observations, to minimize the disturbance on grasshopper behavior.
Analysis of feeding behavior in the field was carried out in several ways. First,
total time eating, walking, or still was tallied by age (5th instar or adult) and sex. These
were examined with respect to air temperature and precipitation data from a weather
station approximately 250 m from the experimental cages. Second, total time eating any
plant species was analyzed by age and sex across all cages. Third, to account for variation
in plant community composition, general linear models with Poisson errors were used to
assess time spent eating each of the six plant species. Poisson link was necessary due to

29
the abundance of zeros in the observational data; zero-inflated Poisson modesl did not
perform significantly better. For plant species i, the models take the form
Time Eating Species i = f(Stipa + Leymus + Agropyron + Carex + Cleistogenes)
where grasshopper feeding time is measured in minitues and relative abundance of the six
commonly observed plant species are predictors. Models using the first two principal
components of the entire community composition matrix were also assessed, but did not
differ from the models used here, and were more difficult to interpret.
Experiment 3: Feeding, clipping, and Si addition
To assess interactions between feeding behavior and defense strategies I
conducted an experiment in 2008 using the two dominant plant species, the bunchgrass
Leymus chinensis and the needlegrass Stipa grandis, in the grassland communities
surrounding the Inner Mongolia Grassland Ecosystem Research Station. Plants were
transplanted from areas surrounding the field station into 4-L pots enclosed by mesh
netting which was held up by circular wire frames 1 m tall. Three treatments were
applied: (1) O. asiaticus where present or absetn, (2) mechanical wounding which
mimicked grasshopper feeding versus no wounding, and (3) silica added in the form of
SiOH4 at 150 mg / L (Massey et al. 2007b) or no silica added. Twelve replicates were
established for each treatment, for each species, for a total of 12 replicates x 2 species x 6
treatments = 144 pots. Silica solution was added four times over the course of the 57-day
experiment. Mechanical wounding was accomplished by clipping half of all leaf material
in a pot, and was carried out three times over the experiment. Grasshoppers were fourth-
instar black morphs (see Chapter 3) of O. asiaticus collected from nearby fields, with one
30
male and one female added per grasshopper treatment pot. Enclosures were censused
weekly, and additional grasshoppers were added as necessary. A total of nine
grasshoppers of the original 96 (2 grasshopper treatments x 12 replicates x 2
grasshoppers per pot x 2 species) were replaced. Pots were watered twice weekly.
I additionally sampled leaf tissue of these two grasses in across an experimental
sheep grazing intensity. Since 2005, a Sino-German collaboration has been
experimentally manipulating sheep grazing intensity at the field scale near the IMGERS
field site. This experiment, "Matter Fluxes in Grasslands of Inner Mongolia as Influenced
by Stocking Rate" (MAGIM, http://magim.net), is aimed at elucidating how rangeland
management affects grassland biotic and abiotic processes. Plants were sampled from two
replicate fields with 0, 4.5, and 9 sheep per hectare. Full descriptions of the experiment,
including details on how sheep densities were maintained in fields, can be found in
Schönbach et al. (2009). Leaf material was ground in a Retsch MM 301 ball mill. Silica
concentrations were assessed ICP-MS at the Utah State University Analytical Laboratory;
this technique also assessed the concentraitons of phosphorus and potassium, among
other elements. Carbon and nitrogen concentrations were assessed using with a Perkin
Elmer 2400 Series II Elemental Analyzer at the Lamont-Doherty Earth Observatory of
Columbia University.

31
Results
Experiment 1: Pairwise preferences
Ranking plant species by mean quantity of leaf tissue eaten by grasshoppers, the
short-statured C4 plant Cleistogenes squarrosa was the most preferred food item (Fig.
2.1). The tall, robust grass Achnatherum sibericum was by far the least preferred.
Looking more in depth, the relative preference of each species can be assessed in the
context of which comparison species was present. More leaf tissue of Cleistogenes was
eaten than any of its comparison plant species (Fig. 2.2), significantly so for all except
Stipa or Agropyron (Table 2.1). The sedge Carex was significantly less preferred than
either of the grasses Cleistogenes or Agropyron, and still more preferred than the grass
Achnatherum. The previously presumed preferred item, Leymus chinensis, was only
preferred over Achnatherum, and was still less preferred than Cleistogenes (Table 2.1,
Fig 2.2). Of seven leaf traits examined, only leaf carbon concentration and leaf nitrogen
concentration explained significant variation in the feeding preferences. Both greater C
and greater N lead to lower feeding preference (Fig. 2.3).
Experiment 2: Feeding behavior in the field
Field observations found that Oedaleus asiaticus spends 2.2 min / hr feeding,
which did not vary significantly by sex or instar. Feeding bouts lasted an average of 4.5
min, and both feeding and walking activity was strongly dependent on ambient air
temperature. Grasshoppers were active nearly 70% of the time when air temperature was
between 25-29°C, but only approximately 50% of the time when air temperature was 16-

32
18°C. Activity tended to decrease with rainfall, despite little variation in precipitation
during observations (data not shown).
Across all cages, which varied in plant community composition, Stipa was both
the most common plant species and the most frequent food item. Cleistogenes, the
preferred food item in the pairwise preferences experiment, was consumed roughly as
often as expected, based on its relative abundance. Accounting for plant community
composition, the abundance of each of the six plant species observed to be consumed
(Stipa, Leymus, Carex, Cleistogenes, Agropyron, and Koeleria) was a significant factor in
determining the amount of that species eaten. Only for two species were the abundances
of other species important factors in determining how much time was spent eating it: for
Agropyron, abundance of Leymus increased time spent eating Agropyron, while for
Cleistogenes, abundance of Stipa decreased time spent eating Cleistogenes (Table 2.2).
Experiment 3: Feeding, clipping and Si addition
In the pot experiment on the interactive effects of silica addition and herbivory on
the dominant rhizomegrass Leymus and dominant needlegrass Stipa, nearly all of the
transplanted individuals of Stipa died. Therefore, only results for Leymus are shown.
Aboveground biomass at harvest was significantly reduced by grasshopper herbivory, but
not by the mechanical clipping treatment. Silica addition did not alter the biomass at
harvest (Table 2.3). Silica concentration in the leaf tissue of Leymus was significantly
increased by the combination of grasshopper herbivory and silica addition, but not by
either factor alone (Table 2.3, Fig. 2.5). Silica concentrations correlated negatively with
C, N, and P on a mass basis. Silica did not vary significantly with maximum
33
photosynthetic rate or leaf mass per unit area, and tended to positively covary with
aboveground biomass at harvest (Fig. 2.6).
Over a survey of fields where sheep stocking rate was experimentally
manipulated, high sheep grazing significantly increased silica concentrations in the leaf
tissue of Leymus, while significantly decreasing it in the leaf tissue of Stipa (Fig 2.7).
Discussion
Results show that the rhizomegrass Leymus chinensis, the assumed preferred food
item, is in fact not highly preferred, and when the bunchgrass Stipa grandis is present the
grasshopper Oedaleus asiaticus will feed on it. The results from Experiment 1
demonstrate that feeding preferences for O. asiaticus do exist within the graminoids, in
particular with the inconspicuous, thin-leaved C4 grass Cleistogenes squarrosa always
being the preferred food item. However, when feeding behavior was directly observed in
the field, these preferences are overwhelmed by the stronger tendency of O. asiaticus to
allocate feeding effort mainly according to the relative abundance of graminoids present,
regardless of the preferences observed in the laboratory settings. Focusing on the
rhizomegrass Leymus chinensis, there does appear to be an increase in silica
concentration in response to herbivory by both grasshoppers and sheep, which may
explain in part why this dominant and conspicuous grass is less preferred.
In investigating which leaf traits explain the differences in feeding preference,
only two traits were significant of the seven examined (leaf C and N concentration, C:N,
leaf mass per unit area [LMA], maximum photosynthetic rate, height, leaf:stem ratio).
Greater C concentration in leaf tissue lead to significantly less preference, as does greater
34
N concentration (Fig 2.3). This pattern is largely driven by Achnatherum sibericum,
which has high C, high N, and is strongly avoided by O. asiaticus. Examining relative
preferences after removing Achnatherum, relative preferences could not be explained by
nutrient concentrations for these plants. C:N ratio was not a significant predictor of
relative preferences, surprisingly. Leaf thickness, as measured by leaf mass per unit area,
is closely related to measures of leaf toughness (Díaz et al. 2001), but also did not affect
relative preferences among the graminoids. Among the common plants of the Inner
Mongolian grasslands, the LMA of the most preferred food item in the pairwise
comparisons, Cleistogenes squarrosa, is the lowest of all the graminoids (72 g/m2).
However, the LMA of the most commonly consumed food item in the field, Stipa
grandis, is among the highest of all the plants measured (167 g/m2), with only an Iris and
an Allium species having thicker leaves (data from Chapter 3). Therefore, factors other
than leaf N concentration or this simple measure of leaf thickness drive feeding
preferences.
Why is Achnatherum so strikingly avoided? The grass does not have dramatically
higher C (46.7%) and has the highest N concentrations (1.98%) of the graminoid species
investigated here. Other research at the same site has confirmed the strong avoidance of
Achnatherum despite no clear difference in nutritional content of the grass compared to
other graminoids (Zhang et al, in press). Anecdotally, Achnatherum is commonly
observed in large clumps in grasslands heavily grazed by sheep, even when all other
grasses are consumed. This species would appear to be a key candidate for investigation
of secondary compounds, such as alkaloids, phenolics, or endophytic fungi which may be
35
deterring both insect and sheep herbivores. N-rich compounds such as alkaloids would be
the primary focus.
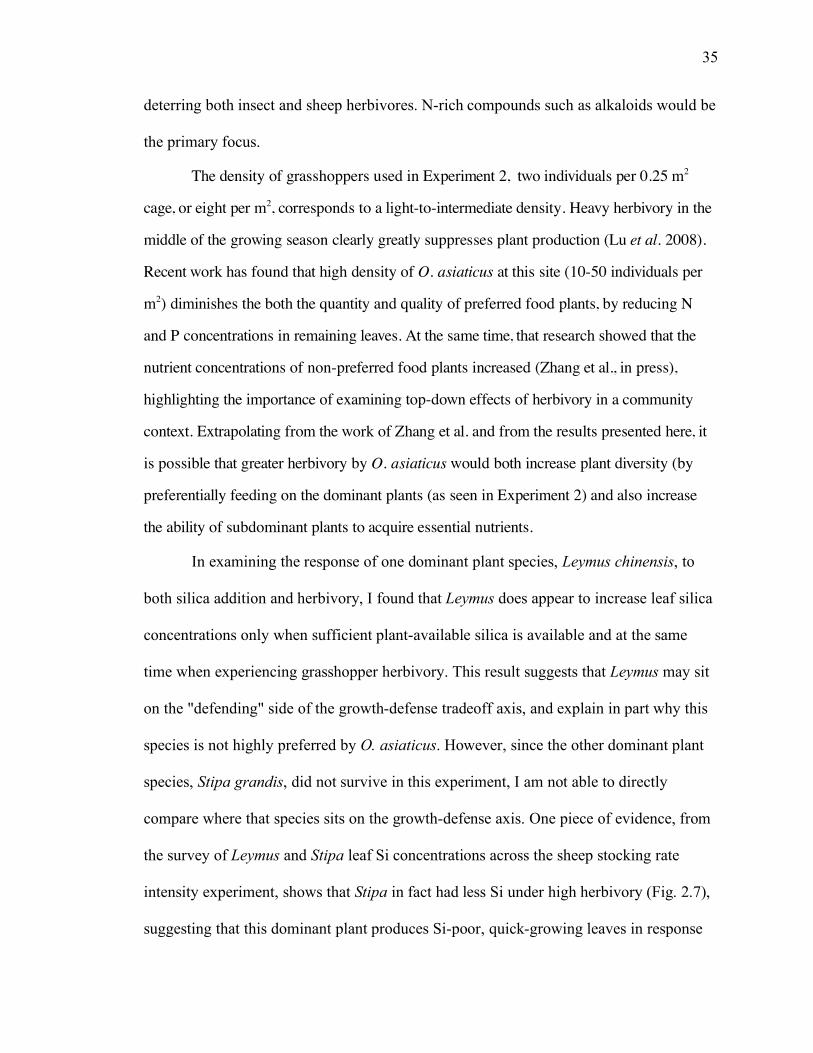
The density of grasshoppers used in Experiment 2, two individuals per 0.25 m2
cage, or eight per m2, corresponds to a light-to-intermediate density. Heavy herbivory in the
middle of the growing season clearly greatly suppresses plant production (Lu et al. 2008).
Recent work has found that high density of O. asiaticus at this site (10-50 individuals per
m2) diminishes the both the quantity and quality of preferred food plants, by reducing N
and P concentrations in remaining leaves. At the same time, that research showed that the
nutrient concentrations of non-preferred food plants increased (Zhang et al., in press),
highlighting the importance of examining top-down effects of herbivory in a community
context. Extrapolating from the work of Zhang et al. and from the results presented here, it
is possible that greater herbivory by O. asiaticus would both increase plant diversity (by
preferentially feeding on the dominant plants (as seen in Experiment 2) and also increase
the ability of subdominant plants to acquire essential nutrients.
In examining the response of one dominant plant species, Leymus chinensis, to
both silica addition and herbivory, I found that Leymus does appear to increase leaf silica
concentrations only when sufficient plant-available silica is available and at the same
time when experiencing grasshopper herbivory. This result suggests that Leymus may sit
on the "defending" side of the growth-defense tradeoff axis, and explain in part why this
species is not highly preferred by O. asiaticus. However, since the other dominant plant
species, Stipa grandis, did not survive in this experiment, I am not able to directly
compare where that species sits on the growth-defense axis. One piece of evidence, from
the survey of Leymus and Stipa leaf Si concentrations across the sheep stocking rate
intensity experiment, shows that Stipa in fact had less Si under high herbivory (Fig. 2.7),
suggesting that this dominant plant produces Si-poor, quick-growing leaves in response

36
to herbivory, placing it at the opposite side of the growth-defense tradeoff axis from
Leymus. Extrapolating these results, it is possible that the extremes of this axis represent
the most successful strategies in the Inner Mongolian grasslands. If that is the case, and
given that herbivory by O. asiaticus in the field was observed principally on whatever
species happened to be dominant in a community, herbivory may be maintaining the
variation along this growth-defense axis.
The focal grasshopper species, Oedaleus asiaticus, is of particular interest both
because it is a large and common grasshopper at in Inner Mongolia (Kang & Chen 1992).
This species is considered a serious economic pest, and is a graminivorous generalist,
which separates its niche from the several forbivorous and omnivorous grasshopper
species with which it coexists (Kang & Chen 1994). This species has been hypothesized
to be form swarm under high density. However, while the black color morph exhibits
substantially greater mass, higher metabolic rates, and is found at higher densities than
the green morph, neither morph has signifcant flying ability, and thus this species is
unlikely to be a locust species (Cease et al. 2010).
The results presented here demonstrate that a combination of approaches is
necessary for assessing the how the top-down effects of herbivory may play out for plant
communities. A controlled experiment demonstrated that the grasshopper Oedaleus
asiaticus has a strong preference for a thin-leaved, short-statured plant, Cleistogenes
squarrosa, but the preferences observed in the lab were not detectable in the field.
Increase in leaf silica of Leymus chinensis and decrease in leaf silica of Stipa grandis in
response to herbivory, as well as the strong avoidance of the fairly N-rich grass
Achnatherum sibericum, demonstrated that antiherbivore defenses may explain feeding

37
preferences of grasshopper in this grassland system. Extending this work will help to the
top-down effects of herbivory on grasslands, and integrate herbivory more fully into
research on terrestrial biodiversity-ecosystem functioning relationship.
Acknowledgments
Arianne Cease, Shuguang Hao, and Guangming Zhang contributed to the experimental
designs, grasshopper collection, and to understanding aspects of grasshopper life history.
Georgia Hart and Xing Jing provided invaluable assistance in carrying out these
experiments. Yongfei Bai generously provided space within the 10-year fenced fields and
in the areas surrounding the Inner Mongolian Grassland Ecosystem Research Station to
carry out these experiments.
Tables and Figures
Table 2.1. Feeding preferences of Oedaleus asiaticus in a controlled environment.
Values shown are Tukey post-hoc tests for an analysis of variance of the percent of the
focal species eaten, with respect to each comparison species; positive values indicate
greater preference of the first species in the pair. Significant differences highlighted in
bold. Ac = Achnatherum sibericum, Ag = Agropyron cristatum, Ca = Carex duriuscula,
Cl = Cleistogenes squarrosa, L = Leymus, S = Stipa grandis.
Pair Difference Lower
bound
Upper
bound
P
Ag-Ac 78.73 53.42 104.04 <0.001
Ca-Ac 52.27 26.12 78.42 <0.001

38
Ca-Ag -26.46 -51.95 -0.96 0.037
Cl-Ac 83.35 57.39 109.32 <0.001
Cl-Ag 4.63 -20.68 29.94 0.995
Cl-Ca 31.08 4.93 57.23 0.010
L-Ac 53.95 27.98 79.92 <0.001
L-Ag -24.77 -50.08 0.53 0.059
L-Ca 1.68 -24.47 27.83 1.000
L-Cl -29.40 -55.37 -3.44 0.016
S-Ac 59.46 33.31 85.62 <0.001
S-Ag -19.26 -44.76 6.24 0.254
S-Ca 7.19 -19.14 33.53 0.970
S-Cl -23.89 -50.04 2.26 0.095
S-L 5.51 -20.64 31.66 0.990
Table 2.2. Summary of general linear model of observed time spent eating one focal
species, Cleistogenes squarrosa, by the grasshopper Oedaleus asiaticus, with respect to
the composition of dominant plant species.
Factor Estimate SE z p
Intercept -1.97 1.11 -1.78 0.075
Stipa -2.99 1.52 -1.97 0.049
Leymus -0.35 2.03 -0.17 0.862
Agropyron 0.96 1.44 0.67 0.504
Cleistogenes 10.93 4.92 2.22 0.026
Carex -8.97 5.26 -1.71 0.088
Table 2.3. Summary of general linear model of Leymus chinensis to experimental silica
addition, crossed with mechanical wounding or grasshopper herbivory in semi-natural
conditions. Response variables are aboveground biomass at harvest after 57 days and
silica concentration in leaf tissue. Estimates show change with respect to the control.
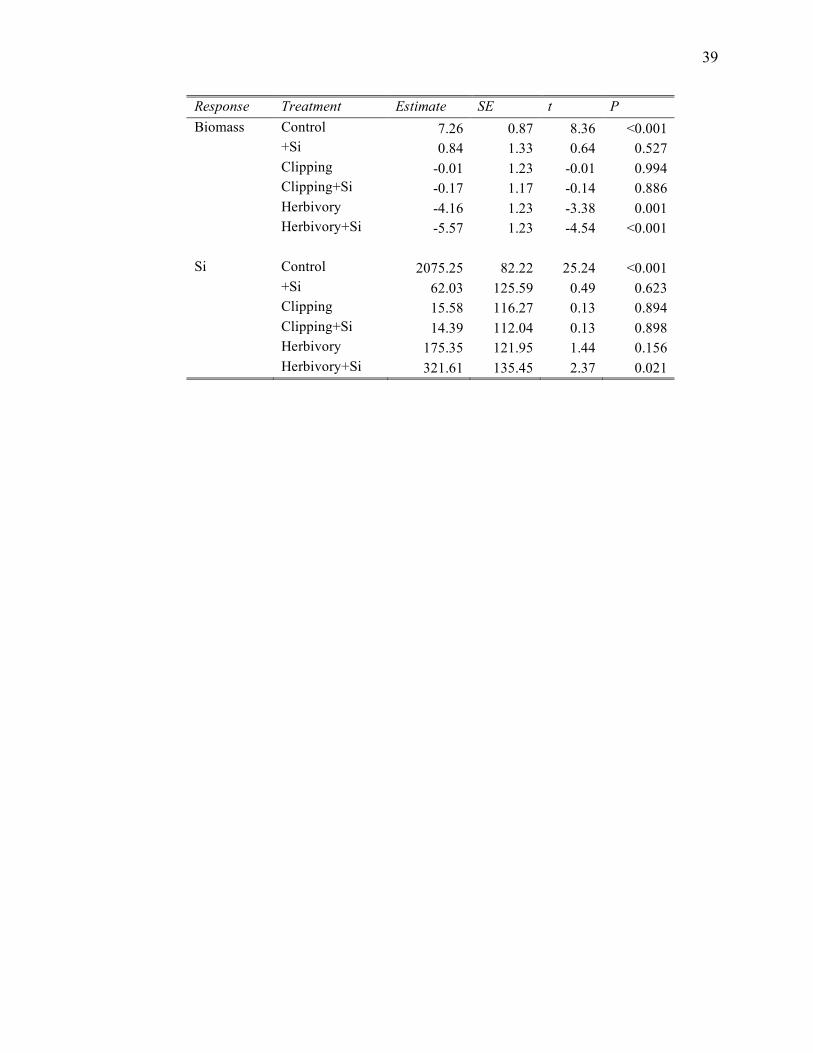
39
Response Treatment Estimate SE t P Biomass Control 7.26 0.87 8.36 <0.001 +Si 0.84 1.33 0.64 0.527 Clipping -0.01 1.23 -0.01 0.994 Clipping+Si -0.17 1.17 -0.14 0.886 Herbivory -4.16 1.23 -3.38 0.001 Herbivory+Si -5.57 1.23 -4.54 <0.001 Si Control 2075.25 82.22 25.24 <0.001 +Si 62.03 125.59 0.49 0.623 Clipping 15.58 116.27 0.13 0.894 Clipping+Si 14.39 112.04 0.13 0.898 Herbivory 175.35 121.95 1.44 0.156 Herbivory+Si 321.61 135.45 2.37 0.021
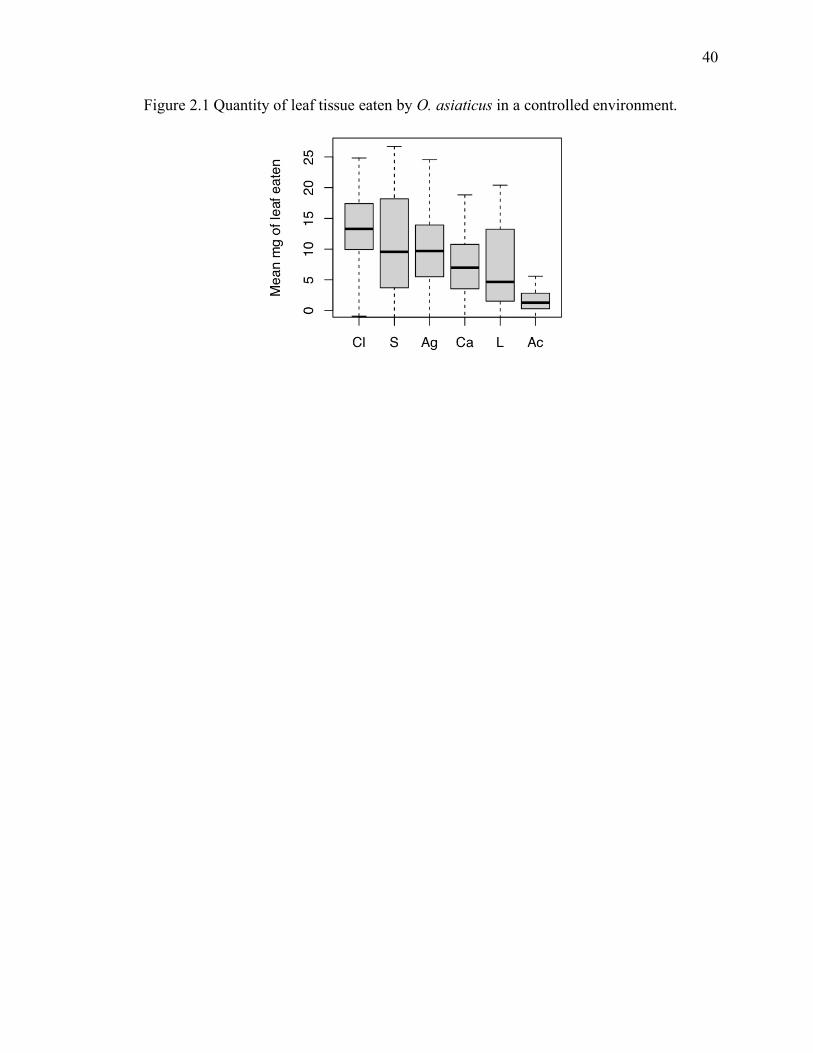
40
Figure 2.1 Quantity of leaf tissue eaten by O. asiaticus in a controlled environment.

41
Figure 2.2 Relative consumption preference of common plants of Inner Mongolia by O.
asiaticus.
Fig. 2.3. Relative difference in consumption preference for each of six plant species by O.
asiaticus compared to difference in carbon and nitrogen concentrations in leaf tissue.
Sign of difference values in consumption preference is arbitrary for each species pair, but
values are aligned with the pair in the same order for differences in element
concentrations.

42
Figure 2.4. Observed feeding behavior of O. asiaticus in the field.
Figure 2.5. Silica concentrations in leaf tissue of Leymus chinensis under experimental Si
addition crossed with mechanical clipping and grasshopper feeding.
43
Fig. 2.6. Correlation between leaf traits, as well as aboveground biomass, under
experimental Si addition.
Leaf elements and biomass log-transformed. Amax = Maximum photosynthetic rate.

44
Fig. 2.7. Silica content of the two dominant grasses, the rhizomegrass Leymus chinensis
and the bunchgrass Stipa grandis in response to sheep stocking rate.
45
CHAPTER 3. HIGH NICHE OVERLAP IN GRASSLAND PLANT COMMUNITIES
IRRESPECTIVE OF HERBIVORY IN INNER MONGOLIA, CHINA
Summary
The relative importance of limiting similarity versus habitat filtering in
community assembly has been a focal point in research on species coexistence, with new
approaches recently developed to take advantage of functional trait data. Because
herbivory in grasslands strongly influences plant species community composition and
structure, elucidating the role of herbivores in assembly processes has the potential to
resolve how biodiversity is maintained in such communities where resource use and other
axes of life history variation may be difficult to capture.
I examined plant community assembly under manipulations of grasshopper or
sheep herbivory using an experimental, trait-based approach in the grasslands of Inner
Mongolia, China. I investigated changes in plant community composition and structure
under short-term grasshopper grazing and long-term sheep grazing at different intensities,
and directly measured of niche overlap based on plant functional traits using a novel
niche overlap index based on convex hull volume. Intersections of hull volumes for
species, weighted by abundance, were made based on extensive ecophysiological and
morphological trait measurements.
Niche overlap was significantly larger than expected under a null model in all
treatments of both experiments, indicating strong environmental filtering with no
evidence for limiting similarity. No effect of grasshopper herbivory at the neighborhood
46
scale or sheep stocking rate at landscape scale was detected on niche overlap. However,
niche overlap fell both within the growing season in the grasshopper experiment and in
the four years between census periods in the sheep grazing experiment. Environmental
filtering was the dominant processes influencing assembly in these communities. There is
no evidence for herbivory acting to strengthen environmental filtering. The surprisingly
strong signal of environmental filtering, irrespective of herbivory, reflects the high
functional similarity of these communities.
Introduction
Identifying the processes influencing the assembly of species into communities
has long been a major goal of community ecology. In particular, understanding the
relative importance of environmental filtering and limiting similarity in governing
community assembly remains a major challenge. Environmental filtering refers to
exclusion of those species from the regional species pool that lack traits necessary to
persist in the local environment. Limiting similarity refers to interspecific competition
eliminating species whose resource use traits are too similar. While the relative balance
between these two factors in determining which species coexist has been explored for a
long time (MacArthur & Levins 1967), recent efforts have focused on the use of
functional traits, particularly in plants, to detect patterns of clumping or dispersion in
traits as indicators of the ecological factors shaping communities (Weiher et al. 1998;
Grime 2006).
The influence of herbivory on the balance between the processes of
environmental filtering and limiting similarity has not been addressed, despite the clear
47
importance of herbivory in influencing the composition and structure of plant
communities (Huntly 1991; Carson & Root 2000). If generalist herbivores in these
communities act to remove dominant species, and if dominant species are similar in trait
values, the resulting communities may be composed of subdominants with a greater
range and less overlap in functional traits. Thus generalist herbivores could act to reduce
the signal of environmental filtering. In contrast, if generalist herbivores act as an
additional "filter" by removing palatable and nutritious plants first, the resulting
communities may be composed of species all with similar traits. Thus in this case,
generalist herbivory could act to enhance the signal of environmental filtering.
To a large extent, the challenge in addressing the question of community
assembly stems from the large number of factors that influence community composition
and structure, and the difficulty of identifying which factors are dominant among them.
Thus, tackling the question of community assembly in a natural setting is ideally done
with relatively simple system. The Inner Mongolian grasslands provide one such case: in
this system, strong environmental factors, namely a short growing season with limited
precipitation, interact with strong biotic factors, namely competition among a limted
number of plant species for light and space. In addition, these grasslands are managed for
sheep grazing and are also under pressure from grasshopper herbivory.
Developing and employing measures of how similar species are with respect to
functional traits has become the predominant method for addressing the relative
importance of limiting similarity and environmental filtering in structuring communities
(Weiher & Keddy 1995). In plant communities, this approach has demonstrated that both
limiting similarity and habitat filtering can act to structure plant communities, depending

48
on the spatial scale examined (Kraft et al. 2008). Nevertheless, other studies based on
fewer traits have found no signal of either process in structuring old field plant
communities (Schamp et al. 2007). In this study I propose a measure of similarity based
on convex hulls (see below) that takes into account trait correlations at the individual
level and the abundance of species within communities.
This study asks two questions: 1. what is the relative importance of limiting
similarity and environmental filtering in structuring plant communities in the Inner
Mongolian grassland? and 2. to what extent does herbivory alter the importance of these
processes in structuring plant communities? This study also presents a novel metric of
community similarity, based on convex hull volume (D. Bunker, D. Flynn, S. Naeem, in
prep.; Cornwell et al. 2006), which directly measures the overlap in functional traits
related to resource acquisition, taking into account intraspecific trait variability and
abundance at the plot scale. I take advantage of two experiments testing the impact of
herbivores on plant community structure. The two experiments differ in spatial and
temporal scale, as well as identity of the herbivores.
Materials and methods
Study Site
The study was carried out near the Inner Mongolia Grassland Research Station
(43°38'N, 116°42'E) of the Institute of Botany in the Chinese Academy of Sciences.
Located in the Xilin River catchment, this area has a continental, semi-arid climate, with
mean annual precipitation of 334 mm and mean annual temperature of 0.7°C. The typical

49
steppe ecosystem is dominated by C3 grasses, particularly the perennial rhizome grass
Leymus chinensis and the perennial bunchgrass Stipa grandis (Bai et al. 2004). Given the
relatively simple plant community structure, with fewer than 20 common plant species,
this community well-suited for examining how functional traits reflect the processes of
habitat filtering or limiting similarity in structuring communities. This system is strongly
precipitation-limited, with aboveground net primary productivity rising sharply with
precipitation even in sites with widely divergent species composition (Bai et al. 2004; Bai
et al. 2008). In addition, there is evidence that species richness covaries across spatial
scales with productivity in this region (Bai et al. 2007). Biodiversity-ecosystem
functioning research in these grasslands has revealed that temporal complementarity in
plant populations drives a significant biodiversity-stability relationship (Bai et al. 2004),
highlighting the role of temporal niche separation in explaining maximum abundances of
the dominant functional groups. The Inner Mongolian grasslands thus provide a test
system to disentangle the relative importance of environmental filtering and limiting
similarity in community assembly, and how herbivory alters the balance of these forces at
different spatial and temporal scales.
Plant Communities
I took advantage of two existing experiments evaluating the effects of herbivores
on plant communities in Inner Mongolia, China. This study focuses solely on the aspects
of niche overlap resulting from these herbivory treatments, not on the overall patterns of
plant community structure or responses of particular species to the herbivory treatments,
which are presented elsewhere (Flynn et al. in prep, Wang et al. in prep).
50
Grasshopper herbivory experiment, neighborhood-scale. In the first experiment, 200 0.25
m2 plant neighborhoods located in several blocks in an experimental field fenced for 10
years to exclude sheep grazing were surveyed in early June 2009. Here, I use the term
"neighborhood" because the scale of the plots was small enough to assume that
individuals would likely interact. Individuals were counted and relative cover estimated
for all species, and average height per species was measured. Following the survey, on
June 22 2009 neighborhoods were enclosed in 0.25 m2 diameter x 1 m nylon mesh cages
to exclude grasshoppers and other insect herbivores. The blocks of plots were arrayed
over a wide range of plant community compositions, resulting in communities with
richnesses of 3 - 10 species and a range of compositions, including communities
dominated variously by the bunchgrass Stipa grandis and the rhizomegrass Leymus
chinensis (Table 1).
The grasshopper manipulation involved the addition of two individuals of the
generalist Oedaleus asiaticus, one male and one female 3rd instar, to a subset of the cages
(see below). For this species, sexing even early instars is straightforward, as ovipositors
are distinct by the 3rd instar. O. asiaticus is a large and common grasshopper at in Inner
Mongolia, typically peaking in density in mid-July (Kang & Chen 1992). This species is
considered a serious economic pest, and is a graminivorous generalist, which separates its
niche from the several forbivorous and omnivorous grasshopper species with which it
coexists (Kang & Chen 1994). All individuals used in the experiment were sweep-netted
from a heavily-grazed field site approximately 5 km from the experimental site. There
were four treatments, with 50 cages each: black grasshopper (the black color morph of O.
asiaticus, which is the larger, "gregarious" form), green grasshopper (the smaller,
51
"solitary" form), clipped, and controls. Thus a total of 200 grasshoppers was used in the
study, 100 of each color morph. Treatments were assigned to rows of cages within blocks
in a regular pattern. For the purpose of this study, the two color morphs are assumed to
represent different intensities of grasshopper grazing, as the black morph has not only
larger body size (femur length, abdomen length, and weight), but also a higher metabolic
rate (Cease et al. 2010). Experimental clipping was performed immediately after caging,
in which all plant material was cut to ground level and left within the cages. The clipping
treatment mimicked severe herbivory by removing all aboveground biomass, and was
additionally designed to measure the regrowth ability of these plant species for a parallel
study (Flynn et al., in prep.).
All cages were harvested to the ground on July 28 2009. Aboveground biomass
was sorted to species, separated into leaf and stem material, and oven dried at 60°C for at
least 24 hr before being weighed. Grasshoppers were collected, weighed, and dried for
future analysis. Leaf material from grasshopper experimental cages was further separated
into leaf tissue with obvious chewing damage and undamaged tissue.
Sheep stocking rate experiment, landscape scale. Since 2005, a Sino-German
collaboration has been experimentally manipulating sheep grazing intensity at the field
scale near the IMGERS field site. This experiment, "Matter Fluxes in Grasslands of Inner
Mongolia as Influenced by Stocking Rate" (MAGIM, http://magim.net), is aimed at
elucidating how rangeland management affects grassland biotic and abiotic processes.
For the purpose of this study, plant community composition data from the first full year
of the experiment, 2005, and from 2009 were used from replicate fields with 0, 1.5, 3,
52
4.5, 6, 7.5, and 9 sheep per hectare. In 2005 plant community composition data were
pooled from the three replicate fields per treatment, while plot-level data were available
for 2009, resulting in a total of 76 plots. Full descriptions of the experiment, including
details on how sheep densities were maintained in fields, can be found in Schönbach et
al. (2009).
Plant Trait Measurements
I collected trait data for 370 individuals, spanning 18 species and six families,
across the growing seasons of 2008 and 2009 (Table 1). In 2008 and 2009, traits
measured were leaf mass per unit area (LMA), height, maximum photosynthetic rate
(Amax), water use efficiency, C and N concentrations, length of longest leaf, and biomass
of leaves and stems (Table 2). Standard methods were used for the measurement of each
of these traits (Cornelissen et al. 2003). Plants were selected from communities adjacent
to the grasshopper study cages of each block, and sampled throughout the growing
season. Measurements were made on a minimum of five individuals of every species
observed in the grasshopper study cages. All measurements were conducted on an
individual basis, where an individual constituted one ramet for rhizomatous plants and
one bunch for bunchgrasses. In the field, Amax was measured on a selected leaf or small
group of leaves for thin-leaved grasses, using a Li-Cor 6400 Portable Photosynthesis
System (Lincoln, Nebraska) with a block temperature of 25°C and CO2 of 400 ppm; five
measures were made after carbon exchange stabilized. Plant height and length of longest
leaf were measured in the field, and then each individual was placed in a paper envelope,
inside a plastic bag to maintain moisture content. Leaf area was scanned immediately

53
upon return from the field, and all aboveground material was dried at 60°C for 24 hr prior
to weighing. Leaf material was ground in a Retsch MM 301 ball mill and analyzed for C
and N with a Perkin Elmer 2400 Series II Elemental Analyzer at the Lamont-Doherty
Earth Observatory of Columbia University.
Research using functional traits include those investigating community assembly
processes (Ackerly & Cornwell 2007; Kraft et al. 2008; Cornwell & Ackerly 2009),
community responses to land use change (Flynn et al. 2009; Laliberté et al. 2009), or
potential for communities to affect ecosystem properties (Chapter 4; Clark et al., in
review; Griffin et al. 2009). In all of these studies, the traits selected and the number of
traits used critically influence the outcome of the analysis. The set of nine traits used in
this study (Table 2) were chosen to reflect above-ground resource acquisition and general
life history strategies. If other trait data had been available, such as root:shoot ratio or
seed size, the results may have demonstrated different magnitudes of niche overlap, by
reflecting other aspects of the niche, in particular belowground processes, which are not
addressed by the current study. Leaf mean area, photosynthetic rate, and leaf nitrogen
concentration in particular tend to covary along a "leaf economics spectrum", reflecting
variation from fast carbon gain and leaf turnover to slow carbon gain and longer leaf life
span (Wright et al. 2004; Poorter et al. 2009). Being tied closely with plant life history
strategies, these traits represent good candidates for examining the balance of limiting
similarity and environmental filtering in shaping plant communities.
54
Measure of Niche Overlap
Many measures of habitat filtering and limiting similarity have been developed
recently based on trait overlap (Stubbs & Wilson 2004; Mouillot et al. 2005; Cornwell et
al. 2006). An ideal measure of niche overlap based on traits would be multivariate, taking
into account abundance of species in communities and their intraspecific variation. Here I
present a new metric of niche overlap, based on the concept of convex hull volume.
Convex hulls describe the minimum volume required to contain a set of points in
multivariate space and represent the multivariate range of a set of data. Applying this
technique from computational geometry to species traits allows the calculation of the
"volume of trait space occupied by species in a community" (Cornwell et al. 2006). In
ecology, this method has been applied to measures of plant trait diversity in oldfields
(Schamp et al. 2007) and in response to disturbance (Pausas & Verdu 2008). Convex hull
volume has been shown to have a higher degree of sensitivity for discriminating among
community assembly processes than all other proposed measures using artificial data sets
(Mouchet et al. 2010).
Our extension of convex hull volume differs from previously described methods
by 1. accounting for intraspecific variation using individual-level trait data, 2. accounting
for species abundances, and 3. being able to calculate the niche overlap of species in a
community as the amount of hull volume intersection between species. This assumes that
the traits chosen reflect the entirety of the relevant aspects of the niche. While previous
studies of functional trait diversity have been almost exclusively based on mean values
by species (but see Cianciaruso et al. 2009), here I use trait values at the individual level,
without aggregating to species mean, to more fully capture the intraspecific variation in
55
plant functional traits. In this formulation, hull volumes are calculated for species within
a community, and with individuals as the vertices of species hulls. To account for
abundance, I weight the trait values of species present in a given community by the log of
their abundance (count data on stems for plant species for grasshopper experiment, dry
aboveground biomass for sheep experiment). Thus, for a given species, a hull volume
will be calculated separately for each community, based on the same set of trait values for
that species but a unique value for the abundance. While this abundance-weighting
procedure has been shown to result in an index that has low power for predicting the
biodiversity effect in an experimental biodiversity-ecosystem function study (C. Clark, D.
Flynn, P. Reich, and B. Butterfield, in review), its utility in evaluating community
assembly processes has not been evaluated previously. The abundance-weighted convex
hull volume incorporates the aspects of functional richness, functional evenness, and
functional divergence as defined by Mason et al. (2005). The net species volume reflects
the total amount of functional space occupied by the assemblage (i.e., functional richness,
or the multivariate range in trait values of a ccommunity), while the relative volume
reflects the evenness of the distribution of species in functional space and the niche
overlap is related to the amount of functional divergence in the community.
To distinguish between expected niche overlap based on the number of species
present and the observed values, I ran null models in which a random draw of species
from the pool of species present in each experiment was performed 1001 times at each
species richness level, and at each census time period (i.e., initial grasshopper
communities, grasshopper communities at harvest, 2005 sheep communities, and 2009
sheep communities). Observed overlap values for each plot were compared to those of

56
null communities with the same number of species with trait data available (i.e., realized
species richness given the trait data set of this study). Abundances were assigned from
random uniform draws with replacement of the observed abundances within each
experiment at each time step. Significant deviations from expectation were determined at
α = 0.05. All calculations, null models, and analyses were performed in R v2.11.1 (R
Development Core Team 2010). Convex hull intersections were performed using the
program polymake (Gawrilow & Joswig 2000).
Results
Significant correlations at the individual level were observed for many pairs of
traits (Appendix S1). In particular, plant size traits (height, length of longest leaf, and
aboveground biomass) correlated positively with leaf C concentration (r = 0.38, 0.60, and
0.29, respectively, for log-transformed values). LMA, leaf N concentration, and
maximum photosynthetic capacity on an area basis (Aarea), the three traits composing the
"leaf economics spectrum" (Wright et al. 2004), were not all tightly related, with LMA
not significantly correlated to either N or Amax. However, given the overall degree of
correlation between traits, principal components analysis was successful at reducing the
number of axes, with the first three principal components accounting for 64% of the
variation in the 9 traits used (Appendix S2). The first principal component reflects
metabolic rate (Amax, N, and conductance) versus plant size, while the second reflects leaf
structure (C and LMA), and the third reflects plant size (area, aboveground mass, LMA,
and longest leaf).
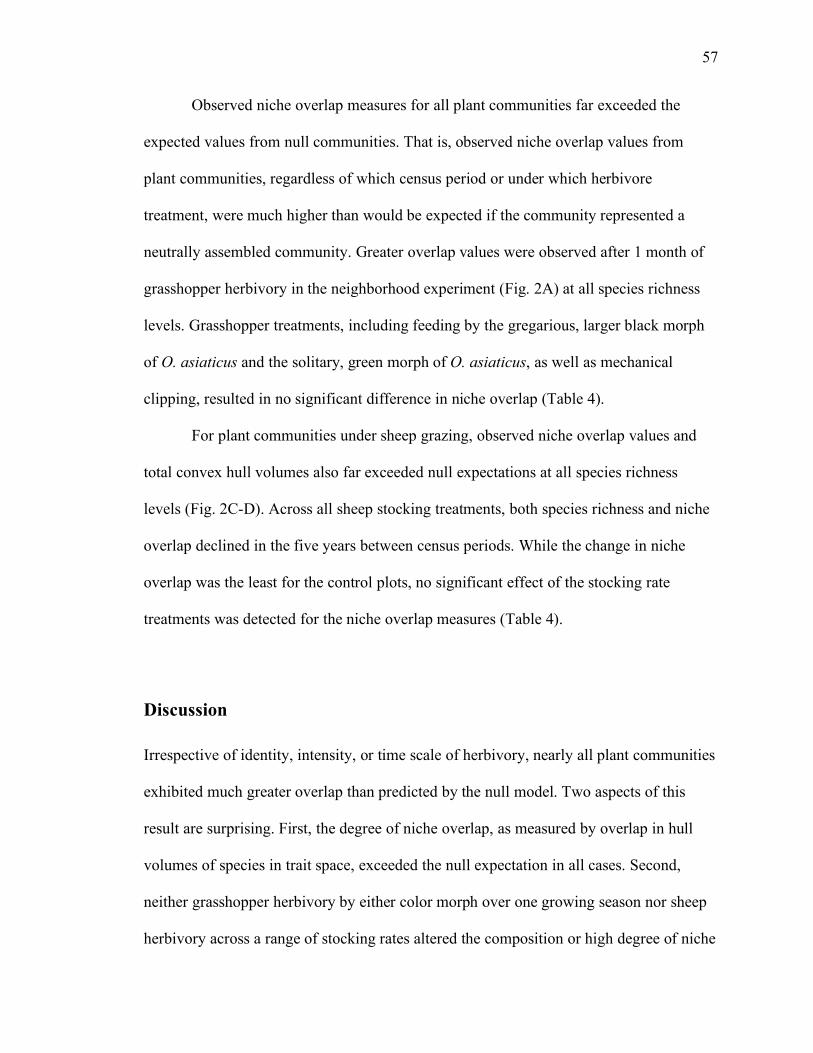
57
Observed niche overlap measures for all plant communities far exceeded the
expected values from null communities. That is, observed niche overlap values from
plant communities, regardless of which census period or under which herbivore
treatment, were much higher than would be expected if the community represented a
neutrally assembled community. Greater overlap values were observed after 1 month of
grasshopper herbivory in the neighborhood experiment (Fig. 2A) at all species richness
levels. Grasshopper treatments, including feeding by the gregarious, larger black morph
of O. asiaticus and the solitary, green morph of O. asiaticus, as well as mechanical
clipping, resulted in no significant difference in niche overlap (Table 4).
For plant communities under sheep grazing, observed niche overlap values and
total convex hull volumes also far exceeded null expectations at all species richness
levels (Fig. 2C-D). Across all sheep stocking treatments, both species richness and niche
overlap declined in the five years between census periods. While the change in niche
overlap was the least for the control plots, no significant effect of the stocking rate
treatments was detected for the niche overlap measures (Table 4).
Discussion
Irrespective of identity, intensity, or time scale of herbivory, nearly all plant communities
exhibited much greater overlap than predicted by the null model. Two aspects of this
result are surprising. First, the degree of niche overlap, as measured by overlap in hull
volumes of species in trait space, exceeded the null expectation in all cases. Second,
neither grasshopper herbivory by either color morph over one growing season nor sheep
herbivory across a range of stocking rates altered the composition or high degree of niche

58
overlap in the plant communities. Thus, generalist herbivory neither enhanced nor
reduced the strong signal of environmental filtering in the assembly of these
communities.
In addition to the choice of traits, the choice of niche overlap metric can also have
important implications. Functional diversity indicies have been developed to address two
issues in community ecology: predicting changes in ecosystem function (largely focused
on aboveground biomass in grasslands), and detecting the imprint of different community
assembly processes. Convex hull volume and its abundance-weighted variation have been
shown to be surprisingly poor predictors of grassland aboveground biomass in a multi-
index comparison (Clark et al., in review), yet the same index emerged as the most
powerful in detecting processes of community assembly (Mouchet et al. 2010). Indices
based on the multivariate range of traits, like convex hull volume, may be more
appropriate for addressing community assembly than predicting changes in ecosystem
functioning. In all cases, understanding the advantages and limitations of each index of
functional diversity is crucial (Petchey et al. 2009).
Calculating niche overlap has a long history in ecology, but recent advances in
compilation of functional traits and in computing power together have allowed for a
range of new approaches to this issue. In the context of this study, I are most interested in
resource niche overlap, as represented by functional traits. As the functional traits chosen
here are assumed to reflect the ability of grassland plants to efficiently compete for light,
water, and nutrients, the degree of similarity in net resource use, accounting for all of
these factors simultaneously. Mouchet and colleagues (2010) reviewed the currently
popular functional diversity metrics in part for their utility in discriminating between

59
different community assembly processes leading to clumped or overdispersed trait
patterns, which have long been assumed to correspond to the dominance of limiting
similarity or environmental filtering (e.g., Weiher et al. 1998; Rabosky et al. 2007). Their
finding that convex hull volume has high power to discriminate between contrasting
community assembly processes gives support for the current study.
Our questions concern how specific niche dimensions can reveal the relative roles of
environmental filtering and limiting similarity in species persistence rather than questions
about phylogenetic similarity and environmental filtering and limiting similarity. In
contrast to the present study, phylogenetic methods frequently been used to assess
community assembly processes, often finding evidence for phylogenetic overdispersion,
which has been interpreted as evidence of limiting similarity. Such studies have generally
found that at small scales communities are more overdispersed than expected, consistent
with limiting similarity at the neighborhood level, but that communities are more
clustered than expected at larger scales, consistent with environmental filtering
dominating at the landscape level (Cavender-Bares et al. 2006; Swenson et al. 2007;
Cadotte et al. 2009b). Here, however, I focus on functional traits, rather than
phylogenetic similarity, to directly assess whether these functional traits are the axes of
variation important to community assembly. Functional traits have the potential to
provide insights into specific dimensions of a species' niche, whereas phylogenetic
measures reflect a broader range of niche dimensions.
Direct effects of herbivory on plant functional traits were not assessed here, since
the trait sampling was destructive and was thus carried out in undisturbed plots
surrounding the experimental plots. Previous work has shown increases in specific leaf

60
area (SLA, the inverse of LMA) in these sites for both Leymus and Stipa after two years
of defoliation (Schiborra et al. 2009). In addition, grazing by O. asiaticus at this same
study site has been shown to eliminate low-N, high C:N host plants, leaving behind high-
N, low C:N plants (Zhang et al., in review). It is possible that variation in the degree of
response to herbivory could modify the degree of realized niche overlap, for example by
leading to differences in investment in defense versus growth. However, the limited
change in trait composition of communities under either grasshopper or sheep herbivory
suggests that such direct effects of herbivores on trait phenotypes may not overcome the
high similarity in trait composition, but future work would be needed to address the direct
effects of herbivory on plant traits related to resource niche overlap.
The high overlap in the resource niche, as reflected by the convex hull volume
metric used in this study, demonstrates that limiting similarity does not account for the
coexistence of the grassland plant species investigated here. Temporal separation in the
timing of peak biomass has previously been shown to be a major mechanism promoting
coexistence of the dominant plant species in this study region (Bai et al. 2004). The
results presented here highlight the potential importance of temporal niche separation,
given the high resource niche overlap. A similar study found no evidence for limiting
similarity in plant communities undergoing low-intensity disturbance (Thompson et al.
2010). Intriguingly, grassland plant species with high stoichiometric homeostasis (i.e.,
limited variation in tissue nutrient ratios despite variation in soil nutrient availability)
have been shown to be the more dominant species in this region of Inner Mongolia (Yu et
al. 2010). It is possible that plant species coexistance in this region is determined more by
the ability for multiple species to maintain steady tissue nutrient ratios despite variation

61
in nutrient availability, rather than segregation of resources in a niche complementarity
perspective.
Niche complementarity, which is based in part on the idea that species have a
minimum degree of differentiation in functional traits, has been taken to be the key
process underpinning positive biodiversity-ecosystem functioning relationships (Hooper
et al. 2005). Thus, our results present a conundrum: given the evidence that there is low
degree of separation in niche space at the neighborhood scale, why is niche
complementarity such a powerful explanatory factor in biodiversity-ecosystem
functioning relationships? Further work should address the question of identifying which
traits most accurately reflect the effects of species on ecosystem functioning, with
increased attention to belowground traits, as well as which traits most accurately reflect
the response of species to the forces of environmental filtering and limiting similarity.
Acknowledgements
Many thanks to YF Bai, F Taube, HW Wang, and P Schönbach for access to the MAGIM
sheep grazing experiment data. Thanks to G Hart and X Jing for field assistance and to D
Bunker for convex hull code. This research was supported by a National Science
Foundation Graduate Research Fellowship to DFBF and National Science Foundation
grant to J Wu, J Elser, and S Naeem.
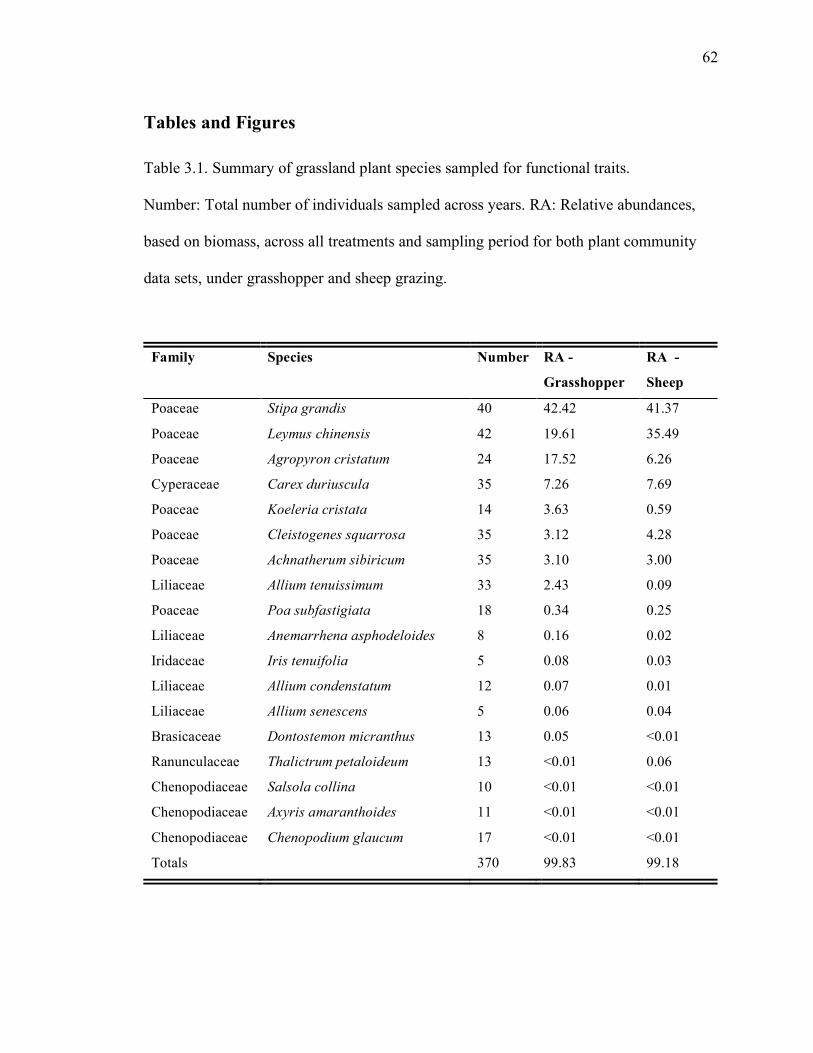
62
Tables and Figures
Table 3.1. Summary of grassland plant species sampled for functional traits.
Number: Total number of individuals sampled across years. RA: Relative abundances,
based on biomass, across all treatments and sampling period for both plant community
data sets, under grasshopper and sheep grazing.
Family Species Number RA -
Grasshopper
RA -
Sheep
Poaceae Stipa grandis 40 42.42 41.37
Poaceae Leymus chinensis 42 19.61 35.49
Poaceae Agropyron cristatum 24 17.52 6.26
Cyperaceae Carex duriuscula 35 7.26 7.69
Poaceae Koeleria cristata 14 3.63 0.59
Poaceae Cleistogenes squarrosa 35 3.12 4.28
Poaceae Achnatherum sibiricum 35 3.10 3.00
Liliaceae Allium tenuissimum 33 2.43 0.09
Poaceae Poa subfastigiata 18 0.34 0.25
Liliaceae Anemarrhena asphodeloides 8 0.16 0.02
Iridaceae Iris tenuifolia 5 0.08 0.03
Liliaceae Allium condenstatum 12 0.07 0.01
Liliaceae Allium senescens 5 0.06 0.04
Brasicaceae Dontostemon micranthus 13 0.05 <0.01
Ranunculaceae Thalictrum petaloideum 13 <0.01 0.06
Chenopodiaceae Salsola collina 10 <0.01 <0.01
Chenopodiaceae Axyris amaranthoides 11 <0.01 <0.01
Chenopodiaceae Chenopodium glaucum 17 <0.01 <0.01
Totals 370 99.83 99.18

63
Table 3.2. Summary of trait data. LMA: Leaf mass per unit area.
Table 3.3. Summary of community data. Average species richness shown for each
herbivory treatment, by experiment and time period. Number of plots are shown in
parentheses.
Communities Treatments Time periods
Initial - June Harvest - July
Grasshopper Control 5.52 (50) 5.78 (50)
Black 5.30 (50) 5.52 (50)
Green 5.76 (50) 5.94 (50)
Clip 5.62 (50) 5.76 (50)
Sheep Sheep/ha 2005 2009
0 10.0 (2) 7.1 (8)
1.5 15.5 (2) 6.0 (14)
4 14.0 (2) 5.1 (8)
4.5 13.5 (2) 5.4 (8)
6 16.5 (2) 5.6 (8)
7.5 15.0 (2) 5.5 (8)
9 14.0 (2) 5.6 (8)
Trait N Mean SD Range
Height (cm) 348 28.85 12.56 3.7-69.1
Longest Leaf (cm) 348 16.23 10.36 1.03-40.8
Aboveground Weight (g DW) 332 0.34 0.51 0.01-6.39
Area (cm2) 343 1.30 0.63 0.3-5.29
LMA (g m-2) 320 102.49 58.48 17.6-437.6
C% 188 44.50 3.42 34.2-53.3
N% 188 2.09 0.71 0.83-5.18
Amax (µmol CO2 m-2 s-1) 312 10.46 9.25 0-71.67
Conductance (mol H2O m-2 s-1) 312 0.08 0.07 0-0.55

64
Table 3.4. Summary of mixed-effects models for niche overlap. No effect of either
grasshopper herbivory at the neighborhood scale or sheep herbivory at the landscape
scale was detectable. In both cases, niche overlap values changed substantially between
the census periods.
Experiment Treatment Estimate SE df t P
Control 2.36 0.16 199 14.69 <0.001 Grasshopper herbivory
Black -0.01 0.22 196 -0.03 0.975
Green -0.19 0.22 196 -0.90 0.371
Clip -0.27 0.22 196 -1.28 0.204
Time 0.99 0.10 199 9.73 <0.001
Control 516.61 183.53 55 2.81 0.007 Sheep grazing
1.5 0.04 0.68 55 0.06 0.955
3 -0.73 0.76 55 -0.96 0.344
4.5 -1.14 0.76 55 -1.50 0.140
6 0.11 0.76 55 0.14 0.888
7.5 -0.33 0.76 55 -0.44 0.664
9 -0.48 0.76 55 -0.63 0.533
Year -0.26 0.09 13 -2.80 0.015

65
Figure Legends
Figure 3.1. Conceptual diagram demonstrating the two modifications to the convex hull
volume method introduced in this study. Upper panels show either substantial (A) or no
(B) niche overlap, as measured by the intersection in convex hull volumes of two species.
In both cases the total volume (CHV) is similar. Niche axes could be trait values or as in
this study, principal components from multiple trait values. Lower panels show the same
hypothetical communities, but with hull volumes for species adjusted by relative
abundances. Species 1 and 3 are dominant and thus hull volumes are expanded, while
species 2 and 4 are minor components of the community, and thus have reduced hull
volumes.
Figure 3.2. Niche overlap (A-C) and total convex hull volume (B-D) of plant
neighborhoods under short-term grasshopper herbivory (top panels) and long-term sheep
grazing (bottom panels) by species richness. For both experiments, both observed niche
overlap values and total convex hull volumes far exceeded null expectations at all species
richness levels. For the plant communities under grasshopper herbivory, across
treatments significantly greater overlap was observed at harvest. For plant communities
under sheep grazing, across treatments both species richness and niche overlap fell in the
five years between census periods.
Figure 3.3. Niche overlap of plant communities under short-term grasshopper herbivory
(top panel) and long-term sheep grazing (bottom panel) by experimental treatment. For
both experiments, niche overlap was not significantly altered by herbivory or grazing

66
intensity experiments. Over the course of the growing season, niche overlap increased in
the communities under grasshopper herbivory, while over the course of several years,
both species richness and niche overlap decreased in the communities under sheep
grazing.
Figure 3.1. Conceptual diagram of the abundance-weighted convex hull.

67
Figure 3.2. Niche overlap and functional richness of plant communites under herbivory.
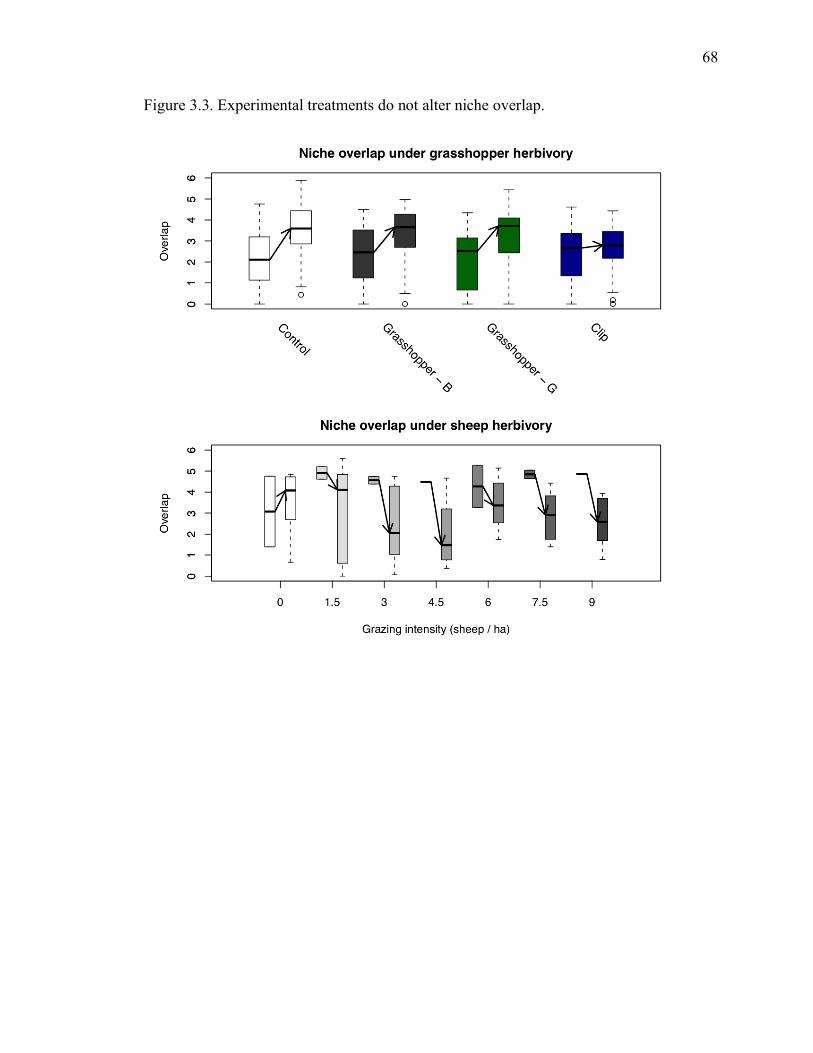
68
Figure 3.3. Experimental treatments do not alter niche overlap.

CHAPTER 4. FUNCTIONAL AND PHYLOGENETIC DIVERSITY AS PREDICTORS
OF BIODIVERSITY-ECOSYSTEM FUNCTION RELATIONSHIPS
Summary
How closely does variability in ecologically-important traits reflect evolutionary
divergence? The use of phylogenetic diversity (PD) to predict biodiversity effects on
ecosystem functioning, and more generally the use of phylogenetic information in
community ecology, depends in part on the answer to this question. However,
comparisons of the predictive power of phylogenetic and functional diversity have not
been conducted across a range of experiments. I addressed this question in 29 grassland
plant experiments, where detailed trait data are available for many species. Functional
trait variation was only partially related to phylogenetic distances between species, and
the resulting FD values therefore correlate only partially with PD. Despite these
differences, FD and PD predicted biodiversity effects across all experiments with similar
strength, including in subsets excluding plots with legumes and focusing on fertilization
experiments. Two- and three-trait combinations of the five traits used here (percent leaf
nitrogen, height, specific root length, leaf mass per unit area, and N-fixation) resulted in
the FD values with the greatest predictive power. Both PD and FD can be valuable
predictors of the effect of biodiversity on ecosystem functioning.
70
Introduction
Substantial experimental evidence exists for the positive influence of biodiversity
on ecosystem functioning, especially in grasslands, with a focus on aboveground plant
biomass production (Balvanera et al. 2006; Duffy 2009). However, which facets of
biodiversity most strongly influence ecosystem functioning remains a subject of debate.
Recent studies have suggested that phylogenetic diversity (PD, the distinct evolutionary
history in a community) can be used as a proxy for these measures of functional diversity
(FD, the functional trait distinctiveness in a community); this relationship between PD
and FD is premised on the reasonable assumption that evolutionary diversification has
generated trait diversification, which in turn may result in greater niche complementarity.
This theory has been supported by a meta-analysis of biodiversity-ecosystem functioning
studies, finding that phylogenetic diversity (PD) predicted plant biomass accumulation
stronger than species richness or functional group richness (Cadotte et al. 2008).
Two issues arise in the use of phylogenetic diversity to predict ecosystem
functioning, one important to community ecology in general and one specific to grassland
biodiversity-ecosystem function research. First, the use of PD to predict ecosystem
function assumes phylogeny represents functional differences relevant to a particular
ecosystem function (Maherali & Klironomos 2007). This assumption will hold if there is
a strong phylogenetic signal in the traits important for determining ecosystem
functioning, or in other words that phylogenetic niche conservatism is high for the traits
driving community interactions, an assumption central to much recent work at the
intersection of evolutionary biology and community ecology (e.g., Cavender-Bares et al.
2009). However, while ample evidence for this premise exists for certain traits (e.g.,

71
wood density,Chave et al. 2006), a recent study found little correlation between changes
in mammal body size variation and changes in phylogenetic diversity (Fritz & Purvis
2010), and phylogeny does not always influence competition (Cahill et al. 2008) or niche
structure (Silvertown et al. 2006) in plants. Among the traits that drive grassland plant
biomass accumulation, coevolved relationships between N-fixing bacteria or with
pathogens exhibit strong phylogenetic signal, but such a signal cannot be assumed for all
traits. Directly testing for phylogenetic signal in functional trait variation in the context of
ecosystem functioning is crucial for determining whether PD can be an effective proxy
for FD.
Second, since knowledge of which traits are important to ecosystem functioning
and access to high-quality trait data are lacking for most species and ecosystem functions
of interest, PD would be quite valuable as a proxy for FD. Grassland biodiversity-
ecosystem functioning experiments represent the best case for using plant traits to predict
aboveground biomass production. Data on grassland plant ecophysiology and life history
are copious, although rarely compiled. Research in grassland communities has
underscored the importance of leaf traits such as leaf mass per unit area (Garnier et al.
2004) and leaf percent nitrogen (Kahmen et al. 2006), belowground traits such as root
thickness (Craine et al. 2002) and nitrogen fixation (Lee et al. 2003), and whole-plant
traits such as height (Díaz et al. 2007) in controlling ecosystem processes. Thus, FD and
PD should be directly compared in predicting biodiversity effects, and how functional
differences map onto phylogenies should be examined.
72
Methods
I compiled data from 29 experiments with 1,721 polycultures and 174 species
from 11 publications (Naeem et al. 1996; Tilman et al. 1996; Tilman et al. 1997; Naeem
et al. 1999; Dukes 2001; Reich et al. 2001; Fridley 2002; Fridley 2003; Dimitrakopoulos
& Schmid 2004; Spehn et al. 2005; Lanta & Lepš 2006). For each polyculture, I
calculated phylogenetic diversity (PD), functional diversity (FD), species richness (S),
and functional group richness (FGR). For the latter, I followed Cadotte et al. in assigning
species to one of five groups: Nitrogen fixers, woody species, C3 grasses, C4 grasses, and
nonnitrogen-fixing forbs.
Phylogenetic and Functional Diversity
I calculated PD from the molecular phylogeny of Cadotte et al. (2008), which
covered 110 of the species in the meta-analysis, using data for congeners in several cases.
In addition, I also a calculated PD from a phylogeny extracted from the supertree of
Davies et al. (2004) using Phylomatic (Webb & Donoghue 2005,
http://www.phylodiversity.net), which covered all 121 of the species in the meta-analysis,
but with much less phylogenetic resolution. I used the phylogenetic diversity measure PD
used by Cadotte et al., which is the sum of the branch lengths for the species present in a
community. This metric is based on the PD developed by Faith (1992), which differs
from the present index by always including the root node. For the supertree-based
phylogeny, branch lengths were based on the angiosperm-wide divergence dates,
interpolated for undated nodes using the branch length adjustment algorithm in the
software Phylocom (Webb et al. 2008). The PD values calculated from these two
73
phylogenies were highly correlated (r2 = 0.964), but yielded different model comparison
results.
Calculating functional diversity requires several key decisions. I used the metric
FD proposed by Petchey & Gaston (2002) because it exactly parallels PD, accommodates
a variety of data types, and has been widely applied as a measure of functional diversity.
Which and how many traits are used to calculate FD are the most critical questions in this
analysis. I selected a small number of traits known to be important for biomass
production in grasslands and for which data are widely available. These traits were leaf
mass per unit area (LMA), plant height, leaf percent nitrogen (%N), specific root length
(SRL, a measure of root thickness), and whether the plant supports root nodules capable
of biological nitrogen fixation (Table 2). Continuous data were rescaled to center on 0
with an s.d. of 1. I calculated FD values from all 26 combinations of 2-5 traits for each
polyculture, focusing the results on the FD with the best predictive power for a given
analysis and the FD with all five traits.
FD requires calculating the multivariate distance between each pair of species
based on their functional traits; I used Gower distances to accommodate both the
continuous (LMA, N, height, SRL) and binary data (N-fixation) (Podani & Schmera
2006). Clustering was performed using the unweighted pair group method with arithmetic
means, which gave the highest cophenetic correlation with the original trait distances
(0.89) of many clustering algorithms. Trait data came from individual studies (e.g.,
Craine et al. 2001), published compilations (de Faria et al. 1989; Wright et al. 2004), the
LEDA database (Kleyer et al. 2008), reference texts (Grime et al. 1988; Gleason &
Cronquist 1991), and unpublished data compilations (D. Bunker).

74
Analysis
For each polyculture, I calculated the net biodiversity effect on aboveground
biomass production as the log ratio of the biomass in polyculture (yp) to the mean
biomass of the constituent species grown in monoculture (
!
ym ):
!
LRmean = ln(yp / ym )
(Cardinale et al. 2006). Since not all experiments had every species grown in
monoculture, LRmean could only be calculated for 1,433 of the polycultures (see Table S1
for data summary). When using PD values calculated from the molecular phylogeny,
additional plots were excluded because this phylogeny did not cover all species, yielding
1,088 plots.
I assessed the relative importance of each diversity metric in predicting LRmean
using single-variable mixed effects models. I further assessed the predictive power of the
best functional diversity metric in combination with phylogenetic diversity, to test
whether the two types of diversity in combination would yield greater predictive power
than either alone. Model parameters were estimated by restricted likelihood estimation,
and compared by Akaike weights. Goodness-of-fit for these models was assessed by R2
of observed and model-fitted LRmean values. Fourteen outliers identified from a
Bonferroni 2-sided test on Studentized residuals were removed. I examined two subsets
of the data set, separately examining the diversity metrics in experimental units that 1)
did not include legumes, and 2) were experimentally fertilized. Legume presence is an
important factor in many grassland biodiversity experiments (e.g., Marquard et al. 2009),
and biodiversity-ecosystem function relationships can vary depending on soil fertility

75
conditions (Reich et al. 2001; Lanta & Leps 2007), so these subsets allowed us to
compare these different aspects of biodiversity under different conditions.
In order to account for the complex covariations among the alternative measures
of biodiversity (Fig. 2, Fig. S3), I also employed structural equation modeling (SEM).
Both the PD and FD metrics used here are highly dependent on species richness. The
models tested reflect this dependency, and are constructed to test how PD and/or FD
mediate the effect of species richness on the biodiversity effect (LRmean). Alternative
pathways included direct effects of S on the ecosystem function, the inclusion of
functional group richness, and correlations between FD and PD (Fig. S2). SEMs were
implemented using the R package sem (Fox 2006).
I assessed the phylogenetic signal in the functional traits at three levels. First, I
compared the relationship between PD and FD. Second, I compared the distances
between species based on functional traits with distances based on phylogeny; these
distances are the foundation for the diversity metrics. I tested the degree of phylogenetic
signal in each trait using the K statistic (Blomberg et al. 2003), as implemented in the R
package picante (Kembel et al. 2010). All analyses used the statistical programming
software R 2.11.0 (http://www.r-project.org).
Results
PD and FD had similar predictive power for biodiversity effects in all cases. From
the mixed effects model comparison, PD was the best predictor of the biodiversity effects
on aboveground biomass, followed closely by the combination of PD and the FD
calculated from leaf %N, mean plant height, and N-fixation ability (FDN, Height, N-fixation),

76
and then by FDN, Height, N-fixation alone. In the most inclusive comparison, using 1,419 plots
and the PD based on the angiosperm supertree, FDN, Height, N-fixation was the best predictor
of the effect of plant biodiversity on aboveground biomass production, although PD had
similar predictive power (Table 1). When examining only plots that did not include
legumes, PD was the best predictor, followed by FDN, Height. Examining only experiments
where N fertilizer was added, PD was a weaker predictor than FD across all experiments,
with FDHeight, N-fixation as the best predictor overall. In every case, FGR was the weakest
predictor of biodiversity effects. Combining PD with the best FD resulted in greater
variance explained for the biodiversity effect on aboveground biomass, but was not the
most parsimonious model in any case.
Despite the similar power for FD and PD to predict biodiversity effects in
grassland experiments, the relationship between the indices results almost entirely from
the correlation of each with S. While PD increases nearly linearly with S, a large range of
FD values was found at all levels of S (Fig. 2, Fig. S3), resulting in a modest relationship
between FD and PD (e.g., FDN, Height, N-fixation and PD, r2 = 0.237). The relationship is
much reduced when the S effect is removed (residuals of FDN, Height, N-fixation and PD
against S, r2 = 0.02), indicating correspondence between FD and PD is not a given at a
particular level of species richness (Fig. S3).
Comparison of competing structural equation models demonstrated that for all
subsets of the data, the best-fit model required including both PD and FD as predictors of
the biodiversity effect. Including the correlation between PD and FD improved the model
fit for various subsets of the data (excluding legume-containing plots or unfertilized
plots), but not all (Table 3). However, in all cases when the correlation was included, the

77
value was small (e.g., Fig. 3). The strength of the predictive power of PD and FD in the
SEMs largely corroborated the results of the linear mixed models.
Directly examining the phylogenetic signal in trait variation, significant
phylogenetic signal was only detected for N-fixing ability (Table 4, Figure S1). When
using the angiosperm supertree, with a complete coverage of species but only genus-level
resolution, significant phylogenetic signal was detected for LMA, height, and N-fixing
ability, indicating that close relatives were more likely to have similar trait values than
would be expected by chance.
Discussion
Our analyses demonstrate that measures of functional and phylogenetic diversity
have similar abilities to predict biodiversity effects; functional group richness has the
weakest predictive power in nearly all cases. The similar predictive power of FD and PD
is surprising because the two indices are based on mostly different information,
ecophysiological traits for FD versus time since evolutionary divergence for PD. There is
evidence for phylogenetic signal in N-fixation, unsurprisingly, but the diversity metrics
summarizing the functional and phylogenetic information do not correlate after the effect
of species richness is removed, and SEMs demonstrated small or zero correlation
between the two diversity metrics when species richness was also included.
The lack of correlation between FD and PD values for communities of a given
species richness suggests that while the traits used in the FD calculations are important,
additional axes of trait variation are captured in PD. These un-measured traits may
include pathogen tolerance (Petermann et al. 2008) or other coevolutionary relationships,

78
and seem to be important in determining grassland ecosystem functioning. PD potentially
captures all such additional axes, but is not informative for identifying what they might
be. Identifying the traits that drive ecosystem functioning will spur better understanding
of the consequences of species loss and the mechanisms driving ecosystem processes,
such as niche complementarity and the selection effect, and will clarify how evolutionary
history can be a good proxy for trait measurements. I found that variation in leaf %N,
height and N-fixation were consistently the most important traits for predicting
biodiversity effects. Leaf N concentration relates to resource acquisition strategy, while
height relates to partitioning of light resources in grasslands (Grime 2001).
Differentiation in height and LMA was partially driven by phylogenetic relationships
(Table 4). N-fixation coincides completely with Fabaceae, and is the only trait with an
overwhelming phylogenetic signal. However, PD was still an effective predictor of the
biodiversity effect even when plots with legumes were excluded (Table 1). Thus,
phylogenetic divergence can reflect functional differentiation, but this does not result in
diversity metrics that correspond closely at a given level of species richness.
Previous studies have evaluated the performance of different diversity metrics in
predicting biodiversity-ecosystem function relationships, notably Petchey et al. (2004b),
who demonstrated that FD was a stronger predictor of aboveground biomass production
than S or FGR. Notably, Cadotte et al. (2009a) assessed PD, several versions of FD, and
other diversity metrics as predictors of the biodiversity effect in one of the studies
included in this meta-analysis. They found that FD and PD were weakly correlated, but
that PD and combinations of PD and other metrics were always superior predictors of
ecosystem functioning. This contrasts with the present results, but their study differed
79
from the current study because they used a different set of traits, fewer species, and
focused on a single biodiversity experiment. These contrasting results highlight the need
for a mechanistic understanding of which traits are represented by PD.
Importantly, other studies have found that the traits of the dominant species can
be more important than any aggregate measure of functional diversity in determining
ecosystem processes (Mokany et al. 2008; Griffin et al. 2009). This highlights the need
for further analyses of how plant traits control ecosystem processes, to partition
complementarity from selection effects, which I did not address here. In addition, trait
data compilation remains a challenge, with a clear need for a central repository of
functional trait data. I suggest that further progress in resolving these issues will require
examining for what traits and to what extent evolutionary relationships closely match
functional relationships, i.e., the idea that there may be a high degree of phylogenetic
niche conservatism in the traits important for ecosystem functioning (Ackerly & Reich
1999).
Acknowledgments
Nicholas Mirotchnick, Meha Jain, Mathew Palmer, and Shahid Naeem collaborated in
conceiving of this study and writing the results. I thank the authors of the original studies
for generously sharing their data, M. Cadotte, B. Cardinale, and T. Oakley for sharing
their molecular phylogeny and R code for calculating PD, and B. Schmid and Naeem lab
members for constructive feedback.
80
Tables and Figures
Table 4.1. Model comparison results of linear mixed models.
Models are compared to predict the log response ratio of biomass production for all plots,
including without legumes and fertilized experimental plots. Predictors are ranked by
Akaike weight. Comparisons were performed between 26 trait combinations for
functional diversity (FD), phylogenetic diversity (PD), species richness (S) and functional
group richness (FGR), and a multivariate model combining PD and the best FD. Results
are shown from PD based on the molecular phylogeny of Cadotte et al., which covers 110
of the 121 species used in these plots, as well as from PD based the angiosperm supertree.
Cadotte et al. created a phylogeny of 145 species, of which 121 are present in plots where
LRmean can be calculated. N, number of experimental units in this subset; wi, Akaike
weights.

81
Using PD from molecular phylogeny (110 species) Subset n Predictor R2 wi All plots 1074 PD 0.196 0.989 PD+FDN.Height.N-fix 0.197 0.01 FDN.Height.N-fixation 0.181 4.8 x10⁻⁵ S 0.177 5.5 x10⁻⁶ FGR 0.17 7.5 x10⁻⁹ No legumes
506 PD 0.105 0.48
FDN.Height 0.096 0.146 PD+FDN.Height 0.107 0.064 S 0.097 0.043 FGR 0.074 3.3 x 10⁻⁶
212 FDHeight.N-fixation 0.172 0.216 Fertilized plots PD 0.186 0.117 PD+FDHeight.N-fix 0.188 0.024 S 0.161 0.002 FGR 0.123 6.7 x10⁻⁵ Using PD from angiosperm supertree (121 species) Subset n Predictor R2 wi All plots 1419 FDN.Height.N-fixation 0.223 0.907 PD+FDN.Height.N-fixation 0.229 0.003 PD 0.223 0.002 S 0.204 2.3 x10⁻⁸ FGR 0.187 2.4 x10⁻¹⁶ No legumes
636 FDN.Height.SRL 0.12 0.495
S 0.11 0.001 PD 0.123 2.7 x10⁻⁴ PD+FDN.Height.SRL 0.125 3.8 x10⁻⁵ FGR 0.078 4.8 x10⁻⁹
302 FDHeight.N-fixation 0.221 0.606 Fertilized plots PD 0.22 0.002 PD+FDN.Height 0.233 2.8 x10⁻⁶ S 0.204 2.6 x10⁻⁷ FGR 0.198 3.5 x10⁻¹⁰

82
Table 4.2. Sources of species mean trait data for the 121 species in this analysis.
Values show median and range of trait data and summarize the binary variable.
Trait Sources n Functional significance Values
Leaf mass per
area
(LMA, g / m2)
Glopnet (22), LEDA
(14), Literature (51)
87 Resource capture rate;
decomposition; leaf
lifespan
49.0
(21.9-141.3)
Leaf N (% on
mass basis)
Glopnet (31),
Literature (40)
71 Rate of resource capture 2.5 (0.5-5.2)
Height (cm) Literature (46),
LEDA (52), Grime
et al. (4), Gleason &
Cronquist (11),
USDA (7)
12
0
Light competition
strategy; competitive
ability
35.0
(8.5-1875)
Specific root
length
(SRL, g / cm)
Craine et al. 2001 24 Investment
belowground, root
lifespan
96.6
(22.9-288.4)
N-fixation
(binary)
de Faria et al. 1989 12
1
Competitive ability in
N-poor soil
0: 103; 1: 18

83
Table 4.3. Summary of structural equation modeling results.
The best of eight possible models is shown for each subset of the data, using either the
molecular phylogeny or angiosperm supertree as the basis for PD. RMSEA: root mean
squared error approximation. Models "M3" and "M8" both include PD and FD; M8
includes a correlation term between PD and FD. See Table S2 and Figure S3 for complete
results.
Using PDM from molecular phylogeny (110 species)
Subset n Model χ2 df P RMSEA
All plots 1074 M8 3.37 1 0.067 0.047
No legumes 506 M3 3.05 2 0.217 0.030
Fertilized
plots
212 M3 0.13 2 0.937 <0.001
Using PD from angiosperm supertree (121 species)
All plots 1419 M8 6.31 1 0.012 0.061
No legumes 636 M8 3.32 1 0.069 0.060
Fertilized
plots
302 M3 2.92 2 0.232 0.039
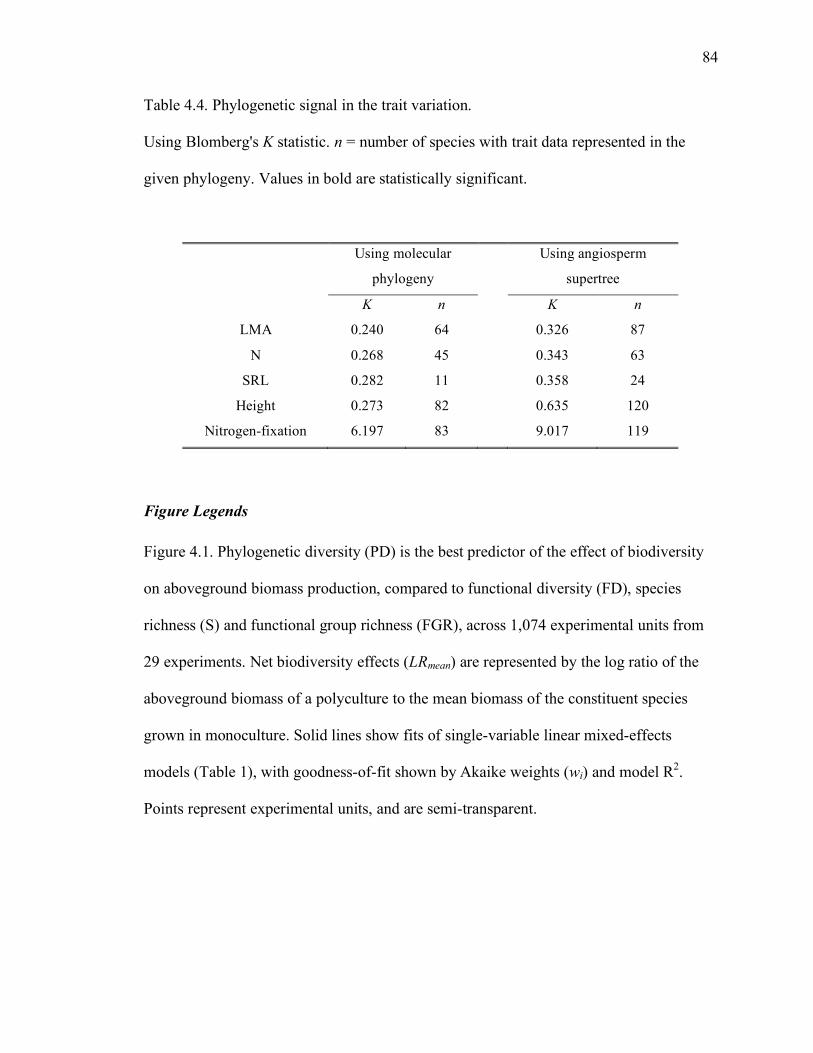
84
Table 4.4. Phylogenetic signal in the trait variation.
Using Blomberg's K statistic. n = number of species with trait data represented in the
given phylogeny. Values in bold are statistically significant.
Using molecular
phylogeny
Using angiosperm
supertree
K n K n
LMA 0.240 64 0.326 87
N 0.268 45 0.343 63
SRL 0.282 11 0.358 24
Height 0.273 82 0.635 120
Nitrogen-fixation 6.197 83 9.017 119
Figure Legends
Figure 4.1. Phylogenetic diversity (PD) is the best predictor of the effect of biodiversity
on aboveground biomass production, compared to functional diversity (FD), species
richness (S) and functional group richness (FGR), across 1,074 experimental units from
29 experiments. Net biodiversity effects (LRmean) are represented by the log ratio of the
aboveground biomass of a polyculture to the mean biomass of the constituent species
grown in monoculture. Solid lines show fits of single-variable linear mixed-effects
models (Table 1), with goodness-of-fit shown by Akaike weights (wi) and model R2.
Points represent experimental units, and are semi-transparent.

85
Figure 4.2. Relationships between the three continuous measures of biodiversity used in
this study. Histograms are shown in the diagonal, with R2 values shown in the bottom
panels.
Figure 4.3. Best-fit structural equation model combining S, FD, and PD calculated from
the molecular phylogeny (χ2 = 3.37, df = 1, P = 0.067). Values give the standardized
coefficients for the relationship between 'upstream' and 'downstream' variables; all
coefficients are significant. Epsilons represent the error term for downstream variables.
See Supplemental Materials for full set of models.

86
Figure 4.1. Comparison of diversity metrics.
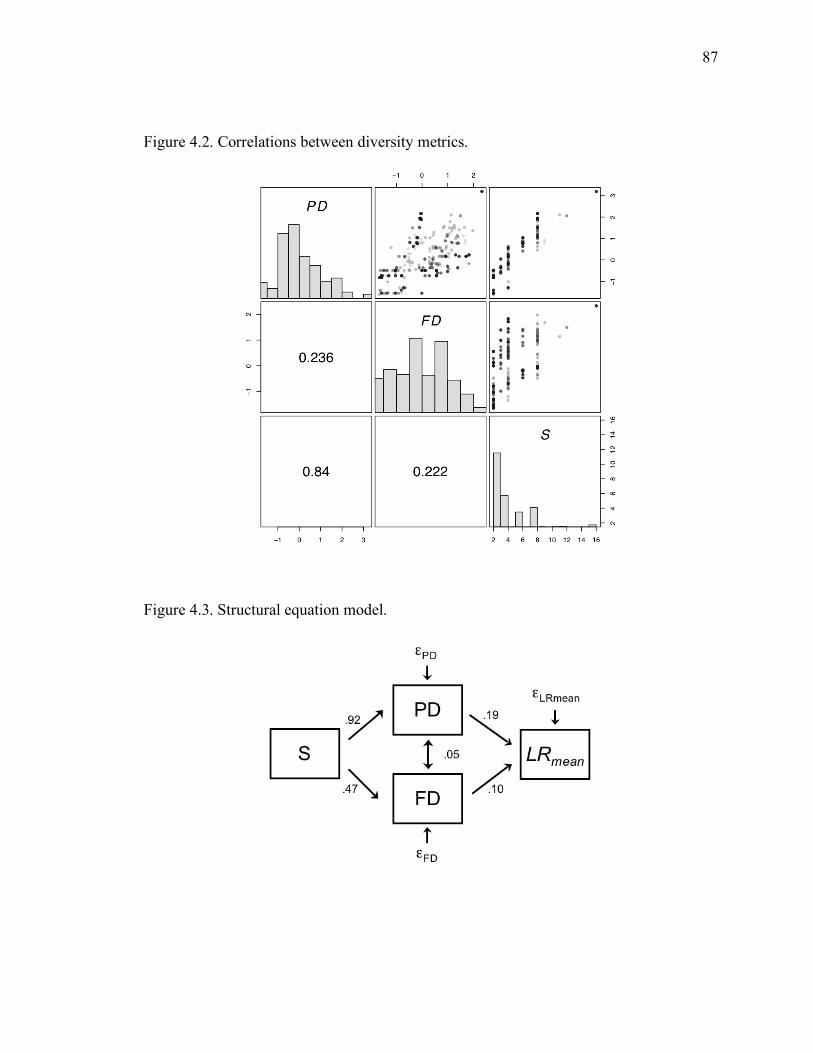
87
Figure 4.2. Correlations between diversity metrics.
Figure 4.3. Structural equation model.

88
CHAPTER 5. SUMMARY
The consequences of biodiversity loss for ecosystem functioning and potentially
for the provisioning of ecosystem services has motivated substantial research into the
relationship between diversity and ecosystem functioning. The majority of this research
effort has been focused within trophic groups, in particular within grassland plant
communities, laying the foundation for future progress in two fronts: 1. incorporating
multiple trophic levels into biodiversity and ecosystem functioning, and 2. the use of
functional traits to investigate community assembly processes and to measure the aspects
of diversity most relevant to ecosystems. Both goals have the proximate aim of increasing
the realism of research into how diversity loss should be expected to affect ecosystem
functioning, and the ultimate aim of refining the link between biodiversity conservation
and the provisioning of ecosystem services.
My thesis has broadly addressed the causes and consequences of plant diversity in
grassland ecosystems. In particular, I focused on how herbivory shapes plant
communities, investigating herbivore behavior and plant strategies to respond to
herbivores to better understand factors shaping plant diversity. In parallel, I used
approaches based on plant functional traits to look at the balance of abiotic and biotic
factors shaping the variation in functional diversity of grassland plant communities in
Inner Mongolia. Finally, I examined grassland biodiversity-ecosystem functioning
experiments globally, to evaluate which aspects of plant diversity are most relevant to
ecosystem functioning.

89
In Chapter 2, "Foraging behavior of a generalist grasshoppers, Oedaleus
asiaticus," field observations and a controlled laboratory experiment showed that the
feeding preferences of a dominant generalist grasshopper in Inner Mongolia were
principally for a palatable, N-rich subdominant C4 plant species. Experimental and
observational work demonstrated that silica may be actively used by one dominant plant,
the bunchgrass Leymus chinensis, in response to either short-term herbivory by
grasshoppers or long-term sheep grazing intensity. A co-dominant plant, the needlegrass
Stipa grandis, appears to have the opposite strategy, with lower silica accumulation under
high herbivory, highlighting the potential for the growth-defense tradeoff to exist among
dominant plant species. However, further work is clearly necessary to translate variation
in antiherbivore defense strategies to ecosystem functioning.
In examining the both the processes shaping community assembly in Chapter 3,
over a range of herbivore intensities in these grassland plant communities, I have shown
that the signal of environmental filtering dominates the observed communities. This work
has additionally created a substantial database of functional trait measurements made at
the individual level and detailed plant community surveys, both of which will be
contributed to data repositories such as Traitnet (http://traitnet.ecoinformatics.org) and
Vegbank (http://www.vegbank.org).
Extending this work on linking traits to communities, I have shown how newly-
developed metrics of biodiversity, based on either differences between species in
functional traits or divergences between species in evolutionary history, perform as
predictors of ecosystem functioning in Chapter 4. Phylogenetic diversity alone explained
a surprisingly high amount of the variance in aboveground biomass production over the

90
29 experiments studied. The surprise comes from the poor correlation between
phylogenetic and functional diversity, at least within a given species richness level. The
implication is that there are important features of grassland plants aside from the five
traits employed in this meta-analysis, and identifying what those functional axes are
presents an intriguing challenge. This challenge can be addressed by taking advantage of
large databases of traits, such as in Traitnet, in conjunction with widely-available genetic
data to reconstruct evolutionary relationships between species. Testing for the amount of
phylogenetic signal in these traits will clarify under what circumstances phylogenetic
diversity would be expected to serve as a good proxy for functional diversity in assessing
both community assembly and community disassembly. It can be conjectured that traits
linked to coevolved relationships, such as plant-herbivore interactions, are more likely to
be phylogenetically conserved, and thus provide a good starting point.
BEF beyond Western grasslands
Like a great deal of research in plant community ecology, the majority of the
research into grassland biodiversity and ecosystem functioning has occurred in western
Europe and North America. Thus, such research has occurred in contexts appropriate for
investigating fundamental ecological relationships and applications to restoration, but
with limited links to sustainable development or conservation in general (Schwartz et al.
2000; Srivastava & Vellend 2005). In order to reach broader generalities about
biodiversity-ecosystem functioning in contexts relevant for sustainable development, it is
important to include a larger range of study ecosystems. The Inner Asian steppe is the
largest grassland in the world, with a diversity of plant and animal life second only to the
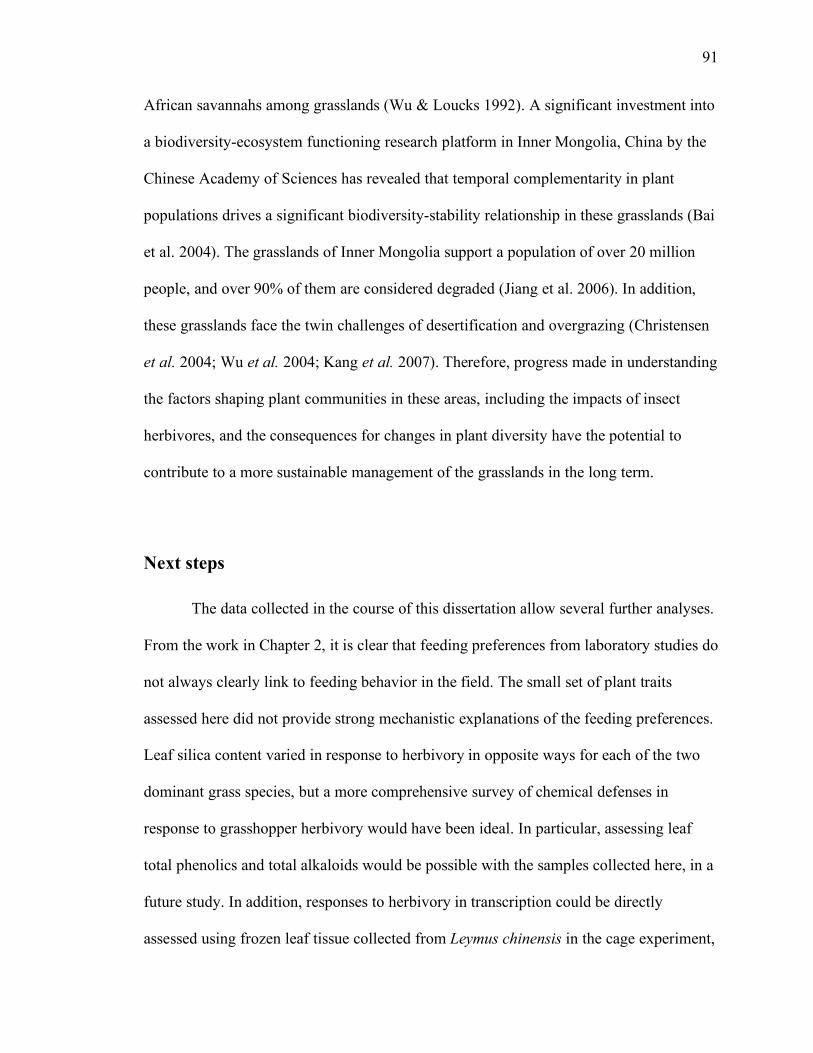
91
African savannahs among grasslands (Wu & Loucks 1992). A significant investment into
a biodiversity-ecosystem functioning research platform in Inner Mongolia, China by the
Chinese Academy of Sciences has revealed that temporal complementarity in plant
populations drives a significant biodiversity-stability relationship in these grasslands (Bai
et al. 2004). The grasslands of Inner Mongolia support a population of over 20 million
people, and over 90% of them are considered degraded (Jiang et al. 2006). In addition,
these grasslands face the twin challenges of desertification and overgrazing (Christensen
et al. 2004; Wu et al. 2004; Kang et al. 2007). Therefore, progress made in understanding
the factors shaping plant communities in these areas, including the impacts of insect
herbivores, and the consequences for changes in plant diversity have the potential to
contribute to a more sustainable management of the grasslands in the long term.
Next steps
The data collected in the course of this dissertation allow several further analyses.
From the work in Chapter 2, it is clear that feeding preferences from laboratory studies do
not always clearly link to feeding behavior in the field. The small set of plant traits
assessed here did not provide strong mechanistic explanations of the feeding preferences.
Leaf silica content varied in response to herbivory in opposite ways for each of the two
dominant grass species, but a more comprehensive survey of chemical defenses in
response to grasshopper herbivory would have been ideal. In particular, assessing leaf
total phenolics and total alkaloids would be possible with the samples collected here, in a
future study. In addition, responses to herbivory in transcription could be directly
assessed using frozen leaf tissue collected from Leymus chinensis in the cage experiment,

92
using microarray technology (Snoeren et al. 2007; Leakey et al. 2009). Despite high
technological hurdles and high cost, the rewards of such analysis could be great, by
revealing changes to metabolic pathways directly in response to herbivory; the promise of
scaling from genes to ecosystems could be achieved in part with such analysis.
Determining which factors are most important in community assembly also still
represents one of the grand challenges in ecology. The work in Chapter 3, showing the
strong imprint of environmental filtering regardless of identity or strength of herbivory,
presents a challenge to biodiversity-ecosystem functioning research. Niche
complementarity has been consistently invoked to explain the positive saturating
relationship between species richness and grassland biomass accumulation; why then do
communities composed of highly-similar species persist? It is possible that niche
complementarity is fairly easy to detect in combinatorial experiments, but plays a smaller
role in the assembly of natural systems. Reconciling the insights from community
assembly and community disassembly research remains a challenge.
In Chapter 4, I demonstrated that phylogenetic diversity explains a high degree of
the variation in the effect of biodiversity on grassland biomass accumulation.
Surprisingly, little of the variance in the grassland plant traits most commonly thought to
influence aboveground biomass accumulation was explained by the phylogeny, and
furthermore the functional and phylogenetic diversity indices related only weakly after
the common influence of species richness was removed. Therefore, the search for which
traits important for grassland ecosystem functioning do in fact show phylogenetic signal
represents an important next step. To date, analyses of phylogenetic signal in plant traits
have been limited to species mean values (e.g., Thompson et al. 1997; Ackerly & Reich

93
1999), but advances in integrating multiple levels of variation, from the population to the
genus and family level, should provide more powerful tools for such comparative studies.
This thesis represents an incremental step forward in towards increasing the
degree of realism in biodiversity-ecosystem functioning research by adopting a
multitrophic framework with an emphasis on the effects of herbivores on plant
communities, as well as focusing on the use of plant traits to assess community structure
and functional diversity. In carrying out this research in the context of the under-studied
Inner Asian steppe, this thesis demonstrates the potential for the tool of community
ecology to contribute to sustainable rangeland management. While translating the lessons
from the basic research here to applications requires much additional work, the potential
for applications plant traits, herbivory, and community-level interactions to ecosystem
management provides a goal for future work to aspire to.

94
REFERENCES
Abrams, P. A. (2000) The Evolution of Predator-Prey Interactions: Theory and Evidence.
Annual Review of Ecology and Systematics, 31, 79-105.
Ackerly, D. D. & Cornwell, W. K. (2007) A trait-based approach to community assembly: partitioning of species trait values into within- and among-community components. Ecology Letters, 10, 135-145.
Ackerly, D. D. & Reich, P. B. (1999) Convergence and correlations among leaf size and function in seed plants: a comparative test using independent contrasts. American Journal of Botany, 86, 1272-1281.
Agrawal, A. A., Lau, J. A. & Hamback, P. A. (2006) Community heterogeneity and the evolution of interactions between plants and insect herbivores. Quarterly Review of Biology, 81, 349-376.
Altieri, A. H., Trussell, G. C., Ewanchuk, P. J., Bernatchez, G. & Bracken, M. E. S. (2009) Consumers Control Diversity and Functioning of a Natural Marine Ecosystem. PLoS ONE, 4.
Alward, R. D. & Joern, A. (1993) Plasticity and overcompensation in grass responses to herbivory. Oecologia, 95, 358-364.
Aoki, I. (2003) Diversity-productivity-stability relationship in freshwater ecosystems: Whole-systemic view of all trophic levels. Ecological Research, 18, 397-404.
Aránguiz-Acuña, A., Ramos-Jiliberto, R. & Bustamante, R. O. (2010) Experimental evidence that induced defenses promote coexistence of zooplanktonic populations. Journal Of Plankton Research.
Augustine, D. J. & McNaughton, S. J. (1998) Ungulate effects on the functional species composition of plant communities: Herbivore selectivity and plant tolerance. Journal of Wildlife Management, 62, 1165-1183.
Bai, Y. F., Han, X. G., Wu, J. G., Chen, Z. Z. & Li, L. H. (2004) Ecosystem stability and compensatory effects in the Inner Mongolia grassland. Nature, 431, 181-184.
Bai, Y. F., Wu, J. G., Pan, Q. M., Huang, J. H., Wang, Q. B., Li, F. S., Buyantuyev, A. & Han, X. G. (2007) Positive linear relationship between productivity and diversity: evidence from the Eurasian Steppe. Journal of Applied Ecology, 44, 1023-1034.
Bai, Y. F., Wu, J. G., Xing, Q., Pan, Q. M., Huang, J. H., Yang, D. L. & Han, X. G. (2008) Primary production and rain use efficiency across a precipitation gradient on the Mongolia plateau. Ecology, 89, 2140-2153.

95
Balvanera, P., Pfisterer, A. B., Buchmann, N., He, J. S., Nakashizuka, T., Raffaelli, D. & Schmid, B. (2006) Quantifying the evidence for biodiversity effects on ecosystem functioning and services. Ecology Letters, 9, 1146-1156.
Bastian, M., Pearson, R. G. & Boyero, L. (2008) Effects of diversity loss on ecosystem function across trophic levels and ecosystems: A test in a detritus-based tropical food web. Austral Ecology, 33, 301-306.
Behmer, S. T. & Joern, A. (2008) Coexisting generalist herbivores occupy unique nutritional feeding niches. Proceedings of the National Academy of Sciences of the United States of America, 105, 1977-1982.
Behmer, S. T., Simpson, S. J. & Raubenheimer, D. (2002) Herbivore foraging in chemically heterogeneous environments: Nutrients and secondary metabolites. Ecology, 83, 2489-2501.
Belovsky, G. E. & Slade, J. B. (2000) Insect herbivory accelerates nutrient cycling and increases plant production. Proceedings of the National Academy of Sciences of the United States of America, 97, 14412-14417.
Belsky, A. J. (1986) Does herbivory benefit plants?: a review of the evidence. American Naturalist, 127, 870-892.
Blomberg, S. P., Garland, T. & Ives, A. R. (2003) Testing for phylogenetic signal in comparative data: Behavioral traits are more labile. Evolution, 57, 717-745.
Bruno, J. F., Boyer, K. E., Duffy, J. E. & Lee, S. C. (2008) Relative and interactive effects of plant and grazer richness in a benthic marine community. Ecology, 89, 2518-2528.
Bruno, J. F. & O'Connor, M. I. (2005) Cascading effects of predator diversity and omnivory in a marine food web. Ecology Letters, 8, 1048-1056.
Bryant, J. P. & Kuropat, P. J. (1980) Selection of winter forage by sub-arctic browsing vertebrates: the role of plant chemistry. Annual Review of Ecology and Systematics, 11, 261-285.
Bryant, J. P., Kuropat, P. J., Cooper, S. M., Frisby, K. & Owensmith, N. (1989) Resource availability hypothesis of plant antiherbivore defense tested in a south-african savanna ecosystem. Nature, 340, 227-229.
Burkepile, D. E. & Hay, M. E. (2008) Herbivore species richness and feeding complementarity affect community structure and function on a coral reef. Proceedings of the National Academy of Sciences of the United States of America, 105, 16201-16206.

96
Byrnes, J., Stachowicz, J. J., Hultgren, K. M., Hughes, A. R., Olyarnik, S. V. & Thornber, C. S. (2006) Predator diversity strengthens trophic cascades in kelp forests by modifying herbivore behaviour. Ecology Letters, 9, 61-71.
Cadotte, M. W., Cardinale, B. J. & Oakley, T. H. (2008) Evolutionary history and the effect of biodiversity on plant productivity. Proceedings of the National Academy of Sciences, 105, 17012-17017.
Cadotte, M. W., Cavender-Bares, J., Tilman, D. & Oakley, T. H. (2009a) Using phylogenetic, functional and trait diversity to understand patterns of plant community productivity. PLoS ONE, 4.
Cadotte, M. W., Hamilton, M. A. & Murray, B. R. (2009b) Phylogenetic relatedness and plant invader success across two spatial scales. Diversity and Distributions, 9999.
Cahill, J. F., Kembel, S. W., Lamb, E. G. & Keddy, P. A. (2008) Does phylogenetic relatedness influence the strength of competition among vascular plants? Perspectives in Plant Ecology Evolution and Systematics, 10, 41-50.
Callaway, R. M. (1995) Positive interactions among plants. Botanical Review, 61, 306-349.
Cardinale, B. J., Srivastava, D. S., Duffy, J. E., Wright, J. P., Downing, A. L., Sankaran, M. & Jouseau, C. (2006) Effects of biodiversity on the functioning of trophic groups and ecosystems. Nature, 443, 989-992.
Carson, W. P. & Root, R. B. (2000) Herbivory and plant species coexistence: Community regulation by an outbreaking phytophagous insect. Ecological Monographs, 70, 73-99.
Cavender-Bares, J., Keen, A. & Miles, B. (2006) Phylogenetic structure of Floridian plant communities depends on taxonomic and spatial scale. Ecology, 87, S109-S122.
Cavender-Bares, J., Kozak, K. H., Fine, P. V. A. & Kembel, S. W. (2009) The merging of community ecology and phylogenetic biology. Ecology Letters, 12, 693-715.
Cease, A. J., Hao, S. G., Kang, L., Elser, J. J. & Harrison, J. F. (2010) Are color or high rearing density related to migratory polyphenism in the band-winged grasshopper, Oedaleus asiaticus? Journal of Insect Physiology, 56, 926-936.
Chapman, S. K., Hart, S. C., Cobb, N. S., Whitham, T. G. & Koch, G. W. (2003) Insect herbivory increases litter quality and decomposition: An extension of the acceleration hypothesis. Ecology, 84, 2867-2876.
Chave, J., Muller-Landau, H. C., Baker, T. R., Easdale, T. A., Ter Steege, H. & Webb, C. O. (2006) Regional and phylogenetic variation of wood density across 2456 neotropical tree species. Ecological Applications, 16, 2356-2367.
97
Chew, F. S. & Courtney, S. P. (1991) Plant apparency and evolutionary escape from insect herbivory. American Naturalist, 138, 729-750.
Christensen, L., Coughenour, M. B., Ellis, J. E. & Chen, Z. Z. (2004) Vulnerability of the Asian typical steppe to grazing and climate change. Climatic Change, 63, 351-368.
Cianciaruso, M. V., Batalha, M. A., Gaston, K. J. & Petchey, O. L. (2009) Including intraspecific variability in functional diversity. Ecology, 90, 81-89.
Coley, P. D., Bryant, J. P. & Chapin, F. S. (1985) Resource availability and plant antiherbivore defense. Science, 230, 895-899.
Cornelissen, J. H. C., Lavorel, S., Garnier, E., Diaz, S., Buchmann, N., Gurvich, D. E., Reich, P. B., ter Steege, H., Morgan, H. D., van der Heijden, M. G. A., Pausas, J. G. & Poorter, H. (2003) A handbook of protocols for standardised and easy measurement of plant functional traits worldwide. Australian Journal of Botany, 51, 335-380.
Cornwell, W. K. & Ackerly, D. D. (2009) Community assembly and shifts in plant trait distributions across an environmental gradient in coastal California. Ecological Monographs, 79, 109-126.
Cornwell, W. K., Schwilk, D. W. & Ackerly, D. D. (2006) A trait-based test for habitat filtering: Convex hull volume. Ecology, 87, 1465-1471.
Craine, J. M., Froehle, J., Tilman, D. G., Wedin, D. A. & Chapin, F. S. (2001) The relationships among root and leaf traits of 76 grassland species and relative abundance along fertility and disturbance gradients. Oikos, 93, 274-285.
Craine, J. M., Tilman, D., Wedin, D., Reich, P., Tjoelker, M. & Knops, J. (2002) Functional traits, productivity and effects on nitrogen cycling of 33 grassland species. Functional Ecology, 16, 563-574.
Davies, T. J., Barraclough, T. G., Chase, M. W., Soltis, P. S., Soltis, D. E. & Savolainen, V. (2004) Darwin's abominable mystery: Insights from a supertree of the angiosperms. Proceedings of the National Academy of Sciences of the United States of America, 101, 1904-1909.
de Faria, S. M., Lewis, G. P., Sprent, J. I. & Sutherland, J. M. (1989) Occurrence of nodulation in the Leguminosae. New Phytologist, 111, 607-619.
Deacon, L. J., Pryce-Miller, E. J., Frankland, J. C., Bainbridge, B. W., Moore, P. D. & Robinson, C. H. (2006) Diversity and function of decomposer fungi from a grassland soil. Soil Biology & Biochemistry, 38, 7-20.
Díaz, S., Lavorel, S., de Bello, F., Quetier, F., Grigulis, K. & Robson, M. (2007) Incorporating plant functional diversity effects in ecosystem service assessments.

98
Proceedings of the National Academy of Sciences of the United States of America, 104, 20684-20689.
Díaz, S., Noy-Meir, I. & Cabido, M. (2001) Can grazing response of herbaceous plants be predicted from simple vegetative traits? Journal of Applied Ecology, 38, 497-508.
Dimitrakopoulos, P. G. & Schmid, B. (2004) Biodiversity effects increase linearly with biotope space. Ecology Letters, 7, 574-583.
Douglass, J. G., Duffy, J. E. & Bruno, J. F. (2008) Herbivore and predator diversity interactively affect ecosystem properties in an experimental marine community. Ecology Letters, 11, 598-608.
Downing, A. L. (2005) Relative effects of species composition and richness on ecosystem properties in ponds. Ecology, 86, 701-715.
Duffy, J. E. (2002) Biodiversity and ecosystem function: the consumer connection. Oikos, 99, 201-219.
Duffy, J. E. (2009) Why biodiversity is important to the functioning of real-world ecosystems. Frontiers in Ecology and the Environment, 7, 437-444.
Duffy, J. E., Carinale, B. J., France, K. E., McIntyre, P. B., Thebault, E. & Loreau, M. (2007) The functional role of biodiversity in ecosystems: incorporating trophic complexity. Ecology Letters, 10, 522-538.
Duffy, J. E., Macdonald, K. S., Rhode, J. M. & Parker, J. D. (2001) Grazer diversity, functional redundancy, and productivity in seagrass beds: An experimental test. Ecology, 82, 2417-2434.
Dukes, J. S. (2001) Productivity and complementarity in grassland microcosms of varying diversity. Oikos, 94, 468-480.
Faith, D. P. (1992) Conservation evaluation and phylogenetic diversity. Biological Conservation, 61, 1-10.
Feng, Z. L., Liu, R. S., DeAngelis, D. L., Bryant, J. P., Kielland, K., Stuart Chapin, F. & Swihart, R. (2009) Plant Toxicity, Adaptive Herbivory, and Plant Community Dynamics. Ecosystems, 12, 534-547.
Flynn, D. F. B., Gogol-Prokurat, M., Nogeire, T., Molinari, N., Richers, B. T., Lin, B. B., Simpson, N., Mayfield, M. M. & DeClerck, F. (2009) Loss of functional diversity under land use intensification across multiple taxa. Ecology Letters, 12, 22-33.
Fox, J. (2006) Structural equation modeling with the sem package in R. Structural Equation Modeling, 13, 465–486.
99
Fox, J. W. (2005) Interpreting the 'selection effect' of biodiversity on ecosystem function. Ecology Letters, 8, 846-856.
Fridley, J. D. (2002) Resource availability dominates and alters the relationship between species diversity and ecosystem productivity in experimental plant communities. Oecologia, 132, 271-277.
Fridley, J. D. (2003) Diversity effects on production in different light and fertility environments: an experiment with communities of annual plants. Journal of Ecology, 91, 396-406.
Fritz, R. S. & Simms, E. L. (1992) Plant Resistance to Herbivores and Pathogens: Ecology, Evolution, and Genetics. University of Chicago Press, Chicago.
Fritz, S. A. & Purvis, A. (2010) Phylogenetic diversity does not capture body size variation at risk in the world's mammals. Proceedings of the Royal Society B: Biological Sciences.
Gamfeldt, L., Hillebrand, H. & Jonsson, P. R. (2005) Species richness changes across two trophic levels simultaneously affect prey and consumer biomass. Ecology Letters, 8, 696-703.
Garnier, E., Cortez, J., Billes, G., Navas, M. L., Roumet, C., Debussche, M., Laurent, G., Blanchard, A., Aubry, D., Bellmann, A., Neill, C. & Toussaint, J. P. (2004) Plant functional markers capture ecosystem properties during secondary succession. Ecology, 85, 2630-2637.
Gawrilow, E. & Joswig, M. (2000) polymake: a Framework for Analyzing Convex Polytopes. Polytopes: Combinatorics and Computation (ed^(eds G. Kalai & G. Ziegler), pp. 43-74. Birkhäuser, Basel.
Gleason, H. & Cronquist, A. (1991) Manual of Vascular Plants of Northeastern United States and Adjacent Canada. New York Botanical Garden, New York.
Griffin, J. N., De la Haye, K. L., Hawkins, S. J., Thompson, R. C. & Jenkins, S. R. (2008) Predator diversity and ecosystem functioning: Density modifies the effect of resource partitioning. Ecology, 89, 298-305.
Griffin, J. N., Méndez, V., Johnson, A. F., Jenkins, S. R. & Foggo, A. (2009) Functional diversity predicts overyielding effect of species combination on primary productivity. Oikos, 118, 37-44.
Griffiths, B. S., Ritz, K., Bardgett, R. D., Cook, R., Christensen, S., Ekelund, F., Sorensen, S. J., Baath, E., Bloem, J., de Ruiter, P. C., Dolfing, J. & Nicolardot, B. (2000) Ecosystem response of pasture soil communities to fumigation-induced microbial diversity reductions: an examination of the biodiversity-ecosystem function relationship. Oikos, 90, 279-294.

100
Grime, J. P. (2001) Plant strategies, vegetation processes, and ecosystem properties. John Wiley & Sons, Chichester.
Grime, J. P. (2006) Trait convergence and trait divergence in herbaceous plant communities: mechanisms and consequences. Journal of Vegetation Science, 17, 255-260.
Grime, J. P., Hodgson, J. G. & Hunt, R. (1988) Comparative Plant Ecology. Allen & Unwin, London.
Hairston, N. G., Smith, F. E. & Slobodkin, L. B. (1960) Community structure, population control, and competition. American Naturalist, 94, 421-425.
Hartley, S. E. & Jones, T. H. (2003) Plant diversity and insect herbivores: effects of environmental change in contrasting model systems. Oikos, 101, 6-17.
Harvey, J. A., van der Putten, W. H., Turin, H., Wagenaar, R. & Bezemer, T. M. (2008) Effects of changes in plant species richness and community traits on carabid assemblages and feeding guilds. Agriculture Ecosystems & Environment, 127, 100-106.
Hector, A., Bazeley-White, E., Loreau, M., Otway, S. & Schmid, B. (2002) Overyielding in grassland communities: testing the sampling effect hypothesis with replicated biodiversity experiments. Ecology Letters, 5, 502-511.
Herms, D. A. & Mattson, W. J. (1992) The dilemma of plants: To grow or defend. Quarterly Review of Biology, 67, 283-335.
Hillebrand, H. & Cardinale, B. J. (2004) Consumer effects decline with prey diversity. Ecology Letters, 7, 192-201.
Hjalten, J., Danell, K. & Ericson, L. (1996) Food selection by two vole species in relation to plant growth strategies and plant chemistry. Oikos, 76, 181-190.
Hooper, D. U., Chapin, F. S., Ewel, J. J., Hector, A., Inchausti, P., Lavorel, S., Lawton, J. H., Lodge, D. M., Loreau, M., Naeem, S., Schmid, B., Setala, H., Symstad, A. J., Vandermeer, J. & Wardle, D. A. (2005) Effects of biodiversity on ecosystem functioning: A consensus of current knowledge. Ecological Monographs, 75, 3-35.
Hunt, J. W., Dean, A. P., Webster, R. E., Johnson, G. N. & Ennos, A. R. (2008) A novel mechanism by which silica defends grasses against herbivory. Ann Bot, 102, 653-656.
Huntly, N. (1991) Herbivores and the dynamics of communities and ecosystems. Annual Review of Ecology and Systematics, 22, 477-503.
101
Huston, M. A. (1997) Hidden treatments in ecological experiments: re-evaluating the ecosystem function of biodiversity. Oecologia, 110, 449-460.
Jactel, H. & Brockerhoff, E. G. (2007) Tree diversity reduces herbivory by forest insects. Ecology Letters, 10, 835-848.
Jaschinski, S., Aberle, N., Gohse-Reimann, S., Brendelberger, H., Wiltshire, K. H. & Sommer, U. (2009) Grazer diversity effects in an eelgrass-epiphyte-microphytobenthos system. Oecologia, 159, 607-615.
Jiang, G. M., Han, X. G. & Wu, J. G. (2006) Restoration and management of the inner Mongolia grassland require a sustainable strategy. Ambio, 35, 269-270.
Jonsson, M. & Malmqvist, B. (2000) Ecosystem process rate increases with animal species richness: evidence from leaf-eating, aquatic insects. Oikos, 89, 519-523.
Kahmen, A., Renker, C., Unsicker, S. B. & Buchmann, N. (2006) Niche complementarity for nitrogen: an explanation for the biodiversity and ecosystem functioning relationship? Ecology, 87, 1244-1255.
Kang, L. & Chen, Y. (1992) Temporal and spatial heterogeneity of grassland grasshoppers. Research on Grassland Ecosystems, 4, 109-123.
Kang, L. & Chen, Y.-L. (1994) Trophic niche of grasshoppers within steppe ecosystems in Inner Mongolia. Acta Entomologica Sinica, 37, 178–189.
Kang, L., Han, X. G., Zhang, Z. B. & Sun, O. J. (2007) Grassland ecosystems in China: review of current knowledge and research advancement. Philosophical Transactions of the Royal Society B-Biological Sciences, 362, 997-1008.
Karban, R. & Agrawal, A. A. (2002) Herbivore offense. Annual Review of Ecology and Systematics, 33, 641-664.
Kembel, S. W., COwan, P. D., Helmus, M. R., Cornwell, W. K., Morlon, H., Ackerly, D. D., Blomberg, S. P. & Webb, C. O. (2010) Picante: R tools for integrating phylogenies and ecology. Bioinformatics, 26, 1463-1464.
Kleyer, M., Bekker, R. M., Knevel, I. C., Bakker, J. P., Thompson, K., Sonnenschein, M., Poschlod, P., van Groenendael, J. M., Klimes, L., Klimesova, J., Klotz, S., Rusch, G. M., Hermy, M., Adriaens, D., Boedeltje, G., Bossuyt, B., Dannemann, A., Endels, P., Gotzenberger, L., Hodgson, J. G., Jackel, A. K., Kuhn, I., Kunzmann, D., Ozinga, W. A., Romermann, C., Stadler, M., Schlegelmilch, J., Steendam, H. J., Tackenberg, O., Wilmann, B., Cornelissen, J. H. C., Eriksson, O., Garnier, E. & Peco, B. (2008) The LEDA Traitbase: a database of life-history traits of the Northwest European flora. Journal of Ecology, 96, 1266-1274.

102
Koricheva, J., Mulder, C. P. H., Schmid, B., Joshi, J. & Huss-Danell, K. (2000) Numerical responses of different trophic groups of invertebrates to manipulations of plant diversity in grasslands. Oecologia, 125, 271-282.
Kraft, N. J. B., Valencia, R. & Ackerly, D. D. (2008) Functional traits and niche-based tree community assembly in an Amazonian forest. Science, 322, 580-582.
Laliberté, E., Wells, J. A., DeClerck, F., Metcalfe, D. J., Catterall, C. P., Queiroz, C., Aubin, I., Bonser, S. P., Ding, Y., Fraterrigo, J. M., McNamara, S., Morgan, J. W., Merlos, D. S. n., Vesk, P. A. & Mayfield, M. M. (2009) Land-use intensification reduces functional redundancy and response diversity in plant communities. Ecology Letters, 9999.
Lanta, V. & Leps, J. (2007) Effects of species and functional group richness on production in two fertility environments: an experiment with communities of perennial plants. Acta Oecologica-International Journal of Ecology, 32, 93-103.
Lanta, V. & Lepš, J. (2006) Effect of functional group richness and species richness in manipulated productivity-diversity studies: a glasshouse pot experiment. Acta Oecologica, 29, 85-96.
Leakey, A. D. B., Ainsworth, E. A., Bernard, S. M., Markelz, R. J. C., Ort, D. R., Placella, S. A., Rogers, A., Smith, M. D., Sudderth, E. A., Weston, D. J., Wullschleger, S. D. & Yuan, S. H. (2009) Gene expression profiling: opening the black box of plant ecosystem responses to global change. Global Change Biology, 15, 1201-1213.
Lee, T. D., Reich, P. B. & Tjoelker, M. G. (2003) Legume presence increases photosynthesis and N concentrations of co-occurring non-fixers but does not modulate their responsiveness to carbon dioxide enrichment. Oecologia, 137, 22-31.
Li, H. & Chen, Y. (1985) Studies on the feeding behavior of acridoids in the typical steppe subzone of the Nei Mongol (Inner Mongolia) Autonomous Region: II. Characteristics of food selection in natural plant communities. Research on Grassland Ecosystems, 154-168.
Loeuille, N. (2010) Influence of evolution on the stability of ecological communities. Ecology Letters, 13, 1536-1545.
Long, Z. T., Bruno, J. F. & Duffy, J. E. (2007) Biodiversity mediates productivity through different mechanisms at adjacent trophic levels. Ecology, 88, 2821-2829.
Loreau, M. (2000) Biodiversity and ecosystem functioning: recent theoretical advances. Oikos, 91, 3-17.
Loreau, M., Naeem, S., Inchausti, P., Bengtsson, J., Grime, J. P., Hector, A., Hooper, D. U., Huston, M. A., Raffaelli, D., Schmid, B., Tilman, D. & Wardle, D. A. (2001)

103
Biodiversity and ecosystem functioning: current knowledge and future challenges. Science, 294, 804-809.
Lu, H., Han, J.-G. & Zhang, Z.-H. (2008) Impacts of damage caused by Oedaleus asiaticus on the compensatory growth of plants in steppe. Pratacultural Science.
Lucas, P. W., Turner, I. M., Dominy, N. J. & Yamashita, N. (2000) Mechanical defences to herbivory. Annals of Botany, 86, 913-920.
MacArthur, R. & Levins, R. (1967) Limiting similarity convergence and divergence of coexisting species. American Naturalist, 101, 377-&.
Maherali, H. & Klironomos, J. N. (2007) Influence of phylogeny on fungal community assembly and ecosystem functioning. Science, 316, 1746-1748.
Marquard, E., Weigelt, A., Temperton, V. M., Roscher, C., Schumacher, J., Buchmann, N., Fischer, M., Weisser, W. W. & Schmid, B. (2009) Plant species richness and functional composition drive overyielding in a six-year grassland experiment. Ecology, 90, 3290-3302.
Mason, N. W. H., Mouillot, D., Lee, W. G. & Wilson, J. B. (2005) Functional richness, functional evenness and functional divergence: the primary components of functional diversity. Oikos, 111, 112-118.
Massey, F., Roland Ennos, A. & Hartley, S. (2007a) Herbivore specific induction of silica-based plant defences. Oecologia, 152, 677-683.
Massey, F. P., Ennos, A. R. & Hartley, S. E. (2007b) Grasses and the resource availability hypothesis: the importance of silica-based defences. Journal of Ecology, 95, 414-424.
Massey, F. P., Massey, K., Ennos, A. R. & Hartley, S. E. (2009) Impacts of silica-based defences in grasses on the feeding preferences of sheep. Basic and Applied Ecology, 10, 622-630.
Mattson, W. J. (1980) Herbivory in relation to plant nitrogen-content. Annual Review of Ecology and Systematics, 11, 119-161.
May, R. M. (1973) Stability and complexity in model ecosystems. Princeton University Press, Princeton, NJ.
McIntyre, S. (2008) The role of plant leaf attributes in linking land use to ecosystem function in temperate grassy vegetation. Agriculture Ecosystems & Environment, 128, 251-258.
McNaughton, S. J. (1983) Serengeti grassland ecology: the role of composite environmental factors and contingency in community organization. Ecological Monographs, 53, 291-320.
104
Mikola, J. & Setala, H. (1998) Relating species diversity to ecosystem functioning: mechanistic backgrounds and experimental approach with a decomposer food web. Oikos, 83, 180-194.
Milchunas, D. G. & Noy-Meir, I. (2002) Grazing refuges, external avoidance of herbivory and plant diversity. Oikos, 99, 113-130.
Mokany, K., Ash, J. & Roxburgh, S. (2008) Functional identity is more important than diversity in influencing ecosystem processes in a temperate native grassland. Journal of Ecology, 96, 884-893.
Moorthi, S. I., Hillebrand, H., Wahl, M. & Berninger, U. G. (2008) Consumer diversity enhances secondary production by complementarily effects in experimental ciliate assemblages. Estuaries and Coasts, 31, 152-162.
Moretti, M., Duelli, P. & Obrist, M. K. (2006) Biodiversity and resilience of arthropod communities after fire disturbance in temperate forests. Oecologia, 149, 312-327.
Mouchet, M. A., Villeger, S., Mason, N. W. H. & Mouillot, D. (2010) Functional diversity measures: an overview of their redundancy and their ability to discriminate community assembly rules. Functional Ecology, 24, 867-876.
Mouillot, D., Stubbs, W., Faure, M., Dumay, O., Tomasini, J. A., Wilson, J. B. & Chi, T. D. (2005) Niche overlap estimates based on quantitative functional traits: a new family of non-parametric indices. Oecologia, 145, 345-353.
Naeem, S., Hahn, D. R. & Schuurman, G. (2000) Producer-decomposer co-dependency influences biodiversity effects. Nature, 403, 762-764.
Naeem, S., Håkansson, K., Lawton, J. H., Crawley, M. J. & Thompson, L. J. (1996) Biodiversity and plant productivity in a model assemblage of plant species. Oikos, 76, 259-264.
Naeem, S., Hector, A., Perrings, C. & Bunker, D. E. (2009) Biodiversity, Ecosystem Functioning, and Human Wellbeing: An Ecological and Economic Perspective. Oxford University Press, Oxford.
Naeem, S. & Li, S. B. (1997) Biodiversity enhances ecosystem reliability. Nature, 390, 507-509.
Naeem, S., Thompson, L. J., Lawler, S. P., Lawton, J. H. & Woodfin, R. M. (1995) Empirical evidence that declining species diversity may alter the performance of terrestrial ecosystems. Philosophical Transactions of the Royal Society of London Series B-Biological Sciences, 347, 249-262.
Naeem, S., Tjossem, S. F., Byers, D., Bristow, C. & Li, S. B. (1999) Plant neighborhood diversity and production. Ecoscience, 6, 355-365.
105
O'Connor, M. I. & Bruno, J. F. (2009) Predator richness has no effect in a diverse marine food web. Journal of Animal Ecology, 78, 732-740.
O’Gorman, E., Enright, R. & Emmerson, M. (2008) Predator diversity enhances secondary production and decreases the likelihood of trophic cascades. Oecologia, 158, 557-567.
Oksanen, L., Fretwell, S. D., Arruda, J. & Niemela, P. (1981) Exploitation ecosystems in gradients of primary productivity. American Naturalist, 118, 240-261.
Pacala, S. W. & Tilman, D. (2001) The transition from sampling to complementarity. The functional consequences of biodiversity (ed^(eds D. Tilman), pp. 151–166. Princeton University Press, Princeton.
Pausas, J. G. & Verdu, M. (2008) Fire Reduces Morphospace Occupation in Plant Communities Ecology, 89, 2181-2186.
Petchey, O. L., Downing, A. L., Mittelbach, G. G., Persson, L., Steiner, C. F., Warren, P. H. & Woodward, G. (2004a) Species loss and the structure and functioning of multitrophic aquatic systems. Oikos, 104, 467-478.
Petchey, O. L. & Gaston, K. J. (2002) Functional diversity (FD), species richness and community composition. Ecology Letters, 5, 402-411.
Petchey, O. L. & Gaston, K. J. (2006) Functional diversity: back to basics and looking forward. Ecology Letters, 9, 741-758.
Petchey, O. L., Hector, A. & Gaston, K. J. (2004b) How do different measures of functional diversity perform? Ecology, 85, 847-857.
Petchey, O. L., O'Gorman, E. J. & Flynn, D. F. B. (2009) A functional guide to functional diversity measures. Biodiversity, Ecosystem Functioning, & Human Wellbeing (ed^(eds S. Naeem, D. E. Bunker, A. Hector, M. Loreau & C. Perrings), pp. 49-59. Oxford University Press, Oxford.
Petermann, J. S., Fergus, A. J. F., Turnbull, L. A. & Schmid, B. (2008) Janzen-Connell effects are widespread and strong enough to maintain diversity in grasslands. Ecology, 89, 2399-2406.
Philpott, S. M., Perfecto, I. & Vandermeer, J. (2008) Behavioral diversity of predatory arboreal ants in coffee agroecosystems. Environmental Entomology, 37, 181-191.
Podani, J. & Schmera, D. (2006) On dendrogram-based measures of functional diversity. Oikos, 115, 179-185.
Poorter, H., Niinemets, U., Poorter, L., Wright, I. J. & Villar, R. (2009) Causes and consequences of variation in leaf mass per area (LMA): a meta-analysis. New Phytologist, 182, 565-588.

106
R Development Core Team (2010) R: A language and environment for statistical computing. R Foundation for Statistical Computing, Vienna, Austria.
Raberg, S. & Kautsky, L. (2007) Consumers affect prey biomass and diversity through resource partitioning. Ecology, 88, 2468-2473.
Rabosky, D. L., Reid, J., Cowan, M. A. & Foulkes, J. (2007) Overdispersion of body size in Australian desert lizard communities at local scales only: no evidence for the Narcissus effect. Oecologia, 154, 561-570.
Raubenheimer, D. & Simpson, S. J. (1997) Integrative models of nutrient balancing: application to insects and vertebrates. Nutrition Research Reviews, 10, 151-179.
Raubenheimer, D., Simpson, S. J. & Mayntz, D. (2009) Nutrition, ecology and nutritional ecology: toward an integrated framework. Functional Ecology, 23, 4-16.
Reich, P., Knops, J., Tilman, D., Craine, J., Ellsworth, D., Tjoelker, M., Lee, T., Wedin, D., Naeem, S., Bahauddin, D., Hendrey, G., Jose, S., Wrage, K., Goth, J. & Bengston, W. (2001) Plant diversity enhances ecosystem responses to elevated CO2 and nitrogen deposition. Nature, 410, 809-812.
Reiss, J., Bridle, J. R., Montoya, J. M. & Woodward, G. (2009) Emerging horizons in biodiversity and ecosystem functioning research. Trends in Ecology & Evolution, 24, 505-514.
Rhoades, D. F. (1985) Offensive-defensive interactions between herbivores and plants: their relevance in herbivore population-dynamics and ecological theory. American Naturalist, 125, 205-238.
Schamp, B. S., Chau, J. & Aarssen, L. W. (2007) Dispersion of traits related to competitive ability in an old-field plant community. Journal of Ecology, 96, 204-212.
Scherber, C., Eisenhauer, N., Weisser, W. W., Schmid, B., Voigt, W., Fischer, M., Schulze, E.-D., Roscher, C., Weigelt, A., Allan, E., Beszler, H., Bonkowski, M., Buchmann, N., Buscot, F., Clement, L. W., Ebeling, A., Engels, C., Halle, S., Kertscher, I., Klein, A.-M., Koller, R., Konig, S., Kowalski, E., Kummer, V., Kuu, A., Lange, M., Lauterbach, D., Middelhoff, C., Migunova, V. D., Milcu, A., Muller, R., Partsch, S., Petermann, J. S., Renker, C., Rottstock, T., Sabais, A., Scheu, S., Schumacher, J., Temperton, V. M. & Tscharntke, T. (2010) Bottom-up effects of plant diversity on multitrophic interactions in a biodiversity experiment. Nature, 468, 553-556.
Scherber, C., Milcu, A., Partsch, S., Scheu, S. & Weisser, W. W. (2006) The effects of plant diversity and insect herbivory on performance of individual plant species in experimental grassland. Journal of Ecology, 94, 922-931.
107
Scheu, S., Schlitt, N., Tiunov, A. V., Newington, J. E. & Jones, T. H. (2002) Effects of the presence and community composition of earthworms on microbial community functioning. Oecologia, 133, 254-260.
Schiborra, A., Gierus, M., Wan, H. W., Bai, Y. F. & Taube, F. (2009) Short-term responses of a Stipa grandis/Leymus chinensis community to frequent defoliation in the semi-arid grasslands of Inner Mongolia, China. Agriculture Ecosystems & Environment, 132, 82-90.
Schmitz, O. J. (2006) Predators have large effects on ecosystem properties by changing plant diversity, not plant biomass. Ecology, 87, 1432-1437.
Schmitz, O. J. (2008) Effects of predator hunting mode on grassland ecosystem function. Science, 319, 952-954.
Schmitz, O. J. (2009) Effects of predator functional diversity on grassland ecosystem function. Ecology, 90, 2339-2345.
Schönbach, P., Wan, H., Schiborra, A., Gierus, M., Bai, Y., Muller, K., Glindemann, T., Wang, C., Susenbeth, A. & Taube, F. (2009) Short-term management and stocking rate effects of grazing sheep on herbage quality and productivity of Inner Mongolia steppe. Crop & Pasture Science, 60, 963-974.
Schuldt, A., Baruffol, M., Bohnke, M., Bruelheide, H., Hardtle, W., Lang, A. C., Nadrowski, K., von Oheimb, G., Voigt, W., Zhou, H. Z. & Assmann, T. (2010) Tree diversity promotes insect herbivory in subtropical forests of south-east China. Journal of Ecology, 98, 917-926.
Schwartz, M. W., Brigham, C. A., Hoeksema, J. D., Lyons, K. G., Mills, M. H. & van Mantgem, P. J. (2000) Linking biodiversity to ecosystem function: implications for conservation ecology. Oecologia, 122, 297-305.
Silvertown, J., McConway, K., Gowing, D., Dodd, M., Fay, M. F., Joseph, J. A. & Dolphin, K. (2006) Absence of phylogenetic signal in the niche structure of meadow plant communities. Proceedings of the Royal Society B-Biological Sciences, 273, 39-44.
Snoeren, T. A. L., De Jong, P. W. & Dicke, M. (2007) Ecogenomic approach to the role of herbivore-induced plant volatiles in community ecology. Journal of Ecology, 95, 17-26.
Snyder, W. E., Snyder, G. B., Finke, D. L. & Straub, C. S. (2006) Predator biodiversity strengthens herbivore suppression. Ecology Letters, 9, 789-796.
Spehn, E. M., Hector, A., Joshi, J., Scherer-Lorenzen, M., Schmid, B., Bazeley-White, E., Beierkuhnlein, C., Caldeira, M. C., Diemer, M., Dimitrakopoulos, P. G., Finn, J. A., Freitas, H., Giller, P. S., Good, J., Harris, R., Hogberg, P., Huss-Danell, K., Jumpponen, A., Koricheva, J., Leadley, P. W., Loreau, M., Minns, A., Mulder, C.
108
P. H., O'Donovan, G., Otway, S. J., Palmborg, C., Pereira, J. S., Pfisterer, A. B., Prinz, A., Read, D. J., Schulze, E. D., Siamantziouras, A. S. D., Terry, A. C., Troumbis, A. Y., Woodward, F. I., Yachi, S. & Lawton, J. H. (2005) Ecosystem effects of biodiversity manipulations in European grasslands. Ecological Monographs, 75, 37-63.
Srivastava, D. S. & Bell, T. (2009) Reducing horizontal and vertical diversity in a foodweb triggers extinctions and impacts functions. Ecology Letters, 12, 1016-1028.
Srivastava, D. S. & Vellend, M. (2005) Biodiversity-ecosystem function research: is it relevant to conservation? Annual Review of Ecology and Systematics, 36, 267-294.
Steffan, S. A. & Snyder, W. E. (2010) Cascading diversity effects transmitted exclusively by behavioral interactions. Ecology, 91, 2242-2252.
Stein, C., Unsicker, S. B., Kahmen, A., Wagner, M., Audorff, V., Auge, H., Prati, D. & Weisser, W. W. (2010) Impact of invertebrate herbivory in grasslands depends on plant species diversity. Ecology, 91, 1639-1650.
Steiner, C. F. (2001) The effects of prey heterogeneity and consumer identity on the limitation of trophic-level biomass. Ecology, 82, 2495-2506.
Stubbs, W. J. & Wilson, J. B. (2004) Evidence for limiting similarity in a sand dune community. Journal of Ecology, 92, 557-567.
Swenson, N. G., Enquist, B. J., Thompson, J. & Zimmerman, J. K. (2007) The influence of spatial and size scale on phylogenetic relatedness in tropical forest communities. Ecology, 88, 1770-1780.
Thompson, K., Parkinson, J. A., Band, S. R. & Spencer, R. E. (1997) A comparative study of leaf nutrient concentrations in a regional herbaceous flora. New Phytologist, 136, 679-689.
Thompson, K., Petchey, O. L., Askew, A. P., Dunnett, N. P., Beckerman, A. P. & Willis, A. J. (2010) Little evidence for limiting similarity in a long-term study of a roadside plant community. Journal of Ecology, 98, 480-487.
Tilman, D., Knops, J., Wedin, D., Reich, P., Ritchie, M. & Siemann, E. (1997) The influence of functional diversity and composition on ecosystem processes. Science, 277, 1300-1302.
Tilman, D., Wedin, D. & Knops, J. (1996) Productivity and sustainability influenced by biodiversity in grassland ecosystems. Nature, 379, 718-720.
109
Unsicker, S. B., Baer, N., Kahmen, A., Wagner, M., Buchmann, N. & Weisser, W. W. (2006) Invertebrate herbivory along a gradient of plant species diversity in extensively managed grasslands. Oecologia, 150, 233-246.
van der Meijden, E., Wijn, M. & Verkaar, H. J. (1988) Defense and regrowth, alternative plant strategies in the struggle against herbivores. Oikos, 51, 355-363.
Vicari, M. & Bazely, D. R. (1993) Do grasses fight back? The case for antiherbivore defenses. Trends in Ecology & Evolution, 8, 137-141.
Wackers, F. L. & Bezemer, T. M. (2003) Root herbivory induces an above-ground indirect defence. Ecology Letters, 6, 9-12.
Wardle, D. A. (1999) Is "sampling effect" a problem for experiments investigating biodiversity-ecosystem function relationships? Oikos, 87, 403-407.
Wardle, D. A., Bonner, K. I., Barker, G. M., Yeates, G. W., Nicholson, K. S., Bardgett, R. D., Watson, R. N. & Ghani, A. (1999) Plant removals in perennial grassland: vegetation dynamics, decomposers, soil biodiversity, and ecosystem properties. Ecological Monographs, 69, 535-568.
Webb, C., Ackerly, D. & Kembel, S. W. (2008) Phylocom: software for the analysis of phylogenetic community structure and trait evolution. Version 4.0.
Webb, C. O. & Donoghue, M. J. (2005) Phylomatic: tree assembly for applied phylogenetics. Molecular Ecology Notes, 5, 181-183.
Weiher, E., Clarke, G. D. P. & Keddy, P. A. (1998) Community assembly rules, morphological dispersion, and the coexistence of plant species. Oikos, 81, 309-322.
Weiher, E. & Keddy, P. A. (1995) Assembly rules, null models, and trait dispersion: new questions front old patterns. Oikos, 74, 159-164.
Wenninger, E. J. & Inouye, R. S. (2008) Insect community response to plant diversity and productivity in a sagebrush-steppe ecosystem. Journal of Arid Environments, 72, 24-33.
Wilsey, B. J. (2005) Relationships among indices suggest that richness is an incomplete surrogate for grassland biodiversity. Ecology, 86, 1178-1184.
Wright, I. J., Reich, P. B., Westoby, M., Ackerly, D. D., Baruch, Z., Bongers, F., Cavender-Bares, J., Chapin, T., Cornelissen, J. H. C., Diemer, M., Flexas, J., Garnier, E., Groom, P. K., Gulias, J., Hikosaka, K., Lamont, B. B., Lee, T., Lee, W., Lusk, C., Midgley, J. J., Navas, M. L., Niinemets, U., Oleksyn, J., Osada, N., Poorter, H., Poot, P., Prior, L., Pyankov, V. I., Roumet, C., Thomas, S. C., Tjoelker, M. G., Veneklaas, E. J. & Villar, R. (2004) The worldwide leaf economics spectrum. Nature, 428, 821-827.

110
Wu, C. I., Shi, S. H. & Zhang, Y. P. (2004) A case for conservation. Nature, 428, 213-214.
Wu, J. & Loucks, O. L. (1992) Xilingole grassland. Grasslands and Grassland Sciences in Northern China (ed^(eds, pp. 67-84. National Academy Press, Washington, DC.
Yan, Z. & Chen, Y. (1997) Observation of plant height selection in 3 species of grasshoppers in grasslands of the Xilin River basin, Inner Mongolia. Chinese Bulletin of Entomology, 34, 228-230.
Yu, Q., Chen, Q. S., Elser, J. J., He, N. P., Wu, H. H., Zhang, G. M., Wu, J. G., Bai, Y. F. & Han, X. G. (2010) Linking stoichiometric homoeostasis with ecosystem structure, functioning and stability. Ecology Letters, 13, 1390-1399.

111
APPENDIX A
Supplemental Figures and Tables for Chapter 3: High niche overlap in grassland plant
communities irrespective of herbivory
Table S1: Principal components analysis of plant functional traits. Loadings on the first
four principal components.
Trait PC1 PC2 PC3 PC4
Height -0.419 -0.303 0.014 -0.340
Longest Leaf -0.442 -0.128 -0.384 -0.150
Aboveground Weight -0.332 -0.368 0.431 0.069
Area -0.268 -0.089 0.639 0.120
LMA -0.132 -0.451 -0.457 0.400
C -0.428 0.105 -0.195 -0.208
N 0.274 -0.243 0.049 -0.761
Amax 0.326 -0.431 -0.066 -0.113
Conductance 0.254 -0.538 0.059 0.219
S.D. 1.72 1.27 1.06 0.93
Proportion of
variance 0.33 0.18 0.13 0.10
Cumulative variance 0.33 0.51 0.64 0.74

112
Figure S2. Biplot of principal components 1, 2, and 3 of the traits used in the niche
overlap analysis. Localtion of individuals in the ordination space shown in grey, with
loadings for each trait represented by arrows.

113
Figure S1. Relationships between plant traits. All traits were measured on all individuals.
Pearson product-moment correlations (r) between pairs are shown in the bottom panel,
with text size proportional to the value of the correlation, and histograms are shown in the
diagonal. All trait values were log transformed.

114
APPENDIX B
Supplemental Figures and Tables for Chapter 4: Functional and phylogenetic diversity
as predictors of biodiversity-ecosystem function relationships
Figure S1. Phylogeny extracted from the angiosperm supertree of Davies et al., showing
variation in trait values for the four functional and one taxonomic trait used in this study.
White boxes indicate no data were available. Major families for the 121 species used in
this study are indicated at right.
Figure S2. Structural equation models tested for combinations of functional diversity
(FD), phylogenetic diversity (PD), and functional group richness (FGR) in combination
with species richness (S) as predictors of the biodiversity effect on aboveground biomass
accumulation (LRmean). Models were constructed to represent the effect of PD, FD, or
FGR on the biodiversity effect as functions of S, since the indices used here are
inherently dependent on S to some extent. That is, the PD and FD indices used here can
only remain flat or increase as a species is added to a community. Model 5 shows one of
many alternatives where PD and FD do not depend on S; note that this model is
consistently the poorest-fitting of the candidate models (Table S2).
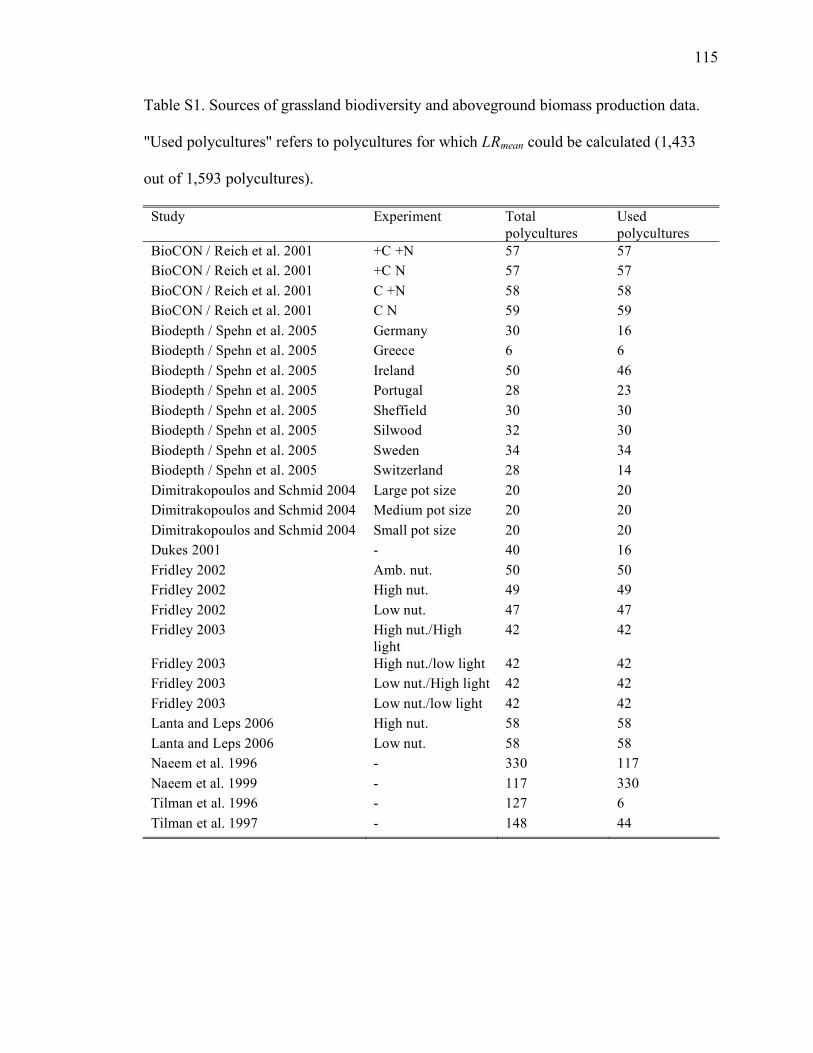
115
Table S1. Sources of grassland biodiversity and aboveground biomass production data.
"Used polycultures" refers to polycultures for which LRmean could be calculated (1,433
out of 1,593 polycultures).
Study Experiment Total polycultures
Used polycultures
BioCON / Reich et al. 2001 +C +N 57 57 BioCON / Reich et al. 2001 +C N 57 57 BioCON / Reich et al. 2001 C +N 58 58 BioCON / Reich et al. 2001 C N 59 59 Biodepth / Spehn et al. 2005 Germany 30 16 Biodepth / Spehn et al. 2005 Greece 6 6 Biodepth / Spehn et al. 2005 Ireland 50 46 Biodepth / Spehn et al. 2005 Portugal 28 23 Biodepth / Spehn et al. 2005 Sheffield 30 30 Biodepth / Spehn et al. 2005 Silwood 32 30 Biodepth / Spehn et al. 2005 Sweden 34 34 Biodepth / Spehn et al. 2005 Switzerland 28 14 Dimitrakopoulos and Schmid 2004 Large pot size 20 20 Dimitrakopoulos and Schmid 2004 Medium pot size 20 20 Dimitrakopoulos and Schmid 2004 Small pot size 20 20 Dukes 2001 - 40 16 Fridley 2002 Amb. nut. 50 50 Fridley 2002 High nut. 49 49 Fridley 2002 Low nut. 47 47 Fridley 2003 High nut./High
light 42 42
Fridley 2003 High nut./low light 42 42 Fridley 2003 Low nut./High light 42 42 Fridley 2003 Low nut./low light 42 42 Lanta and Leps 2006 High nut. 58 58 Lanta and Leps 2006 Low nut. 58 58 Naeem et al. 1996 - 330 117 Naeem et al. 1999 - 117 330 Tilman et al. 1996 - 127 6 Tilman et al. 1997 - 148 44

116
Table S2. Results of structual equation modeling comparisons for the effects of species
richness, functional diversity, phylogenetic diversity, and functional group richness as
predictors of the biodiversity effect on aboveground biomass accumulation in 29
grassland experiments. The eight candidate models are shown in Fig. S2. BIC: Bayesian
information criterion; RMSEA: root mean squared error approximation; CFI:
comparative fit index. Note that P values indicate whether the model can be rejected as a
potential explanation of the covariance in the data set.
Using PDM from molecular phylogeny (110 species)
All: 1,074 plots Model χ2 df P BIC RMSEA CFI M1 35.56 1 <0.001 28.57 0.178 0.9 M2 4.07 1 0.044 -2.92 0.053 0.999 M3 29.5 2 <0.001 15.51 0.112 0.989 M4 26.13 1 <0.001 19.14 0.152 0.99 M5 2333.76 3 <0.001 2312.78 0.845 0.031 M6 967.26 4 <0.001 939.29 0.471 0.721 M7 962.54 3 <0.001 941.57 0.542 0.722 M8 3.37 1 0.067 -3.63 0.047 0.999 No legumes: 506 M1 4.83 1 0.028 -1.54 0.081 0.991 M2 3.48 1 0.062 -2.89 0.065 0.998 M3 3.05 2 0.217 -9.68 0.03 0.999 M4 1.37 1 0.241 -5 0.025 1 M5 1566.37 3 <0.001 1547.26 0.945 0.013 M6 157.1 4 <0.001 131.62 0.256 0.913 M7 155.41 3 <0.001 136.3 0.295 0.914 M8 1.68 1 0.195 -4.69 0.034 1 Fertilized: 212 M1 2.44 1 0.118 -2.92 0.083 0.994 M2 0.92 1 0.339 -4.44 <0.001 1 M3 0.13 2 0.937 -10.58 <0.001 1 M4 0.1 1 0.752 -5.26 <0.001 1 M5 638.41 3 <0.001 622.34 1.002 0.048

117
M6 158.01 4 <0.001 136.58 0.427 0.824 M7 158 3 <0.001 141.93 0.495 0.823 M8 0.03 1 0.862 -5.33 <0.001 1
Using PD from angiosperm supertree (121 species) All: 1,419 plots Model χ2 df P BIC RMSEA CFI M1 33.08 1 <0.001 25.81 0.15 0.962 M2 10.86 1 0.001 3.6 0.083 0.994 M3 142.1 2 <0.001 127.57 0.221 0.947 M4 135.79 1 <0.001 128.52 0.307 0.949 M5 2491.83 3 <0.001 2470.03 0.761 0.051 M6 1261.21 4 <0.001 1232.14 0.468 0.697 M7 1253.83 3 <0.001 1232.03 0.54 0.699 M8 6.31 1 0.012 -0.96 0.061 0.998 No legumes: 636 M1 5.12 1 0.024 -1.35 0.08 0.991 M2 10.37 1 0.001 3.89 0.12 0.972 M3 47.74 2 <0.001 34.79 0.188 0.943 M4 44.42 1 <0.001 37.94 0.259 0.946 M5 775.87 3 <0.001 756.44 0.631 0.034 M6 111.59 4 <0.001 85.69 0.204 0.881 M7 108.36 3 <0.001 88.93 0.233 0.884 M8 3.32 1 0.069 -3.16 0.06 0.997 Fertilized: 302 M1 0.04 1 0.841 -5.68 <0.001 1 M2 0 1 0.945 -5.72 <0.001 1 M3 2.92 2 0.232 -8.53 0.039 0.999 M4 0 1 0.986 -5.72 <0.001 1 M5 982.18 3 <0.001 965.01 1.034 0.037 M6 301.64 4 <0.001 278.74 0.494 0.8 M7 297.82 3 <0.001 280.65 0.568 0.801 M8 2.92 1 0.088 -2.8 0.079 0.998

118

119
Fig. S2